 Zoltan B. Szuts1*
 Amy S. Bower2
 Kathleen A. Donohue3
 James B. Girton1
 Julia M. Hummon4
 Katsuro Katsumata5
 Rick Lumpkin6
 Peter B. Ortner7
 Helen E. Phillips8
 H. Thomas Rossby3Lynn Keith Shay7
 Charles Sun9†
 Robert E. Todd2
- 1Applied Physics Laboratory, University of Washington, Seattle, WA, United States
- 2Woods Hole Oceanographic Institution, Woods Hole, MA, United States
- 3Graduate School of Oceanography, The University of Rhode Island, Narragansett, RI, United States
- 4School of Ocean and Earth Science and Technology, University of Hawai’i at Mânoa, Honolulu, HI, United States
- 5Research and Development Center for Global Change, Japan Agency for Marine-Earth Science and Technology, Yokosuka, Japan
- 6Atlantic Oceanographic and Meteorological Laboratory (NOAA), Miami, FL, United States
- 7Rosenstiel School of Marine and Atmospheric Sciences, University of Miami, Miami, FL, United States
- 8Institute for Marine and Antarctic Studies, University of Tasmania, Hobart, TAS, Australia
- 9National Centers for Environmental Information (NOAA), Asheville, NC, United States
Ocean velocity defines ocean circulation, yet the available observations of subsurface velocity are under-utilized by society. The first step to address these concerns is to improve visibility of and access to existing measurements, which include acoustic sampling from ships, subsurface float drifts, and measurements from autonomous vehicles. While multiple programs provide data publicly, the present difficulty in finding, understanding, and using these data hinder broader use by managers, the public, and other scientists. Creating links from centralized national archives to project specific websites is an easy but important way to improve data discoverability and access. A further step is to archive data in centralized databases, which increases usage by providing a common framework for disparate measurements. This requires consistent data standards and processing protocols for all types of velocity measurements. Central dissemination will also simplify the creation of derived products tailored to end user goals. Eventually, this common framework will aid managers and scientists in identifying regions that need more sampling and in identifying methods to fulfill those demands. Existing technologies are capable of improving spatial and temporal sampling, such as using ships of opportunity or from autonomous platforms like gliders, profiling floats, or Lagrangian floats. Future technological advances are needed to fill sampling gaps and increase data coverage.
Introduction
Ocean circulation plays a critical role in the Earth’s climate and biosphere through transport of heat, freshwater, momentum, nutrients, and biota. Ocean circulation, in turn, arises from ocean velocity that is driven by processes on a wide range of temporal and spatial scales. Although most of our knowledge of ocean circulation derives from indirect measurements (e.g., subsurface density or sea surface height), such measurements assume a low-frequency balance (geostrophy) that is incomplete. For this reason, direct measurements of subsurface ocean velocity are indispensable for a full diagnosis of ocean circulation. Better organization and dissemination of such measurements to societal users will increase the utility of historic, on-going, and future measurements.
Velocity measurements from the surface through the mixed layer to the abyss complement our indirect knowledge from density observations. For example, a pioneering use of public temperature and salinity data to calculate geostrophic velocity (Reid, 1994) traced deep boundary currents along the western continental slope of the North Atlantic. At the time, the currents were thought to be continuous along the slope. Seeding these currents with subsurface drifting floats (Bower et al., 2009), however, showed a striking lack of continuity and the prevalence of interior recirculation. Many other types of motion are responsible for the wide range of ocean variability observed: planetary waves (Gill, 1982), baroclinic instability and eddy generation in strong currents (Pedlosky, 1979), internal waves, transfer of wind momentum into the deep ocean (Sanford et al., 2007; Uhlhorn and Shay, 2012; Kilbourne and Girton, 2015), or ocean mixing (MacKinnon et al., 2017). Direct-velocity measurements provide greater insight into these processes than the indirect inferences from the ocean density field. Moreover, geostrophy does not apply at the equator, and is less significant at weakly stratified high latitudes where strong depth-averaged motion results from atmospheric forcing.
This article is spurred by a sense that the marine community has limited knowledge of existing ocean velocity sampling. Consider two anecdotes. An ocean engineer needs to identify the maximum force a subsurface structure can withstand and seeks maps of observed subsurface velocity. Not knowing of any local observations, the engineer’s team turns instead to numerical models. Without personal contacts familiar with local direct velocity measurements, the ocean engineer assumes that existing information is adequate. In another example, to understand larval transport, a researcher requests maps of deep ocean velocity. With only maps of mean geostrophic circulation from historical hydrography, the important turbulent dispersion of biota is neglected. Although anecdotal, these two examples are a subset of our personal experiences and accurately reflect an inadequacy of the present situation.
Many marine fields are influenced by ocean currents and could benefit from existing observations. Example applications include larval dispersal for management of fisheries and ecosystems, oil spill response to deep or surface release (Hamilton et al., 2011, search and rescue operations, monitoring and tracking harmful algal blooms, coastal water quality monitoring, and marine engineering applications. With this article, we summarize present-day sampling capabilities and suggest improvements to data accessibility, as a first step to increase societal use of subsurface velocity measurements. Our suggestions to reach this goal deserve further discussion, modification, and implementation by scientists who measure ocean velocity, funders of this research, and potential users.
Measuring Subsurface Ocean Velocity
Ocean velocity is measured by a variety of techniques with differing temporospatial response. An overview of common sensors or techniques is needed to understand how to create common frameworks from disparate measurements. Selected examples (Figure 1) convey the insight provided by velocity sampling.
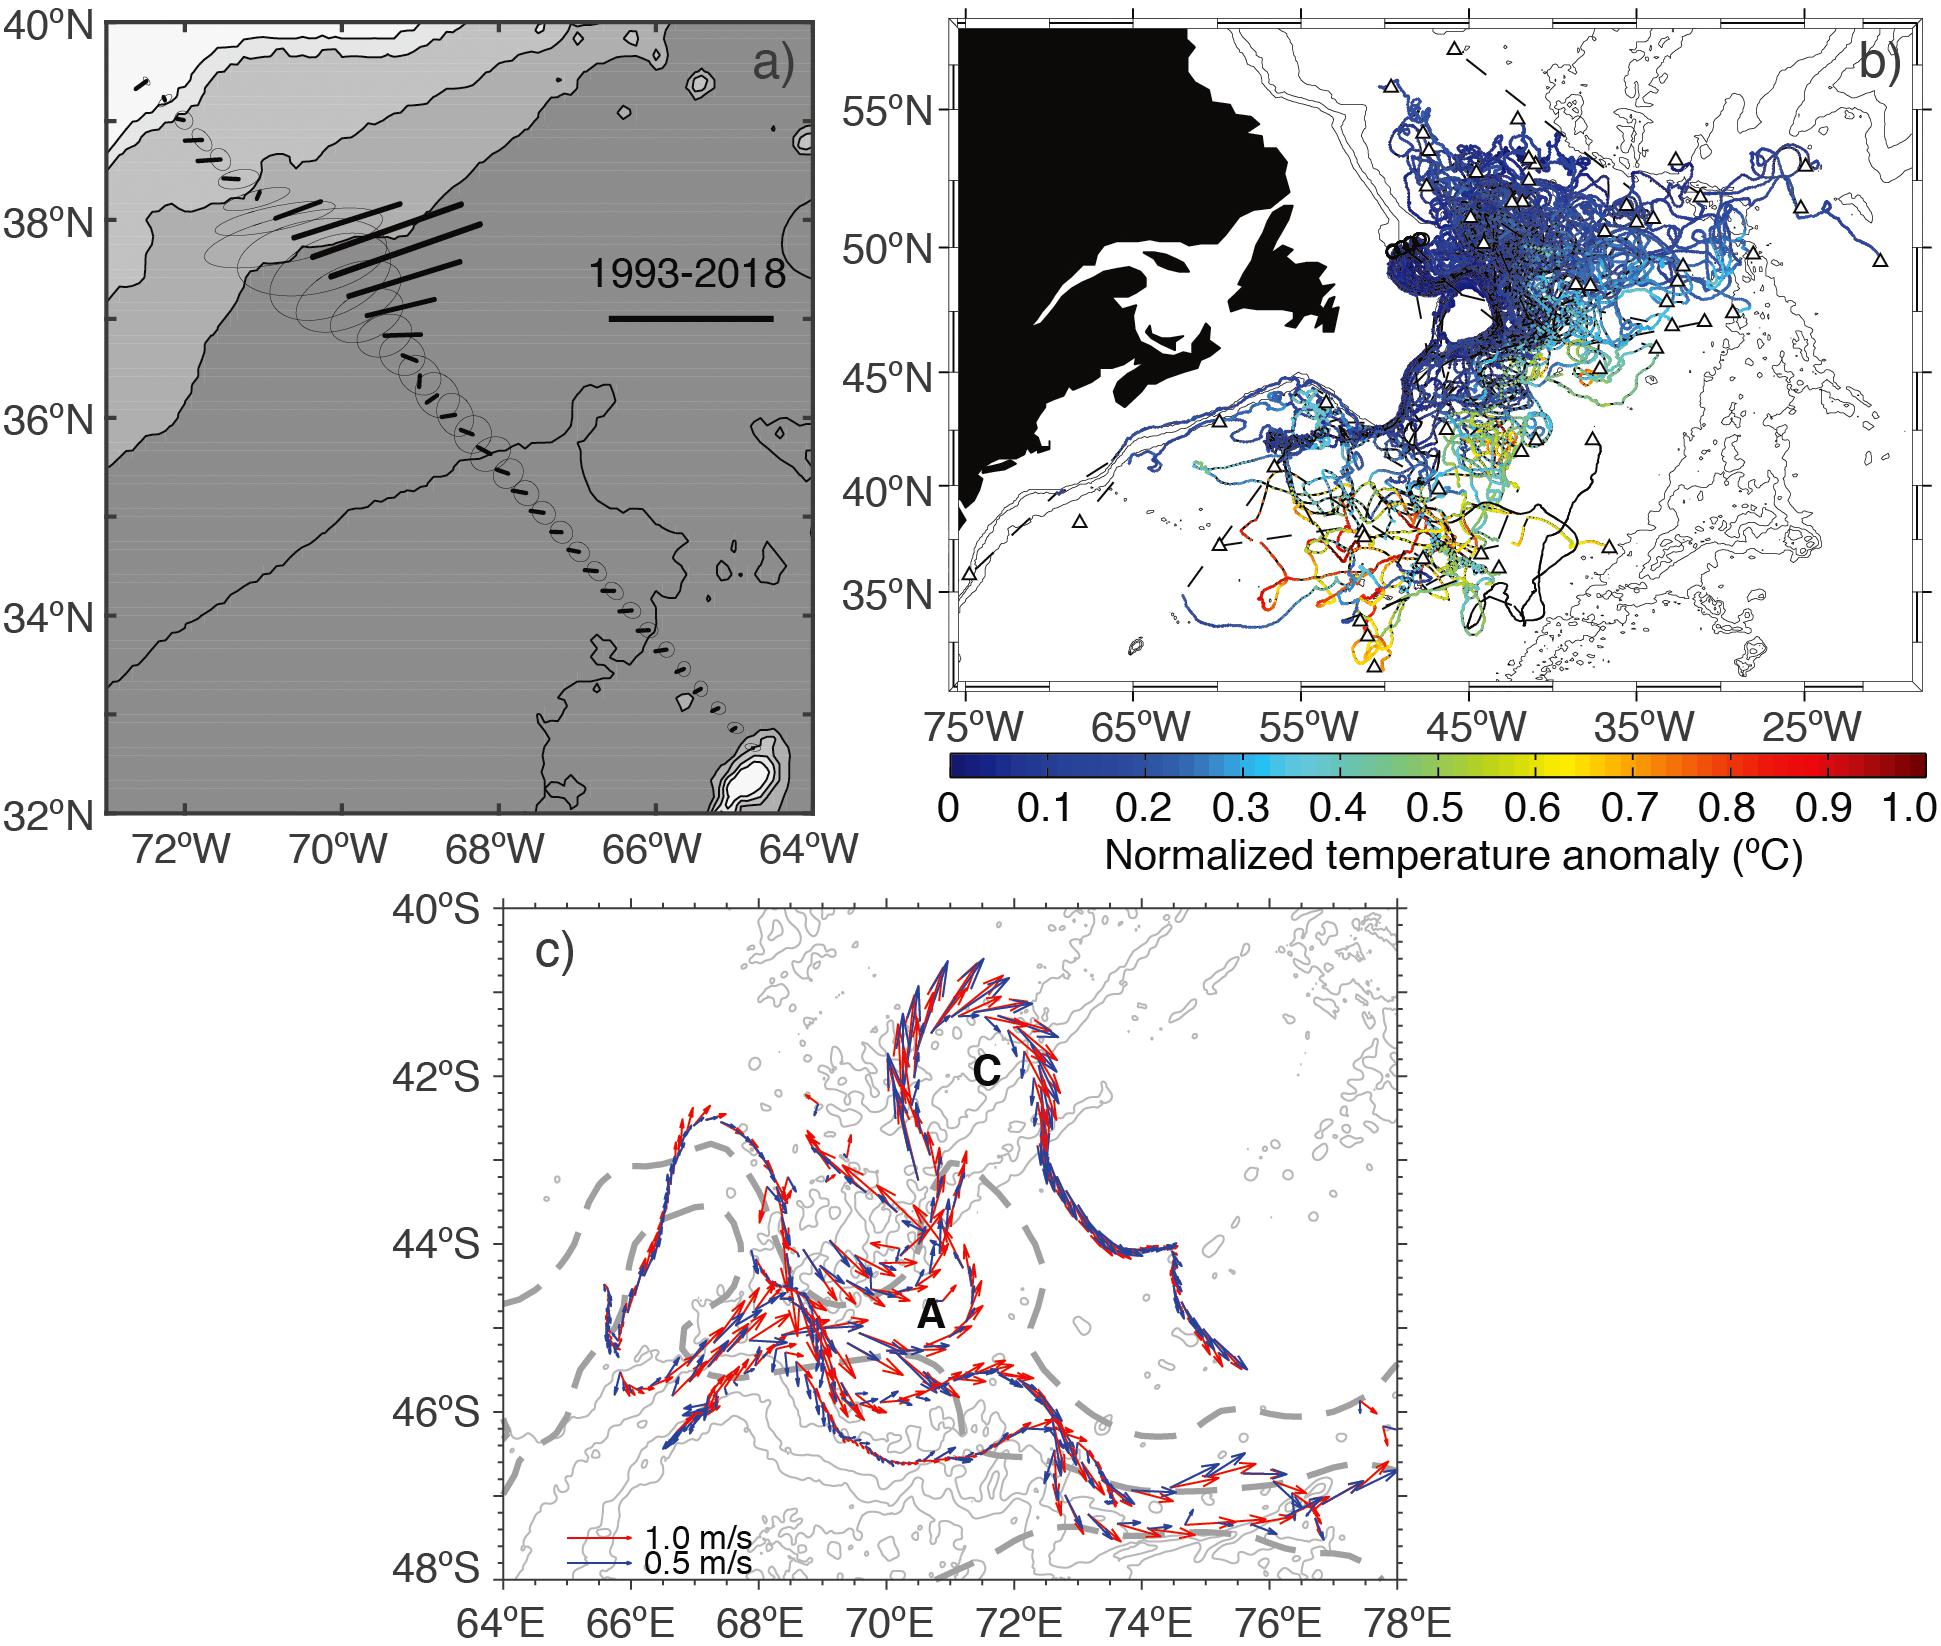
Figure 1. Examples of velocity data. (a) Variance ellipses from repeated Shipboard ADCP transects across the Gulf Stream (e.g. Rossby et al., 2010). Long time-series are needed to show that variability on the flanks is directed toward the center of the Gulf Stream. (b) Map of subsurface pathways from Lagrangian drifters (Bower, pers. comm.). Color shows the normalized temperature anomaly relative to the float’s initial temperature. These 2-year trajectories of RAFOS floats in the subpolar North Atlantic show how they almost exclusively leave the deep boundary-intensified southward current, and instead recirculate in the interior basin. (c) Velocity at 200 dbar (red) and 1500 dbar (blue) from electric field profiling floats in a topographically-induced meander of the Antarctic Circumpolar Current, with branches of the Antarctic Circumpolar Current from concurrent satellite altimetry shown as dashed lines (Phillips, pers. comm.). Note how vertical shear varies consistently for cyclonic (marked “C”) and anticyclonic (marked “A”) curvature, and how surface fronts are often crossed by deep trajectories.
Sensor Techniques
Acoustic Doppler
Acoustic Doppler current measurements rely on the frequency shift of an acoustic signal when it reflects off of a moving body. Acoustic Doppler current profilers (ADCPs) transmit acoustic pulses and fit Doppler shifts to gated time bins, thus providing a profile of along-beam velocity. Acoustic beams oriented in multiple directions resolve currents in 2 or 3 dimensions. Typically, ensembles of single-ping estimates are averaged over a few minutes to improve signal-to-noise ratios. Modern systems installed on ships can typically reach 900–1200 m at 38 kHz or 50–80 m at 300 kHz, and sometimes deeper under ideal conditions. Five-beam systems with a central beam pointing upwards are available to measure vertical velocity (e.g., Guerra and Thomson, 2017).
Acoustic Doppler current profilers can be installed on fixed moorings or on moving platforms. Any platform motion present needs to be removed during processing. Moving platforms include surface ships (shipboard ADCP, sADCP, see Figure 1a), CTD rosettes (lowered ADCP; Fischer and Visbeck, 1993), or increasingly on small autonomous platforms such as subsurface gliders (Todd et al., 2017) or surface autonomous vehicles (Thomson and Girton, 2017). The depth of ADCP sampling is only constrained by its platform.
Lagrangian Tracking
Acoustic tracking of subsurface floats provides estimates of averaged Lagrangian velocity between positions fixes (see Rossby and Özgökmen, 2007). Long range acoustic tracking is possible because of a sound guide at 700–1000 m throughout much of the global ocean. This fact permits successful tracking down to 4000 m with a few moored sound sources transmitting a few times per day. When applied to tracking 10–100 floats that follow a constant pressure or seawater density surface (RAFOS floats; Levine et al., 1986; Rossby et al., 1986; Richardson, 2018), this method traces advective-diffusive pathways of water parcels over years. For example, a recent study in the deep subpolar North Atlantic (Figure 1b; Bower et al., 2009) found that the Deep Western Boundary Current is remarkably leaky to the interior basin despite being topographically trapped. This tracking method is also useful in Polar Regions where ice hinders surface tracking (Chamberlain et al., 2018). Multicycle profiling floats can also estimate their subsurface drift velocity from surface GPS fixes (Lebedev et al., 2007), typically over a 10-day interval, while frequent surface fixes track surface drifters (Lumpkin et al., 2016a).
Point Sensors
Point sensors are typically installed on moorings that sample regional circulation. Mooring designs have great variety depending on the research focus, and are even possible on moving sea-ice (Cole et al., 2015). When many moorings are collected into databases (Figure 2B), they provide high temporal resolution velocity that are suitable for additional purposes, from scientific (e.g., Wunsch, 1997) to societal (tracking deep oil spills in the Gulf of Mexico, e.g., Hamilton et al., 2011).
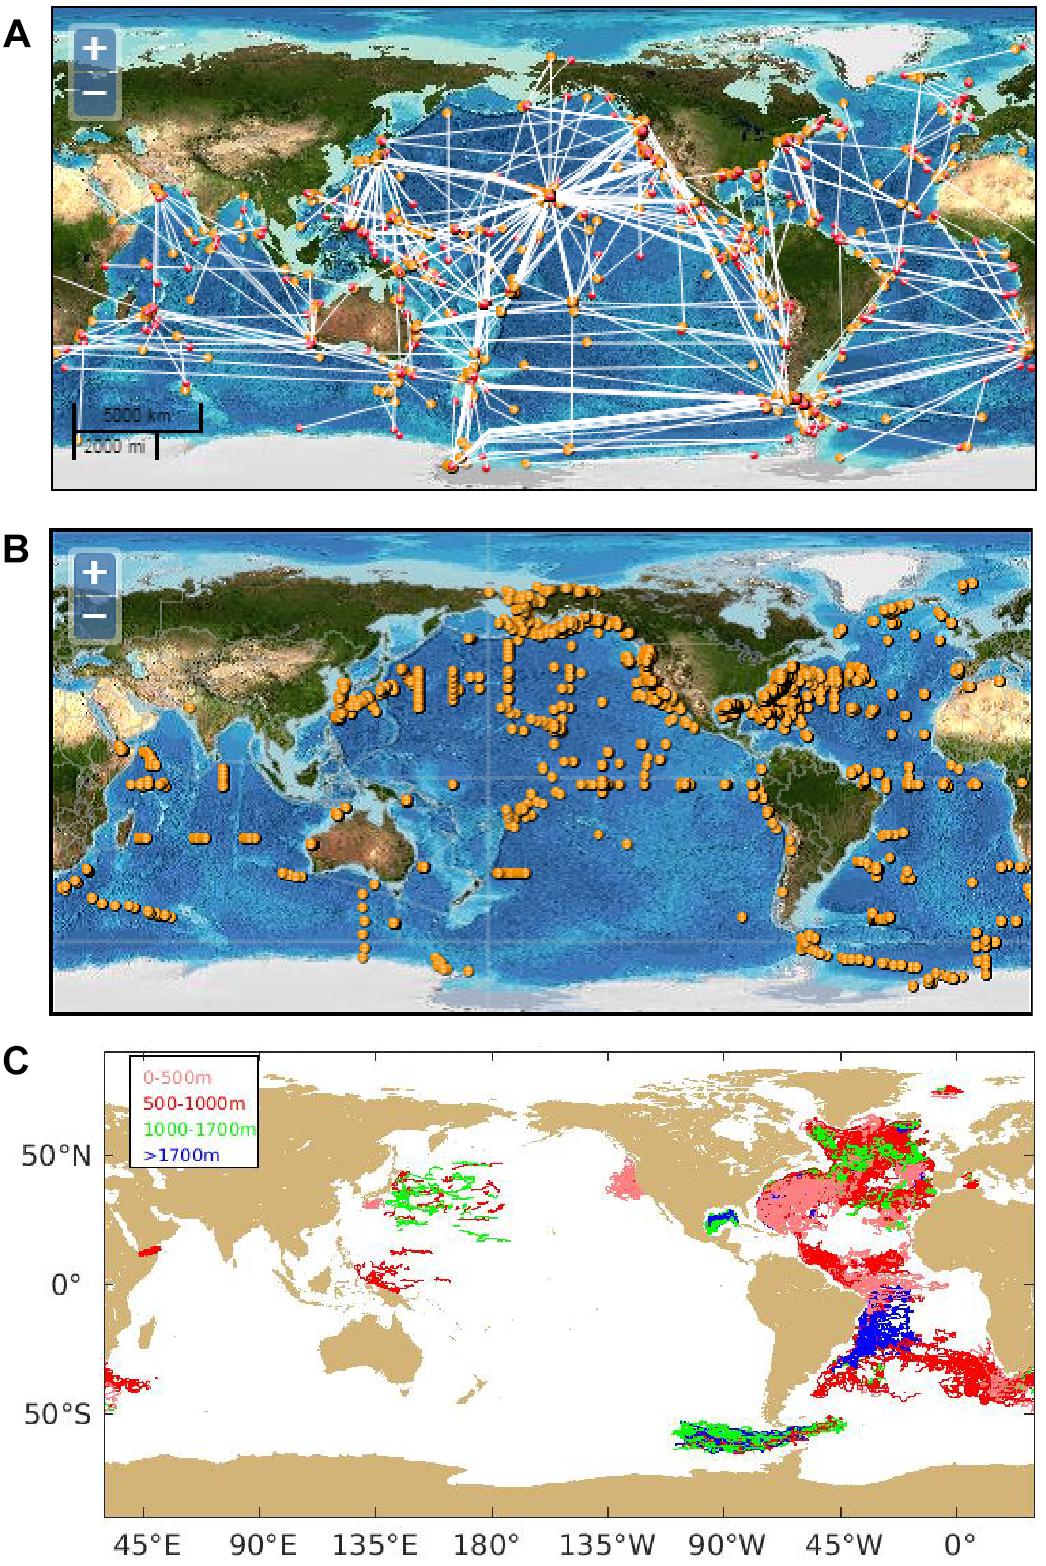
Figure 2. Data available from two recently created archives (see text). From the NOAA National Centers for Environmental Information (NCEI) Global Ocean Currents Database (GOCD), two screen shots show (A) shipboard ADCP data (which includes data from the Joint Archive for Shipboard Acoustic Doppler Current Profiler Data, JASADCP; and the Rolling Deck to Repository, (R2R, funded by the National Science Foundation and the Office of Naval Research), and (B) mooring data. (C) Trajectories of RAFOS floats from the WOCE Subsurface Float Data Assembly Center, updated through December 2017. Colors indicate depth (legend in upper left).
Motional Induction
Horizontal water velocity is obtainable by measuring oceanic electric fields caused by salt ions moving through the Earth’s magnetic field (Sanford, 1971). The relation between velocity and electric field is simple and provides a near instantaneous response anywhere in the water column. Electric field measurements are possible from multiple platforms (see review by Szuts, 2012): fixed sensors give time-series of depth-averaged velocity (Meinen et al., 2002) or transport (Larsen and Sanford, 1985; Szuts and Meinen, 2013), while implementation on expendable (Sanford et al., 1982) or multicycle profiling floats (Sanford et al., 2007; Kilbourne and Girton, 2015) provides vertical profiles of horizontal velocity. Example data in the Southern Ocean (Figure 1c; Phillips and Bindoff, 2014), shows how vertical shear in the Antarctic Circumpolar Current varies with meander curvature, and how surface streamlines identified by fronts are often crossed by deep trajectories.
Existing Sustained Programs That Measure Ocean Velocity
There are three categories of platforms onto which velocity sensors can be mounted: fixed in space (Eulerian), drifting with currents (Lagrangian), or self propelling. There are a few existing velocity sampling networks that are formed by a distributed array of similar platforms.
Shipboard ADCP Records
Oceanographic vessels are outfitted with sADCPs as standard instrumentation, and many countries archive measurements made from their research vessels. For the United States UNOLS fleet, data acquisition and automated preliminary processing is performed by the UHDAS program from the University of Hawaii. This system provides near real-time ocean currents for scientific and operational use at sea. If this dataset is subsequently manually calibrated and edited, the final data product can be submitted to the Joint Archive for Shipboard Acoustic Doppler Current Profiler Data (JASADCP), a repository for science-ready sADCP data.
Commercial vessels can also be outfitted with sADCP sensors for making measurements along their frequently repeated tracks. The oldest sustained program is a line from New Jersey to Bermuda using the commercial cargo vessel MV Oleander (Flagg et al., 1998; Rossby et al., 2010, 2014), which collects transects across the Gulf Stream. These data are well suited for validating models, and show (Figure 1a) that velocity variability across the Gulf Stream is highest on the flanks and is directed toward the center.
Other instrumented commercial vessels include cruise ships in the Caribbean (Rousset and Beal, 2010) and ferries and cargo vessels in the North Atlantic and Nordic Seas (Rossby and Flagg, 2012). Instrumenting additional commercial vessels with sADCPs would expand repeat sampling of upper ocean velocity. Additional insight can be added to such systems by expendable temperature probes (Goni et al., 2014), especially if deployed adaptively based on sADCP measurements (Rossby et al., 2011), or by adding collocated meteorological, surface ocean, and biological measurements (OceanScope, 2012).
Mooring Database
Collecting many mooring records together enables new consideration of measurements that are often collected for a specific regional purpose. One database is provided by Oregon State University1, while some long-duration programs serve data on their own sites (e.g., the 26°N RAPID Overturning Array2) or on national servers. Included in this category are mooring programs that maintain arrays intended for measuring ocean transport through a combination of velocity and density measurements (e.g., RAPID, OSNAP3, Agulhas System Climate Array4), or other techniques (Florida Current transport from cable voltages5). A sustained global array of equatorial moorings (TAO/TRITON, PIRATA, RAMA), supported by multi-national collaborations and publicly available6, is especially important to understand non-geostrophic equatorial currents and for model validation (e.g., Kessler et al., 2003).
Argo Network of Drifting Profiling Floats
Although primarily a system for measuring temperature and salinity profiles (Riser et al., 2016), the profiling floats used by Argo measure Lagrangian displacement at 1000 m over 10 days. Argo drift velocities are available from the YoMaHa’07 database (Lebedev et al., 2007), which is now regularly updated and publicly available7. It is based on Argo data from the Global Data Assembly Center (GDAC)8. Detailed quality control and gridding of drift velocities are available from multiple sources (G-YoMaHa, Katsumata and Yoshinari, 2010; ANDRO, Ollitrault and Rannou, 2013; GADV, Gray and Riser, 2014).
Subsurface Float Drifts
Lagrangian tracks of RAFOS-style float trajectories from many regional studies are now archived and publicly available (Ramsey et al., 2018). Originally compiled by the WOCE Subsurface Float Data Assembly Center in Woods Hole, this comprehensive database is now maintained by NOAA/AOML9. Float positions are typically at a temporal resolution of 12 h. As of the latest update (December 2017), the database had trajectories from 2,193 unique floats, half above 1000 dbar and spanning 1972–2015. Another data repository for subsurface floats can be found at the PANGAEA data repository10.
Recommendations for Increased Societal Use of Ocean Currents
Direct measurements of ocean velocity provide insight into the ocean that can aid societal decisions in many domains to respond to and manage the ocean environment. There is a strong need for improving communication pathways and building dissemination infrastructure to bring together researchers and end users.
Potential End User Applications
Although ocean circulation is fundamental to many societal users of the marine environment, ease of use and applicability are critical for end users to be able to use velocity measurements. Developing derived products for specific applications will require joint discussion between communities.
Similar to other types of observations, velocity observations have clear uses with numerical models. The simplest use is for model validation, to quantify and improve how well models represent the real ocean. Validation can extend beyond mean velocity to include velocity variability, for example to test whether a known subsurface maximum of eddy kinetic energy is reproduced. This is similar to diagnosing Gulf Stream separation latitude based on surface maps of eddy kinetic energy. More formalized use, such as through assimilation into models (Taillandier et al., 2006), will need large advances in understanding velocity structures in space and time, or increased sampling density. One example of model improvement comes from tropical cyclone studies, where measuring the ocean response to winds with electromagnetic velocity profilers (expendable and multi-cycle) enabled an improved parameterization of wind input of momentum that has increased the skill of coupled model forecasts (Shay and Jacob, 2006; Sanford et al., 2011). The Global Drifter Program (GDP, Lumpkin et al., 2016a,b) found that derived products like monthly-averaged maps are often preferred by modelers. Once data are accessible from a single source, then derived products with more uniform spatial or temporal information will be easier to create.
Another use of ocean velocity sampling is to relate remote sensing measurements to subsurface structure (e.g., Chiswell, 2016). This is necessary now for coastal high frequency radar that measures surface currents (Paduan et al., 2004) and for satellite measurements of sea surface height, temperature, or salinity. Though global surface maps have a wide range of applications, fully understanding the subsurface ocean requires measurements in the water column. Tying subsurface velocity to surface conditions will be especially important for upcoming and proposed satellite missions that will sample the ocean at submesoscales (SWOT, US NASA/French CNES) and will potentially provide direct measurements of surface velocities (SKIM from the European Space Agency, Ardhuin et al., 2018; or WaCM from NASA in the United States of America, Chelton et al., 2018).
Data Access
The first step for broader use of velocity observations is better visibility and accessibility. Improving data processing and data management should receive dedicated and systematic support from funding agencies and institutions. The infrastructure for disseminating ocean velocity should be developed now, so that new and emerging capabilities to measure subsurface velocity can be fully utilized as soon as they become available.
Much progress has been made toward this goal through two newly released databases that deserve wider awareness in our community. The United States NOAA National Centers for Environmental Information (NCEI) released a Global Ocean Current Database (GOCD)11 on 21 July 2015 (Sun, 2018). The database includes measurements from shipboard ADCPs and current meter moorings, and has developed archiving formats and quality control procedures (Sun, 2015). Screen shots of coverage maps for two instrument categories (Figures 2A,B) show higher density near coasts and in the northern hemisphere. The GOCD has also created archive-ready velocity file formats suitable for many platforms and sensors. A second database, also released in the past year, archives subsurface float tracks (Ramsey et al., 2018; see description in section “Data Access”). Although studies with acoustically tracked floats have predominantly been done in the Atlantic Basin (Figure 2C) to study regional circulation, the compilation of these data now permits additional studies, from comparative analyses to basin-wide model validation studies. Additional work is needed, however, to cover more velocity sampling programs, create archiving standards for all types of velocity measurements, and, ideally, provide a common access point.
In addition to the two active subsurface velocity databases above, our suggestions are informed by the experience of two databases for surface velocity, the NOAA Global Drifter Program12 that uses low-cost GPS-tracked surface drifters (Lumpkin et al., 2016b), and a network of coastal radars for surface velocity as part of the U.S. Integrated Ocean Observing System13. Though these two programs only sample the surface, their data dissemination strategies and user groups provide positive examples.
Limitations of Present-Day Velocity Sampling
Without an easy way to summarize all present sampling, it is hard to evaluate coverage of existing programs and fill potential holes in global sampling. The coverage maps (Figure 2) highlight the limited sampling outside of the northern hemisphere and Atlantic basin. Temporal coverage is also necessary to resolve seasonal patterns or high frequency variability that impact net fluxes or transports. The community should use existing technologies and platforms to fill these gaps in the short term, coordinated through existing or new sampling programs. Possibilities include collecting ADCP measurements from autonomous vehicles, expanding partnerships with the merchant marine community, deploying velocity profiling floats globally for long duration missions, or sampling subsurface connectivity with tracked Lagrangian floats. In the long term, we must identify new technologies, cost savings, or implementations that increase data return.
Summary of Recommendations
This article aims to increase use of subsurface ocean velocity measurements beyond their originating community to meet societal needs. The recommendations above fall into three broad categories:
Provide Centralized Access
• Improve visibility and accessibility of existing programs through a common access point
• Contribute, archive and disseminate data from centralized database (e.g., NCEI GOCD)
• Develop data repository standards and format converters for common methods of measuring velocity
Identify and Meet Users Needs
• Define end-user requirements for data formats
• Identify derived products through discussion with potential users. Examples uses include assimilation for numerical models, combining multiple data sets for model validation, interpreting surface satellite observations, or using profiler measurements to improve coupled models that forecast storm events.
Support Data Management and Improve Sampling
• Provide funding and institutional support for data management
• With collaborating agencies, develop data servers, data formats, format converters, and meta-data standards
• Fill observational gaps and improve spatial coverage of velocity sampling
• Apply existing technologies to fill gaps in global coverage in the short term
• Develop technology to increase velocity sampling rates, through cheaper platforms, cheaper sampling networks, or increased data return resulting from more sensor power and/or longer platform lifetimes
• Increase the amount of velocity sampling, for instance by reducing costs (of platforms, networks), improving sensors, or extending vehicle lifetimes.
We encourage scientists, research institutions, and funding agencies to support the actions above in a systematic way to improve our understanding and stewardship of the marine environment.
Author Contributions
ZBS conceived and organized the study. ZBS, ASB, KAD, JBG, JMH, KK, RL, PBO, HEP, HTR, LKS, CS, and RET contributed to their area of expertise and to the writing and organization of the article as a whole.
Funding
This work was supported by the National Science Foundation, United States, Grant Numbers 1356383 to ZBS, OCE 1756361 to ASB at the Woods Hole Oceanographic Institution, and 1536851 to KAD and HTR; the National Oceanographic and Atmospheric Administration, United States, Ocean Observations and Monitoring Division and Atlantic Oceanographic and Meteorological Laboratory to RL; Royal Caribbean Cruise Ltd., to PBO; the Australian Government Department of the Environment and Energy National Environmental Science Programme and Australian Research Council Centre of Excellence for Climate Extremes to HEP; and the Gulf of Mexico Research Initiative Grant V-487 to LS.
Conflict of Interest Statement
The authors declare that the research was conducted in the absence of any commercial or financial relationships that could be construed as a potential conflict of interest.
Acknowledgments
The authors thank the two reviewers for their suggestions.
Footnotes
- ^http://kepler.oce.orst.edu/
- ^http://www.rsmas.miami.edu/users/mocha
- ^https://www.o-snap.org
- ^https://beal-agulhas.rsmas.miami.edu/research/projects/asca/index.html
- ^http://www.aoml.noaa.gov/phod/floridacurrent/index.php
- ^https://www.pmel.noaa.gov/gtmba/
- ^http://apdrc.soest.hawaii.edu/projects/Argo/data/trjctry
- ^http://www.coriolis.eu.org or http://www.usgodae.org/argo
- ^http://www.aoml.noaa.gov/phod/float_traj
- ^https://www.pangaea.de
- ^https://www.nodc.noaa.gov/gocd/index.html
- ^http://www.aoml.noaa.gov/phod/gdp/index.php
- ^https://hfradar.ioos.us
References
Ardhuin, F., Aksenov, Y., Benetazzo, A., Bertino, L., Brandt, P., Caubet, E., et al. (2018). Measuring currents, ice drift, and waves from space: the sea surface kinematics multiscale monitoring (skim) concept. Ocean Sci. 14, 337–354. doi: 10.5194/os-14-337-2018
Bower, A. S., Lozier, M. S., Gary, S. F., and Böning, C. W. (2009). Interior pathways of the North Atlantic meridional overturning circulation. Nature 459, 243–247. doi: 10.1038/nature07979
Chamberlain, P., Talley, L. D., Mazloff, M. R., Riser, S., Speer, K., Gray, A. R., et al. (2018). Observing the ice-covered weddell gyre with profiling floats: position uncertainties and correlation statistics. J. Geophys. Res. Oceans 123, 8383–8410. doi: 10.1029/2017JC012990
Chelton, D. B., Schlax, M. G., Samelson, R. M., Farrar, J. T., Molemaker, J., McWilliams, J. C., et al. (2018). Prospects for future satellite estimation of small-scale variability of ocean surface velocity and vorticity. Prog. Oceanogr. 173, 256–350. doi: 10.1016/j.pocean.2018.10.012
Chiswell, S. M. (2016). Mean velocity decomposition and vertical eddy diffusivity of the pacific ocean from surface gdp drifters and 1000-m argo floats. J. Phys. Oceanogr. 46, 1751–1768. doi: 10.1175/JPO-D-15-0189.1
Cole, S. T., Thwaites, F. T., Krishfield, R. A., and Toole, J. M. (2015). “Processing of velocity observations from ice-tethered profilers,” in Proceedings of the MTS/IEEE Oceans 2015 Conference, Washington, DC.
Fischer, J., and Visbeck, M. (1993). Deep velocity profiling with self-contained ADCPs. J. Atmos. Oceanic. Technol. 10, 764–773. doi: 10.1175/1520-0426(1993)010<0764:dvpwsc>2.0.co;2
Flagg, C. N., Schwartze, G., Gottlieb, E., and Rossby, T. (1998). Operating an acoustic doppler current profiler aboard a container vessel. J. Atmosp. Ocean. Tech. 15, 257–271. doi: 10.1175/1520-0426(1998)015<0257:oaadcp>2.0.co;2
Gill, A. E. (1982). Atmosphere-Ocean Dynamics of International Geophysics Series, Vol 30. San Diego, CA: Academic Press.
Goni, G., Sprintall, J., Roemmich, D.,Gronell, A., Thresher Couley, R., and Baringer, M. (2014). “The global network of XBT temperature sections in support of oceanographic and climate studies,” in Oceans and Society: Blue Planet, ed. S. Djavidnie (Cambridge: Cambridge Scholars Publishing).
Gray, A. R., and Riser, S. C. (2014). A global analysis of sverdrup balance using absolute geostrophic velocities from argo. J. Phys. Oceanogr. 44, 1213–1229. doi: 10.1175/JPO-D-12-0206.1
Guerra, M., and Thomson, J. (2017). Turbulence measurements from five-beam acoustic doppler current profilers. J. Atmos. Ocean. Technol. 34, 1267–1284. doi: 10.1175/JTECH-D-16-0148.1
Hamilton, P., Donohue, K., Leben, R. R., Lugo-Fernández, A., and Green, R. (2011). “Loop current observations during spring and summer of 2010: description and historical perspective,” in Monitoring and Modeling the Deepwater Horizon Oil Spill: A Record-breaking Enterprise. eds Y. Liu, A. MacFadyen and Z. G. J. R. Weisberg (American Geophysical Union: Washington, DC), 117–130. doi: 10.1029/2011gm001116
Katsumata, K., and Yoshinari, H. (2010). Uncertainties in global mapping of argo drift data at the parking level. J. Oceanogr. 66, 553–5691. doi: 10.1007/s10872-010-0046-4
Kessler, W. S., Johnson, G. C., and Moore, D. W. (2003). Sverdrup and nonlinear dynamics of the Pacific equatorial currents. J. Phys. Oceanogr. 33, 994–1008. doi: 10.1175/1520-0485(2003)033<0994:sandot>2.0.co;2
Kilbourne, F. B., and Girton, J. B. (2015). Quantifying high-frequency wind energy flux into near-inertial motions in the southeast Pacific. J. Phys. Oceanogr. 45, 369–386. doi: 10.1175/jpo-d-14-0076.1
Larsen, J. C., and Sanford, T. B. (1985). Florida current volume transport from voltage measurements. Science 227, 302–304. doi: 10.1126/science.227.4684.302
Lebedev, K., Yoshinari, H., Maximenko, N. A., and Hacker, P. W. (2007). YoMaha’07: velocity data assessed from trajectories fo argo floats at parking level and at the sea surface. IPRC Tech. 4:6.
Levine, E. R., Connors, D. N., Cornillon, P. C., and Rossby, H. T. (1986). Gulf stream kinematics along an isopycnal float trajectory. J. Phys. Oceanogr. 16, 1317–1328. doi: 10.1175/1520-0485(1986)016<1317:gskaai>2.0.co;2
Lumpkin, R., Centurioni, L., and Perez, R. C. (2016a). Fulfilling observing system implementation requirements with the global drifter array. J. Atmos. Oceanic Technol. 33, 685–695. doi: 10.1175/JTECH-D-15-0255.1
Lumpkin, R., Ozgokmen, T., and Centurioni, L. (2016b). Advances in the applications of surface drifters. Annu. Rev. Mar. Sci. 9, 59–81. doi: 10.1146/annurev-marine-010816-060641
MacKinnon, J. A., Alford, M. H., Ansong, J. K., Arbic, B. K., Barna, A., Briegleb, B. P., et al. (2017). Climate process team on internal wave-driven ocean mixing. Bull. Am. Meteorol. Soc. 98, 2429–2454. doi: 10.1175/BAMS-D-16-0030.1
Meinen, C. S., Luther, D. S., Watts, D. R., Tracey, K. L., Chave, A. D., and Richman, J. (2002). Combining inverted echo sounder and horizontal electric field recorder measurements to obtain absolute velocity profiles. J. Atmos. Oceanic Technol. 19, 1653–1664. doi: 10.1175/1520-0426(2002)019<1653:ciesah>2.0.co;2
OceanScope (2012). “A Proposed Partnership Between the Maritime Industries and the Ocean Observing Community to Monitor the Global Ocean Water Column,” in Report of SCOR/IAPSO Working Group 133, eds T. Rossby and K. Kim (Paris: SCOR/IAPSO Final Report).
Ollitrault, M., and Rannou, J.-P. (2013). ANDRO: an Argo-based deep displacement dataset. J. Atmos. Ocean. Technol. 30, 759–788. doi: 10.1175/JTECH-D-12-00073.1
Paduan, J. D., Kosro, P. M., and Glenn, S. M. (2004). A national coastal ocean high frequency radar system for the United States. Mar. Tech. Soc. J. 38, 76–82.
Phillips, H. E., and Bindoff, N. L. (2014). On the non-equivalent barotropic structure of the antarctic circumpolar current: an observational perspective. J. Geophys. Res. Oceans 119, 5221–5243. doi: 10.1002/2013JC009516
Ramsey, A. L., Furey, H. H., and Bower, A. S. (2018). Deep floats reveal complex ocean circulation patterns. Eos 99 doi: 10.1029/2018EO105549
Reid, J. L. (1994). On the total geostrophic circulation of the north atlantic ocean: flow patterns, tracers, and transports. Prog. Oceanogr. 33, 1–92. doi: 10.1016/0079-6611(94)90014-0
Richardson, P. L. (2018). “Drifters and floats,” in Encyclopedia of Ocean Sciences eds K. Turekian, S. A. Thorpe, and J. Steele. Woods Hole, MA: Woods Hole Oceanographic Institution.
Riser, S. C., Freeland, H. J., Roemmich, D., Wijffels, S., Troisi, A., Belbéoch, M., et al. (2016). Fifteen years of ocean observations with the global argo array. Nat. Clim. Change 6, 145–153.
Rossby, H. T., Dorson, D., and Fontaine, J. (1986). The RAFOS system. J. Atmosp. Ocean. Technol. 3, 672–679. doi: 10.1175/1520-0426(1986)003<0672:trs>2.0.co;2
Rossby, T., Flagg, C., and Donohue, K. (2010). On the variability of gulf stream transport from seasonal to decadal timescales. J. Mar. Res. 68, 503–522. doi: 10.1357/002224010794657128
Rossby, T., Flagg, C., Ortner, P., and Hu, C. (2011). A tale of two eddies: diagnosing coherent eddies through acoustic remote sensing. J. Geophys. Res. 116:C12017. doi: 10.1029/2011JC007307
Rossby, T., and Flagg, C. N. (2012). Direct measurement of volume flux in the faroe-shetland channel and over the iceland-faroe ridge. Geophys. Res. Lett. 39:L07602.
Rossby, T., Flagg, C. N., Donohue, K., Sanchez-Franks, A., and Lillibridge, J. (2014). On the long-term stability of Gulf Stream transport based on 20 years of direct measurements. J. Geophys. Res. 41, 114–120. doi: 10.1002/2013gl058636
Rossby, T., and Özgökmen, T. (2007). “Evolution of lagrangian methods in oceanography,” in Lagrangian Analysis and Prediction of Coastal and Ocean Dynamics, eds A. Griffa, A. D. Kirwan Jr., A. JMariano, and H. T. Rossby (Cambridge: Cambridge Univ. Press).
Rousset, C., and Beal, L. M. (2010). Observations of the yucatan and florida currents from caribbean cruise ship. J Phys. Oceanogr. 40, 1575–1581. doi: 10.1175/2010jpo4447.1
Sanford, T. B. (1971). Motionally induced electric and magnetic fields in the sea. J. Geophys. Res. Oceans 76, 3476–3492. doi: 10.1029/JC076i015p03476
Sanford, T. B., Drever, R. G., Dunlap, J. H., and D’Asaro, E. A. (1982). Design, Operation, and Performance of an Expendable Temperature and Velocity Profiler (XTVP). Seattle, WA: University of Washington.
Sanford, T. B., Price, J. F., and Girton, J. B. (2011). Upper-ocean response to Hurricane Frances (2004) observed by profiling EM-APEX floats. J. Phys. Oceanogr. 41 1041–1056. doi: 10.1175/2010JPO4313.1
Sanford, T. B., Price, J. F., Girton, J. B., and Webb, D. C. (2007). Highly resolved observations and simulations of the ocean response to a hurricane. Geophys. Res. Lett. 34:L13604.
Shay, L. K., and Jacob, S. D. (2006). “Relationship between oceanic energy fluxes and surface winds during tropical cyclone passage” in Atmosphere-Ocean Interactions II, Advances in Fluid Mechanics ed. W. Perrie (Southampton: WIT Press), 115–142. doi: 10.2495/978-1-85312-929-2/05
Sun, C. (2015). Reference Manual for Quality Control of Subsurface Currents Data (QCSCD). Available at: https://www.nodc.noaa.gov/gocd/documents/qcscd_manual_v1.pdf (accessed March 21, 2019).
Sun, C. (2018). US DOC/NOAA/NESDIS National Centers for Environmental Information NCEI Standard Product: Global Ocean Currents Database (GOCD). NOAA: Silver Spring.
Szuts, Z. B. (2012). Using motionally-induced electric fields to indirectly measure ocean velocity: instrumental and theoretical developments. Prog. Oceanogr. 96, 108–127. doi: 10.1016/j.pocean.2011.11.014
Szuts, Z. B., and Meinen, C. S. (2013). Salinity transport in the florida straits. J. Atmos. Ocean. Technol. 30, 971–983. doi: 10.1175/jtech-d-12-00133.1
Taillandier, V., Griffa, A., Poulain, P. M., and Béranger, K. (2006). Assimilation of argo float positions in the north western mediterranean sea and impact on ocean circulation simulations. Geophys. Res. Lett. 33:L11604. doi: 10.1029/2005GL025552
Thomson, J., and Girton, J. (2017). Sustained measurements of southern ocean air-sea coupling from a wave glider autonomous surface vehicle. Oceanography 30, 104–109. doi: 10.5670/oceanog.2017.228
Todd, R. E., Rudnick, D. L., Sherman, J. T., Owens, W. B., and George, L. (2017). Absolute velocity estimates from autonomous underwater gliders equipped with doppler current profilers. J. Atmos. Ocean. Technol. 34, 309–333. doi: 10.1175/JTECH-D-16-0156.1
Uhlhorn, E. W., and Shay, L. K. (2012). Loop current mixed layer energy response to hurricane lili (2002). Part I: observations. J. Phys. Oceanogr. 42, 400–419. doi: 10.1175/jpo-d-11-096.1
Keywords: velocity, ocean measurements, subsurface, database, sampling network, ADCP, autonomous vehicle, floats
Citation: Szuts ZB, Bower AS, Donohue KA, Girton JB, Hummon JM, Katsumata K, Lumpkin R, Ortner PB, Phillips HE, Rossby HT, Shay LK, Sun C and Todd RE (2019) The Scientific and Societal Uses of Global Measurements of Subsurface Velocity. Front. Mar. Sci. 6:358. doi: 10.3389/fmars.2019.00358
Received: 01 November 2018; Accepted: 12 June 2019;
Published: 24 July 2019.
Edited by:
John Siddorn, Met Office, United KingdomReviewed by:
Sophie E. Cravatte, Institut de Recherche pour le Développement (IRD), FranceBablu Sinha, University of Southampton, United Kingdom
Copyright © 2019 Szuts, Bower, Donohue, Girton, Hummon, Katsumata, Lumpkin, Ortner, Phillips, Rossby, Shay, Sun and Todd. This is an open-access article distributed under the terms of the Creative Commons Attribution License (CC BY). The use, distribution or reproduction in other forums is permitted, provided the original author(s) and the copyright owner(s) are credited and that the original publication in this journal is cited, in accordance with accepted academic practice. No use, distribution or reproduction is permitted which does not comply with these terms.
*Correspondence: Zoltan B. Szuts, enN6dXRzQGFwbC53YXNoaW5ndG9uLmVkdQ==
†Retired, Asheville, NC, United States