 Edward T. Baker
 Sharon L. Walker
 Gary J. Massoth
 Joseph A. Resing
- 1Joint Institute for the Study of the Atmosphere and Ocean, University of Washington, Seattle, WA, United States
- 2National Oceanic and Atmospheric Administration/Pacific Marine Environmental Laboratory, Seattle, WA, United States
- 3Mass-Ex3 Consulting, LLC, Renton, WA, United States
The distribution of hydrothermal venting reveals important clues about the presence of magma in submarine settings. The NE Lau Basin in the southwest Pacific Ocean is a complex back-arc region of widespread hydrothermal activity. It includes spreading ridges, arc volcanoes, and intra-plate volcanoes that provide a perhaps unique laboratory for studying interactions between hydrothermal activity and magma sources. Since 2004, multiple cruises have explored the water column of the NE Lau Basin. Here, we use these data to identify and characterize 43 active hydrothermal sites by means of optical, temperature, and chemical tracers in plumes discharged by each site. Seventeen of 20 prominent volcanic edifices dispersed among the Tofua arc, spreading ridges, and plate interiors host active hydrothermal sites. Fourteen apparently discharge high-temperature fluids, including a multi-year submarine eruption at the intra-plate volcano W Mata. The 430 km of spreading ridges host 31 active sites, one an eruption event in 2008. Our data show that the relationship between site spatial density (sites/100 km of ridge crest) and ridge spreading rate (8–42 mm/year) in the NE Lau Basin follows the same linear trend as previously established for the faster-spreading (40–90 mm/year) ridges in the central Lau Basin. The lower site density in the NE Lau Basin compared to the southern Lau is consistent with recent plate reconstructions that more than halved earlier estimates of ∼50–100 mm/year spreading rates in the NE Lau Basin. Combined data from the spreading ridges throughout the entire Lau back-arc basin demonstrates that hydrothermal sites, normalized to spreading rate, are ∼10× more common than expected based on existing mid-ocean ridge data. This increase documents the ability of meticulous exploration, using both turbidity and chemical sensors, to more fully describe the true hydrothermal population of a spreading ridge, compared to conventional techniques. It further reveals that the Lau back-arc basin, benefiting from both ridge and arc magma sources, supports an exceptionally high population of ridge and intra-plate hydrothermal sites.
Introduction
The distribution of hydrothermal venting sites depends on the interplay between heat supply by magmatism and crustal permeability caused by tectonism (e.g., Baker et al., 1995). Few oceanic areas combine the abundance of hydrothermal sites and the diversity of geological settings necessary for evaluating the relative importance of each process. One example is the NE Lau Basin, a back-arc basin where complex plate processes have created one of the most densely populated and geologically diverse group of active vents yet studied. We here define the NE Lau Basin as that portion of the larger Lau Basin that is bounded on the east by the Tofua arc, on the north by a subducting plate tear created by the westward bending of the Tonga-Pacific plate boundary, on the west by a series of back-arc ridges along the Niuafo’ou-Tonga plate (and likely an undefined microplate(s) to their north) boundary, and on the south by the near intersection of the Niuafo’ou plate and the Tofua arc (Figure 1; Conder and Wiens, 2011; Sleeper and Martinez, 2016).
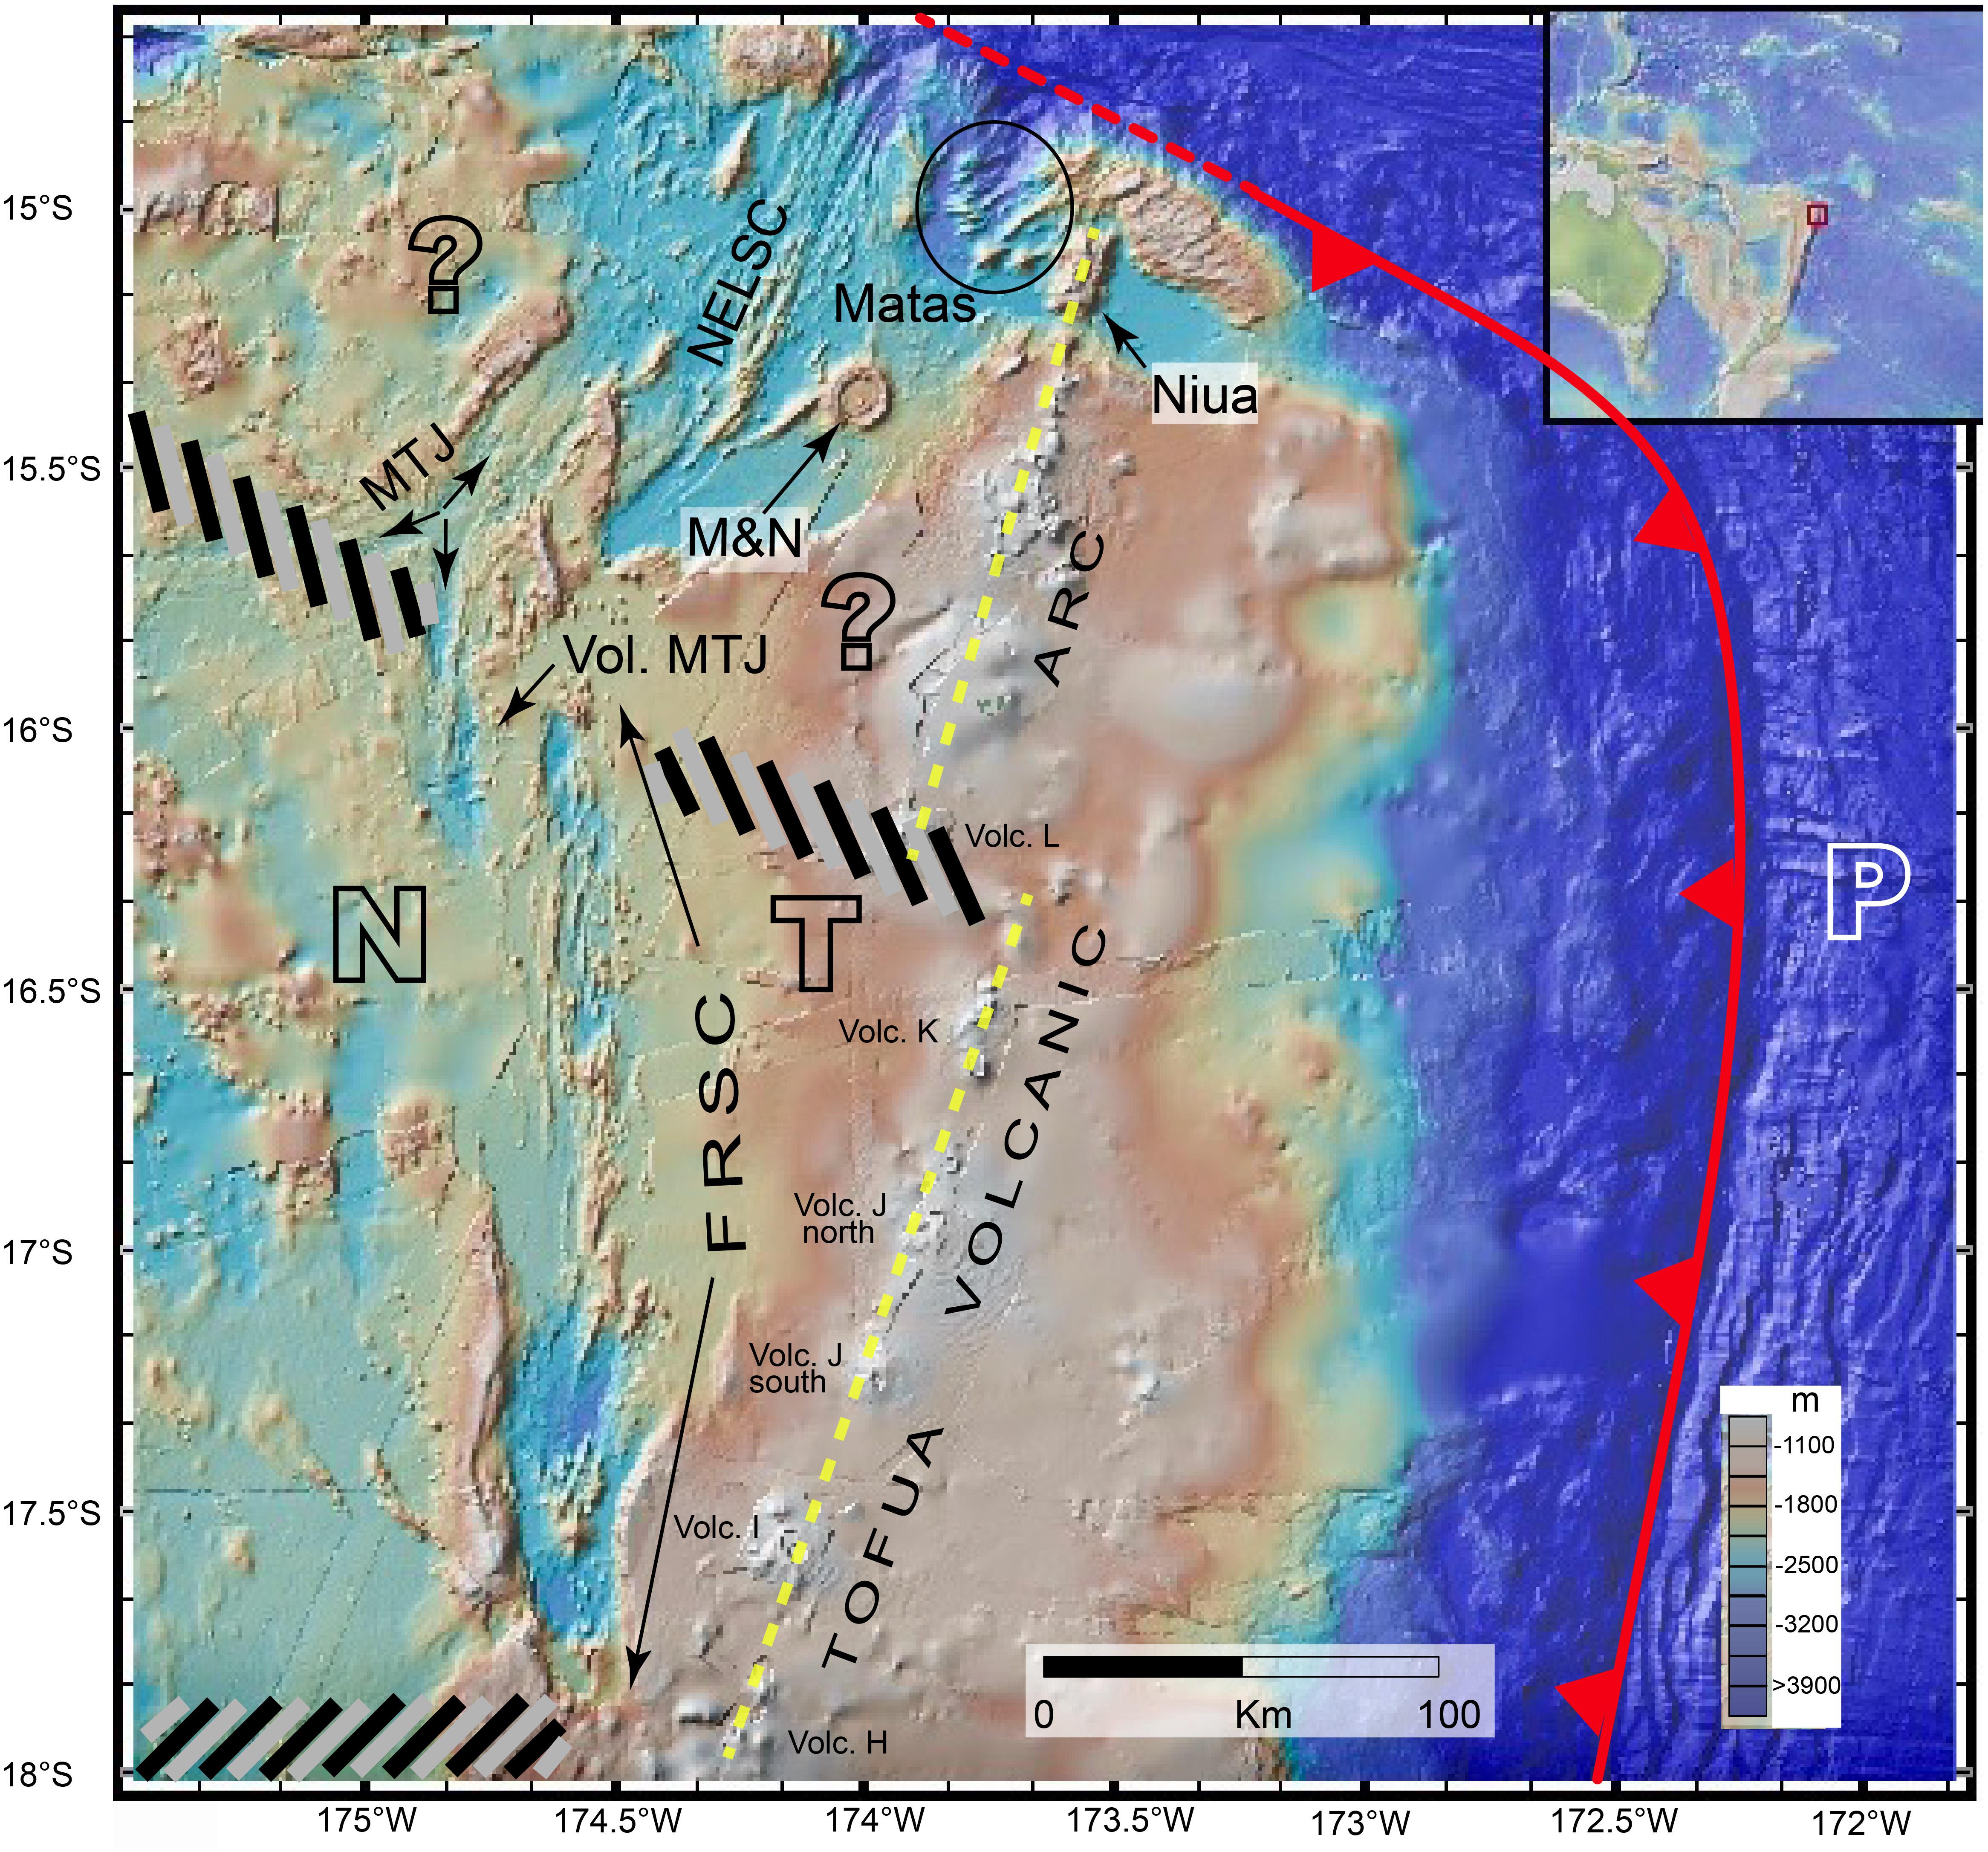
Figure 1. Hydrothermally active areas of the NE Lau Basin. Spreading centers along the Mangatolou Triple Junction (MTJ) and the Fonualei Rift and Spreading Center (FRSC), separate the Tonga (T) and Niuafo’ou (N) plates. The southern N-T boundary is a diffuse boundary or a deformation zone, (right-tilting gray and black bars) (Sleeper and Martinez, 2016). The NE Lau Spreading Center (NELSC) is within an area where plate boundaries (north of the left-tilting gray and black bars) between N&T and more northerly plates (?) are undetermined (Conder and Wiens, 2011). Niua volcano is on the Tofua arc, whereas the nine Mata volcanoes, Motutahi (M), Niuatahi (N) and MTJ are intra-plate volcanoes. Other known but apparently inactive submarine Tofua arc volcanoes (H–L) are also labeled. The NE Lau Basin is constrained on the north by the subduction boundary between the T and Pacific (P) plates (solid red line) that becomes a subducting plate tear (dashed red line) after turning westward. Figure made with GeoMapApp (www.geomapapp.org).
Volcanism in the NE Lau Basin occurs on and between these boundaries. The active Niua volcano marks the northern end of the Tofua arc. The Northeast Lau Spreading Center (NELSC), the Mangatolou Triple Junction (MTJ) segments, and the Fonualei Rift and Spreading Center (FRSC) define the western edge of the northern Tonga plate, and that of the undefined plate(s) to the north. Multiple active cone and caldera volcanoes populate its intra-plate portion. The Zellmer and Taylor (2001) three-plate kinematic model derived spreading rates increasing from 50 mm/year (full rate here and throughout the text) at the south end of the FRSC to 100 mm/year along the MTJ. Bird (2003) extended these predictions to the NELSC, deriving speeds as high as 126 mm/year. By analogy with world-wide mid-ocean ridges (e.g., Beaulieu et al., 2015), the hydrothermal site density, Fs (sites/100 km of ridge), along this boundary should be among the highest in the entire Lau Basin. A revised plate model (Sleeper and Martinez, 2016), however, predicts spreading rates of only 8–∼40 mm/year along these ridges. This reduction leads to an expectation of significantly fewer hydrothermal sites.
This paper uses water-column survey data collected since 2004 to describe the distribution of hydrothermal activity within the various volcanic/tectonic domains of the NE Lau Basin. Such surveys began with sparse coverage by Arculus (2004),German et al. (2006), and Kim et al. (2009). In 2008, the NOAA Vents (now Earth–Ocean Interaction) program, together with various collaborating institutions and organizations, began a series of cruises (2008, 2009, 2010, 2012, and 2017) to investigate hydrothermal activity in the NE Lau Basin. This work has produced a list of 25 hydrothermal sites in the authoritative InterRidge database1, but that list is not comprehensive, contains no specific water column information about individual sites, and is based almost exclusively on meeting abstracts and cruise reports. To describe NE Lau Basin sites more fully, we first present optical, temperature, and oxidation-reduction potential (ORP) hydrothermal plume data that identify 43 sites that were active when discovered, including 11 sites where time series data spanning 4–12 years are available. These data allow us to infer discharge as either high- (discrete) or low- (diffuse) temperature. We then describe how the distribution of active sites on volcanic edifices and spreading ridges is related to the apparent sources of magma at the local convergent and divergent plate boundaries. Finally, we compare Fs at different ridge spreading rates in the NE Lau Basin to that of faster-spreading ridges in the southern Lau Basin, and to a global set of mid-ocean ridges available from the InterRidge database.
Geologic Setting
Spreading Ridges
Sleeper and Martinez (2016) derive southern MTJ and FRSC spreading rates decreasing from 30 mm/year at 15.67°S to ultraslow rates (8–14 mm/year) south of ∼17.17°S. Their analysis further implies that rates on MTJ and NELSC increase steadily northward from 32 mm/year at 15.7°S to 42 mm/year at 15.2°S (J. D. Sleeper, University of Hawaii, personal communication). Morphological changes follow this spreading rate trend (Sleeper et al., 2016). Near 15.2°S, the NELSC is a high-standing ridge ∼6 km wide with an elevation approaching 600 m (Figure 2). On the southern segment, the axial profile narrows and elevation increases to ∼1000 m at the bathymetric high (15.385°S), which is bookended by prominent volcanic cones (Maka and Tafu). An ongoing eruption at the bathymetric high was serendipitously discovered in November 2008 (Baker et al., 2011; Baumberger et al., in review). The morphology of the NELSC is similar to that of the southern Eastern Lau Spreading Center (ELSC; a section of the ELSC also known as the Valu Fa Ridge (VFR)] and the southern Mariana back-arc spreading center, both slow-spreading ridges that are close (<70 km) to an active arc and have enhanced hydrothermal activity relative to their spreading rates (30–50 mm/year) (Martinez et al., 2006; Baker et al., 2017).
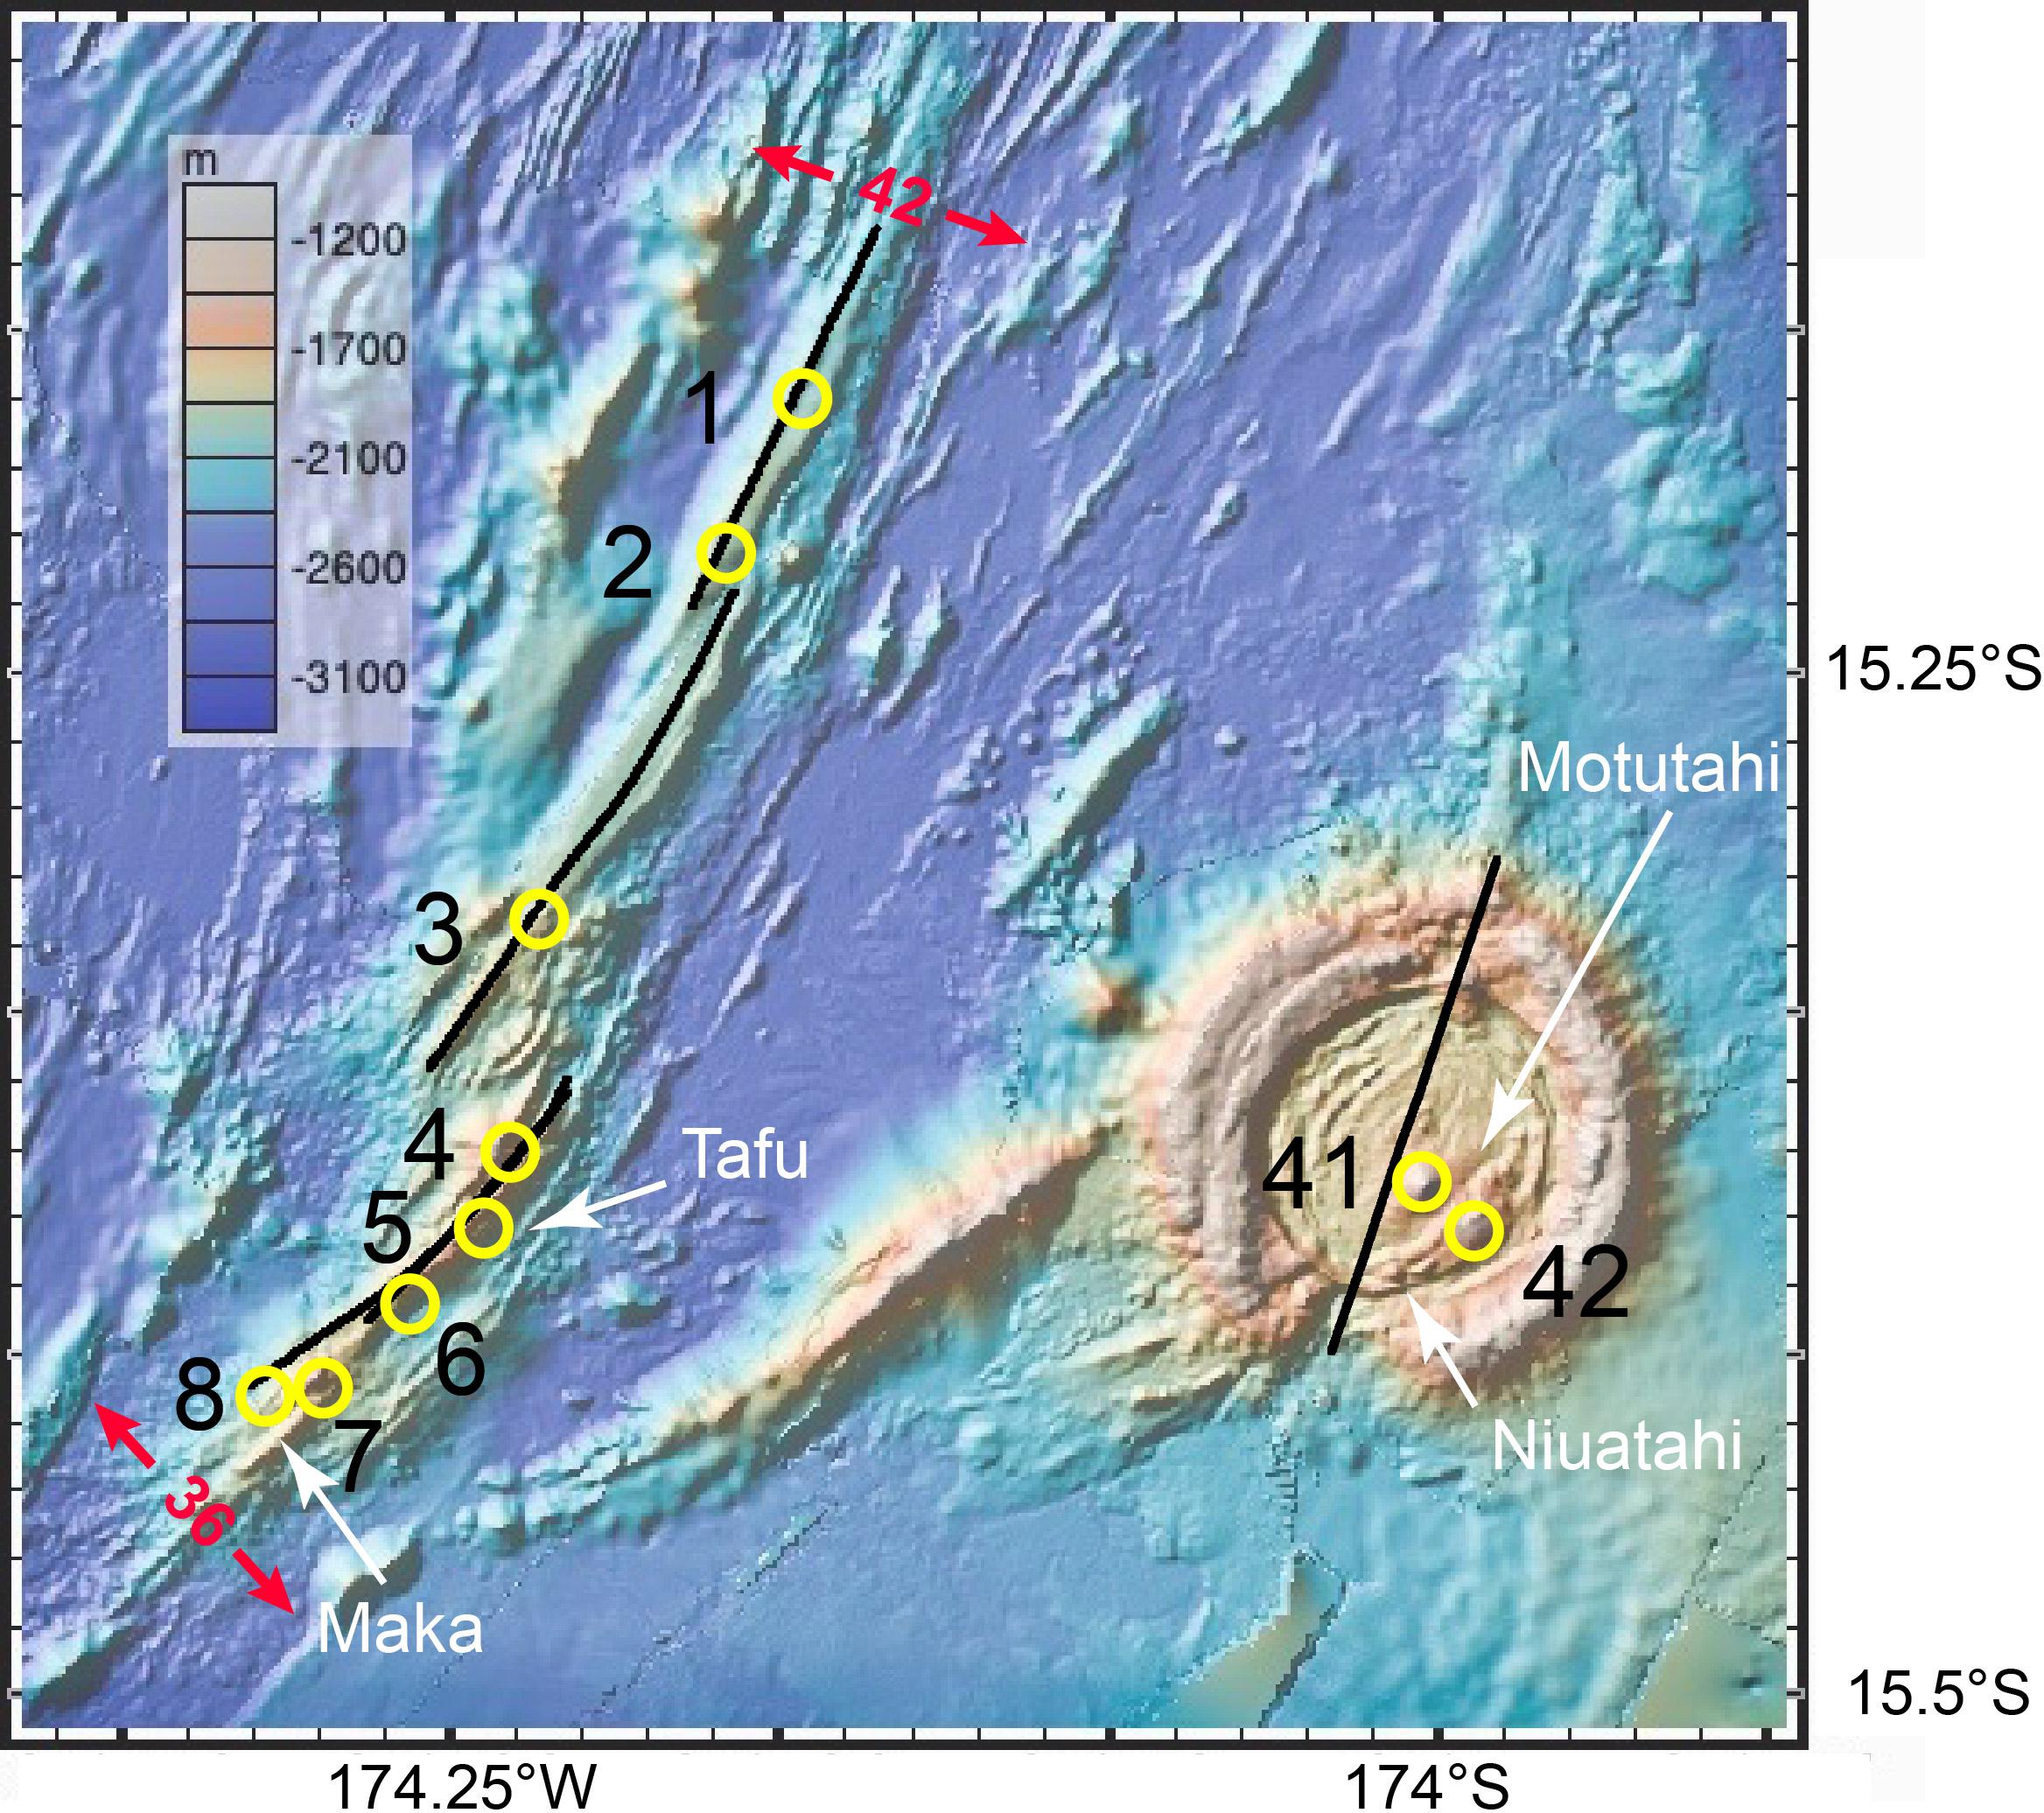
Figure 2. Survey tow lines (black) and active hydrothermal sites (yellow circles) of the NELSC and the Niuatahi volcano (within which is the Motutahi volcanic cone). Numbers correspond to sites in Tables 1, 2. Red arrows indicate full rate spreading values (mm/year). Figure made with GeoMapApp (www.geomapapp.org).
The MTJ lies only 30 km west of the NELSC but contrasts sharply in morphology. It includes three spreading centers in a ridge-ridge-ridge triple junction (Figure 3; Hawkins, 1995). The northern limb is considerably wider (∼15–18 km) than the NELSC, with a broad (∼12 km) axial high split by a narrow axial cleft in the north and a narrow (∼3 km) axial high in the south. The southern limb includes two off-set segments with deep, flat, ∼5 km-wide floors bounded by faults (Sleeper et al., 2016). The western limb is similar but narrower.
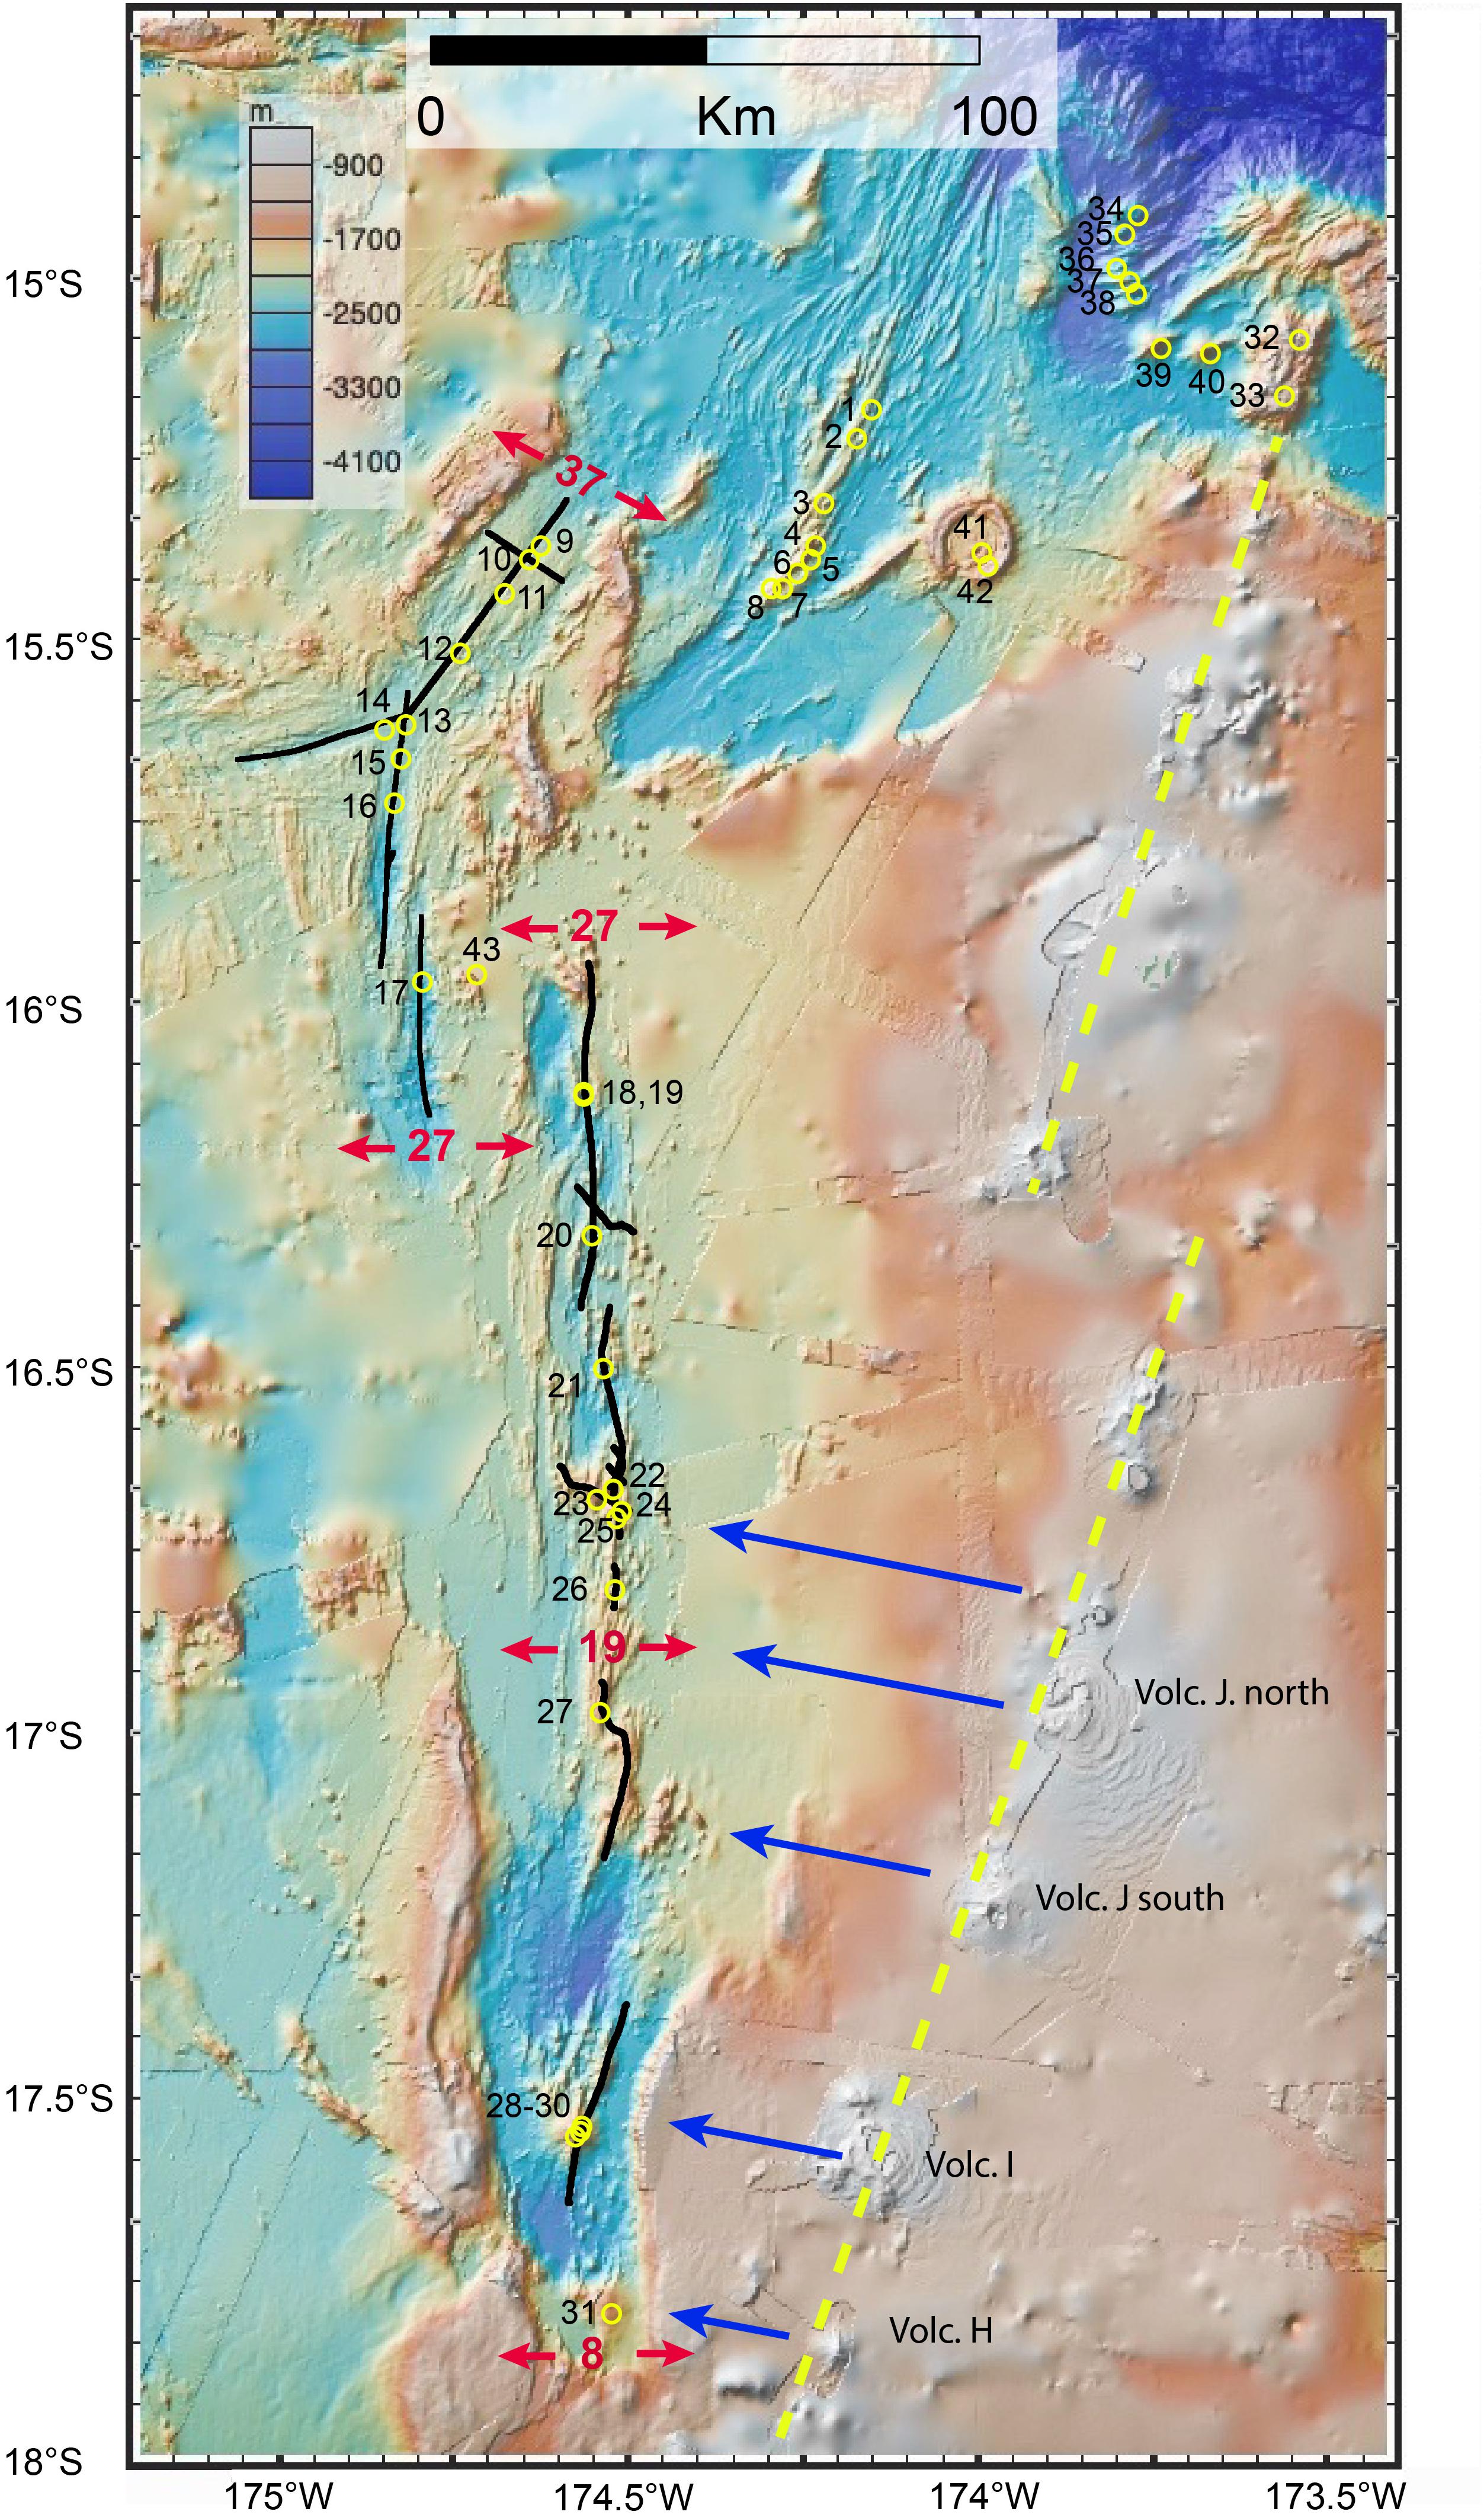
Figure 3. Survey tow lines (black) and active hydrothermal sites (yellow circles) of the MTJ and the FRSC. Numbers correspond to sites in Table 1. This figure also includes all the known active sites in the NE Lau Basin (Tables 1, 2). Red arrows indicate full rate spreading values (mm/year). Tofua arc strike follows the dashed yellow line. Blue arrows, aligned in the direction of the Pacific slab flow line, indicate correspondence between arc and FRSC volcanoes within 70 km of the Tofua arc (Sleeper et al., 2016). Figure made with GeoMapApp (www.geomapapp.org).
The FRSC overlaps the MTJ, beginning as a ∼10 km-wide axial valley with discontinuous axial ridges (Figure 3). As the spreading rate decreases to <∼14 mm/year near 17.1°S, the axial valley widens (∼15–20 km) and large volcanic peaks replace axial ridges (Sleeper et al., 2016). The extremely rugged bathymetry of the FRSC complicates the inference of source locations from plume observations. Large volcanic cones are prominent on the FRSC south of ∼16.6°S, notably at 16.67°S, 17.11°S, 17.54°S, and 17.78°S (Figure 3). These volcanoes have reliefs of 1200–2000 m.
Non-ridge Volcanoes
Niua (aka Volcano “P”) is the northern-most volcano of the Tofua arc and the only submarine arc volcano bordering the NE Lau Basin confirmed hydrothermally active (Arculus, 2004). The Niua edifice is elongated N-S with shallow (700 m) and deep (1200 m) cones (Figure 4).
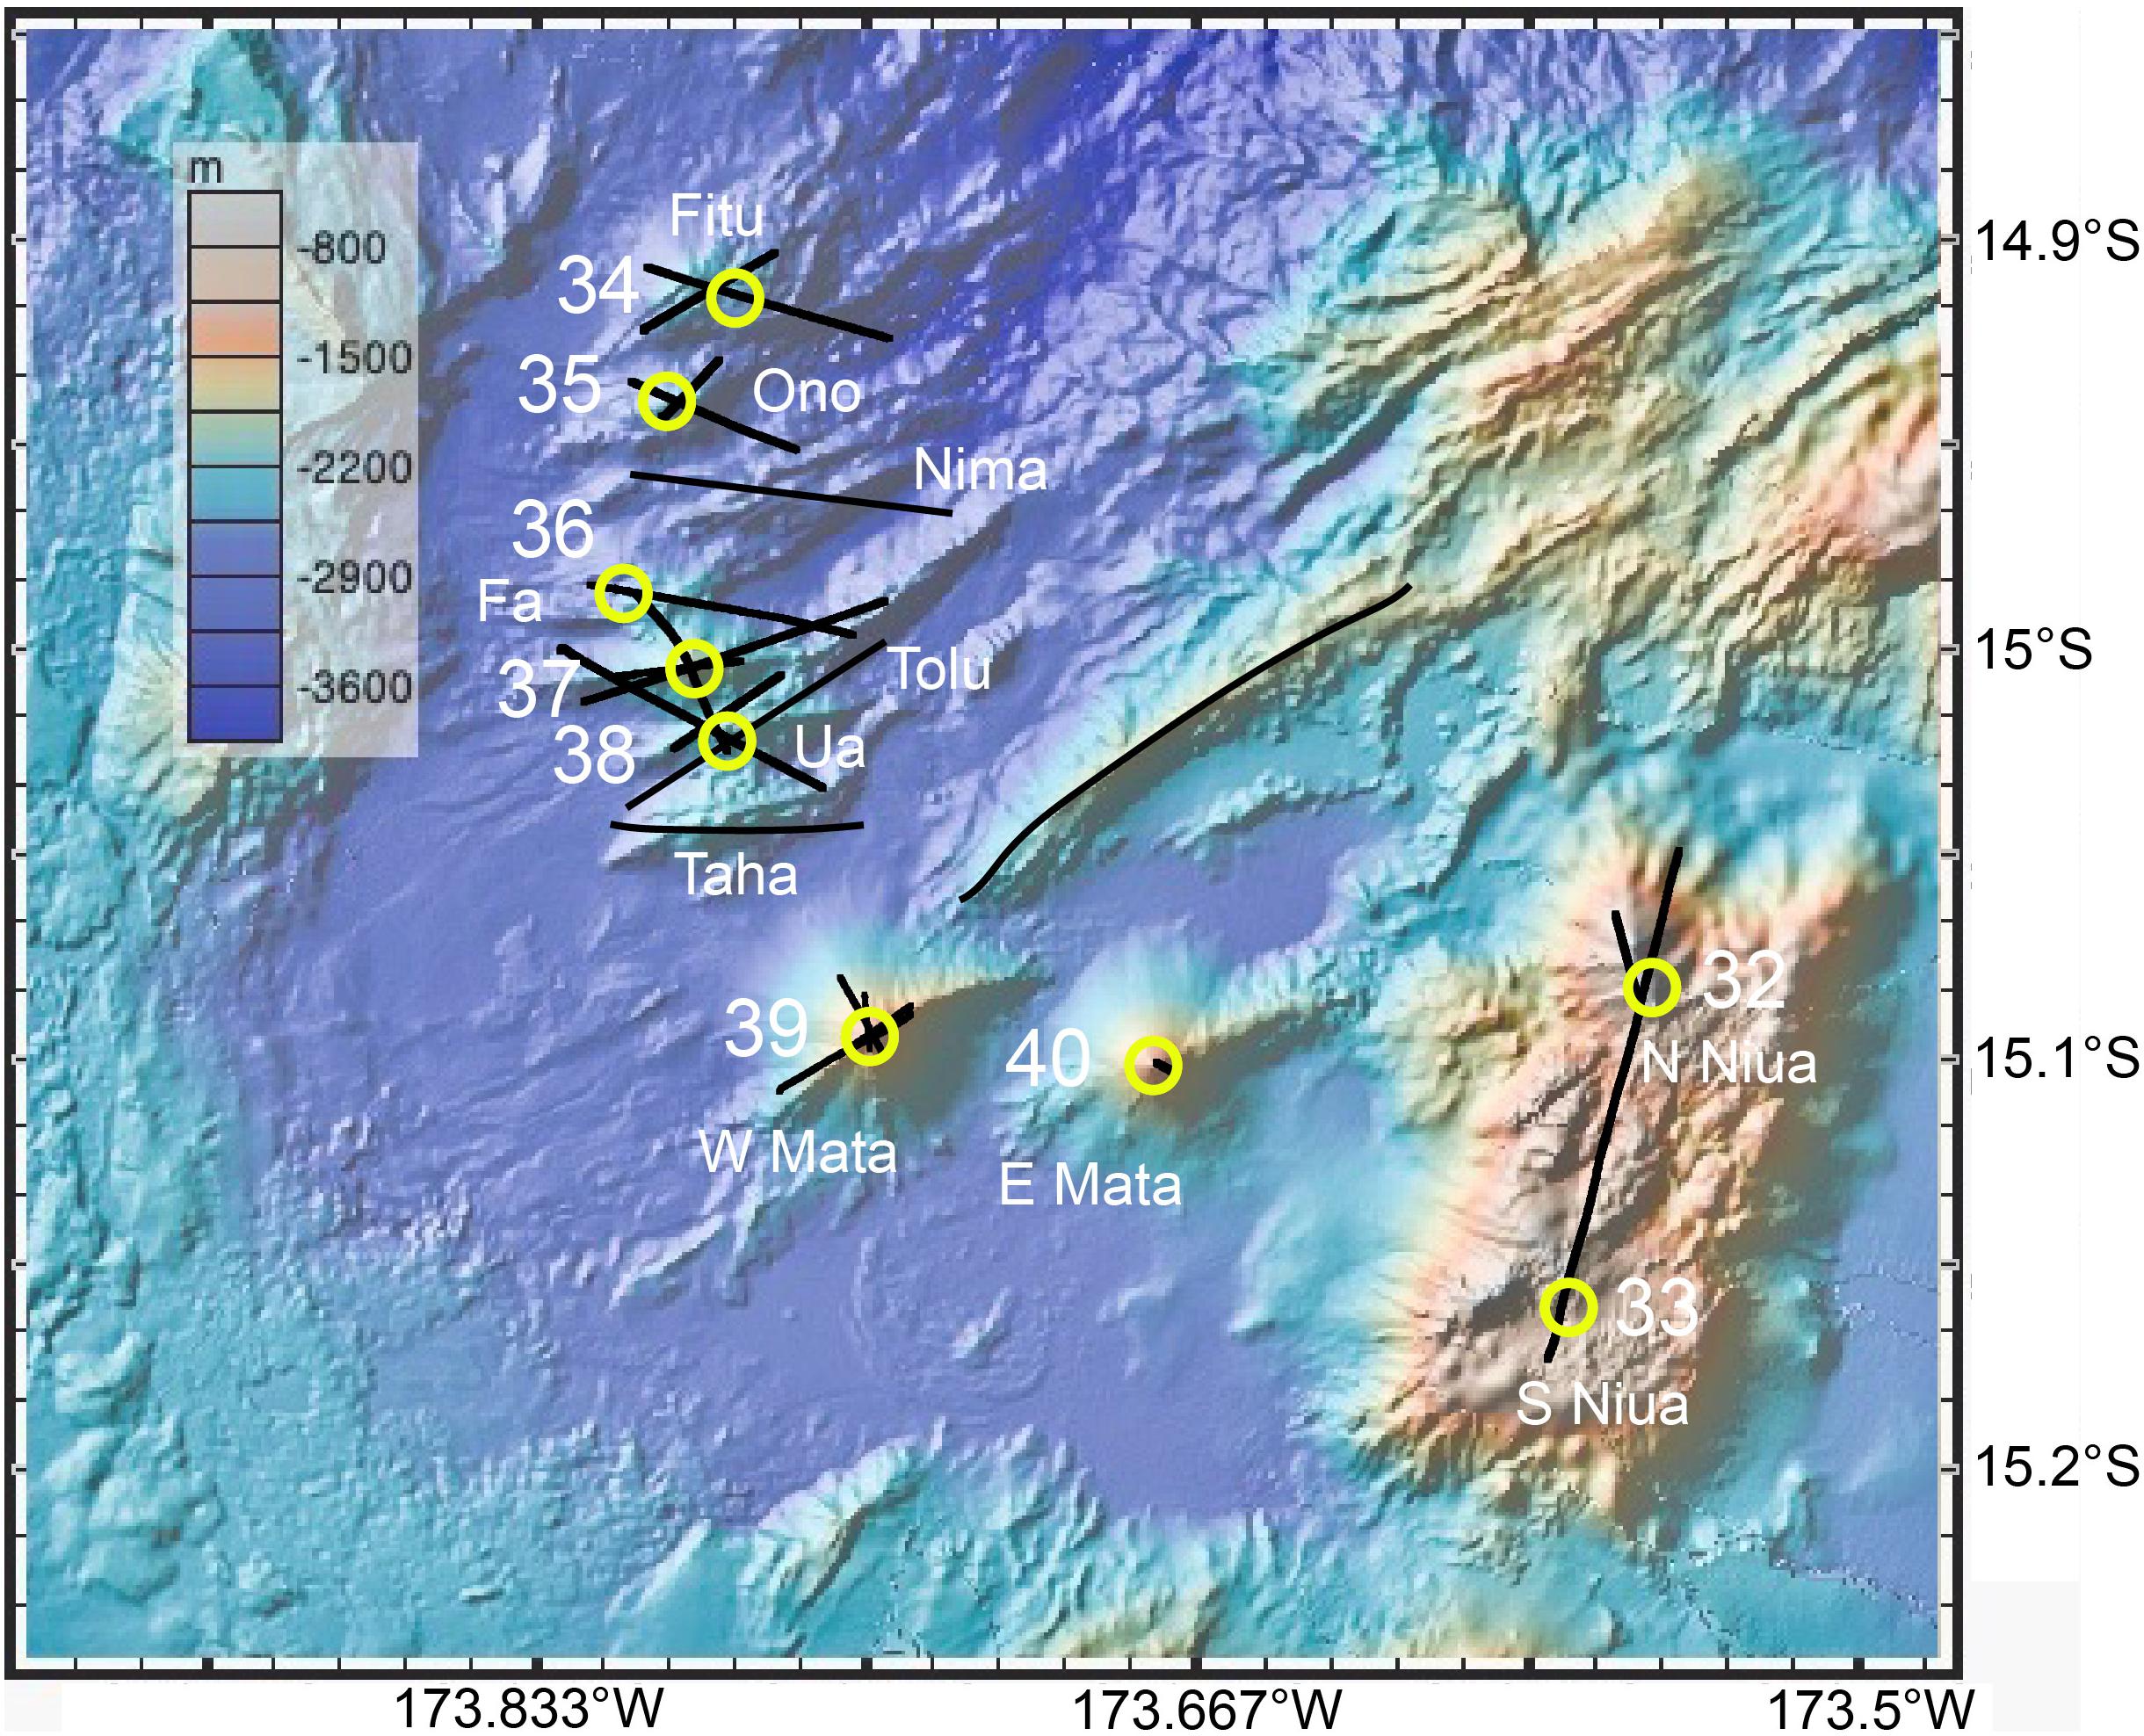
Figure 4. Survey tow lines (black) and active hydrothermal sites (yellow circles) of the Matas and Niua. Numbers correspond to sites in Table 2. Figure made with GeoMapApp (www.geomapapp.org).
Niuatahi (aka “Volcano O”) is a 15-km-diameter caldera just east of the NELSC (Figure 2; Kim et al., 2009). Ongoing E-W extension of the caldera is indicated by short gaps in the wall north and south of the cone, and by ridges that extend outward from those gaps. The central cone, Motutahi, reaches a depth of ∼1300 m, and a deeper volcanic edifice to the southeast summits at ∼1500 m.
The nine Mata volcanoes form an en echelon crescent path lying 12–30 km west of the Tofua arc (Figure 4; Resing et al., 2011b; Rubin and Embley, 2012). The northern seven are smaller (900–1300 m elevation) and deeper (summit depths of 1900–2400 m) than the southern W and E Mata (1400–1700 m relief, summit depths of 1200–1330 m). All nine are elongated in a roughly WSW-ENE orientation, evidently controlled by smaller crustal tears linked to the major crustal tear fault where the N-S Tongan subduction trend changes to E-W strike-slip motion (Govers and Wortel, 2005; Embley et al., 2009). Resing et al. (2011a) confirmed a boninite lava eruption on W Mata lasting at least from 2008 to 2010. They suggested that hydrothermal activity on the Matas may be stimulated by the upwelling of high-temperature mantle (Wiens et al., 2006) and/or the hot Samoan mantle plume passing through a tear in the Pacific plate into the NE Lau Basin (Falloon et al., 2007). Lupton et al. (2015) recently offered a different interpretation, using plots of C/3He versus 3He/4He for NE Lau Basin rock and fluid samples that clearly define fields of ridge and arc influence. Those data place all the intra-plate volcanos (including Niuatahi) clearly in the arc field with Niua (Lupton et al., 2015). This interpretation supports a powerful magmatic influence from the superfast [convergence as much as ∼240 mm/year (Bevis et al., 1995)] Tonga subduction zone.
Surprisingly, in 2012 we found another hydrothermally active, apparently intra-plate, volcano just 6 km east of the eastern wall of the southern limb of the MTJ spreading ridge but >100 km distant from any other intra-plate or arc volcano (Figure 1). Referred to here as “Volcano MTJ,” it features a ∼100-m-deep, ∼500-m-diameter crater at a summit depth of 1200 m. This volcano is a glaring contrast to the apparently low magma budget of the southern MTJ. Its location due east of site 17 in the MTJ may be a coincidence or an indication of a common magma source. A profile over a deeper volcanic structure east of site 16 showed no indication of hydrothermal activity.
Materials and Methods
Instrumentation
Most hydrothermal plumes were mapped by means of vertical casts and tow-yos using a SeaBird 911plus conductivity-temperature-depth (CTD) package with light back-scattering (Seapoint turbidity) and chemical (PMEL ORP) sensors. Eighty percent of the plume data used here (Tables 1, 2) was collected using tow-yos, which create two-dimensional plume images (e.g., Baker et al., 2017). Some data were acquired using only PMEL Miniature Autonomous Plume Recorders, self-contained packages with light back-scattering, ORP (in some cases), and pressure sensors (e.g., German et al., 2006). The light back-scattering and ORP sensors were identical to those used on the CTD.
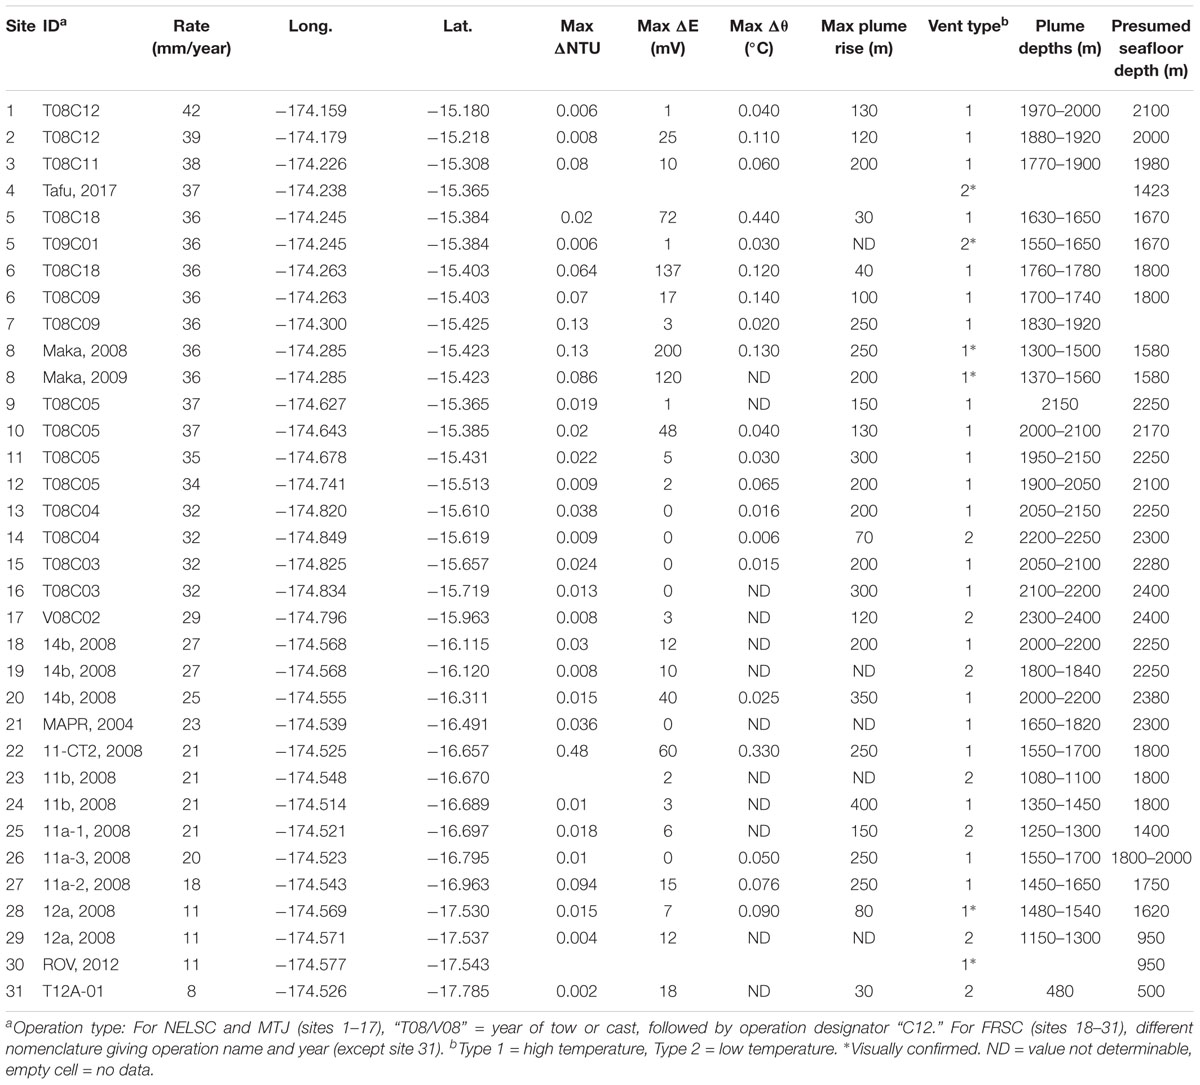
Table 1. Characteristics of plumes from NE Lau Basin spreading ridges.
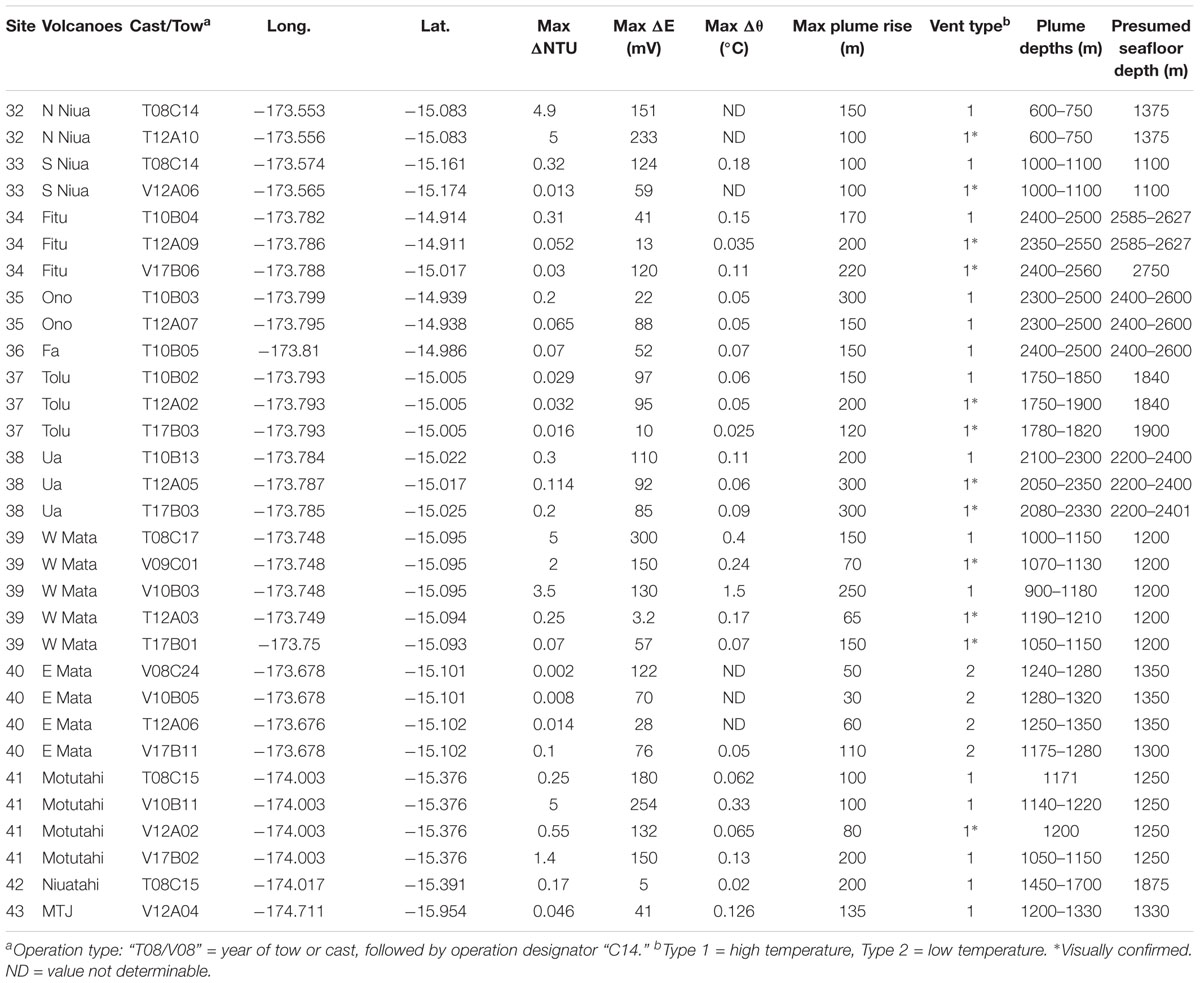
Table 2. Characteristics of plumes from NE Lau Basin non-ridge volcanoes.
The light back-scattering sensor [measuring non-dimensional Nephelometric Turbidity Units (NTU; American Public Health Association [APHA], 1985)] detects particle-rich discharge, generally at source temperatures >200°C, containing precipitated metals or sulfur-rich minerals that create plumes extending kilometers from their source. The notation ΔNTU indicates the NTU value (0–5 V range on the sensor) above the local ambient water. Continual plume mixing and particle sedimentation strongly affects instantaneous ΔNTU values of any plume.
We calculate the hydrothermal temperature anomaly (Δ𝜃) in a neutrally buoyant plume from the expression Δ𝜃 = 𝜃–(m1 + m2σ𝜃 + m3σ𝜃2), where 𝜃 is potential temperature, σ𝜃 is potential density, and m1, m2, and m3 are constants in a linear or polynomial regression between 𝜃 and σ𝜃 in hydrothermally unaffected water around the plume (Lupton et al., 1985). We multiply the calculated Δ𝜃 values by 3.4 based on the local 𝜃-salinity gradient and assuming the vent fluid salinity is close to the salinity of ambient seawater (McDuff, 1995; Baker et al., 2011). Vent fluid salinities higher than seawater would lower the correction factor by about half, but vent salinities lower than ∼20 PSU would increase the correction by a factor of 10 or more.
The ORP sensor responds within a 1 s sampling interval to the presence of nanomolar concentrations of reduced hydrothermal chemicals (e.g., Fe+2, HS-, H2) from vents of any temperature (Walker et al., 2007; Resing et al., 2009; Baker et al., 2016). Because these chemicals rapidly oxidize, biotically or abiotically, close (∼1 km) to their seafloor source (Baker et al., 2016), an ORP response provides a far more precise indication of source location than does ΔNTU or Δ𝜃. The magnitude of an ORP anomaly (ΔE, mV) is calculated as the difference between the value prior to entering a plume and the most negative value reached before the values begin steadily increasing again (a more intense signal has a greater negative value), or by a negative time rate of change in E as the sensor encounters a plume (dE/dt). The absolute value of E varies among individual ORP sensors, but ΔE and dE/dt values are comparable (Walker et al., 2007; Baker et al., 2016). We consider values of ΔE > 2 mV to be diagnostic of a plume (Baker et al., 2017), but even values as low as 1 mV, when correlated with ΔNTU or Δ𝜃, can be reliably hydrothermal.
Inferring Vent Fluid Temperatures
We use plume data to infer whether sites were high-temperature (“black smokers” and associated low-temperature discharge) or low-temperature only (diffuse flow) sites. Of the 43 identified sites, remotely operated vehicles (ROVs) have visited only 13 (11 on discrete volcanoes). All but two dives measured high-temperature (>250°C) fluids or made observations consistent with such discharge (e.g., “black smoke,” sulfur particles). Of the remaining 29 sites, we classified some as high-temperature based on a single measurement type, but most required a combination of criteria to assign them as high- or low-temperature. We emphasize that these are inferred classifications that may change as a site ages or when direct observations are eventually made.
To make this decision, we use three criteria, listed here in order of importance: (1) Plume rise: high-temperature discharge typically rises >∼150 m (subject to the local vertical gradient of σ𝜃) and creates a roughly vertically symmetrical plume profile with a pronounced maximum in tracer values. Sites with multiple sources or strong current effects (which bend plumes and depress rise height) can display multiple maxima at different depths. Because the precise location and depth of many inferred sources remains uncertain, especially at low spreading rates where axial valleys are wide and bathymetry rugged, plume rise can be difficult to estimate accurately. (2) ΔNTU value: high-temperature discharge produces copious particles and higher ΔNTU (very roughly >∼0.02), but values decrease as the plume dilutes and particles are removed. Conversely, a low ΔNTU coupled with high ΔE is characteristic of low-temperature discharge. (3) Δ𝜃 values: The Δ𝜃 value of low-temperature sources dilutes rapidly, so measurable values, especially when significantly correlated with ΔNTU, argue for a high-temperature source. Values for these criteria for each site (where data permits) are given in Tables 1, 2.
Data Sources
In addition to the cited papers and abstracts, extensive background information on work in the NE Lau Basin can be found in published cruise reports, which are not specifically referenced in the text. These include the following years: 20082, 20093, 20104, 20125, and 20176. Vertical profiles of the plume tracers ΔNTU, Δ𝜃, and ΔE, along with plots of ΔNTU/Δ𝜃, at each site location where available, and the corresponding data sets, are available in the Supplementary Materials.
Results
Spreading Ridges
Plumes over the NELSC were first surveyed by German et al. (2006) and Kim et al. (2009), and those data identified sites 4, 5, 7, and 8 (Figure 2). Comprehensive CTD tows in 2008 (Baker et al., 2011) surveyed 15°–15.47°S and identified four additional high-temperature sites (1–3, 6). Sites 5 and 6 likely became high-temperature during the eruption that preceded our 2008 survey by only days; by 2009 both sites had degraded to low-temperature. Tafu (site 4) may be episodically active: a 2004 vertical cast detected no plume (German et al., 2006), a 2006 tow mapped a plume at least 3 km long apparently emanating from Tafu (Kim et al., 2009), 2008 surveys found no plume (Baker et al., 2011), and a 2017 ROV dive found 5°C fluids. Plumes above Maka (site 8) indicated high-temperature discharge in 2004 (German et al., 2006), 2006 (Kim et al., 2009), 2008 (Baker et al., 2011), and 2009. Nautilus Minerals Inc., made the first visual confirmation of high-temperature Maka fluids (∼315°C) in 2008 (Baker et al., 2011). All NELSC sites were located by ΔE anomalies or ROV observations.
Six of the nine MTJ sites are on its northern limb or near the triple junction (Figure 3). Sites 9–12 on the northern limb occur along the strike of the narrow axial cleft of a broad axial high; sites 10–12 show multiple plume maxima distributed 100–200 m vertically that imply high-temperature sites at a variety of buoyancy fluxes. Based on low rise heights and weak ΔNTU and Δ𝜃 values (Table 1), sites 14 and 17 appear to be low-temperature discharge. ΔE values were measurable at sites 9–12, and 17.
Conductivity-temperature-depth tows along the FRSC first occurred in 2009 (Crowhurst et al., 2009). Fifteen sites occupy three morphological regions: near prominent axial ridges (north of 16.67°S), near an axial ridge or off-axis discrete volcano (16.67–17.03°S), or associated with large arc-like volcanoes where an axial ridge is negligible (south of 17.03°S) (Figure 3). This morphological trend follows the spreading rate decline from 27 to 8 mm/year (Sleeper et al., 2016). Sites in the slowest-spreading portion of the ridge tend to cluster near volcanoes: four (22–25) around an axial volcano at 16.67°S, three (28–30) around an isolated volcano at 17.54°S, and one (31) on an isolated volcano at 17.78°S. We judge four of these sites as high-temperature discharge, and at each volcano we observed a plume (or seafloor venting) at a depth corresponding to the summit depth. A hydrothermally diagnostic ΔE value was observed at 11 of the 14 sites.
Non-ridge Volcanoes
All the active Mata volcanoes except E Mata create plumes with ΔNTU, Δ𝜃, and ΔE characteristic of high-temperature discharge. ROV dives subsequently confirmed high-temperature discharge at all sites except Fa and E Mata. Plume values at the north Mata volcanoes, first observed in 2010, have remained relatively stable at those volcanoes where plume mapping occurred again in 2012 and 2017. W and E Mata have a lengthier time series: 2008, 2009 (W only), 2010, 2012, and 2017. E Mata has been conspicuously stable, except for higher ΔNTU and the first detectable Δ𝜃 in 2017. Unlike other Mata volcanoes, plume values at W Mata have varied substantially over the 9 year observation period. Intense plumes in 2008 evidenced eruptive activity, which was confirmed by ROV in 2009 (Resing et al., 2011b; Baumberger et al., 2014). A sharp reduction in eruption gasses (3He, H2; Baumberger et al., 2014) in 2010 and 2012, and in plume ΔNTU, Δ𝜃, and ΔE, signaled reduced volcanic activity. Plume tracers reached their lowest values in 2017, although the plume rise height was unusually high (150 m).
Arculus (2004) first reported strong hydrothermal plumes above Motutahi, and recovered possible eruption residue such as sulfide-rich material and native S. In 2006, Kim et al. (2009) also mapped strong particle plumes from Motutahi. Our data from 2008, 2010, 2012, and 2017 (Table 2) consistently shows two primary plume levels, with peaks <1200 and >1200 m, attesting to long-lasting differences in source buoyancy fluxes. ΔNTU values have been consistently high, and in 2010 exceeded the sensor range of 5 NTU. Plumes elsewhere that consistently reach 5 ΔNTU have contained exceedingly high concentrations of particulate S (>18,000 nM) (Resing et al., 2011a). Kim et al. (2009) also identified a deeper, active volcanic edifice within Niuatahi, southeast of Motutahi, which we confirmed in 2008. Unpublished results from a recent R.V. Sonne expedition (K. Haase, Chief Scientist) indicate other minor venting areas, typical of a large caldera volcano.
In both 2008 and 2012, ΔNTU plume values at N Niua reached the sensor maximum of 5 V (Table 2), again suggestive of a vigorous, S-rich hydrothermal system. The S Niua cone was also active both years, although the single vertical cast in 2012 found ΔNTU values an order of magnitude less than in 2008.
The plume within the crater of MTJ displayed high anomalies in all plume tracers, perhaps because of the constraining geometry of the ∼100-m-deep crater at its summit.
Discussion
Site Distribution and Apparent Magma Sources
The most intense plume anomalies overwhelmingly occurred over the summits or flanks of discrete volcanoes, wherever their location. Volcanoes accounted for 11 of the top 12 ΔNTU values, 9 of the top 11 Δ𝜃 values, and the top 10 ΔE values (Tables 1, 2 and Figures 5–7). These statistics describe an uncommonly active group of ridge, arc, and intra-plate discrete volcanoes in the NE Lau Basin. Of the 20 prominent volcanoes, only three (the FRSC at 17.11°S and Mata volcanoes Nima and Taha) lacked evidence of hydrothermal activity. High-temperature discharge, confirmed by ROV observation (9 sites) or plume characteristics (5 sites), occurred on all active volcanoes except for E Mata, Tahu, and the southernmost FRSC cone. Even more remarkable, plume data indicated an erupting W Mata in 2008, 2009 (when confirmed by ROV), and 2010, and uncommonly intense venting (ΔNTU > 5) at Motutahi in 2010 and N Niua in 2008/2012. And surprisingly, MTJ is adjacent to an apparently low-magmatic-budget spreading ridge but >100 km distant from any other intra-plate or arc volcano.
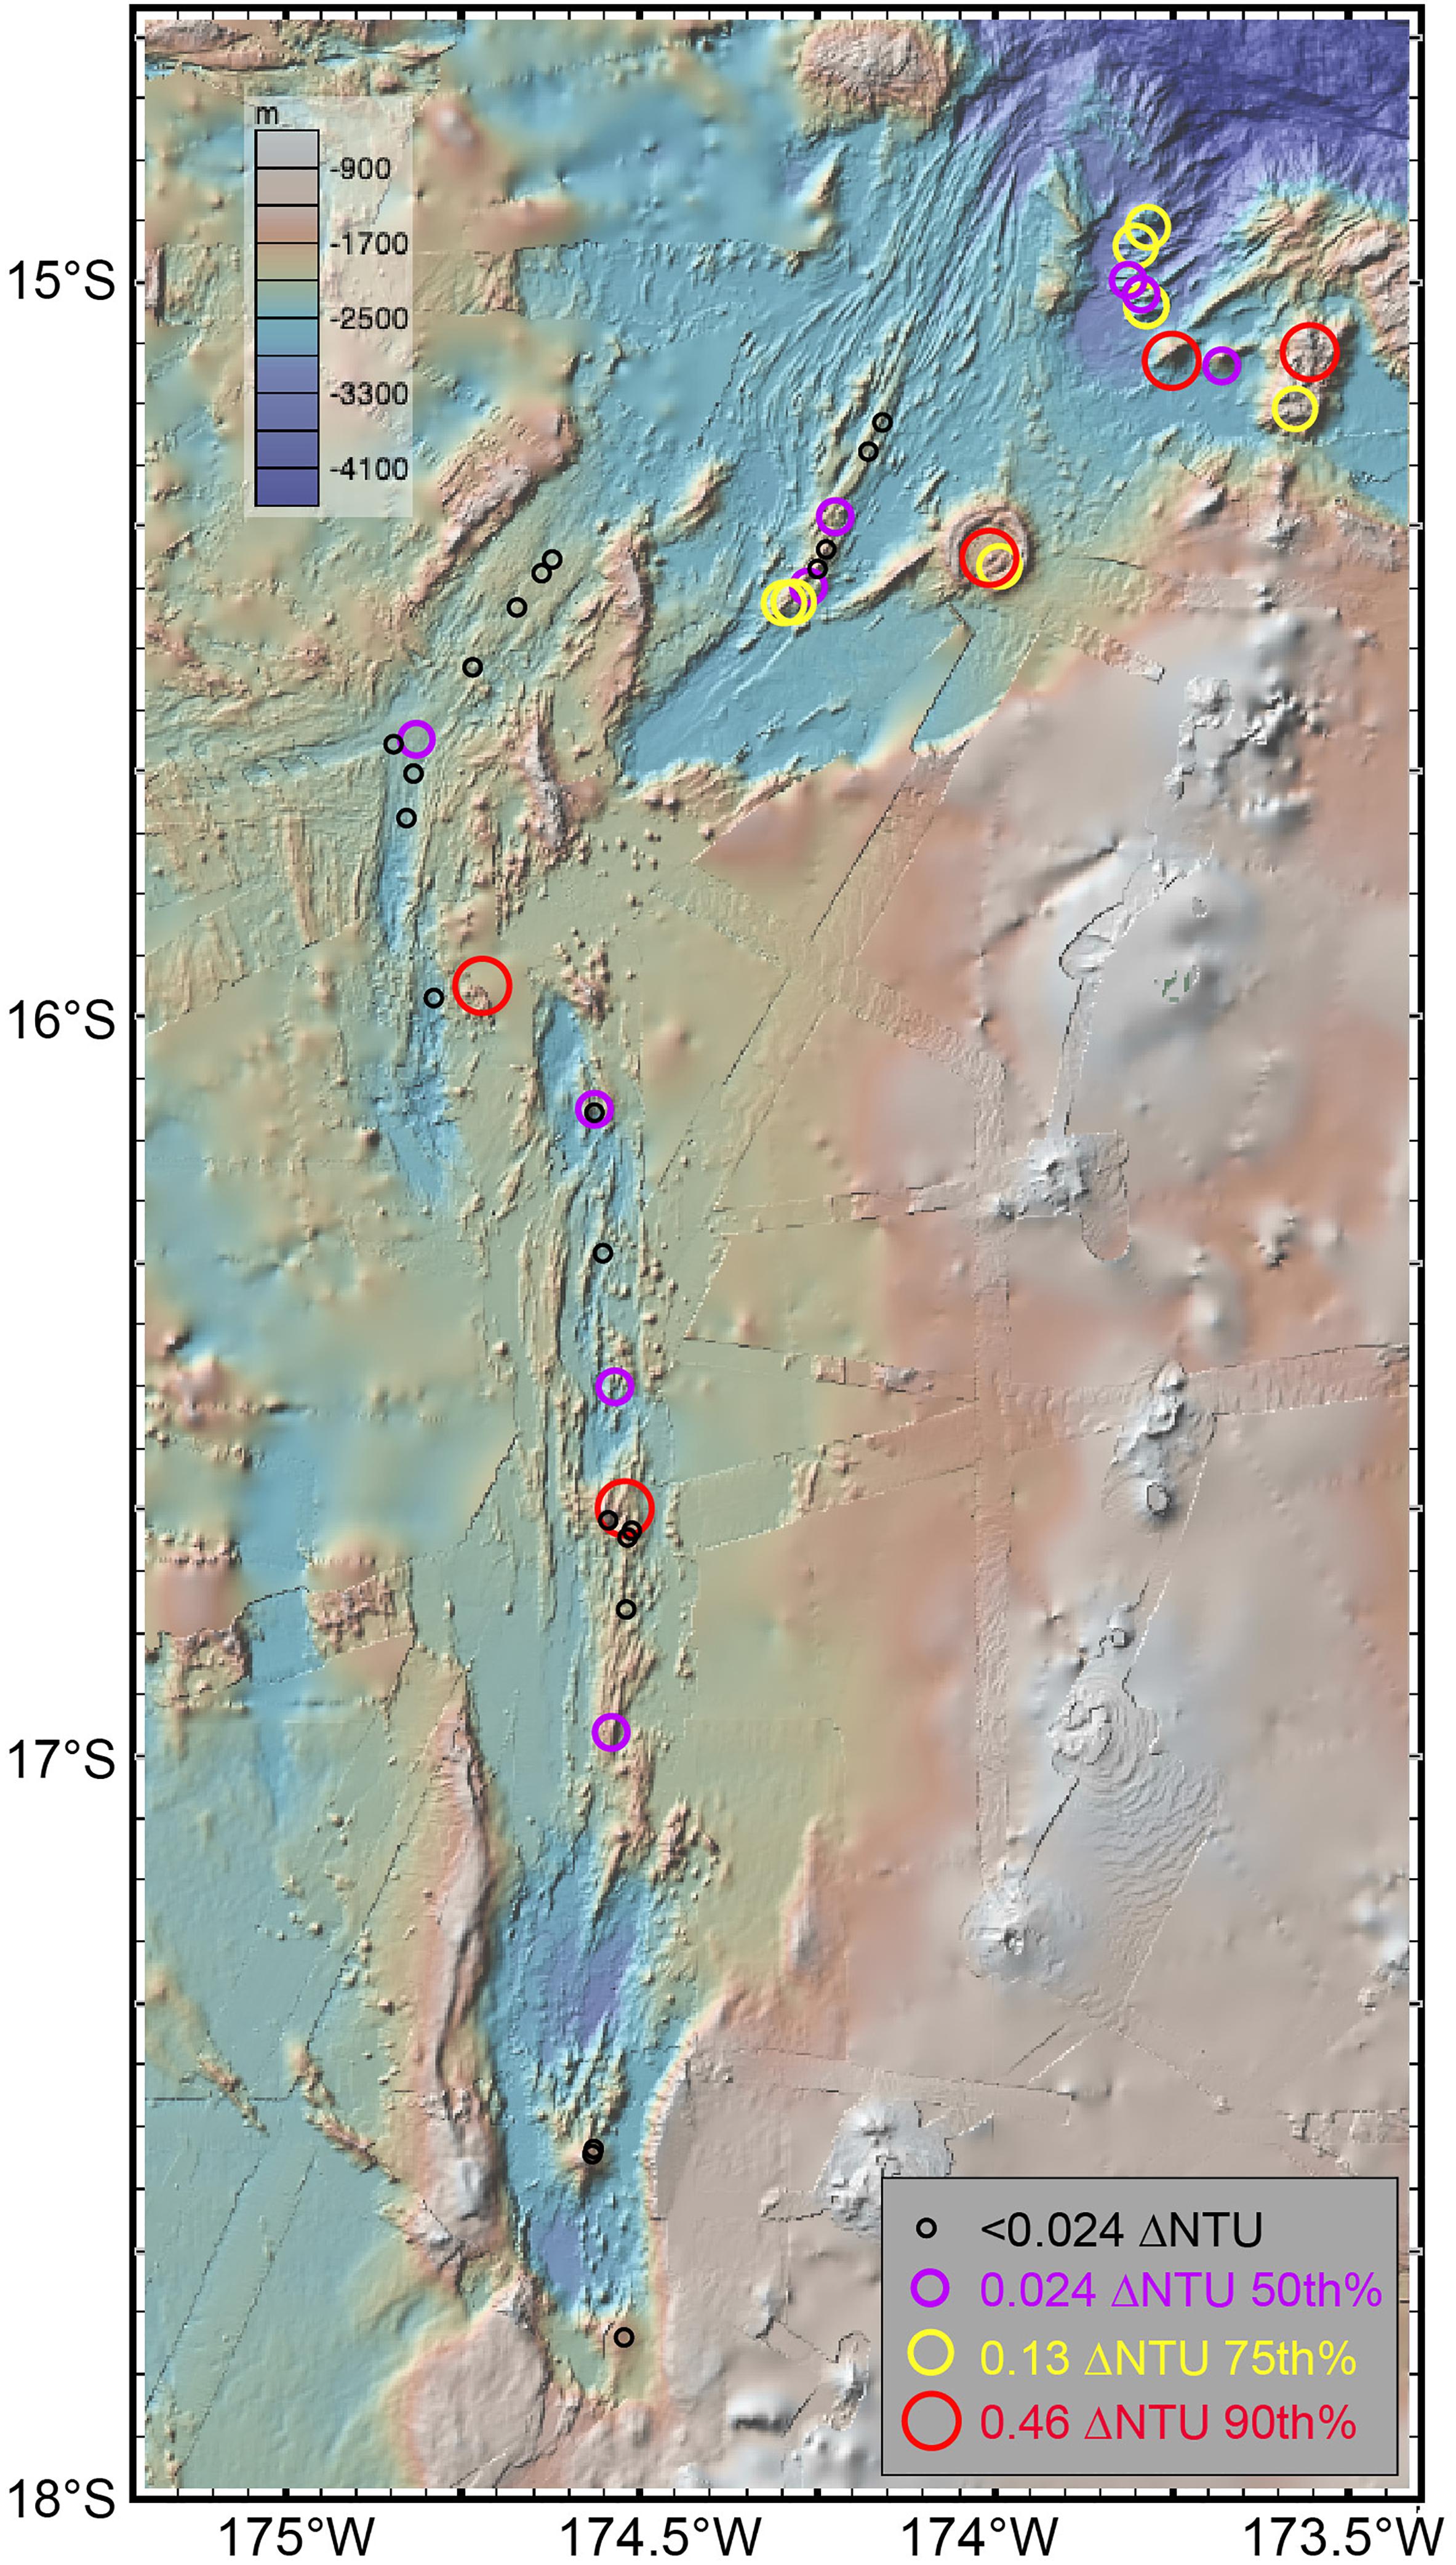
Figure 5. Distribution of maximum ΔNTU at each site: ≥90th percentile (red), ≥70th–90th percentile (yellow), ≥50th–70th percentile (lavender), <50th percentile (black). Values given in Tables 1, 2. Figure made with GeoMapApp (www.geomapapp.org).
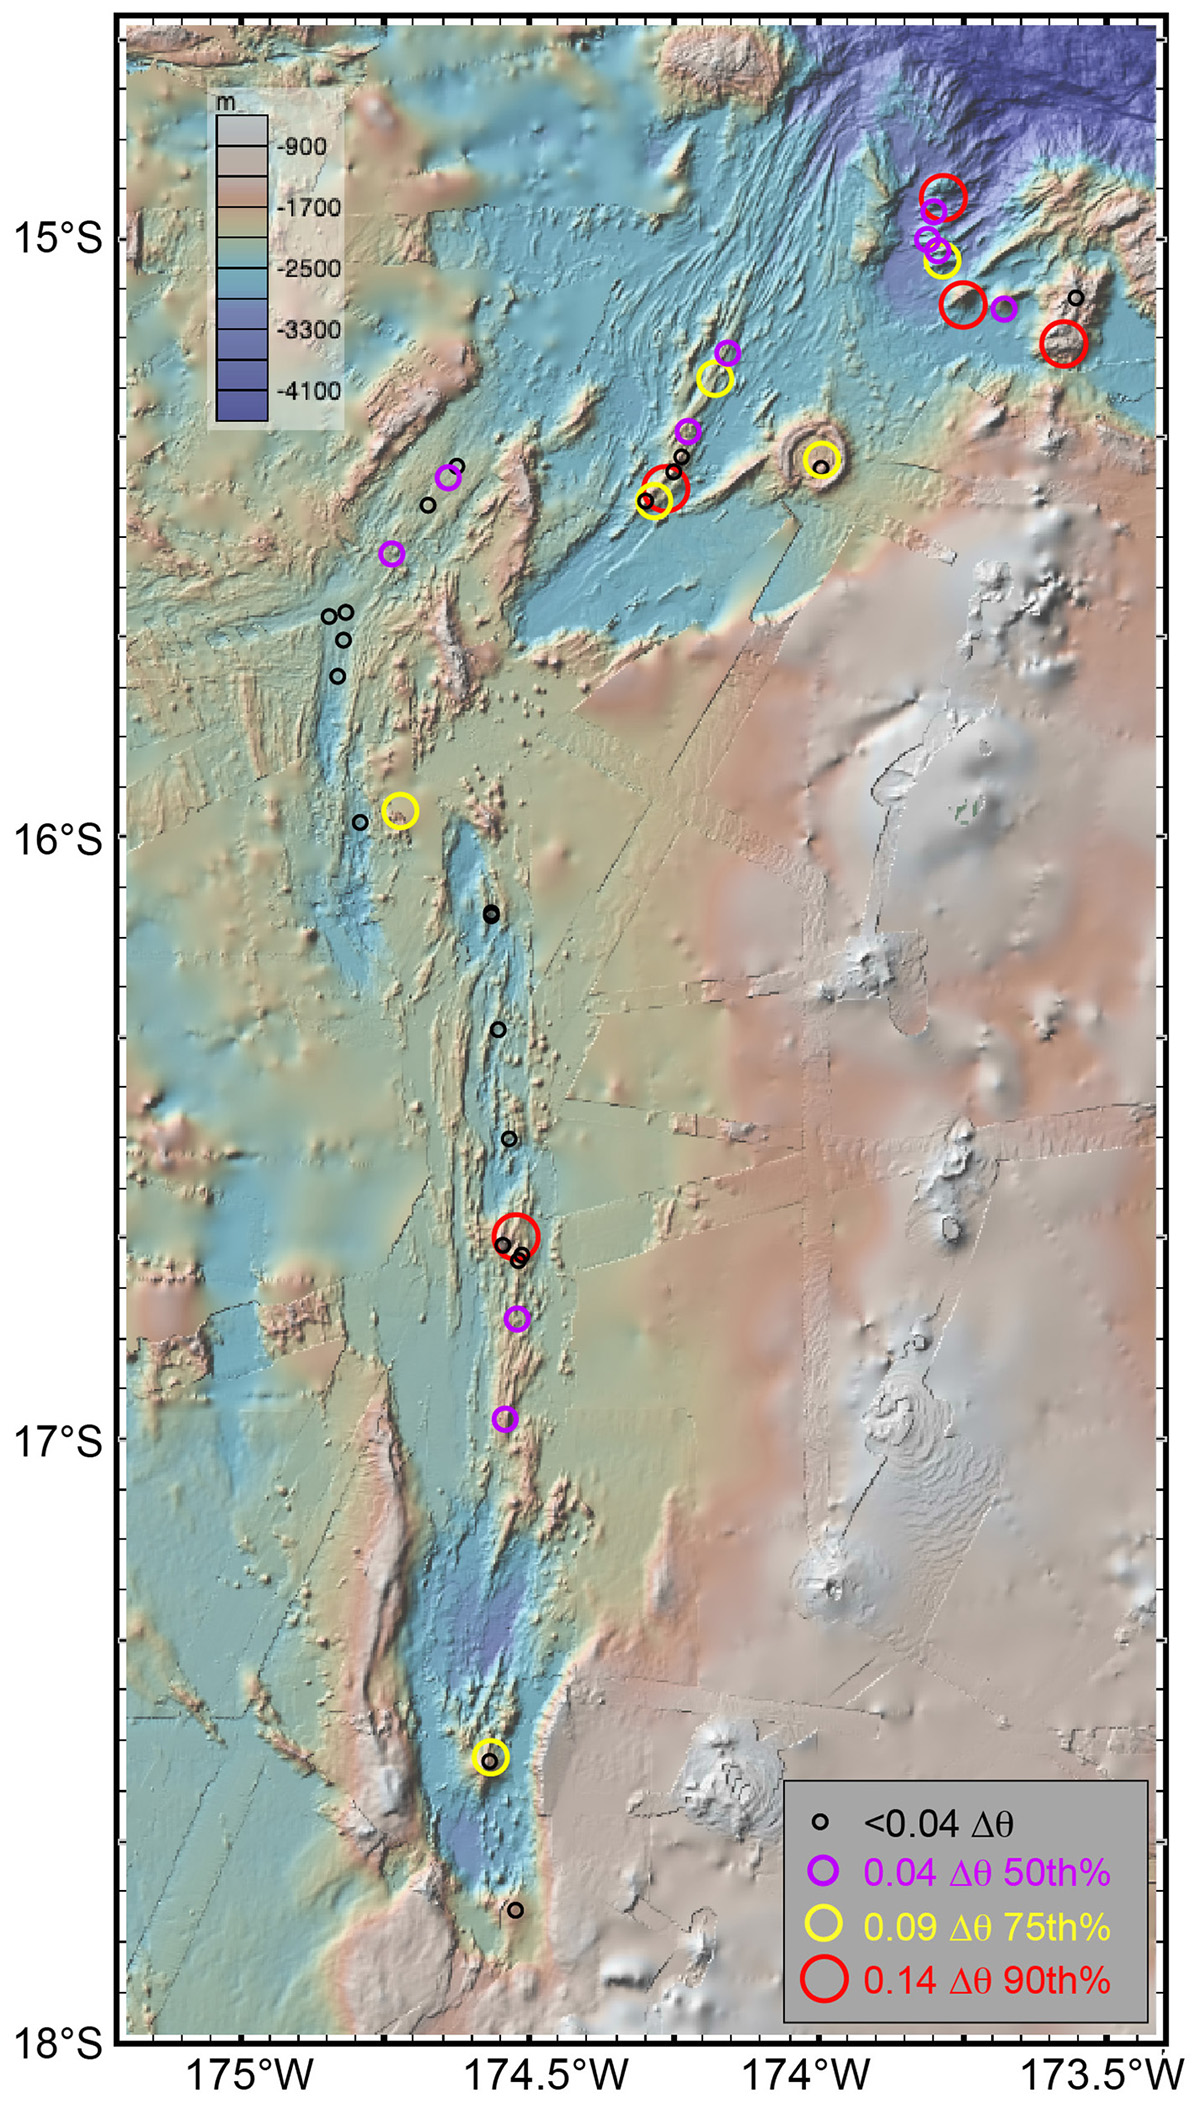
Figure 6. Distribution of maximum Δ𝜃 (°C) at each site: ≥90th percentile (red), ≥70th–90th percentile (yellow), ≥50th–70th percentile (lavender), <50th percentile (black). Values given in Tables 1, 2. Figure made with GeoMapApp (www.geomapapp.org).
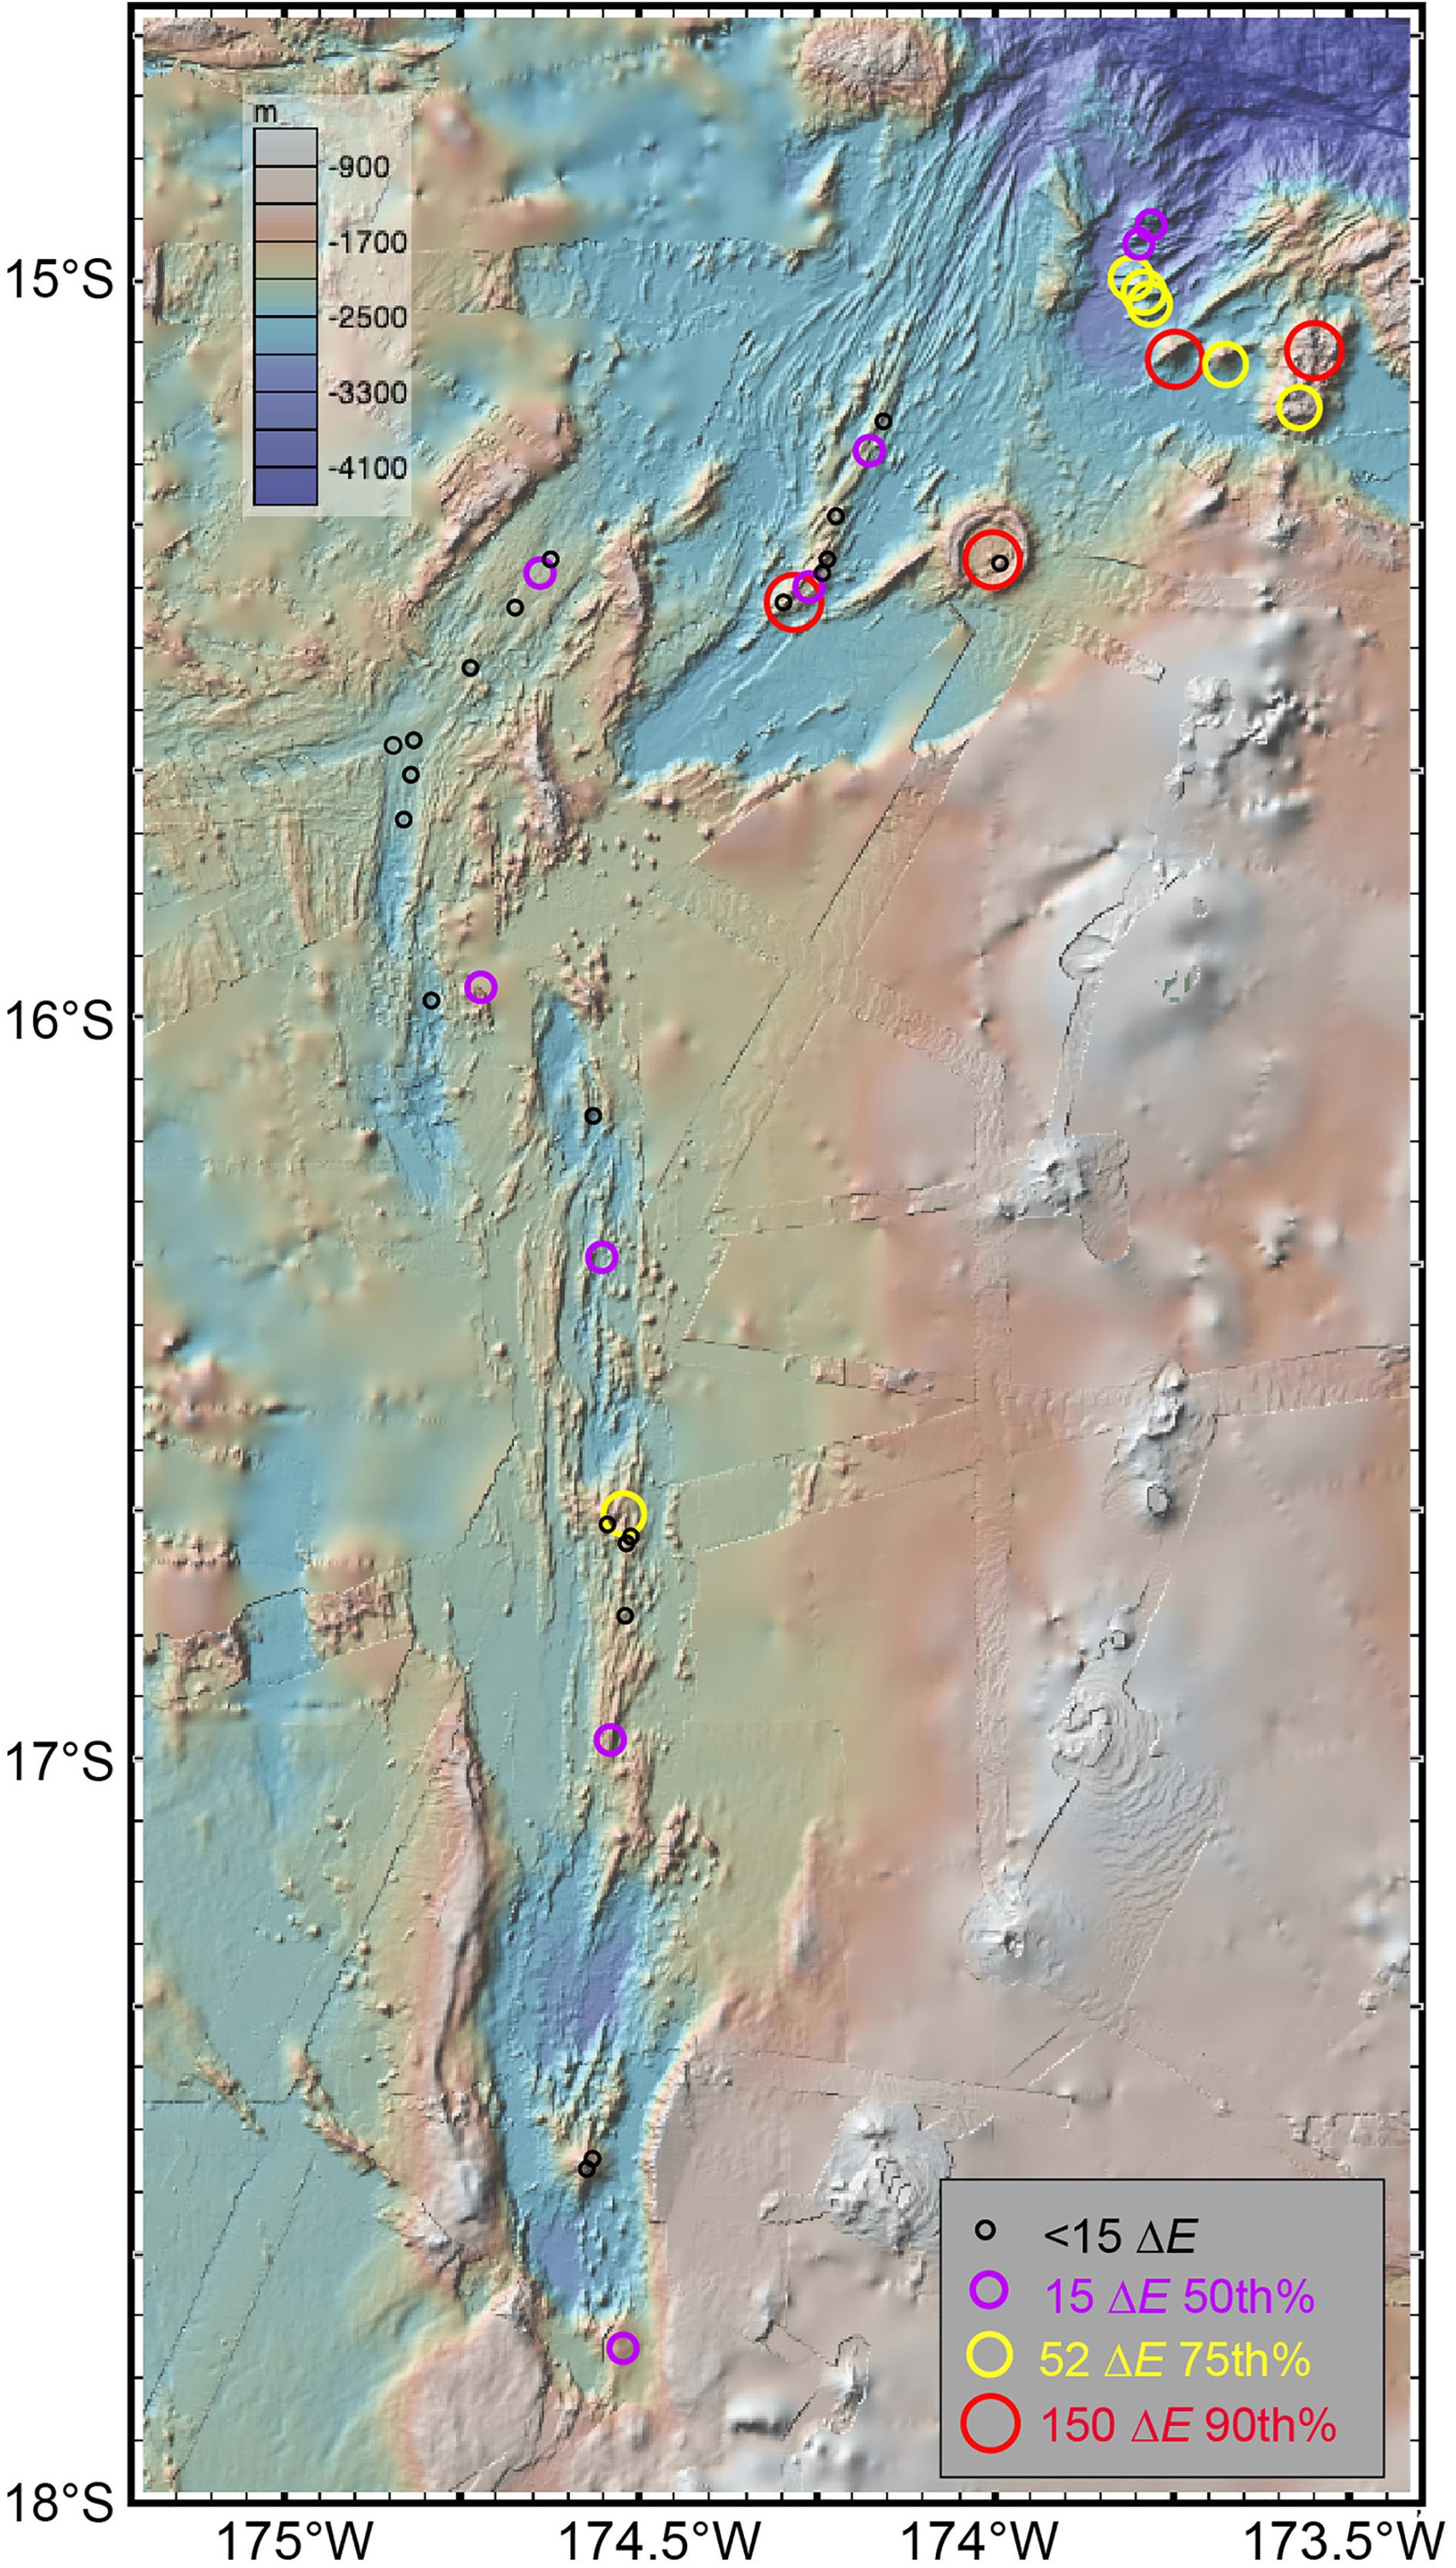
Figure 7. Distribution of maximum ΔE (mV)at each site: ≥90th percentile (red), ≥70th–90th percentile (yellow), ≥50th–70th percentile (lavender), <50th percentile (black). Values given in Tables 1, 2. Figure made with GeoMapApp (www.geomapapp.org).
Although the Mariana, Kermadec, and Izu–Bonin subduction zones feature cross-arc chains of intra-plate volcanoes (Wright et al., 1996; Stern et al., 2003, 2006, 2013), those of the NE Lau Basin may be unique (Rubin and Embley, 2012). They follow no linear trace, present a diversity ranging from small cones to a sizeable caldera, and display near unanimous hydrothermal activity. Possible magma sources supporting this high overall activity include magma captured from the Tofua arc due to increased melting driven by slab-derived hydration of mantle wedge (Martinez and Taylor, 2002; Lupton et al., 2015), and magma leakage through deep crustal tears of the subducting Pacific plate (Govers and Wortel, 2005; Falloon et al., 2007).
Compared to the discrete volcanoes, plume anomalies are more varied on NE Lau ridges, where the site distribution appears influenced by both ridge and arc magma sources. Globally, lengthy sections of ridge crest spreading at 20–40 mm/year occur almost exclusively along the Mid-Atlantic and Central Indian Ridges, where deep axial valleys dominate. The NELSC and the FRSC (north of ∼17.17°S), however, feature prominent axial ridges, similar to other slow-spreading back-arc ridges close (<∼70 km) to an active arc. Examples include the southern Mariana and VFR, where the capture of arc magma facilitates the creation of axial ridges (Martinez et al., 2006; Stern et al., 2013; Brounce et al., 2016).
Even though the NELSC lies within ∼70 km of the Tofua arc (Figure 1), C/3He-3He/4He data indicate that both the ridge and Maka volcano (site 8) are mid-ocean ridge basalt (Lupton et al., 2015). However, trace element data from NELSC basalts also suggest the presence of an enriched mantle source similar to basalts from the Samoan hotspot (Rubin et al., 2009; Lupton et al., 2015), testifying to a multiplicity of magma sources in the rapidly evolving NE Lau Basin.
Axial ridges are also present on the FRSC between 16° and 17.17°S, increasing in sharpness and relief progressing south, indicative of an increasing contribution of slab-derived melts as the axis nears the arc (Sleeper et al., 2016). The effect of magma supply is expressed differently in the southern half of the FRSC, where ultra-slow spreading focuses magma to point sources (Sleeper et al., 2016) and creates hydrothermally active discrete volcanoes. FRSC isotope data [C/3He and 3He/4He (Lupton et al., 2015)] from five rock samples and one vent fluid fall between ridge and arc characteristics, suggesting at least a minor arc influence as interpreted by Sleeper et al. (2016). This influence is also implied by the observation that the FRSC volcanoes lie on the slab flow lines corresponding to prominent Tofua arc volcanoes (Figure 3).
The MTJ is a stark contrast to the NELSC and FRSC. Pronounced axial ridges are absent, suggesting a present-day magma budget lower than the NELSC or FRSC, perhaps a consequence of a location more distant (∼100 km) from the supply of Tofua arc magma (Baker et al., 2017). The southern and western arms feature deep, flat valleys and no plume anomalies above the 50th percentile. The most robust plumes were found along the cleft of the broad, low-relief axial high of the northern arm. The origin of Volcano MTJ is thus enigmatic.
Site Distribution and Ridge Spreading Rates
The boundaries of the Tonga plate have been explored extensively for hydrothermal activity over the last 20 years. At present counting, the VFR/ELSC ridge segments (19°–24°S) host 95 active sites (Baker et al., 2016) and the Kermadec/Tofua arc (21.1°–36.45°S) adds 33 active volcanic centers containing 44 active sites, totaling ∼20% of the 650 globally known submarine vent sites [http://vents-data.interridge.org/, updated from Beaulieu et al. (2015)]. Our data add 31 ridge and 12 arc/intra-plate volcano sites, 17 of which are not currently in the InterRidge database.
The number of known active sites on any spreading ridge depends not only on the local magmatic budget (proxies include spreading rate on long time scales (∼100 Kyr) and bathymetric characteristics (e.g., axial ridges) on shorter time scales) but also on the effectiveness of exploration techniques. Roughly 80% of global sites have been discovered using water-column profiles, generally spaced at intervals of ∼10 km or wider along axis (Baker, 2017). This approach is cost-effective but inadequate. Most of the remaining sites have been discovered by two-dimensional surveys using towed instruments, primarily employing real-time turbidity and temperature sensors. This approach is far more effective, but can easily overlook low-temperature sites emitting plumes deficient in turbidity and temperature but rich in reduced chemicals (e.g., “Lost City” on the Mid-Atlantic Ridge; Larson et al., 2015). Only a few ridge sections have benefited from towed surveys that include an ORP sensor sensitive to low-temperature emissions. These sections uniformly show higher Fs values than other ridge sections with comparable spreading rates but conventional exploration efforts, including those previously surveyed (Baker et al., 2016; Baker, 2017).
Our detailed exploration methods support two conclusions from Sleeper and Martinez (2016) and Sleeper et al. (2016): spreading rates on the Niuafo’ou/Tonga border are much lower than proposed by Zellmer and Taylor (2001), and magma delivery becomes sharply focused into large axial volcanoes at FRSC spreading rates <14 mm/year. Fs values along ridge segments in the NE Lau Basin steadily increase as the spreading rate increases northward from 8 to 42 mm/year, but remain lower than on the faster-spreading VFR/ELSC (Figure 8). The relatively low Fs on the NE Lau Basin ridges is consistent with lower spreading rates calculated by Sleeper and Martinez (2016). And on the slowest-spreading section of the FRSC (south of 17°S), the presumed sites of volcano construction by focusing of arc magma are the only sites where we found hydrothermal activity.
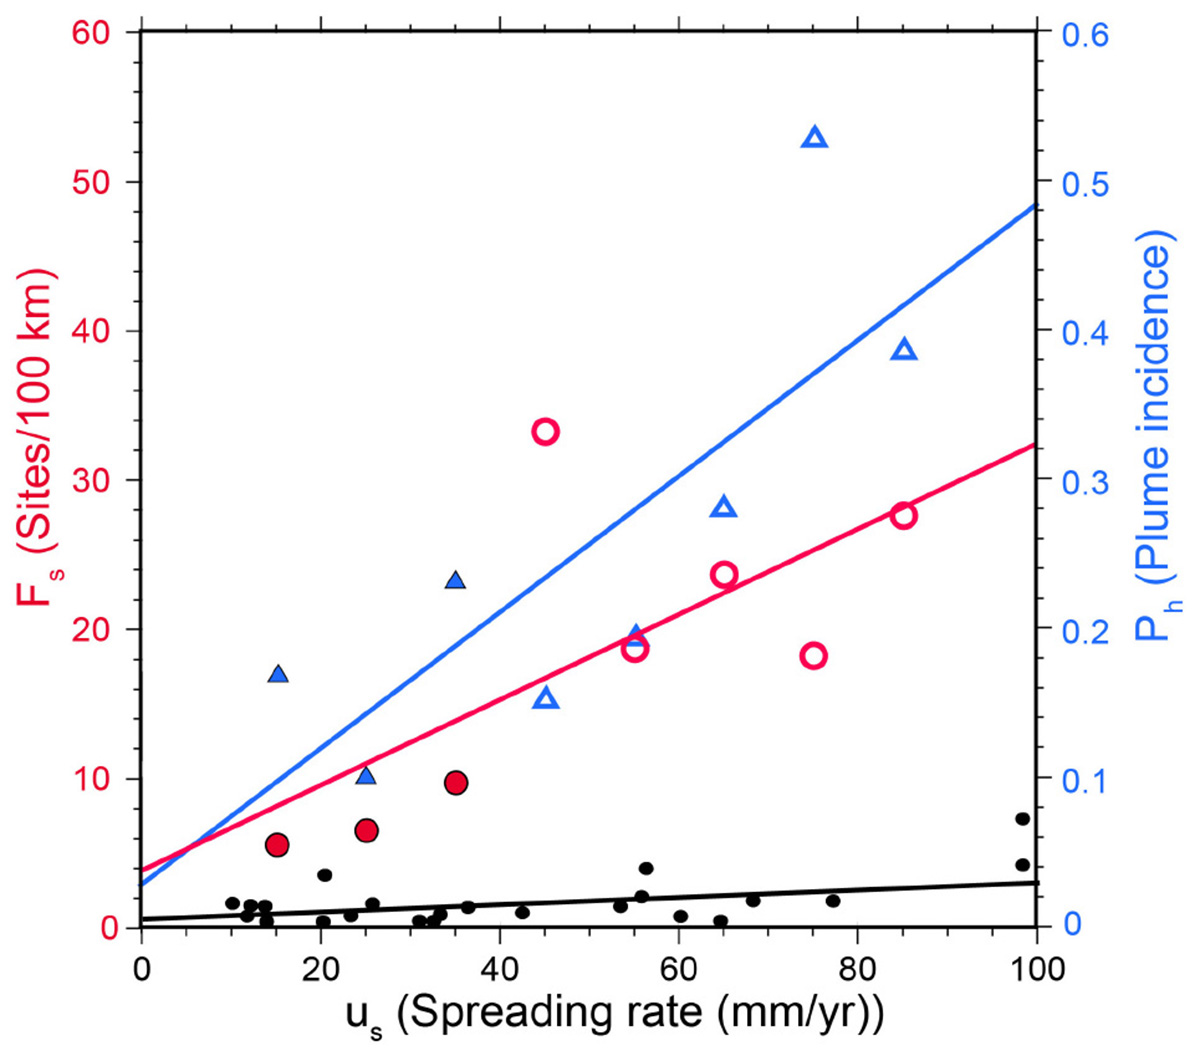
Figure 8. Spreading rate (us) versus relative hydrothermal activity (Fs, red circles; ph, blue triangles) in the Lau Basin (in 10 mm/year us bins), and for a selection of 26 mid-ocean ridge sections (black circles) (mean us for each section). Back-arc ridges in the NE Lau Basin (this paper) shown as solid red and blue symbols, VFR/ELSC ridge (Martinez et al., 2006) shown as open red and blue symbols. Ridge data (Beaulieu et al., 2015) are Fs only. Corresponding regression equations (solid lines) are: Lau Fs: Fs = 3.7 + 0.29us, r = 0.69; Lau ph: ph = 2.7 + 0.46us, r = 0.80; Mid-ocean ridge Fs: Fs = 0.61 + 0.025us, r = 0.77.
Notably, the Fs trend along NE Lau Basin ridges follows that calculated from the VFR/ELSC ridge (Baker et al., 2017), where spreading rates (us) range from 40 to 90 mm/year. The Fs/us least-squares regression slope for the entire suite of hydrothermally surveyed Lau ridges (0.29) is ∼10× greater than for a global suite of 26 mid-ocean ridge sections (0.025) from Beaulieu et al. (2015) (Figure 8). Much of this difference is a function of improved exploration, as described above, but the entire Lau region appears hydrothermally enhanced even compared to other well-explored ridge sections with similar spreading rates (Baker, 2017). Fs values in the 40–60 mm/year range are more than twice that measured along the Galapagos Ridge using the same exploration techniques. And in the 80–90 mm/year range, Lau Fs values are comparable to those observed on well-explored fast- to superfast-spreading ridges (100–140 mm/year).
Note that the Fs value for Lau Basin trend at us = 40–50 mm/year (the southern VFR) is almost double the predicted value (Figure 8). We suggest that this anomalous point, which is closer (<50 km) to the Tofua arc than any in the Lau Basin (except for the ultra-slow southern segments of the FRSC, where arc magma supply is differently expressed), is a consequence of heightened magma capture from the arc (Martinez and Taylor, 2002). A similar effect is also apparent on nearest-arc sections of the Mariana and Manus backarcs (Baker et al., 2017).
Interestingly, this anomaly does not appear when using the simpler hydrothermal index of plume incidence (ph), the fraction of ridge crest overlain by a ΔNTU plume (Baker and Hammond, 1992). This difference arises because ph is based on ΔNTU alone, and 43% of active sites in the 40–50 mm/year VFR section are ΔE only, with no ΔNTU signature (Baker et al., 2016).
Trends of spreading rate versus hydrothermal activity along Lau Basin ridges are similar whether using Fs or ph. A strong linear relationship results from either index, although here Fs gives a lower correlation (r = 0.69 versus r = 0.80) because the 40–50 mm/year VFR section is not anomalous in the ph data. This consistency between Fs and ph trends, based on ∼850 km of well-explored and spreading-rate-variable ridge crests in the Lau Basin, validates 25 years of using ph as an approximate predictor of apparent magma budget.
Conclusion
The NE Lau Basin, bounded by a series of back-arc spreading ridges and the Tofua arc, is a product of the fastest subducting plate boundary on Earth. A compilation of water-column data from 10 cruises over 16 years describes an area of extraordinary hydrothermal activity. Optical, thermal, and chemical sensors identified discharge plumes from 43 active sites, distributed among back-arc ridges (31), the Tofua arc (2), and intra-plate volcanic edifices (10). At least 32 of the sites appear to be high-temperature (emitting precipitated mineral particles), two of which were sampled during seafloor eruptions. When combined with existing data from ridges farther south (VFR and ELSC), the spatial density of active sites (sites/100 km of ridge crest) along all Lau Basin back-arc spreading ridges was a robust (r = 0.69) linear function of ridge spreading rate, extending across a spreading rate range of 8–90 mm/year. The Lau Basin site density versus spreading rate trend is an order of magnitude higher than currently recognized for mid-ocean ridges generally. This enhancement is likely the result, primarily, of meticulous exploration along Lau Basin ridges, and, secondarily, of a regional magmatic budget augmented by superfast Kermadec-Tonga subduction rates.
Data Availability
All datasets generated for this study are included in the manuscript and/or the Supplementary Files.
Author Contributions
SW processed and controlled the quality of the data. EB provided the original text, figures, and tables, with contributions and insights from SW, GM, and JR. All authors collected the data at sea.
Funding
This work was supported by the NOAA/PMEL Earth-Ocean Interactions Program, the Joint Institute for the Study of the Atmosphere and Ocean (JISAO) under the NOAA Cooperative Agreements NA11OAR4320091 and NA10OAR4320148, the NOAA Office of Exploration and Research, the National Science Foundation (OCE0930025, OCE0934660, and OCE15-38121), the Schmidt Ocean Institute (FK171110), and the Nautilus Minerals Inc. NOAA/PMEL covered salary and publication costs for SW. NOAA/PMEL and JISAO covered salary and publication costs for EB and JR. There are no specific grant numbers associated with the NOAA funds. The NOAA Office of Exploration and Research, the National Science Foundation, and the Schmidt Ocean Institute funded at-sea costs for various cruises that collected data used in this manuscript.
Conflict of Interest Statement
GM was funded by Nautilus Minerals Inc., for the at-sea collection of data and has no present connection with the company.
The remaining authors declare that the research was conducted in the absence of any commercial or financial relationships that could be construed as a potential conflict of interest.
Acknowledgments
We thank the numerous colleagues who worked with us on the many cruises dedicated to exploring the NE Lau Basin, especially to other Chief Scientists R. Embley, W. Chadwick, J. Lupton, and K. Rubin. We thank Nautilus Minerals Inc., for access to proprietary data. The reviewers CW and JS provided insightful and useful comments. PMEL contribution number 4913.
Supplementary Material
The Supplementary Material for this article can be found online at: https://www.frontiersin.org/articles/10.3389/fmars.2019.00382/full#supplementary-material
Footnotes
- ^ http://vents-data.interridge.org/
- ^ https://www.pmel.noaa.gov/eoi/laubasin/documents/tn227-nelau-report-final.pdf
- ^ https://www.pmel.noaa.gov/eoi/laubasin/documents/tn234-NELRC-CruiseReport-final.pdf and http://mnf.csiro.au/~{}/media/Files/Voyage-plans-and-summaries/Southern-Surveyor/Voyage%20plans-summaries/2009/VOYAGE%20SUMMARY%20SS02-09.ashx
- ^ https://www.pmel.noaa.gov/eoi/laubasin/documents/2010-LauBasin-KM1008-cruise-report.pdf
- ^ https://www.pmel.noaa.gov/eoi/laubasin/documents/SRoF12-cruisereport-final.pdf
- ^ https://www.pmel.noaa.gov/eoi/laubasin/documents/FK171110-CruiseReport-with-logs.pdf
References
American Public Health Association [APHA] (1985). Standard Methods for the Examination of Water and Wastewater. Washington D.C: A.P.H.A.
Baker, E. T. (2017). Exploring the ocean for hydrothermal venting: new techniques, new discoveries, new insights. Ore. Geol. Rev. 86, 55–69. doi: 10.1016/j.oregeorev.2017.02.006
Baker, E. T., German, C. R., and Elderfield, H. (1995). “Hydrothermal plumes over spreading-center axes: Global distributions and geological inferences,” in Seafloor Hydrothermal Systems: Physical, Chemical, Biological, and Geological Interactions, Geophys. Monogr. Ser, Vol. 91, eds S. Humphris, R. Zierenberg, L. S. Mullineaux, and R. Thomson (Washington D.C:AGU).
Baker, E. T., and Hammond, S. R. (1992). Hydrothermal venting and the apparent magmatic budget of the Juan de Fuca Ridge. J. Geophys. Res. 97, 3443–3456. doi: 10.1029/91jb02671
Baker, E. T., Lupton, J. E., Resing, J. A., Baumberger, T., Lilley, M., Walker, S. L., et al. (2011). Unique event plumes from a 2008 eruption on the Northeast Lau Spreading Center. Geochem. Geophys. Geosyst. 12:Q0AF02. doi: 10.1029/2011GC003725
Baker, E. T., Resing, J. A., Haymon, R. M., Tunnicliffe, V., Lavelle, W., Martinez, F., et al. (2016). How many vent fields? New estimates of vent field populations on ocean ridges from precise mapping of hydrothermal discharge locations. Earth Planet. Sci. Lett. 449, 186–196. doi: 10.1016/j.epsl.2016.05.031
Baker, E. T., Walker, S. L., Resing, J. A., Chadwick, W. W., Merle, S. G., Anderson, M. O., et al. (2017). The effect of arc proximity on hydrothermal activity along spreading centers: New evidence from the Mariana back arc (12.78N–18.38N). Geochem. Geophys. Geosyst. 18, 4211–4228. doi: 10.1002/2017GC007234
Baumberger, T., Lilley, M. D., Resing, J. A., Lupton, J. E., Baker, E. T., Butterfield, D. A., et al. (2014). Understanding a submarine eruption through time series hydrothermal plume sampling of dissolved and particulate constituents: West Mata, 2008–2012. Geochem. Geophys. Geosyst. 15, 4631–4650. doi: 10.1002/2014GC005460
Beaulieu, S. E., Baker, E. T., and German, C. R. (2015). Where are the undiscovered hydrothermal vents on oceanic spreading ridges? Deep Sea Res. Part II 121, 202–212. doi: 10.1016/j.dsr2.2015.05.001
Bevis, M., Taylor, F. W., Schutz, B. E., Recy, J., Isacks, B. L., Helu, S., et al. (1995). Geodetic observations of very rapid convergence and back-arc extension at the Tonga arc. Nature 374, 249–251. doi: 10.1038/374249a0
Bird, P. (2003). An updated digital model of plate boundaries. Geochem. Geophys. Geosyst. 4:1027. doi: 10.1029/2001GC000252
Brounce, M., Kelley, K. A., Stern, R., Martinez, F., and Cottrell, E. (2016). The Fina Nagu volcanic complex: Unusual submarine arc volcanism in the rapidly deforming southern Mariana margin. Geochem. Geophys. Geosyst. 17, 4078–4091. doi: 10.1002/2016GC006457
Conder, J. A., and Wiens, D. A. (2011). Shallow seismicity and tectonics of the central and northern Lau Basin. Earth Planet. Sci. Lett. 304, 538–546. doi: 10.1016/j.epsl.2011.02.032
Crowhurst, P. V., Arculus, R. J., Massoth, G. J., Baptista, L., Stevenson, I., Angus, R., et al. (2009). “Discovery of New Hydrothermal Venting Sites in the Lau Basin, Tonga Back Arc,” in Proceedings of the American Geophysical Union, Fall Meeting 2009, Washington, DC.
Embley, R. W., Merle, S. G., Lupton, J. E., Resing, J., Baker, E. T., Lilley, M. D., et al. (2009). “Extensive and Diverse Submarine Volcanism and Hydrothermal Activity in the NE Lau Basin,” in Proceedings of the American Geophysical Union, Fall Meeting 2009, Washington, DC.
Falloon, T. J., Danyushevsky, L. V., Crawford, T. J., Maas, R., Woodhead, J. D., Eggins, S. M., et al. (2007). Multiple mantle plume components involved in the petrogenesis of subduction-related lavas from the northern termination of the Tonga Arc and northern Lau Basin: evidence from the geochemistry of arc and backarc submarine volcanics. Geochem. Geophys. Geosyst. 8:Q09003. doi: 10.1029/2007GC001619
German, C. R., Baker, E. T., Connelly, D. P., Lupton, J. E., Resing, J., Prien, R. D., et al. (2006). Hydrothermal exploration of the Fonualei Rift and Spreading Center and the Northeast Lau Spreading Center. Geochem. Geophys. Geosyst. 7:Q11022. doi: 10.1029/2006GC001324
Govers, R., and Wortel, M. J. R. (2005). Lithosphere tearing at STEP faults: response to edges of subduction zones. Earth Planet. Sci. Lett. 236, 505–523. doi: 10.1016/j.epsl.2005.03.022
Hawkins, J. W. (1995). “The Geology of the Lau Basin,” in Backarc Basins - Tectonics and Magmatism, ed. T. Brian (New York, NY: Plenum Press), 63–138. doi: 10.1007/978-1-4615-1843-3_3
Kim, J., Son, S. K., Son, J. W., Kim, K. H., Shim, W. J., Kim, C. H., et al. (2009). Venting sites along the Fonualei and Northeast Lau Spreading Centers and evidence of hydrothermal activity at an off-axis caldera in the northeastern Lau Basin. Geochem. J. 43, 1–13. doi: 10.2343/geochemj.0.0164
Larson, B. I., Lang, S. Q., Lilley, M. D., Olson, E. J., Lupton, J. E., Nakamura, K., et al. (2015). Stealth export of hydrogen and methane from a low temperature serpentinization system. Deep-Sea Res. Part II 121, 233–245. doi: 10.1016/j.dsr2.2015.05.007
Lupton, J., Rubin, K. H., Arculus, R., Lilley, M., Butterfield, D., Resing, J., et al. (2015). Helium isotope, C/3He, and Ba-Nb-Ti signatures in the northern Lau Basin: distinguishing arc, back-arc, and hotspot affinities. Geochem. Geophys. Geosyst. 16, 1133–1155. doi: 10.1002/2014GC005625
Lupton, J. E., Delaney, J. R., Johnson, H. P., and Tivey, M. K. (1985). Entrainment and vertical transport of deep-ocean water by buoyant hydrothermal plumes. Nature 316, 621–623. doi: 10.1038/316621a0
Martinez, F., and Taylor, B. (2002). Mantle wedge control on back-arc crustal accretion. Nature 416:417. doi: 10.1038/416417a
Martinez, F., Taylor, B., Baker, E. T., Resing, J. A., and Walker, S. L. (2006). Opposing trends in crustal thickness and spreading rate along the back-arc Eastern Lau Spreading Center: implications for controls on ridge morphology, faulting, and hydrothermal activity. Earth Planet. Sci. Lett. 245, 655–672. doi: 10.1016/j.epsl.2006.03.049
McDuff, R. E. (1995). “Physical dynamics of deep-sea hydrothermal plumes,” in Seafloor Hydrothermal Systems: Physical, Chemical, Biological, and Geological Interactions, Geophysical Monograph Series, Vol. 91, eds S. Humphris, et al. (Washington, DC: American Geophysical Union), 357–368. doi: 10.1029/gm091p0357
Resing, J. A., Baker, E. T., Lupton, J. E., Walker, S. L., Butterfield, D. A., Massoth, G. J., et al. (2009). Chemistry of hydrothermal plumes above submarine volcanoes of the Mariana Arc. Geochem. Geophys. Geosyst. 10:Q02009. doi: 10.1029/2008GC002141
Resing, J. A., Baker, E. T., Lupton, J. E., Lilley, M. D., Rubin, K. H., and Buck, N. J. (2011a). The Chemistry of Hydrothermal Venting at a Volcano “O”, a Large Submarine Volcano in the NE Lau Basin. Abstract V53D-2652 Presented at 2011 Fall Meeting. San Francisco, CA: AGU.
Resing, J. A., Rubin, K. H., Embley, R. W., Lupton, J. E., Baker, E. T., Dziak, R. P., et al. (2011b). Active submarine eruption of boninite in the northeastern Lau Basin. Nat. Geosci. 4:799. doi: 10.1038/ngeo1275
Rubin, K. H., and Embley, R. W. (2012). Identification and implications of a submarine monogenetic field in the NE Lau Basin. Abstract V44C-08 Presented at 2012 Fall Meeting, AGU, San Francisco, CA.
Rubin, K. H., Embley, R. W., Clague, D. A., Resing, J. A., Michael, P. J., Keller, N. S., et al. (2009). Lavas from active boninite and very recent basalt eruptions at two submarine NE Lau Basin sites. EOS. Trans. Am. Geophys. Un. Fall Meeting Suppl. Abstr. 90, V431–05.
Sleeper, J. D., and Martinez, F. (2016). Geology and kinematics of the Niuafo’ou microplate in the northern Lau Basin. J. Geophys. Res. Solid Earth 121, 4852–4875. doi: 10.1002/2016JB013051
Sleeper, J. D., Martinez, F., and Arculus, R. (2016). The Fonualei Rift and spreading center: effects of ultraslow spreading and arc proximity on axial morphology. J. Geophys. Res. Solid Earth 121, 4814–4835. doi: 10.1002/2016JB013050
Stern, R. J., Fouch, M. J., and Klemperer, S. L. (2003). “An over- view of the Izu-Bonin-Mariana subduction factory,” in Inside the Subduction Factory, Geophys. Monogr. Ser, Vol. 138, ed. J. Eiler (Washington, D. C: AGU), 175–222. doi: 10.1029/138gm10
Stern, R. J., Kohut, E., Bloomer, S. H., Leybourne, M., Fouch, M., and Vervoort, J. (2006). Subduction factory processes beneath the Guguan cross-chain, Mariana Arc: no role for sediments, are serpentinites important? Cont. Mineral. Petrol. 151, 202–221. doi: 10.1007/s00410-005-0055-2
Stern, R. J., Tamura, Y., Masuda, H., Fryer, P., Martinez, F., Ishizuka, O., et al. (2013). How the Mariana Volcanic Arc ends in the south. Island Arc. 22, 133–148. doi: 10.1111/iar.12008
Walker, S. L., Baker, E. T., Resing, J. A., Nakamura, K., and McLain, P. D. (2007). “A new tool for detecting hydrothermal plumes: An ORP Sensor for the PMEL MAPR,” in Proceedings of the American Geophysical Union, Fall Meeting 2007, (Washington, DC: AGU).
Wiens, D. A., Kelley, K. A., and Plank, T. (2006). Mantle temperature variations beneath back-arc spreading centers inferred from seismology, petrology, and bathymetry. Earth Planet. Sci. Lett. 248, 30–42. doi: 10.1016/j.epsl.2006.04.011
Wright, I. C., Parson, L. M., and Gamble, J. A. (1996). Evolution and interaction of migrating cross-arc volcanism and backarc rifting: An example from the southern Havre Trough (35 20’–37 S). J. Geophys. Res. 101, 22071–22086. doi: 10.1029/96jb01761
Keywords: hydrothermal plumes, NE Lau Basin, spreading ridge, submarine volcanoes, subduction zone
Citation: Baker ET, Walker SL, Massoth GJ and Resing JA (2019) The NE Lau Basin: Widespread and Abundant Hydrothermal Venting in the Back-Arc Region Behind a Superfast Subduction Zone. Front. Mar. Sci. 6:382. doi: 10.3389/fmars.2019.00382
Received: 21 March 2019; Accepted: 19 June 2019;
Published: 09 July 2019.
Edited by:
Diva Amon, Natural History Museum, United KingdomReviewed by:
Jeffrey Seewald, Woods Hole Oceanographic Institution, United StatesCharles Geoffrey Wheat, University of Alaska Fairbanks, United States
Copyright © 2019 Baker, Walker, Massoth and Resing. This is an open-access article distributed under the terms of the Creative Commons Attribution License (CC BY). The use, distribution or reproduction in other forums is permitted, provided the original author(s) and the copyright owner(s) are credited and that the original publication in this journal is cited, in accordance with accepted academic practice. No use, distribution or reproduction is permitted which does not comply with these terms.
*Correspondence: Edward T. Baker, RWR3YXJkLmJha2VyQG5vYWEuZ292