 Matthew D. Palmer1*
 Paul J. Durack2
 Maria Paz Chidichimo3
 John A. Church4
 Sophie Cravatte5
 Katy Hill6
 Johnny A. Johannessen7
 Johannes Karstensen8
 Tong Lee9
 David Legler10
 Matt Mazloff11
 Eitarou Oka12
 Sarah Purkey11
 Ben Rabe13
 Jean-Baptiste Sallée14
 Bernadette M. Sloyan15
 Sabrina Speich16
 Karina von Schuckmann17Josh Willis9
 Susan Wijffels18
- 1Met Office Hadley Centre, Exeter, United Kingdom
- 2Lawrence Livermore National Laboratory, United States Department of Energy (DOE), Livermore, CA, United States
- 3National Scientific and Technical Research Council (CONICET), Buenos Aires, Argentina
- 4Climate Change Research Centre, University of New South Wales, Sydney, NSW, Australia
- 5Institut de Recherche pour le Développement, Noumea, New Caledonia
- 6World Meteorological Organization, Geneva, Switzerland
- 7Nansen Environmental and Remote Sensing Center, Bergen, Norway
- 8GEOMAR Helmholtz Centre for Ocean Research Kiel, Kiel, Germany
- 9NASA Jet Propulsion Laboratory, California Institute of Technology, Pasadena, CA, United States
- 10Ocean Observing and Monitoring Division, Climate Program Office (NOAA), Silver Spring, MD, United States
- 11Scripps Institution of Oceanography, University of California, San Diego, San Diego, CA, United States
- 12Atmosphere and Ocean Research Institute, The University of Tokyo, Kashiwa, Japan
- 13Alfred Wegener Institute, Helmholtz Centre for Polar and Marine Research, Bremerhaven, Germany
- 14UMR 7159, Laboratoire d’Océanographie et du Climat: Expérimentations et Approches Numériques (LOCEAN), Paris, France
- 15CSIRO, Oceans and Atmosphere, Hobart, TAS, Australia
- 16Laboratoire de Météorologie Dynamique (LMD) UMR8539, École Normale Supérieure, Paris, France
- 17Mercator Ocean, Ramonville-Saint-Agne, France
- 18Woods Hole Oceanographic Institution, Woods Hole, MA, United States
Considerable advances in the global ocean observing system over the last two decades offers an opportunity to provide more quantitative information on changes in heat and freshwater storage. Variations in these storage terms can arise through internal variability and also the response of the ocean to anthropogenic climate change. Disentangling these competing influences on the regional patterns of change and elucidating their governing processes remains an outstanding scientific challenge. This challenge is compounded by instrumental and sampling uncertainties. The combined use of ocean observations and model simulations is the most viable method to assess the forced signal from noise and ascertain the primary drivers of variability and change. Moreover, this approach offers the potential for improved seasonal-to-decadal predictions and the possibility to develop powerful multi-variate constraints on climate model future projections. Regional heat storage changes dominate the steric contribution to sea level rise over most of the ocean and are vital to understanding both global and regional heat budgets. Variations in regional freshwater storage are particularly relevant to our understanding of changes in the hydrological cycle and can potentially be used to verify local ocean mass addition from terrestrial and cryospheric systems associated with contemporary sea level rise. This White Paper will examine the ability of the current ocean observing system to quantify changes in regional heat and freshwater storage. In particular we will seek to answer the question: What time and space scales are currently resolved in different regions of the global oceans? In light of some of the key scientific questions, we will discuss the requirements for measurement accuracy, sampling, and coverage as well as the synergies that can be leveraged by more comprehensively analyzing the multi-variable arrays provided by the integrated observing system.
Introduction
The global ocean plays a fundamental role in the climate system through its ability to store and redistribute large quantities of heat and freshwater. The IPCC Fifth Assessment Report of Working Group I (hereafter “IPCC AR5”) has highlighted the critical role played by the ocean in both the long-term response of the Earth system under global warming and also nearer-term prediction (IPCC, 2013). Variations in heat content (HC) and freshwater content (FWC) can give rise to predictability of societally relevant information on seasonal-to-decadal timescales, such as El Niño Southern Oscillation (ENSO) (Chen et al., 2004) and the North Atlantic Oscillation (Scaife et al., 2014). More than 90% of the planetary heating associated with anthropogenic climate change is manifested in warming of the global oceans (Rhein et al., 2013). Climate model simulations show that global ocean HC change becomes the dominant term in the planetary heat budget on a timescale of several months and provides a more reliable indication of Earth’s net radiative forcing than changes in global surface temperature (Palmer et al., 2011; Palmer and McNeall, 2014; von Schuckmann et al., 2016).
The thermal expansion associated with global ocean warming accounts for about 30–40% of the observed global sea level rise (Church et al., 2011, 2013b; WCRP Global Sea Level Budget Group, 2018) and is expected to make a substantial contribution in future projections for the 21st century (Church et al., 2013a). The spatial pattern of ocean HC change exerts a strong influence on local sea level change and remains a key uncertainty in regional projections of sea level rise (e.g., Slangen et al., 2014; Cannaby et al., 2016; Carson et al., 2016). In addition, we are beginning to understand the importance of the spatial pattern of ocean warming on the strength of climate feedbacks and climate sensitivity (Rose et al., 2014; Rose and Rayborn, 2016), which determines the amount of surface warming we will see for a given amount of greenhouse gas emissions. Understanding, and accurately monitoring the patterns of HC change from global to regional scales are therefore of central importance to the development of robust information on future climate change.
Alterations to the global water cycle, such as water availability, droughts and floods are a major concern as Earth’s climate changes. The ocean is the largest water store in Earth’s hydrosphere, accounting for 97% by storage across all water reservoirs, and 80% of Earth’s surface freshwater fluxes occur at the ocean-atmosphere interface (Durack, 2015). Accurate monitoring of ocean salinity variability and change can provide important insights into broad-scale changes to the global water cycle. Oceanic waters contain simple salts (e.g., Pawlowicz et al., 2016), and through the process of evaporation, these salts remain, ensuring that as water is cycled from ocean to atmosphere to land and back again, salinity anomalies persist and accumulate, providing a salty or fresh marker of water cycle variability and change.
Observed changes in HC and FWC are computed based upon the available in situ subsurface temperature and salinity measurements. While the earliest trans-global survey of subsurface temperature dates back to the H.M.S Challenger expedition in the late 19th century (Roemmich et al., 2012), it was not until the late 1960s that widespread upper ocean temperature measurements became available (Abraham et al., 2013). The historical ocean observations over the latter half of the 20th century have a strong bias toward the Northern Hemisphere, as these measurements are associated predominantly with research vessels and shipping activity. However, it is only since the mid-2000s with the advent of the Argo array of autonomous profiling floats that we have regular, quasi-global sampling of the upper ocean (0–2000 m) (Roemmich et al., 2012, 2019; Riser et al., 2016). Argo also delivers co-located observations of salinity, from which changes in ocean FWC can be derived. These co-located temperature and salinity observations allow us to compute the density field and its influence on regional sea level change (Willis et al., 2008), related changes in the geostrophic flow field (Gray and Riser, 2014) and mechanistic insights to the observed changes through water mass analysis (Desbruyères et al., 2017). The discussion of the global in situ ocean observing system presented here focuses on this post-Argo era.
The advent of remote sensing in 1978 with the Seasat Earth-orbiting satellite heralded a new era in global ocean investigations, with the first of these remote platforms including a radar altimeter to measure satellite height above the ocean surface, a microwave scatterometer to measure wind speed and direction, microwave radiometer to measure sea surface temperature and visible and infrared radiometers to identify clouds, land and water features. The utility of these space-borne remote platforms was proven for sea surface temperature in the early 1980s (e.g., McConaghy, 1980). In the early 1990s the integrated quantity of sea surface height (SSH) was robustly captured (e.g., Le Traon et al., 1998; Ducet et al., 2000), and the first of the sea surface salinity satellites was launched in November 2009 (ESAs Soil Moisture and Ocean Salinity satellite) with a number of other missions launching soon after (e.g., Berger et al., 2002; Lagerloef et al., 2008; Fore et al., 2016; Vinogradova et al., 2019). Satellite based observations provide an exceptional high-resolution view on the surface ocean manifestation of (sub)mesoscale dynamics in SST (Group for High Resolution SST; GHRSST), sea level anomaly (Jason & Sentinel – see https://sentinel.esa.int/web/sentinel/missions) and surface salinity fields (SMOS and SMAP). These satellite observations are highly complementary to the in situ observing array and can provide, for example, propagation of information from single profile observations (e.g., Argo) over wider spatial domains.
Satellite and in situ measurements are complementary. Satellite measurements help resolve the scales or monitor regions not adequately sampled or covered by in situ observations. Examples include variability in coastal oceans and marginal seas such as those associated with river plumes that influence regional FWC (e.g., Fournier et al., 2016). In situ measurements are generally much more accurate, thereby providing ground truth for the calibration and validation of satellite data. Synthesized satellite/in situ products (e.g., Reynolds et al., 2007; Guinehut et al., 2012; Xie et al., 2014) combine strengths of the satellite and in situ observing systems to facilitate studies of regional HC and FWC changes.
The multi-decadal three-dimensional response of the ocean temperature and salinity fields offers the potential for more powerful means to quantify the influence of different climate forcings than using surface temperature alone. In particular, the systematic horizontal and vertical re-arrangement of heat in the ocean through ocean circulation and processes such as ENSO variability (Roemmich and Gilson, 2011; England et al., 2014; Roemmich et al., 2015) poses a challenge for interpretation for both regional and global changes in surface temperature. However, this “noise” arising from internal climate variability is also an important source of decadal predictability (e.g., Smith et al., 2007; Meehl et al., 2014), which is an important element in the development of climate services for societal benefit. Advancing the science of the impacts of HC and FWC variability and change requires us to move beyond qualitative descriptions of past changes afforded by the 20th century ocean observing. This White Paper reviews the capabilities of the contemporary ocean observing array for quantifying regional HC and FWC changes and presents recommendations for the future development of the ocean observing system.
The remaining sections of the paper are organized as follows. In section “Observed Changes in Ocean Heat and Freshwater Content,” we present a discussion of the observed trends and variability of regional HC and FWC, with linkages to predictability and forecast initialization. In section “Projected Changes in Ocean Heat and Freshwater Content,” we present a synopsis of what is known about the emergent patterns of HC and FWC change from climate model simulations. We then present a number of regional case studies in subsequent sections, focused on the Atlantic Ocean, the tropical Pacific, the Arctic Ocean and the Southern Ocean. These geographic regions are selected based on their importance in the global climate system and each case study is focused on the key scientific questions and the current observing system capabilities in each of these regions respectively. In the “Discussion”, we cover some of the overarching issues, including the challenge of sustaining the long-term observations that are needed to monitor regional HC and FWC variability and change. Finally, we conclude with the recommendations in which we present a series of goals for future development of the ocean observing system.
Observed Changes in Ocean Heat and Freshwater Content
Prior to the comprehensive data coverage of Argo, much of the assessment of global ocean variability was limited to climatological annual and seasonal cycles (e.g., Levitus, 1984, 1986, 1989; Boyer and Levitus, 2002; Kara et al., 2003; de Boyer Montegut et al., 2004), or pentadal temporal epochs for the deeper ocean (e.g., Levitus, 1989). With the explosion of ocean measurements thanks to the international Argo Program, much more comprehensive investigations into modern-era ocean variability have been made possible. Most recently, with the so-called surface warming “hiatus” (e.g., Meehl et al., 2011), numerous studies have focused on the role of the ocean during the Earth surface warming slow down. Many of these studies have highlighted the importance of ocean HC redistribution, either basin to basin (e.g., Lee et al., 2015; Nieves et al., 2015) or vertically (Drijfhout et al., 2014; e.g., Chen and Tung, 2014; England et al., 2014), in explaining the reduced rate of surface warming during this period. Model simulations show that “hiatus” events can arise purely through internal climate variability (e.g., Easterling and Wehner, 2009; Meehl et al., 2011; Risbey et al., 2014; Roberts et al., 2016) but there is evidence that both anthropogenic and natural external forcings can also play an important role (e.g., Maher et al., 2014; Smith et al., 2016).
The upper ocean (0–700 m) is where the bulk of historical measurements exist, and consequently where our knowledge of long-term change is most robust (Abraham et al., 2013). On multi-decadal timescales, a consistent picture of forced ocean change has been clearly evident in ocean observations, since the first assessments of ocean warming became available (e.g., Levitus et al., 2000). Subsequently a clearer picture of change has emerged, with a near-global, upper-ocean warming evident from 1971 to 2010 at a mean rate of 107 TW (74–137 TW for the range of 5 independent estimates), and a weaker warming signal over 1870–1971 (Rhein et al., 2013), broadly consistent with our understanding of changes in Earth’s radiative forcing (e.g., Myhre et al., 2013). While measurement coverage reduces in the intermediate depths (700–2000 m) prior to Argo, pentadal (5-year) estimates have been calculated that extend back to 1957 (Levitus et al., 2012). These too show marked warming over the observed record, but at a slower rate compared to the upper-ocean. While all available analyses show a marked historical warming, the patterns and rates of these diverge due to measurement coverage limitations, and the different methods used to reconstruct global changes from sparse observations (e.g., Boyer et al., 2016; Palmer et al., 2017). This issue largely disappears for the upper and intermediate ocean during the Argo period (Roemmich et al., 2015, 2019).
Along with ocean warming, coherent salinity changes have also been observed for both the near-surface global ocean and the ocean interior (Boyer et al., 2005; Hosoda et al., 2009; Durack and Wijffels, 2010; Helm et al., 2010; Mulet et al., 2018). Surface ocean salinity patterns mirror the climatological mean pattern evaporation and precipitation fluxes at the ocean-atmosphere interface, such that high evaporation regions express high climatological salinities (the subtropical convergence zones) and high precipitation regions express low climatological salinities (tropical and sub-polar regions). The broad-scale patterns of salinity change reflect an enhancement to these mean patterns, both for the surface and subsurface ocean, and agree well with those from ocean model simulations driven by enhanced surface evaporation and precipitation patterns (e.g., Williams et al., 2007; Durack et al., 2012; Lago et al., 2016), suggesting that, as with temperature, anthropogenically forced changes are already underway (Figure 1).
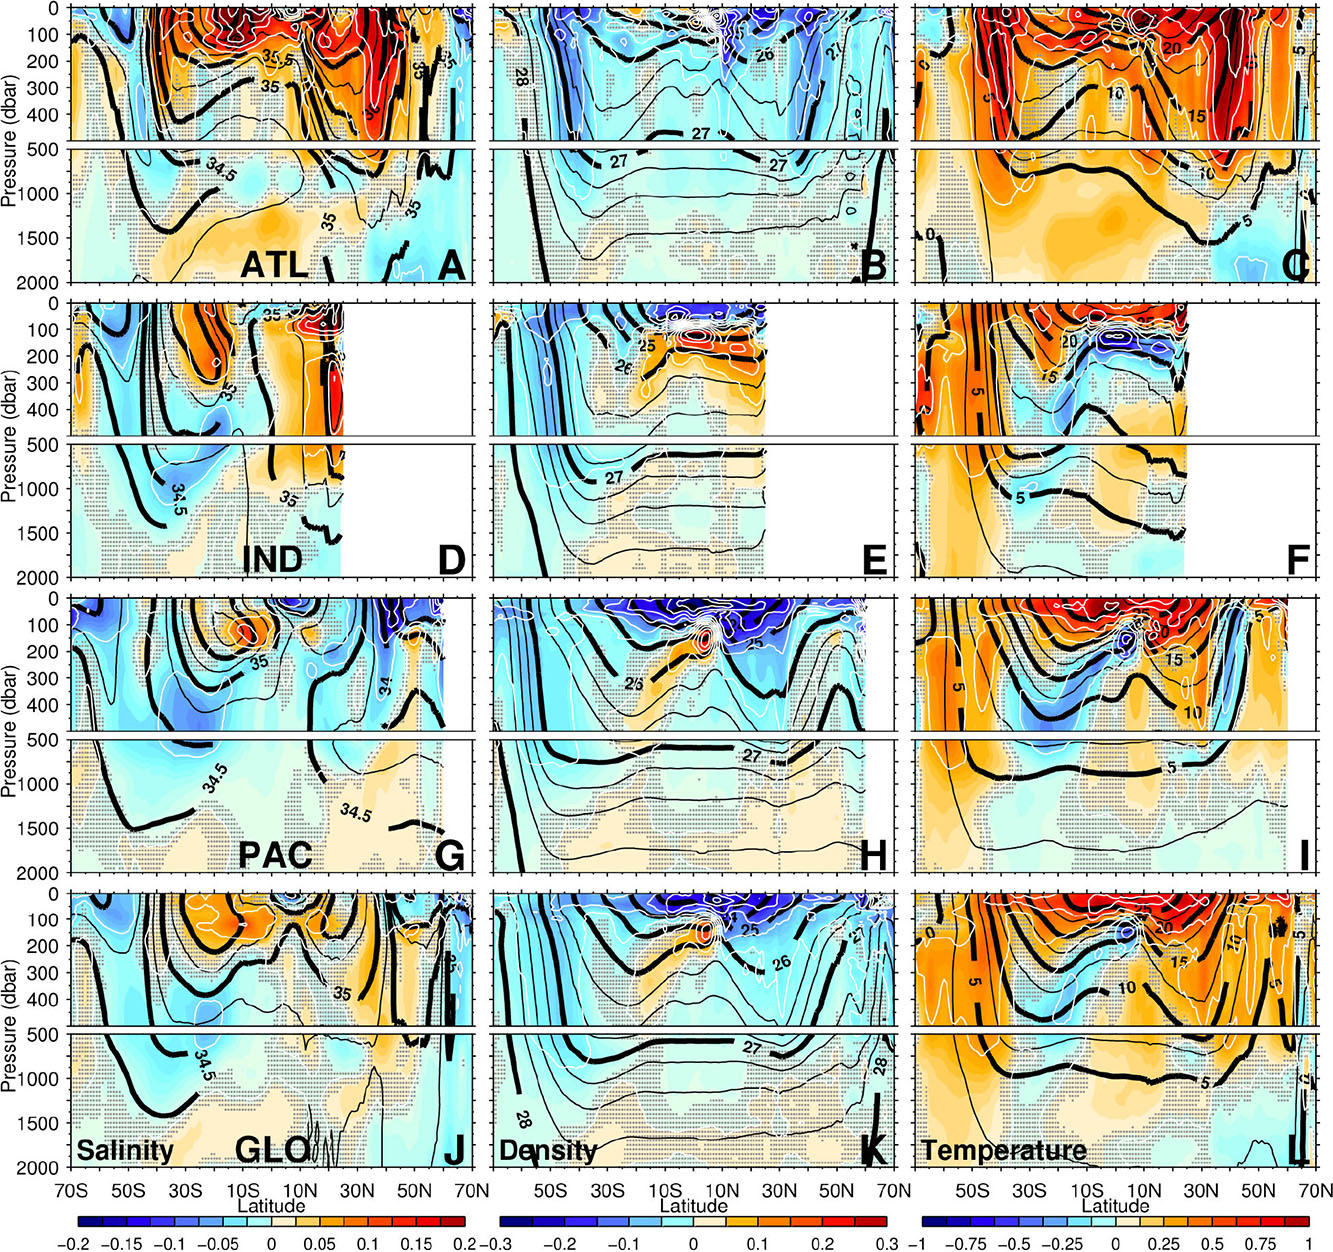
Figure 1. Upper 2000 dbar (pressure) zonally averaged linear trend (1950–2000) (colors with white contours) of salinity changes (column 1, PSS-78 per 50 year; white contours: 0.05 PSS-78, -0.5 to 0.5), neutral density changes (column 2, kg m–3 per 50 year; white contours: 0.05 kg m–3, −0.3 to 0.3), and potential temperature changes (column 3, °C per 50 year; white contours: 0.25°C, −1 to 1), for the Atlantic Ocean (ATL) in row 1 (A–C), Indian Ocean (IND) in row 2 (D–F), Pacific Ocean (PAC) in row 3 (G–I), and global ocean (GLO) in row 4 (J–L). Mean fields are shown as black lines (Salinity: thick black contours 0.5 PSS-78, thin contours 0.25 PSS-78; Neutral density: thick black contours 1.0 kg m–3, thin contours 0.25 kg m–3; Potential temperature: thick black contours 5.0°C, thin contours 2.5°C). Trends are calculated on pressure surfaces. Regions where the resolved linear trend is not significant at the 90% confidence level are stippled in gray. Reproduced from IPCC AR5 (Rhein et al., 2013, Figure 3.9).
While deep (>2000 m) ocean measurements are sparse, these are captured by dedicated research cruises using highly specialized, calibrated measurement platforms under the auspices of GO-SHIP (Sloyan et al., 2019) and represent the “gold standard” for subsurface observations. Regions of the deep ocean have also undergone statistically significant warming and freshening since the 1990s with large regional variability (Purkey and Johnson, 2010, 2013). Monitoring the deep ocean is currently limited to ship-based, full-depth hydrographic sections based on a sparse network of ship tracks that are typically repeated every few years, and from purposely designed transbasin Atlantic Meridional Overturning Circulation (AMOC) and boundary currents arrays (Frajka-Williams et al., 2019). Based on the available observations it has been estimated that the deep (below 2000 m) and abyssal (below 4000 m) oceans have accumulated heat at a rate of 22.3 ± 23.7 TW and 10.7 ± 3.4 TW, respectively; mostly owing to the deep Southern Ocean which has warmed 10 times faster than the deep basins to the north (Purkey and Johnson, 2010; Desbruyères et al., 2016, 2017). In addition, the abyssal Indian and Pacific sectors of the Southern Ocean have freshened at a rate equivalent to a freshwater flux of 73 ± 26 Gtonne/year (Purkey and Johnson, 2012). As a third decade of repeat hydrography becomes available, there has been some evidence that the warming is slowing in the South Atlantic and accelerating in the Pacific, but variability in local trends are not statistically significant owing to limited data (Sloyan et al., 2019). To fully resolve deep ocean HC and FWC changes on local to global scales, a continuously, global, full depth monitoring system is needed. Plans are underway for a 5° × 5° × 15-day cycle Deep Argo array capable of sampling to 4000–6000 m (Le Reste et al., 2016; Roemmich et al., 2019). This new array will be able to resolve local trends above 0.001°C/decade in the North Pacific and above 0.026°C/decade in the noisier Southern Ocean based on current observed local variance (Johnson et al., 2015).
Ocean and climate models represent critical tools to advance our understanding of observed changes and their causes. In addition to improvements in observations, ocean models have consistently improved in the last decade, with the latest eddy-permitting (∼1/10th degree) high-resolution simulations capable of reproducing the variability represented in modern satellite altimetry measurements of SSH, both spatially and in magnitude (Griffies et al., 2015), and even the coarser resolution CMIP-grade simulations have utility in capturing the spatial gradients in SSH variability (Landerer et al., 2014). A number of studies have attributed observed temperature (Levitus et al., 2001; Domingues et al., 2008; Palmer et al., 2009; Gleckler et al., 2012; Pierce et al., 2012; Weller et al., 2016) and salinity changes (Stott et al., 2008; Pierce et al., 2012; Terray et al., 2012) to anthropogenic forcing. In addition, ensemble approaches in ocean modeling have been used to disentangle the forced response from chaotic ocean variability (e.g., Sérazin et al., 2017). Sub-sampling of spatially complete model fields has provided insights into our ability to constrain observed climate variability and change based on the sparse historical coverage of ocean profile measurements (Gregory et al., 2004; AchutaRao et al., 2006, 2007; Good, 2017; Allison et al., 2019). Studies using both models and observations have provided provocative perspectives that question the observation-only estimates of historical changes, noting that potentially large underestimates of historical changes may have occurred due to poor Southern Hemisphere sampling (e.g., Durack et al., 2014), and that due to poor spatial coverage, particularly in the deeper ocean, the rate of deep ocean warming may have been underestimated (Gleckler et al., 2016; Allison et al., 2019). In particular, these studies have highlighted the propagation of the climate change signal into the deeper ocean over time (Figure 2; Cheng et al., 2016; Gleckler et al., 2016). Ocean reanalyses and ocean state estimates, where data assimilation schemes are used to fuse observations with numerical model simulations, are increasingly being used to gain insights into past ocean variability and change (Balmaseda et al., 2015; Palmer et al., 2017).
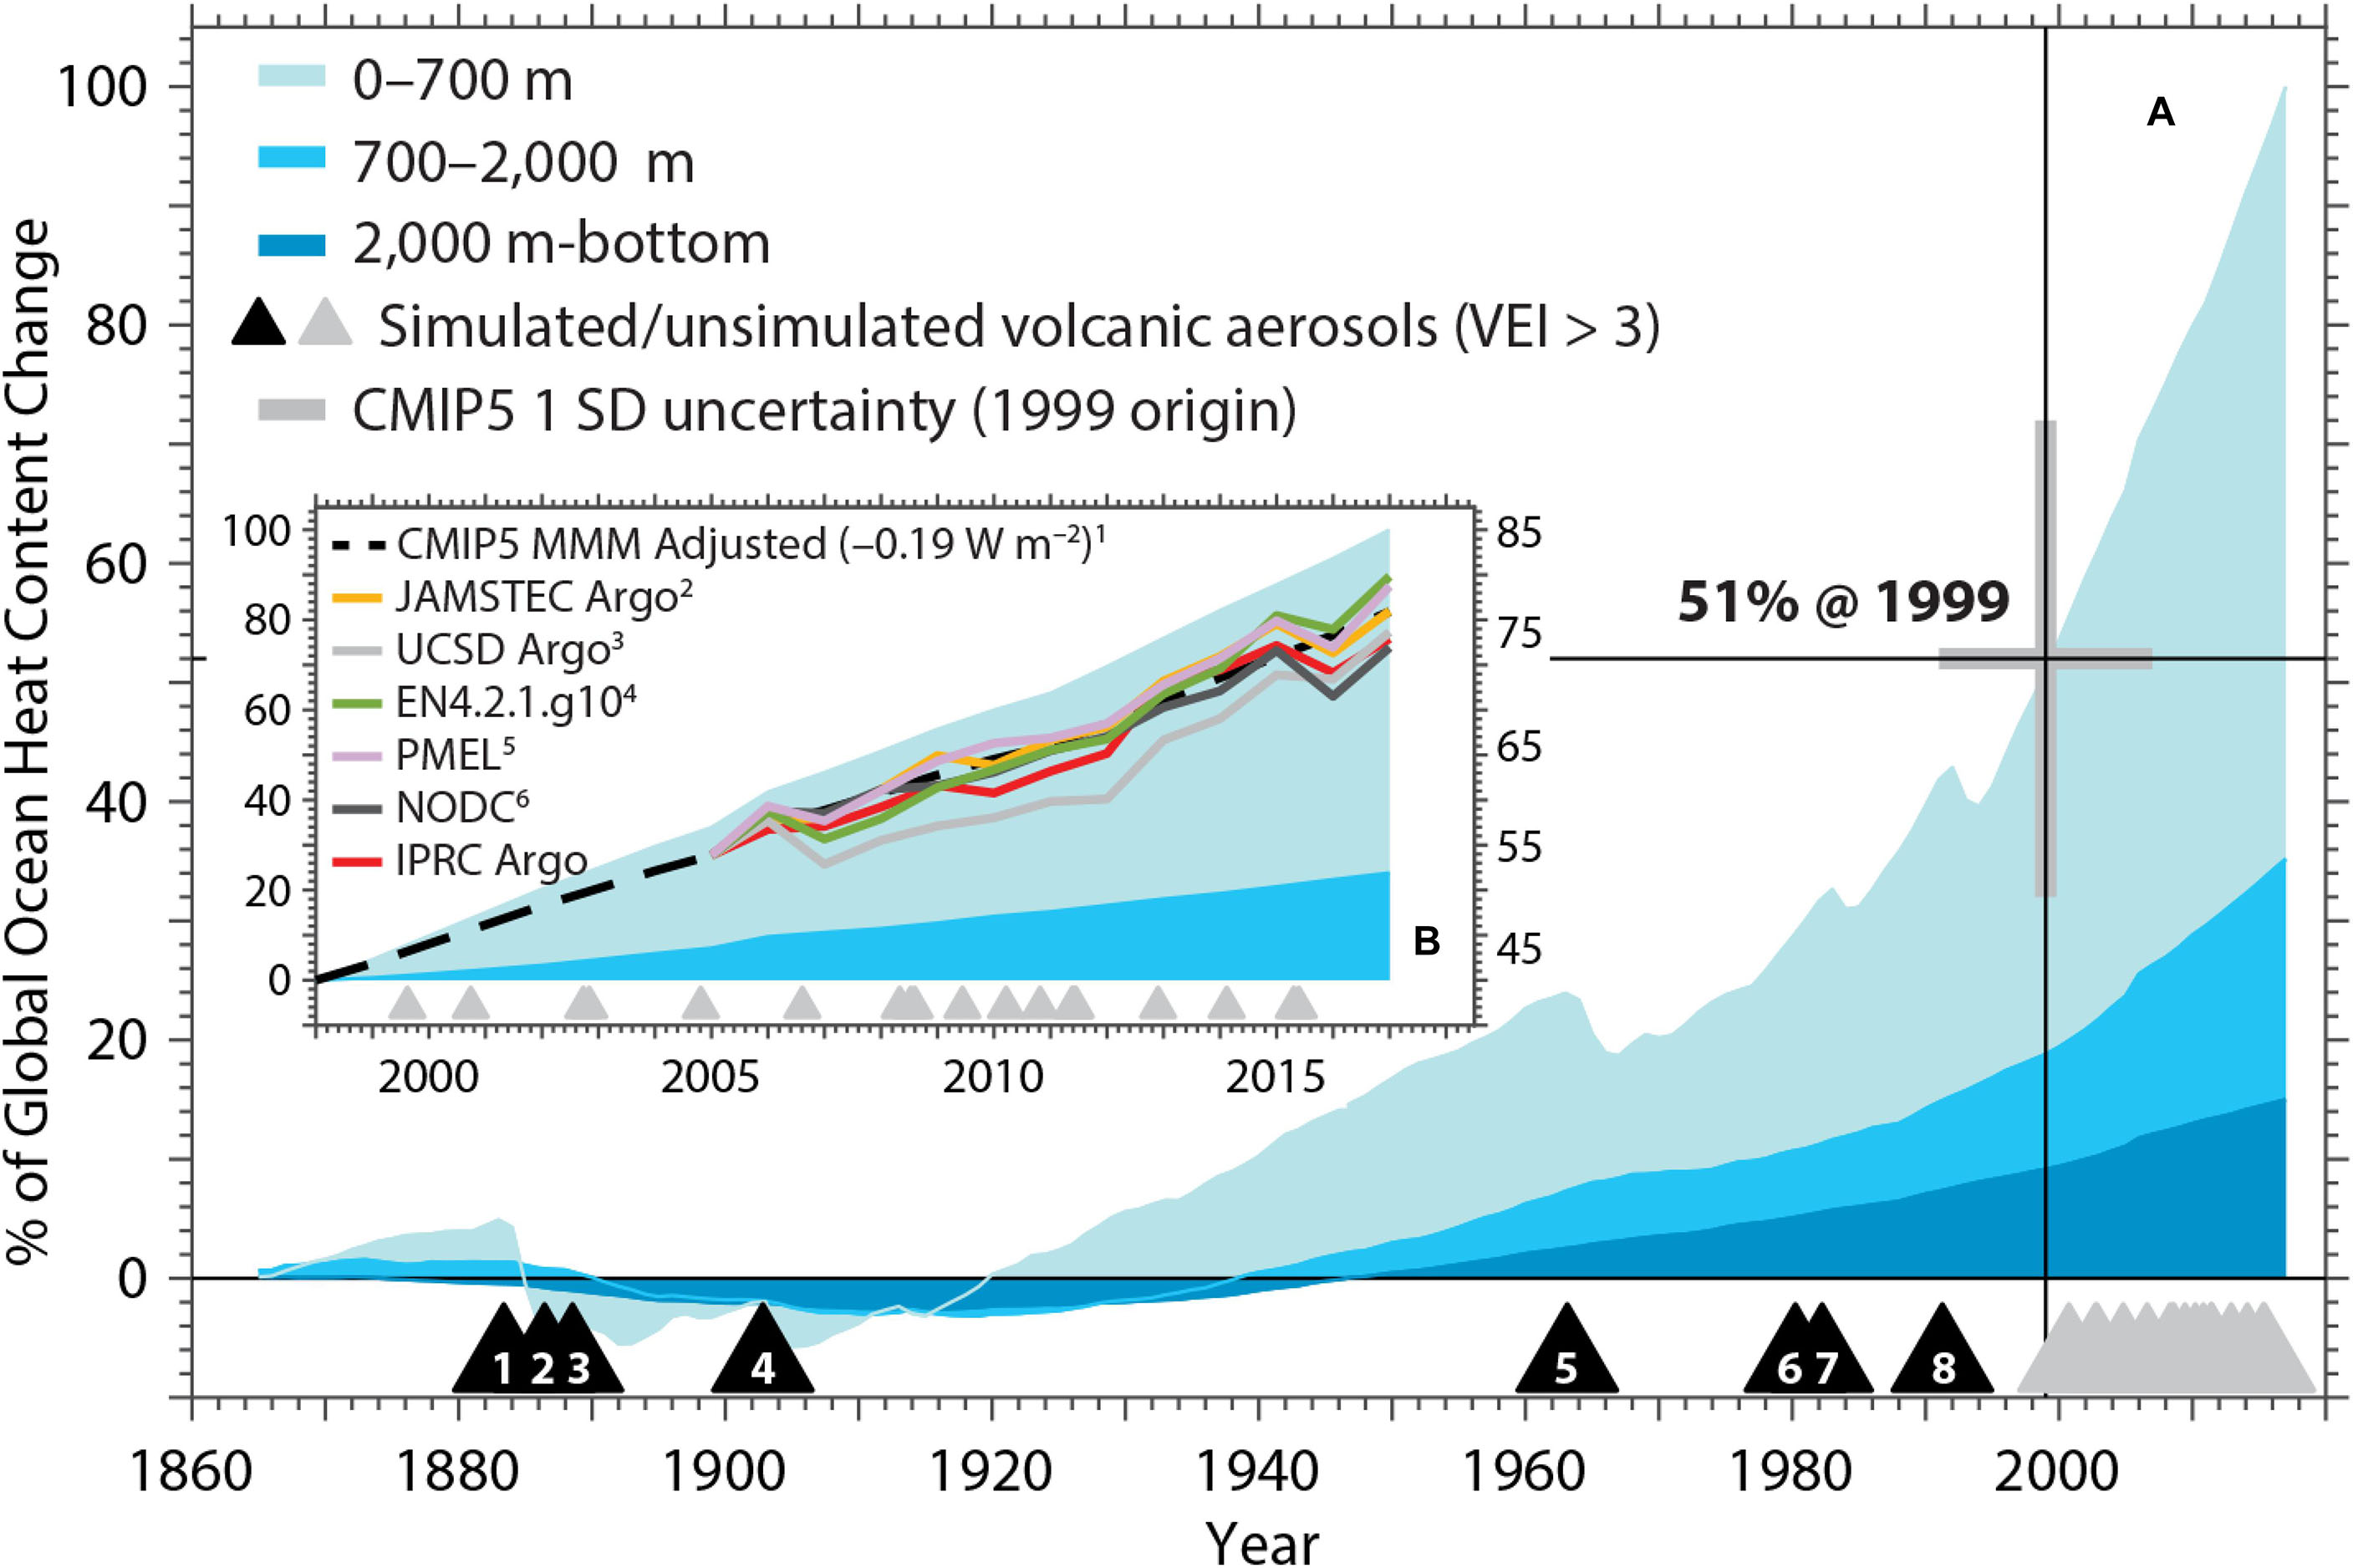
Figure 2. Ocean models provide insights as to how the full-depth ocean responds to imposed simulated forcings. When contrasted over the modern Argo coverage, and corrected to discrepancies in forcing over the 2000-near present (Ridley et al., 2014), the rate of change in ocean heat content approximates observed estimates (Hosoda et al., 2008; Roemmich and Gilson, 2009; Levitus et al., 2012; Good et al., 2013; Johnson et al., 2018). Ocean heat uptake (percentage of total 1865–2017 change) for the CMIP5 Multi-model Mean (MMM) layers. The three shaded wedges are combined similarly to the AR5 change in global energy inventory (Rhein et al., 2013; Box 3.1). The thick vertical gray bar represents a 1 s.d. spread from the CMIP5 simulations about the year (1999) at which the MMM heat uptake reaches 51% of the net (1865–2017) industrial-era increase, and the thick horizontal gray bar indicates the CMIP5 1 s.d. spread in the year at which 50% the total accumulated heat is reached. Black (forcing included) and gray (forcing not included) triangles represent major 20th- and 21st-century volcanic eruptions with magnitude represented by symbol size. Reproduced from Durack et al. (2018; Figure 2).
Ocean and climate variability is an important source of predictability on seasonal-to-decadal timescales. The best-known example is probably that associated with seasonal forecasts of ENSO (e.g., Chen et al., 2004; Barnston et al., 2012), with large global impacts on patterns of temperature and precipitation (McPhaden et al., 2006) and sea level in the Pacific (Widlansky et al., 2017). Skill in ENSO prediction arises from well-understood and conceptually simple ocean dynamics (e.g., Roberts et al., 2016). The most skilful seasonal forecasts tend to be those that incorporate subsurface ocean initial conditions and include an active dynamical ocean as part of a coupled model prediction system (e.g., Doblas-Reyes et al., 2013). On longer timescales, one of the main sources of predictability arises from initialization of the subsurface ocean (e.g., Smith et al., 2007; Meehl et al., 2014). Therefore, a major challenge in the development of decadal prediction systems is the lack of historical temperature and salinity observations that are required to: (i) assess the representation of variability in climate model simulations; (ii) generate initial conditions for hindcast simulations; and (iii) provide skill assessment of prediction systems based on hindcast sets. Idealized predictability studies and assessment of internal variability in CMIP5 models both suggest that improved forecast skill should be possible with more complete sampling of the ocean temperature and salinity fields (Dunstone and Smith, 2010; Palmer et al., 2011; Palmer and McNeall, 2014).
Projected Changes in Ocean Heat and Freshwater Content
The ocean response under anthropogenic greenhouse gas forcing will be a critical determinant of both the magnitude and regional impacts of future climate change. We have a high degree of scientific confidence in some of the systematic changes that will occur in the climate system under anthropogenic warming. These changes include: intensification of the hydrological cycle (with corresponding amplification of the spatial variations in surface and subsurface salinity); continued warming of the global oceans and sea level rise; a weakening of the AMOC (and associated northward heat transport); intensification of the Southern Ocean winds; and increased freshwater input to the high-latitudes (from both moisture transport and melting ice). However, the magnitude of these changes and the associated spatial patterns generally show a large degree of uncertainty in climate model simulations (e.g., Collins et al., 2013; Gregory et al., 2016).
Global warming gives rise to increased global precipitation and atmospheric moisture transports, due to the capacity for a warmer atmosphere to hold more moisture (Held and Soden, 2006). CMIP5 climate model simulations suggest that the rate of global precipitation will increase with global surface temperature change, at rate between 0.5 and 3% per C depending on the climate change scenario (Collins et al., 2013). The first-order picture that has often been presented for precipitation is “the richer get richer and the poor get poorer” in reference to an intensification of the hydrological cycle, with corresponding amplification of rainfall extremes and drought events (Trenberth, 2011). However, more recent studies have challenged this viewpoint as too simplistic (Collins et al., 2013; e.g., Chadwick et al., 2013) and there remains a large degree of uncertainty in the spatial patterns of precipitation changes among climate models in general (Collins et al., 2013). Given the challenges of measuring changes in global precipitation and evaporation, using observations of sea surface salinity may be the most tractable approach to monitoring long-term changes in the global hydrological cycle (e.g., Durack and Wijffels, 2010; Durack et al., 2012; Li et al., 2016a, b; Liu et al., 2018).
Global ocean heat uptake acts to delay the surface temperature rise and mitigates the worst impacts of future global warming. The spatial pattern of heat uptake affects the evolution of sea surface temperature and climate feedbacks, with important implications for the magnitude of global surface temperature change (e.g., Rose et al., 2014; Rose and Rayborn, 2016). This spatial pattern of warming also has important implications for both global and regional sea level rise (e.g., Kuhlbrodt and Gregory, 2012); and may also directly influence the future ice mass input from the West Antarctic Ice Sheet (e.g., Levermann et al., 2014; Golledge et al., 2015). Global ocean HC change is an important indicator of the rate of global warming and provides more reliable information on annual-to-decadal timescales than changes in global surface temperature (Roemmich et al., 2015; von Schuckmann et al., 2016). The spatial pattern of ocean heat uptake under climate change therefore has important implications for the design of the future observing array if we are to accurately monitor the rate of anthropogenic global change.
The IPCC AR5 (Rhein et al., 2013) provided a good overview of the historical observed spatial trends in upper ocean HC and FWC/salinity (see section “Observed Changes in Ocean Heat and Freshwater Content”). However, relatively little information was provided on the spatial patterns of HC and FWC under climate change. The surface temperature response under greenhouse gas forcing varies considerably among CMIP5 models (Collins et al., 2013), both in terms of the overall magnitude and the spatial pattern of warming. In general, the response of any given climate model is associated with relatively large-scale patterns and key features typically extend over several degrees of longitude/latitude or more. The CMIP5 multi-model mean suggests the largest surface temperature response in the Arctic and the least warming in areas of the North Atlantic, South Pacific, and Southern Ocean (Collins et al., 2013).
CMIP5, and previous climate model simulations, exhibit widespread warming of the global ocean under all RCP climate change scenarios. The spatial pattern is broadly characterized by a surface intensified warming, with the majority of the warming below 2000 m occurring in the Southern Ocean (Figure 3; Collins et al., 2013). Model simulations suggest that the climate change signal steadily propagates into the deeper ocean over time (Collins et al., 2013; Gleckler et al., 2016).
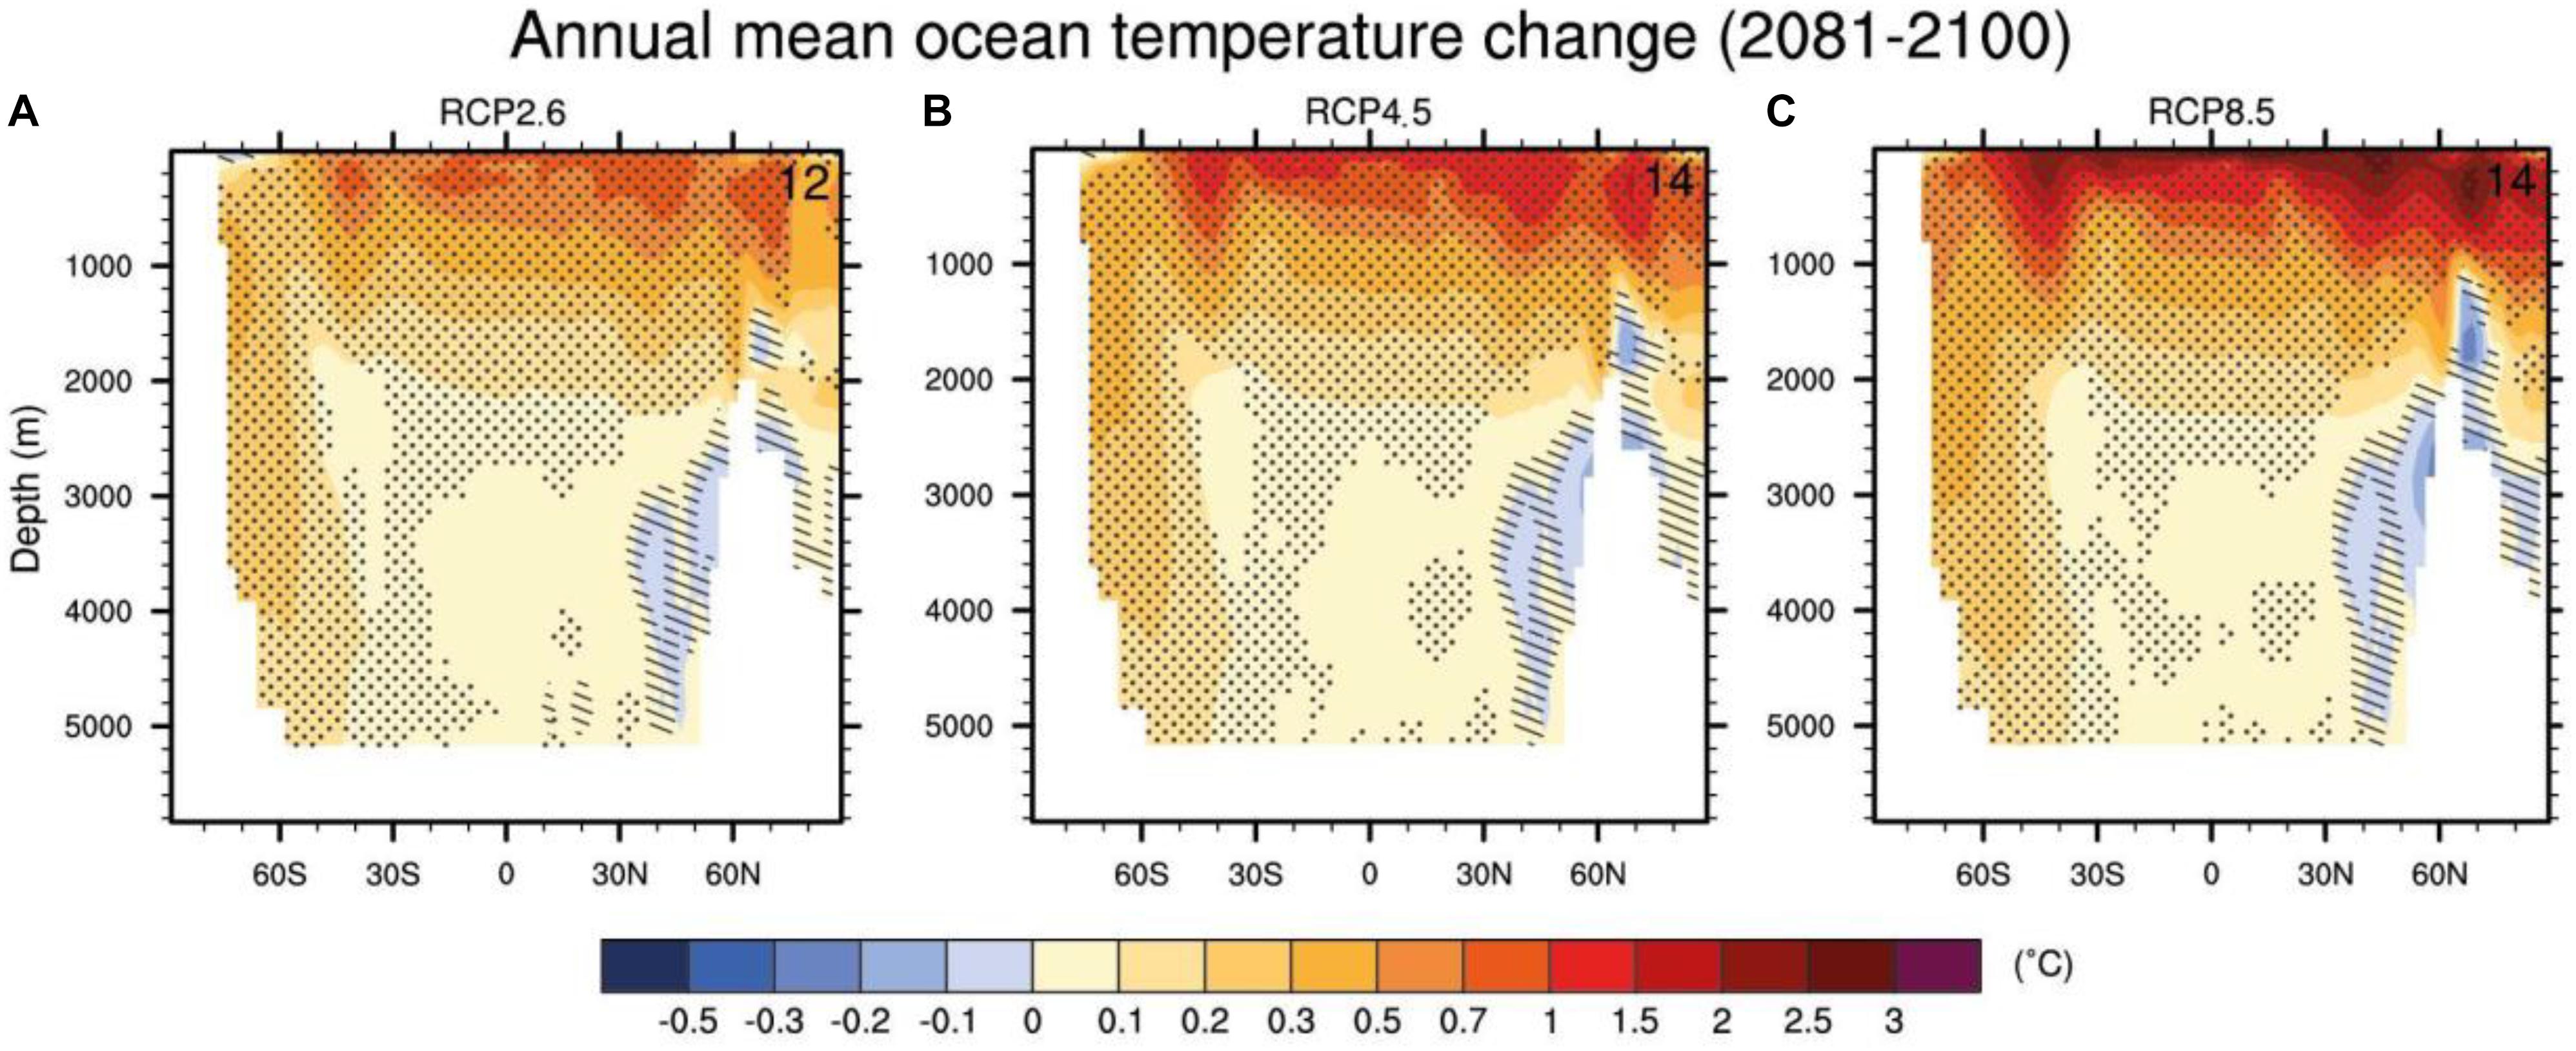
Figure 3. CMIP5 multi-model changes in annual mean zonal mean temperature in the ocean relative to 1986–2005 for 2081–2100 under the RCP2.6 (A), RCP4.5 (B), and RCP8.5 (C) forcing scenarios. Hatching indicates regions where the multi-model mean change is less than one standard deviation of internal variability. Stippling indicates regions where the multi-model change mean is greater than two standard deviations of internal variability and where at least 90% of the models agree on the sign of change. The numbers in the upper-right corner indicate the size of the model ensemble. Reproduced from IPCC AR5 (Collins et al., 2013, Figure 12.12).
The connection between air–sea heat fluxes and the deep ocean is strongest in regions of deep and bottom formation. Therefore, in addition to the surface-intensified warming, climate model simulations also show a bottom-intensified warming, particularly for the Southern Ocean sector (Figure 4; Heuzé et al., 2015). This aspect of the change signal is also in broad agreement with observational estimates of abyssal ocean warming and consistent with theoretical understanding of water mass formation and ocean circulation. While the signals for bottom warming are fairly consistent among CMIP5 models this is less true for projections of changes in bottom salinity. Details of the climate change response vary substantially across CMIP5 models and are linked to changes in the mean transports of key water masses (Heuzé et al., 2015). Uncertainty in the spatial pattern of the ocean response is also reflected in depth-integrated properties, such as HC and dynamic sea level (Kuhlbrodt and Gregory, 2012; Gregory et al., 2016). The largest ocean heat uptake is seen in the Southern Ocean and Atlantic sectors (Kuhlbrodt and Gregory, 2012; Exarchou et al., 2014; Garry, 2017) with ocean circulation playing a substantial role in the associated spatial pattern through both advection of, and response to, the warming signal (Marshall et al., 2015; Gregory et al., 2016).
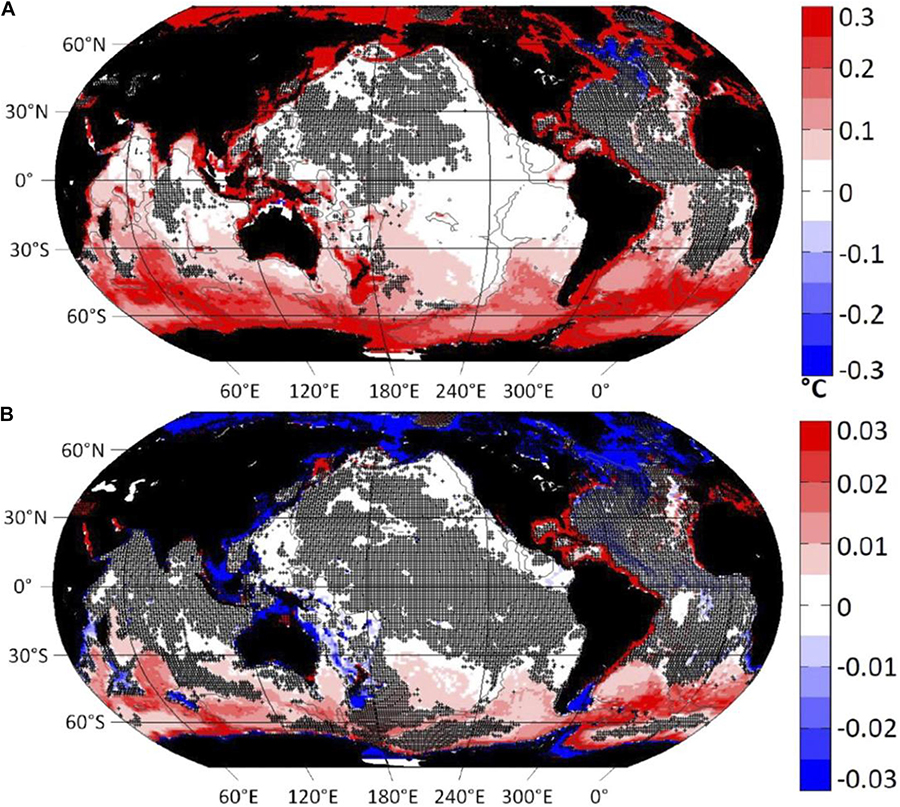
Figure 4. RCP8.5 multimodel mean change (2081–2100 minus 1986–2005) in (A) bottom temperature, and (B) bottom salinity. Control drift has been removed. Black stippling indicates areas where fewer than 16 models agree on the sign of the change. Gray contour indicates the 3000-m isobath. Figure adapted from Heuzé et al. (2015).©American Meteorological Society. Used with permission.
The various aspects of climate change discussed above are all either directly, or indirectly, associated with patterns of regional HC and FWC, through changes in air–sea fluxes and/or horizontal ocean transports. Changes in storage act to integrate out atmospheric/weather “noise” that is inherent to air–sea fluxes and provide better signal-to-noise ratios than attempting to monitor the fluxes directly. While changes in upper ocean HC feedback on air–sea fluxes via the surface temperature field (e.g., Gregory et al., 2016), salinity behaves more like a passive tracer. Therefore, there is a high degree of complementarity between HC and FWC changes in water mass frameworks and the influence of both on density offers insights into changes in the geostrophic flow field and the steric component of sea level. Accurately monitoring regional HC and FWC changes offers the potential for improved understanding of the emergent patterns of climate change and developing multi-variate observational constraints for climate model projections (e.g., Cox et al., 2018) across a wide range of societal-relevant metrics. While we must be cognizant of limitations and known biases in climate model simulations, they can provide useful information to help inform development of the future ocean observing array. We can have most confidence in projections of future ocean climate changes where there is a consistent picture between theory, observations and the model simulations of future climate change. Comparison across these three elements may provide a useful framework for assessing and communicating uncertainty in future projections of climate change.
Case Study: Atlantic Ocean
The Atlantic Ocean plays a unique role in Earth’s climate as the sole basin connected to both the Arctic and Southern Oceans. The current systems of the Atlantic carry and redistribute HC and FWC not only poleward but there is a net heat transport from the southern to the northern hemisphere. This cross hemispheric transport is carried by the AMOC (Frajka-Williams et al., 2019), and the HC and FWC pattern reflect this close link and show significant variability in both, thermocline waters and in the deep ocean below 2000 m.
As for other basins, thermocline waters affecting HC changes are essentially mode and intermediate waters, formed in both the subpolar and subtropical regions, and penetrating the subtropical gyres of both hemispheres at depth (Arbic and Owens, 2001; Häkkinen et al., 2015; Desbruyères et al., 2017). Recent estimates show that during the period 1950s to 2012, the upper 2000 m of the North Atlantic Ocean have gained 5 × 10²² J, 30% of the global ocean warming over this period (Häkkinen et al., 2015) and are accompanied by a downward displacement of mid-thermocline isopycnals (Arbic and Owens, 2001; Häkkinen et al., 2015; Desbruyères et al., 2017).
The water mass transformation processes that create North Atlantic Deep Water (NADW) have two drivers: (i) buoyancy fluxes at the air/sea interface, creating dense mode water in the subpolar gyre (densest one is Labrador Sea Water; LSW); and (ii) entrainment processes at the Greenland-Scotland Ridges, where dense water masses that enter from the Nordic Seas are transformed into Denmark Strait Overflow Water (densest part of the NADW) and the Iceland Scotland Overflow Water. The hydrographic variability of subpolar Mode Water masses is well documented and also correlated with air/sea buoyancy fluxes (Yashayaev and Loder, 2017). Variability of the hydrography of the overflow waters is more complex because of the entrainment of ambient waters adding twice the volume to the overflow (Jochumsen et al., 2015). The northward spreading of Antarctic Bottom Water (AABW) in the Atlantic Ocean is supplied by dense water formed around Antarctica, in particular from the Weddell Sea. The northward penetration is limited by the topographic structure of the Atlantic basin and almost all AABW has to cross through the Vema Channel (28°S/38°W) where a steady increase in AABW temperature (about 2.8 mK/year; Zenk and Morozov, 2007) has been reported.
Adequately monitoring the HC in the Atlantic Ocean is important in terms of planetary energy budget but also in relation to ocean-atmosphere heat fluxes (Rhines et al., 2008), seasonal-to-decadal climate prediction (Czaja and Frankignoul, 2002), to constrain future projections of atmospheric storminess and Arctic changes (Straneo and Heimbach, 2013; Jung et al., 2017). The Atlantic HC in the upper 0–2000 m exhibits strong decadal variability (e.g., Cheng et al., 2017), which is likely linked with decadal changes in the AMOC, which has been shown to increase its total overturning transport up to the mid-1990s followed by a decrease from 2000 onward (e.g., Danabasoglu et al., 2015; Jackson et al., 2016).
Analysis of the strong weakening of the AMOC in 2009/2010 (McCarthy et al., 2012) suggest that we are able to present a consistent picture between changes in horizontal transports, heat storage and air–sea fluxes at least for basin-scale changes (Cunningham et al., 2013; Bryden et al., 2014). Since 2005, a large part of the North Atlantic evidenced a shift from warming to cooling (Robson et al., 2012a, 2016), which led to decreasing regional HC. The regional North Atlantic cooling is likely linked to changes in the circulation such as anomalously weak LSW deep convection (Thornalley et al., 2018) and/or long-term AMOC weakening (e.g., Caesar et al., 2018; Smeed et al., 2018) and to changes in the air–sea fluxes (e.g., Robson et al., 2014; Dubois et al., 2018; Josey et al., 2018). These results suggest that long-term changes in the AMOC will have a first-order impact on the future HC (and FWC) changes in the North Atlantic.
The deep reaching overturning circulation in the North Atlantic and the proximity to large freshwater reservoirs (Arctic, Greenland) means that surface freshwater anomalies can be efficiently introduced into deep waters and spread southward (Curry and Mauritzen, 2005). One such example is the Great Salinity Anomalies observed during the 1970s, 1980s, and 1990s (Belkin, 2004). Examination of a range of salinity products collectively suggests widespread freshening of the subpolar North Atlantic from the mid-2000s to the present (Tesdal et al., 2018). In the western subpolar gyre, a negative correlation between near-surface salinity and the circulation strength of the subpolar gyre suggests that negative salinity anomalies are connected to an intensification of the subpolar gyre, which is causing increased flux of freshwater from the East Greenland Current and subsequent transport into the Labrador Sea during the melting season. A freshening has been also observed in the Antarctic Intermediate Water (AAIW) layer in the South Atlantic during the period 2005–2014 (Yao et al., 2017) and it has been suggested that it is linked to increased southern hemisphere subpolar precipitation and a decrease in the Agulhas leakage. Concurrently to the so called “North Atlantic cold event,” distinct freshening of the upper 1000 m layer has been reported in the subpolar North Atlantic since 2005 (Dubois et al., 2018). A schematic of the observed heat and salinity changes is presented in Figure 5.
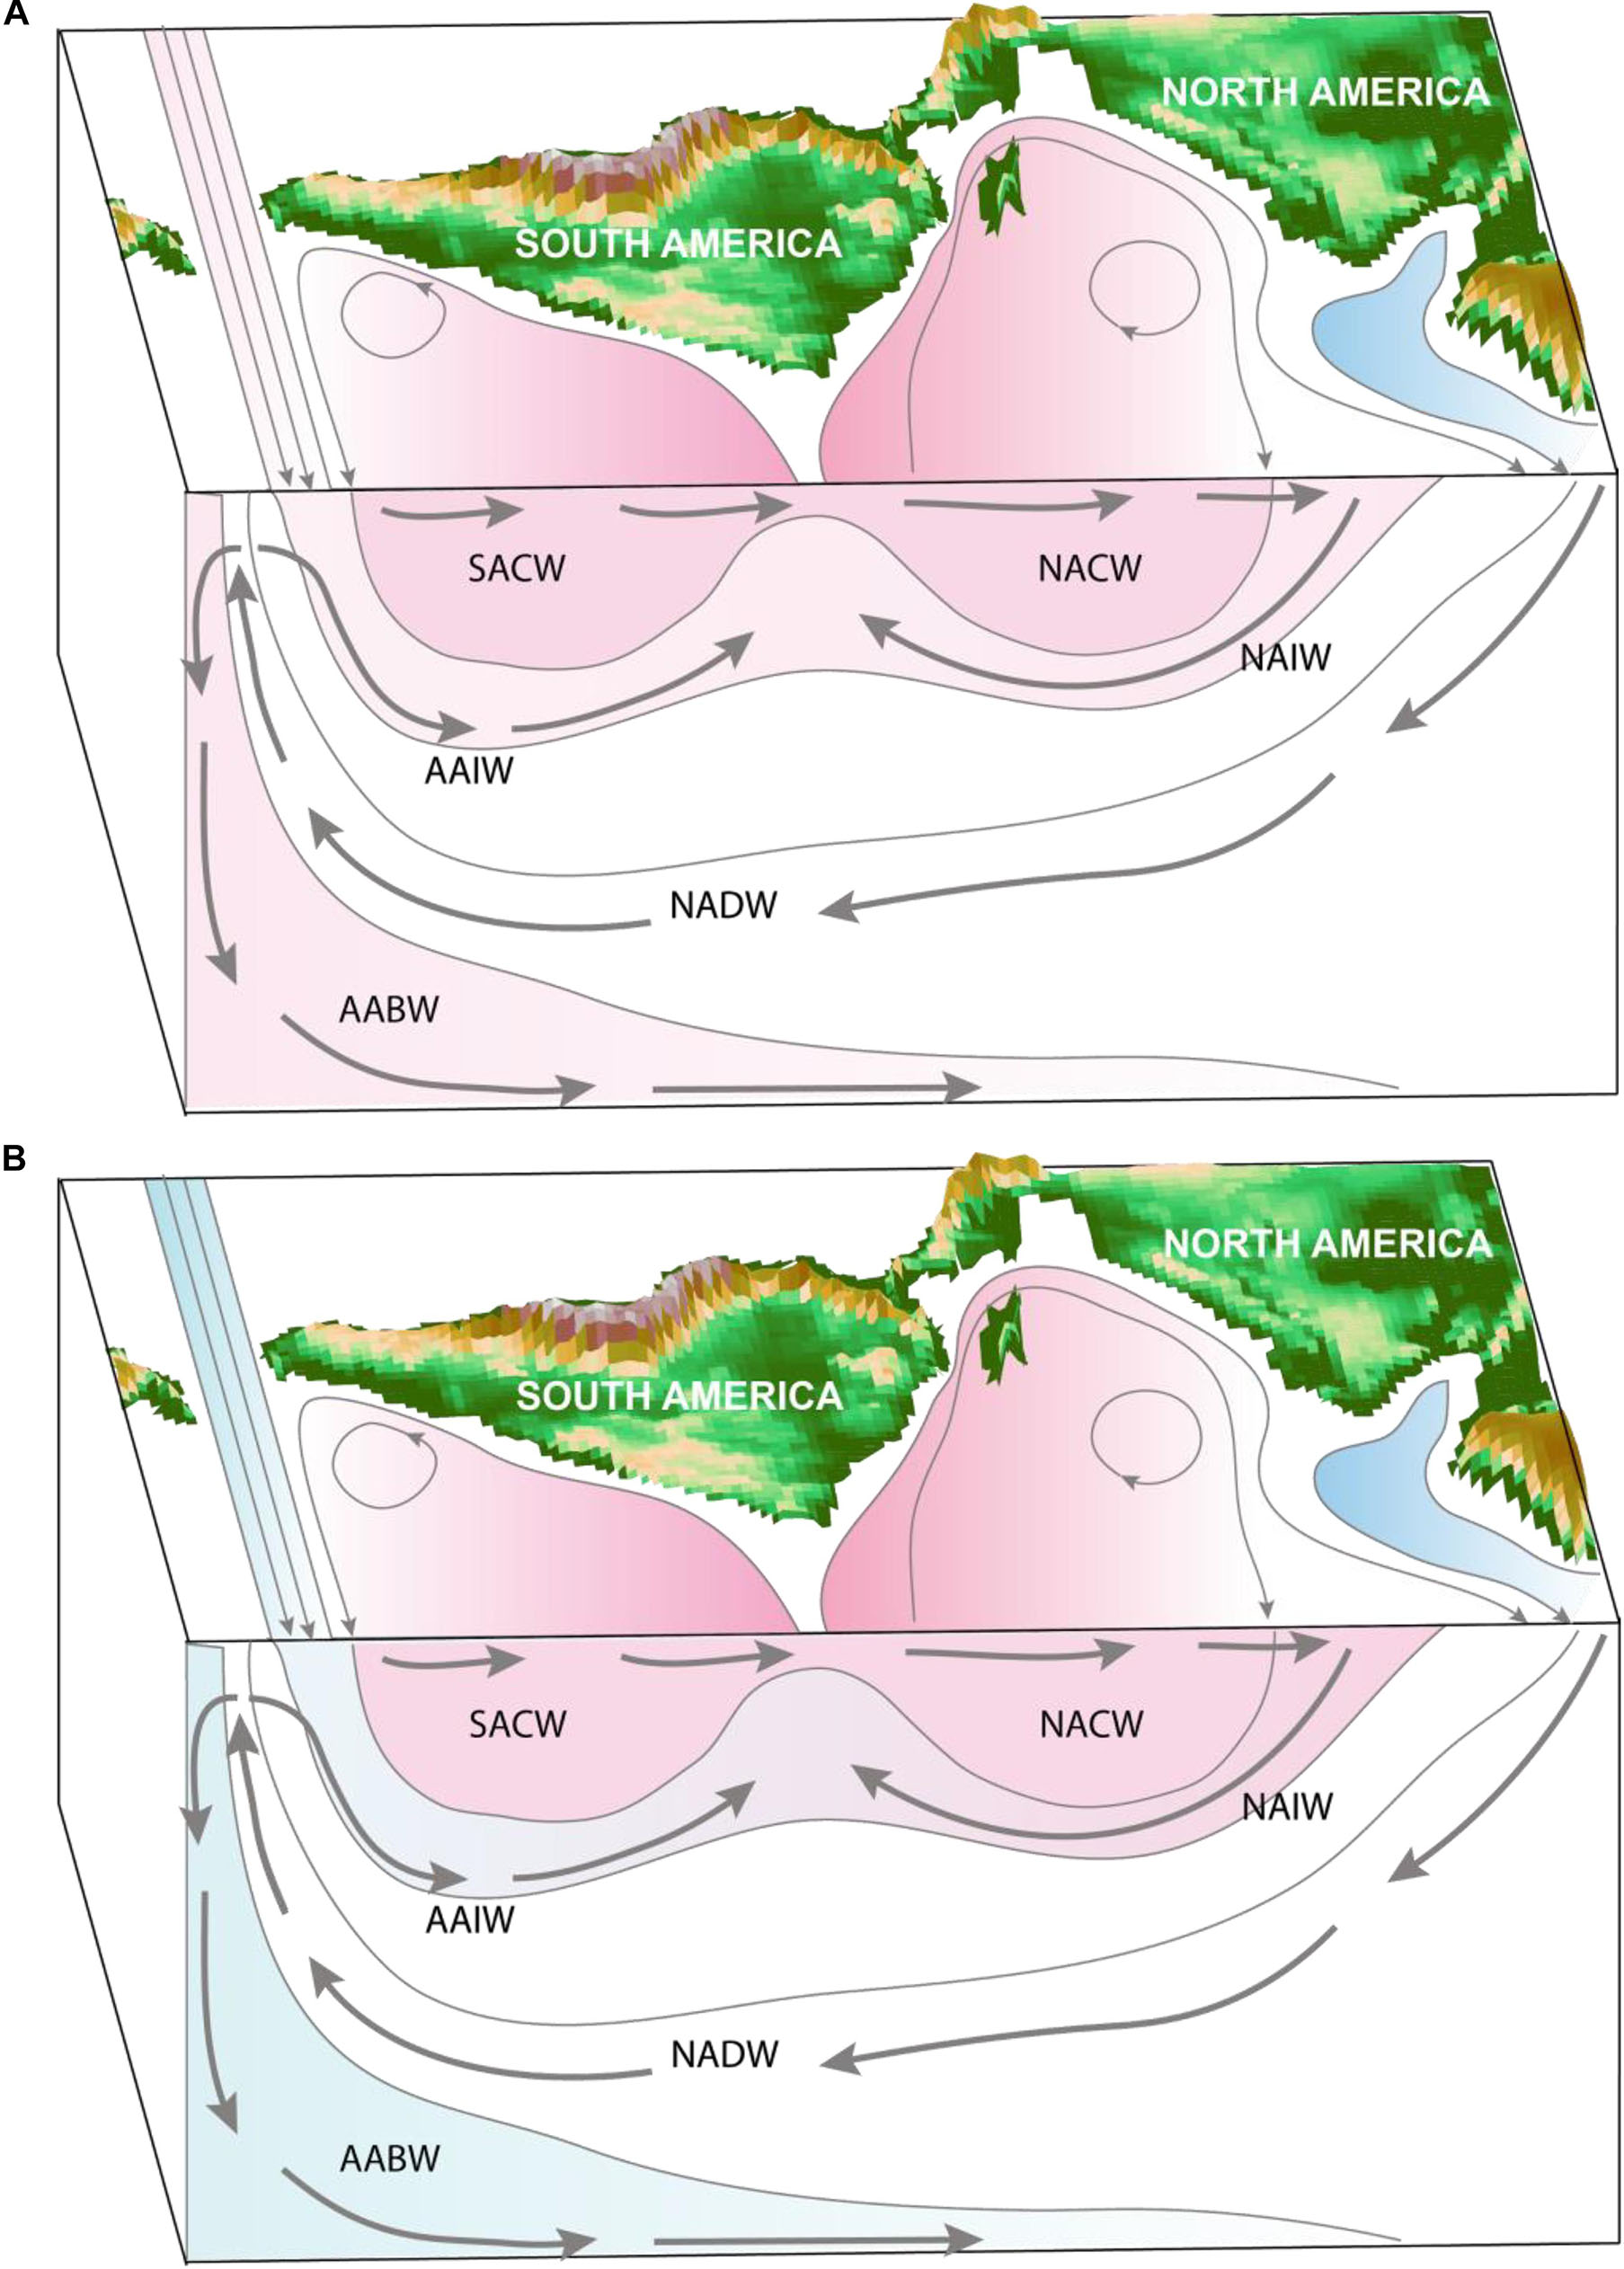
Figure 5. Schematic showing temperature (A) and salinity (B) trends in different layers of the Atlantic Ocean. The layers are defined as main water-masses of the Atlantic Ocean. From the upper layers down to the ocean bottom: South Atlantic Central Water (SACW), North Atlantic Central Water (NACW), Antarctic Intermediate Water (AAIW), North Atlantic Intermediate Water (NACW), North Atlantic Deep Water (NADW), and Antarctic Bottom Water (AABW). Gray arrows show the main overturning pathways in the basin, and the black contours show a vertical slice of the vertical and meridional water masses distribution in terms of potential density. The color shading corresponds to: warming/saltier in red, cooling/freshening in blue, and white where no clear trends are documented.
Monitoring the Atlantic Ocean FWC budget is relevant for understanding and monitoring the global hydrological cycle with a clear connection to seasonal-to-decadal predictability (Schlundt et al., 2014; Fu et al., 2018). It is also an important element in the discussion around potential abrupt changes of the AMOC (Clark et al., 2002; de Vries and Weber, 2005; Liu et al., 2017).
In the Atlantic Ocean the different pathways of freshwater transport, the variability of air/sea fluxes and internal water mass transformation in particular at the overflow sills create highly variable HC and FWC storage throughout the water column. This sets very demanding observational requirements for monitoring the variations of these ocean properties in this basin. However, the characteristic timescales of HC and FWC anomalies differ by the depth of the water mass and corresponding ventilation regions and water transformation processes. Indeed, the upper to lower thermocline layers are highly affected by processes at intraseasonal to interdecadal timescales, due to the strong influence of air–sea fluxes, mesoscale variability and lower frequency natural variability. Changes in the deeper layers are characterized by interannual to centennial timescales (Park and Latif, 2008; McCarthy et al., 2012; Xu et al., 2014; Gastineau et al., 2018). In order to constrain variability and changes in the global energy and freshwater budgets and initialize seasonal-to-decadal forecasts, monitoring at monthly timescales is required for the upper (0–2000 m) layers and annual timescales for the deeper layers as only these observations provide a strong constraint on ocean temperatures beneath the mixed layer and have been shown to have a very significant impact on such forecasts (Dunstone and Smith, 2010; Robson et al., 2012b; Dunstone, 2014). Such timescales are defined by the time variability scales of the upper ocean (essentially mesoscale) and longer for deeper layers.
For the monthly monitoring of the upper layers, the current observing system provision of T and S vertical profiles at 5–10 days timescales at a 3° × 3° resolution in the open ocean, should be adequate to characterize month-to-month variations in HC and FWC. Higher spatio-temporal sampling is needed at choke points along the continental slopes and shelf areas in order to accurately monitor boundary currents, ocean-atmosphere buoyancy exchanges hot-spots and the freshwater inflow from continental sources (rivers, sea-ice and icebergs/continental ice-cap interaction along Greenland and the Labrador Sea) and exchanges with other oceans and marginal seas (Indian and Southern Ocean in the Southern Hemisphere, the Mediterranean and Caribbean seas and the Arctic in the Northern Hemisphere). For deeper layers, a yearly to interannual timescale of full depth T and S vertical profile should be sufficient for decadal prediction and longer-term climate change detection.
The combined elements of the current Atlantic observing system described above, allow good broadscale characterization of HC and FWC changes in the upper (especially 0–700 m with XBTs for OHC and down to 2000 m with Argo for both, HC and FWC) open ocean. However, the upper 1500 m of continental slopes around the Atlantic basin are undersampled since Argo floats tend to be advected parallel to, or away from, these regions by fast-moving boundary currents. For the deep layers (below 2000 m), the AMOC boundary arrays, boundary current arrays (Todd et al., 2019), choke point OceanSITES moorings (e.g., Vema Channel) and the oceanographic research cruises (incl. GO-SHIP, Sloyan et al., 2019) are, for the time being, the only source of deep T and S data. However, it must be said that, in the Atlantic Ocean, due to the AMOC dedicated mooring arrays and the fact that these moorings need to be serviced, the amount of yearly data at depth exceed the number of data available for other ocean basins.
Case Study: Tropical Pacific
The Tropical Pacific Ocean is the global “hot spot” for upper-ocean HC variability on interannual-to-decadal timescales (e.g., Chen and Tung, 2014). During ENSO events, OHC is redistributed across the basin and between the surface and subsurface layers: the upper 0–100 m layer warms while the 100–500 m layer cools during an El Nino, and vice versa during La Nina (Roemmich and Gilson, 2011; Roemmich et al., 2015; Johnson and Birnbaum, 2017). Deeper, the short observational time series suggest a weak warming in the intermediate layers (Piecuch and Quinn, 2016; Johnson and Birnbaum, 2017). Figure 6 illustrates schematically the fundamental processes of the coupled ocean-atmosphere system in the Tropical Pacific that links upper-ocean HC to climate variability and change from interannual-to-decadal and longer time scales.
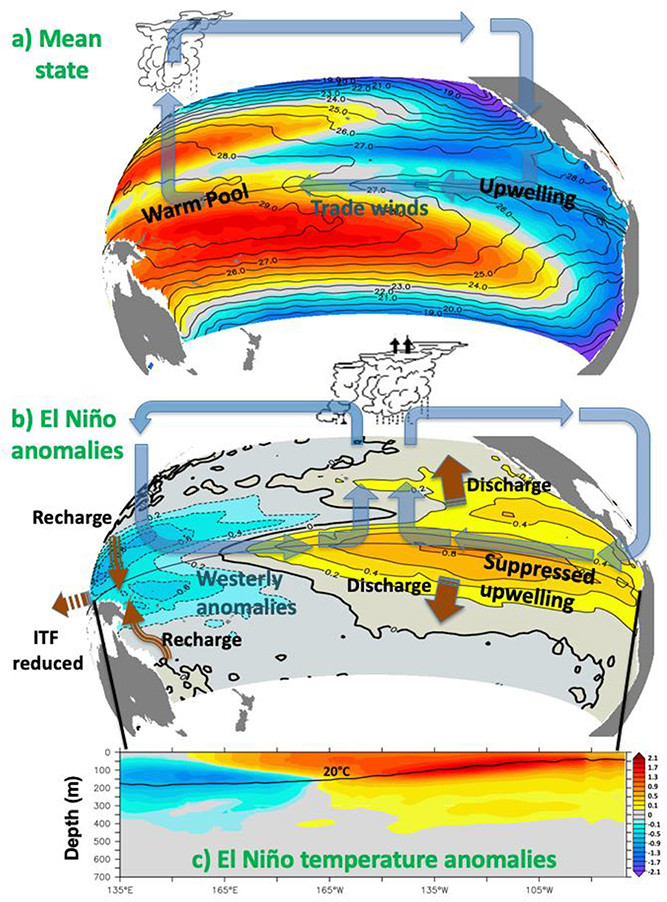
Figure 6. Schematics of the oceanic and atmospheric processes in the mean state (a) and El Nino state (b,c). (a) Mean 0–300 m heat content from Argo gridded product (colors), and mean SST (contours). In the mean state, easterly trade winds produce eastern upwelling, fostering higher sea surface temperatures and atmospheric convection in the west. That in turn strengthens the easterly surface winds in a positive feedback. Upper oceanic heat content is larger in the southwestern and northwestern parts of the basin. (b,c) 0–300 m temperature anomalies regressed onto Nino3.4 index during the 2004–2016 period, both for the upper 0–300 m layer (b), and for the vertical equatorial section to 700 m depth (c). The mean position of the 20°C isotherm is also shown. ITF = Indonesian Throughflow.
During El Nino, trade winds weaken or reverse, leading to the deepening of the thermocline in the central and eastern Pacific, to a weakening/suppression of the upwelling, and to an eastward displacement of the warm waters and atmospheric convection. These changes induce a zonal redistribution of the upper oceanic HC from west to east. Schematic arrows indicate the recharge/discharge from the low-latitude western boundary currents (WBCs) and the interior ocean, forced by wind stress curl anomalies, both locally and through Kelvin and Rossby waves propagations.
ENSO-related HC variability in the 0–100 m layer is largely compensated by opposing changes in the 100–500 m layer, with generally small changes in the vertically integrated change. Several studies have suggested that the global ocean loses heat during El Nino events and gains heat during La Nina events (Roemmich and Gilson, 2011; Abraham et al., 2013; Rhein et al., 2013; Roemmich et al., 2015). However, a recent study by Piecuch and Quinn (2016) and satellite-based estimates of changes in Earth’s energy storage lead to opposite conclusions (Wong et al., 2006; Johnson and Birnbaum, 2017). This emphasizes the need to continue accurate monitoring of the temperature anomalies in sub-thermocline layers in the Tropical Pacific, at least to the depth extent of ENSO-related variations, for constraining the global ocean HC. Such redistributions are also seen at decadal timescales, linked to the phase of the PDO (Pacific Decadal Oscillation) and IPO (interdecadal Pacific Oscillation; Corre et al., 2012; Nieves et al., 2015).
The tropical Pacific is a region where the long-term trend in ocean HC is masked by large interannual-to-decadal variability, and thus long continuous records are needed to separate out the forced response from climate variability. HC trends estimates are therefore subject to large uncertainties, and depend greatly on the time period, and on the depth of the layer considered (e.g., Wang et al., 2018). Recent estimates indicate a weak warming of the upper ocean (0–700 m) during 1971–2010 (Rhein et al., 2013) and the 1993–2016 (Johnson et al., 2016). Deeper, historical observations are too sparse to establish the relative importance of multi-decadal versus interannual variability. Argo observations of the 700–2000 m layer exhibit a steadier warming than seen in the upper layers (Roemmich et al., 2015), consistent with expectations based on climate model simulations (Palmer and McNeall, 2014).
Adequate monitoring HC in the Tropical Pacific is fundamental to better constraining variability in the planetary energy budget and for accurate prediction of ENSO events (e.g., Jin, 1997). The “Warm Water Volume” (WWV), (i.e the equatorial Pacific volume warmer than 20°C; Meinen and McPhaden, 2000), is a useful precursor to El Nino events. The WWV is used in simple statistical ENSO forecasts (McPhaden et al., 2006), forecast center expert assessments, and is a key evaluation metric for coupled forecast systems (e.g., Balmaseda et al., 2014).
The Tropical Pacific also shows substantial interannual-to-decadal variability in 0–100 m FWC (Delcroix et al., 2007; Wang et al., 2017). Recently unprecedented FWC anomalies were observed during the 2015 El Nino event (Gasparin and Roemmich, 2016; von Schuckmann et al., 2016), arising from both changes in surface freshwater fluxes and oceanic dynamics. Longer-term freshening of the Tropical Pacific has been attributed to anthropogenic forcing and is related to an intensification of the hydrological cycle (Cravatte et al., 2009; Durack and Wijffels, 2010; Durack et al., 2012; Terray et al., 2012; Rhein et al., 2013). Freshwater changes in the Tropical Pacific have important impacts on local seawater density and ENSO dynamics and contribute to both regional and global sea level change (Wang et al., 2017).
In the tropics, the observational requirements for monitoring HC and FWC anomalies are less stringent than in other regions: the drivers are mostly deterministic (Sérazin et al., 2017) and the signals generally have long zonal length scales compared to the mid-latitudes (Kessler et al., 1996). These requirements have been discussed in the context of the Tropical Pacific Observing System 2020 (TPOS 2020; Cravatte et al., 2016; Smith et al., 2019). Monitoring of the upper ocean HC and FWC (0–300 m) requires temperature and salinity profiles at 5 to 10-days timescales, 500 km in the zonal and 200 km in the meridional directions, with a higher 100 km meridional resolution in the equatorial band to allow direct estimation of HC changes and to provide adequate constraints for ocean data assimilation products (Fujii et al., 2015). T and S profiles to 1000 m at monthly timescales and full-depth measurements at yearly or longer timescales to support decadal prediction and climate monitoring, respectively.
The current Tropical Pacific Observing System (TPOS) capability for measuring HC and FWC changes has been discussed by Roemmich et al. (2014) and Cravatte et al. (2016). The in situ elements of the TPOS include the Tropical Moored Array (TMA; McPhaden et al., 1998) since the 1980s, the Argo array since the 2000s, XBT lines and some repeat hydrographic measurements. The historical TMA TAO/TRITON array consists of around 70 moorings located at 11 longitudes across the Pacific from 137°E to 95°W and nominally at latitudes of ±8°, ±5°, ±2°, and the equator. They measure temperature generally at 11 or 12 depths from the surface down to 500 m, or to 700 m in the west, with coarser resolution below the thermocline. Subsurface salinity is measured from the surface to 500 m at the same depths in the western Pacific on TRITON moorings, and from the surface to 120 m at many TAO equatorial moorings. The divergence of Argo floats around the equatorial central and eastern Pacific has been an issue, but the new Iridium floats partly overcome this issue. Other regions where the Argo coverage is limited are the western and eastern boundary regions (Roemmich et al., 2014).
Hydrographic stations have been collected regularly along the TAO longitudes in the eastern equatorial Pacific since 1979, and since the mid 1980s for basin-wide sections, nominally to 1000 m. Unfortunately, this profiles timeseries was interrupted since 2007 due to resourcing issues. Additional full-depth repeat hydrographic stations have been collected along 137°E, 149°E, 165°E, 170°W (in the southern hemisphere only), 150°W, and 110°W at roughly decadal intervals since the 1990s (WOCE and GO-SHIP programs). These data are precious to document long-term trends for the deep tropical Pacific HC and FWC.
The 0–300 m equatorial HC is well captured since the advent of the moored array in the mid-1980s, when these observations are combined with other hydrographic data (Smith, 1995)1. The spread among ocean reanalysis has been drastically reduced (Xue et al., 2017). The development of the Argo array has significantly enhanced the capability to estimate tropical Pacific FWC and to reduce uncertainties in HC. Due to the dominance of thermosteric contribution to sea level variability in the tropical Pacific, altimeter-derived sea level anomalies have also been used to derive proxy estimate of tropical Pacific upper-ocean HC (Willis et al., 2004; Bunge and Clarke, 2014; Lyman and Johnson, 2014). The combination of XBT, TMA, Argo, and altimetry has enabled longer time series and more accurate estimates of tropical Pacific upper-ocean HC over time. The complementarity of arrays plays an essential role in resolving the required scales effectively (Gasparin et al., 2015; Xue et al., 2017).
Current shortcomings in the TPOS are the limited meridional resolution and poor sampling in the vicinity of the equator, especially in the eastern Pacific where the meridional scales are smaller, the influence of Tropical Instability Waves are important, and where the HC variability in the upper layer is largest. Near the boundaries Argo floats are sparsely distributed, and the estimates of HC and FWC are subject to larger uncertainties. Altimetry data, especially those from the upcoming SWOT mission, can provide proxy estimates of upper-ocean HC, but cannot distinguish thermosteric from halosteric contributions without the help from in situ measurements. An additional challenge is to understand the tropical Pacific Ocean volume, heat and freshwater budgets, referred to as the “Wyrtki Challenge” (Wyrtki, 1981; Cravatte et al., 2016). The ability of the observing system to characterize the horizontal convergences, vertical fluxes and surface fluxes is yet to be established. The analysis of high-resolution ocean or coupled ocean-atmosphere models and data assimilation products can help shed light on the requirements.
Case Study: Arctic Ocean
The HC and FWC transiting the Arctic Ocean is of prime importance not only for region but also for the global ocean and climate. The large amount of river input (11% of the world’s continental runoff; Fichot et al., 2013), low-salinity water from the Pacific and ice-ocean coupled processes lead to a very strong halocline overlying the relatively warm waters of Atlantic origin below. This practically isolates most of that heat from the surface and therefore prevents heat release to the atmosphere and melting of sea-ice (e.g., Rudels, 2009). Only in the inflow regions from the Atlantic and Pacific sides, through the Barents Sea and Fram Strait as well as through the Bering Strait, do the relatively warm water masses near the surface interact with sea-ice and release heat to the atmosphere. On a larger scale, the large amounts of FWC passing the Arctic lead to a large reservoir in the Beaufort Gyre but also across much of the central Arctic. The release of this FWC to the North Atlantic is mostly driven by changes in atmospheric pressure leading to varying surface stress on the ocean and resulting Ekman transports/pumping. FWC input from the Arctic to the North Atlantic has the potential to strongly influence the subpolar gyre circulation (Brauch and Gerdes, 2005) and deep convection (e.g., Koenigk et al., 2007). On the other hand, FWC variability in the Arctic largely controls changes in the steric SSH leading to variability in the upper ocean circulation. A recent study shows that the FWC in the Arctic Ocean is characterized by a remarkable increase since the mid 1990s strongly linked to sea ice volume variability (Garric et al., 2018). Finally, the warm waters of Atlantic origin are slowly modified in passing the Arctic Ocean, with a potential to influence the overflow across the Denmark Strait sill into the NADW (Karcher et al., 2011). Changes in basin-wide ocean HC during the past two decades show considerable increase, but estimates have still large uncertainties due to insufficient sampling (Mayer et al., 2016; von Schuckmann et al., 2018).
Observations of salinity in the upper few 100 m of the Arctic Ocean basins by various platforms since the early 1990s and intensified use of autonomous ice-tethered systems (ITP) since about 2004 have allowed to robustly quantify the liquid FWC variability on decadal timescales (Rabe et al., 2014). In addition, year-round observations across the basins now allow studying winter ice formation and convection processes in relation to vertical heat fluxes from the warm water of Atlantic origin to the surface (Polyakov et al., 2013). However, ITP still leave temporary gaps in different parts of the Arctic. This is due to the deployments upstream in the Transpolar Drift, north of the Siberian shelves, being tied to icebreaker expeditions in summer/early autumn. These ITP then drift to north of 85° N by April and leave a gap until late summer to the south. In addition, buoys only drift to the region north of Greenland by chance. Hence, it remains an unsolved challenge to reliably quantify a full seasonal cycle and interannual variability of the Arctic basin-wide liquid FWC. To tackle this issue, it is necessary to bring additional, newly innovated technology into the Arctic. The future use of Argo-style drifting profilers (floats) as well as advanced seafloor-moored systems, measuring from the warm Atlantic Water layer across the whole halocline and well into the mixed-layer should cover many of these spatial and temporal gaps. This could include floats operating a reliable ice detection sensor and/or used with an appropriate algorithm, supported by underwater sound sources (positions), as well as mooring systems with winches for year-round upper ocean measurements. The continuation of observing programs such as the Beaufort Gyre Project/Ice-tethered profiler (United States)2, FRontiers in Arctic-marine Monitoring (FRAM; Germany3) alongside the introduction of new technology are vital to sustain and enhance Arctic upper ocean observations of HC and FWC in future years. Furthermore, coordinated, extended observations on the shelves, near the continental slope and across the gateways are vital to determine transports in-/out of the Arctic Ocean basins and to close the budget, as current surface flux products are highly uncertain (Haine et al., 2015). In addition, the continued use of research icebreakers to obtain high-quality, full-depth profiles of temperature and salinity across the Arctic Ocean basins is paramount to measure variability in the deep ocean and to ensure adequate calibration/quality-control of the autonomous systems. Estimating sea-ice volume, representing the solid part of liquid FWC, has been facilitated since about 2011 by various satellite missions (e.g., Cryosat-2), that allow the determination of seasonal near-surface changes (largely ice-melt/freeze) and interannual variability (Armitage et al., 2016; Ricker et al., 2016). The differences between SSH from altimetry and ocean bottom pressure (OBP) from gravimetry, i.e., depth-integrated steric height that is dominated by FWC changes in the Arctic Ocean, have provided the capability to monitor broad-scale FWC changes in the Arctic Ocean (e.g., Morison et al., 2012). SSS from the L-band SMOS and SMAP satellites, with better spatiotemporal sampling then the satellite-derived SSH-OBP, have the potential to complement satellite SSH-OBP and in situ measurements to study Arctic FWC changes (e.g., Tang et al., 2018). However, improvement in retrievals and innovation in technology (e.g., multi-frequency sensors as opposed to be L-band only sensors) are necessary to reduce the uncertainty of satellite SSS in the Arctic Ocean to facilitate the studies of Arctic Ocean FWC changes.
One of the most important consequences of human-caused climate warming is rising sea levels, and although thermal expansion is a significant component of sea level rise the largest potential sea level threat comes from ice lost from the Greenland and Antarctic Ice Sheet. Greenland alone contains enough ice to raise sea levels by more than 7 m, and recent work has shown that warmer waters and higher HC on the continental shelves surrounding Greenland may drive enhanced ice loss at the margins (Holland et al., 2008; Straneo and Heimbach, 2013; Rignot et al., 2016; Truffer and Motyka, 2016).
On the continental shelf, a shallow layer of fresh, cold water of Polar origin to overlay a layer of warm, salty Atlantic Water (Figure 7). At depths greater than about 150 m, and with temperatures ranging from 1 to 6°C, Atlantic Water can interact directly with glaciers that terminate in waters deeper than about 200 m. The presence of this water enhances melt at the glacier face, which can increase calving and result in retreat and acceleration of glacier mass loss, driving sea levels higher. Because the Atlantic water usually sits more than 100 m beneath the ocean surface, remote sensing techniques are not effective in detecting it, and in situ observations are required to monitor Atlantic Water on the shelf.
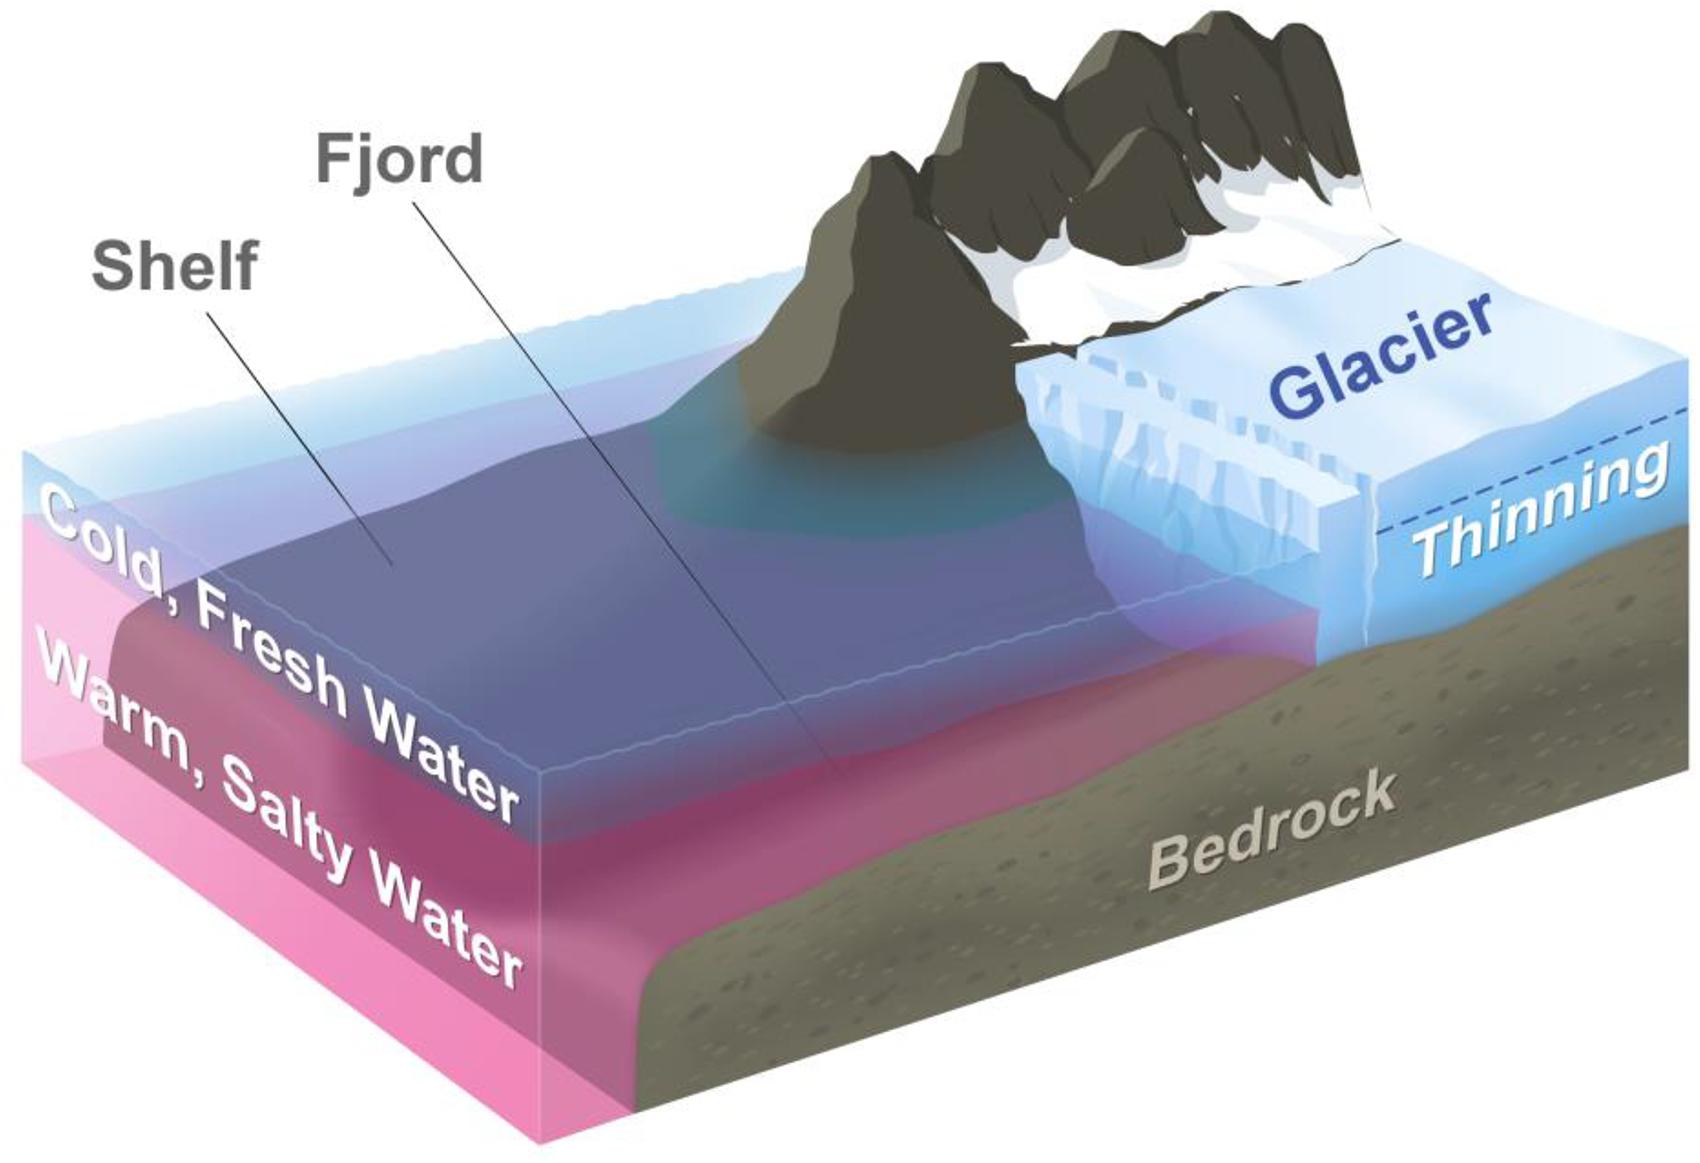
Figure 7. Typical configuration of a marine terminating glacier in Greenland. The layer of cold, fresh Arctic water poses little threat to these glaciers, which usually terminate in a near-vertical face. However, glaciers sitting in water that is greater than about 250 m can encounter warm, salty water from the Atlantic. This accelerates melt and can result in glacier retreat and sea level rise. Currently, there is no system for monitoring the temperature or thickness of this warm salty layer, which is found nearly everywhere on the continental shelf and in fjords surrounding the entire island.
Despite its importance, there is no planned or existing observing system to measure the volume and extent of warm, salty Atlantic Water on the shelves surrounding Greenland. As a result, ocean forcing of ice loss from Greenland’s more than 200 marine terminating glaciers may go unmeasured in the decades to come. NASA has undertaken a 5-year airborne campaign called Oceans Melting Greenland (OMG) that is designed to fill this gap from 2016 to 2020 (Fenty et al., 2016). Once per year surveys of temperature and salinity profiles with approximately 50 km spatial resolution are carried out as a part of OMG, with enhanced sampling in deep troughs and depressions on the shelf. While short-term variability clearly exists in many places on the shelves and in glacial fjords, interannual increases in the amount and temperature of warm water on the shelf have been suggested as a driver of enhanced ice loss from the glaciers (Holland et al., 2008; Straneo and Heimbach, 2013).
This suggests that a broad-scale survey of ocean temperatures and salinities on the continental shelf may be necessary, at least in key regions like southeast and northwest Greenland where ocean-ice interactions are thought to be most important. Such a survey would have to augment existing efforts to monitor key glaciers and straights with moorings and other in situ instruments. A combination of ship-surveys, gliders and autonomous floats (such as the air-deployable Alamo floats) may be necessary to cover key regions effectively.
Case Study: Southern Ocean
The Southern Ocean is an essential piece of the global ocean heat uptake, Earth Energy Imbalance and global warming, and is associated with some of the world’s ocean largest deep-reaching freshwater storage changes (e.g., Durack and Wijffels, 2010; Durack et al., 2012; Rhein et al., 2013; Roemmich et al., 2015). Its complex circulation connecting most of the world’s ocean deep water-masses to the sea surface makes it a unique place on Earth for the transport and storage of heat and freshwater anomalies to great depths where such anomalies are then stored for decades to millennia (DeVries et al., 2011).
In stark contrast with its pivotal role for the global HC and FWC (and other tracers such as carbon) budgets, the Southern Ocean has remained poorly observed compared to other ocean basins (Sallée, 2018). Specific challenges keep the observation system from growing as fast as in other basins: the difficulty of access to these regions, the vastness of the ocean basin, and presence of sea-ice in large part of the domain, which makes ship-based observation complex and expensive, prevents satellite-based observation of the ocean surface, as well as satellite communication with autonomous platforms. Ship-based observations of heat and salt remain infrequent and seasonally biased, being largely limited to quasi-decadal summer repeats of a few repeat hydrographic sections. Nevertheless, the development of the international Argo Program has revolutionized the sampling of the upper 2000 m of the Southern Ocean. Argo observations have no seasonal biases, but they are still sparse in the region poleward of the Antarctic Circumpolar Current, where sea-ice cover is a challenge for their survival and for data recovery. Moreover, Argo coverage does not yet include the deep seas below 2000 m. The current development of networks of ice-capable Argo floats (Klatt et al., 2007), and Deep-Argo floats promises great advances in the sampling of the Southern Ocean in the coming decades. In addition, the development of observations from animal-born sensors have considerably increased the sampling of the upper ocean (upper 500 m) under sea-ice over the last decade (Treasure et al., 2017), but the accuracy of such observations is still limiting their usefulness in studies seeking to detect subtle long-term change.
Despite these sampling challenges, the current observation system has allowed documenting clear and significant changes HC and FWC changes in the Southern Ocean. It is estimated that the Southern Ocean has accounted for 30–50% of the 0–700 m ocean HC change since 1970 (Smith and Murphy, 2007; Domingues et al., 2008; Ishii and Kimoto, 2009), while the Southern Ocean only represents 30% of the world’s ocean surface. In addition, recent work suggests that the Southern Ocean heat storage in these estimates might be biased low as a result of the sparse sampling of the Southern Hemisphere, and it is hypothesized it may instead represent around 60% of the global ocean HC trend since 1970 (Durack et al., 2014). Estimates in the most recent period, which is better observed by autonomous profiling floats, suggest that the Southern Ocean contribution to the global 0–2000 m HC climbs to 67–98% for the period 2006–2013, with a clear peak in the latitude band of the Antarctic Circumpolar Current or north of it (30–50°S; Figure 3C; Roemmich et al., 2015; Llovel and Terray, 2016; Durack et al., 2018; Sallée, 2018).
The significant HC of the Southern Ocean is, however, spatially inhomogeneous (Sallée, 2018). In particular, the surface layer of subpolar seas stands out as a region where temperatures are relatively stable, or even slightly cooling (e.g., Armour et al., 2016; Sallée, 2018; Figure 8), and associated with a marked freshening (Durack and Wijffels, 2010; Rhein et al., 2013; de Lavergne et al., 2014). The freshening trend might be associated to a regime shift in sea-ice growth/melt (Haumann et al., 2016), and accelerated melt of the Antarctic ice-sheet (Schmidtko et al., 2014), leading to an increase of the stratification, isolating surface waters from the relatively warmer underlying waters (Sallée, 2018). This increased stratification may possibly lead to an increase HC accumulation in the Circumpolar Deep Water layer, directly below the surface layer in the subpolar seas (Lecomte et al., 2017). However, the processes associated with temperature and salinity changes in the subpolar seas remains difficult to disentangle given the short and incomplete nature of the observed time-series.
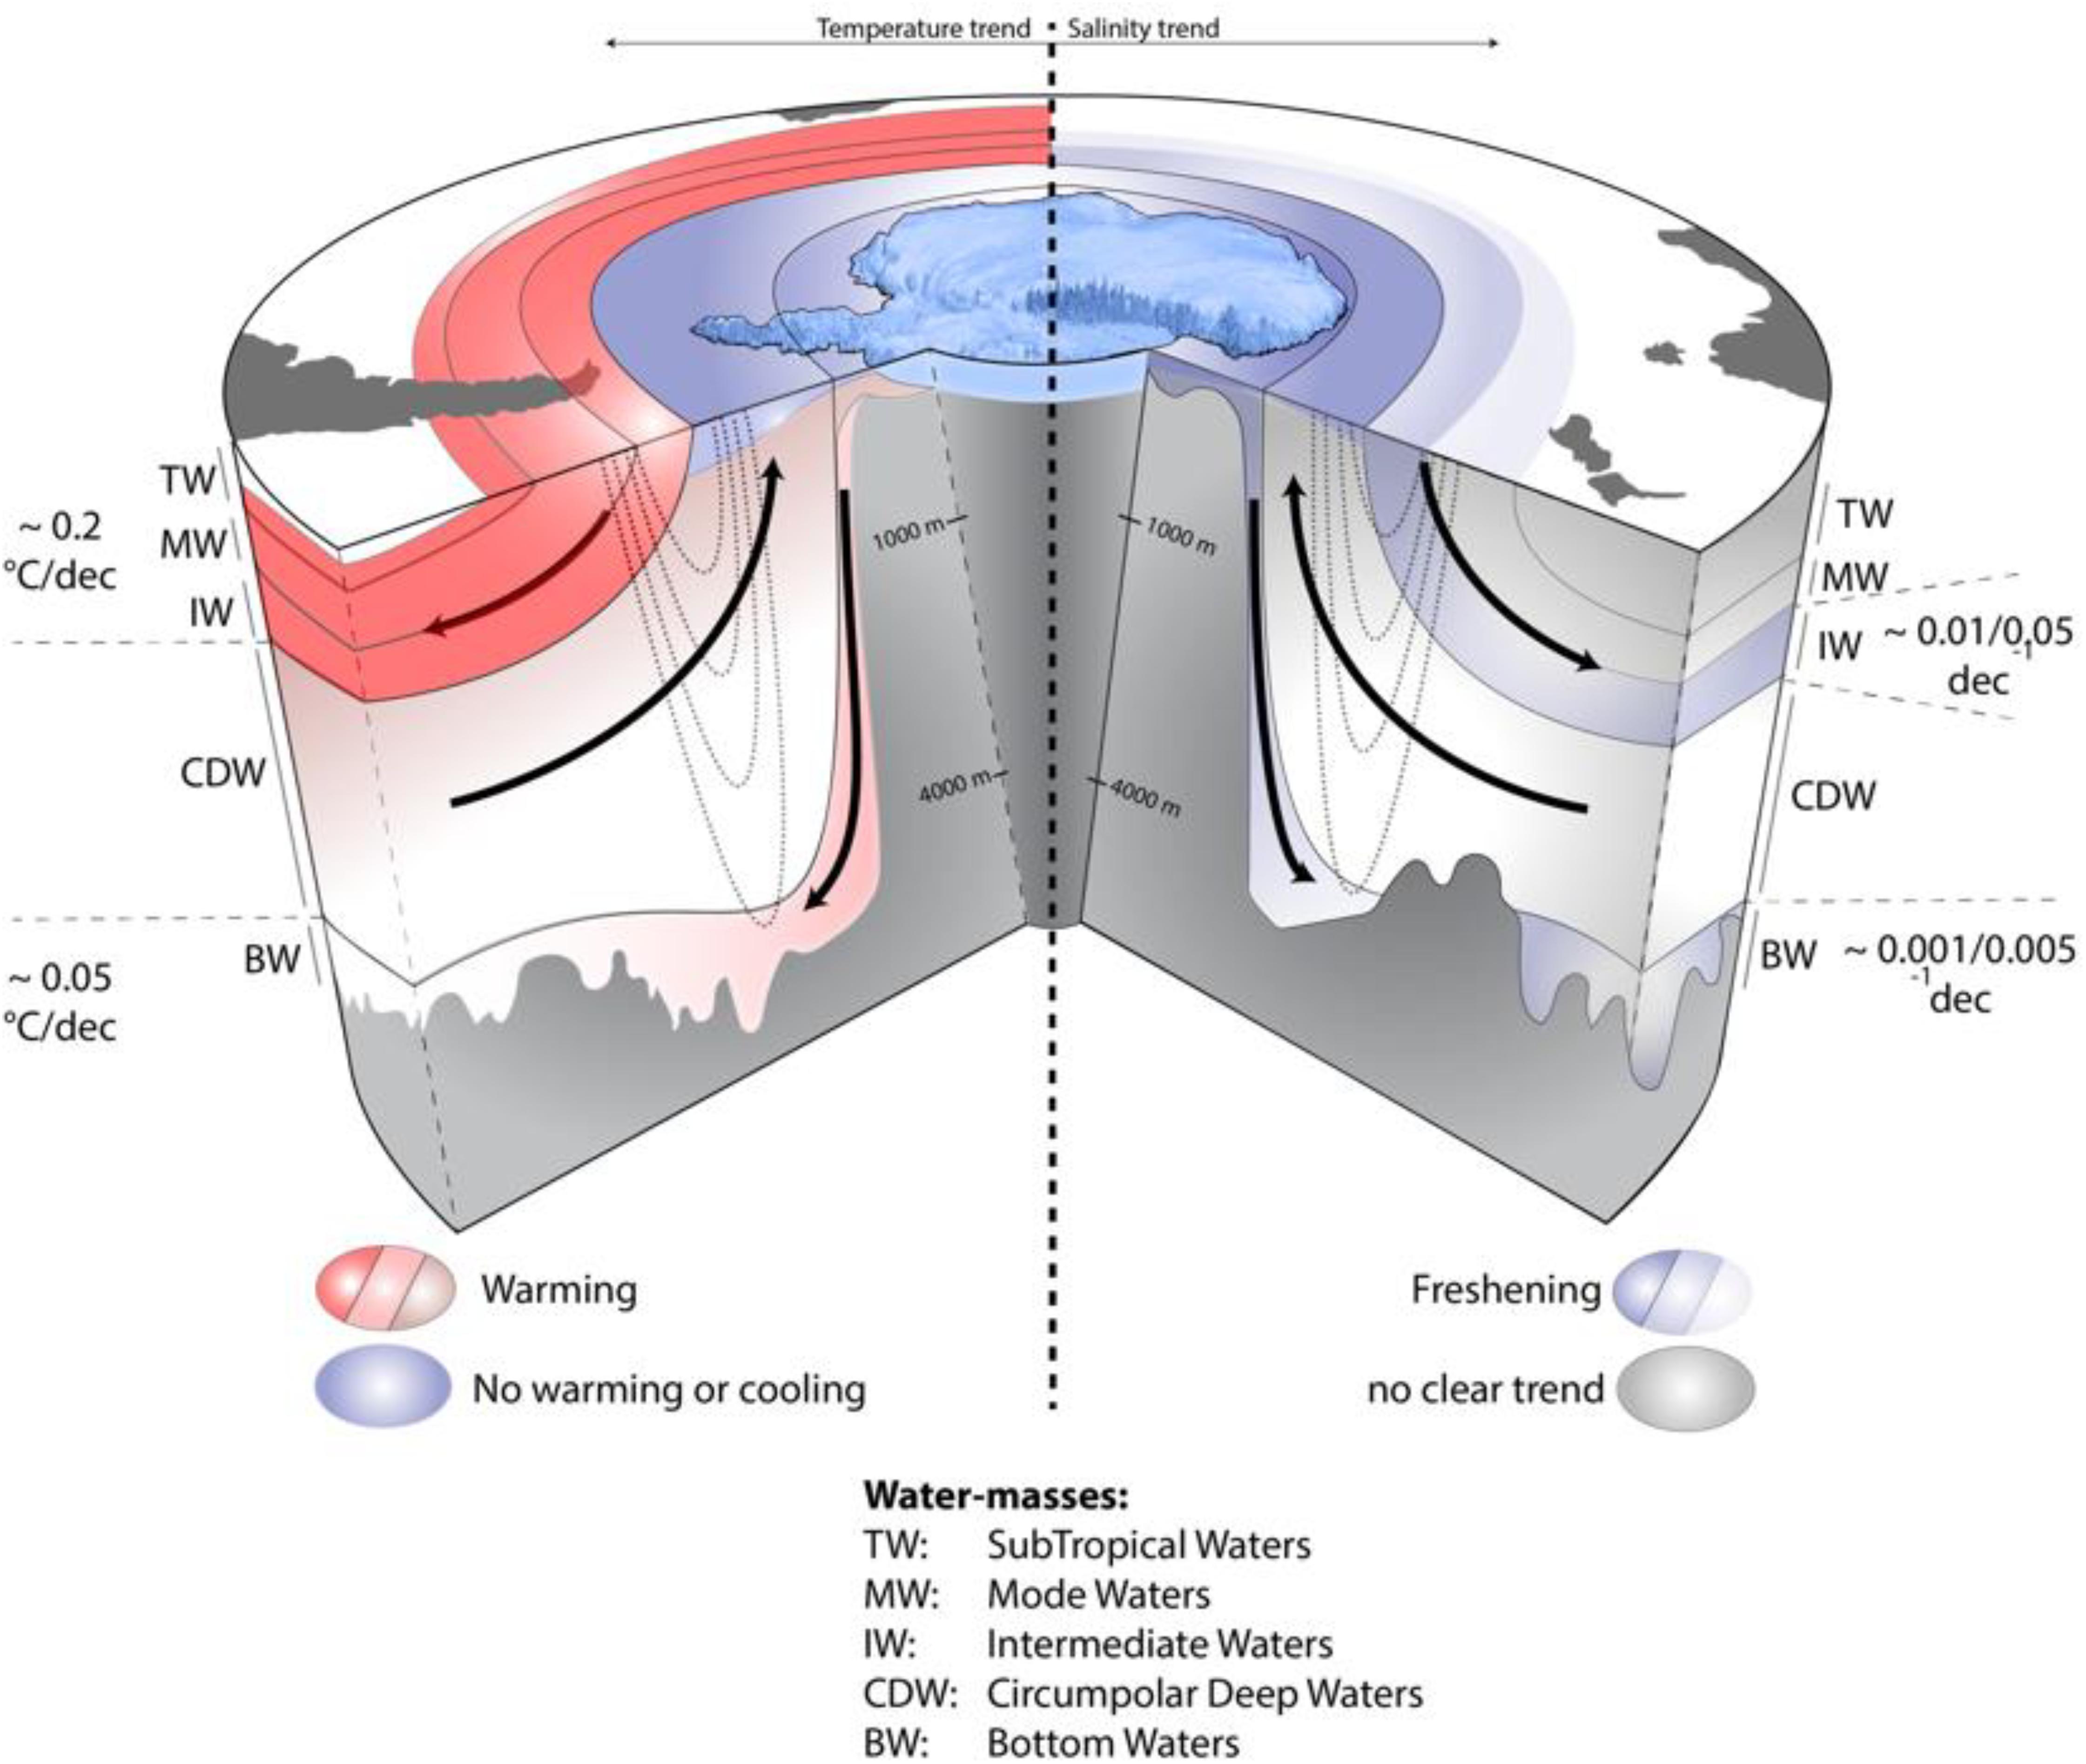
Figure 8. Schematic showing temperature and salinity trends in different layers of the Southern Ocean. The layers are defined as main water-masses of the Southern Ocean: subtropical water (TW), mode water (MW), intermediate water (IW), circumpolar deep water (CDW), and bottom water (BW). Black arrows show the main overturning pathways in the basin, and the dashed black contours show a vertical slice of the deep-reaching Antarctic Circumpolar Current circulating clockwise around the Antarctic continent. Adapted from Sallée (2018, Figure 1).
The delayed warming of the subpolar seas creates a disequilibrium with the warming atmosphere, which tends to make the subpolar seas a region of large HC uptake (Frölicher et al., 2015). The heat taken up in the subpolar seas is then transported northward and accumulate within and north of the Antarctic Circumpolar Current, in the first 1 km of the water column which is well ventilated (Mode and Intermediate Waters; Figure 8). Strong warming at a rate of ∼0.2°C/decade is observed in this region of the Southern Ocean (Böning et al., 2008; Gille, 2008; Giglio and Johnson, 2017). Similarly, the freshening trend observed in the subpolar seas, propagates with the northward and downward circulation, within the Antarctic Circumpolar Current, in the AAIWs ventilated in the first 1 km of the water column (Figure 8; Durack and Wijffels, 2010).
The abysses of the Southern Ocean are also associated with significant warming and freshening trends of order of 0.05°C/decade, and 0.001–0.005 PSS-78/decade (Purkey and Johnson, 2012, 2013; Shimada et al., 2012; Jullion et al., 2013; van Wijk and Rintoul, 2014). However, these regions are the least well observed, and it remains hard to distinguished between natural and forced variability. It is however likely that these trends are explained by changes of ocean properties in the Antarctic coastal region, where bottom water forms (Jacobs and Giulivi, 2010; Masuda et al., 2010; Johnson et al., 2014; van Wijk and Rintoul, 2014).
Potential change of the circulation might also impact Southern Ocean HC and FWC. Several studies have discussed the possibility of an acceleration of the upper meridional overturning circulation as a results of increase winds (Southern Annular Mode), with increased volume of mid-depth waters (CDW) upwelled south of the Antarctic Circumpolar Current, and increased volume of water subducted north of the Antarctic Circumpolar Current (Le Quéré et al., 2009; Waugh et al., 2013; DeVries et al., 2017). If such change of the circulation is still debated, it would increase even more Southern Ocean HC and FWC accumulation in the upper ventilated layers (mode and intermediate waters; Figure 8). Other studies have discussed the possibility of a change in the ventilation of the abysses, caused by increased stratification due to freshening of the surface ocean in the subpolar seas. While still unclear, oxygen observations tend to argue for a persisting ventilation of the abysses (van Wijk and Rintoul, 2014). However, the short and incomplete nature of existing time series still makes the causes and consequences of the observed HC and FWC changes difficult to assess.
The deployment of the Southern Ocean Argo array in 2004 revolutionized Southern Ocean research. This array has revealed the changes discussed above, which are occurring across all distinct dynamical regimes of the Southern Ocean. Yet challenges attributing the causes of these changes remain. Remoteness and ice-cover have resulted in significant observational gaps in the subpolar regions. Meanwhile strong interannual variability combined with high-levels of internal variability occurring on short spatial scales reduce the confidence in some diagnosed trends. Continued and expanded coverage over the coming decades will allow better quantification of the trends and attribution to their causes, which is a priority for documenting and understanding global ocean HC and FWC.
Discussion
Evaluation of the potential spatiotemporal characteristics of the emergent climate change signals is a key element in the assessment of the adequacy of the ocean observing system. While the emergent patterns of climate change are uncertain (both in terms of spatial pattern and magnitude), they are associated with a large-scale coherent ocean responses and features that typically extend over several degrees of longitude/latitude or more (see section “Projected Changes in Ocean Heat and Freshwater Content”). In this regard, the nominal 3° × 3° sampling of Argo should be sufficient to capture these emergent signals in the upper 2000 m ocean. In addition to the surface-intensified upper ocean warming, model simulations, observations and theory all support the expectation of a deep and bottom-intensified signature of ocean climate change associated with deep and bottom water formation and transport processes. A recent observing design study for a deep Argo array (based on high quality repeat ship sections from the GO-SHIP observing network) to monitor basin-scale deep ocean temperature trends suggests that a 5° × 5° spatial sampling and 15-day repeat cycle should be sufficient (Johnson et al., 2015). Likewise, observational data of adequate quality can be acquired with moored instrumentation (OceanSITES observing network). For the deep ocean, given the absence of a large amplitude seasonal cycle and wave signals (White, 1995), a spatially homogenous grid is not mandatory and a multiplatform observing approach is feasible.
In addition to the persistent anthropogenic greenhouse gas forcing, we know from historical observations that the total radiative forcing has been punctuated by the short-lived cooling effects of major volcanic eruptions (Figure 9). Future volcanic eruptions will no doubt play an important role in the future climate change and quantifying their effects on the Earth system is an important element of our understanding of radiative forcing. The strong negative radiative forcing of a major volcanic eruption has an associated timescale of 1–2 years and has a distinct signature in ocean warming (e.g., Gleckler et al., 2016). While satellite-based sensors are best placed to capture the magnitude of volcanic radiative forcings, quantifying the ocean three-dimensional response requires resolving the spatial patterns of regional ocean HC and FWC on sub-annual timescales.
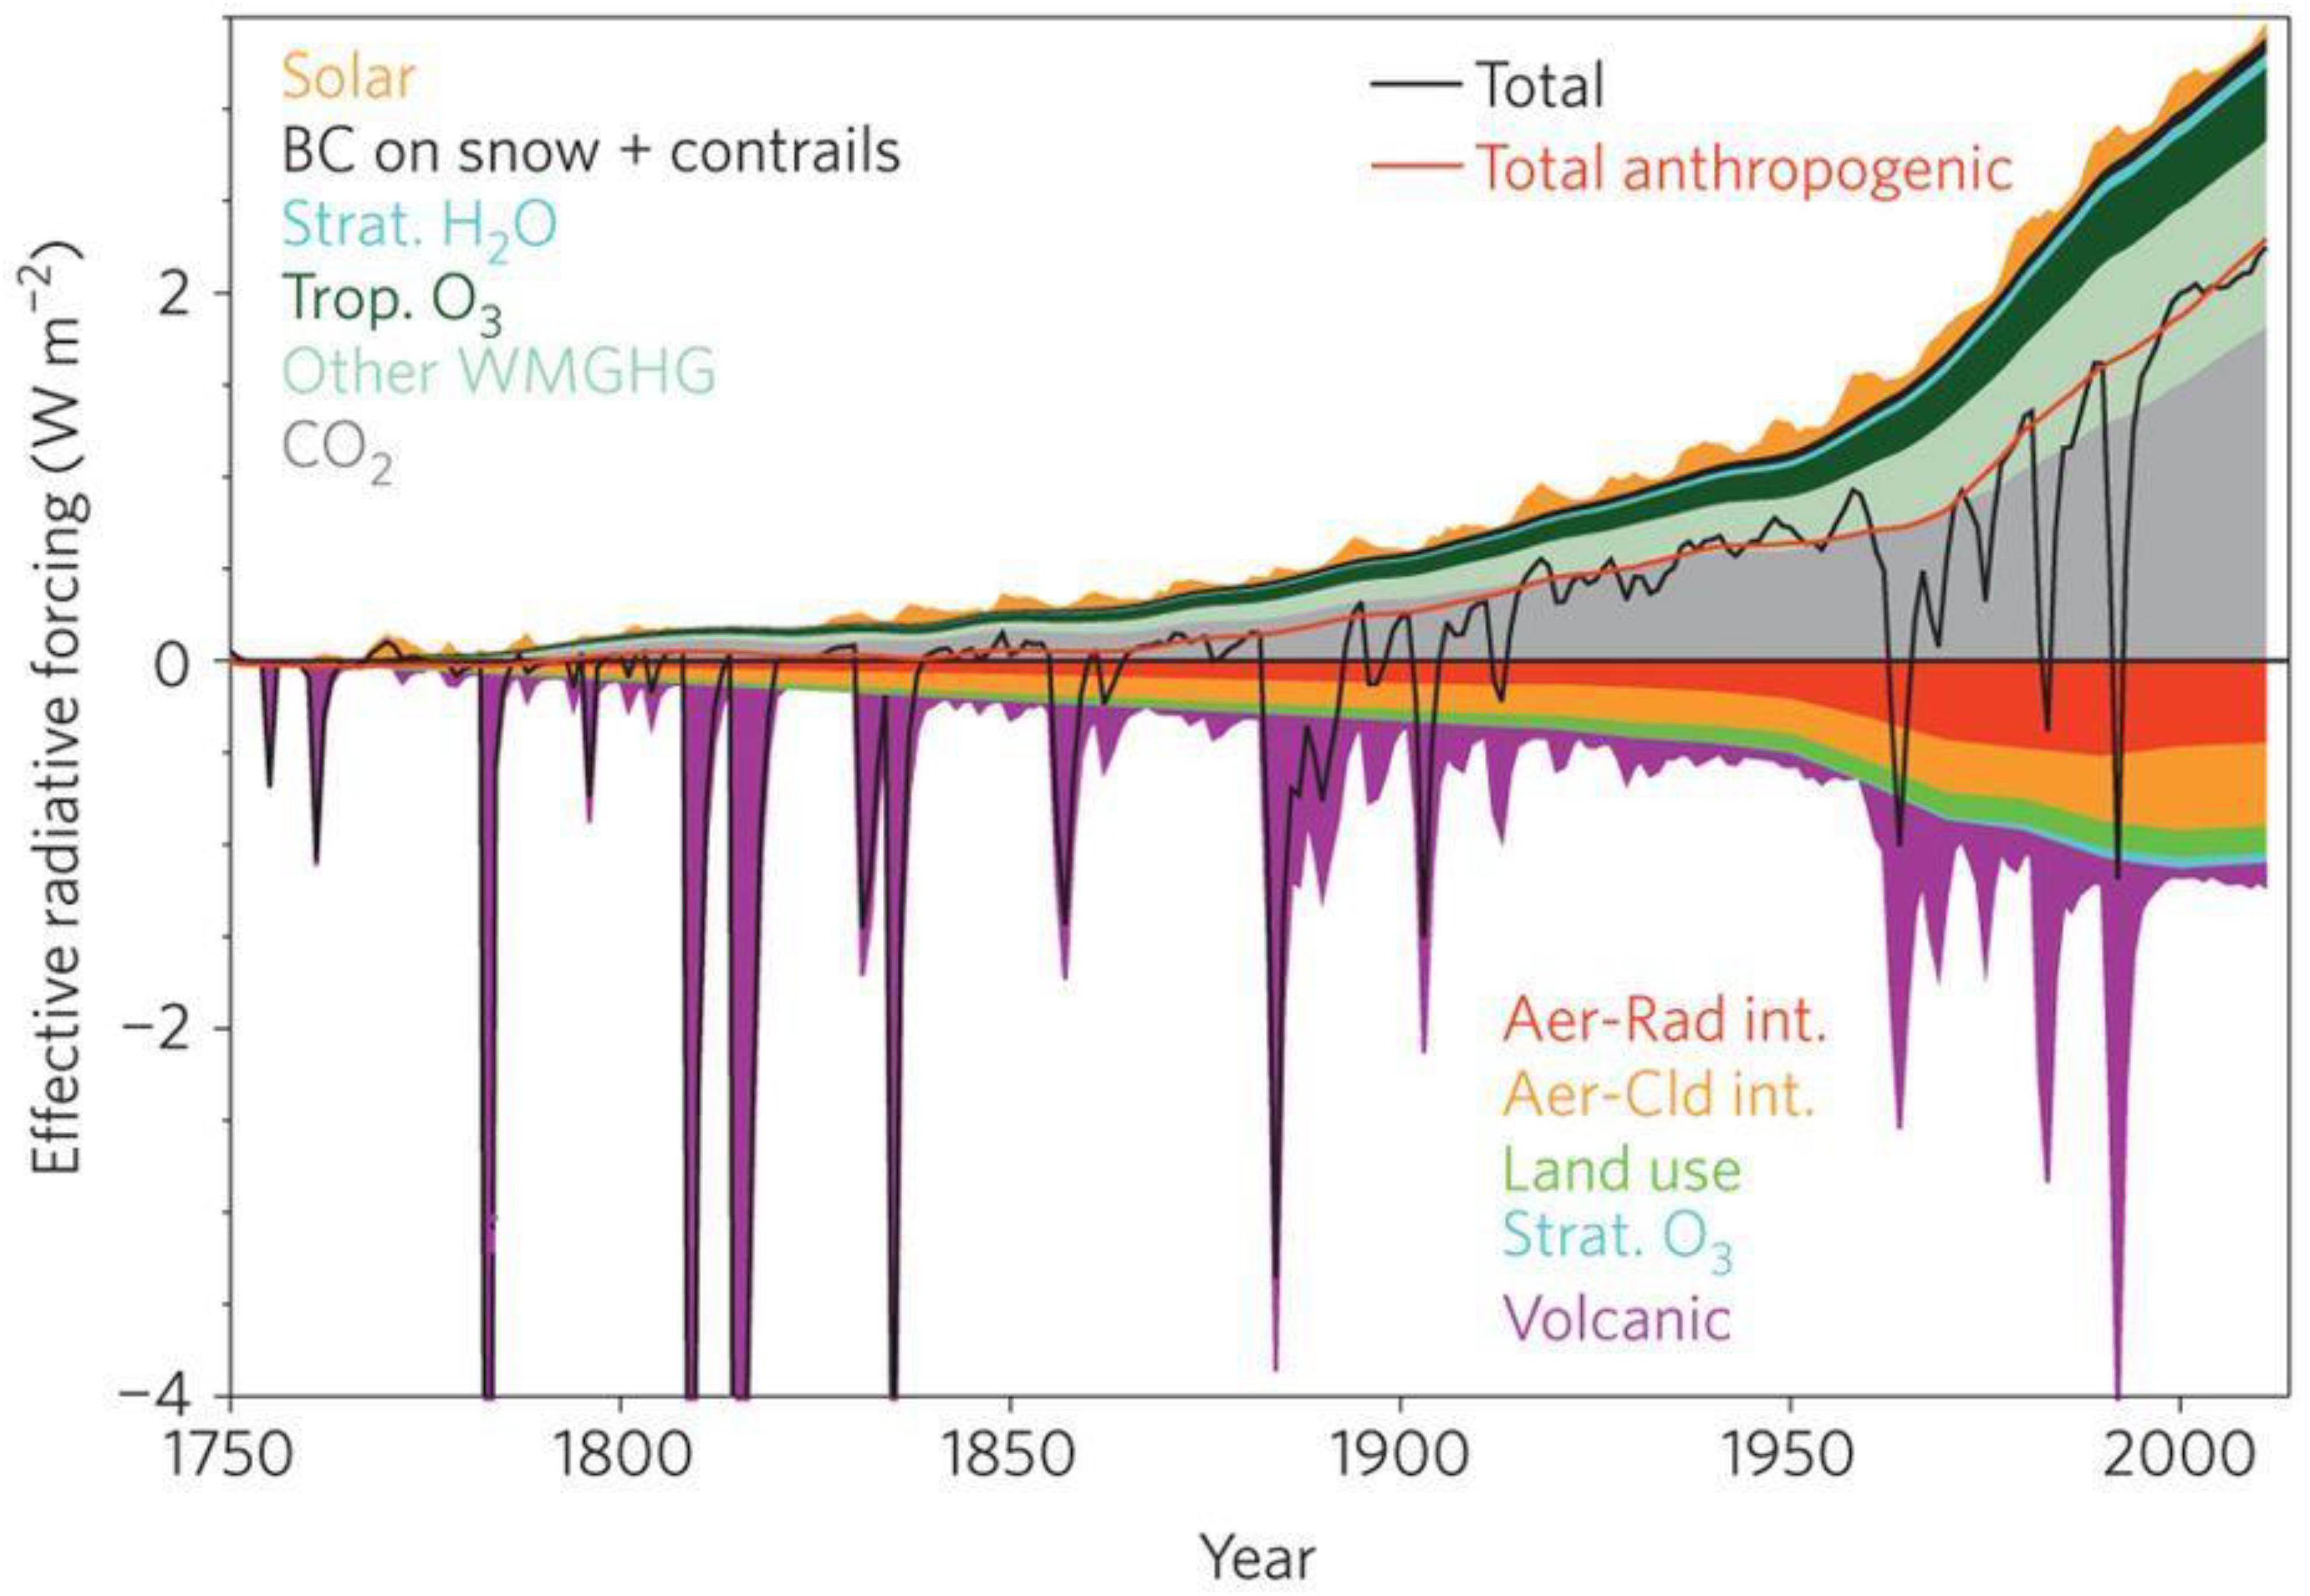
Figure 9. An estimate of the radiative forcing of the climate system since 1750, including both natural (solar and volcanic) and anthropogenic climate forcings. Aer-Rad int. = aerosol–radiation interaction; Aer-Cld int. = aerosol–cloud interaction; BC = black carbon; Strat. = stratospheric; Trop. = tropospheric; WMGHG = well-mixed greenhouse gases. Reproduced from von Schuckmann et al. (2016, Figure 1).
The operational oceanography community has been particularly active in assessing the utility of the contemporary ocean observing system using a variety of ocean modeling and data assimilation systems (e.g., Oke et al., 2015; Gasparin et al., 2019). However, these efforts are often focused on short time-horizons (e.g., 1–2 years) and therefore can provide limited insights into the observing system capability for constraining longer-term climate variability and change. Climate and ocean model simulations have the potential to offer insights into observing system capability on longer time horizons. One such approach is by extracting “synthetic profiles” from these model simulations, i.e., model data with the same sampling characteristics as the real observations, in order to assess our ability to constrain both integrated quantities (such as global HC) and spatial patterns of change (e.g., Allison et al., 2019). The main innovation in this approach compared to previous efforts (e.g., Gregory et al., 2004; AchutaRao et al., 2006, 2007) is that the synthetic data can be ingested directly into the same mapping methods as used on the real observations and assessed by comparison with model “truth” fields. This type of approach may add substantial value to observation-based observing system assessments, particularly when considering future observing strategies in the presence of climate variability and change. Coordinated multi-system experiments are required to promote robust findings and used alongside analyses of observations and theoretical considerations, with full cognizance of any model biases limitations of model physics.
The challenge of funding and maintaining the ocean observing system has been discussed for decades, with mixed progress in establishing persistent funding sources and assigning custodial responsibilities (e.g., Baker et al., 2007; Wunsch et al., 2013; Wunsch, 2016; National Academies of Sciences Engineering and Medicine [NASEM], 2017; Weller et al., 2019). It is a human imperative, that these observing networks are protected, maintained and augmented, with increasing pressures accumulating on their continuation (e.g., Durack et al., 2016).
Sparsity of measurement coverage poses a primary limitation to improving our observed understanding, and validating and improving model representations of the physical world. Observational coverage becomes more valuable the longer, more complete, and more accurate the measurements become, with multi-platform, overlapping and complementary coverage the ultimate aim for any observing array. The Argo program has provided a step change that has turbo-charged progress and considerably improved our ability to monitor, understand, simulate and validate the physical world in respect to ocean heat and freshwater variability in the upper 2000 m.
While great progress in physical ocean observing have been made in the last decades, sponsor agency priorities and funding pressures ensure that the observing array remains on tenterhooks. The success of the core physical Argo Program (see Roemmich et al., 2019), and the 30 contributing countries, has led to additional programs such as biogeochemical Argo which was initiated in 2012, however for the most part the funding sources of these networks primarily originate from identical agencies leading to competition for maintenance and augmentation of core Argo. There is a growing acknowledgment that the marine biological community needs to pay attention to the physical drivers of the system (e.g., Bates et al., 2018), however funding challenges remain while agency and country budgets are constrained, and the coordination of the physical and biological communities takes considerable work. In addition, most funding for the physical Argo network comes from fluctuating and competitive research-based grants, which are difficult to predict and maintain year-to-year, and consequently the near-term outlook for Argo core coverage is a significant cause for concern (see Figure 10).
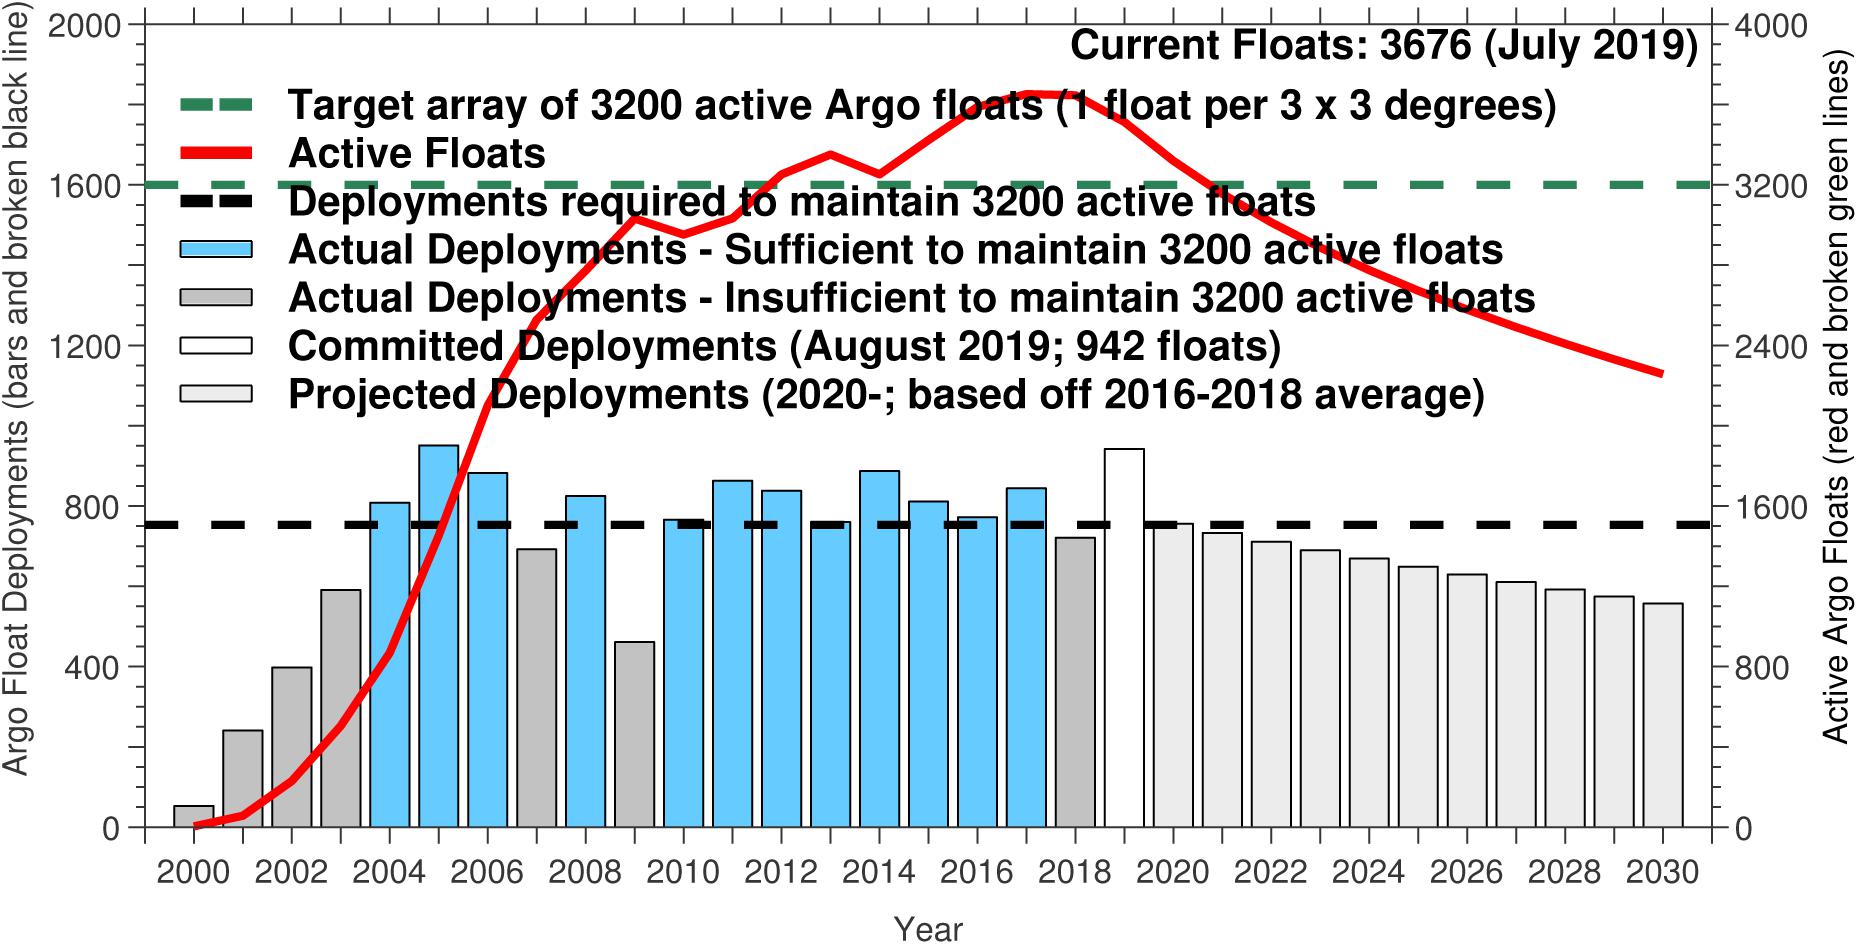
Figure 10. The time history of Argo Programme deployments since 2000, and float coverage projections into the future assuming a business as usual funding scenario across the 30 partner countries. The broken green line shows the target 3200 active Argo float (right y-axis), since 2010 this target was met, but deployments dropped below this value in 2018. The broken black lines show the ∼800 float annual deployments required (left y-axis) to maintain the 3200-strong array. If additional deployments are not prioritized, the array will start falling beneath the deployments required to maintain the 3200-strong global target array in ∼2021, with a continuing degradation of the array from 2022 onward (based off the average deployments from the last 3 years 2016–2018; updated from Durack et al., 2016). The expansion of the program to include BioArgo and Deep Argo needs to be prioritized in a way that preserves the physical observing capability of the core array.
The situation is similar with GO-SHIP, the ship-based observing network. Currently 10 nations share responsibility for the 62 repeat transects covering the global ocean (Sloyan et al., 2019). GO-SHIP is focused on increasing the number of participating nations to maintain the program due to the continued pressure by the realignment of national research priorities of the partner nations. While the current decadal survey is planned up to 2023, fewer cruises are committed when contrasted with previous decades. This is particularly concerning as Deep Argo spins up, because GO-SHIP measurements are the only source of the key deep observations that allow calibration drift of the remote sensors to be evaluated. Without GO-SHIP measurements, it will not be clear whether a large change in deep ocean temperature and/or salinity recorded by a remote Argo float is real or whether a problem with the developing equipment, with cross-platform consistency checks an imperative to ensure accuracy and utility of the observing network.
Stresses on marine ecosystems are likely to increase into the future, with a recent works suggesting that marine heatwaves are becoming more prevalent and intense and this trend is expected to continue into the future (e.g., Frolicher et al., 2018) alongside their terrestrial counterparts (e.g., Perkins, 2015). For this reason, our future observing array must be capable of addressing relevant questions now, as well as those questions which may be posed into the future.
Recommendations
• It is essential that the core physical (temperature and salinity) Argo array of autonomous profiling floats be maintained at current levels to preserve the 3 × 3 degree near-global coverage and monitor heat and freshwater changes in the 0–2000 m open ocean. Current evidence suggests this sampling density provides near-global coverage at the monthly frequency which will capture emergent climate change signals and provide initial conditions for seasonal-to-decadal prediction systems. Any expansion of Argo to observe deep, biogeochemical or other ocean properties must occur whilst preserving this core physical array.
• It is essential that the full-depth hydrographic sections sampled by GO-SHIP are maintained and augmented, enabling a linkage between physical ocean variables to biogeochemical and ecosystem changes, and provide key calibration data for emerging deep autonomous observations.
• It is essential that mooring arrays such as the AMOC, and the tropical Pacific TAO-TRITON as well as moorings that provide global ocean circulation “choke point” measurements (e.g., Indonesian Throughflow/ITF, Arctic gateways) be preserved to provide insights on inter-basin transports, along with estimates of heat and freshwater variability and the ability to close regional and global budgets.
• Satellite measurements of sea-surface height, ocean mass, sea surface temperature and sea surface salinity must be maintained in order to monitor and understand the origins of regional sea level variability and change driven by changing ocean heat and freshwater.
• In order to promote combined observational and model analysis, the international research community should continue to improve data interoperability through implementing data standards (e.g., CF conventions), and supporting current and future host platforms such as the Earth System Grid Federation (ESGF4) and the observations for Model Intercomparisons Project (obs4MIPs5). In addition, data streams should be implemented to be near real-time (similar to Argo) to facilitate data usage by seasonal and decadal forecasting activities.
• It is essential that the Deep Argo Program (>2000 m) be developed and implemented in coordination with core physical Argo, and GO-SHIP (which provides deep measurement calibration). The Southern and Atlantic Oceans are highlighted in model and observational analyses, as the regions where signals will first emerge and so deployments should be prioritized for these regions.
• Coordinated efforts are required to sample regional seas, continental shelves, near-coastal and subpolar regions to elucidate terrestrial-ocean interactions and allow global budget closure for heat and freshwater. In particular a focus on the upper 1500 m of continental slopes is required to constrain AMOC estimates, and better categorizing WBCs HC and variability, as well as the large air–sea interactions that occur in these regions. To progress this agenda we call for a dedicated working group to be formed to facilitate developed and developing nations to achieve these goals in their corresponding regions.
• Targeted observational campaigns are needed to promote understanding of the ocean forcing of ice mass loss from the polar ice sheets (Greenland and Antarctica), which represent a key uncertainty in projections of future global and regional sea level rise.
• Understanding ocean forcing of Greenland and Antarctica requires additional surveys of temperature and salinity on the continental shelves. A combination of airborne and ship-based surveys, gliders and autonomous floats (such as the air-deployable Alamo floats) may be necessary to cover key regions effectively.
• In the Arctic Ocean, additional observations are required to improve monitoring of the seasonal cycle and interannual variability in liquid FWC. These observations should exploit emerging technologies, such as ITP, drifting profilers and seafloor-moored systems. The conditions under which each of these systems can operate dictate the use of different modern instrumentation in conjunction with traditional CTD surveys carried out by research icebreakers.
• Improvements in satellite retrieval algorithms and innovation in technology (e.g., multi-frequency sensors as opposed to be L-band only sensors) are necessary to reduce the uncertainty of satellite sea surface salinity in the Arctic Ocean to facilitate the studies of Arctic Ocean freshwater changes.
• Ocean and climate model simulations provide an opportunity to test and prototype proposed changes to the observing system, and to set priorities for future network development. The use of model-derived “synthetic observations” is a promising approach that should be further exploited.
Author Contributions
MP and PD led the writing of the manuscript. KH led the coordination of group discussions and teleconferences during the writing process. All authors made contributions via discussions or by writing text and figures.
Funding
MP was supported by the Met Office Hadley Centre Climate Programme funded by the BEIS and Defra, and the European Union’s Horizon 2020 Research and Innovation Program under grant Agreement No. 633211 (AtlantOS). The work of PD was prepared the by Lawrence Livermore National Laboratory (LLNL) under Contract DE-AC52-07NA27344 and is a contribution to the U.S. Department of Energy, Office of Science, Climate and Environmental Sciences Division, Regional and Global Modeling and Analysis Program. LLNL Release number: LLNL-JRNL-761158. BS and JC was partially supported by the Centre for Southern Hemisphere Oceans Research, a joint research center between the QNLM and the CSIRO. BS was also supported by the Australian Government Department of the Environment and CSIRO through the National Environmental Science Program. SC was supported by the IRD and by the French national program LEFE/INSU. SC thanks W. Kessler for suggestions concerning Figure 6. BR was supported by the German Alfred-Wegener-Institut Helmholtz-Zentrum für Polar-und Meeresforschung (AWI). J-BS was supported by the CNRS/INSU and the Horizon 2020 Research and Innovation Program under Grant Agreement 637770. SS was supported by the French Institutions ENS, LMD, IPSL, and CNRS/INSU. The work of JW was performed in part at the Jet Propulsion Laboratory, California Institute of Technology, under contract with the National Aeronautics and Space Administration.
Conflict of Interest Statement
The authors declare that the research was conducted in the absence of any commercial or financial relationships that could be construed as a potential conflict of interest.
Acknowledgments
This manuscript contributes to an ongoing GCOS-GOOS-WCRP Ocean Observations Physics and Climate Panel led review of the Observing System for tracking Ocean Heat and Freshwater Content in support of the Global Climate Observing System (GCOS) and the Global Ocean Observing System (GOOS). The work presented here draws on community efforts of the International Quality Controlled Ocean Database initiative (IQuOD; www.iquod.org), which is sponsored by the Scientific Committee on Oceanic Research and the International Oceanographic Data and Information Exchange program of the Intergovernmental Oceanographic Commission (IOC).
Footnotes
- ^ https://www.pmel.noaa.gov/elnino/upper-ocean-heat-content-and-enso
- ^ http://www.whoi.edu/itp/
- ^ https://www.awi.de/en/science/biosciences/deep-sea-ecology-and-technology/observatories/fram-ocean-observing-system.html
- ^ https://esgf.llnl.gov/
- ^ https://esgf-node.llnl.gov/projects/obs4mips/
References
Abraham, J., Baringer, P. M., Bindoff, N. L., Boyer, T., Cheng, L. J., Church, J. A., et al. (2013). A review of global ocean temperature observations: implications for ocean heat content estimates and climate change. Rev. Geophys. 51, 450–483. doi: 10.1002/rog.20022
AchutaRao, K. M., Santer, B. D., Gleckler, P. J., Taylor, K. E., Pierce, D. W., Barnett, T. P., et al. (2006). Variability of ocean heat uptake: reconciling observations and models. J. Geophys. Res. 111 doi: 10.1029/2005JC003136
AchutaRao, K. M., Ishii, M., Santer, B. D., Gleckler, P. J., Taylor, K. E., Barnett, T. P., et al. (2007). Simulated and observed variability in ocean temperature and heat content. Proc. Natl. Acad. Sci. U.S.A. 104, 10768–10773. doi: 10.1073/pnas.0611375104
Allison, L. C., Roberts, C. D., Palmer, M. D., Killick, R., Hermanson, L., and Rayner, N. A. (2019). Towards quantifying uncertainty in ocean heat content changes using synthetic profiles. Env. Res. Lett. 14:8. doi: 10.1088/1748-9326/ab2b0b
Arbic, B. K., and Owens, W. B. (2001). Climatic warming of Atlantic intermediate waters. J. Clim. 14, 4091–4108. doi: 10.1175/1520-0442(2001)014<4091:cwoaiw>2.0.co;2
Armitage, T. W. K., Bacon, S., Ridout, A. L., Thomas, S. F., Aksenov, Y., and Wingham, D. J., (2016). Arctic sea surface height variability and change from satellite radar altimetry and GRACE, 2003-2014. J. Geophys. Res. Oceans 121, 4303–4322. doi: 10.1002/2015JC011579
Armour, K. C, Marshall, J., Scott, J., Donohoe, A., and Newsom, E. R. (2016). Southern ocean warming delayed by circumpolar upwelling and equatorward transport. Nat. Geosci. 9, 549–554. doi: 10.1038/ngeo2731
Balmaseda, M. A., Kumar, A., Andersson, E., Takaya, Y., Anderson, D., Janssen, P., et al. (2014). “Operational forecasting systems,” in Proceedings of the Report of the Tropical Pacific Observing System 2020 Workshop (TPOS 2020), Vol. II. (San Diego, CA: Scripps Institution of Oceanography), 64–101.
Balmaseda, M. A., Hernandez, F., Storto, A., Palmer, M. D., Alves, O., Shi, L., et al. (2015). The ocean reanalyses intercomparison project (ORA-IP). J. Oper. Oceanogr. 7, 81–99
Baker, D. J., Schmitt, R. W., and Wunsch, C. (2007). Endowments and new institutions for long-term observation. Oceanography 20, 10–14. doi: 10.5670/oceanog.2007.19
Barnston, A. G., Tippett, M. K., L’Heureux, M. L., Li, S., and Dewitt, D. G. (2012). Skill of real-time seasonal ENSO model predictions during 2002-11: is our capability increasing? Bull. Am. Meteorol. Soc. 93, 631–651. doi: 10.1175/BAMS-D-11-00111.1
Bates, A. E., Helmuth, B., Burrows, M. T., Duncan, M. I., Garrabou, J., Guy-Haim, T., et al. (2018). Biologists ignore ocean weather at their peril. Nature 560, 299–301. doi: 10.1038/d41586-018-05869-5
Belkin, I. M. (2004). Propagation of the “great salinity anomaly” of the 1990s around the northern North Atlantic. Geophys. Res. Lett. 31:L08306. doi: 10.1029/2003GL019334
Berger, M., Camps, A., Font, J., Kerr, Y., Miller, J., Johannessen, J. A., et al. (2002). Measuring ocean salinity with ESA’s SMOS mission - advancing the science. ESA Bull. 111, 113–121.
Böning, C. W., Dispert, A., Visbeck, M., Rintoul, S. R., and Schwarzkopf, F. U. (2008). The response of the antarctic circumpolar current to recent climate change. Nat. Geosci. 1, 864–869. doi: 10.1038/ngeo362
Boyer, T. P., and Levitus, S. (2002). Harmonic analysis of climatological sea surface salinity. J. Geophys. Res. 107, 7–14. doi: 10.1029/2001JC000829
Boyer, T. P., Levitus, S., Antonov, J. I., Locarnini, R. A., and Garcia, H. E. (2005). Linear trends in salinity for the world ocean, 1955-1998. Geophys. Res. Lett. 32:L01604. doi: 10.1029/2004GL021791
Boyer, T. P., Domingues, C. M., Good, S. A., Johnson, G. C., Lyman, J. M., Ishii, M., et al. (2016). Sensitivity of global upper-ocean heat content estimates to mapping methods, XBT bias corrections, and baseline climatologies. J. Clim. 29, 4817–4842. doi: 10.1175/JCLI-D-15-0801.1
Brauch, J. P., and Gerdes, R. (2005). Reaction of the northern North Atlantic and arctic oceans to a sudden change of the NAO. J. Geophys. Res. 110:C11018. doi: 10.1029/2004JC002436
Bryden, H. L., King, B. A., McCarthy, G. D., and McDonagh, E. L. (2014). Impact of a 30% reduction in Atlantic meridional overturning during 2009–2010. Ocean Sci. 10, 683–691. doi: 10.5194/os-10-683-2014
Bunge, L., and Clarke, A. J. (2014). On the warm water volume and its changing relationship with ENSO. J. Phys. Oceanogr. 44, 1372–1385. doi: 10.1175/JPO-D-13-062.1
Clark, P. U., Pisias, N. G., Stocker, T. F., and Weaver, A. J. (2002). The role of the thermohaline circulation in abrupt climate change. Nature 415, 863–869. doi: 10.1038/415863a
Caesar, L., Rahmstorf, S., Robinson, A., Feulner, G., and Saba, V. (2018.) Observed fingerprint of a weakening Atlantic ocean overturning circulation. Nature 556, 191–196. doi: 10.1038/s41586-018-0006-5
Cannaby, H., Palmer, M. D., Howard, T., Bricheno, L., Calvert, D., Krijnen, J., et al. (2016) Projected sea level rise and changes in extreme storm surge and wave events during the 21st century in the region of singapore. Ocean Sci. 12, 613–632. doi: 10.5194/os-12-613-2016
Carson, M., Köhl, A., Stammer, D., Slangen, A. A. B., Katsman, C. A., van de Wal, R. S. W., et al. (2016). Coastal sea level changes, observed and projected during the 20th and 21st century. Clim. Chang. 134, 269–281. doi: 10.1007/s10584-015-1520-1
Chadwick, R., Boutle, I., and Martin, G. (2013). Spatial patterns of precipitation change in CMIP5: why the rich do not get richer in the tropics. J. Clim. 26, 3803–3822. doi: 10.1175/JCLI-D-12-00543.1
Chen, D., Cane, M. A., Kaplan, A., Zebiak, S. E., and Huang, D. (2004). Predictability of El Niño over the past 148 years. Nature 428, 733–736. doi: 10.1038/nature02439
Chen, X., and Tung, K.-K. (2014). Varying planetary heat sink led to global-warming slowdown and acceleration. Science 345, 897–903. doi: 10.1126/science.1254937
Cheng, L., Trenberth, K. E., Palmer, M. D., Zhu, J., and Abraham, J. P. (2016). Observed and simulated full-depth ocean heat-content changes for 1970–2005. Ocean Sci. 12, 925–935. doi: 10.5194/os-12-925-2016
Cheng, L., Trenberth, K. E., Fasullo, J., Boyer, T., Abraham, J., and Zhu, J. (2017). Improved estimates of ocean heat content from 1960 to 2015. Sci. Adv. 3:e1601545. doi: 10.1126/sciadv.e1601545
Church, J. A., White, N. J., Konikow, L. F., Domingues, C. M., Cogley, J. G., Rignot, E., et al. (2011). Revisiting the Earth’s sea-level and energy budgets for 1961 to 2008. Geophys. Res. Lett. 38:L18601. doi: 10.1029/2011GL048794
Church, J. A., Clark, P. U., Cazenave, A., Gregory, J. M., Jevrejeva, S., Levermann, A., et al. (2013a). “sea level change,” in Climate Change 2013: The Physical Science Basis. Contribution of Working Group I to the Fifth Assessment Report of the Intergovernmental Panel on Climate Change Stocker, eds T. F. D. Qin, G.K. Plattner, M. Tignor, S. K. J. Allen, A. Boschung, Y. Nauels, et al. (New York, NY: Cambridge University Press), 1137–1216.
Church, J. A., White, N. J., Konikow, L. F., Domingues, C. M., Cogley, J. G., Rignot, E., et al. (2013b). Correction to revisiting the earth’s sea-level and energy budgets for 1961 to 2008. Geophys. Res. Lett. 40:4066. doi: 10.1002/grl.50752
Collins, M., Knutti, R., Arblaster, J., Dufresne, J.-L., Fichefet, T., Friedlingstein, P., et al. (2013). “Long-term Climate Change: Projections, Commitments and Irreversibility,” in Climate Change 2013: The Physical Science Basis. Contribution of Working Group I to the Fifth Assessment Report of the Intergovernmental Panel on Climate Change Stocker, eds T. F. D. Qin, G.-K. Plattner, M. Tignor, S.K. Allen, J. Boschung, A. Nauels, et al. (New York, NY: Cambridge University Press).
Corre, L., Terray, L., Balmaseda, M., Ribes, A., and Weaver, A. (2012). Can oceanic reanalyses be used to assess recent anthropogenic changes and low-frequency internal variability of upper ocean temperature? Clim. Dyn. 38, 877–896. doi: 10.1007/s00382-010-0950-8
Cox, P. M., Huntingford, C., and Williamson, M. S. (2018). Emergent constraint on equilibrium climate sensitivity from global temperature variability. Nature 553, 319–322. doi: 10.1038/nature25450
Cravatte, S., Delcroix, T., Zhang, D., McPhaden, M., and Leloup, J. (2009). Observed freshening and warming of the western pacific warm pool. Clim Dyn 33, 565–589. doi: 10.1007/s00382-009-0526-7
Cravatte, S., Kessler, W. S., Smith, N., Wijffels, S. E., Yu, L., Ando, K., et al. (2016). First Report of TPOS 2020. Salisbury: TPOS, 200.
Cunningham, S. A., Roberts, C. D., Frajka-Williams, E., Johns, W. E., Hobbs, W., Palmer, M. D., et al. (2013). Atlantic meridional overturning circulation slowdown cooled the subtropical ocean. Geophys. Res. Lett. 40, 6202–6207. doi: 10.1002/2013GL05846
Curry, R., and Mauritzen, C. (2005). Dilution of the northern North Atlantic ocean in recent decades. Science 308, 1772–1774. doi: 10.1126/science.1109477
Czaja, A., and Frankignoul, C. (2002). Observed impact of atlantic SST Anomalies on the North Atlantic Oscillation. J. Clim. 15, 606–623. doi: 10.1175/1520-0442(2002)015<0606:oioasa>2.0.co;2
Danabasoglu, G., Yeager, S. G., Kim, W. M., Behrens, E., Bentsen, M., Daohua, B., et al. (2015). North Atlantic simulations in coordinated ocean-ice reference experiments phase II (CORE-II). Part II: inter-annual to decadal variability. Ocean Mod. 97, 65–90. doi: 10.1016/j.ocemod.2015.11.007
de Boyer Montegut, C., Madec, G., Fischer, A. S., Lazar, A., and Ludicone, D. (2004). Mixed layer depth over the global ocean: an examination of profile data and a profile-based climatology. J. Geophys. Res. 109:20. doi: 10.1029/2004JC002378
de Lavergne, C., Palter, J. B., Galbraith, E. D., Bernardello, R., and Marinov, I. (2014). Cessation of deep convection in the open Southern Ocean under anthropogenic climate change. Nat. Clim. Chang 4, 278–282. doi: 10.1038/nclimate2132
de Vries, P., and Weber, S. L. (2005). The Atlantic freshwater budget as a diagnostic for the existence of a stable shut down of the meridional overturning circulation. Geophys. Res. Lett. 32 doi: 10.1029/2004GL021450
Delcroix, T., Cravatte, S., and McPhaden, M. J. (2007). Decadal variations and trends in tropical pacific sea surface salinity since 1970. J. Geophys. Res. 112:C03012. doi: 10.1029/2006JC003801
Desbruyères, D. G., Purkey, S. G., McDonagh, E. L., Johnson, G. C., and King, B. A. (2016). Deep and abyssal ocean warming from 35 years of repeat hydrography. Geophys. Res. Lett. 43, 10356–10365. doi: 10.1002/2016GL070413
Desbruyères, D., McDonagh, E. L., King, B. A., and Thierry, V. (2017). Global and full-depth ocean temperature trends during the early twenty-first century from argo and repeat hydrography. J. Clim. 30, 1985–1997. doi: 10.1175/JCLI-D-16-0396.1
DeVries, T., Primeau, F., DeVries, T., and Primeau, F. (2011). Dynamically and observationally constrained estimates of water-mass distributions and ages in the global ocean. J. Phys. Oceanogr. 41, 2381–2401. doi: 10.1175/JPO-D-10-05011.1
DeVries, T., Holzer, M., and Primeau, F. (2017). Recent increase in oceanic carbon uptake driven by weaker upper-ocean overturning. Nature 542, 215–218. doi: 10.1038/nature21068
Doblas-Reyes, F. J., García-Serrano, J., Lienert, F., Biescas, A. P., and Rodrigues, L. R. (2013), Seasonal climate predictability and forecasting: status and prospects. WIRES Clim. Chang. 4, 245–268. doi: 10.1002/wcc.217
Domingues, C. M., Church, J. A., White, N. J., Gleckler, P. J., Wijffels, S. E., Barker, P. M., et al. (2008). Improved estimates of upper-ocean warming and multi-decadal sea-level rise. Nature 453, 1090–1093. doi: 10.1038/nature07080
Drijfhout, S. S., Blaker, A. T., Josey, S. A., Nurser, A. J., Sinha, G. B., and Balmaseda, M. A. (2014). Surface warming hiatus caused by increased heat uptake across multiple ocean basins. Geophys. Res. Lett. 41, 7868–7874. doi: 10.1002/2014GL061456
Dubois, C., von Schuckmann, K., Josey, S., and Ceschin, A., (2018). “Changes in the North Atlantic,” in Copernicus Marine Service Ocean State Report, Issue 2: Journal of Operational Oceanography, vol. 11, eds K. von Schuckmann, P.-Y. Le Traon, N. Smith, A. Pascual, P. Brasseur, K. Fennel, et al. (Ditcot: Taylor & Francis), s66. doi: 10.1080/1755876X.2018.1489208
Ducet, N., Le Traon, P. Y., and Reverdin, G. (2000). Global high-resolution mapping of ocean circulation from TOPEX/poseidon and ERS-1 and -2. J. Geophys. Res. 105, 19477–19498. doi: 10.1029/2000JC900063
Dunstone, N. J. (2014). A perspective on sustained marine observations for climate modelling and prediction. Philos. Trans. A Math. Phys. Eng. Sci. 37:20130340. doi: 10.1098/rsta.2013.0340
Dunstone, N. J., and Smith, D. M. (2010). Impact of atmosphere and sub-surface ocean data on decadal climate prediction. Geophys. Res. Lett. 37. doi: 10.1029/2009GL041609
Durack, P. J., and Wijffels, S. E. (2010). Fifty-year trends in global ocean salinities and their relationship to broad-scale warming. J. Clim. 23, 4342–4362. doi: 10.1175/2010JCLI3377.1
Durack, P. J., Wijffels, S. E., and Matear, R. J. (2012). Ocean salinities reveal strong global water cycle intensification during 1950 to 2000. Science 336, 455–458. doi: 10.1126/science.1212222
Durack, P. J., Gleckler, P. J., Landerer, F. W., and Taylor, K. E. (2014). Quantifying underestimates of long-term upper-ocean warming. Nat. Clim. Chang. 4, 999–1005. doi: 10.1038/nclimate2389
Durack, P. J., Gleckler, P. J., Purkey, S. G., Johnson, G. C., Lyman, J. M., and Boyer, T. P. (2018). Ocean warming: from the surface to the deep in observations and models. Oceanography 31, 41–51. doi: 10.5670/oceanog.2018.227
Durack, P. J. (2015). Ocean salinity and the global water cycle. Oceanography 28, 20–31. doi: 10.5670/oceanog.2015.03
Durack, P. J., Lee, T., Vinogradova, N. T., and Stammer, D. (2016). Keeping the lights on for global ocean salinity observation. Nat. Clim. Chang. 6, 228–231. doi: 10.1038/nclimate2946
Easterling, D. R., and Wehner, M. F. (2009). Is the climate warming or cooling? Geophys. Res. Lett. 36:L08706. doi: 10.1029/2009GL037810
England, M. H., McGregor, S., Spence, P., Meehl, G. A., Timmermann, A., and Cai, W., (2014). Recent intensification of wind-driven circulation in the pacific and the ongoing warming hiatus. Nat. Clim. Chang. 4, 222–227. doi: 10.1038/nclimate2106
Exarchou, E., Kuhlbrodt, T., Gregory, J. M., and Smith, R. S. (2014). Ocean heat uptake processes: a model intercomparison. J. Clim. 28, 887–908. doi: 10.1175/jcli-d-14-00235.1
Frölicher, T. L., Sarmiento, J. L., Paynter, D. J., Dunne, J. P., Krasting, J. P., Winton, M., et al. (2015). Dominance of the southern ocean in anthropogenic carbon and heat uptake in CMIP5 models. J. Clim. 28, 862–886. doi: 10.1175/JCLI-D-14-00117.1
Fenty, I., Willis, J. K., Khazendar, A., Dinardo, S., Forsberg, R., Fukumori, I., et al. (2016). Oceans melting greenland: early results from nasa’s ocean-ice mission in greenland. Oceanography 29, 72–83. doi: 10.5670/oceanog.2016.100
Fichot, C. G., Kaiser, K., Hooker, S. B., Amon, R. M. W., Babin, M., Belanger, S., et al. (2013), Pan-Arctic distributions of continental runoff in the arctic ocean. Sci. Rep. 3:1053
Fore, A. G., Yueh, S. H., Tang, W., Stiles, B. W., and Hayashi, A. K. (2016). Combined active/passive retrievals of ocean vector wind and sea surface salinity with SMAP. IEEE Trans. Geosci. Remote Sens. 54, 7396–7404. doi: 10.1109/TGRS.2016.2601486
Fournier, S., Lee, T., and Gierach, M. M. (2016). Seasonal and interannual variations of sea surface salinity associated with the Mississippi River plume observed by SMOS and aquarius. Remote Sens. Env. 180, 431–439. doi: 10.1016/j.rse.2016.02.050
Frajka-Williams, E., Ansorge, I. J., Baehr, J., Bryden, H. L., Chidichimo, M. P., Cunningham, S. A., et al. (2019). Atlantic meridional overturning circulation: observed transport and variability. Front. Mar. Sci. 6:260. doi: 10.3389/fmars.2019.00260
Frolicher, T. L., Fischer, E. M., and Gruber, N. (2018). Marine heatwaves under global warming. Nature 560, 360–364. doi: 10.1038/s41586-018-0383-9
Fu, Y., Karstensen, J., and Brandt, P. (2018). Atlantic Meridional Overturning Circulation at 14.5°N in 1989 and 2013 and 24.5°N in 1992 and 2015: volume, heat, and freshwater transports. Ocean Sci. 14, 589–616. doi: 10.5194/os-14-589-2018
Fujii, Y., James, C., Yan, X., Andreas, S., Tong, L., Magdalena, A. B., et al. (2015). Evaluation of the tropical pacific observing system from the ocean data assimilation perspective. Q. J. R. Meteorol. Soc. 141, 2481–2496. doi: 10.1002/qj.2579
Garric, G., Hernandez, O., Bricaud, C., Storto, A., Peterson, K. A., and Zuo, H., (2018). “Arctic ocean freshwater content,” in Copernicus Marine Service Ocean State Report, Issue 2: Journal of Operational Oceanography, vol. 11, eds K. von Schuckmann, P.-Y. Le Traon, N. Smith, A. Pascual, P. Brasseur, K. Fennel, et al. (Ditcot: Taylor & Francis), s70. doi: 10.1080/1755876X.2018.1489208
Garry, F. (2017). Deep Ocean Heat Content Observing Strategy: Evaluating the Past and Preparing for the Future. Ph.D thesis, University of Southampton, Southampton.
Gasparin, F., Roemmich, D., Gilson, J., and Cornuelle, B. (2015). Assessment of the upper-ocean observing system in the equatorial pacific: the role of argo in resolving intraseasonal to interannual variability. J. Atmos. Oceanic. Technol. 32, 1668–1688. doi: 10.1175/jtech-d-14-00218.1
Gasparin, F., and Roemmich, D. (2016). The strong freshwater anomaly during the onset of the 2015/2016 El Niño. Geophys. Res. Lett. 43, 6452–6460. doi: 10.1002/2016GL069542
Gasparin, F., Guinehut, S., Mao, C., Mirouze, I., Rémy, E., King, R. R., et al. (2019). Requirements for an integrated in situ atlantic ocean observing system from coordinated observing system simulation experiments. Front. Mar. Sci. 6:83. doi: 10.3389/fmars.2019.00083
Gastineau, G., Mignot, J., Arzel, O., and Huck, T. (2018). North Atlantic ocean internal decadal variability: role of the mean state and ocean-atmosphere coupling. J. Geophys. Res. Oceans 123, 5949–5970. doi: 10.1029/2018JC014074
Giglio, D., and Johnson, G. C. (2017). Middepth decadal warming and freshening in the South Atlantic. J. Geophys. Res. Oceans 122, 973–979. doi: 10.1002/2016JC012246
Gille, S. T. (2008). Decadal-scale temperature trends in the southern hemisphere ocean. J. Clim. 21, 4749–4765. doi: 10.1175/2008JCLI2131.1
Gleckler, P. J., Durack, P. J., Stouffer, R. J., Johnson, G. C., and Forest, C. E. (2016). Industrial-era global ocean heat uptake doubles in recent decades. Nat. Clim. Chang. 6, 394–398. doi: 10.1038/nclimate2915
Gleckler, P. J., Santer, B. D., Domingues, C. M., Pierce, D. W., Barnett, T. P., Church, J. A., et al. (2012). Human-induced global ocean warming on multidecadal timescales. Nat. Clim. Chang. 2, 524–529. doi: 10.1038/nclimate1553
Golledge, N. R., Kowalewski, D. E., Naish, T. R., Levy, R. H., Fogwill, C. J., and Gasson, E. G. W. (2015). The multi-millennial Antarctic commitment to future sea-level rise. Nature 526, 421–425. doi: 10.1038/nature15706
Good, S. A. (2017). The impact of observational sampling on time series of global 0-700 m ocean average temperature: a case study. Int. J. Climatol. 37, 2260–2268. doi: 10.1002/joc.4654
Good, S. A., Martin, M. J., and Rayner, N. A. (2013). EN4: quality controlled ocean temperature and salinity profiles and monthly objective analyses with uncertainty estimates. J. Geophys. Res. 118, 6704–6716. doi: 10.1002/2013JC009067
Gray, A. R., and Riser, S. C. (2014). A global analysis of sverdrup balance using absolute geostrophic velocities from argo. J. Phys. Oceanogr. 44, 1213–1229. doi: 10.1175/JPO-D-12-0206.1
Gregory, J. M., Banks, H. T., Stott, P. A., Lowe, J. A., and Palmer, M. D. (2004), Simulated and observed decadal variability in ocean heat content. Geophys. Res. Lett. 31:L15312. doi: 10.1029/2004GL020258
Gregory, J. M., Bouttes, N., Griffies, S. M., Haak, H., Hurlin, W. J., Jungclaus, J., et al. (2016). The flux-anomaly-forced model intercomparison project (FAFMIP) contribution to CMIP6: investigation of sea-level and ocean climate change in response to CO2 forcing. Geosci. Mod. Dev. 9, 3993–4017. doi: 10.5194/gmd-9-3993-2016
Griffies, S. M., Winton, M., Anderson, W. G., Benson, R., Delworth, T. L., Dufour, C. O., et al. (2015). Impacts on ocean heat from transient mesoscale eddies in a hierarchy of climate models. J. Clim. 28, 952–977. doi: 10.1175/JCLI-D-14-00353.1
Guinehut, S., Dhomps, A.-L., Larnicol, G., and Le Traon, P.-Y., (2012). High resolution 3D temperature and salinity fields derived from in situ and satellite observations. Ocean Sci. 8, 845–857. doi: 10.5194/os-8-845-2012
Haine, T. W. N., Beth, C., Rüdiger, G., Edmond, H., Michael, J. K., Craig, L., et al. (2015). Arctic freshwater export: status, mechanisms, and prospects. Global. Planet. Chang. 125, 13–35. doi: 10.1016/j.gloplacha.2014.11.013
Häkkinen, S., Rhines, P. B., and Worthen, D. L. (2015). Heat content variability in the North Atlantic Ocean in ocean reanalyses. Geophys. Res. Lett. 42, 2901–2909. doi: 10.1002/2015GL063299
Haumann, F. A., Gruber, N., Münnich, M., Frenger, I., and Kern, S. (2016). Sea-ice transport driving Southern Ocean salinity and its recent trends. Nature 537, 89–92. doi: 10.1038/nature19101
Held, I. M., and Soden, B. J. (2006). Robust responses of the hydrological cycle to global warming. J. Clim. 19, 5686–5699. doi: 10.1175/JCLI3990.1
Helm, K. P., Bindoff, N. L., and Church, J. A. (2010). Changes in the global hydrological-cycle inferred from ocean salinity. Geophys. Res. Lett. 37. doi: 10.1029/2010GL044222
Heuzé, C., Heywood, K. J., Stevens, D. P., and Ridley, J. K. (2015). Changes in global ocean bottom properties and volume transports in CMIP5 models under climate change scenarios. J. Clim. 28, 2917–2944. doi: 10.1175/JCLI-D-14-00381.1
Holland, D. M., Thomas, R. H., De Young, B., Ribergaard, M. H., and Lyberth, B. (2008). Acceleration of Jakobshavn Isbrae triggered by warm subsurface ocean waters. Nat. Geosci. 1, 659–664. doi: 10.1038/ngeo316
Hosoda, S., Ohira, T., and Nakamura, T., (2008). A monthly mean dataset of global oceanic temperature and salinity derived from Argo float observations. JAMSTEC Rep. Res. Dev. 8, 47–59. doi: 10.5918/Jamstecr.8.47
Hosoda, S., Suga, T., Shikama, N., and Mizuno, K. (2009). Global surface layer salinity change detected by Argo and its implication for hydrological cycle intensification. J. Oceanogr. 65, 579–586. doi: 10.1007/s10872-009-0049-1
IPCC, (2013). “Climate Change 2013: The Physical Science Basis,” in Contribution of Working Group I to the Fifth Assessment Report of the Intergovernmental Panel on Climate Change Stocker, eds T. F. D. Qin, G.-K. Plattner, M. Tignor, S.K. Allen, J. Boschung, A. Nauels, et al. (New York, NY: Cambridge University Press), 1535.
Ishii, M., and Kimoto, M. (2009). Reevaluation of historical ocean heat content variations with time-varying XBT and MBT depth bias corrections. J. Oceanogr. 65, 287–299. doi: 10.1007/s10872-009-0027-7
Jacobs, S. S., and Giulivi, C. F. (2010). large multidecadal salinity trends near the pacific–antarctic continental margin. J. Clim. 23, 4508–4524 doi: 10.1175/2010jcli3284.1
Jackson, L. C., Peterson, K. A., Roberts, C. D., and Wood, R. A. (2016). Recent slowing of Atlantic overturning circulation as a recovery from earlier strengthening. Nat. Geosci. 9, 518–522. doi: 10.1038/ngeo2715
Jin, F. F. (1997). An equatorial ocean recharge paradigm for ENSO. Part I conceptual model. J. Atmos. Sci. 54, 811–829. doi: 10.1175/1520-0469(1997)054<0811:aeorpf>2.0.co;2
Johnson, G. C., and Birnbaum, A. N. (2017), As El Niño builds, Pacific Warm Pool expands, ocean gains more heat. Geophys. Res. Lett. 44, 438–445. doi: 10.1002/2016GL071767
Jochumsen, K., Köllner, M., Quadfasel, D., Dye, S., Rudels, B., and Valdimarsson, H. (2015). On the origin and propagation of denmark strait overflow water anomalies in the irminger basin. J. Geophys. Res. Oceans 120, 1841–1855. doi: 10.1002/2014JC010397
Johnson, G. C., Lyman, J. M., Boyer, T., Cheng, L., Domingues, C. M., Gilson, J., et al. (2018). Global oceans: ocean heat content. state of the climate in 2017. Bull. Am. Meteorol. Soc. 99, S72–S77.
Johnson, G. C., McTaggart, K. E., and Wanninkhof, R. (2014), Antarctic bottom water temperature changes in the western South Atlantic from 1989 to 2014. J. Geophys. Res. Oceans 119, 8567–8577. doi: 10.1002/2014JC010367
Johnson, G. C., Lyman, J. M., and Purkey, S. G. (2015). Informing deep argo array design using argo and full-depth hydrographic section data. J. Atmos. Ocean. Technol. 32, 2187–2198. doi: 10.1175/JTECH-D-15-0139.1
Johnson, G. C., Lyman, J. M., and Loeb, N. G. (2016). Improving estimates of Earth’s energy imbalance. Nat. Clim. Chang. 6, 639–640. doi: 10.1038/nclimate3043
Josey, S. A., Hirschi, J. J., Sinha, B., Duchez, A., Grist, J. P., and Marsh, R. (2018). The recent atlantic cold anomaly: causes, consequences, and related phenomena. Annu. Rev. Mar. Sci. 10, 475–501. doi: 10.1146/annurev-marine-12191-2
Jullion, L., Naveira Garabato, A. C., Meredith, M. P., Holland, P. R., Courtois, P., and King, B. A. (2013). Decadal freshening of the antarctic bottom water exported from the weddell sea. J. Clim. 26, 8111–8125. doi: 10.1175/JCLI-D-12-00765.1
Jung, O., Sung, M. K., Sato, K., Lim, Y. K., Kim, S. J., Baek, E. H., et al. (2017). How does the SST variability over the western North atlantic ocean control arctic warming over the barents-kara seas? Environ. Res. Lett. 12:034021. doi: 10.1088/1748-9326/aa5f3b
Kara, A., Rochford, P. A., and Hurlburt, H. E. (2003). Mixed layer depth variability over the global ocean. J. Geophys. Res. Oceans 108:3079
Karcher, M., Beszczynska-Möller, A., Kauker, F., Gerdes, R., Heyen, S., Rudels, B., et al. (2011), Arctic Ocean warming and its consequences for the Denmark Strait overflow. J. Geophys. Res. 116:C02037. doi: 10.1029/2010JC006265
Kessler, W. S., Spillane, M. C., McPhaden, M. J., and Harrison, D. E. (1996). Scales of variability in the equatorial pacific inferred from the TAO buoy array. J. Clim. 9, 2999–3024. doi: 10.1175/1520-0442(1996)009<2999:sovite>2.0.co;2
Klatt, O., Boebel, O., and Fahrbach, E., (2007). A profiling float’s sense of ice. J. Atmos. Ocean. Technol. 24, 1301–1308. doi: 10.1175/JTECH2026.1
Koenigk, T., Mikolajewicz, U., Haak, H., and Jungclaus, J. (2007). Arctic freshwater export in the 20th and 21st centuries. J. Geophys. Res. 112:G04S41. doi: 10.1029/2006JG000274
Kuhlbrodt, T., and Gregory, J. M. (2012), Ocean heat uptake and its consequences for the magnitude of sea level rise and climate change. Geophys. Res. Lett. 39:L18608. doi: 10.1029/2012GL052952
Lagerloef, G., Colomb, F. R., Le Vine, D., Wentz, F., Yueh, S., Ruf, C., et al. (2008). The Aquarius/SAC-D mission: designed to meet the salinity remote-sensing challenge. Oceanograph 21, 68–81. doi: 10.5670/oceanog.2008.68
Lago, V., Wijffels, S. E., Durack, P. J., Church, J. A., Bindoff, N. L., and Marsland, S. J. (2016). Simulating the role of surface forcing on observed multidecadal upper-ocean salinity changes. J. Clim. 29, 5575–5588. doi: 10.1175/JCLI-D-15-0519.1
Landerer, F. W., Gleckler, P. J., and Lee, T. (2014). Evaluation of CMIP5 dynamic sea surface height multi-model simulations against satellite observations. Clim. Dyn. 43, 1271–1283. doi: 10.1007/s00382-013-1939-x
Lecomte, O., Goosse, H., Fichefet, T., de Lavergne, C., Barthélemy, A., and Zunz, V. (2017). Vertical ocean heat redistribution sustaining sea-ice concentration trends in the ross sea. Nat. Commun. 8:258. doi: 10.1038/s41467-017-00347-4
Le Traon, P. Y., Nadal, F., and Ducet, N. (1998). an improved mapping method of multisatellite altimeter data. J. Atmos. Ocean. Technol. 15, 522–534. doi: 10.1175/1520-04261998015<0522:AIMMOM>2.0.CO;2
Lee, S.-K., Park, W., Baringer, M. O., Gordon, A. L., Huber, B., and Liu, Y. (2015). Pacific origin of the abrupt increase in Indian Ocean heat content during the warming hiatus. Nat. Geosci. 8, 445–449. doi: 10.1038/ngeo2438
Levitus, S. (1984). Annual cycle of temperature and heat storage in the world ocean. J. Phys. Oceanogr. 14, 727–746. doi: 10.1175/1520-04851984014<0727:ACOTAH>2.0.CO;2
Le Quéré, C., Raupach, M. R., Canadell, J. G., Marland, G., Le Quéré, C., Raupach, M. R., et al. (2009). Trends in the sources and sinks of carbon dioxide. Nat. Geosci. 2, 831–836. doi: 10.1038/ngeo689
Le Reste, S., Dutreuil, V., André, X., Thierry, V., Renaut, C., Le Traon, P., et al. (2016). “Deep-Arvor”: a new profiling float to extend the argo observations down to 4000-m depth. J. Atmos. Oceanic Technol. 33, 1039–1055. doi: 10.1175/JTECH-D-15-0214.1
Levermann, A., Winkelmann, R., Nowicki, S., Fastook, J. L., Frieler, K., Greve, R., et al. (2014). Projecting Antarctic ice discharge using response functions from SeaRISE ice-sheet models. Earth Syst. Dyn. 5, 271–293. doi: 10.5194/esd-5-271-2014
Levitus, S. (1986). Annual cycle of salinity and salt storage in the world ocean. J. Phys. Oceanogr. 16, 322–343. doi: 10.1175/1520-0485(1986)016<0322:acosas>2.0.co;2
Levitus, S. (1989). Interpentadal variability of temperature and salinity at intermediate depths of the north Atlantic Ocean, 1970-74 versus 1955-1959. J. Geophys. Res. 94, 6091–6131. doi: 10.1029/JC094iC05p06091
Levitus, S., Antonov, J. I., Boyer, T. P., and Stephens, C. (2000). Warming of the World Ocean. Science 287, 2225–2229. doi: 10.1126/science.287.5461.2225
Levitus, S., Antonov, J. I., Wang, J., Delworth, T. L., Dixon, K. W., and Broccoli, A. J. (2001). Anthropogenic warming of the earth’s climate system. Science 292, 267–270. doi: 10.1126/science.1058154
Levitus, S., Antonov, J. I., Boyer, T. P., Baranova, O. K., Garcia, H. E., Locarnini, R. A., et al. (2012). World ocean heat content and thermosteric sea level change (0 - 2000 m), 1955-2010. Geophys. Res. Lett. 39:L10603. doi: 10.1029/2012GL051106
Li, L., Schmitt, R. W., Ummenhofer, C. C., and Karnauskas, K. B. (2016a). North Atlantic salinity as a predictor of Sahel rainfall. Sci. Adv. 2:e1501588. doi: 10.1126/sciadv.1501588
Li, L., Schmitt, R. W., Ummenhofer, C. C., and Karnauskas, K. B. (2016b). Implications of North Atlantic Sea surface salinity for summer precipitation over the U.S. midwest: mechanisms and predictive value. J. Clim. 29, 3143–3159. doi: 10.1175/JCLI-D-15-0520.1
Liu, X., Köhl, A., and Stammer, D. (2017). Dynamical ocean response to projected changes of the global water cycle. J. Geophys. Res. Oceans 122, 6512–6532. doi: 10.1002/2017JC013061
Liu, T., Schmitt, R. W., and Li, L. (2018). Global search for autumn-lead sea surface salinity predictors of winter precipitation in Southwestern United States. Geophys. Res. Lett. Banner 45, 8445–8454. doi: 10.1029/2018GL079293
Lyman, J. M, and Johnson, G. C. (2014). Estimating global ocean heat content changes in the upper 1800 m since 1950 and the influence of climatology choice. J. Clim. 27, 1945–1957. doi: 10.1175/JCLI-D-12-00752.1
Maher, N., Sen Gupta, A., and England, M. H. (2014). Drivers of decadal hiatus periods in the 20th and 21st centuries. Geophys. Res. Lett. 41, 5978–5986. doi: 10.1002/2014GL060527
Marshall, J., Scott, J. R., Armour, K. C., Campin, J. M., Kelley, M., and Romanou, A. (2015). The ocean’s role in the transient response of climate to abrupt greenhouse gas forcing. Clim. Dyn. 44, 2287–2299. doi: 10.1007/s00382-014-2308-0
Masuda, S., Awaji, T., Sugiura, N., Matthews, J. P., Toyoda, T., Kawai, Y., et al. (2010). Simulated rapid warming of abyssal North Pacific waters. Science 329, 319–322. doi: 10.1126/science.1188703
Mayer, M., Fasullo, J. T., Trenberth, K. E., and Haimberger, L. (2016). ENSO-driven energy budget perturbations in observations and CMIP models. Clim. Dyn. 4, 4009–4029. doi: 10.1007/s00382-016-3057-z
McCarthy, G., Frajka-Williams, E., Johns, W. E., Baringer, M. O., Meinen, C. S., and Bryden, H. L., (2012). Observed interannual variability of the Atlantic meridional overturning circulation at 26.5°N. Geophysi. Res. Lett. 39:L19609.
McConaghy, D. C. (1980). Measuring sea surface temperature from satellites: a ground truth approach. Remote Sens. Environ. 10, 307–310. doi: 10.1016/0034-4257(80)90090-5
McPhaden, M. J., Zebiak, S. E., and Glantz, M. H. (2006). ENSO as an integrating concept in earth science. Science 314, 1740–1745. doi: 10.1126/science.1132588
McPhaden, M. J., Antonio, J. B., Robert, C., Jean-René, D., Kenneth, S. G., David, H., et al. (1998). The tropical ocean-global atmosphere observing system: a decade of progress. J. Geophys. Res. 103, 14169–14240.
Meehl, G. A., Arblaster, J. M., Fasullo, J. T., Hu, A., and Trenberth, K. E. (2011). Model-based evidence of deep-ocean heat uptake during surface-temperature hiatus periods. Nat. Clim. Chang. 1, 360–364. doi: 10.1038/nclimate1229
Meehl, G. A., Goddard, L., Boer, G., Burgman, R., Branstator, G., Cassou, C., et al. (2014). Decadal climate prediction an update from the trenches. Bull. Am. Meteorol. Soc. 95, 243–267. doi: 10.1175/BAMS-D-12-00241.1
Meinen, C. S., and McPhaden, M. J. (2000), Observations of warm water volume changes in the equatorial pacific and their relationship to El niño and la niña. J. Clim. 13, 3551–3559 doi: 10.1175/1520-0442(2000)013<3551:oowwvc>2.0.co;2
Morison, J., Kwok, R., Peralta-Ferriz, C., Alkire, M., Rigor, I., Andersen, R., et al. (2012). Changing arctic ocean freshwater pathways. Nature 481, 66–70. doi: 10.1038/nature10705
Mulet, S., Buongiorno Nardelli, B., Good, S., Pisan, A., Greiner, E., Monier, M., et al. (2018). “Ocean temperature and salinity,” in Copernicus Marine Service Ocean State Report, Issue 2: Journal of Operational Oceanography, vol. 11, eds K. von Schuckmann, P.-Y. Le Traon, N. Smith, A. Pascual, P. Brasseur, K. Fennel, et al. (Ditcot: Taylor & Francis), s5. doi: 10.1080/1755876X.2018.1489208
Myhre, G., Shindell, D., Bréon, F.-M., Collins, W., Fuglestvedt, J., Huang, J., Koch, D., et al. (2013). “Anthropogenic and Natural Radiative Forcing” in Climate Change 2013: The Physical Science Basis. Contribution of Working Group I to the Fifth Assessment Report of the Intergovernmental Panel on Climate Change Stocker, eds T. F. D. Qin, G.-K. Plattner, M. Tignor, S. K. Allen, J. Boschung, A. Nauels, et al. (New York, NY: Cambridge University Press).
National Academies of Sciences, Engineering, and Medicine [NASEM], (2017). Sustaining Ocean Observations to Understand Future Changes in Earth’s Climate. Washington, DC: The National Academies Press.
Nieves, V., Willis, J. K., and Patzert, W. C. (2015). Recent hiatus caused by decadal shift in indo-pacific heating. Science 349, 532–535. doi: 10.1126/science.aaa4521
Oke, P. R., Larnicol, G., Fujii, Y., Smith, G. C., Lea, D. J., Guinehut, S., et al. (2015). Assessing the impact of observations on ocean forecasts and reanalyses: part 1, global studies. J. Oper. Oceanogr. 8, s49–s62. doi: 10.1080/1755876x.2015.1022067
Palmer, M. D., Good, S. A., Haines, K., Rayner, N. A., and Stott, P. A. (2009). A new perspective on warming of the global oceans. Geophys. Res. Lett. 36:5. doi: 10.1029/2009GL039491
Palmer, M. D., McNeall, D. J., and Dunstone, N. J. (2011). Importance of the deep ocean for estimating decadal changes in earth’s radiation balance. Geophys. Res. Lett. 38:L13707. doi: 10.1029/2011GL047835
Palmer, M. D., and McNeall, D. J. (2014). Internal variability of Earth’s energy budget simulated by CMIP5 climate models. Environ. Res. Lett. 9:34016.
Palmer, M. D., Roberts, C. D., Balmaseda, M., Chang, Y-S., Chepurin, G., Ferry, N., et al. (2017). Ocean heat content variability and change in an ensemble of ocean reanalyses. Clim. Dyn. 49, 909–930. doi: 10.1007/s00382-015-2801-0
Park, W, and Latif, M. (2008). Multidecadal and multicentennial variability of the meridional overturning circulation. Geophys. Res. Lett. 35:L22703
Pawlowicz, R., Feistel, R., McDougall, T. J., Ridout, P., Seitz, S., and Wolf, H. (2016). Metrological challenges for measurements of key climatological observables Part 2: oceanic salinity. Metrologia 53, R1–R11. doi: 10.1088/0026-1394/53/1/R12
Perkins, S. E. (2015). A review on the scientific understanding of heatwaves - their measurement, driving mechanisms, and changes at the global scale. Atmos. Res. 164-165, 242–267. doi: 10.1016/j.atmosres.2015.05.014
Piecuch, C. G., and Quinn, K. J. (2016), El Niño, La Niña, and the global sea level budget. Ocean Sci. 12, 1165–1177.
Pierce, D. W., Gleckler, P. J., Barnett, T. P., Santer, B. D., and Durack, P. J. (2012). The fingerprint of human-induced changes in the ocean’s salinity and temperature fields. Geophys. Res. Lett. 39:6. doi: 10.1029/2012GL053389
Polyakov, I. V., Pnyushkov, A. V., Rember, R., Padman, L., Carmack, E. C., and Jackson, J. M. (2013). Winter convection transports atlantic water heat to the surface layer in the eastern arctic ocean. J. Phys. Oceanogr. 43, 2142–2155. doi: 10.1175/JPO-D-12-0169.1
Purkey, S. G., and Johnson, G. C. (2010). Warming of global abyssal and deep southern ocean waters between the 1990s and 2000s: contributions to global heat and sea level rise budgets. J. Clim. 23, 6336–6351. doi: 10.1175/2010JCLI3682.1
Purkey, S. G., and Johnson, G. C. (2012). Global contraction of antarctic bottom water between the 1980s and 2000s. J. Clim. 25, 5830–5844. doi: 10.1175/JCLI-D-11-00612.1
Purkey, S. G., and Johnson, G. C. (2013). Antarctic bottom water warming and freshening: contributions to sea level rise, ocean freshwater budgets, and global heat gain. J. Clim. 26, 6105–6122. doi: 10.1175/JCLI-D-12-00834.1
Rabe, B., Karcher, M., Kauker, F., Schauer, U., Toole, J. M., Krishfield, R. A., et al. (2014). Arctic ocean basin liquid freshwater storage trend 1992-2012. Geophys. Res. Lett. 41, 961–968. doi: 10.1002/2013GL058121
Reynolds, R. W., Smith, T. M., Liu, C., Chelton, D. B., Casey, K., and Schlax, G. (2007). Daily high-resolution-blended analyses for sea surface temperature. J. Clim. 20, 5473–5496. doi: 10.1175/2007jcli1824.1
Rhein, M., Rintoul, S. R., Aoki, S., Campos, E., Chambers, D., Feely, R. A., et al. (2013). “Observations: Ocean,” in Climate Change 2013: The Physical Science Basis. Contribution of Working Group I to the Fifth Assessment Report of the Intergovernmental Panel on Climate Change, ed. T. F Stockercpesnm, (New York, NY: Cambridge University Press, Cambridge) 255–315.
Rhines, P., Häkkinen, S., and Josey, S. A. (2008). “Is oceanic heat transport significant in the climate system?,” in Arctic–Subarctic Ocean Fluxes eds R. R. Dickson, J. Meincke, and P. Rhinescpesnm, (Dordrecht: Springer). doi: 10.1007/978-1-4020-6774-7-5
Ricker, R., Hendricks, S., and Beckers, J. F. (2016), The impact of geophysical corrections on sea-ice freeboard retrieved from satellite altimetry. Remote Sens. 8, 1415–1425. doi: 10.3390/rs8040317
Ridley, D. A., Solomon, S., Barnes, J. E., Burlakov, V. D., Deshler, T., Dolgii, S. I., et al. (2014). Total volcanic stratospheric aerosol optical depths and implications for global climate change. Geophys. Res. Lett. 41. 7763–7769. doi: 10.1002/2014GL061541
Rignot, E., Xu, Y., Menemenlis, D., Mouginot, J., Scheuchl, B., Li, X., et al. (2016). Modeling of ocean-induced ice melt rates of five west Greenland glaciers over the past two decades. Geophys. Res. Lett. 43, 6374–6382. doi: 10.1002/2016GL068784
Risbey, J. S., Lewandowsky, S., Langlais, C., Monselesan, D. P., O’Kane, T. J., and Oreskes, N. (2014). Well-estimated global surface warming in climate projections selected for ENSO phase. Nat. Clim. Chang. 4, 835–840. doi: 10.1038/nclimate2310
Riser, S. C., Freeland, H. J., Roemmich, D., Wijffels, S., Troisi, A., Belbéoch, M., et al. (2016). Fifteen years of ocean observations with the global argo array. Nat. Clim. Chang. 6, 145–153. doi: 10.1038/nclimate2872
Roberts, C. D., Calvert, D., Dunstone, N., Hermanson, L., Palmer, M. D., and Smith, D. (2016). On the drivers and predictability of seasonal-to-interannual variations in regional sea level. J. Clim. 29, 7565–7585. doi: 10.1175/JCLI-D-15-0886.1
Robson, J., Sutton, R., Lohmann, K., Smith, D., and Palmer, M. D. (2012a). Causes of the rapid warming of the north atlantic ocean in the mid-1990s. J. Clim. 25, 4116–4134. doi: 10.1175/JCLI-D-11-00443.1
Robson, J., Sutton, R., and Smith, D. (2012b). Initialized decadal predictions of the rapid warming of the north Atlantic ocean in the mid 1990s. Geophys. Res. Lett. 39:L19713. doi: 10.1029/2012GL053370
Robson, J., Sutton, R., and Smith, D. (2014). Decadal predictions of the cooling and freshening of the North Atlantic in 1960s and the role of ocean circulation. Clim. Dyn. 42, 2353–2365. doi: 10.1007/s00382-014-2115-7
Robson, J., Ortega, P., and Sutton, R. (2016). A reversal of climatic trends in the North Atlantic since 2005. Nat. Geosci. 9, 513–517. doi: 10.1038/ngeo2727
Roemmich, D., Alford, M. H., Claustre, H., Johnson, K., King, B., Moum, J., (2019). On the future of argo: a global, full-depth, multi-disciplinary array. Front. Mar. Sci. 6:439. doi: 10.3389/fmars.2019.00439
Roemmich, D., and Gilson, J. (2009). The 2004–2008 mean and annual cycle of temperature, salinity, and steric height in the global ocean from the Argo Program. Prog. Oceanogr. 82, 81–100. doi: 10.1016/j.pocean.2009.03.004
Roemmich, D., and Gilson, J. (2011). The global ocean imprint of ENSO. Geophys. Res. Lett. 38:L13606. doi: 10.1029/2011GL047992
Roemmich, D., John Gould, W., and Gilson, J. (2012). 135 years of global ocean warming between the challenger expedition and the argo programme. Nat. Clim. Chang. 2, 425–428. doi: 10.1038/nclimate1461
Roemmich, D., Cravatte, S., Delcroix, T., Gasparin, F., Hu, D., Johnson, G. C., et al. (2014). “White paper #10—In situ temperature, salinity, and velocity observations,” in Proceedings of the Report of the Tropical Pacific Observing System 2020 Workshop (TPOS 2020), Vol. II, (San Diego, CA: Scripps Institution of Oceanography), 27–30
Roemmich, D., Church, J., Gilson, J., Monselesan, D., Sutton, P., and Wijffels, S. (2015). Unabated planetary warming and its ocean structure since 2006. Nat. Clim. Chang. 5, 240–245. doi: 10.1038/nclimate2513
Rose, B. E. J., Armour, K. C., Battisti, D. S., Feldl, N., and Koll, D. D. B. (2014). The dependence of transient climate sensitivity and radiative feedbacks on the spatial pattern of ocean heat uptake. Geophys. Res. Lett. 41, 1071–1078. doi: 10.1002/2013GL058955
Rose, B. E. J., and Rayborn, L. (2016). The effects of ocean heat uptake on transient climate sensitivity. Curr. Clim. Chang. Rep. 2, 190–201. doi: 10.1007/s40641-016-0048-4
Rudels, B. (2009). “Arctic ocean circulation,” in Encyclopedia of Ocean Sciences, 2 Edn, eds J. H. Steele, K. K. Turekian, and S. A. Thorpecpesnm, (Oxford: Academic Press), 211–225 doi: 10.1016/b978-012374473-9.00601-9
Scaife, A. A., Arribas, A., Blockley, E., Brookshaw, A., Clark, R. T., Dunstone, N., et al. (2014). Skillful long-range prediction of European and North American winters. Geophys. Res. Lett. 41, 2514–2519. doi: 10.1002/2014GL059637
Schlundt, M., Brandt, P., Dengler, M., Hummels, R., Fischer, T., Bumke, K., et al. (2014). Mixed layer heat and salinity budgets during the onset of the 2011 Atlantic cold tongue. J. Geophys. Res. Oceans 119, 7882–7910. doi: 10.1002/2014JC010021
Schmidtko, S., Heywood, K. J., Thompson, A. F., and Aoki, S. (2014). Multidecadal warming of antarctic waters. Science 346, 1227–1231. doi: 10.1126/science.1256117
Sérazin, G., Jaymond, A., Leroux, S., Penduff, T., Bessières, L., Llovel, W., et al. (2017). A global probabilistic study of the ocean heat content low-frequency variability: atmospheric forcing versus oceanic chaos. Geophys. Res. Lett. 44, 5580–5589. doi: 10.1002/2017GL073026
Shimada, K., Aoki, S., Ohshima, K. I., and Rintoul, S. R. (2012). Influence of ross sea bottom water changes on the warming and freshening of the antarctic bottom water in the australian-antarctic basin. Ocean Sci. 8, 419–432. doi: 10.5194/os-8-419-2012
Slangen, A. B. A., Carson, M., Katsman, C. A., van de Wal, R. S. W., Koehl, A., Vermeersen, L. L. A., et al. (2014). Projecting twenty-first century regional sea-level changes. Clim. Chang. 124, 317–332. doi: 10.1007/s10584-014-1080-9
Sloyan, B. M., Wanninkhof, R., Kramp, M., Johnson, G. C., Talley, L. D., Tanhua, T., et al. (2019). The global ocean ship-based hydrographic investigations program (GO-SHIP): a platform for integrated multidisciplinary ocean science. Front. Mar. Sci. 6:445. doi: 10.3389/fmars.2019.00445
Smith, D. M., Cusack, S., Colman, A. W., Folland, C. K., Harris, G. R., and Murphy, J. M. (2007). Improved surface temperature prediction for the coming decade from a global climate model. Science 317, 796–799. doi: 10.1126/science.1139540
Smith, D. M., and Murphy, J. M. (2007). An objective ocean temperature and salinity analysis using covariances from a global climate model. J. Geophys. Res. 112:C02022. doi: 10.1029/2005JC003172
Smith, D. M., Booth, B. B. B., Dunstone, N. J., Eade, R., Hermanson, L., Jones, G. S., et al. (2016). Role of volcanic and anthropogenic aerosols in the recent global surface warming?slowdown. Nat. Clim. Chang. 6, 936–940. doi: 10.1038/nclimate3058
Smith, N., Kessler, W. S., Cravatte, S., Sprintall, J., Wijffels, S., Cronin, M. F., et al. (2019). Tropical pacific observing system. Front. Mar. Sci. 6:31. doi: 10.3389/fmars.2019.00031
Smith, N. R. (1995). An improved system for tropical ocean sub-surface temperature analyses. J. Atmos. Oceanic Technol. 12, 850–870. doi: 10.1175/1520-0426(1995)012<0850:aisfto>2.0.co;2
Smeed, D. A., Josey, S. A., Beaulieu, C., Johns, W. E., Moat, B. I., and Frajka-Williams, E., et al. (2018). The north atlantic ocean is in a state of reduced overturning. Geophys. Res. Lett. 45, 1527–1533. doi: 10.1002/2017GL076350
Stott, P. A., Sutton, R. T., and Smith, D. M. (2008). Detection and attribution of Atlantic salinity changes. Geophys. Res. Lett. 35:L21702. doi: 10.1029/2008GL035874
Straneo, F., and Heimbach, P. (2013). North Atlantic warming and the retreat of Greenland’s outlet glaciers. Nature 504, 36–43. doi: 10.1038/nature12854
Tang, W., Yueh, S., Yang, D., Fore, A., Hayashi, A., Lee, T., et al. (2018). The potential and challenges of using soil moisture active passive (SMAP) sea surface salinity to monitor arctic ocean freshwater changes. Remote Sens. 10:869. doi: 10.3390/rs10060869
Terray, L., Corre, L., Cravatte, S., Delcroix, T., Reverdin, G., and Ribes, A. (2012). Near-surface salinity as nature’s rain gauge to detect human influence on the tropical water cycle. J. Clim. 25, 958–977. doi: 10.1175/JCLI-D-10-05025.1
Llovel, W., and Terray, L. (2016). Observed southern upper-ocean warming over 2005–2014 and associated mechanisms. Environ. Res. Lett. 11:124023. doi: 10.1088/1748-9326/11/12/124023
Tesdal, J., Abernathey, R. P., Goes, J. I., Gordon, A. L., and Haine, T. W. (2018). Salinity trends within the upper layers of the subpolar north atlantic. J. Clim. 31, 2675–2698. doi: 10.1175/JCLI-D-17-0532.1
Thornalley, D. J. R., Oppo, D. W, Ortega, P., Robson, J. I., Brierley, C. M., Davis, R. et al. (2018). Anomalously weak Labrador Sea convection and Atlantic overturning during the past 150 years. Nature 556, 227–230. doi: 10.1038/s41586-018-0007-4
Todd, R. E., Chavez, F. P., Clayton, S., Cravatte, S. E., Goes, M. P., Graco, M. I., et al. (2019). Global perspectives on observing ocean boundary current systems. Front. Mar. Sci. 6:423.
Treasure, A. M., Roquet, F., Ansorge, I. J., Bester, M. N., Boehme, L., Bornemann, H. et al. (2017). Marine mammals exploring the oceans pole to pole: a review of the MEOP consortium. Oceanography 30, 132–138. doi: 10.5670/oceanog.2017.234
Trenberth, K. E. (2011). Changes in precipitation with climate change. Clim. Res. 47, 123–138. doi: 10.3354/cr00953
Truffer, M., and Motyka, R. J. (2016), Where glaciers meet water: subaqueous melt and its relevance to glaciers in various settings. Rev. Geophys. 54, 220–239. doi: 10.1002/2015RG000494
van Wijk, E. M., and Rintoul, S. R. (2014). Freshening drives contraction of antarctic bottom water in the australian antarctic basin. Geophys. Res. Lett. 41, 1657–1664. doi: 10.1002/2013GL058921
Vinogradova, N., Lee, T., Boutin, J., Drushka, K., Fournier, S., Sabia, R., et al. (2019) Satellite salinity observing system: recent discoveries and the way forward. Front. Mar. Sci. 6:243. doi: 10.3389/fmars.2019.00243
von Schuckmann, K., Palmer, M. D., Trenberth, K. E., Cazenave, A., Chambers, D., Champollion, N., et al. (2016). An imperative to monitor Earth’s energy imbalance. Nat. Clim. Chang. 6, 138–144. doi: 10.1038/nclimate2876
von Schuckmann, K., Storto, A., Simoncelli, S., Raj, R. P., Samuelsen, A., de Pascual Collar, A. et al. (2018). “Ocean heat content,” in Copernicus marine Service Ocean state Report, Issue 2: Journal of Operational Oceanography, vol. 11, eds K. von Schuckmann, P.-Y. Le Traon, N. Smith, A. Pascual, P. Brasseur, K. Fennel, et al. (Ditcot: Taylor & Francis), s41. doi: 10.1080/1755876X.2018.1489208
Wang, G., Cheng, L., Boyer, T., and Li, C. (2017). Halosteric sea level changes during the argo Era. Water 9:484. doi: 10.3390/w9070484
Wang, G., Cheng, L., Abraham, J., and Li, C. (2018). Consensuses and discrepancies of basin-scale ocean heat content changes in different ocean analyses. Clim. Dyn. 50:2471. doi: 10.1007/s00382-017-3751-5
Waugh, D. W., Primeau, F., DeVries, T., and Holzer, M. (2013). Recent changes in the ventilation of the southern oceans. Science 339, 568–570. doi: 10.1126/science.1225411
WCRP Global Sea Level Budget Group, (2018). Global sea-level budget 1993–present. Earth Syst. Sci. Data 10, 1551–1590. doi: 10.5194/essd-10-1551-2018
Weller, E., Min, S.-K., Palmer, M. D., Lee, D., Yim, B. Y., and Yeh, S.-W. (2016). Multi-model attribution of upper-ocean temperature changes using an isothermal approach. Sci. Rep. 6:26926. doi: 10.1038/srep26926
Weller, R. A., Baker, D. J., Glackin, M. M., Roberts, S. J., Schmitt, R. W., Twigg, E. S. et al. (2019) The Challenge of Sustaining Ocean Observations. Front. Mar. Sci. 6:105. doi: 10.3389/fmars.2019.00105
White, W. (1995). Design of a global observing system for gyre-scale upper ocean temperature variability. Prog. Oceanogr. 36, 169–217. doi: 10.1016/0079-6611(95)00017-8
Widlansky, M. J., Marra, J. J., Chowdhury, M. R., Stephens, S. A., Miles, E. R., Fauchereau, N., et al. (2017). Multimodel ensemble sea level forecasts for tropical pacific islands. J. Appl. Meteorol. Climatol. 56, 849–862. doi: 10.1175/jamc-d-16-0284.1
Williams, P. D., Guilyardi, E., Sutton, R., Gregory, J., and Madec, G. (2007). A new feedback on climate change from the hydrological cycle. Geophys. Res. Lett. 34:L08706. doi: 10.1029/2007GL029275
Willis, J. K., Roemmich, D., and Cornuelle, B. (2004), Interannual variability in upper ocean heat content, temperature, and thermosteric expansion on global scales. J. Geophys. Res. 109:C12036. doi: 10.1029/2003JC002260
Willis, J. K., Chambers, D. P., and Nerem, R. S. (2008). Assessing the globally averaged sea level budget on seasonal to interannual timescales. J. Geophys. Res. Oceans 113:C06015. doi: 10.1029/2007JC004517
Wong, T., Wielicki, B. A., Lee, R. B., Smith, G. L., Bush, K. A., and Willis, J. K. (2006). Reexamination of the observed decadal variability of the earth radiation budget using altitude-corrected ERBE/ERBS nonscanner WFOV data. J. Clim. 19, 4028–4040. doi: 10.1175/jcli3838.1
Wunsch, C. (2016). Global ocean integrals and means, with trend implications. Annu. Rev. Mar. Sci. 8, 1–33. doi: 10.1146/annurev-marine-122414-034040
Wunsch, C., Schmitt, R. W., and Baker, D. J. (2013). Climate change as an intergenerational problem. Proc. Natl. Acad. Sci. U.S.A. 110, 4435–4436. doi: 10.1073/pnas.1302536110
Wyrtki, K. (1981). An estimate of equatorial upwelling in the pacific. J. Phys. Oceanogr. 11, 1205–1214. doi: 10.1175/1520-04851981011<1205:AEOEUI>2.0.CO;2
Xie, P., Boyer, T., Bayler, E., Xue, Y., Byrne, D., Reagan, J., et al. (2014). An in situ-satellite blended analysis of global sea surface salinity. J. Geophys. Res. Oceans 119, 6140–6160. doi: 10.1002/2014JC010046
Xu, X., Chassignet, E. P., Johns, W. E., Schmitz, W. J. Jr., and Metzger, E. J. (2014), Intraseasonal to interannual variability of the Atlantic meridional overturning circulation from eddy-resolving simulations and observations. J. Geophys. Res. Oceans 119, 5140–5159. doi: 10.1002/2014JC009994
Xue, Y., Wen, C., Kumar, A., Balmaseda, M., Fujii, Y., Alves, O., et al. (2017). A real-time ocean reanalyses intercomparison project in the context of tropical pacific observing system and ENSO monitoring. Clim Dyn. 49:3647. doi: 10.1007/s00382-017-3535-y
Yao, W., Shi, J., and Zhao, X. (2017). Freshening of antarctic intermediate water in the south atlantic ocean in 2005–2014. Ocean Sci. 13, 521–530. doi: 10.5194/os-13-521-7
Yashayaev, I. M., and Loder, J. W. (2017). Further intensification of deep convection in the labrador sea in 2016. Geophys. Res. Lett. 44, 1429–1438. doi: 10.1098/rsta.2016.0321
Keywords: heat content, freshwater content, salinity, temperature, ocean observing system, climate change, climate variability, observing system design
Citation: Palmer MD, Durack PJ, Chidichimo MP, Church JA, Cravatte S, Hill K, Johannessen JA, Karstensen J, Lee T, Legler D, Mazloff M, Oka E, Purkey S, Rabe B, Sallée J-B, Sloyan BM, Speich S, von Schuckmann K, Willis J and Wijffels S (2019) Adequacy of the Ocean Observation System for Quantifying Regional Heat and Freshwater Storage and Change. Front. Mar. Sci. 6:416. doi: 10.3389/fmars.2019.00416
Received: 23 October 2018; Accepted: 05 July 2019;
Published: 29 August 2019.
Edited by:
Eric Delory, Oceanic Platform of the Canary Islands, SpainReviewed by:
Oscar Schofield, Rutgers University, The State University of New Jersey, United StatesShinya Kouketsu, Japan Agency for Marine-Earth Science and Technology, Japan
At least a portion of this work is authored by Paul J. Durack on behalf of the U.S. Government and, as regards Dr. Durack and the U.S. Government, is not subject to copyright protection in the United States. Foreign and other copyrights may apply. This is an open-access article distributed under the terms of the Creative Commons Attribution License (CC BY). The use, distribution or reproduction in other forums is permitted, provided the original author(s) and the copyright owner(s) are credited and that the original publication in this journal is cited, in accordance with accepted academic practice. No use, distribution or reproduction is permitted which does not comply with these terms.
*Correspondence: Matthew D. Palmer, bWF0dGhldy5wYWxtZXJAbWV0b2ZmaWNlLmdvdi51aw==