 Gustavo J. Goni1*
 Janet Sprintall2
 Francis Bringas1
 Lijing Cheng3
 Mauro Cirano4
 Shenfu Dong1
 Ricardo Domingues1,5
 Marlos Goes1,5
 Hosmay Lopez1,5
 Rosemary Morrow6
 Ulises Rivero1
 Thomas Rossby7
 Robert E. Todd8
 Joaquin Trinanes1,5,9
 Nathalie Zilberman2
 Molly Baringer1
 Tim Boyer10
 Rebecca Cowley11
 Catia M. Domingues12,13
 Katherine Hutchinson14,15
 Martin Kramp16
 Mauricio M. Mata17
 Franco Reseghetti18Charles Sun10Udaya Bhaskar TVS19
 Denis Volkov1,5
- 1Atlantic Oceanographic and Meteorological Laboratory, National Oceanic and Atmospheric Administration, Miami, FL, United States
- 2Scripps Institution of Oceanography, University of California, San Diego, La Jolla, CA, United States
- 3International Center for Climate and Environment Science, Institute of Atmospheric Physics, Chinese Academy of Sciences, Beijing, China
- 4Department of Meteorology, Institute of Geosciences, Federal University of Rio de Janeiro, Rio de Janeiro, Brazil
- 5Cooperative Institute for Marine and Atmospheric Studies, University of Miami, Miami, FL, United States
- 6Laboratorie d'Etudes en Geophisique et Oceanographie Spatiales, Toulouse, France
- 7Graduate School of Oceanography, University of Rhode Island, Narragansett, RI, United States
- 8Woods Hole Oceanographic Institution, Woods Hole, MA, United States
- 9Technological Research Institute, University of Santiago de Compostela, Santiago de Compostela, Spain
- 10National Oceanic and Atmospheric Administration, National Centers for Environmental Information, Silver Spring, MD, United States
- 11Commonwealth Scientific and Industrial Research Organisation, Oceans and Atmosphere, Hobart, TAS, Australia
- 12ACE CRC, CLEX, University of Tasmania, Hobart, TAS, Australia
- 13Institute for Marine and Antarctic Studies, University of Tasmania, Hobart, TAS, Australia
- 14Oceanography Department, University of Cape Town, Cape Town, South Africa
- 15Laboratoire LOCEAN/IPSL, Sorbonne Universités (UPMC Universités Paris 06) CNRS-IRD-MNHN, Paris, France
- 16The JCOMM in situ Observations Programme Support Centre, Plouzané, France
- 17Institute of Oceanography, Federal University of Rio Grande (FURG), Rio Grande-RS, Brazil
- 18ENEA, Italian National Agency for New Technologies, Energy, and Sustainable Economic Development, Santa Teresa Research Centre, Lerici, Italy
- 19Indian National Center for Ocean Information Services, Ministry of Earth Science, Hyderabad, India
The first eXpendable BathyThermographs (XBTs) were deployed in the 1960s in the North Atlantic Ocean. In 1967 XBTs were deployed in operational mode to provide a continuous record of temperature profile data along repeated transects, now known as the Global XBT Network. The current network is designed to monitor ocean circulation and boundary current variability, basin-wide and trans-basin ocean heat transport, and global and regional heat content. The ability of the XBT Network to systematically map the upper ocean thermal field in multiple basins with repeated trans-basin sections at eddy-resolving scales remains unmatched today and cannot be reproduced at present by any other observing platform. Some repeated XBT transects have now been continuously occupied for more than 30 years, providing an unprecedented long-term climate record of temperature, and geostrophic velocity profiles that are used to understand variability in ocean heat content (OHC), sea level change, and meridional ocean heat transport. Here, we present key scientific advances in understanding the changing ocean and climate system supported by XBT observations. Improvement in XBT data quality and its impact on computations, particularly of OHC, are presented. Technology development for probes, launchers, and transmission techniques are also discussed. Finally, we offer new perspectives for the future of the Global XBT Network.
Introduction
EXpendable BathyThermographs (XBTs) are instruments that provide the simplest and most cost-efficient solution for frequently obtaining temperature profiles along fixed transects of the upper thousand meters of the ocean. XBTs have been historically deployed by navies, research vessels, and merchant ships. The first XBT probes were tested in 1959, and systematic deployment of XBTs began in the mid to late 1960s. XBTs thereafter became the largest source of data for the upper ocean thermal record during the 1970s−1990s, with ~89,000 XBTs deployed in 1990. XBTs thus provide one of the longest available historical records of upper ocean temperature profiles (to ~1,000 m depth). Currently, XBTs deployed along fixed transects are grouped into what constitutes the Global XBT Network (Figure 1, top panel). During the past 10 years, 15,000–20,000 XBTs have been deployed annually. Most of the XBTs being currently deployed are from the Deep Blue type, which can reach depths of 800 m (Cheng et al., 2014).
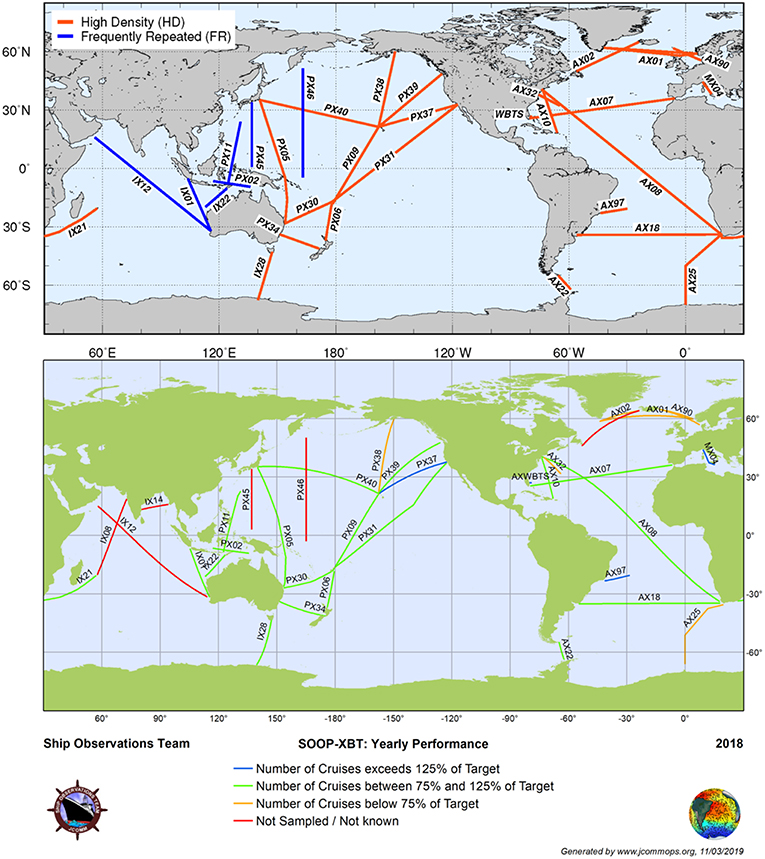
Figure 1. (Top) Location of the HD/HR and FR XBT transects recommended by the XBT Science Team during the 5th Science Workshop held in October 2016. Table 1 provides a detailed explanation of each transect. (Bottom) Annual performance of the XBT network. Targets are set by the XBT Science Team and compared to realization numbers for each transect. The KPI defined by the total number of realization numbers divided by the number of all targeted realizations is 82% for 2018.
Observations from the Global XBT Network provide repeated sections of temperature along fixed transects that cross regions that are critical for monitoring, understanding, and assessing surface and subsurface dynamical processes that occur in the upper ocean. Data from the Global XBT Network have been used extensively to estimate variability and changes in near-surface ocean properties (e.g., heat content) and dynamics (e.g., Levitus et al., 2012). XBT observations informed much of what is known about variability and changes in global and regional upper-ocean heat content (OHC) before the near-global Argo profiling float array was implemented (Riser et al., 2016; Jayne et al., 2017). XBT observations are extremely valuable in near-coastal regions and in some areas of the open ocean where they are the sole source of repeated hydrographic observations that resolve mesoscale features for assessing transports.
The current Global XBT Network collects observations at spatial and temporal scales that cannot feasibly be duplicated by other observational platforms. While platforms such as profiling floats (Riser et al., 2016) and underwater gliders (Rudnick, 2016) now provide temperature profiles, they cannot occupy repeated, mesoscale-resolving, trans-ocean basin transects across major currents on the time scales that are regularly sampled using XBTs from fast-moving ships. Observations from XBTs and from other profiling platforms should be seen as complementary. For example, XBTs provide targeted observations in specific regions, while Argo floats provide background information needed to understand the processes that lead to the variability observed by XBT observations (Figure 2). In addition, collocated observations from XBTs and other components of the Global Ocean Observing System (GOOS) can be used to identify and assess potential errors or biases within the observing system.
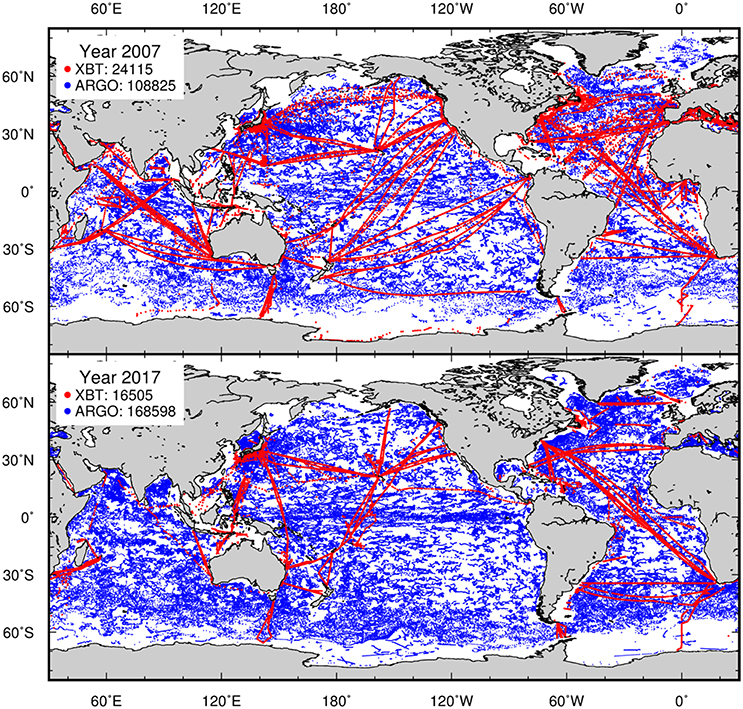
Figure 2. Location of XBT (red) and Argo float (blue) measurements during the years 2007 (Top) and 2017 (Bottom) that show the difference of spatial sampling produced by these observing platforms. The numbers indicate the observations made by each platform during these 2 years.
XBT observations are currently mainly used to:
1) Monitor the state and spatial and temporal variability of key surface and subsurface ocean currents and boundary currents, including their transport;
2) Monitor the state and variability of the Meridional Heat Transport (MHT) and Meridional Overturning Circulation (MOC) across ocean basins;
3) Provide upper ocean thermal observations to estimate global and regional OHC in areas undersampled by other observational platforms;
4) Initialize and validate Ocean Forecasting Systems; and
5) Provide constraints through data assimilation for ocean reanalysis hindcasts.
The two spatial modes of XBT deployment currently used in the Global XBT Network are:
1. High Density or High Resolution (HD/HR): Usually four or more repetitions are conducted annually along a fixed transect with an average of one XBT deployment about every 10–50 km along the ship track (35 XBT deployments per day at a ship speed of 20 kts). This mode is aimed at obtaining high spatial resolution in a single realization to resolve the spatial structure of mesoscale eddies, fronts, and boundary currents. These transects are designed to resolve boundary currents and to estimate basin-scale geostrophic velocity and mass and heat transports, including the MOC, and heat transport. This is currently the most widely used deployment mode.
2. Frequently Repeated (FR): Twelve or more repetitions are conducted annually along a fixed transect, with six or more XBT deployments performed daily along the transect every 100–150 km. This mode is aimed at obtaining repeat surveys along those transects where there is high temporal variability. This sampling mode is designed to produce well-resolved monthly time series that observe specific features of the thermal structure (e.g., thermocline ridges) or that obtain samples where intraseasonal variability is strong (e.g., the Indonesian Throughflow).
The currently operated transects (Figure 1, top panel) follow recommendations from the international review of the global upper ocean thermal network (Smith et al., 2001), OceanObs'99, OceanObs'09 (Goni et al., 2010), and recent recommendations from the XBT Science Team. Profiles from about 90% of the XBT deployments are transmitted in near real-time into the Global Telecommunication System (GTS), making up ~15% of the current real-time vertical temperature profile observations (not including the continuous temperature profiles made by some moorings).
Some XBT transects have been in operation for more than 30 years, thereby providing unique and valuable climate records. For example, AX10 (New York to San Juan) has provided key information about the variability in upper ocean temperature within the Gulf Stream for more than 55 years (Molinari, 2004). PX06 (Auckland to Fiji) has been occupied since 1986 and was the first transect sampled in HD/HR mode; it has now been sampled more than 90 times over 30 years. In the Indian and Pacific oceans, the FR transects IX01 (Western Australia to Java) and PX02 (Darwin, Australia to Indonesia) have been sampled for more than 35 years. Since the implementation of the Argo array in 1999 to sample the ocean interior (Gould et al., 2004; Riser et al., 2016), the focus of the XBT array has been to primarily monitor boundary currents and trans-basin sections that capture the meridional transport of heat and mass.
This review presents the current state of the Global XBT Network, major scientific advances resulting from the decades-long XBT record, and synergy between the Global XBT Network and other components of the observing system. Examples of how the XBT network contributes to both operational oceanography and monitoring the state of the ocean, particularly with respect to the MOC, OHC, and sea level change, and extreme weather events, are also highlighted.
XBT Operational and Scientific Oversight
XBT operations are coordinated on a global scale by the Ship Of Opportunity Programme Implementation Panel (SOOPIP), a network of the Ship Observations Team (SOT) which operates under the framework of the Joint Technical Commission for Oceanography and Marine Meteorology (JCOMM) of the World Meteorological Organization (WMO) and UNESCO's Intergovernmental Oceanographic Commission (IOC). The JCOMM Observations Programme Support Center (JCOMMOPS) is tasked with monitoring the operational efforts of the SOOPIP. It also implements Key Performance Indicators (KPI) and status maps for the current Global XBT network, re/defined by the international community (Figure 1, bottom panel).
The Global XBT Network is a key component of GOOS that addresses themes related to climate, operational services, and marine ecosystem health. The network directly or indirectly measures Essential Ocean and Climate Variables, such as sea surface temperature, subsurface temperature, surface and subsurface currents, and ocean surface heat flux. The scientific oversight and justification is provided and assessed by the XBT Science Team.
Scientific aspects of XBT observations are discussed within the XBT Science Team, which was created in 2011 and consists of more than 30 experts and scientists from 19 institutions and 10 countries. The focus of this team is to:
• Provide a voice in the scientific community to communicate XBT-related results;
• Organize meetings of the XBT community to discuss scientific advances in the use of XBT observations;
• Enhance international scientific collaboration;
• Make recommendations and prioritize transects of the XBT network;
• Make recommendations on XBT data management;
• Cultivate links to active and recognized scientific and operational panels of other observing platforms.
The XBT Science Team website1 provides easy access to XBT data, XBT-derived products and indicators, and other XBT-related scientific and operational information. It also brings scientists together to highlight the uses of XBT data, including upper ocean thermal structure and variability, ocean currents, and heat transport.
In addition to the XBT Science Team, scientists and operators involved in the XBT network participate in international panels that address many aspects of XBT operations, data management, and science. These panels provide a wide range of recommendations geared toward interdisciplinary and complementary studies, the continuous reporting of research highlights, and improvement of the XBT network integration with the GOOS. Some of these panels are:
• SOOPIP: This panel coordinates the operational and data management standards for the implementation and maintenance of the Global XBT Network from volunteer ships.
• IQuOD: The International Quality controlled Ocean Database (IQuOD) project focuses on the creation and distribution of a complete, high quality single ocean profile repository, including metadata, and assigned uncertainties, mostly for use in ocean climate research applications, data assimilation, and model evaluation2.
• GOSUD: The Global Ocean Surface Underway Data (GOSUD) Project is an IOC program dedicated to assembling and distributing quality-controlled data sets of underway sea surface temperature and salinity observations collected by cargo ships and research vessels.
• GTSPP: The Global Temperature and Salinity Profile Program (GTSPP) provide essential subsurface climate variables of temperature and salinity profile data, as well as timely and complete data with documented quality flags. It implements internationally agreed upon quality control standards and manages ocean data in accordance with the GOOS action plan.
Key XBT Scientific Contributions
Since the inception of the XBT network, XBT observations have led to pioneering research related to OHC, ocean current variability, and water mass and heat transports. The contributions of XBT observations to scientific research have been highlighted in thousands of publications and have also provided the basis for many student theses and dissertations. On average, about 100 peer-reviewed manuscripts that use XBT data are published annually.
XBTs have provided some of the longest continuous records of ocean currents, with many of the existing transects surpassing 30 years of uninterrupted observations across ocean basins on at least a quarterly basis. These include the surveillance of narrow boundary current regions that the global Argo array with its 3-degree spacing cannot resolve. XBTs are one of the few observational platforms capable of long-term monitoring of ocean current properties at the surface and at subsurface depths and of measuring trans-oceanic temperature sections at an eddy-resolving resolution. The maintenance of sustained temperature profile observations along these fixed transects is critical for long-term monitoring of the properties of key ocean currents and integrated transport across basins.
Scientists from the XBT community have been successful in developing and implementing novel methodologies, including multiplatform and multivariable assessments, that have become standard for monitoring and analyzing the state and variability of the ocean. In what follows, section the complementarity of XBTs with other observing platforms highlights studies that discuss the synergy of XBT transects with other components of the global observing system. Section Ocean currents, gyres, and ocean variability shows examples of how XBT monitoring has improved understanding of ocean currents, gyres, and ocean variability, while sections meridional heat transport, global and regional ocean heat content, and operational oceanography and ocean forecasts highlight MHT, global/regional OHC, and operational oceanography/ocean forecasts, respectively. Section Societal benefits of XBT observations provides an overview of the societal benefits of XBT observations, section Data management addresses XBT data management, and section Technological Improvements discusses technological improvements. Finally, section the future of the Global XBT Network presents the vision of the authors on the future of the Global XBT Network.
The Complementarity of XBTs With Other Observing Platforms
Several studies have combined XBT profiles with collocated Conductivity, Temperature, and Depth (CTD), Argo, and satellite altimetry observations to establish, for example, a statistical dynamic height relationship. By linking dynamic height to cumulative baroclinic transport across an XBT section, altimetric dynamic height can be used to extend the XBT sections into a near-continuous long-term time series of baroclinic transport. The synergy between XBT temperature profiles and sea surface height measured by satellites has been used extensively to monitor several current systems and regions, including the Antarctic Circumpolar Current (ACC) south of Tasmania (Rintoul et al., 2002), the Agulhas retroflection and ACC fronts south of Africa (Swart et al., 2008), the ACC fronts in the Drake Passage (Sprintall, 2003), the East Australian Current (Zilberman et al., 2018), across the North Pacific gyre (Roemmich and Gilson, 2001), the Brazil Current (Goni and Wainer, 2001), the North Brazil Current (Fonseca et al., 2004), the East India Coastal Currents in the Bay of Bengal (Sherin et al., 2018), the Gulf Stream (Molinari, 2011), and the Florida Current (Olson et al., 1983; Domingues et al., 2018). Section Ocean currents, gyres, and ocean variability shows examples of how XBT observations are integrated with data from other observing platforms to assess the state and variability of the ocean. The complementarity of XBT observations to data provided by other observing platforms are further shown in this issue for MHT (Frajka-Williams et al., 2019) and boundary currents (Todd et al., 2019).
Ocean Currents, Gyres, and Ocean Variability
Gulf Stream
The Gulf Stream, the Western Boundary Current (WBC) of the North Atlantic, has been linked to changes in various weather and climate phenomena, including extreme weather events over the Northwest Atlantic, the Atlantic Meridional Overturning Circulation (AMOC), and coastal sea level rise (Latif et al., 2000; Hoskins and Hodges, 2002; Joyce et al., 2009; Kelly et al., 2010; Kwon et al., 2010).
Four XBT transects monitor the Gulf Stream at different locations: AX08 (Cape Town to New York), AX10 (New York to Puerto Rico), AX32 (New York to Bermuda), and AXWBTS (Palm Beach, FL, to Grand Bahama). The first sustained time series of the position of the Gulf Stream, beginning in the early 1950s, was obtained by combining mechanical bathythermograph measurements with XBT data along AX10. These observations showed that meridional migration of the Gulf Stream is strongly correlated with the North Atlantic Oscillation (NAO) on decadal time-scales and that the meridional migration is also similar to anomalies in Gulf Stream upper layer transport and an east-west extension of the Gulf Stream southern recirculation gyre (Molinari, 2004).
The Gulf Stream between the northeastern United States and Bermuda has been surveyed for nearly 150 years. The H.M.S. Challenger collected the oldest documented temperature section across the Gulf Stream in 1873 (Rossby et al., 2010). Between the late 1960s and early 1970s, the US Naval Oceanographic Office made a large number of high resolution XBT sections from various passenger vessels between 40°N (the outer continental shelf) and 35°N. These data are currently being reassembled and will be archived cruise-by-cruise. Since 1977 the Global XBT Network has included XBT deployments across the shelf out to and sometimes into the Gulf Stream on a monthly basis along AX32 and in HD mode with transects AX10 and AX08. In late 1992, a program to measure upper ocean currents along the New Jersey-Bermuda section was implemented using the M/V Oleander, a container vessel. As part of this effort, additional XBTs are now being deployed across the Gulf Stream on a monthly basis.
A recent analysis of the 20-year time series of AX10 HD data (Figure 3A) shows that the Gulf Stream experiences strong north-south shifts, which can exceed two degrees of latitude on seasonal time scales. However, the current itself has not exhibited significant long-term trends in location (Figure 3B) or in transport (Figure 3C). Ongoing research indicates that 20 years of measurements using AX10 data show that below the seasonal mixed layer the largest temperature variability in the Gulf Stream occurs between 300 and 600 m depth. This is important because subtropical mode waters are found within this depth range. Geostrophic velocity estimated from each AX10 section using temperature measurements from XBTs and salinity inferred from the historical T-S relationship (Goes et al., 2018) shows that the temporal variations in the XBT-derived geostrophic velocity estimates are vertically coherent. Combining AX10 observations with satellite altimetry observations has also resulted in improved understanding of Gulf Stream changes over a larger region (50°-80°W). During 1993–2016, the Gulf Stream was found to experience a strong southward shift east of 65°W after passing the New England Seamount chain (Figure 4A). This southward shift was accompanied by a weakening of the Gulf Stream (Figures 4B,C). West of 70°W, however, the observed trends during 1993–2006 were very weak. This type of study is important because the sea surface temperature (SST) gradient associated with the Gulf Stream contributes significantly to the growth of midlatitude storm activity, storm tracks, and intensity (Chang et al., 2002; Kushnir et al., 2002; Nakamura et al., 2004).
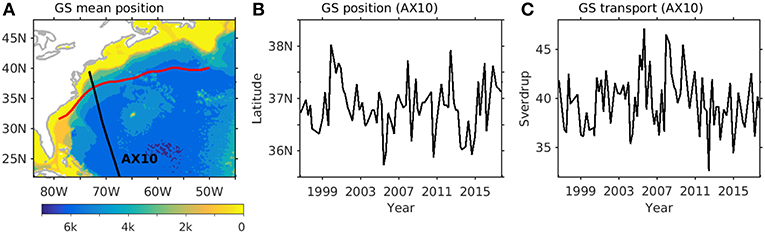
Figure 3. (A) Time-mean Gulf Stream position from satellite altimetry (red) and the location of the XBT AX10 transect (black). (B) Gulf Stream position from AX10 in degree latitude. (C) Gulf Stream transport in the upper 800 m water column from AX10 (referenced to 800 m); units are Sverdrups (106 m3 s−1). The background color shows the bottom depth.
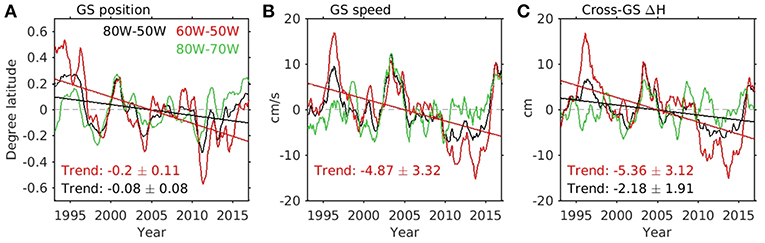
Figure 4. Zonally averaged Gulf Stream (A) position, (B) speed, and (C) cross-front sea surface height (SSH) difference (proxy for transport) derived from satellite altimetry.
Florida Current
The Florida Current is the WBC that feeds into the Gulf Stream and carries both the return flow from the subtropical wind-driven gyre and the upper branch of the AMOC. The Florida Current is routinely monitored by two XBT transects: AX07 (Miami to Gibraltar) and AXWBTS. While the AMOC has long been recognized as an important component of the climate system, changes in the intensity of the Florida Current transport and heat carried by the current have also been recently acknowledged as key drivers of regional sea level changes along the US East Coast (Ezer, 2013; Domingues et al., 2016). An analysis of XBT profiles from these transects reveals substantial year-to-year changes in the Florida Current temperature, which can exceed ±1°C over the full time record (Figure 5). The time series reveals that temperature anomalies are mostly coherent throughout the entire water column (e.g., late 2015), although ~30% of the time the anomalies above and below 100 m have opposite signs (e.g., early 1997). XBT data also revealed an unprecedented warming of the Florida Current during 2014–2015, which followed a relatively cold period in 2010–2013. During the 2014–2015 event, the entire water column in the Florida Straits was ~0.5°C warmer than average conditions. As discussed in section regional sea level changes, these changes are key drivers of coastal sea level anomalies in the region. Temperature changes in the Florida Current are also found to be uncorrelated with changes in the intensity of its flow (Domingues et al., 2018). These phases of warming and cooling of the Florida Current have important impacts on regional sea level changes along the US Southeast Coast.
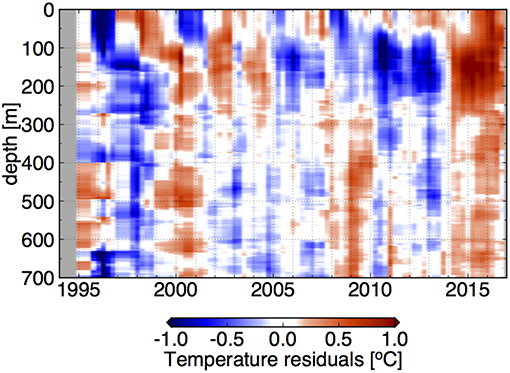
Figure 5. Depth-time diagram of the average temperature residuals (seasonal cycle removed and one 1-year low-pass filter applied) in the Florida Straits using subsurface temperature profile data derived from 1,925 XBT profiles (AX07 and AXWBTS) and 541 CTD casts sampled during 1995–2016.
Brazil Current
The Brazil Current (BC) is the WBC of the South Atlantic subtropical gyre. There are two XBT transects that cross the BC: AX18 (Buenos Aires to Cape Town) at 34°S and AX97 (Rio de Janeiro to Ilha da Trindade) at 22°S. Started in 2002 and 2004, respectively, AX18 and AX97 are the longest continuous efforts to assess the structure and variability of the BC. The BC is of key importance in closing the mass budget in the South Atlantic, since it is the WBC that closes the subtropical gyre, transporting waters from subpolar regions, thus constituting an integral part of the AMOC. Until the implementation of these two XBT transects, most of the BC observations relied on sparse cruise data, short period mooring deployments, or models. A recent study (Lima et al., 2016) used geostrophic velocity fields constructed from AX97 data to show that models generally misrepresent the structure of the variability of this current, simulating it as too deep, and too wide. AX97 transects have resolved the high mesoscale variability associated with the BC that can manifest in inshore or offshore states, depending on transient eddies and the semi-permanent Cape of São Tomé eddy (Mill et al., 2015). During the summer of 2009–2010, an extreme warm SST event (>3°C) was identified near 22°S off the coast of Brazil, which was associated with atmospheric teleconnections from a Central Niño event in the Pacific (Majumder et al., 2019). During the warm SST event, the XBT-derived geostrophic BC transport (12 Sv) was three times larger than average. This anomalous transport was physically linked to increased coastal upwelling and baroclinicity in the region (Goes et al., 2019). These processes enhance the SST gradient across the BC off Cabo Frio, Brazil, which generates wind convergence/curl and thickens the atmospheric boundary layer, impacting local weather and precipitation (e.g., Pezzi et al., 2016). Future work will include assessing the subtropical gyre variability and BC frontal changes to regional weather patterns.
East India Coastal Current in the Bay of Bengal
The upper layer circulation of the Bay of Bengal (BoB) is known to have strong seasonal variability (Eigenheer and Quadfasel, 2000). During the northeast monsoon, the East India Coastal Current (EICC) is the WBC of the BoB and flows equatorward along the east coast of India to Sri Lanka. Sherin et al. (2018) used 27 years of repeated XBT sections that cross the western (Chennai to Port Blair) and northwestern (Kolkata to Port Blair) regions of the BoB to study the EICC and its interannual variability. The EICC was found to be seasonally reversing, flowing poleward from February to July with a transport of 5 Sv and then flowing equatorward from October to December with a transport of 3 Sv. In March, 7 Sv in the EICC flows northeastward in the northwestern BoB. Weak northwestward flow (2 Sv at most) occurs during the remainder of the calendar year. The Indian Ocean Dipole (IOD) is found to have a significant influence on EICC variability. Remote wind forcing from the equatorial Indian Ocean associated with the EICC generates a northward (southward) anomalous transport of 5 Sv (7 Sv) during winter of positive (negative) IOD events (Sherin et al., 2018).
Tropical Atlantic Current System
The AX08 transect monitors and assesses the tropical Atlantic system of surface and subsurface currents and countercurrents at ~23°W. AX08 transect data and satellite-derived sea height fields revealed that altimetry data alone could not be used to identify and monitor all currents in the tropical Atlantic, particularly the undercurrents (Goni and Baringer, 2002). In a more recent study, Goes et al. (2013a) combined XBT data with historical temperature-salinity relationships, altimetric sea level anomalies, and Argo-based steric height data to estimate density and velocity properties of the tropical Atlantic eastward currents for the entire altimetric period (1992-present). Goes et al. (2013a) associated the variability of the North Equatorial Undercurrent (NEUC) and North Equatorial Countercurrent (NECC) with the main modes of interannual variability in the tropical Atlantic (Figure 6), particularly the Atlantic Meridional Mode (AMM) and associated excursions of the Intertropical Convergence Zone. The NECC and NEUC transports were found to be out-of-phase; the NECC (NEUC) is associated with positive (negative) AMM and led by the strengthening (weakening) of the trade winds. Although satellite altimetry measurements have sufficient temporal and spatial resolution to resolve most of the highly variable surface processes near the equator, the XBT data were critical in sampling the vertical and meridional structure of the subsurface currents, which are generally between 200 and 300 m deep and 100–150 km wide (Goes et al., 2013a).
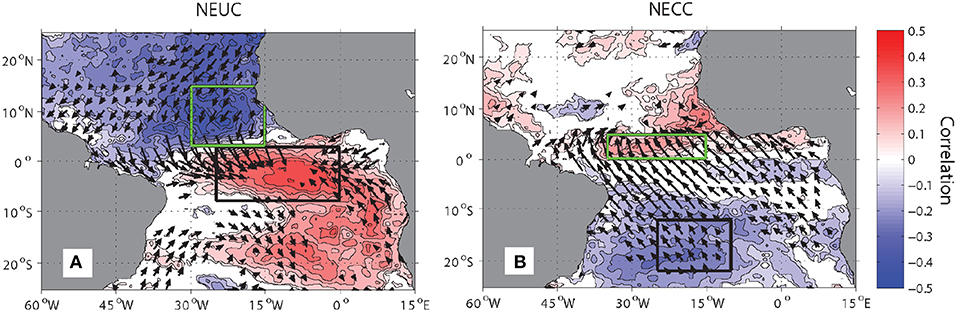
Figure 6. Simultaneous correlation of monthly anomalies of tropical Atlantic SST (contour) and pseudo wind stress (vectors) with the transport of (A) North Equatorial Undercurrent (NEUC) and (B) North Equatorial Countercurrent (NECC) at interannual timescales. Anomalies are calculated relative to the monthly means. The boxes represent the regions of maximum correlation.
The East Australian Current, the East Auckland Current, and the Tasman Sea
XBT transects PX30 (Brisbane to Fiji) and PX34 (Sydney to Wellington) cross the East Australian Current (EAC), the WBC of the South Pacific gyre. XBT transect PX06 (Auckland to Fiji) crosses the East Auckland Current (EAuC). These transects are among the longest running HR lines in the Global XBT Network and have now been sampling along near-repeat transects for over 30 years (Table 1).
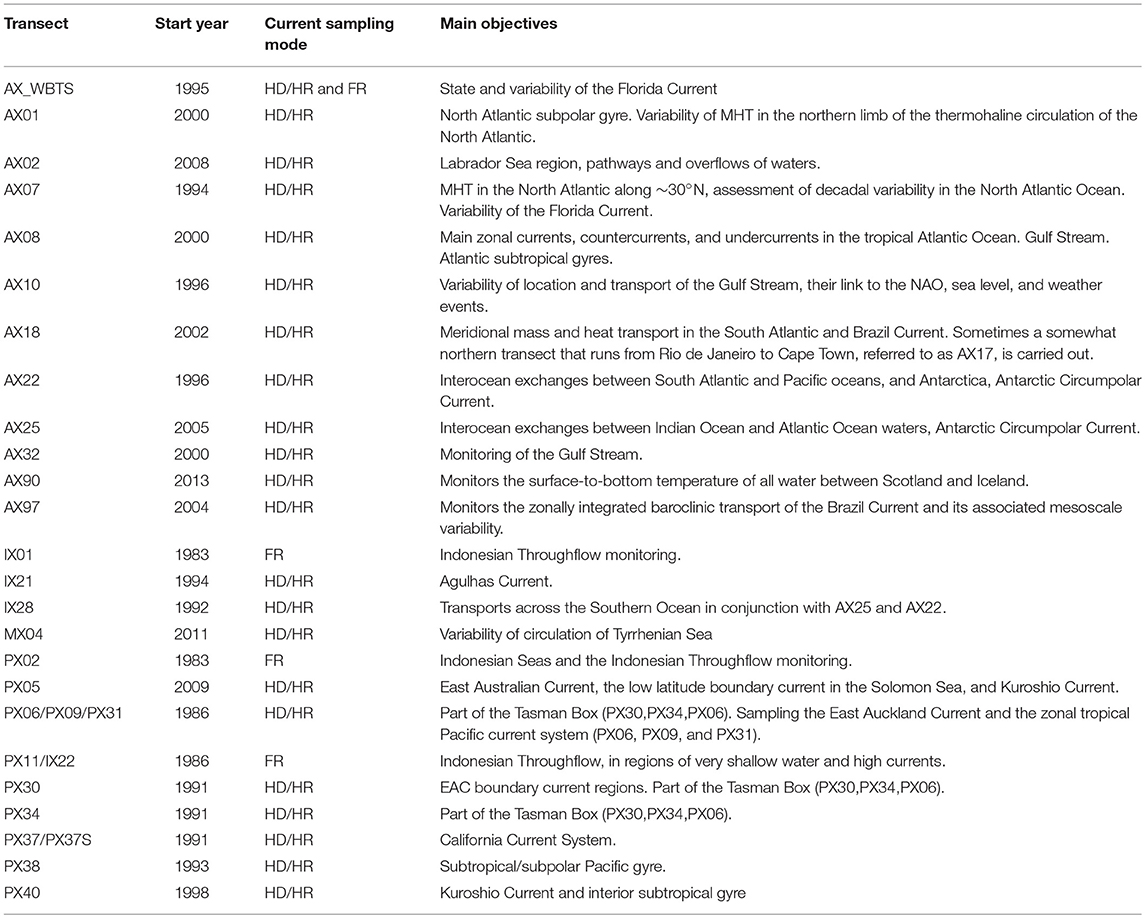
Table 1. List of all currently operational XBT transects, with year of implementation, mode of operation, and main ocean properties they observe.
Geostrophic velocity estimates obtained by combining XBT and satellite altimetry data have shown that the eastward flow from the separated EAC occurs in distinct permanent filaments (Ridgway and Dunn, 2003; Ridgway et al., 2008), demonstrating the banded nature of the mean velocity field. Hill et al. (2011) showed that southward transport in the Tasman Sea is strongly anti-correlated with the eastward transport of the Tasman Front (PX06) north of New Zealand. Moreover, a multi-decadal southward shift in the Southern Hemisphere westerly winds has resulted in less eastward transport in the Tasman Front and greater southward transport in the EAC Extension. This work, following a previous analysis by Roemmich et al. (2005), sheds light on not only long-term temperature and salinity trends in the Tasman Sea but also the ecosystem impacts of climate change in the EAC system. These XBT data have significantly contributed to our understanding of the mass and heat budgets in the Tasman region and the formation, spreading, characteristics, and variability of South Pacific Subtropical Mode Water (Roemmich and Cornuelle, 1992; Roemmich et al., 2005; Tsubouchi et al., 2007; Holbrook and Maharaj, 2008).
Considerable effort over the past 10 years has focused on expanding our knowledge of the temporal variability of the EAC and EAuC transports at interannual to decadal time scales, although uncertainties remain. The XBT-derived transport time-series show interannual variability with a period of about 4 years and a decadal trend toward lower eastward transport (Hill et al., 2008). This trend is consistent with changes in the wind stress curl that are believed to have caused the EAC to extend farther south over the past decade (Cai et al., 2005; Roemmich et al., 2007; Hill et al., 2011). Interestingly, in contrast to the EAC, there has been no significant trend in the EAuC transport over the past 30 years, and there is little correlation in variability with the large-scale or local wind forcing (Fernandez et al., 2018).
Improved estimates of the oceanic advection of heat in the EAC region would have a beneficial impact on weather forecasts, modeling of marine ecosystems, and fisheries management (Suthers et al., 2011). Transport estimates across PX30 show time-mean and low-frequency variability of the EAC transport that are consistent with overlapping and nearly collocated moored observations by Sloyan et al. (2016) (Figure 7). Studies that combine synergistic measurements of HD XBT data with altimetry and Argo observations are conducive to understanding the along-current variability of the EAC, resolving both the major jets and the EAC recirculation, and improving estimates of the basin-scale transports of mass, heat, and freshwater in the shallow South Pacific MOC. A pilot project that will merge data from the XBT network with multidisciplinary data from Argo floats, satellites, gliders, and ocean moorings is presently underway to connect ocean dynamics and productivity in the EAC and over the continental shelf.
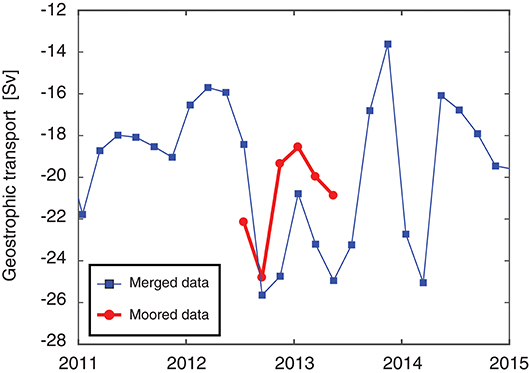
Figure 7. Time series of the absolute geostrophic transport normal to the PX30 nominal track in the EAC region west of 155.3°E from 2011 to 2015, computed using merged high-resolution XBT (HR-XBT), satellite altimetry, and Argo profiles and trajectory data, are shown in blue. Transport estimates using moored data at 27°S are indicated in red. Both series are smoothed with a 4-month running mean. Transport estimates averaged between April 2012 and August 2013, are 23.3 Sv using the HR-XBT/Argo/altimetry method, and 21.1 Sv from moored data.
Kuroshio Current
The Kuroshio Current, the WBC of the North Pacific gyre, is sampled by XBT transect PX40 (Honolulu to Yokohama) that began in 1998. This transect is often combined with XBT transects PX37 (San Francisco to Honolulu) and PX10 (Honolulu to Guam) to estimate the complete trans-basin mean heat and freshwater transports in the North Pacific (Uehara et al., 2008; Douglass et al., 2009, 2010; Auad et al., 2011; Nagano et al., 2012, 2016).
An analysis of the total heat budget of the North Pacific Ocean, including heat storage, air-sea flux, and heat transport by the ocean circulation, was carried out using HR XBT data and an ocean data assimilation model (Douglass et al., 2009, 2010). The mean offset between the northward heat transport from XBT data and that estimated from the model is due to the low model resolution near the WBC and to a meridional offset in the simulated position of the North Equatorial Current. Model-based and observational analyses show good agreement in their temporal variability, demonstrating large interannual variability in the ocean heat transport. The heat transport and heat storage components largely balance one another, with less variability in the air-sea exchange component.
Nagano et al. (2012, 2016) used the PX37/40 transect data to quantify the variability in the interior. Their integrated analysis of XBT, profiling float, and satellite altimetry data showed that the volume transport-weighted temperature of the interior flow shows clear seasonality and that its anomaly from the mean seasonal cycle varies on quasi-decadal time scales. The weighted temperature peaked in 1998 and 2007, contributing between 6 and 10 TW to the net heat transport, ~1 year before peaks in SST occurred east of the Philippines. These results suggest that the heat budget of the warm water pool is sensitive to the interior heat transport in the central North Pacific. On interannual and longer time scales, the variability is mostly related to shifts in the Pacific Decadal Oscillation.
Indonesian Throughflow
One of the longest running transport measurements in the Indonesian region comes from the frequently repeated IX01 (Fremantle, Western Australia to Java) XBT section with approximately 18 repetitions per year since sampling began in 1983. Estimates of upper ocean temperature and geostrophic transport of the Indonesian Throughflow (ITF) therefore extend back 35 years (Sprintall et al., 2019). This remarkable XBT record confirms that the shallow ITF transport increases during La Niña and decreases during El Niño (Wijffels et al., 2008), but this effect is greatly weakened by canceling from in-phase wind forcing in the Indian Ocean associated with the IOD (Wijffels and Meyers, 2004; Liu et al., 2015). A clear long term strengthening of the ITF has been observed (Liu et al., 2015), likely associated with the strengthening Pacific Trade winds since 1984 (England et al., 2014).
Antarctic Circumpolar Current
In the Southern Ocean, westerly winds drive the flow of the ACC system and its associated fronts, serving as a major conduit for inter-oceanic exchange of heat and salt between the Pacific, Atlantic, and Indian oceans. There are three XBT transects that routinely monitor the ACC, strategically placed at inter-ocean chokepoints: AX22 (across the Drake Passage), AX25 (Cape Town to Antarctica), and IX28 (Hobart to Antarctica). One of the key contributions of these XBT transects in the ACC is an improved understanding of the underlying dynamics driving the multi-branch structure of the ACC, which largely determines the overall variability associated with this current (Sprintall, 2003; Swart et al., 2008; Sprintall et al., 2012; Domingues et al., 2014). These XBT sections also monitor the boundary currents, giving key seasonal and interannual observations of inter-ocean exchange (along the northern boundaries) and Antarctic boundary current variations (in the south).
XBT observations collected along AX25, when jointly analyzed with temperature and salinity climatological fields and nearby observations from Argo floats and satellite altimetry, show that the Subantarctic Front (SAF) and the Antarctic Polar Front transport together account for over 80% of the total ACC transport at this longitude (Swart et al., 2008). The year-to-year changes of frontal transports were driven by local winds associated with the Southern Annular Mode (Domingues et al., 2014). However, local winds were not directly linked to meridional excursions of these fronts in this region (Sallée et al., 2008). XBT data have shown that the location and transport of the various frontal regions along the AX25 transect do not have a strong annual cycle. The SAF transport, for example, is related to the local wind field and so exhibits a biannual period.
Observations along the northern part of IX28 south of Tasmania have revealed strong interannual variations in the exchange of subtropical waters from the Tasman Sea to the Indian Ocean that are linked to poleward shifts in the position of the Subtropical Front and the Subantarctic Front which are, in turn, impacted by El Niño-Southern Oscillation (ENSO) variability (Morrow et al., 2008; Sallée et al., 2008). Water mass variations here are strongly linked to mesoscale eddy activity from the Tasman Sea (Morrow and Kestenare, 2014; Pilo et al., 2015) and to cold-core eddies crossing the Subantarctic Front (Morrow et al., 2004).
In September 1996, a high-density XBT sampling program across the Drake Passage was initiated on the US Antarctic Program (USAP) vessel to study temperature and geostrophic transport variability: over 140 transects have been completed as of 2018. The AX22 transect represents the longest repeat year-round upper ocean transect in the Southern Ocean. In fact, the principal USAP vessel serves as a “super-ship” with concurrent measurements of near-surface currents and acoustic backscatter from shipboard acoustic Doppler Current Profilers (ADCP); salinity profiles obtained through Expendable CTD (XCTD) sampling; measurements of the near surface underway partial pressure of CO2 (pCO2) and discrete total CO2 (TCO2), nutrients, δ13C of TCO2, nutrients (nitrate, phosphate, silicate), and salinity. High-precision continuous atmospheric O2 and CO2 measurements were added in 2012. Typically, six to seven transects of XBT/XCTD and discrete surface measurements are completed annually, while the ADCP, pCO2, and atmospheric O2/CO2 sensors sample continuously along all cruise tracks, about 22 Drake Passage transects annually. Together these underway measurements provide concurrent information on the physical and biogeochemical air-sea variability at high temporal and spatial resolution on a near year-round basis, an unmatched achievement in the Southern Ocean.
The near-repeat HR XBT/XCTD/ADCP sampling along AX22 in the Drake Passage is designed to study modes of variability in the ACC on seasonal to interannual time scales (Sprintall, 2003, 2008) and on space scales from that of current cores (~50–100 km) to eddies (~10 km) (Lenn et al., 2007, 2011). The combined XBT temperature and ADCP velocity observations have been used to describe and quantify the mean jets, mesoscale variability, and eddy momentum and heat fluxes in the Drake Passage (Lenn et al., 2007, 2008, 2011; Firing et al., 2011) and to resolve the Southern Ocean Ekman layer (Lenn and Chereskin, 2009; Polton et al., 2013). These observations have also been used to determine variability in properties and fronts (Dong et al., 2006b; Thompson et al., 2007; Sprintall et al., 2012), and the mixed layer depth and shear (Stephenson et al., 2012, 2013; Brannigan et al., 2013). Additionally, the data have been used for validation of satellite products (Dong et al., 2006a, 2010). The combined observed nutrient, carbon, and XBT temperature AX22 time series were used to examine the balance of net community production in the surface layer, providing an opportunity to validate satellite-based productivity algorithms and to improve understanding of the role of the Southern Ocean in the global carbon cycle (Munro et al., 2015). Finally, the AX22 XBT data are also assimilated into the Southern Ocean State Estimate (SOSE) and used to test ocean and coupled climate models (Jiang et al., 2014).
XBT data have detected warming trends in the Southern Ocean and revealed details regarding processes that could lead to warming. In the Antarctic Zone, data from the IX28 and AX22 transects show that Antarctic Surface Water and Upper Circumpolar Deep Waters have warmed over the past several decades (Morrow et al., 2008; Sprintall, 2008) and that the cold Winter Water tongue has become warmer, thinner, and shallower. In the South African sector, warming anomalies observed using XBT data have reached values as large as 1°C in the Ekman layer that are linked with changes in the wind field that could potentially provide a source for the overall ACC warming. Large-scale changes in the wind forcing, related to the Southern Annular Mode, may contribute to the deeper warming trend in the vicinity of Antarctica (Morrow et al., 2008; Sprintall, 2008) and the periods of biannual fluctuations south of Australia (Morrow et al., 2008).
Mediterranean Sea
The MX04 XBT transect (Genoa to Palermo) has been sampling upper ocean variability in the Tyrrhenian Sea and the northeastern Ligurian Sea since September 1999. To date, about 90 transects have been completed, resulting in over 3,000 profiles. This XBT transect is nearly coincident with one altimetric track, allowing a combination of XBT, and remotely sensed sea surface height anomaly data to estimate the geostrophic circulation (Vignudelli et al., 2003; Ciuffardi et al., 2016; Napolitano et al., 2018). The Tyrrhenian Sea is an area where the mixing of the waters coming from the eastern and western Mediterranean occurs, while the formation of dense winter waters takes place in the Ligurian Sea. XBT temperature profiles have shown a warming that could be linked to the anomalous 2003 summer (an unusually long, hot, and dry season in the southern Europe). After a return to temperature conditions prior to 2004, a new anomaly appeared in 2014 in the Tyrrhenian Sea with a warming tendency in the 200–500 m depth layer moving from south to north (Ribotti et al., 2016). Over the years, this thermal anomaly has increased and extended both in depth (up to about 700 m) and in the involved areas, which include the northeastern part of the Ligurian Sea (albeit with lower intensity). Even if in a non-homogeneous way, this heating process continued until the end of 2018, when the warming seems to have stopped. The current temperature variations with respect to the pre-warming conditions are in the range of 0.3–0.6°C and decrease when latitude and depth increase. The mechanism producing these recent anomalies is still under analysis because it is unclear whether it can be explained in terms of climatic changes or variability of circulation (Schroeder et al., 2017; Von Schuckmann et al., 2018). The warming of seawater in the Ligurian and Tyrrhenian seas also appears to be connected to a recent increase in local extreme weather events. The monitoring of these two seas is thus crucial for a correct interpretation of the ocean-atmospheric variability, and the MX04 XBT transect is able to easily provide very useful data for such analyses.
Meridional Heat Transport
Meridional Heat Transport in the Atlantic Ocean
In the Atlantic, zonal XBT transects AX18 and AX07 are used to assess the Atlantic MHT and the AMOC at 35°S and 30°N, respectively. Although mooring arrays have been in place since 2004 in the North Atlantic and 2009 in the South Atlantic to observe and monitor the AMOC (Frajka-Williams et al., 2019), deriving MHT from these boundary arrays is challenging without temperature measurements in the interior region.
The AX18 XBT transect with trans-basin temperature measurements is the only observing system currently available to provide MHT estimates in the South Atlantic. Results obtained to date from AX18 show that the MOC and MHT across 35°S are approximately 18.47 ± 1.73 Sv and 0.56 ± 0.13 PW, respectively, and have not experienced statistically significant trends during the observing period. A distinguishable seasonal cycle was, however, found for the geostrophic and Ekman heat transports, which have similar amplitudes but are close to 180° out-of-phase. Consequently, this explains the small amplitude of the seasonal cycle in the total northward MHT and MOC (Dong et al., 2009, 2011). Statistical analyses of the MOC and MHT in this region using XBT data indicate that they are significantly correlated. Results from this transect also provide a ground truth for evaluating numerical models and methodologies to estimate the MOC using other data sources. Current generation climate models are unable to reproduce the seasonal variations in the geostrophic transports; subsequently, the model MOC and MHT seasonal evolution is controlled largely by Ekman transport (Dong et al., 2014). A detailed analysis of XBT observations show that the weak seasonal cycle in geostrophic transport from Coupled Model Intercomparison Project Phase 5 (CMIP5) Models [National Center for Atmospheric Research Community Climate System Model (NCAR-CCSM4) and the Geophysical Fluid Dynamics Laboratory Earth System Model (GFDL-ESM2M)] is due to poor representation of the boundary currents and vertical stratification.
Some XBT transects are currently being assessed using Observing System Experiments (OSEs) to determine the best strategy for monitoring currents and mass and heat transports. For example, AX18 was assessed using the HYbrid Coordinate Ocean Model (HYCOM)/Navy Coupled Ocean Data Assimilation (NCODA) eddy resolving analysis (Goes et al., 2015a). Results showed that horizontal resolution finer than 25 km is required to resolve boundary currents, that at least 15 years of quarterly sampling is needed to resolve the seasonal cycle of the MOC, and that altimetric sea level height can be used to infer the barotropic mode.
The close relationship between satellite sea surface height anomalies with the vertical temperature structure between 20° and 34.5°S (Dong et al., 2015) has allowed the assessment of changes in MOC/MHT with latitude back to 1993, the start of operational satellite altimetry observations. The 20-year time series of the altimetry-derived MOC showed the geostrophic component dominant during the 1993–2006 period and the Ekman component dominant between 2006 and 2011 at 34.5°S (Dong et al., 2015). One important result is that during 2017 the MHT at latitudes between 20° and 34.5°S show strong positive anomalies (Figure 8), which were dominated by the geostrophic transport at 20° and 25°S and by the Ekman transport at 30° and 34.5°S3. This indicates that measurements of both the water column density and surface wind fields are needed to correctly assess the MHT. The multi-latitude estimates of the MOC and their co-variability with SST further allowed development of MOC indices back to the 1870s using SST reanalysis products (Lopez et al., 2017). The century-long MOC indices were used to investigate the link between the South Atlantic MOC and changes in climate and extreme weather events, as suggested by climate models (see section Regional sea level changes).
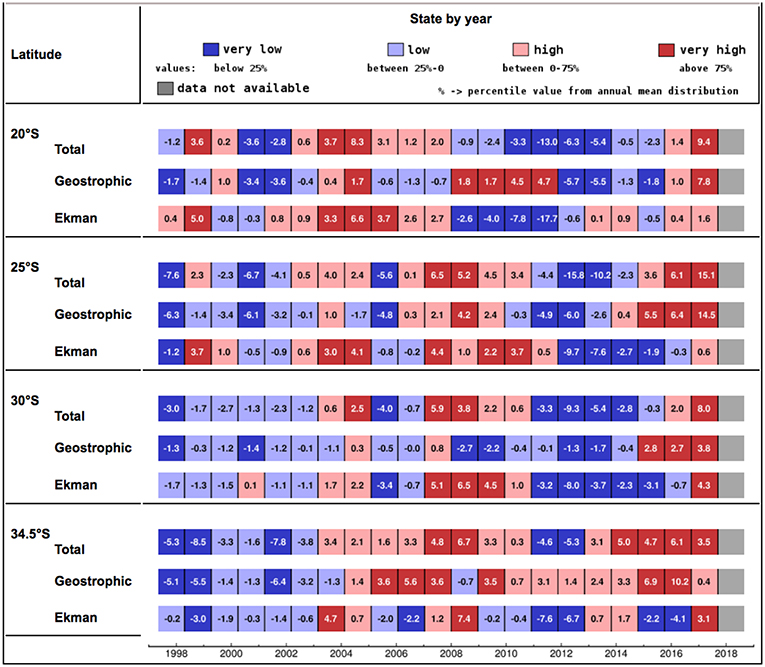
Figure 8. Meridional Heat Transport (MHT) anomalies in the South Atlantic using a combination of XBT, satellite altimetry, and historical hydrographic observations with the red (blue) colors indicating values higher (lower) than the 1993–2017 assessment period average. Values are reported in Petawatts (1 PW = 1015 watts), and multiplied by 100 for display purposes.
In the North Atlantic, ongoing analyses of observations along AX07 have shown that the 20-year mean MHT at 30°N is about 1.16 ± 0.19 PW, largely due to geostrophic transport (1.13 ± 0.25 PW) and that the temporal variability of the MHT is highly correlated with the geostrophic component (R = 0.90)4. The correlation between MHT and its Ekman component is somewhat lower and negative (−0.33), but still exceeds the 95% significance level of 0.22. In contrast to that in the South Atlantic, the MHT and its geostrophic component at 30°N do not show a significant seasonal cycle, although the Ekman component varies seasonally with high values during winter and low values during summer. The 20-year time series from AX07 suggests an increasing trend of 0.21 ± 0.07 PW/decade in the geostrophic transport, which is partially compensated for by the decreasing trend of 0.11 ± 0.03 PW/decade in the Ekman transport. An analysis of XBT observations finds that the total MHT across 30°N has a net increasing trend of 0.10 ± 0.06 PW/decade.
Frajka-Williams et al. (2019) provides a discussion of the different approaches for estimating the AMOC, including their advantages and limitations. They also provide key results when using the various observational platforms and make suggestions for implementing future observational efforts.
Global and Regional Ocean Heat Content
XBTs have provided about 38% of the global temperature observations obtained between 1970 and 2000 for profiles down to a depth of 300 m and a larger portion for profiles to 700 m depth. During the Argo era, ~15% of the global temperature profiles are still from XBT deployments. As such, XBT observations have been, and continue to be, an essential source of information for the derivation of global and regional OHC changes since the 1970s (Lyman et al., 2010; Abraham et al., 2013; Boyer et al., 2016; Cheng et al., 2016b, 2017). As assessed by the Fifth Assessment Report of the Intergovernmental Panel on Climate Change (IPCC-AR5) (Rhein et al., 2013) and other studies (Domingues et al., 2008; Lyman and Johnson, 2008; Cheng et al., 2017), uncertainty in global OHC is reduced after ~1970, coincident with improved sampling due to the introduction of the XBT network (to 400 m depth). With this long-term accumulation of XBT data, scientists can now provide a long-term record for OHC change as a basis for mapping ocean heat uptake (Figure 9). Since OceanObs'09, Levitus et al. (2012) and Ishii et al. (2017) have provided major updates to their long-term OHC estimates since the 1950s. Recently, Cheng et al. (2017) proposed an improved estimate of OHC, since 1960, using a recommended XBT data quality improvement scheme (section Technological Improvements). All of these estimates show a significant ocean warming since 1960, with an acceleration since the 1990s (Wijffels et al., 2008; Gleckler et al., 2016; Cheng et al., 2017). All major ocean basins have experienced significant warming since 1960, with the greatest warming in the southern oceans south of 30°S (Cheng et al., 2017) (Figure 9). The significant Southern Ocean warming is mainly due to the increased greenhouse gas effect (Shi et al., 2018; Swart et al., 2018). Decadal and multi-decadal scale OHC changes in the Indian Ocean were also robustly observed and are due to the changing relative contribution of Pacific wind forcing through the ITF, local wind, and heat flux forcing over time (Lee et al., 2015; Nieves et al., 2015; Li et al., 2018).
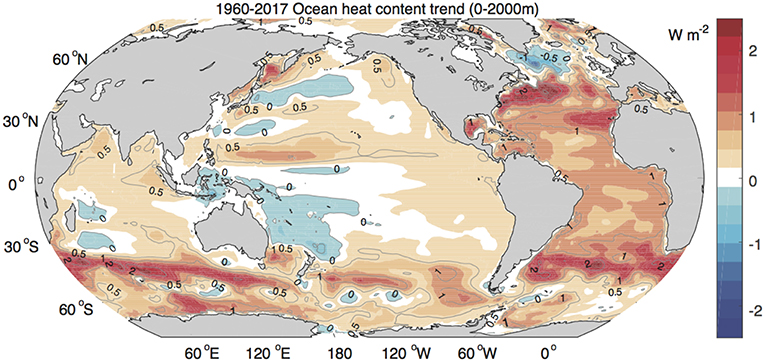
Figure 9. Observed ocean warming rate in the upper 2000 m since 1960 (Figure updated from Cheng and Zhu, 2016 and Cheng et al., 2017). The data used to generate this figure is from gridded ocean temperature analysis in Cheng et al. (2017), and this analysis is based on all available in situ ocean subsurface temperature observations (including XBT data) from World Ocean Database (Boyer et al., 2013).
The observed long-term OHC record also provides a key tool to evaluate climate models. Cheng et al. (2016a) and Gleckler et al. (2016) compared the observed OHC records with simulations from CMIP5 during the 1970–2005 period, showing that the CMIP5 ensemble mean agreed with observations, although an underestimation of the global ocean warming in the Southern Hemisphere could be possible due to poor sampling (Durack et al., 2014). However, the uncertainties in models are much larger than in the observations, indicating that observational OHC records, including those that use XBT observations, remain a critical metric for model evaluation.
The subsurface temperature data in the western North Atlantic Ocean can be used to investigate variations in the upper OHC and to assess the contributions from surface heat fluxes and oceanic processes (Dong et al., 2007a). A heat budget study in a region bounded by the XBT transects AX07, AX08, AX10, and the Gulf Stream (Dong et al., 2007b) indicates that the year-to-year upper OHC changes were driven by the oceanic heat transport, which was dominated by the geostrophic component. The heat content anomalies, in turn, forced anomalous air-sea heat exchanges, suggesting that geostrophic advection in the Gulf Stream plays an important role in air–sea coupling.
Operational Oceanography and Ocean Forecasts
In the context of operational oceanography, XBTs are widely used among international centers that run Ocean Forecasting Systems (OFSs). Tonani et al. (2015), in a revision of the status and future of global and regional ocean prediction systems, provided a geographic distribution of the centers that developed OFSs under the Global Ocean Data Assimilation Experiment (GODAE) and GODAE OceanView initiatives. The configuration of OFSs is quite variable in terms of horizontal and vertical resolution, the base model adopted, and data assimilation. While some of the systems are limited to a specific geographic region (e.g., the Oceanographic Modeling and Observation Network, REMO configuration focuses only on the South Atlantic Ocean), 12 of these OFSs are global systems. A common ground for these systems is the use of vertical profiles of temperature and salinity from different platforms (e.g., ship-based CTD, XBT, Argo, gliders, and drifters) in their data assimilation schemes. Martin et al. (2015) presented a more detailed description of seven of these systems, which assimilate XBT data in near real-time.
In terms of representativeness and impact, vertical profiles of temperature that are obtained from different observational platforms are being evaluated in a complementary manner. In an assessment of the current status of the real-time in situ GOOS for operational oceanography, Legler et al. (2015) argued that XBT transects provide a very different view of the global ocean to that of Argo floats. XBT deployments sample along well-observed transects, at either large or small spatial scales or at special locations such as boundary currents and chokepoints, all of which are complementary to the global Argo broad scale array.
The impact of XBT data on improving OFSs can be assessed by OSEs. In a near real-time OSE using the UK Met Office's operational OFSs–Forecasting Ocean Assimilation Model where XBT data were not assimilated, Oke et al. (2015a) found that although XBT data did not significantly impact global metrics, they did have significant local impacts. On a global scale, suppression of XBT data resulted in a mean (maximum) temperature difference of ~0.04°C (5.42°C), which compares to a difference of 0.27°C (10.53°C) in the case of suppressing Argo data. Moreover, Oke et al. (2015a) argued that, although XBT data represented a small component of the GOOS, their impact in the vicinity of the XBT transects was significant. Suppression of XBT data resulted in a marked degradation of the forecast system. Focusing on regional applications, Oke et al. (2015b) found that carefully designed in-situ observation arrays (e.g., optimized glider fleets and XBT observations) added significant constraint to high-resolution models, with improvements as much as 40% in the representation of ocean density (Oke et al., 2015b).
Reanalysis Products
Estimation of the tropical ocean's state is important for seasonal to interannual predictability. For example, ocean observing systems in the tropical Pacific are frequently evaluated by carrying out estimates of ocean state (“reanalysis”) and comparing them to withheld observations. Errors in reanalysis products include both formal mapping errors arising from sparse or noisy observations and representation errors that arise from low resolution, missing physics, or errors in the model–data synthesis methodology.
The evolution of the Tropical Pacific Observing System (TPOS) 2020 project recommends the use of data assimilation to combine observations and to assess the design of the TPOS. A necessary first step in this procedure is to have a measure of the errors and performance of the assimilation systems. Verdy et al. (2017) evaluated the performance of a 4-Dimensional Variable system that assimilates Pacific Ocean XBT transect data, as well as Argo and remotely-sensed sea surface height (SSH) data sets, as a necessary step to inform use of the output for dynamical analysis or for data impact studies. A comparison to independent observations from Tropical Atmosphere Ocean (TAO) moorings showed that for time scales shorter than 100 days the state estimate that included the Pacific XBT data improved estimates of TAO temperature relative to an optimally interpolated Argo product. The improvement was greater at time scales shorter than 20 days.
Societal Benefits of XBT Observations
Extreme Weather
The time series of MHT in the South Atlantic, obtained using a combination of XBT and satellite observations and coupled general circulation models, has served to assess the potential predictability of monsoon rainfall. The global monsoon system is defined by regions where summer precipitation exceeds 75% of the total annual rainfall (Wang et al., 2012). These regions encompass more than 55% of the global population and are important sites for global agricultural output. Decadal variability of the South Atlantic MOC and MHT plays a key role in modulating global atmospheric circulation via its influence on interhemispheric redistributions of momentum, heat, and moisture that influence the global monsoon system (Lopez et al., 2016). MOC variability could modulate the strength of global monsoons with a 20–30 year advance lead time (Lopez et al., 2016), which suggests that the time series obtained from the AX18 XBT transect at 34°S could serve as a predictor of monsoon precipitation.
Transport estimates from the AX18 transect were used to reconstruct a century-long MOC estimate from 20° to 35°S in the South Atlantic (Lopez et al., 2017) using a multivariate Empirical Orthogonal Function method, which quantifies the joint covariability between MOC and SST (Figure 10A). Four SST products were employed, including the Hadley Center SST (HadSST), the Extended Reconstructed SST version 3 and 4 (ERSSTv3 and ERSSTv4), and the Centennial Observational Based Estimates SST (COBE-SST). An MOC was jointly derived from XBT and altimetry observations that extend from 1993 to the present (2017). For reconstruction purposes, this is referred to as the training period to obtain the joint covariance of observed SST-MOC. The reconstructed century-long MOC was then used to assess the role of the MOC in modulating extreme weather events, such as heat waves over the US (Figure 10B). For example, there is an increase in the likelihood of heat waves in the US when the South Atlantic MOC is weaker than normal compared to those periods when the MOC is stronger than normal. South Atlantic MOC variability leads US heat wave occurrence by about 30 years (Figure 10C). This is consistent with the model results of Lopez et al. (2016) and highlights the need for continuing the effort to monitor the MOC through XBT and other observational platforms, as the MOC is a potential predictor of high-impact extreme weather events on decadal timescales. This longer time series, together with historical weather records, will allow us to dynamically and statistically assess the role of the South Atlantic MOC on global weather events.
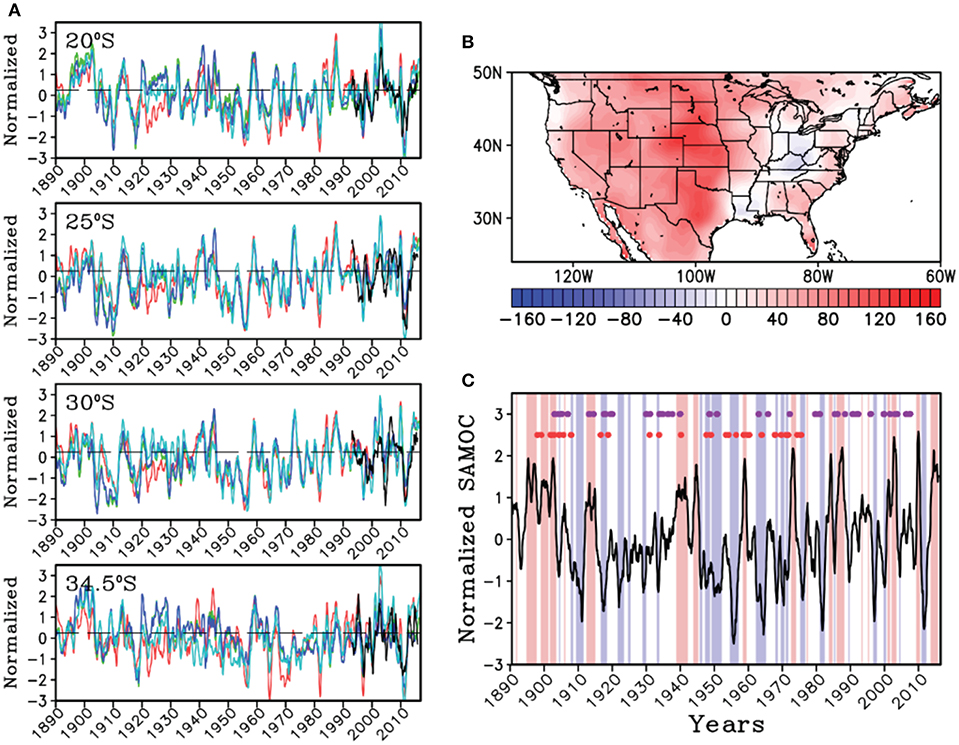
Figure 10. (A) Reconstructed South Atlantic MOC at four different latitudes from 1870 using XBT, satellite altimetry observations (black), and SST from HadSST(red), ERSSTv4 (green), ERSSTv3 (blue), and COBE-SST (cyan). (B) Percentage change in the number of heat waves during weak minus strong South Atlantic MOC when the MOC leads heat waves by 30 years. (C) Reconstructed South Atlantic MOC from HadSST at 30°S (black) with periods of strong (weak) MOC red (blue) shading. The historical US heat waves are shown by the purple dots (red dots are lagged by 30 years to show the correspondence of weak MOC and more heat wave events 30 years later).
Regional Sea Level Changes
Coastal sea level changes are caused by the combined effect of various global and regional forcing mechanisms. Along the US East Coast, changes in the Florida Current and Gulf Stream dynamics and heat content are one source of sea level variability. During 2010–2015, accelerated sea level rise with rates as large as 25 mm year−1, five times larger than the global average for this period, were observed along the southeast US coast that coincided with extensive flooding of large urban areas such as Miami, Florida. Simultaneously, sea levels decreased rapidly north of Cape Hatteras at similar rates (Domingues et al., 2018).
Over 2,000 XBT temperature profiles from transects AXWBTS and AX07, used together with ship CTD data, allowed for the identification of a temperature shift of the Florida Current from a cold phase (2010–2013) to a warm phase (2014–2015). Altimetry and tide gauge data showed that the warm phase caused the accelerated sea level rise recorded between Key West and Cape Hatteras (red line, Figure 11). The Florida Current warming recorded during this period accounted for ~13 cm of sea level rise solely due to a thermal expansion of the water column (magenta line, Figure 11). A continuous record of the Florida Current transport in the Florida Straits further indicated that the transport remained relatively constant during this time period (filled curve, Figure 11), revealing the dominant contribution of temperature changes for driving coastal sea level changes (Domingues et al., 2018).
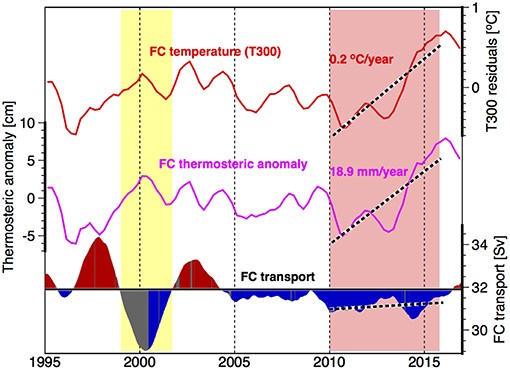
Figure 11. Time-series of the average temperature residuals (seasonal cycle removed) for the upper 300 m of the water column in the Florida Straits (red, T300), of thermosteric anomalies derived from the temperature data observed in the Florida Straits (magenta), and of the Florida Current (FC) volume transport (red and blue filled curve) measured in the Florida Straits using telephone cable voltage differences, and complemented using satellite altimetry data (gray). All time series are displayed after applying a 1-year low pass filter.
North of Cape Hatteras, more than 10,000 XBT observations from transects AX10, AX08, and AX32 revealed that the observed sea level decline along the coast coincided with a cooling of the water column over the shelf (not shown). Sea level decline in this area was largely accounted for by an increase in atmospheric pressure combined with a small contribution from cooling of the water column over the continental shelf (Domingues et al., 2018). Sustained XBT observations allowed for the identification of key changes in these boundary currents that contributed to coastal flooding events affecting highly populated urban areas.
Data Management
Data Transmission
XBT profiles are generally transmitted from ship to shore using satellite communications networks (e.g., Iridium, Argos, Inmarsat). When near real-time transmission is not possible, the profiles are sent to transect operators once the ship arrives in port. Each profile undergoes a quality control (QC) process in which a series of tests assesses the overall quality of the measurements. Some data centers apply initial automatic procedures; profiles that fail these tests move to a visual QC (VQC) stage. Other data centers proceed directly to the VQC stage. In VQC, the profiles are visually inspected and quality flags are applied. The QC tests check for the presence of spikes, constant value profiles, extreme depth, and temperature values, impossible dates and locations, vertical gradients and inversions, wire breaks, seafloor contact, etc. (Bailey et al., 1994; Thadathil et al., 2001). Once the profile QC phase is complete, all profiles approved during this process are encoded into FM 63-XI Ext. BATHY (the traditional alphanumeric code for reporting temperature profiles) and/or BUFR (Binary Universal Form for the Representation of meteorological data) bulletins and submitted to the GTS for worldwide distribution in near real-time. The GTS is a core component of WMO's World Weather Watch Programme and contributes to the rapid collection and distribution of satellite, in situ, and other processed datasets (WMO, 2015b).
The collection and distribution of XBT data is routinely performed through GTS centers in the United States, Australia, Japan, France, Canada, and Brazil. The centers in the first four countries also disseminate the profile data and associated metadata in BUFR format. BATHY encoded GTS distributions are gradually being discontinued within the XBT community, in accordance with the WMO mandate to fully migrate to BUFR. The reasons behind this decision are based on the development of new and dynamic requirements, a higher volume and complexity of data and metadata, a promotion of automation, and the limitations of the traditional fixed alphanumeric codes such as BATHY, which restrict the number of metadata fields and do not include QC flags. In BUFR, XBT profiles are encoded into the operational common sequence 315004, which incorporates all of the common metadata fields, as well as full resolution data (WMO, 2015a).
Data tracking activities include the collection of XBT BATHY and BUFR reports arriving from the GTS. Monitoring the different stages of the data management process serves to generate reports, detect anomalies and data gaps, and analyze the performance and latency of the data collection and distribution system. The data originators retain the original and delayed-mode QC profiles and intermediate products.
XBT data posted to the GTS in near real-time are collected by the Marine Environmental Data Section (MEDS) of the Oceans Science Branch, Fisheries and Oceans in Canada, along with other ocean temperature profile data, and relayed as a package every 3 days to the National Oceanic and Atmospheric Administration (NOAA) National Centers for Environmental Information (NCEI) in the US. NCEI hosts the long-term archive center of GTSPP and preserves XBT data in the GTSPP Continuously Maintained Database (CMD). The delayed-mode profiles (those that are either not posted to the GTS or are full resolution or are fully quality controlled replacements for the GTS versions) are sent to NOAA/NCEI for inclusion in the GTSPP, from where they are disseminated and enter other global data sets such as the NOAA/World Ocean Database, thus becoming part of the data flow of the JCOMM Marine Climate Data System. Every other year, the data centers and XBT providers gather under the auspices of GTSPP to discuss potential improvements to quality control and global dissemination of XBT data.
Data Quality
Decades of effort have been made by the XBT community to improve XBT data quality (e.g., Hanawa et al., 1995), and significant progress has been achieved in data quality improvements since OceanObs'09. More tools and methods are now being used to better understand the accuracy of XBT fall rates and temperature measurements. These tools include traditional side-by-side XBT and CTD comparisons (e.g., Thadathil et al., 2002; Hamon et al., 2012; Cowley et al., 2013; Cheng et al., 2018), tests in swimming pools and water tanks (e.g., Bringas and Goni, 2015), Geophysical Fluid Dynamics models (Abraham et al., 2012, 2014; Gorman et al., 2014; Shepard et al., 2014), comparison with Argo and satellite altimetry data (DiNezio and Goni, 2010), and temporal changes of biases (DiNezio and Goni, 2011; Good, 2011; Gouretski, 2012). A careful analysis of the different individual probe types is in progress (Reseghetti et al., 2018), as different probe types have different characteristics in probe design that may impact data quality. An overview of the progress made in improving data quality can be found in Cheng et al. (2016b).
In 2016, the XBT science community recommended the use of an XBT data improvement scheme based on the bias corrections (Cheng et al., 2014, 2016b). The new XBT scheme allows for improved XBT observations in the estimates of global OHC. Using the three XBT data performance methods (Levitus et al., 2009; Gouretski and Reseghetti, 2010; Cheng et al., 2014) results in near-identical global OHC changes in the upper 2000 m since 1966 based on the mapping method proposed in Cheng and Zhu (2016) (Figure 12). In addition, temporal, and spatial variability of locations and transports of ocean currents, estimates of MHT and MOC, and the determination of mixed layer depths are robust for any XBT data improvement scheme (Goes et al., 2015b; Houpert et al., 2015).
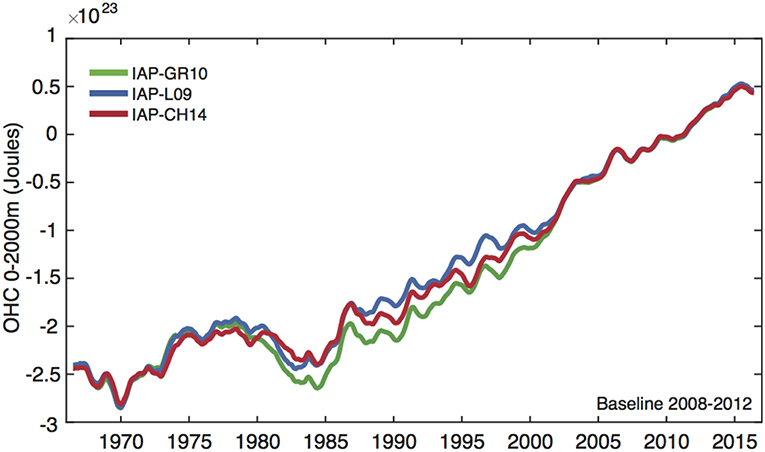
Figure 12. Global OHC time series in the upper 2000 m after applying three XBT data improvement schemes: Levitus et al. (2009)-L09 (blue); Gouretski and Reseghetti (2010)-GR10 (green); and Cheng et al. (2014)-CH14 (red) based on the mapping method proposed by the Chinese Institute of Atmospheric Physics (IAP) in Cheng and Zhu (2016).
Technological Improvements
XBT Probes
Based on theoretical and observational experiments, improvements have been proposed to the accuracy of both the XBT depth estimate and the measured temperature. To improve estimates of probe depth, the addition of pressure switches has been proposed. Pressure switches are small resistors that are activated at certain depths during the probe descent, marking those depths in the profile with spikes. These spikes are filtered during post processing, and their depths are recorded and used to correct the derived-depth estimates of the full profile. In a theoretical study, Goes et al. (2013b) showed that one pressure switch can limit depth errors from 2% of depth to ~3.5 m. The implementation of pressure switches may increase the cost of XBT probes, an issue that will be jointly assessed by the manufacturer and the scientific and operational communities. The probe-to-probe variability of the linear depth bias might also be reduced by using a tighter weight tolerance of the probes. At present, the stated weight tolerance of Deep Blue probes, the most widely used probes, is ±2.5 g (±1 g for the metal head and ±1.5 g for the wire). However, reducing the tolerance to ±1.1 g in a sea trial did not produce significant improvements (Goes et al., 2017). Additional tests are needed to assess the importance of tighter weight tolerance on probe linear biases to confirm the results of theoretical assessments (Green, 1984; Abraham et al., 2012).
The temperature accuracy of XBTs stated by the manufacturer (Lockheed Martin Sippican, Inc.) is 0.2°C. Changes in probe specifications and acquisition systems can impact this accuracy. Goes et al. (2017) found that thermistor calibration, performed in a strictly controlled temperature bath, can improve XBT accuracy to 0.03°C at practically no additional cost.
XBT Launcher Systems
Many advances have been made over the years in collecting and distributing XBT data more effectively. Initially, XBT probes were deployed by a trained operator using a hand-launching system. On many projects, it is necessary to deploy XBTs on a 24-h-a-day schedule as the ship steams along its course. To reduce the workload and personnel, an XBT probe autolauncher was developed that allowed this work to be performed by one person. New autolaunchers can be preloaded with a number of probes (6–12) that are then deployed at predetermined launch times or positions. Autolaunchers have been developed by several institutions, including NOAA, Scripps Institution of Oceanography, CSIRO, and the University of Rhode Island. For example, a recently developed Automated eXpendable Instrument System (AXIS; Fratantoni et al., 2017) in 2012, enabled XBT sampling across an entire section from the continental shelf to Bermuda without the need for an observer on board. Autolaunchers are mounted to the stern of the ship and cabled to a room, where they interface with the data acquisition computer. The length of the cable-run can vary from ship to ship but is on average >75 m. Laying the cable alongside the ship can be difficult and time-consuming because of the limited amount of deck space available for installation. To alleviate the installation and break-down of the current setup, a power independent, wireless autolauncher using a standard wireless access point, a battery, a solar panel, and other off-the-shelf equipment and software tools, has been developed as a “cable replacement” for the standard XBT autolauncher system (Fratantoni et al., 2017). The improved setup will consist of Wifi technology coupled with a remote desktop client that in theory can be operated using only a tablet computer from within the vessel or operated from a land-based station via the Iridium satellite network.
Data Acquisition and Transmission Systems
The data acquisition recorder is the backbone for collecting accurate XBT data. A new XBT prototype data recorder is currently being tested to improve the number of data dropouts in the transmissions and to reduce the cost of servicing and upgrading existing data acquisition systems. These measures may reduce hardware costs by 85%.
Historically, the real-time transmission of XBT data had been mostly carried out using the Inmarsat-C satellite system. With the development of a more cost-effective, Iridium-based transmission system, the average transmission cost per XBT profile was reduced by 95% per profile during the last 10 years since Ocean Obs‘09. Although originally developed to be used for XBT observations, these transmission systems have also been expanded to transmit other types of data, such as thermosalinograph (TSG), pCO2, and marine weather observations.
The Future of the Global XBT Network
Twenty years after OceanObs'99, the Global XBT Network continues to increase in value, not only through the growing length of the decadal time-series along individual transects, but also due to integrative relationships with other elements of the ocean observing system. Uniquely, the Global XBT Network provides spatial and temporal sampling that cannot as yet be reproduced by other existing platforms. One of the key strengths of the network is that XBTs have low operational costs and can be readily deployed on a repeat basis with varying spatial resolution. It is expected that the Global XBT Network will remain active and be enhanced over the next 10 years. We conclude with a list of key aspects that the scientific community has determined to be important for future studies involving XBT observations.
• Sampling strategies. One unique quality of XBT observations is their ability to sample along fixed trans-basin transects and across boundary currents in a sustained fashion, which presently cannot be reproduced by any other platform. Other components of the ocean observing system (e.g., profiling floats, gliders, moorings, etc.) provide complementary profiles of ocean temperature and other properties in these regions; however, none can replicate the rapidly-occupied transects in nearly repeated locations that have been obtained by XBTs for decades.
• Maintenance of long climate record. Several of the time series initiated and still maintained by XBTs have been in place for 30 years or longer. During the next decade, XBTs are likely to remain an integral part of the coordinated observing effort that continues collecting key oceanic temperature measurements for monitoring boundary currents (section Ocean currents, gyres, and ocean variability), MHT estimates across ocean basins (section Meridional Heat Transport), and global OHC assessments (section Global and regional ocean heat content).
• Improvement of data quality. As with other observing platforms, experiments and studies will continue to be carried out to improve the quality of XBT observations. This will be addressed by continuing to reduce errors in each subgroup of XBT data (i.e., data of the same probe type, data from the same year, etc.) (section Technological Improvements) and by improving probe design to increase the precision of each individual measurement (section The future of the Global XBT Network). The continuous improvement of XBT data quality justifies the merging of XBT data with data from other platforms (i.e., Argo, CTD), allowing for better monitoring and analysis of climate change and variability (i.e., section Global and regional ocean heat content).
• Meridional heat transport. The Global XBT Network continues to provide key assessments of oceanic temperature profiles at different latitudes, particularly in the North Pacific and South Atlantic oceans to monitor the current state of the MOC and associated MHT. These data will contribute to studies that link trans-basin heat transports with atmospheric circulation that may influence regional and global climate and extreme weather, aiding in the development of forecasts and outlooks of high-impact extreme weather events.
• Simultaneous meteorological and oceanographic observations. Meteorological sensors can be easily integrated into existing XBT transects to provide key meteorological data collected simultaneously with upper ocean thermal observations to calculate surface heat and moisture fluxes, which are critical for weather and climate research. Other instrumentation that can be installed on ships of opportunity include pCO2 systems, continuous plankton recorders, acoustic current Doppler profilers, etc.
• Sea level change. Studies of sea level change attributions, such as that being performed off the US East Coast (Domingues et al., 2018), serve as examples for similar studies that may be conducted outside coastal areas where XBT observations continue to provide long-time series of variability of ocean currents, such as the Brazil Current. Ocean observations, including those from XBTs in these coastal areas, are critical for the continuous understanding and monitoring of key drivers of disruptive, and oftentimes destructive, flooding events due to elevated sea levels.
• Submesoscale Ocean Dynamics. Of current interest in oceanography is the monitoring of submesoscale features and processes (<10 km) across strong boundary currents, mesoscale eddies, and meanders. The XBT network can contribute to this effort in coordination with semi-Lagrangian observing platforms, such as underwater gliders and drifters. For example, the challenges that gliders may encounter while measuring across strong currents could be avoided by increasing the spatial sampling along selected portions of XBT transects.
• Internal tides. As we move to finer-resolution altimetric observations, with along track Synthetic Aperture Radar (SAR) missions (e.g., Sentinel-3) and the future Surface Water and Ocean Topography (SWOT) 2D missions, these long time series of XBT observations are being reassessed. High-frequency internal tide variability was historically filtered out of XBT data to concentrate on the larger-scale eddies and circulation. Now that altimetry is capable of observing the sea level variations of these signals, there are opportunities for data mining of the older XBT data to help validate the altimetric internal tide observations, as well as ocean models including internal tides. Future XBT or glider observations along SAR-altimetry or SWOT tracks will provide invaluable vertical structure to help interpret these dynamical processes.
• High northern latitude observations. The existing XBT transects AX01 (Greenland to Denmark) and AX90 (Iceland to Faroe Island to Shetland Islands) in the subpolar North Atlantic have provided valuable information on meridional volume and heat transports (e.g., Rossby et al., 2018). There is future potential to significantly enhance the present-day observing system in the high latitudes by establishing a new XBT transect between continental Norway and Svalbard. Possible instrumentation of a Norwegian supply vessel with a shipboard ADCP and an XBT launcher would provide accurate measurements of ocean currents and temperature fluxes across this most important Arctic gateway at high spatial and temporal resolution. This will result in improved monitoring of oceanic fluxes into the Arctic Ocean, a region experiencing dramatic climate change.
• Observing system experiments and observing system simulation experiments. Both OSEs and Observing System Simulation Experiments (OSSEs) are needed to carry out quantitative evaluations of the impact of ocean observations, including XBTs. OSEs serve to assess the impact of actual observations on ocean forecasts or reanalyses, while OSSEs provide a rigorous approach to evaluate the potential impact of new observing systems or to improve the sampling of current observations. With the implementation of new observing platforms it is necessary to quantitatively assess the complementary value of a suite of temperature profiles at different spatial and temporal scales for a range of studies.
• A platform to deploy other observing instruments. Vessels involved in the work of the SOT, and particularly in the XBT network, often also support other networks, e.g., through the deployment of autonomous instruments (drifters, floats) or installation of underway systems (e.g., TSGs). Coordination and monitoring of ship contributions across all observing networks is of growing importance, not only for a better exploitation of synergies (e.g., maintenance and logistics), but also for not overburdening ships with too many tasks for a variety of purposes. JCOMMOPS5 has developed online tools that will allow for a centralized and harmonized registration of cruises, instruments, and deployment plans, all referring to a commonly used ship reference list with unique identifiers.
• Hurricane applications. A potential application for XBTs is to improve seasonal hurricane outlooks. In the Pacific Ocean, PX09 (Honolulu to Suva)/PX31 (Los Angeles to Suva) and PX40 data are used to derive OHC estimates to improve tropical cyclone intensity forecasts (Shay and Brewster, 2010; McCaskill et al., 2016). The AX08 transect crosses the development region for Atlantic hurricanes, a region where coupled models generally present a cold bias and where cyclone development is affected by eddy, interannual, and decadal upper OHC variability via turbulent heat fluxes. The use of AX08 data to assess and improve ocean models has the potential to also improve seasonal outlooks and/or intensification forecasts of Atlantic hurricanes (Domingues et al., 2019).
• Redundancy of observations. Finally, it is important to recognize that some redundancy in the observing system is needed, especially to assist automatic quality control procedures. For instance, having XBT data in the vicinity of profiling floats can help detect errors in one or the other instrument.
Author Contributions
GG led the writing and organization of the manuscript, as well as the research whose results are posted in several sections. JS led the research posted in several sections and contributed with writing and comments. FB, LC, MC, SD, RD, MG, HL, RM, UR, TR, RT, JT, NZ, MB, TB, RC, CD, KH, MK, MM, FR, CS, UB, and DV contributed to the writing of sections, posted comments, and provided figures.
Funding
GG, FB, SD, UR, MB, RD, and DV were supported by a grant from the NOAA/Ocean Observing and Monitoring Division (OOMD) and by NOAA's Atlantic Oceanographic and Meteorological Laboratory (AOML). The participation of JS and NZ in this study was supported by NOAA's Global Ocean Monitoring and Observing Program through Award NA15OAR4320071 and NSF Award 1542902. CD was funded by the Australian Research Council (FT130101532 and DP160103130); the Scientific Committee on Oceanic Research (SCOR) Working Group 148, funded by national SCOR committees and a grant to SCOR from the U.S. National Science Foundation (Grant OCE-1546580); and the Intergovernmental Oceanographic Commission of UNESCO/International Oceanographic Data and Information Exchange (IOC/IODE) IQuOD Steering Group. LC was supported by 2016YFC1401800.
Conflict of Interest Statement
The authors declare that the submitted work was not carried out in the presence of any personal, professional, or financial relationships that could potentially be construed as a conflict of interest.
Acknowledgments
The authors acknowledge the many agencies and institutions that support the implementation and maintenance of the Global XBT Network, and data management and research activities, including but not limited to: NOAA (United States), National Science Foundation (United States), Commonwealth Scientific and Industrial Research Organization (CSIRO), Bureau of Meteorology (BOM), Integrated Marine Observing System (IMOS), a national collaborative research infrastructure supported by the Australian government (Australia), National Agency for New Technologies, Energy and Sustainable Economic Development (ENEA) (Italy), Tohoku University (Japan), University of Miami (United States), University of Tasmania (Australia), Scripps Institution of Oceanography (United States), National Institute of Water and Atmospheric Research (New Zealand), Laboratoire d'Etudes en Géophysique et Océanographie Spatiales (LEGOS) (France), Institute of Atmospheric Physics and Chinese Academy of Sciences (China), University of Rhode Island (United States), BIO (Bermuda), University of Cape Town (South Africa), Federal University of Rio Grande do Sul (Brazil), Federal University of Rio de Janeiro (Brazil), University of Paris (France), National Institute of Oceanography (India), MEDS (Canada), Servicio de Hidrografía Naval (Argentina), Servicio de Hidrografía Naval (Brazil), State University of New York at Stony Brook (United States), Indian National Centre for Ocean Information Services (India), and the Woods Hole Oceanographic Institution (United States). The authors acknowledge the volunteer contribution of container shipping lines and their crews for continuously providing support to operations and logistics to deploy XBT probes.
Footnotes
1. ^www.aoml.noaa.gov/phod/goos/xbtscience
3. ^www.aoml.noaa.gov/phod/indexes/samoc_alt.php
References
Abraham, J. P., Baringer, M., Bindoff, N. L., Boyer, T., Cheng, L. J., Church, J. A., et al. (2013). A review of global ocean temperature observations: implications for ocean heat content estimates and climate change. Rev. Geophys. 51, 450–483. doi: 10.1002/rog.20022
Abraham, J. P., Gorman, J., Reseghetti, F., Sparrow, E., Stark, J., and Shepard, T. (2014). Modeling and numerical simulation of the forces acting on a sphere during early-water entry. Ocean Eng. 76, 1–9. doi: 10.1016/j.oceaneng.2013.11.015
Abraham, J. P., Gorman, J. M., Reseghetti, F., Sparrow, E. M., and Minkowycz, W. J. (2012). Drag coefficients for rotating expendable bathythermographs and the impact of launch parameters on depth predictions. Num. Heat Transfer Pt. 62, 25–43. doi: 10.1080/10407782.2012.672898
Auad, G., Roemmich, D., and Gilson, J. (2011). The california current system in relation to the northeast pacific ocean circulation. Prog. Oceanogr. 91, 576–592. doi: 10.1016/j.pocean.2011.09.004
Bailey, R., Gronell, A. M., Phillips, H., Tanner, E., and Meyers, G. (1994). Quality Control Cookbook for XBT Data. CSIRO Marine Laboratories Reports 221.
Boyer, T., Domingues, C. M., Good, S. A., Johnson, G. C., Lyman, J. M., Ishii, M., et al. (2016). Sensitivity of global ocean heat content estimates to mapping methods, XBT bias corrections, and baseline climatologies. J. Clim. 29, 4817–4842. doi: 10.1175/JCLI-D-15-0801.1
Boyer, T. P., Antonov, J. I., Baranova, O. K., Coleman, C., Garcia, H. E., and Grodsky (2013). World Ocean Database 2013. NOAA Atlas NESDIS 72.
Brannigan, L., Lenn, Y.-D., Rippeth, T. P., McDonagh, E., Chereskin, T. K., and Sprintall, J. (2013). Shear at the base of the oceanic mixed layer generated by wind shear alignment. J. Phys. Oceanogr. 43, 1798–1810. doi: 10.1175/JPO-D-12-0104.1
Bringas, F., and Goni, G. (2015). Early dynamics of deep blue XBT probes. J. Atmos. Oceanic Tech. 32, 2253–2263. doi: 10.1175/JTECH-D-15-0048.1
Cai, W., Shi, G., Cowan, T., Bi, D., and Ribbe, J. (2005). The response of the Southern Annular Mode, the East Australian Current, and the southern mid-latitude ocean circulation to global warming. Geophys. Res. Lett. 32:L23706. doi: 10.1029/2005GL024701
Chang, E. K. M., Lee, S., and Swanson, K. L. (2002). Storm track dynamics. J. Clim. 15, 2163–2183. doi: 10.1175/1520-0442(2002)015<02163:STD>2.0.CO;2
Cheng, L., Abraham, J., Goni, G., Boyer, T., Wijffels, S., Cowley, R., et al. (2016b). XBT science: assessment of instrumental biases and errors. Bull. Amer. Met. Soc. 97, 924–933. doi: 10.1175/BAMS-D-15-00031.1
Cheng, L., Luo, H., Boyer, T., Cowley, R., Abraham, J., Gouretski, V., et al. (2018). How well can we correct systematic errors in historical XBT data? J. Atmos. Oceanic Tech. 35, 1103–1125. doi: 10.1175/JTECH-D-17-0122.1
Cheng, L., Trenberth, K. E., Fasullo, J., Boyer, T., Abraham, J., and Zhu, J. (2017). Improved estimates of ocean heat content from 1960-2015. Sci. Adv. 3:e1601545. doi: 10.1126/sciadv.1601545
Cheng, L., Trenberth, K. E., Palmer, M. D., Zhu, J., and Abraham, J. P. (2016a). Observed and simulated full-depth ocean heat-content changes for 1970–2005. Ocean Sci. 12, 925–935. doi: 10.5194/os-12-925-2016
Cheng, L., and Zhu, J. (2016). Benefits of CMIP5 multimodel ensemble in reconstructing historical ocean subsurface temperature variations. J. Clim. 29, 5393–5416. doi: 10.1175/JCLI-D-15-0730.1
Cheng, L., Zhu, J., Cowley, R., Boyer, T., and Wijffels, S. (2014). Time, probe type and temperature variable bias corrections to historical expendable bathythermograph observations. J. Atmos. Oceanic Tech. 31, 1793–1825. doi: 10.1175/JTECH-D-13-00197.1
Ciuffardi, T., Napolitano, E., Iacono, R., Reseghetti, F., Raiteri, G., and Bordone, A. (2016). Analysis of surface circulation structures along a frequently repeated XBT transect crossing the Ligurian and Tyrrhenian Seas. Ocean Dyn. 66, 767–783. doi: 10.1007/s10236-016-0954-y
Cowley, R., Wijffels, S., Cheng, L., Boyer, T., and Kizu, S. (2013). Biases in expendable bathythermograph data: a new view based on historical side-by-side comparisons. J. Atmos. Oceanic Tech. 30, 1195–1225. doi: 10.1175/JTECH-D-12-00127.1
DiNezio, P. N., and Goni, G. (2010). Identifying and estimating biases between XBT and Argo observations using satellite altimetry. J. Atmos. Oceanic Tech. 27, 226–240. doi: 10.1175/2009JTECHO711.1
DiNezio, P. N., and Goni, G. (2011). Direct evidence of a changing fall-rate bias in XBT manufactured during 1986-2008. J. Atmos. Oceanic Tech. 28, 1569–1578. doi: 10.1175/JTECH-D-11-00017.1
Domingues, C. M., Church, J. A., White, N. J., Gleckler, P. J., Wijffels, S. E., Barker, P. M., et al. (2008). Improved estimates of upper-ocean warming and multi-decadal sea-level rise. Nature 453, 1090–1093. doi: 10.1038/nature07080
Domingues, R., Baringer, M., and Goni, G. (2016). Remote sources for year-to-year changes in the seasonality of the Florida current transport. J.Geophys. Res. 121, 7547–7559. doi: 10.1002/2016JC012070
Domingues, R., Goni, G., Baringer, M., and Volkov, D. (2018). What caused the accelerated sea level changes along the U.S. East Coast during 2010-2015? Geophys. Res. Lett. 45, 13,367–13,376. doi: 10.1029/2018GL081183
Domingues, R., Goni, G., Swart, S., and Dong, S. (2014). Wind forced variability of the antarctic circumpolar current south of Africa between 1993 and 2010. J. Geophys. Res. 119, 1123–1145. doi: 10.1002/2013JC008908
Domingues, R., Kuwano-Yoshida, A., Chardon-Maldonado, P., Todd, R. E., Halliwell, G. R., Kim, H. S., et al. (2019). Ocean observing systems in support of studies and forecasts of tropical and extratropical cyclones. Front. Marine Sci. 6:446. doi: 10.3389/fmars.2019.00446
Dong, S., Baringer, M., Goni, G., and Garzoli, S. (2011). Importance of the assimilation of Argo float measurements on the meridional overturning circulation in the South Atlantic. Geophys. Res. Lett. 38:L18603. doi: 10.1029/2011GL048982
Dong, S., Baringer, M. O., Goni, G. J., Meinen, C. S., and Garzoli, S. L. (2014). Seasonal variations in the South Atlantic meridional overturning circulation from observations and numerical models. Geophys. Res. Lett. 41, 4611–4618. doi: 10.1002/2014GL060428
Dong, S., Garzoli, S. L., Baringer, M. O., Meinen, C. S., and Goni, G. J. (2009). The atlantic meridional overturning circulation and its northward heat transport in the South Atlantic. Geophys. Res. Lett. 36:L20606. doi: 10.1029/2009GL039356
Dong, S., Gille, S. T., and Sprintall, J. (2007a). An assessment of the Southern ocean mixed layer heat budget. J. Clim. 20, 4425–4442. doi: 10.1175/JCLI4259.1
Dong, S., Gille, S. T., Sprintall, J., and Fetzer, E. J. (2010). Assessing the potential of the Atmospheric Infrared Sounder (AIRS) surface temperature and specific humidity in turbulent heat flux estimates in the southern ocean. J. Geophys. Res. 115:C05013. doi: 10.1029/2009JC005542
Dong, S., Gille, S. T., Sprintall, J., and Gentemann, C. (2006a). Validation of the advanced microwave scanning radiometer for the earth observing System (AMSR-E) sea surface temperature in the Southern Ocean. J. Geophys. Res. 111:C04002. doi: 10.1029/2005JC002934
Dong, S., Goni, G., and Bringas, F. (2015). Temporal variability of the South Atlantic meridional overturning circulation between 20°S and 35°S. Geophys. Res. Lett. 42, 7655–7662. doi: 10.1002/2015GL065603
Dong, S., Hautala, S. L., and Kelly, K. A. (2007b) Interannual variations in upper-ocean heat content heat transport convergence in the western North Atlantic. J. Phys. Oceanogr. 37, 2682–2697. doi: 10.1175/2007JPO3645.1
Dong, S., Sprintall, J., and Gille, S. T. (2006b). Location of the Antarctic polar front from AMSR-E satellite sea surface temperature measurements. J. Phys. Oceanogr. 36, 2075–2089. doi: 10.1175/JPO2973.1
Douglass, E., Roemmich, D., and Stammer, D. (2009). Data sensitivity of the ECCO state estimate in a regional setting. J. Atmos. Oceanic Tech. 26, 2420–2443. doi: 10.1175/2009jtecho641.1
Douglass, E., Roemmich, D., and Stammer, D. (2010). Interannual variability in North Pacific heat and freshwater budgets. Deep Sea Res. 57, 1127–1140. doi: 10.1016/j.dsr2.2010.01.001
Durack, P. J., Glecker, P. J., Landerer, F. W., and Taylor, K. E. (2014). Quantifying underestimates of long-term upper-ocean warming. Nat. Clim. Change 4, 999–1005. doi: 10.1038/nclimate2389
Eigenheer, A., and Quadfasel, D. (2000). Seasonal variability of the Bay of Bengal circulation inferred from TOPEX/Poseidon altimetry. J. Geophys. Res. 105, 3243–3252. doi: 10.1029/1999JC900291
England, M. H., McGregor, S., Spence, P., Meehl, G. A., Timmermann, A., Cai, W., et al. (2014). Recent intensification of wind-driven circulation in the Pacific and the ongoing warming hiatus. Nat. Clim. Change 4, 222–227. doi: 10.1038/nclimate2106
Ezer, T. (2013). Sea level rise, spatially uneven and temporally unsteady: why the US East Coast, the global tide gauge record, and the global altimeter data show different trends. Geophys. Res. Lett. 40, 5439–5444. doi: 10.1002/2013GL057952
Fernandez, D., Bowen, M., and Sutton, P. (2018). Variability, coherence and forcing mechanisms in the New Zealand ocean boundary currents. Prog. Oceanogr. 165, 168–188. doi: 10.1016/j.pocean.2018.06.002
Firing, Y. L., Chereskin, T. K., and Mazloff, M. R. (2011). Vertical structure and transport of the antarctic circumpolar current in drake passage from direct velocity observations. J. Geophys. Res. 116:C08015. doi: 10.1029/2011JC006999
Fonseca, C., Goni, G. J., Johns, W. E., and Campos, E. J. D. (2004). Investigation of the North Brazil current retroflection and north equatorial countercurrent variability. Geophys. Res. Lett. 31:L21304. doi: 10.1029/2004GL020054
Frajka-Williams, E., Dong, S., Meinen, C., Perez, R., Goni, G., Volkov, D., et al. (2019). Atlantic Meridional overturning circulation: observed transports and mechanisms. Front. Mar. Sci. 6:260. doi: 10.3389/fmars.2019.00260
Fratantoni, D. M., O'Brien, J. K., Flagg, C., and Rossby, T. (2017). AXIS–An autonomous expendable instrument system. J. Atmos. Oceanic Tech. 34, 2673–2682. doi: 10.1175/JTECH-D-17-0054.1
Gleckler, P. J., Durack, P. J., Stouffer, R. J., Johnson, G. C., and Forest, C. E. (2016). Industrial-era global ocean heat uptake doubles in recent decades. Nat. Clim. Change 6, 394–398. doi: 10.1038/nclimate2915
Goes, M., Babcock, E., Bringas, F., Ortner, P., and Goni, G. (2017). The impact of improved thermistor calibration on the expendable bathythermograph profile data. J. Atmos. Oceanic Tech. 34, 1947–1961. doi: 10.1175/JTECH-D-17-0024.1
Goes, M., Baringer, M., and Goni, G. (2015b). The impact of historical biases on the XBT-derived meridional overturning circulation estimates at 34°S. Geophys. Res. Lett. 42, 1848–1855. doi: 10.1002/2014GL061802
Goes, M., Christophersen, J., Dong, S., Goni, G., and Baringer, M. O. (2018). An updated estimate of salinity for the atlantic ocean sector using temperature–salinity relationships. J. Atmos. Oceanic Tech. 35, 1771–1784. doi: 10.1175/JTECH-D-18-0029.1
Goes, M., Cirano, M., Mata, M. M., and Majumder, S. (2019). Long-term monitoring of the Brazil Current transport at 22S from XBT altimetry data: Seasonal, interannual extreme variability. J. Geophys. Res. 124, 3645–3663. doi: 10.1029/2018JC014809
Goes, M., Goni, G., and Dong, S. (2015a). An optimal XBT-based monitoring system for the South Atlantic meridional overturning circulation at 34°S. J. Geophys. Res. 120, 161–181. doi: 10.1002/2014JC010202
Goes, M., Goni, G., Hormann, V., and Perez, R. C. (2013a). Variability of the Atlantic off-equatorial eastward currents during 1993–2010 using a synthetic method. J. Geophys. Res. 118, 3026–3045. doi: 10.1002/jgrc.20186
Goes, M., Goni, G., and Keller, K. (2013b). Reducing biases in XBT measurements by including discrete information from pressure switches. J. Atmos. Oceanic Tech. 30, 810–824. doi: 10.1175/JTECH-D-12-00126.1
Goni, G., and Baringer, M. (2002). Surface currents in the tropical Atlantic across high density XBT line AX08. Geophys. Res. Lett. 29, 71.1–71.4. doi: 10.1029/2002GL015873
Goni, G., Roemmich, D., Molinari, R., Meyers, G., Sun, C., Boyer, T., et al. (2010). “The ship of opportunity program,” in Proceedings of OceanObs'09: Sustained Ocean Observations and Information for Society, eds J. Hall, D. E. Harrison, and D. Stammer (Auckland: ESA Publications).
Goni, G. J., and Wainer, I. (2001). Investigation of the Brazil Current front variability from altimeter data. J. Geophys. Res. 106, 31,117–31,128. doi: 10.1029/2000JC000396
Good, S. A. (2011). Depth biases in XBT data diagnosed using bathymetry data. J. Atmos. Oceanic Tech. 28, 287–300. doi: 10.1175/2010JTECHO773.1
Gorman, J. M., Abraham, J. P., Schwalbach, D. B., Shepard, T. S., Stark, J. R., and Reseghetti, F. (2014). Experimental verification of drag forces on spherical objects entering water. J. Mar. Ocean Biol. Oceanogr. 3:2. doi: 10.4172/2324-8661.1000126
Gould, J., Roemmich, D., Wijffels, S., Freeland, H., Ignaszewsky, M., Jianping, X., et al. (2004). Argo profiling floats bring new era of in situ ocean observations. Eos Trans. Amer. Geophys. 179, 190–191. doi: 10.1029/2004EO190002
Gouretski, V. (2012). Using GEBCO digital bathymetry to infer depth biases in the XBT data. Deep Sea Res. 62, 40–52. doi: 10.1016/j.dsr.2011.12.012
Gouretski, V., and Reseghetti, F. (2010). On depth and temperature biases in bathythermograph data: Development of a new correction scheme based on analysis of a global ocean database. Deep Sea Res. 57, 812–833. doi: 10.1016/j.dsr.2010.03.011
Green, A. W. (1984). Bulk dynamics of the expendable bathythermograph (XBT). Deep-Sea Res. 31, 415–426. doi: 10.1016/0198-0149(84)90093-1
Hamon, M., Reverdin, G., and Le Traon, P. Y. (2012). Empirical correction of XBT data. J. Atmos. Oceanic Tech. 29, 960–973. doi: 10.1175/JTECH-D-11-00129.1
Hanawa, K., Rual, P., Bailey, R., Sy, A., and Szabados, M. (1995). A new depth time equation for Sippican or TSK T-7, T-6 and T-4 expendable bathythermographs (XBT). Deep Sea Res. 42, 1423–1451. doi: 10.1016/0967-0637(95)97154-Z
Hill, K. L., Rintoul, S. R., Coleman, R., and Ridgway, K. R. (2008). Wind forced low frequency variability of the East Australian current. Geophys. Res. Lett. 35:L08602. doi: 10.1029/2007GL032912
Hill, K. L., Rintoul, S. R., Ridgway, K. R., and Oke, P. R. (2011). Decadal changes in the South Pacific western boundary current system revealed in observations and ocean state estimates. J. Geophys. Res. 116:C01009. doi: 10.1029/2009JC005926
Holbrook, N. J., and Maharaj, A. M. (2008). Southwest Pacific subtropical mode water: a climatology. Prog. Oceanogr. 77, 298–315. doi: 10.1016/j.pocean.2007.01.015
Hoskins, B. J., and Hodges, K. I. (2002). New perspectives on the Northern Hemisphere winter storm tracks. J. Atmos. Sci. 59, 1041–1061. doi: 10.1175/1520-0469(2002)059<1041:NPOTNH>2.0.CO;2
Houpert, L., Testor, P., Durrieu de Madron, X., Somot, S., D'Ortenzio, F., Estournel, C., et al. (2015). Seasonal cycle of the mixed layer, the seasonal thermocline and the upper-ocean heat storage rate in the Mediterranean Sea derived from observations. Prog. Oceanogr. 132, 333–352. doi: 10.1016/j.pocean.2014.11.004
Ishii, M., Fukuda, Y., Hirahara, S., Yasui, S., Suzuki, T., and Sato, K. (2017). Accuracy of global upper ocean heat content estimation expected from present observational data sets. SOLA 13, 163–167. doi: 10.2151/sola.2017-030
Jayne, S. R., Roemmich, D., Zilberman, N., Riser, S. C., Johnson, K. S., Johnson, G. C., et al. (2017). The argo program: present and future. Oceanography 30, 18–28. doi: 10.5670/oceanog.2017.213
Jiang, C., Gille, S. T., Sprintall, J., and Sweeney, C. (2014). Drake Passage oceanic pCO2: evaluating CMIP5 coupled carbon–climate models using in-situ observations. J. Clim. 27, 76–100, doi: 10.1175/JCLI-D-12-00571.1
Joyce, T. M., Kwon, Y.-O., and Yu, L. (2009). On the relationship between synoptic wintertime atmospheric variability and path shifts in the Gulf Stream and Kuroshio extension. J. Clim. 22, 3177–3192. doi: 10.1175/2008JCLI2690.1
Kelly, K. A., Small, R. J., Samelson, R. M., Qiu, B., Joyce, T. M., Kwon, Y.-O., et al. (2010). Western boundary currents and frontal air–sea interaction: Gulf Stream and Kuroshio Extension. J. Clim. 23, 5644–5667. doi: 10.1175/2010JCLI3346.1
Kushnir, Y., Robinson, W. A., Blade, I., Hall, N. M. J., Peng, S., and Sutton, R. (2002). Atmospheric GCM response to extratropical SST anomalies: synthesis and evaluation. J. Clim. 15, 2233–2256. doi: 10.1175/1520-0442(2002)015<2233:AGRTES>2.0.CO;2
Kwon, Y.-O., Alexander, M. A., Bond, N. A., Frankignoul, C., Nakamura, H., Qiu, B., et al. (2010). Role of the Gulf Stream and Kuroshio–Oyashio systems in large-scale atmosphere–ocean interaction: a review. J. Clim. 23, 3249–3281. doi: 10.1175/2010JCLI3343.1
Latif, M., Arpe, K., and Roeckner, E. (2000). Oceanic control of decadal North atlantic sea level pressure variability in winter. Geophys. Res. Lett. 27, 727–730. doi: 10.1029/1999GL002370
Lee, S.-K., Park, W., Baringer, M. O., Gordon, A. L., Huber, B., and Liu, Y. (2015). Pacific origin of the abrupt increase in Indian Ocean heat content during the warming hiatus. Nat. Geosci. 8, 445–449. doi: 10.1038/ngeo2438
Legler, D. M., Freeland, H. J., Lumpkin, R., Ball, G., McPhaden, M. J., North, S., et al. (2015). The current status of the real-time in situ global ocean observing system for operational oceanography. J. Oper. Oceanogr. 8, s189–s200. doi: 10.1080/1755876X.2015.1049883
Lenn, Y.-D., and Chereskin, T. K. (2009). Observations of Ekman currents in the Southern Ocean. J. Phys. Oceanogr. 39, 768–779. doi: 10.1175/2008JPO3943.1
Lenn, Y.-D., Chereskin, T. K., and Sprintall, J. (2008). Improving estimates of the antarctic circumpolar current streamlines in drake passage. J. Phys. Oceanogr. 38, 1000–1010, doi: 10.1175/2007JPO3834.1
Lenn, Y.-D., Chereskin, T. K., Sprintall, J., and Firing, E. (2007). Mean jets, mesoscale variability and eddy momentum fluxes in the surface layer of the antarctic circumpolar current in drake passage. J. Mar. Res. 65, 27–58. doi: 10.1357/002224007780388694
Lenn, Y.-D., Chereskin, T. K., Sprintall, J., and McClean, J. L. (2011). Near-surface eddy heat and momentum fluxes in the antarctic circumpolar current in drake passage. J. Phys. Oceanogr. 41, 1385–1407. doi: 10.1175/JPO-D-10-05017.1
Levitus, S., Antonov, J. I., Boyer, T. P., Baranova, O. K., Garcia, H. E., Locarnini, R. A., et al. (2012). World ocean heat content and thermosteric sea level change (0-2000 m), 1955-2010. Geophys. Res. Lett. 39:L10603. doi: 10.1029/2012GL051106
Levitus, S., Antonov, J. I., Boyer, T. P., Locarnini, R. A., Garcia, H. E., and Mishonov, A. V. (2009). Global ocean heat content 1955-2008 in light of recently revealed instrumentation problems. Geophys. Res. Lett. 36:L07608. doi: 10.1029/2008GL037155
Li, Y., Han, W., Hu, A., Meehl, G. A., and Wang, F. (2018). Multidecadal changes of the upper Indian Ocean heat content during 1965–2016. J. Clim. 31, 7863–7884. doi: 10.1175/JCLI-D-18-0116.1
Lima, M. O., Cirano, M., Mata, M., Goes, M., Goni, G., and Baringer, M. O. (2016). An assessment of the Brazil Current baroclinic structure and variability near 22°S in distinct ocean forecasting and analysis systems. Ocean Dyn. 66, 893–916. doi: 10.1007/s10236-016-0959-6
Liu, Q.-Y., Feng, M., Wang, D., and Wijffels, S. (2015). Interannual variability of the Indonesian throughflow transport: a revisit based on 30 year expendable bathythermograph data. J. Geophys. Res. 120, 8270–8282. doi: 10.1002/2015JC011351
Lopez, H., Dong, S., Lee, S.-K., and Goni, G. (2016). Decadal modulations of interhemispheric global atmospheric circulations and monsoons by the South Atlantic meridional overturning circulation. J. Clim. 29, 1831–1851. doi: 10.1175/JCLI-D-15-0491.1
Lopez, H., Goni, G., and Dong, S. (2017). A reconstructed South Atlantic meridional overturning circulation time series since 1870. Geophys. Res. Lett. 44, 3309–3318. doi: 10.1002/2017GL073227
Lyman, J. M., Good, S. A., Gouretski, V. V., Ishii, M., Johnson, G. C., Palmer, M. D., et al. (2010). Robust warming of the global upper ocean. Nature 465, 334–337. doi: 10.1038/nature09043
Lyman, J. M., and Johnson, G. C. (2008). Estimating annual global upper-ocean heat content anomalies despite irregular in situ ocean sampling. J. Clim. 21, 5629–5641. doi: 10.1175/2008JCLI2259.1
Majumder, S., Goes, M., Polito, P. S., Lumpkin, R., Schmid, C., and Lopez, H. (2019). Propagating modes of variability and their impact on the western boundary current in the South Atlantic. J. Geophys. Res. 124, 3168–3185. doi: 10.1029/2018JC014812
Martin, M. J., Balmaseda, M., Bertino, L., Brasseur, P., Brassington, G., et al. (2015). Status and future of data assimilation in operational oceanography. J. Oper. Oceanogr. 8, s28–s48. doi: 10.1080/1755876X.2015.1022055
McCaskill, C., Shay, L. K., Brewster, J. K., and Meyers, P. C. (2016). Development and assessment of the systematically merged Pacific Ocean regional temperature and salinity (SPORTS) climatology for ocean heat content estimations. J. Atmos. Oceanic Tech. 33, 2259–2272. doi: 10.1175/JTECH-D-15-0168.1
Mill, G. N., da Costa, V. S., Lima, N. D., Gabioux, M., Guerra, L. A. A., and Paiva, A. M. (2015). Northward migration of Cape São Tomé rings, Brazil. Cont. Shelf Res. 106, 27–37. doi: 10.1016/j.csr.2015.06.010
Molinari, R. L. (2004). Annual and decadal variability in the western subtropical North Atlantic: signal characteristics and sampling methodologies. Prog. Oceanogr. 62, 33–66. doi: 10.1016/j.pocean.2004.07.002
Molinari, R. L. (2011). Information from low-density expendable bathythermograph transects: North Atlantic mean temperature structure and quasi-decadal variability. Prog. Oceanogr. 88, 131–149. doi: 10.1016/j.pocean.2010.12.013
Morrow, R., Donguy, J.-R., Chaigneau, A., and Rintoul, S. R. (2004). Cold core anomalies at the subantarctic front, south of Tasmania. Deep Sea Res. 51, 1417–1440. doi: 10.1016/j.dsr.2004.07.005
Morrow, R., and Kestenare, E. (2014). Nineteen-year changes in surface salinity in the Southern Ocean south of Australia. J. Mar. Sys. 129, 472–483. doi: 10.1016/j.jmarsys.2013.09.011
Morrow, R., Valladeau, G., and Sallée, J. (2008). Observed subsurface signature of Southern Ocean decadal sea level rise. Prog. Oceanogr. 77, 351–366. doi: 10.1016/j.pocean.2007.03.002
Munro, D. R., Lovenduski, N. S., Stephens, B. B., Newberger, T., Arrigo, K. R., Takahashi, T., et al. (2015). Estimates of net community production in the Southern Ocean determined from time series observations (2002–2011) of nutrients, dissolved inorganic carbon, and surface ocean pCO2 in drake passage. Deep Sea Res. 114, 49–63. doi: 10.1016/j.dsr2.2014.12.014
Nagano, A., Ichikawa, H., Yoshikawa, Y., Kizu, S., and Hanawa, K. (2012). Variation of the southward interior flow of the North Pacific subtropical gyre, as revealed by a repeat hydrographic survey. J. Oceanogr. 68, 361–368. doi: 10.1007/s10872-012-0102-3
Nagano, A., Kizu, S., Hanawa, K., and Roemmich, D. (2016). Heat transport variation due to change of North Pacific subtropical gyre interior flow during 1993–2012. Ocean Dyn. 66, 1637–1649. doi: 10.1007/s10236-016-1007-2
Nakamura, H., Sampe, T., Tanimoto, Y., and Shimpo, A. (2004). “Observed associations among storm tracks, jet streams and midlatitude oceanic fronts,” in Earth's Climate: The Ocean–Atmosphere Interaction, Geophysical Monograph, Vol. 147, American Geophysical Union (Washington, DC), 329–346. doi: 10.1029/147GM18
Napolitano, E., Iacono, R., Ciuffardi, T., Reseghetti, F., Poulain, P. M., and Notarstefano, G. (2018). The Tyrrhenian Intermediate Water (TIW): characterization and formation mechanisms. Prog. Oceanogr. 170, 53–68. doi: 10.1016/j.pocean.2018.10.017
Nieves, V., Willis, J. K., and Patzert, W. C. (2015). Recent hiatus caused by decadal shift in Indo-Pacific heating. Science 349, 532–535. doi: 10.1126/science.aaa4521
Oke, P. R., Larnicol, G., Fujii, V., Smith, G. C., Lea, D. J., Guinehut, S., et al. (2015a). Assessing the impact of observations on ocean forecasts and reanalyses: Part 1, Global studies. J. Oper. Oceanogr. 8, s49–s62. doi: 10.1080/1755876X.2015.1022067
Oke, P. R., Larnicol, G., Jones, E. M., Kourafalou, V., Sperrevik, A. K., Carse, F., et al. (2015b). Assessing the impact of observations on ocean forecasts and reanalyses: Part 2, Regional applications. J. Oper. Oceanogr. 8, s63–s79. doi: 10.1080/1755876X.2015.1022080
Olson, D. B., Brown, O. B., and Emmerson, S. R. (1983). Gulf Stream frontal statistics from Florida Straits to Cape Hatteras derived from satellite and historical data. J. Geophys. Res. 88, 4569–4577. doi: 10.1029/JC088iC08p04569
Pezzi, L. P., Souza, R. B., Farias, P. C., Acevedo, O., and Miller, A. J. (2016). Air-sea interaction at the Southern Brazilian Continental shelf: in situ observations. J. Geophys. Res. 121, 6671–6695. doi: 10.1002/2016JC011774
Pilo, G. S., Oke, P. R., Rykova, T., Coleman, R., and Ridgway, K. (2015). Do East Australian current anticyclonic eddies leave the Tasman Sea? J. Geophys. Res. 120, 8099–8114. doi: 10.1002/2015JC011026
Polton, J. A., Lenn, Y. D., Elipot, S., Chereskin, T. K., and Sprintall, J. (2013). Can drake passage observations match Ekman's classic theory? J. Phys. Oceanogr. 43, 1733–1740. doi: 10.1175/JPO-D-13-034.1
Reseghetti, F., Cheng, L., Borghini, M., Yashayaev, I. M., Raiteri, G., and Zhu, J. (2018). Assessment of quality and reliability of measurements with XBT Sippican T5 and T5/20. J. Atmos. Oceanic Tech. 35, 1935–1960. doi: 10.1175/JTECH-D-18-0043.1
Rhein, M., Rintoul, S. R., Aoki, S., Campos, E., Chambers, D., Feely, R. A., et al. (2013). “Observations: ocean,” in Climate Change 2013: The Physical Science Basis. Contribution of Working Group I to the Fifth Assessment Report of the Intergovernmental Panel on Climate Change, eds T. F. Stocker, D. Qin, G.-K. Plattner, M. Tignor, S. K. Allen, J. Boschung, A. Nauels, Y. Xia, V. Bex and P. M. Midgley (Cambridge, UK; New York, NY: Cambridge University Press), 255–315.
Ribotti, A., Sorgente, R., Olita, A., Orilia, F., Borghini, M., and Reseghetti, F. (2016). Indication of recent warming process at the intermediate level in the Tyrrhenian Sea from SOOP XBT measurements. Mediter. Mar. Sci. 17, 467–475. doi: 10.12681/mms.1196
Ridgway, K. R., Coleman, R. C., Bailey, R. J., and Sutton, P. (2008). Decadal variability of East Australian current transport inferred from repeated high-density XBT transects, a CTD survey and satellite altimetry. J. Geophys. Res. 113:C08039. doi: 10.1029/2007JC004664
Ridgway, K. R., and Dunn, J. R. (2003). Mesoscale structure of the mean East Australian Current System and its relationship with topography. Prog. Oceanogr. 56, 189–222. doi: 10.1016/S0079-6611(03)00004-1
Rintoul, S. R., Sokolov, S., and Church, J. (2002). A 6 year record of baroclinic transport variability of the Antarctic circumpolar current at 140°E from expendable bathythermograph and altimetry measurements. J. Geophys. Res. 107:19-1-19-22. doi: 10.1029/2001JC000787
Riser, S. C., Freeland, H. J., Roemmich, D., Wijffels, S., Troisi, A., Belbéoch, M., et al. (2016). Fifteen years of ocean observations with the global Argo array. Nat. Clim. Change 6, 145–153. doi: 10.1038/nclimate2872
Roemmich, D., and Cornuelle, B. (1992). The subtropical mode waters of the South Pacific Ocean. J. Phys. Oceanogr. 22, 1178–1187. doi: 10.1175/1520-0485(1992)022<1178:TSMWOT>2.0.CO;2
Roemmich, D., and Gilson, J. (2001). Eddy transport of heat and thermocline waters in the North Pacific: a key to interannual/decadal climate variability? J. Phys. Oceanogr. 31, 675–688. doi: 10.1175/1520-0485(2001)031<0675:ETOHAT>2.0.CO;2
Roemmich, D., Gilson, J., Davis, R., Sutton, P., Wijffels, S., and Riser, S. (2007). Decadal spin up of the deep subtropical gyre in the South Pacific. J. Phys. Oceanogr. 37, 162–173. doi: 10.1175/JPO3004.1
Roemmich, D., Gilson, J., Willis, J., Sutton, P., and Ridgway, K. (2005). Closing the time-varying mass and heat budgets for large ocean areas: the Tasman box. J. Clim. 18, 2330–2343. doi: 10.1175/JCLI3409.1
Rossby, T., Flagg, C., Chafik, L., Harden, B., and Søiland, H. (2018). A direct estimate of volume, heat, and freshwater exchange across the Greenland-Iceland-Faroe-Scotland Ridge. J. Geophys. Res. 123, 7139–7153. doi: 10.1029/2018JC014250
Rossby, T., Flagg, C., and Donohue, K. (2010). On the variability of Gulf Stream transport from seasonal to decadal timescales. J. Mar. Res. 68, 503–522. doi: 10.1357/002224010794657128
Rudnick, D. L. (2016). Ocean research enabled by underwater gliders. Ann. Rev. Mar. Sci. 8, 519–541. doi: 10.1146/annurev-marine-122414-033913
Sallée, J. B., Speer, K., and Morrow, R. (2008). Response of the Antarctic circumpolar current to atmospheric variability. J. Clim. 21, 3020–3039. doi: 10.1175/2007JCLI1702.1
Schroeder, K., Chiggiato, J., Josey, S. A., Borghini, M., Aracri, S., and Sparnocchia, S. (2017). Rapid response to climate change in a marginal sea. Scien. Rep. 7:4065. doi: 10.1038/s41598-017-04455-5
Shay, L. K., and Brewster, J. K. (2010). Oceanic heat content variability in the eastern Pacific Ocean for hurricane intensity forecasting. Mon. Wea. Rev. 138, 2110–2131. doi: 10.1175/2010MWR3189.1
Shepard, T., Abraham, J. P., Schwalbach, D. S., Kane, S., Sigling, D., and Harrington, T. (2014). Velocity and density effect on impact force during water entry of spheres. J. Geophys. Remote Sens. 3:129. doi: 10.4172/2169-0049.1000129
Sherin, V. R., Durand, F., Gopalkrishna, V. V., Anuvinda, S., Chaitanya, A. V. S., Bourdalle-Badie, R., et al. (2018). Signature of indian Ocean dipole on the western boundary current of the Bay of Bengal. Deep Sea Res. 136, 91–106. doi: 10.1016/j.dsr.2018.04.002
Shi, J.-R., Xie, S.-P., and Talley, L. D. (2018). Evolving relative importance of the Southern Ocean and North Atlantic in anthropogenic ocean heat uptake. J. Clim. 31, 7459–7479. doi: 10.1175/JCLI-D-18-0170.1
Sloyan, B. M., Ridgway, K. R., and Cowley, R. (2016). The east australian current and property transport at 27°S from 2012 to 2013. J. Phys. Oceanogr. 46, 993–1008. doi: 10.1175/JPO-D-15-0052.1
Smith, N., Harrison, D., Bailey, R., Alves, O., Delcroix, T., Roemmich, K., et al. (2001). “The upper ocean thermal network,” in From: Observing the Oceans in the 21st Century, eds C. Koblinsky and N. Smith (Melbourne, VIC: Bureau of Meteorology, 259–284.
Sprintall, J. (2003). Subsurface structure of interannual temperature anomalies in the Australian sector of the Southern Ocean. J. Geophys. Res. 108:3285. doi: 10.1029/2002JC001494
Sprintall, J. (2008). Long-term trends and interannual variability of temperature in Drake Passage. Prog. Oceanogr. 77, 316–330. doi: 10.1016/j.pocean.2006.06.004
Sprintall, J., Chereskin, T. K., and Sweeney, C. (2012). High-resolution underway upper ocean and surface atmospheric observations in Drake Passage: synergistic measurements for climate science. Oceanography 25, 70–81. doi: 10.5670/oceanog.2012.77
Sprintall, J., Gordon, A. L., Wijffels, S. E., Feng, M., Hu, S., Koch-Larrouy, A., et al. (2019). Detecting change in the Indonesian seas. Front. Mar. Sci. 6:257. doi: 10.3389/fmars.2019.00257
Stephenson, G. R., Gille, S. T., and Sprintall, J. (2012). Seasonal variability of upper ocean heat content in Drake Passage. J. Geophys. Res. 117:C04019. doi: 10.1029/2011JC007772
Stephenson, G. R., Gille, S. T., and Sprintall, J. (2013). Processes controlling upper-ocean heat content in Drake Passage. J. Geophys. Res. 118, 4409–4423. doi: 10.1002/jgrc.20315
Suthers, I. M., Young, J. W., Baird, M. E., Roughan, M., Everett, J. E., Brassington, G. B., et al. (2011). The strengthening East Australian Current, its eddies and biological effects - an introduction and overview. Deep Sea Res. 58, 538–546. doi: 10.1016/j.dsr2.2010.09.029
Swart, N. C., Gille, S. T., Fyfe, J. C., and Gillett, N. P. (2018). Recent Southern Ocean warming and freshening driven by greenhouse gas emissions and ozone depletion. Nat. Geosci. 11, 836–841. doi: 10.1038/s41561-018-0226-1
Swart, S., Speich, S., Ansorge, I. J., Goni, G. J., Gladyshev, S., and Lutjeharms, J. R. E. (2008). Transport and variability of the Antarctic Circumpolar Current south of Africa. J. Geophys. Res. 113:C09014. doi: 10.1029/2007JC004223
Thadathil, P., Ghosh, A. K., Sarupria, J. S., and Gopalakrishna, V. V. (2001). An interactive graphical system for XBT data quality control and visualization. Comp. Geosci. 27, 867–876. doi: 10.1016/S0098-3004(00)00172-2
Thadathil, P., Saran, A. K., Gopalakrishna, V. V., Vethamony, P., and Araligidad, N. (2002). XBT fall rate in waters of extreme temperature: a case study in the Antarctic Ocean. J. Atmos. Oceanic Tech. 19, 391–397. doi: 10.1175/1520-0426-19.3.391
Thompson, A. F., Gille, S. T., MacKinnon, J. A., and Sprintall, J. (2007). Spatial and temporal patterns of small-scale mixing in Drake Passage. J. Phys. Oceanogr. 37, 572–592. doi: 10.1175/JPO3021.1
Todd, R., Goes, M., Baringer, M., Dong, S., Goni, G., Volkov, D., et al. (2019). Global Perspectives on observing ocean boundary current systems. Front. Marine Sci. 6:423. doi: 10.3389/fmars.2019.00423
Tonani, M., Balmaseda, M., Bertino, L., Blockley, E., Brassington, G., Davidson, F., et al. (2015). Status and future of global and regional ocean prediction systems. J. Oper. Oceanogr. 8, s201–s220. doi: 10.1080/1755876X.2015.1049892
Tsubouchi, T., Suga, T., and Hanawa, K. (2007). Three types of South Pacific subtropical mode waters: Their relation to the large-scale circulation of the South Pacific Subtropical Gyre and their temporal variability. J. Phys. Oceanogr. 37, 2478–2490. doi: 10.1175/JPO3132.1
Uehara, H., Kizu, S., Hanawa, K., Yoshikawa, Y., and Roemmich, D. (2008). Estimation of heat and freshwater transports in the North Pacific using high-resolution expendable bathythermograph data. J. Geophys. Res. 113:C02014. doi: 10.1029/2007JC004165
Verdy, A., Cornuelle, B., Mazloff, M. R., and Rudnick, D. L. (2017). Estimation of the tropical pacific ocean state 2010-13. J. Atmos. Oceanic Tech. 34, 1501–1517. doi: 10.1175/JTECH-D-16-0223.1
Vignudelli, S., Cipollini, P., Reseghetti, F., Fusco, G., Gasparini, G. P., and Manzella, G. M. R. (2003). Comparison between XBT data and TOPEX/Poseidon satellite altimetry in the ligurian-tyrrhenian area. Ann. Geophys. Atmos. Hydrospheres Space Sci. 21, 123–135. doi: 10.5194/angeo-21-123-2003
Von Schuckmann, K., Le Traon, P. Y., Aaboe, S., Fanjul, E. A., Autret, E., and Axell, L. (2018). Copernicus marine service ocean state report. J. Oper. Oceanogr. 11, S1–S142. doi: 10.1080/1755876X.2018.1489208
Wang, B., Liu, J., Kim, H.-J., Webster, P. J., and Yim, S.-Y. (2012). Recent change of the global monsoon precipitation (1979–2008). Clim. Dyn. 39, 1123–1135. doi: 10.1007/s00382-011-1266-z
Wijffels, S., and Meyers, G. (2004). An intersection of oceanic waveguides: variability in the indonesian throughflow region. J. Phys. Oceanogr. 34, 1232–1253. doi: 10.1175/1520-0485(2004)034<1232:AIOOWV>2.0.CO;2
Wijffels, S. E., Willis, J., Domingues, C. M., Barker, P., White, N. J., Gronell, A., et al. (2008). Changing expendable bathythermograph fall rates and their impact on estimates of thermosteric sea level rise. J. Clim. 21, 5657–5672. doi: 10.1175/2008JCLI2290.1
WMO (2015b). Manual on the Global Telecommunication System. WMO-386. WMO, Geneva. ISBN: 978-92-63-10386-4.
Keywords: expendable bathythermographs, surface currents, subsurface currents, meridional heat transport, ocean heat content, sea level, extreme weather
Citation: Goni GJ, Sprintall J, Bringas F, Cheng L, Cirano M, Dong S, Domingues R, Goes M, Lopez H, Morrow R, Rivero U, Rossby T, Todd RE, Trinanes J, Zilberman N, Baringer M, Boyer T, Cowley R, Domingues CM, Hutchinson K, Kramp M, Mata MM, Reseghetti F, Sun C, Bhaskar TVS U and Volkov D (2019) More Than 50 Years of Successful Continuous Temperature Section Measurements by the Global Expendable Bathythermograph Network, Its Integrability, Societal Benefits, and Future. Front. Mar. Sci. 6:452. doi: 10.3389/fmars.2019.00452
Received: 28 October 2018; Accepted: 08 July 2019;
Published: 24 July 2019.
Edited by:
Amos Tiereyangn Kabo-Bah, University of Energy and Natural Resources, GhanaReviewed by:
Eleanor Frajka-Williams, National Oceanography Centre, University of Southampton, United KingdomJohn Patrick Abraham, University of St. Thomas, United States
Copyright © 2019 Goni, Sprintall, Bringas, Cheng, Cirano, Dong, Domingues, Goes, Lopez, Morrow, Rivero, Rossby, Todd, Trinanes, Zilberman, Baringer, Boyer, Cowley, Domingues, Hutchinson, Kramp, Mata, Reseghetti, Sun, Bhaskar TVS and Volkov. This is an open-access article distributed under the terms of the Creative Commons Attribution License (CC BY). The use, distribution or reproduction in other forums is permitted, provided the original author(s) and the copyright owner(s) are credited and that the original publication in this journal is cited, in accordance with accepted academic practice. No use, distribution or reproduction is permitted which does not comply with these terms.
*Correspondence: Gustavo J. Goni, R3VzdGF2by5Hb25pQG5vYWEuZ292