 Nick Caputi
 Mervi Kangas
 Arani Chandrapavan
 Anthony Hart1
 Ming Feng
- 1Western Australian Fisheries and Marine Research Laboratories, Department of Primary Industries and Regional Development, North Beach, WA, Australia
- 2CSIRO Oceans and Atmosphere, Indian Ocean Marine Research Centre, Crawley, WA, Australia
The extreme Western Australia 2011 marine heatwave had a lasting effect on the marine ecosystem and after 7 years, only parts of the ecosystem have showed good signs of recovery. After the heatwave, scallop fisheries in the Abrolhos Is. and Shark Bay were closed for 3-5 years, while the Shark Bay crab fishery was closed for 18 months; these fisheries at the center of the heatwave have shown some improvement due to better protection of spawning stock and improved environmental conditions. Also at the center of the heatwave, Roe’s abalone suffered a catastrophic mortality and has not recovered as spawning stock remains very low. The Perth abalone stock which was outside the peak heatwave area had a major stock reduction but remained opened with reduced catches. The heatwave had a marked indirect effect on brown tiger prawns in Exmouth Gulf due to loss of seagrass habitat. The heatwave also resulted in a decline in western king prawn recruitment in Exmouth Gulf, to the north of heatwave center, but an improved recruitment in the cooler waters of Shark Bay. Western rock lobsters near the heatwave peak also appear to have been indirectly affected and have not recovered. Factors influencing the recovery rate from the heatwave appeared to be: species near their upper temperature range and/or sensitive to warming temperatures; spatial overlap between the warming event and species distribution; whether spawning stock was affected to the point of recruitment impairment; life-cycle duration of invertebrate (or habitat) species affected; and management intervention. This study provides a framework for managing the consequences of heatwaves on fisheries by highlighting the value of early identification of the event and its effect on fisheries and having flexible harvest strategies for early management intervention. This is particularly important as long-term increases in water temperatures will increase the frequency of marine heatwave events and the fisheries stocks would have less time for recovery.
Introduction
Environmental factors are important drivers of fisheries recruitment variation and they have become increasingly important under climate change, with more frequent episodic extreme climatic events occurring such as marine heatwaves. Hobday et al. (2016a) define a heatwave event as a prolonged discrete warm-water event that can be described by its duration, intensity, rate of evolution and spatial extent. An extreme marine heatwave in the austral summer of 2010/2011 affected 2000 km of coastline in the mid-west of Western Australia (WA) with warming anomalies of 2–4°C (Pearce and Feng, 2013; Wernberg et al., 2013; Benthuysen et al., 2014; Figure 1A). The marine heatwave was followed by 2 years of above-average summer water temperatures (Figure 1A). This region of WA is also a hotspot of long-term water temperature increases (Pearce and Feng, 2007), having been classified as one of the 24 global hotspots of temperature rise (Hobday and Pecl, 2013). Hobday et al. (2018) classified the 2011 WA event at their highest “Category IV level (extreme).” They also identified another heatwave in the same region in 1999, which was classified as Category III (severe).
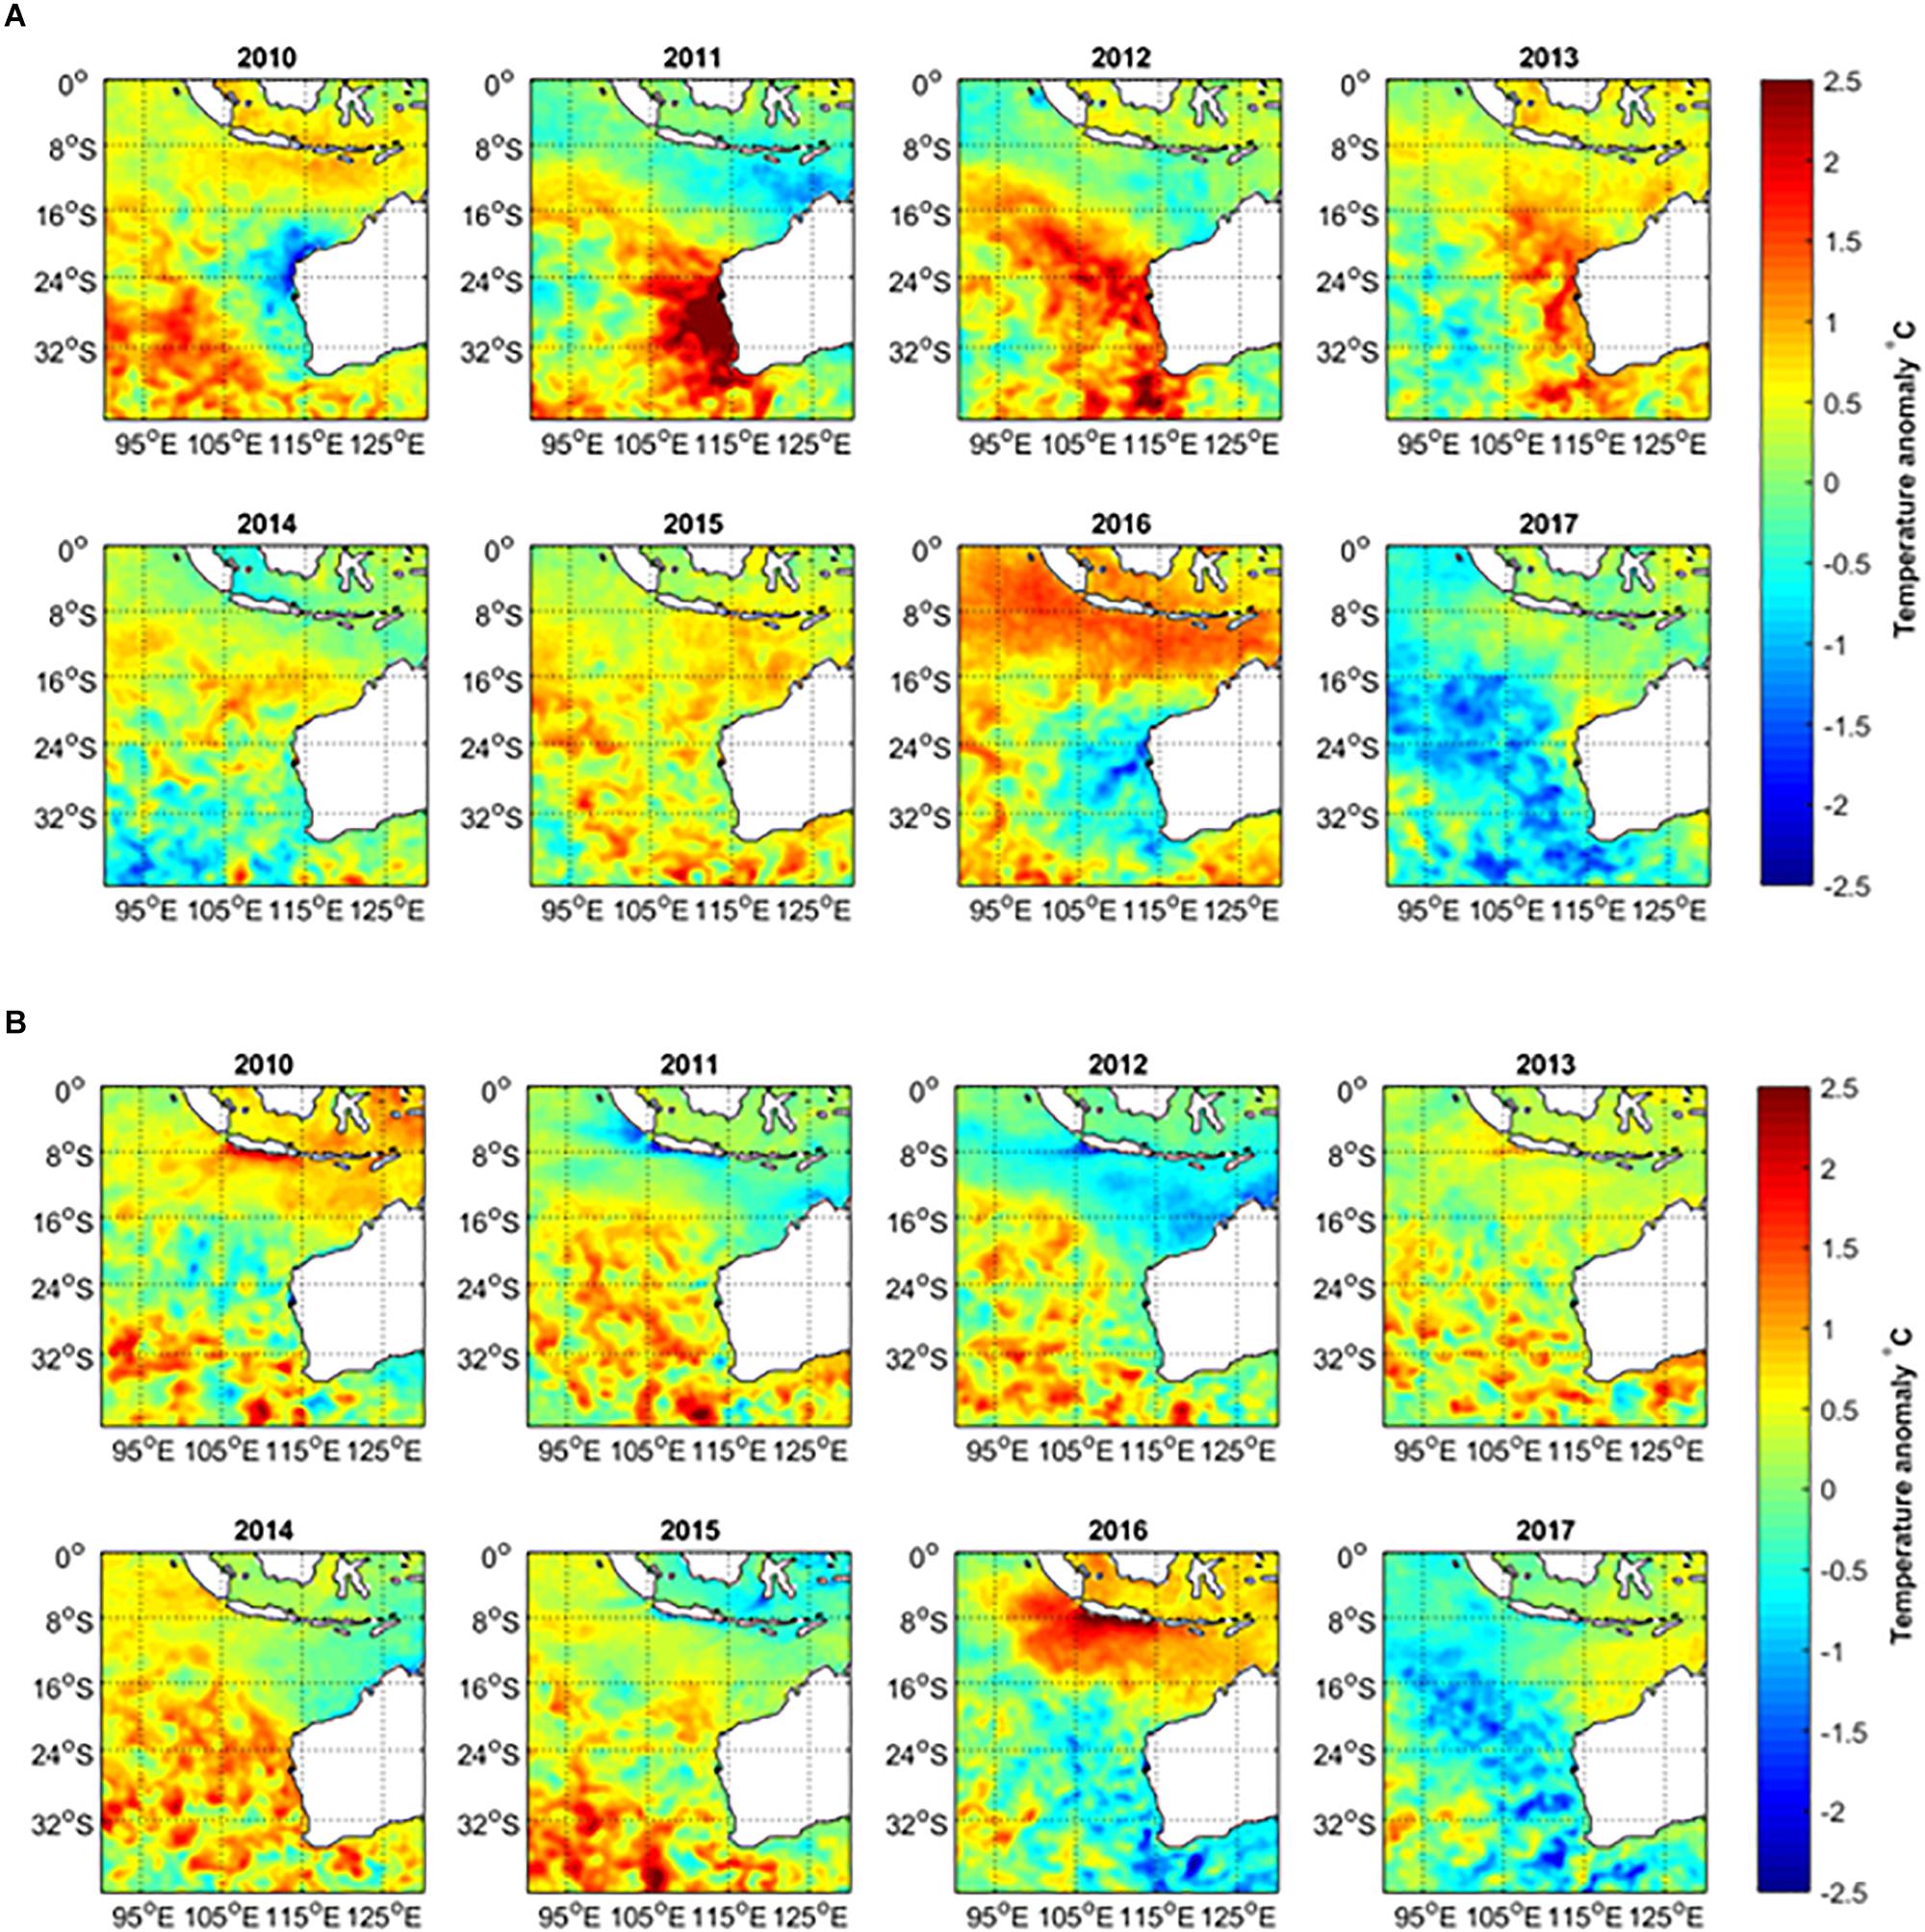
Figure 1. (A) February–March (peak summer months) and (B) August–September (peak winter months) average sea surface temperature anomalies in 2010–2017, relative to the long-term mean temperature during 1981–2017.
The 2011 heatwave had some major short and long-term effects on the marine ecosystem such as a reduction in abundance of habitat-forming seaweeds, a subsequent shift in community structure and a southward distribution shift in tropical finfish communities (Wernberg et al., 2013; Lenanton et al., 2017). Seagrasses in Shark Bay (Fraser et al., 2014) and Exmouth Gulf were also significantly negatively affected by the heatwave (McMahon et al., 2017) with a 58% loss of the main seagrass species (Amphibolis antarctica) cover in Shark Bay (Thomson et al., 2015). Coral bleaching followed by high mortality was recorded in areas of Ningaloo and Abrolhos Is. (Depczynski et al., 2012). An assessment 4 years after the heatwave showed a 43% loss of kelp forests with a 100 km range contraction of extensive kelp forests, forcing a regime shift to seaweed turfs (Wernberg et al., 2016). They also saw temperate species replaced by seaweeds, invertebrates, corals, and fish characteristic of subtropical and tropical waters which altered key ecological processes. Smale et al. (2017) noted a major reduction of all benthic macroinvertebrates in Kalbarri near the center of the heatwave after 4 years. These ecological studies are valuable in providing an overview of the effect of the heatwave on the ecosystem, however, they may not be undertaken on a systematic basis in the long term compared to some fisheries surveys that occur annually to enable an assessment of the stock and the setting of management parameters (Caputi et al., 2014). Fisheries data can be valuable in understanding the effect of the heatwave on stocks and comparing it to the annual variation experienced prior to the heatwave under typical environmental variation and fishing intensities, and assessing the rate of recovery of the stocks after a heatwave event.
Off the WA coast, subtropical regions (including the lower west coast) are more susceptible to marine heatwaves during La Niña events and these have contributed to 1999 and 2011 events, whereas tropical regions are more susceptible to marine heatwaves during El Niño events (Zhang et al., 2017). Water temperatures off the west coast of Australia have declined in subsequent years after the consecutive marine heatwave events during 2011–2013 (Figures 1A, 2A). Cooler water temperature anomalies have been observed off the lower west coast in the 2015/2016 summer (Figures 1A, 2A) during the onset of a strong El Niño event.
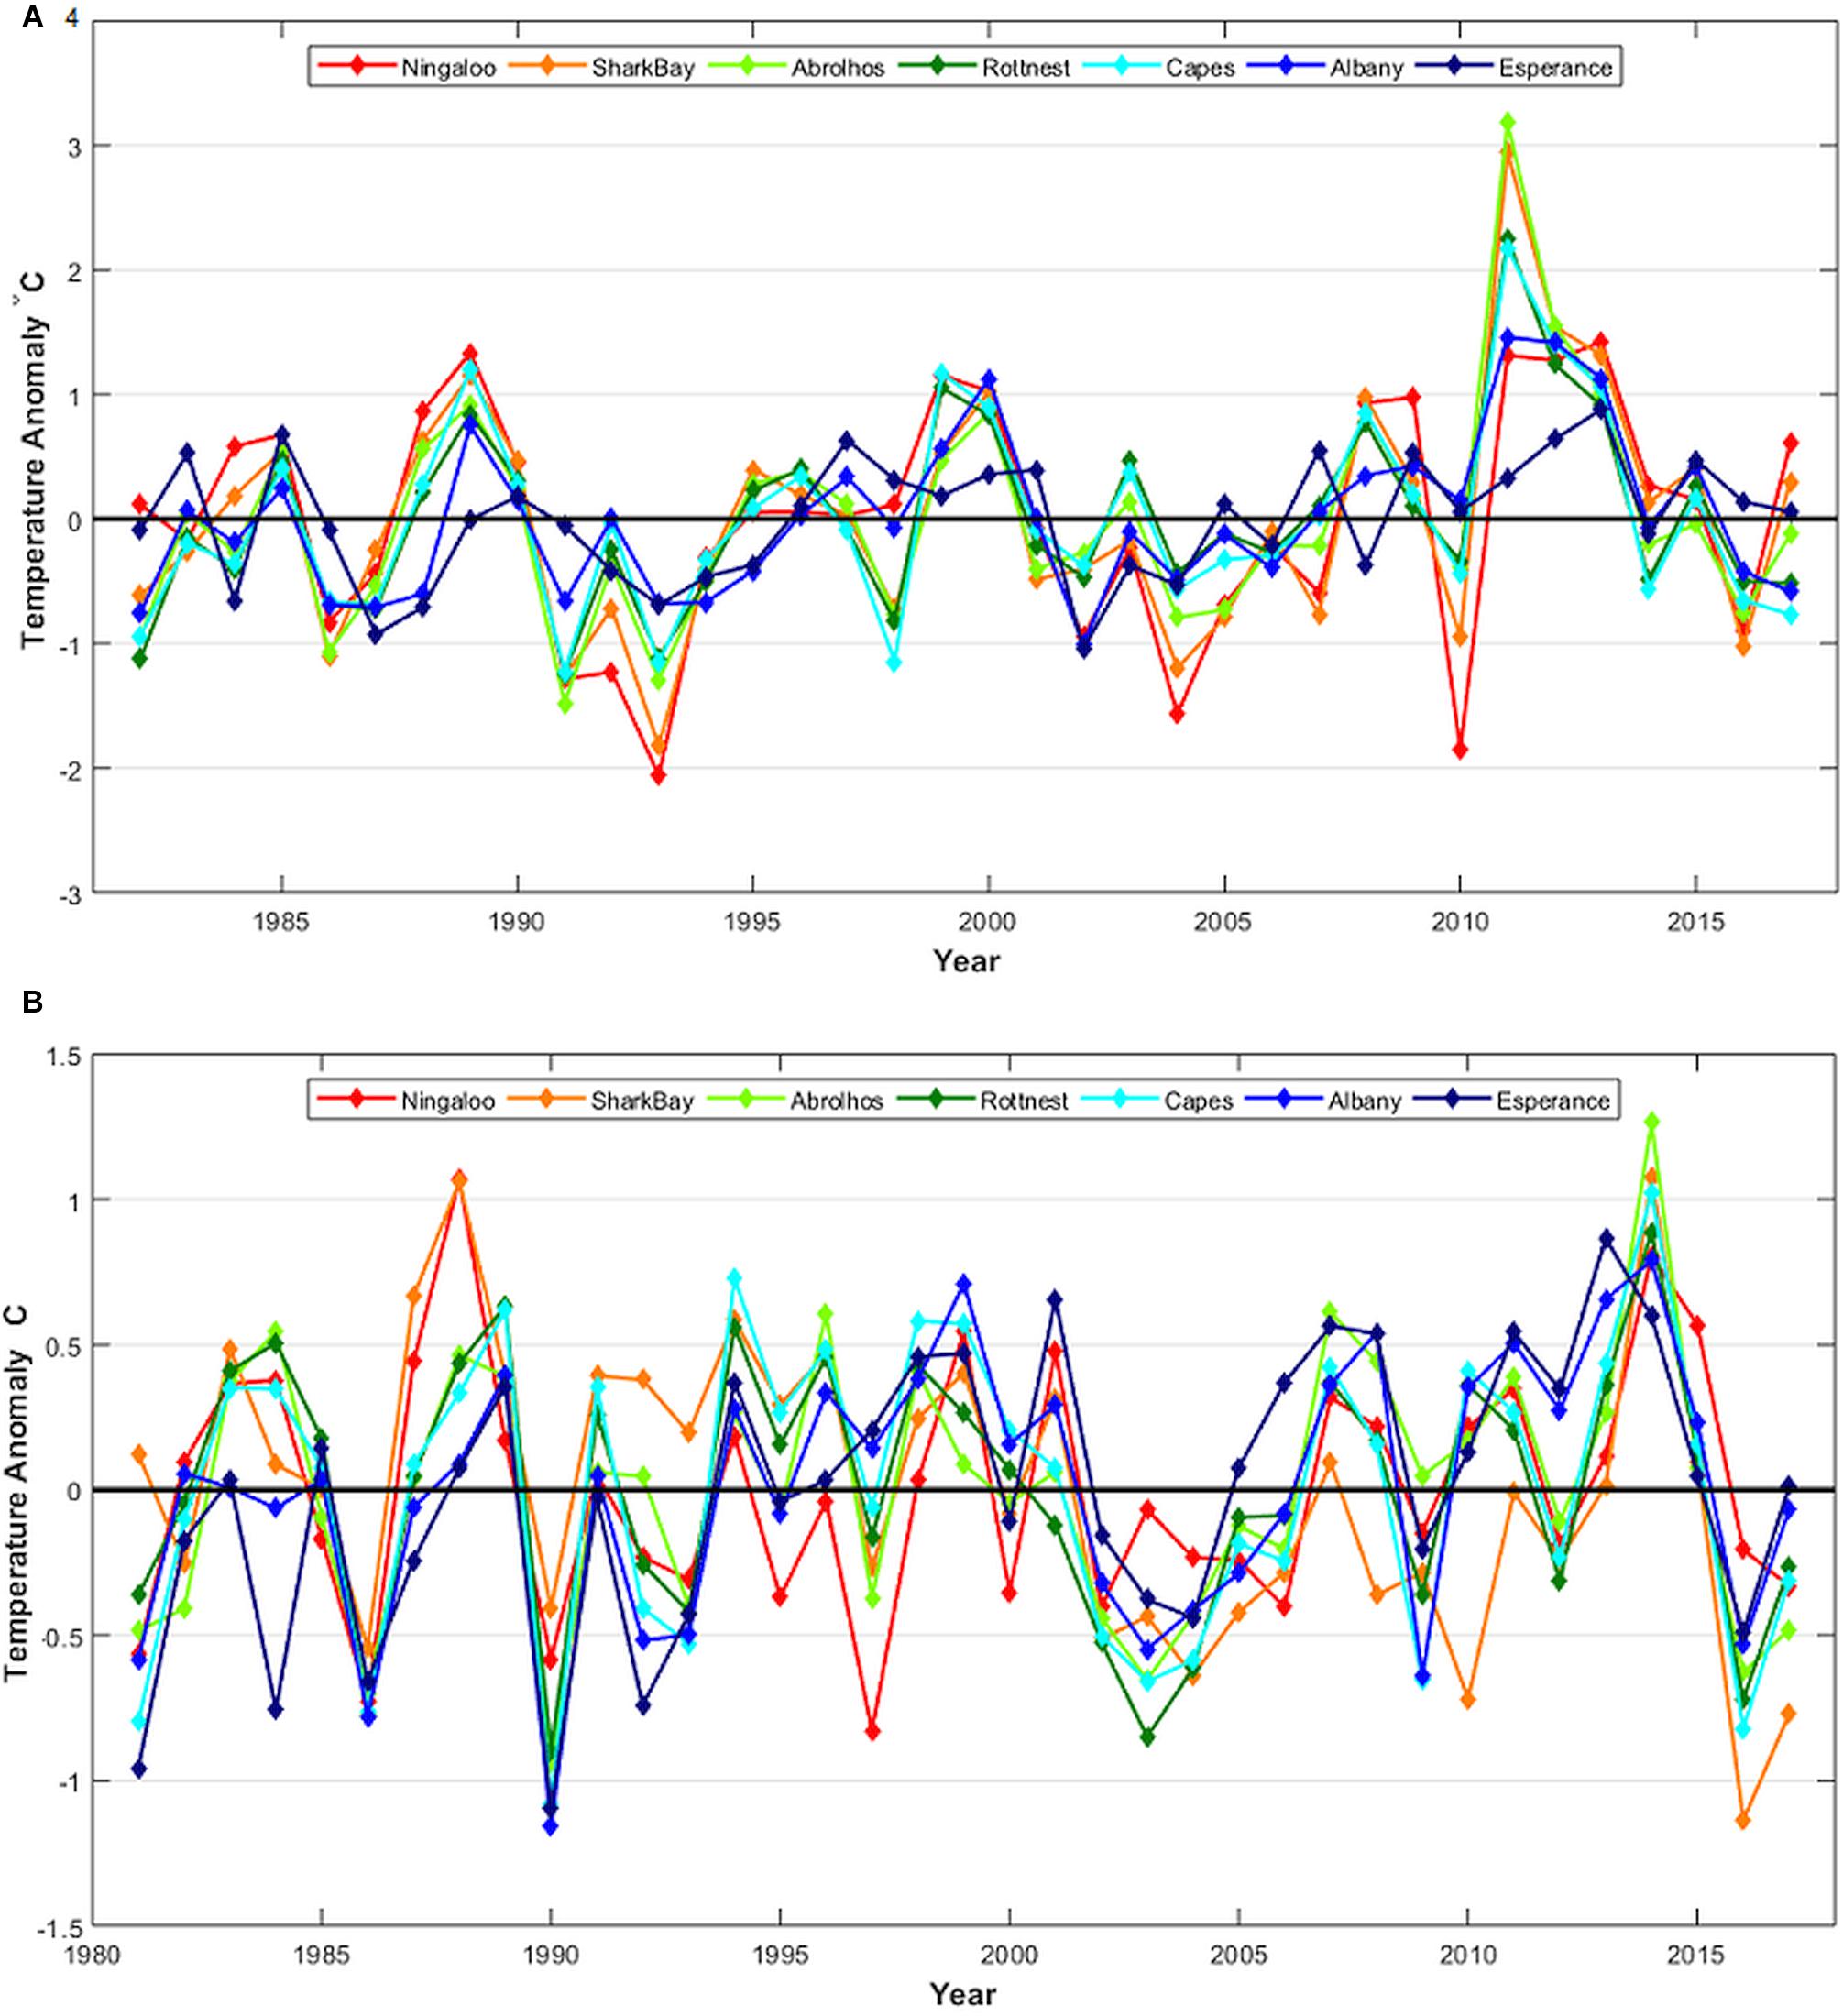
Figure 2. (A) February–March and (B) August–September sea surface temperature (SST) anomalies at selected locations using SST averaged for 1° blocks off Western Australia on the west coast near Ningaloo (Nin), Shark Bay (SHB), Abrolhos Is. (ABR), Rottnest Is.(ROT), and the Capes region (CAP), and the south coast near Albany (ALB) and Esperance (ESP). See Figure 3 for map locations.
Western Australia is one of several regions affected by marine heatwaves in recent years (Hobday et al., 2016a) with south-east Australia being one the latest regions affected in 2015/2016 (Oliver et al., 2017; Schaeffer and Roughan, 2017) with this event referred to as Tasman Sea, Australia 2015–Category II (strong) heatwave by Hobday et al. (2018). This latter event affected invertebrate fisheries of Pacific oysters and blacklip abalone, the aquaculture of Atlantic salmon, with intrusions of fish normally seen in warmer waters further north. Other events around the world in recent years include (a) the Mediterranean Sea 1999 event (Category I moderate) with a large-scale mass mortality of benthic species in the summer of 1999 (Cerrano et al., 2000) and also in 2003 (Category II strong) when macro-invertebrate species were affected (Garrabou et al., 2009); (b) the Northwest Atlantic 2012 event (Category II) resulting in a major impact on coastal ecosystems and economies, with a significant effect on the American lobster (Mills et al., 2013); (c) the Northeast Pacific blob 2015 event (Category III severe) resulted in an unprecedented warming event in 2014–2016 (Bond et al., 2015; Cavole et al., 2016) resulting in harmful algal bloom which caused the closure of valuable shellfish fisheries (Di Lorenzo and Mantua, 2016); and (d) declines in coral cover, due to coral bleaching were observed resulting from the Great Barrier Reef 2016 event (Category II) on the east coast of Australia due to extreme temperatures (Hughes et al., 2017). Some common features of many of these marine heatwave events appear to be a major effect on habitat structures (Wernberg et al., 2013) and sessile or slow-moving invertebrates and the movement of species from warmer waters into the affected area (Smale et al., 2019).
Under the present warming trend influenced by anthropogenic forcing, these extreme events are expected to become more frequent with an estimated increase in global average frequency and duration of 34 and 17%, respectively, since 1925 (Oliver et al., 2018). Frölicher and Laufkötter (2018) highlighted the large increase in marine heatwave events as a result of moderate long-term increase in mean sea surface temperature (SST) and Schlegel et al. (2017) identified the effect of aseasonal variability in wind and current patterns. Therefore it is important to assess the effects of these extreme events on the ecosystem and commercial and recreational fisheries stocks that are affected. As some parts of the ecosystem have not yet recovered to date or may be suffering a permanent change (Wernberg et al., 2016; Smale et al., 2017), the question remained as to whether the invertebrate fisheries stocks affected by the heatwave (Caputi et al., 2016) would ever fully recover given the very low abundance (99% decline in some cases) observed in the years after the heatwave.
There has been a high commercial cost to a number of invertebrate fisheries which have been affected by a series of low recruitment (Caputi et al., 2016). Therefore it is important to examine how these stocks have fared in the 7 years since the heatwave, the extent of their recovery, and the reasons for the different timing of recovery. The invertebrate stocks examined include scallops, blue swimmer crabs, Roe’s abalone, western king and brown tiger prawns and western rock lobsters (Figure 3). This study also provided a framework for assessment and management responses to marine heatwave impacts on fisheries in other regions by highlighting the value of early identification of the extreme event and its effect on fishery stocks and having flexible harvest strategies for early management intervention.
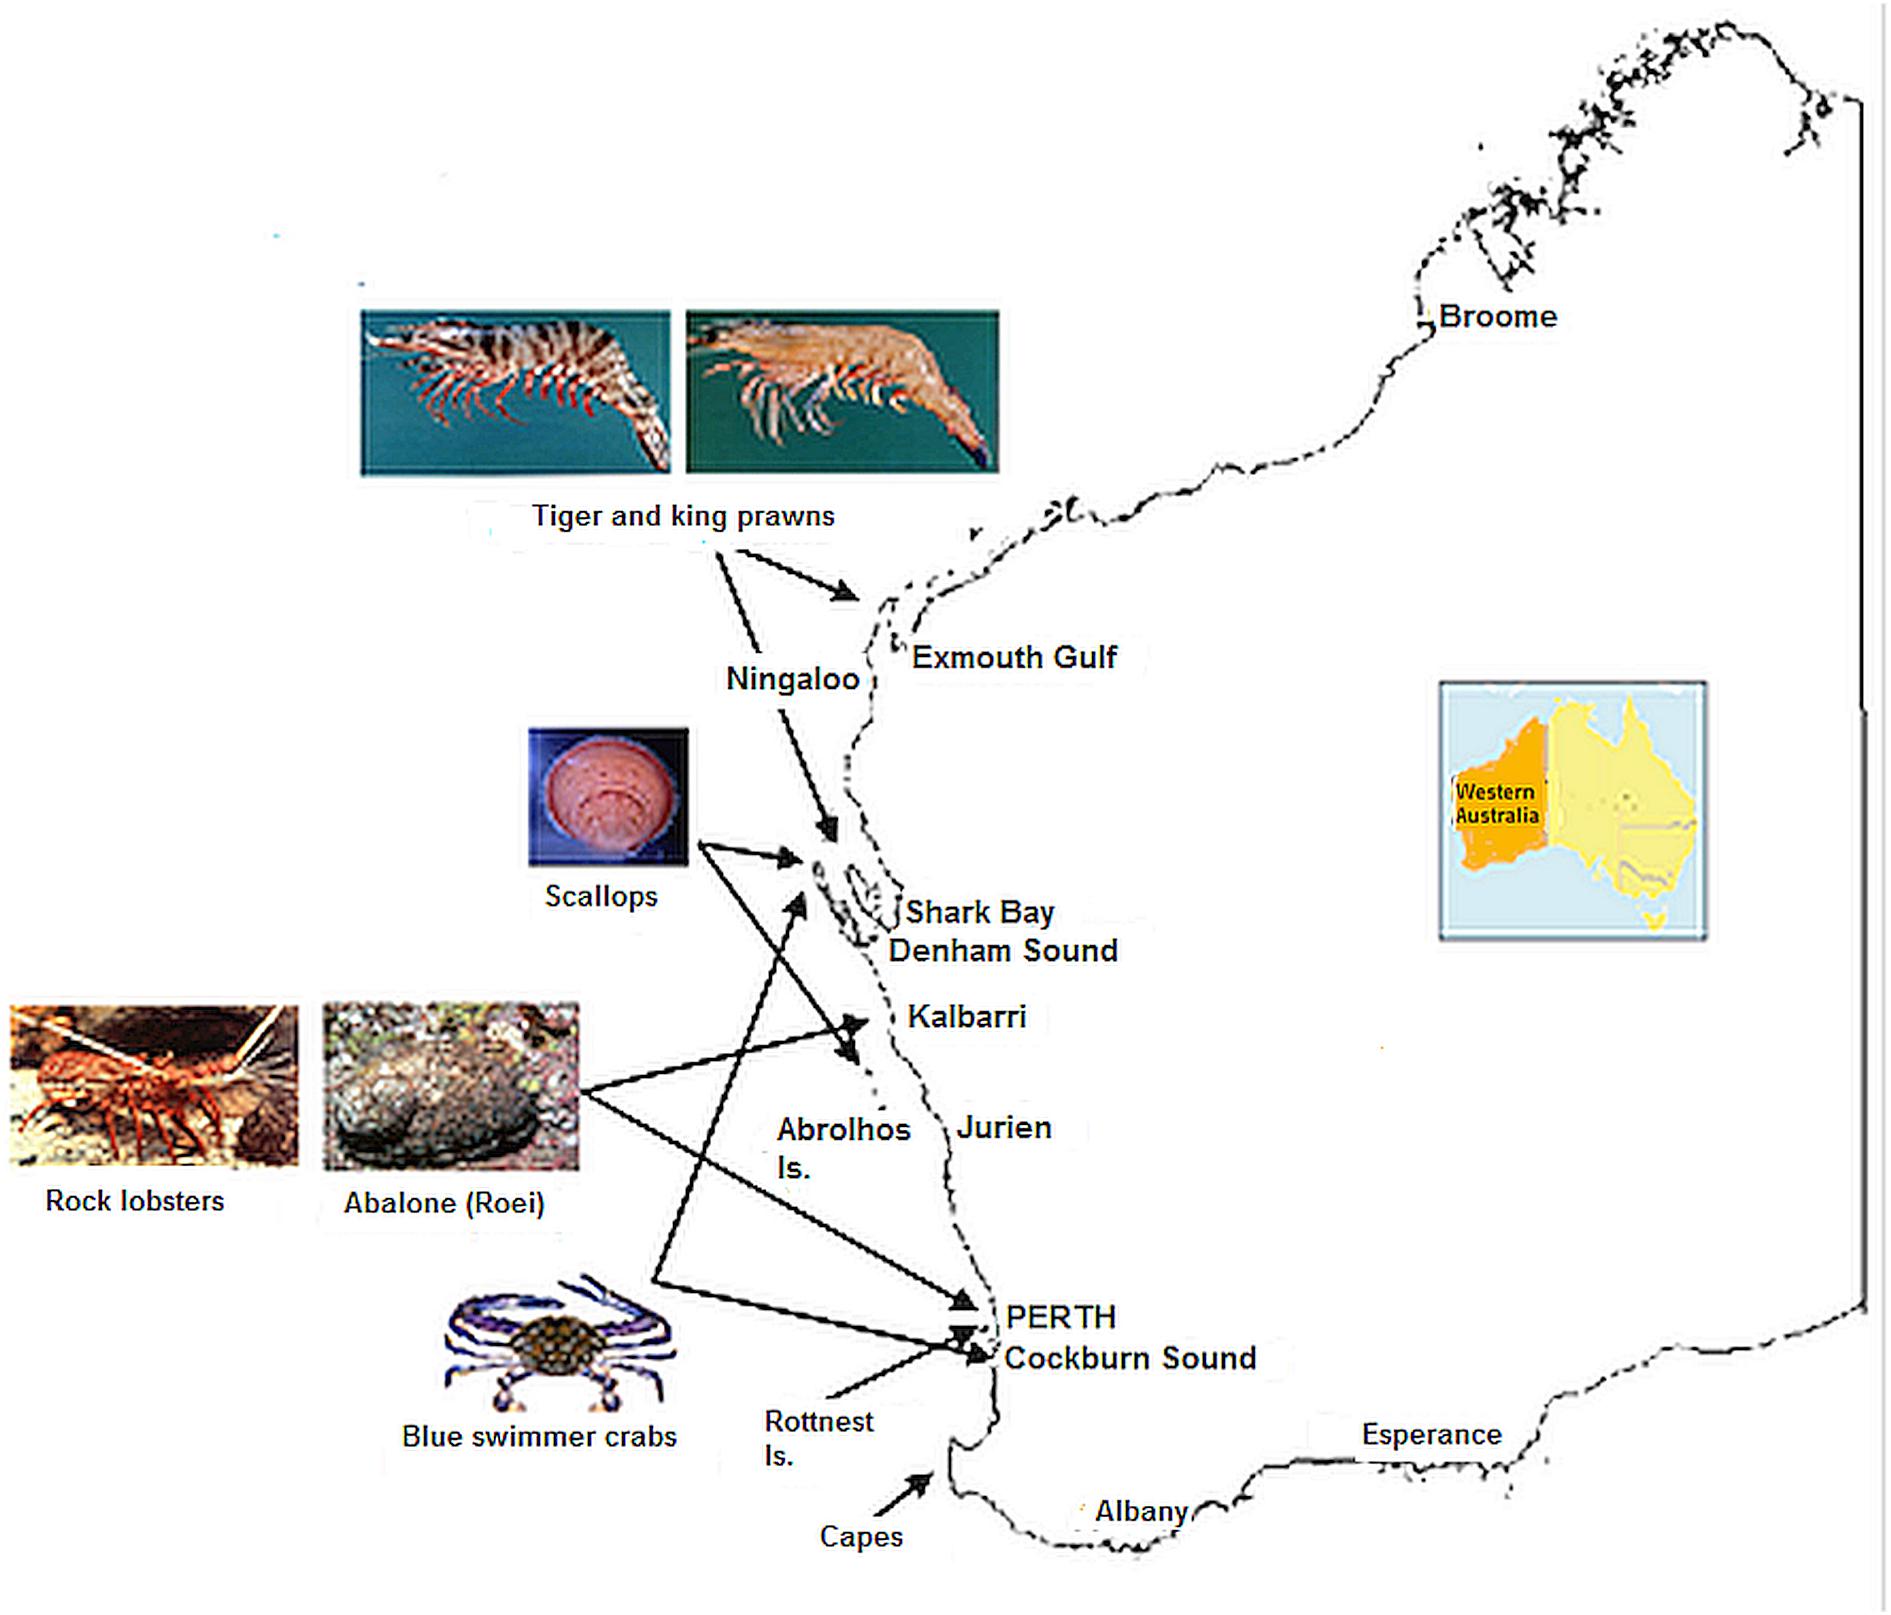
Figure 3. Map of Western Australia showing key locations of fisheries and SST locations specified in Figure 2.
Materials and Methods
Marine Environment
The NOAA OIv2 SST data from 1981 to 2017 at 1/4 degree (∼28 km) resolution (Reynolds et al., 2007) were used to calculate monthly anomalies for each grid point relative to 1981–2017 and these are assessed for the austral summer (February–March) and winter (August–September). Smale and Wernberg (2009) have shown that satellite SST data can be reliably used to monitor water temperatures.
Effect of Heatwave on Invertebrate Stocks
The commercial and recreational invertebrate stocks selected for assessment of recovery from the heatwave event were those that overlapped the area of the heatwave and had been identified as being affected by the heatwave (Caputi et al., 2016). The stocks examined with their annual fisheries recruitment abundance indices were: (a) Shark Bay crabs: annual November fishery-independent trawl survey legal-size abundance (Chandrapavan et al., 2018); (b) Shark Bay scallops: juvenile recruit (0 +) and adult (1 +) catch rates from the November trawl survey (Kangas et al., 2012); (c) Abrolhos Is. scallops: juvenile recruit catch rates (∼1-year-old) in an annual November trawl survey; (d) Exmouth Gulf and Shark Bay: western king and brown tiger prawn: juvenile recruit (0 +) trawl catch rates in March–April surveys (Kangas et al., 2015a,b); (e) Perth metropolitan area Roe’s abalone: dive survey abundance of 1 + juveniles in February–March (Hart et al., 2013, 2017); and (f) western rock lobster in the Kalbarri and Jurien region: fishery-independent puerulus (0 +) monitoring and undersize (3 and 4 +) abundance from commercial monitoring (de Lestang et al., 2016).
The effect of the heatwave on the recruitment abundance of the various invertebrate stocks is assessed by comparing the lowest (and highest) recruitment level post heatwave to the average abundance in the 5 years (2006–2010) before the heatwave. The ratio of lowest (and highest) recruitment abundance post heatwave to the pre-heatwave average abundance is calculated as a measure of the maximum effect of the heatwave on the stocks and the level of recovery in the 7 years since the event.
For the western rock lobster fishery, the relationship between puerulus settlement and undersize abundance 3–4 years later for the period before the heatwave was used to project the expected undersize abundance post-heatwave to assess the effect of the heatwave during the puerulus to undersize (juvenile) phase of the life cycle.
The duration of the effect of the heatwave on the invertebrate stocks in Western Australia is classified as (1) short-term (<2 year) changes such as localized fish kills, increased or decreased recruitment abundance for 1–2 years; (2) longer-term (3–7 year) changes with “recovery” occurring after a few years; and (3) no recovery to date (> 7 years) with possible “permanent” changes on fisheries.
The factors examined which may have affected the rate of recovery include: (a) species near their upper temperature range; (b) species sensitivity to warming temperatures; (c) spatial overlap between the warming event and the species distribution; (d) whether spawning stock was affected to the point of recruitment impairment; (e) life-cycle duration of the invertebrate species affected; (f) changes to habitat/ecological structures and species’ recruitment relationship with that structure; and (g) management action undertaken.
Results
Marine Environment
The austral summer SSTs off the west coast of Australia highlighted the strength of the 2011 Western Australian marine heatwave (Figures 1A, 2A). Despite cooler summer ocean temperatures in 2010, as influenced by the 2009/2010 El Niño (Figure 2A), water temperatures were 2–3°C above the long-term bi-monthly average for all the west coast locations in summer 2010/2011, which represent the highest recorded (Hobday et al., 2016a). The elevated summer temperatures persisted into the 2011/2012 and 2012/2013 summers (Figures 1A, 2A). At the peak of the heatwave in February–March 2011, the entire region from the Abrolhos Islands to Exmouth experienced extremely high temperatures with warming anomalies of 2–4°C (Pearce and Feng, 2013). The heatwave expanded further into the South-East Indian Ocean, with temperature anomalies greater than 1°C observed as far as 100°E in the 2011/2012 summer (Figure 1A). From 2011 to 2013, winter temperatures along the west coast were close to average, although offshore waters generally experienced warmer temperatures with warming anomalies of 0.5–1°C. However, the 2014 winter temperatures also warmed up along most of the west coast, reaching 1–1.5°C anomalies at various locations (Figures 1B, 2B).
Shark Bay endured some extreme temperature fluctuations during 2010 and 2011 with SSTs being well-below average in the 2009/2010 summer and 2010 winter, but then changing to its highest SST during the 2010/2011 summer heatwave (Figure 2).
Summer SSTs declined from the peak in 2010/2011 and were close to average in 2013/2014 and 2014/2015 and then below average in 2015/2016 at a number of locations for the first time since 2010/2011 (Figures 1A, 2A). The cooler temperatures were influenced by one of the most severe El Niño events on record that lasted from early-2014 to mid-2016, dubbed the Godzilla-El Niño. This resulted in weaker Leeuwin Currents and cool SST anomalies off the lower west coast of Australia during 2015/2016, though with widespread warm anomalies in the tropical regions off the north coast of Australia (Figure 1; Benthuysen et al., 2018).
Shark Bay and Abrolhos Is. Scallops
The key scallop (Ylistrum balloti) trawl fisheries in Western Australia are based in Shark Bay which consists of two separate stocks, northern Shark Bay and Denham Sound (Kangas et al., 2012), and at the Abrolhos Islands. The annual trawl survey has been used for catch prediction in the following season for these fisheries (Joll and Caputi, 1995; Caputi et al., 2014). Since 2015 these surveys have been used for the setting of the total allowable catch (TAC) in Shark Bay as the management of the fishery has moved from effort controls to individual transferable quota (ITQ).
Scallop recruitment abundance (and subsequent catch) fluctuates markedly between years and is strongly influenced by water temperature prior to and during the peak spawning period (e.g., r = −0.46, p < 0.01 for northern Shark Bay, r = −0.39, p = 0.03 for Denham Sound, and r = −0.84, p < 0.001 for Abrolhos Is. (Caputi et al., 2015). High water temperatures (associated with La Niña and strong Leeuwin Current) always result in poor recruitment (Joll and Caputi, 1995; Lenanton et al., 2009) while below-average temperatures are required for good recruitment although this is not always guaranteed (Caputi et al., 2016). Hence the effect of the 2011 heatwave and the subsequent years of above-average SST resulted in a series of record-low 0 + recruit abundances during 2011–2013 for both stocks in Shark Bay (Figure 4), particularly in northern Shark Bay which declined 2–3 orders of magnitude resulting in < 1% of the pre-heatwave abundance (Table 1). This resulted in early management intervention with industry’s support that resulted in the Shark Bay scallop fishery being closed in 2012–2014 to maximize the protection of the spawning stock.
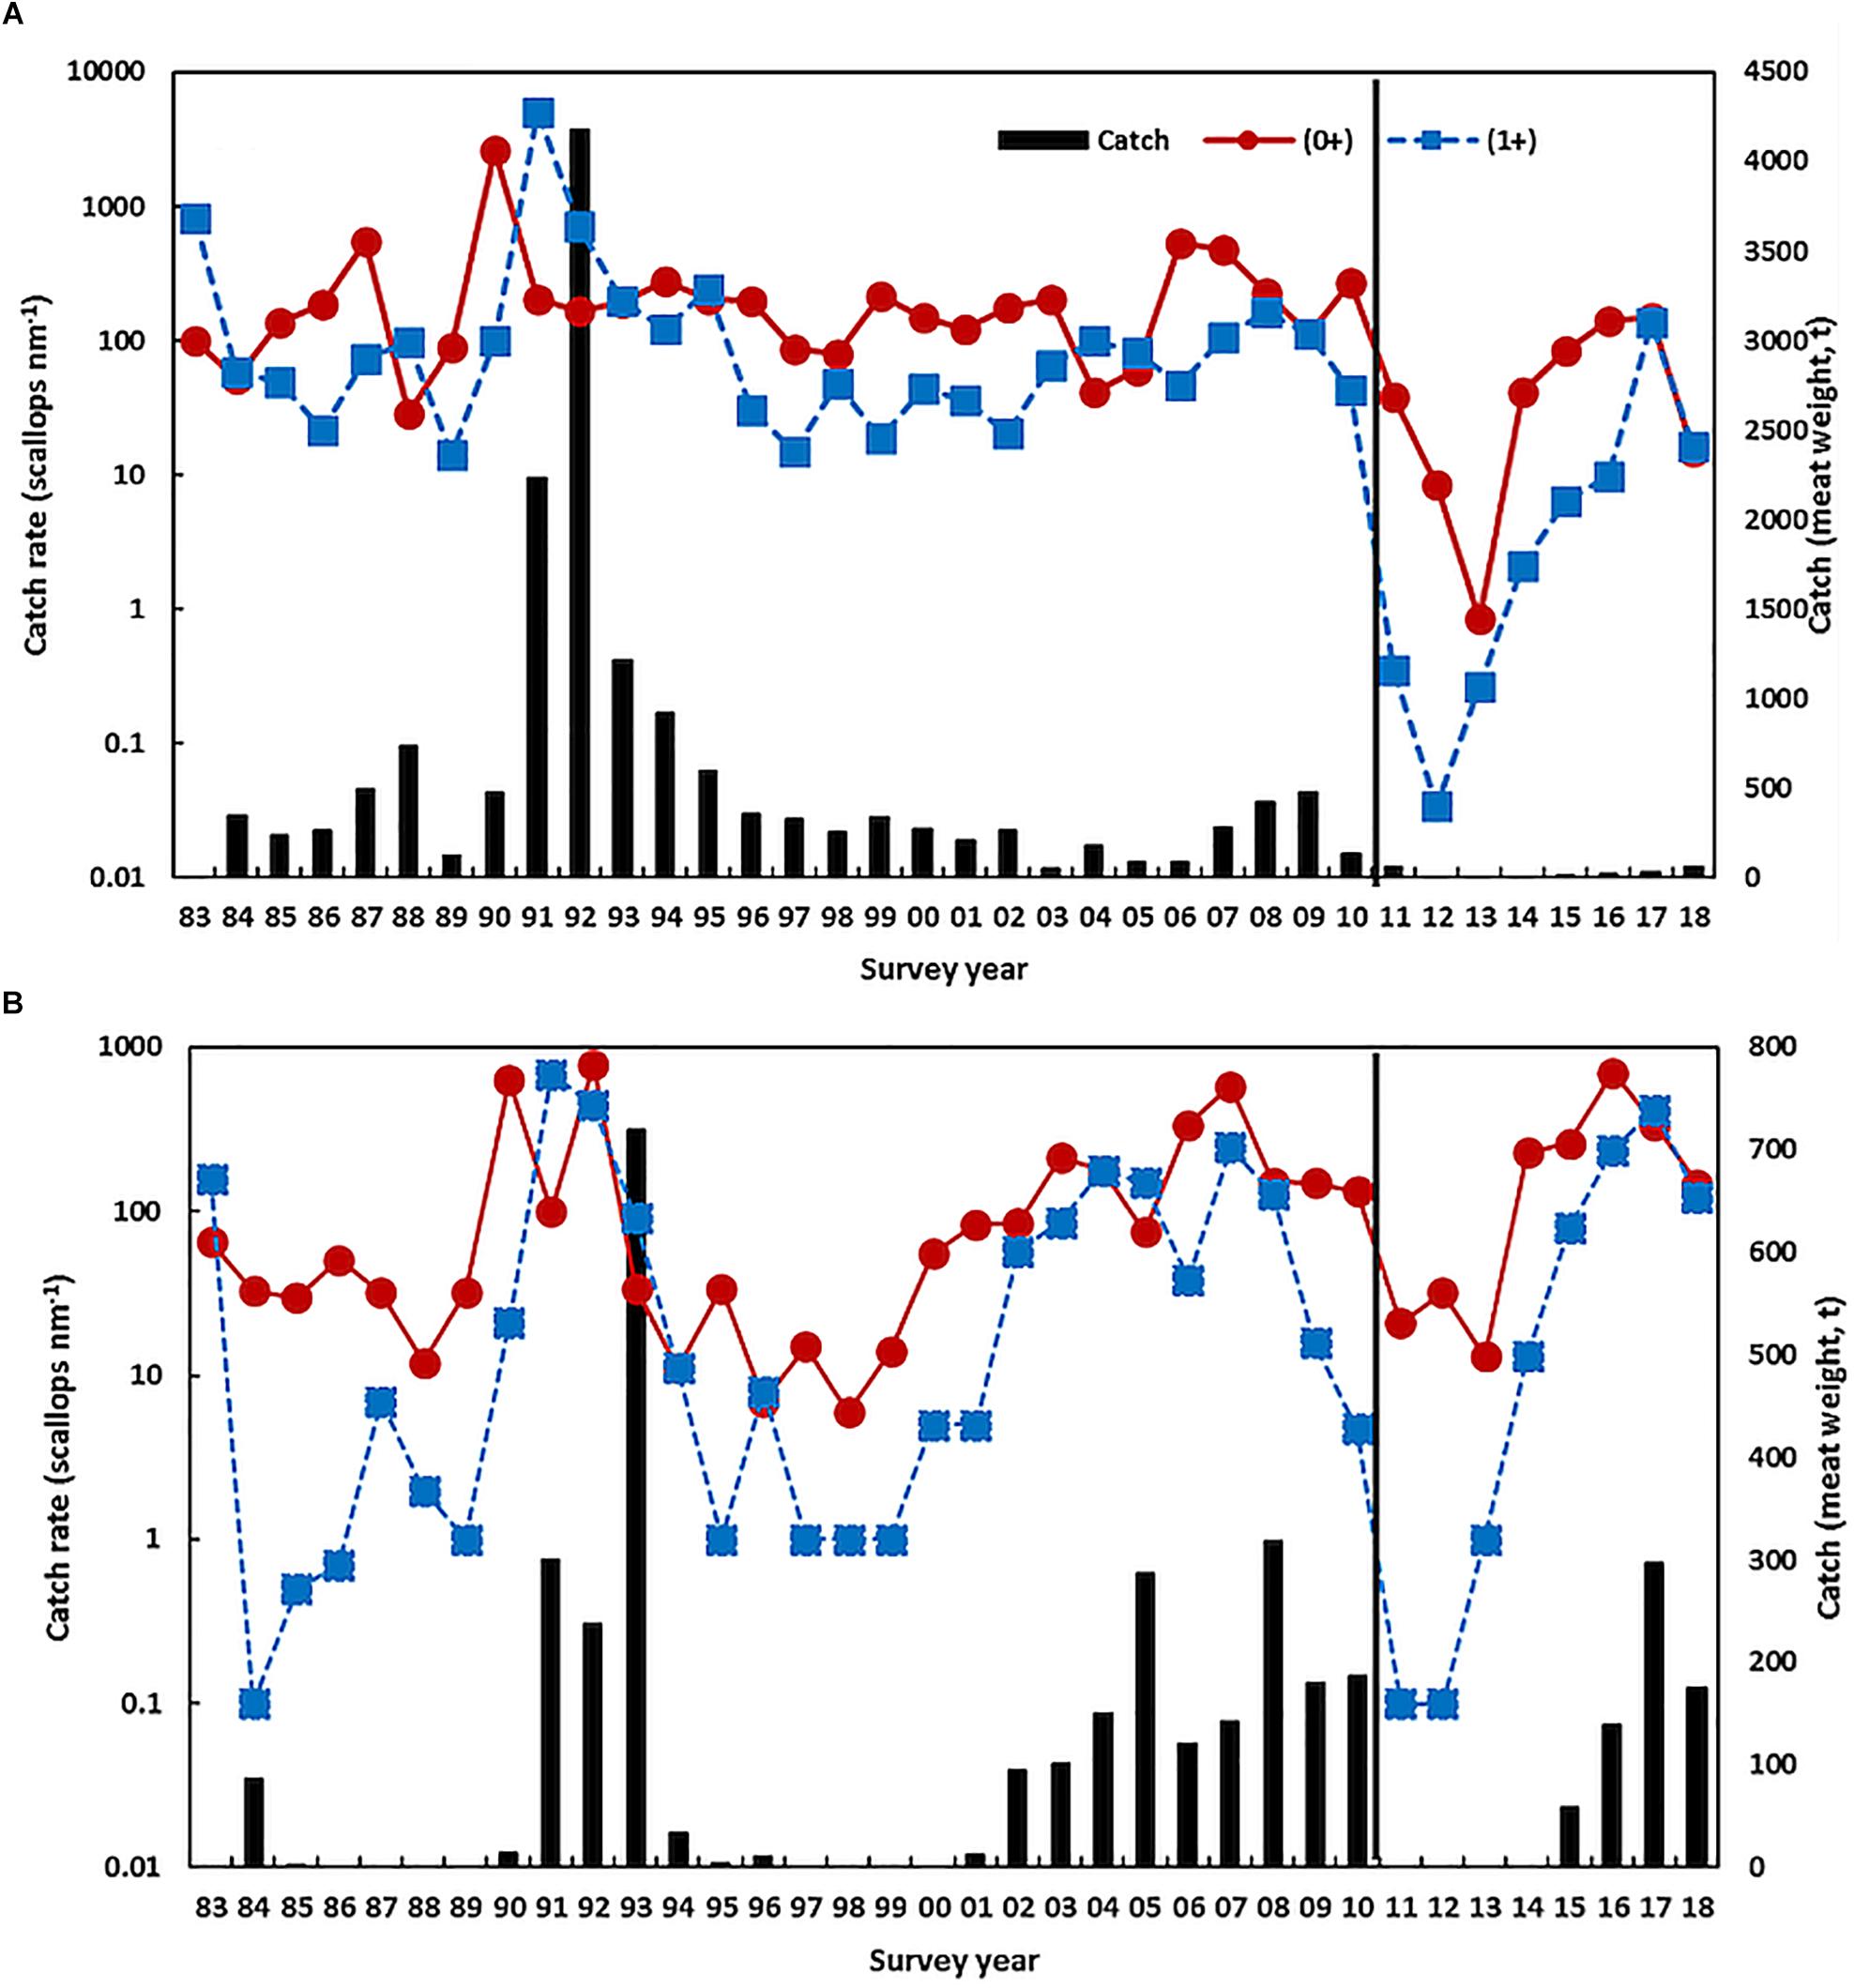
Figure 4. Scallop juvenile recruitment (0 +) and adult (1 +) catch rate from November trawl surveys on a log scale and the catch (t, vertical bars) in (A) northern Shark Bay and (B) Denham Sound. The vertical line indicates the occurrence of the heatwave.
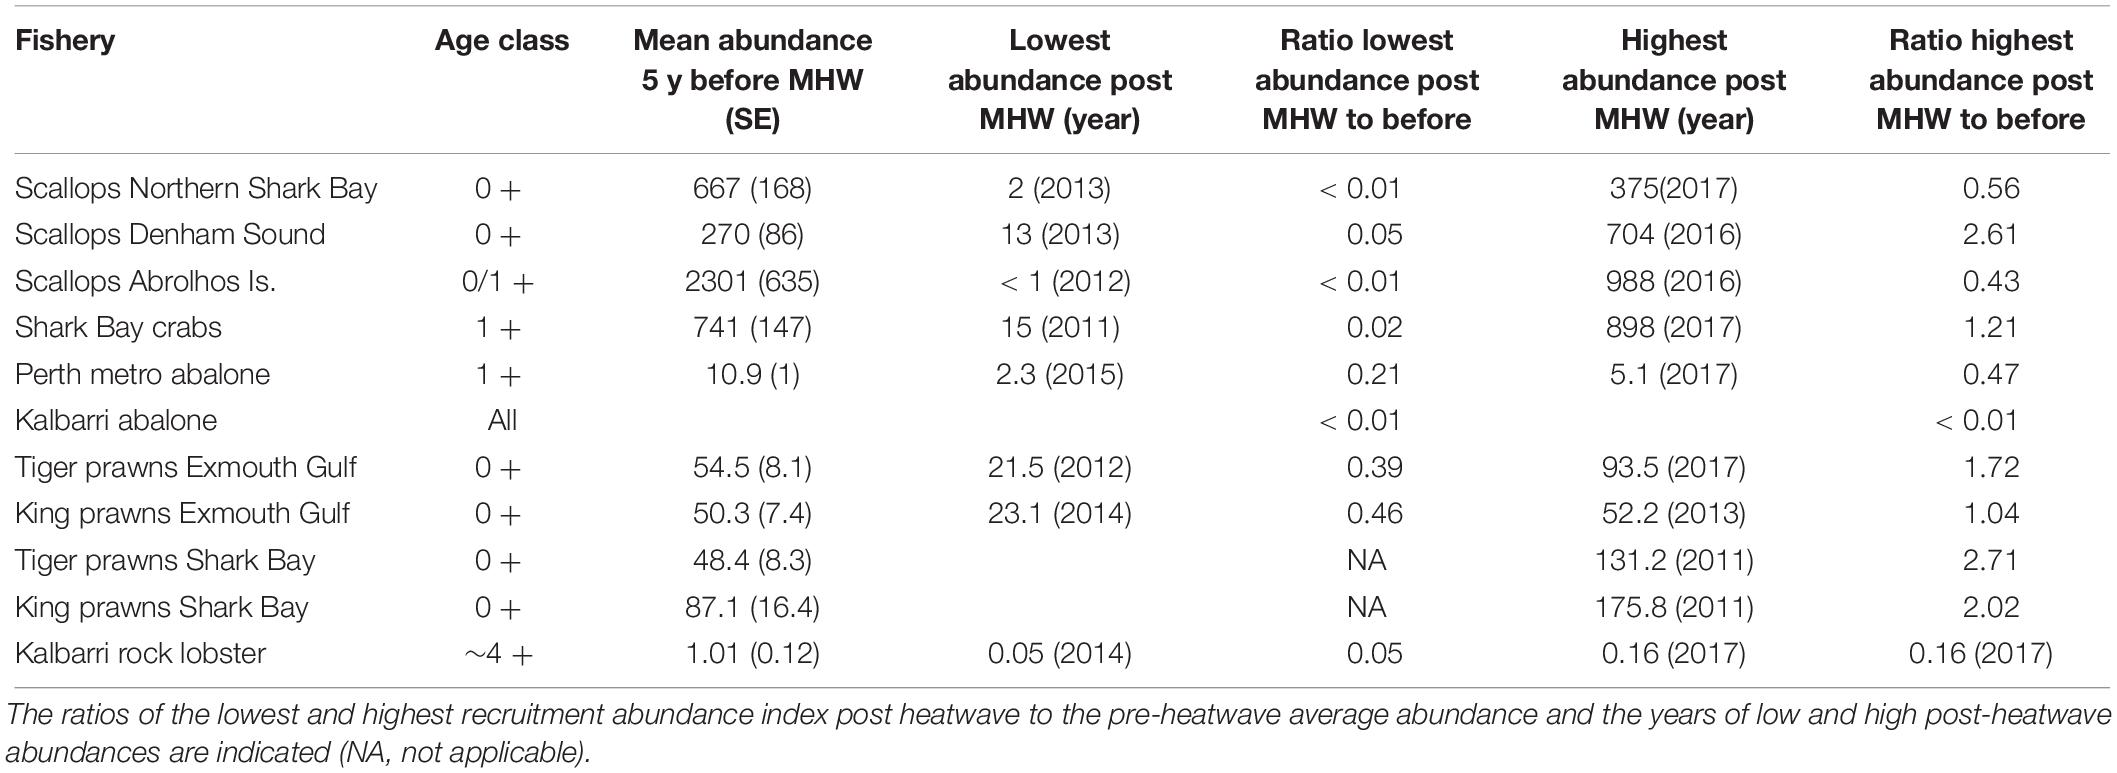
Table 1. The effect of the marine heatwave (MHW) on the recruitment and the level of recovery after the heatwave are compared to the mean abundance indices in the 5 years before the heatwave.
The series of years with low scallop recruitment abundance also meant that the spawning stock was reduced to historic low levels during 2012–2014 in both Shark Bay and the Abrolhos Islands and this is one of the key reasons that delayed the recovery of this stock (Table 2). Surveys of the Abrolhos Islands stock, for example, achieved an average catch rate of 0.4 scallops per nautical mile of trawling in 2012 and 2013 compared to 1000’s of scallops per nautical mile before the heatwave (Figure 5). There were strong concerns at the time about the ability of these stocks to recover from these very low abundance levels, with the Abrolhos Islands remaining closed for 5 years between 2012 and 2016.
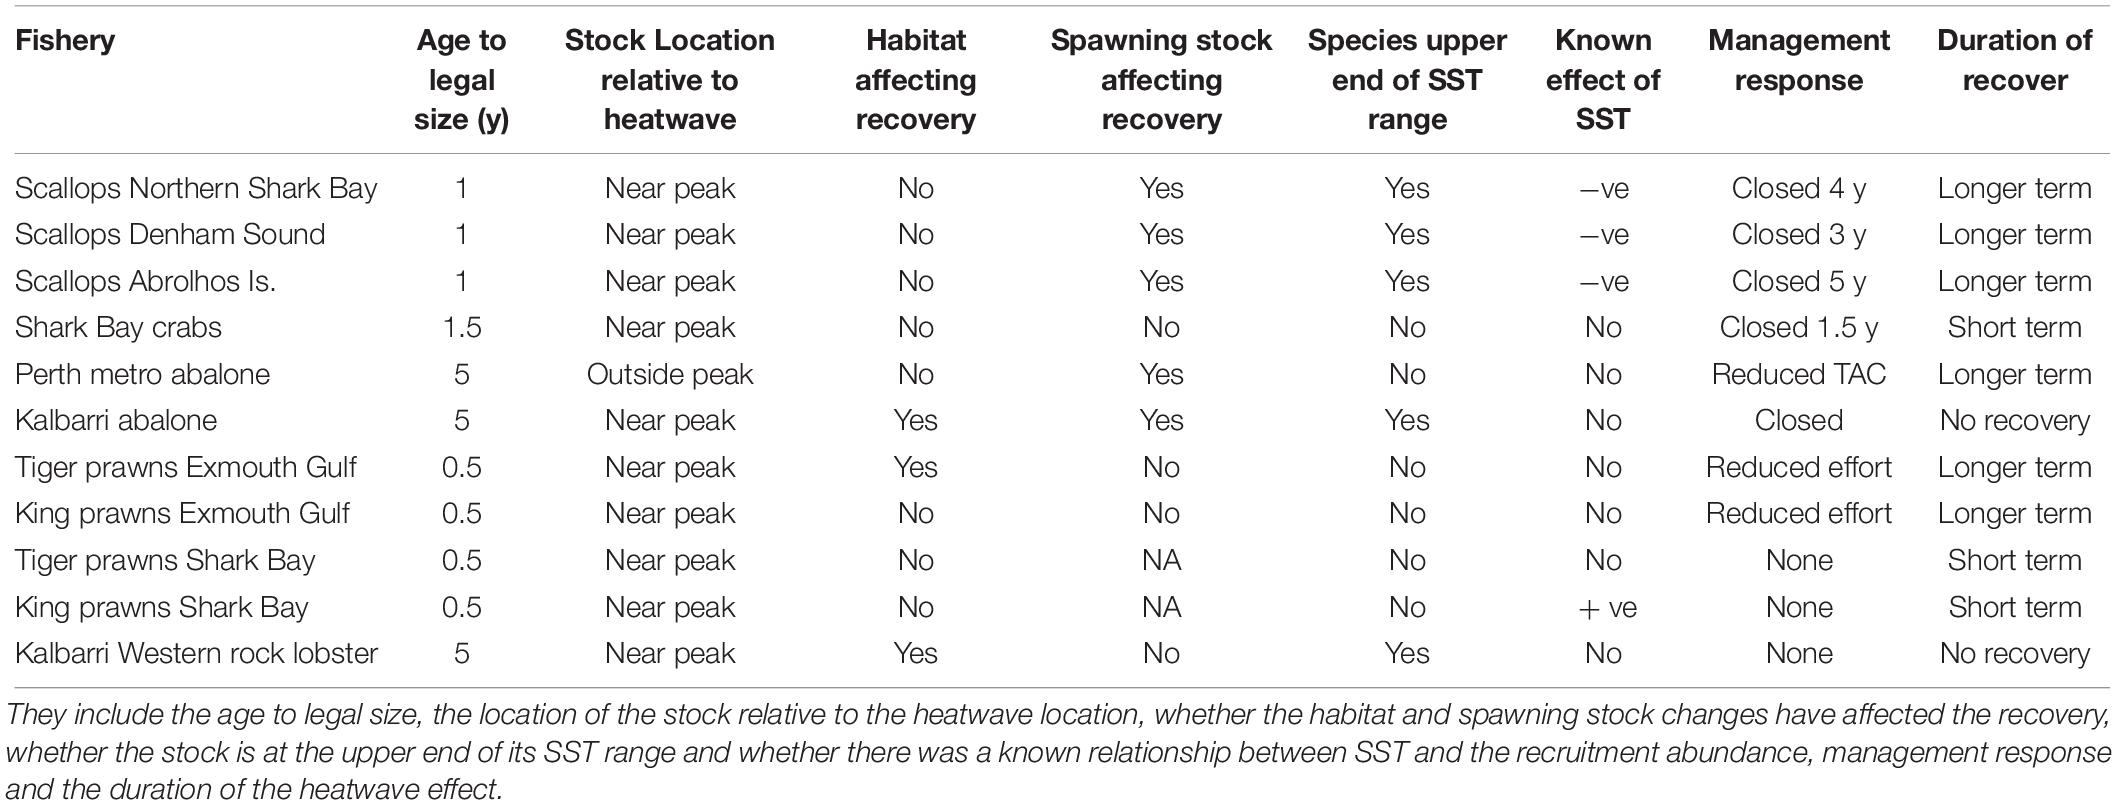
Table 2. The factors affecting the level of recovery from the heatwave for the invertebrate stocks are compared.
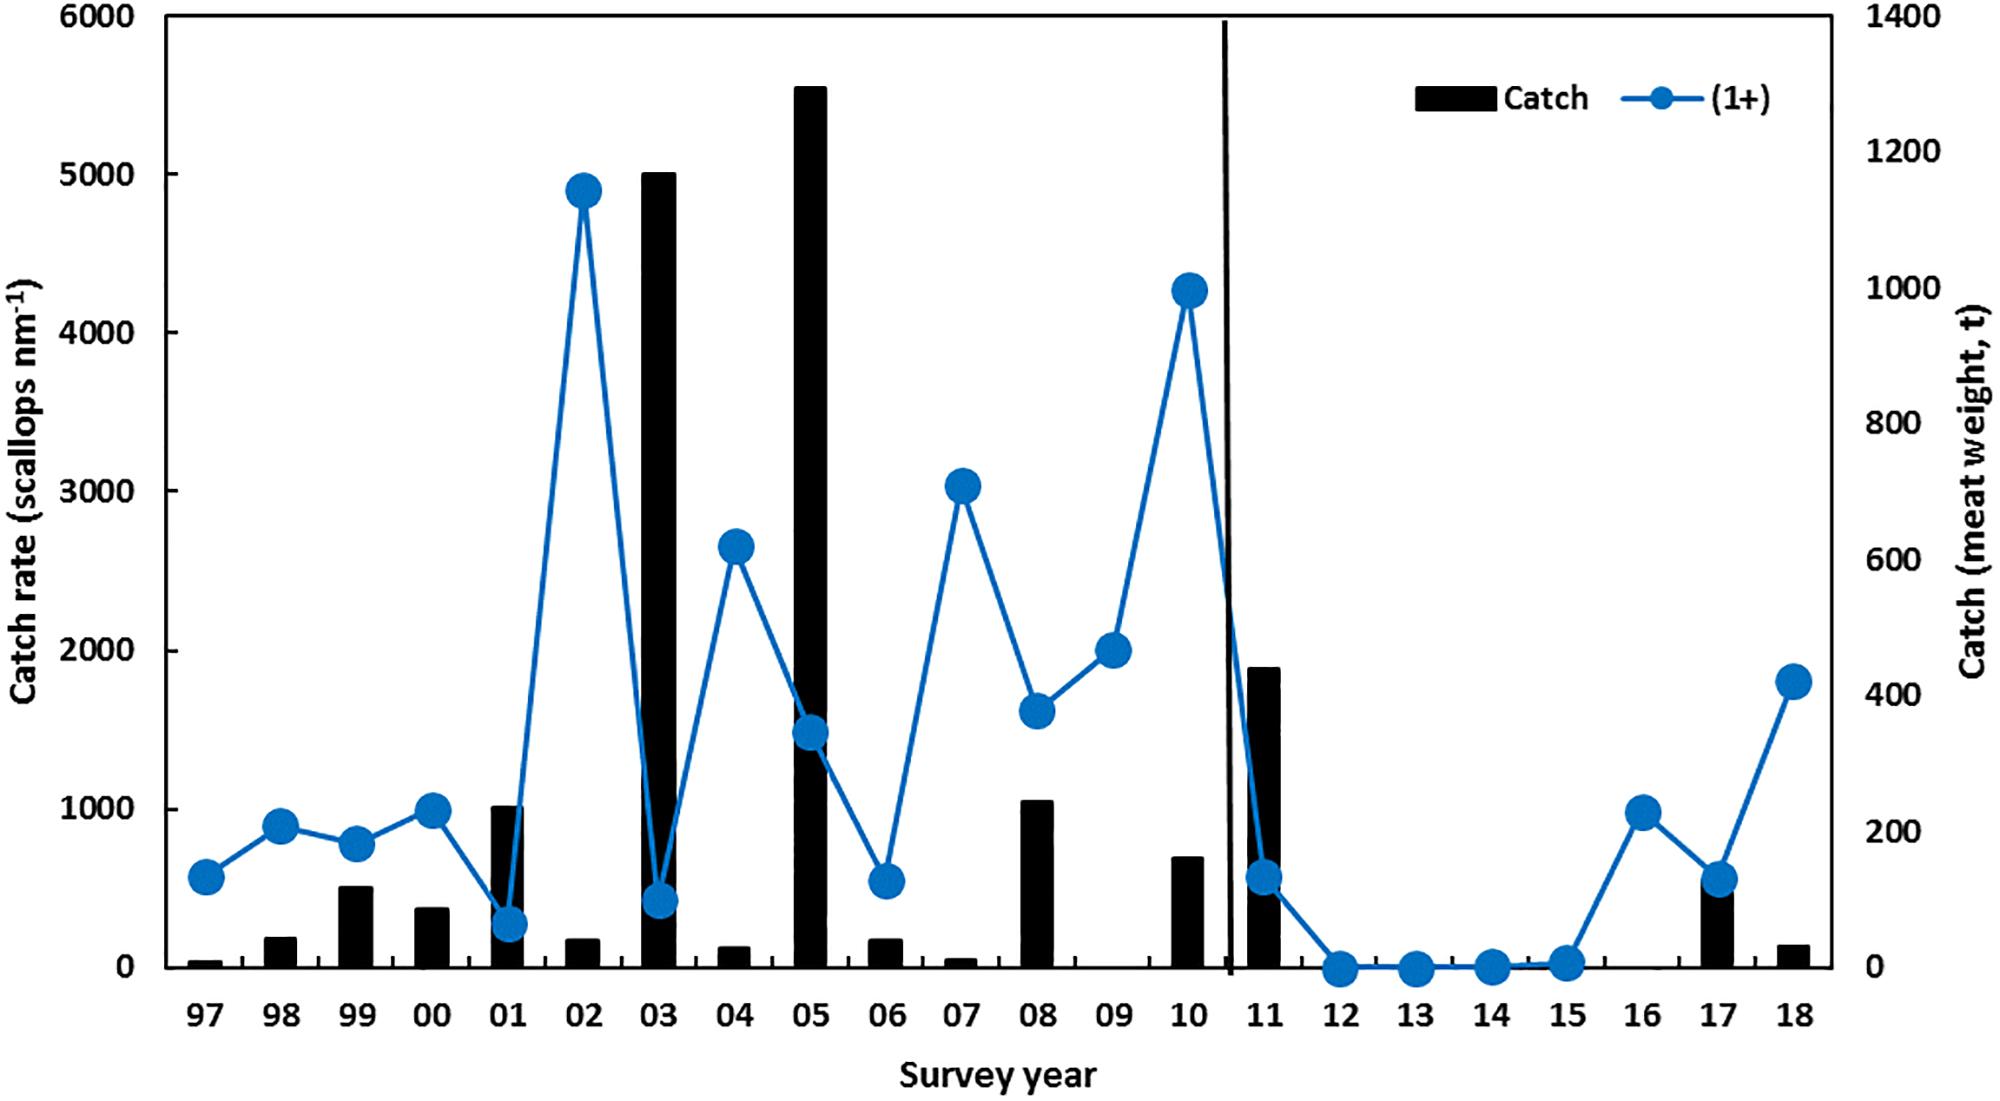
Figure 5. Scallop recruitment catch rate (mainly 1-year-olds) in November trawl survey and the catch (meat weight t, vertical bars) in the Abrolhos Is. The vertical line indicates the occurrence of the heatwave.
There have been previous periods of low scallop recruitment abundance in northern Shark Bay that were associated with periods of above-average SST such as the late 1980s and late 1990s (Joll and Caputi, 1995; Lenanton et al., 2009). However, the survey catch rate in these periods remained at 100’s of scallops per nautical mile and were an order of magnitude higher than the survey catch rates experienced after the heatwave that declined to two scallops per nautical mile in the 2013 survey (Figure 4A and Table 1).
The stock-recruitment-environment relationship showed that the spawning stock from 2012 to 2014 was in a declining trend so that the 0 + recruitment abundances in these years were influenced by historic-low spawning stock as well as above-average SST (Caputi et al., 2016). Environmental conditions improved in 2014 with cooler SSTs (Figure 2) resulting in an improved recruitment abundance, particularly in Denham Sound, and a modest total allowable catch (TAC) was put in place for the Shark Bay fishery in 2015 as the fishery was moved from effort controls to quota management. The improved spawning stock for 2015 combined with cooler SSTs during the 2014/2015 summer resulted in an improved recruit 0 + abundance in the November 2015 survey (Figure 4B). Both stocks in Shark Bay showed continued improvement in 2016, with the total abundance returning within the pre-heatwave historic range in northern Shark Bay and particularly in Denham Sound which achieved its second highest recruitment in 34 years (Figure 4 and Table 1). The Denham Sound stock is now assessed as recovered based on survey abundance. However, there are strong concerns about the productivity within northern Shark Bay with the 2018 scallop survey abundance again declining to very low levels (Figure 4A).
The Abrolhos Islands scallop stock had a more protracted downturn compared to Shark Bay that commenced with poor recruitment of the 1 + scallops in the November 2011 survey and low recruitment abundance continuing for 5 years (Figure 5) with the fishery being closed during 2012–2016. This low recruitment resulted from the negative effect of a series of warm SSTs (Caputi et al., 2016) and the subsequent decline in spawning stock to very low levels that also slowed the recovery. The stock declined to less than 1% of its pre-heatwave abundance (Table 1 and Figure 5). There was a marked improvement in the recruitment abundance in 2016 to 25% of the pre-heatwave abundance (Table 1 and Figure 5) as a result of summer water temperatures returning to average conditions in 2014–2016 (Figure 2A). The improved 2016 survey recruitment abundance enabled a modest level of fishing in 2017 with 125 t of meat weight landed in the Abrolhos Islands fishery (Figure 5) which has remained under effort controls. The 2017 survey showed the distribution of recovery was spread wider than in 2016 which was concentrated in southern part of the fishery.
Shark Bay Crabs
The blue swimmer crab (Portunus armatus) stock in Shark Bay was at record-low levels in late 2011 after the summer heatwave event with poor commercial trap catch rates and low fishery-independent trawl survey catch rates in November 2011 (Chandrapavan et al., in review) which showed that catch rates had declined to 2% of the pre-heatwave abundance (Table 1 and Figure 6). The fishery was closed for 18 months (April 2012 to October 2013) to protect the breeding stock and allow the stocks to recover. Additional trawl surveys were undertaken to monitor the status of the spawning stock and recruitment abundance to assess the stock recovery rate (Chandrapavan et al., 2018).
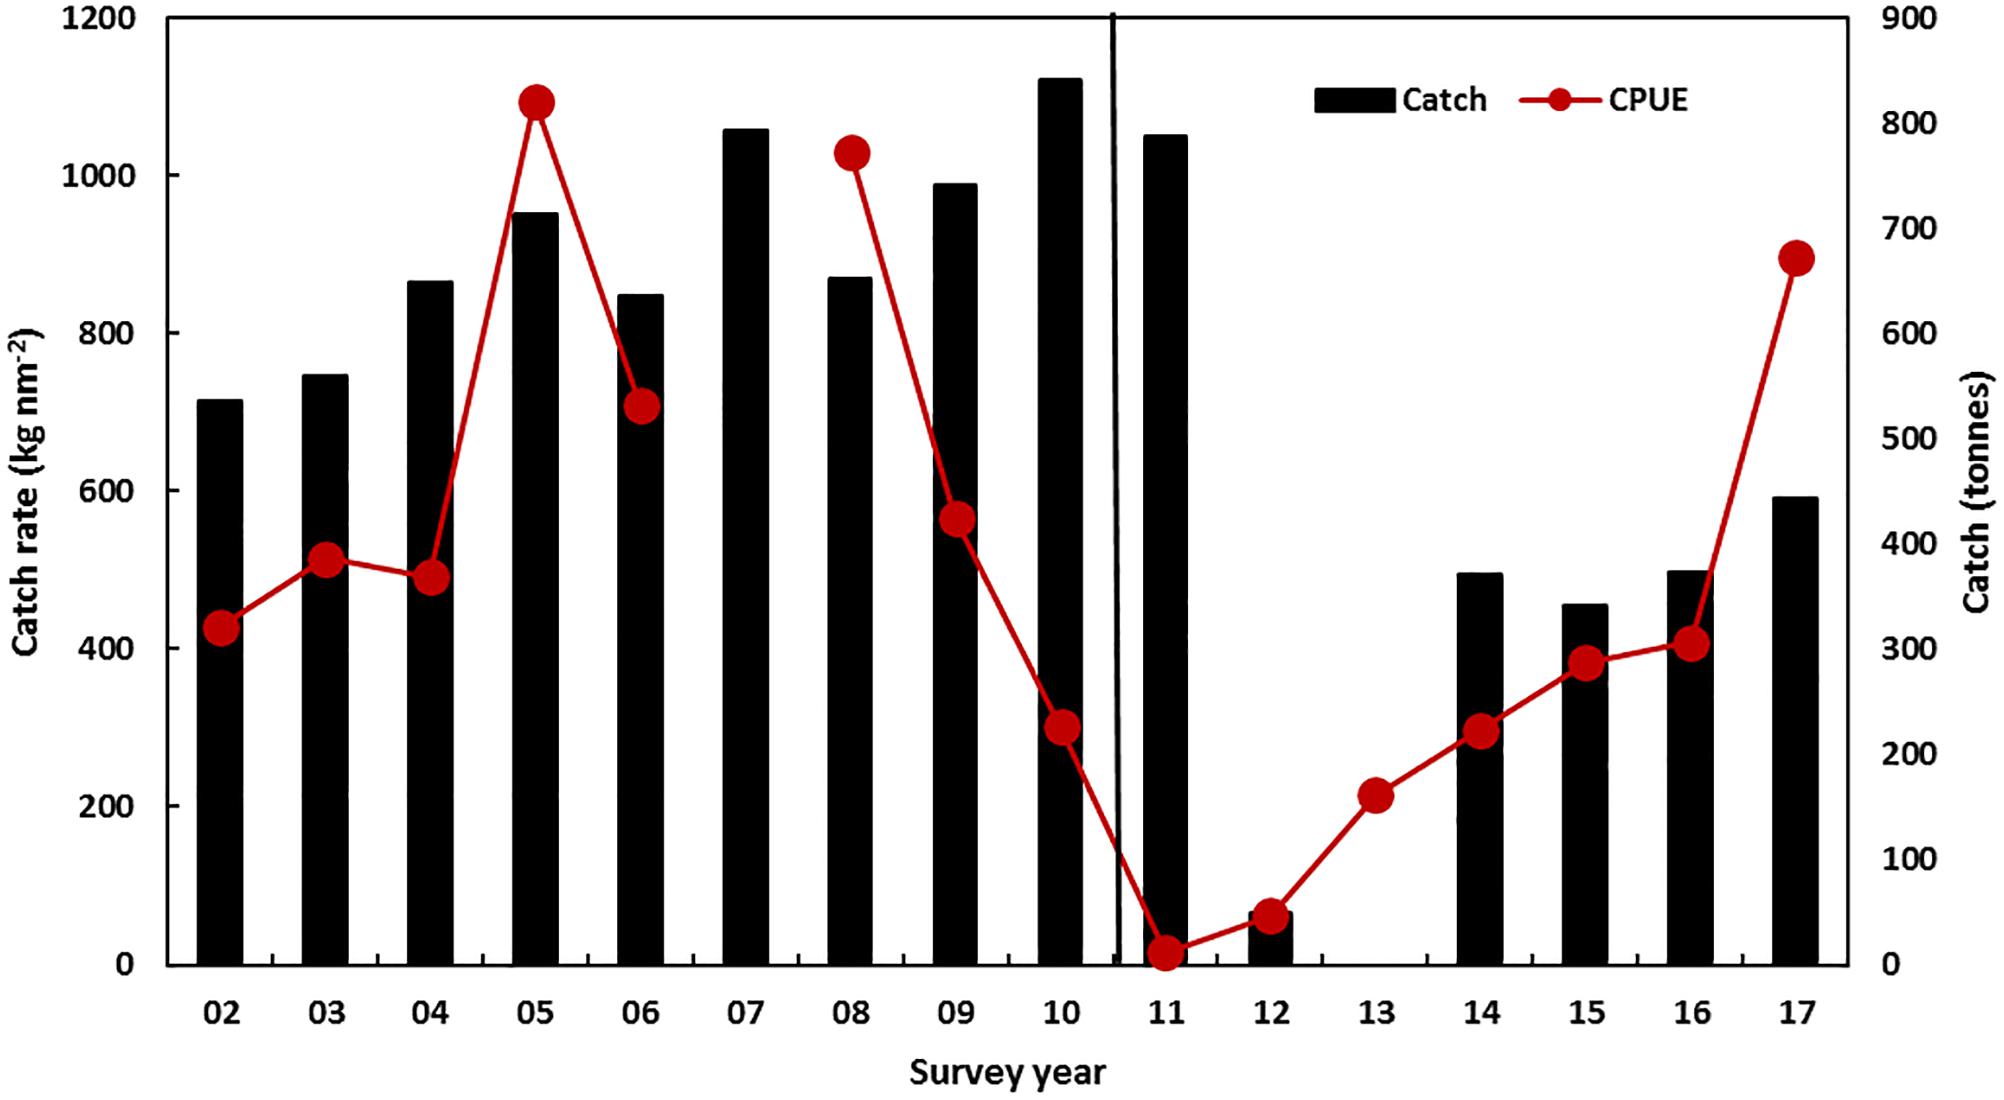
Figure 6. November trawl survey standardized mean catch rate of legal-size blue swimmer crabs and the catch (t, vertical bars) in Shark Bay. No survey information was collected in 2007. The vertical line indicates the occurrence of the heatwave.
Caputi et al. (2016) identified a significant correlation between legal-size commercial catch rate and the SST in the summer period during the juvenile phase (r = −0.76, p < 0.01). The catch rates of legal crabs (1 + cohort) during the November survey were also negatively correlated (r = −0.85, p < 0.01) with SSTs during the previous summer (December–January) (Chandrapavan et al., in review). These assessments indicated that the cause of the low abundance in 2011/2012 was mainly due to the heatwave in the summer of 2010/2011. While there was a reduction in the spawning stock in 2011 and 2012 to historic low levels, its effect on the recruitment is confounded by high summer SST in the same year. Fishery-independent surveys showed only a partial improvement in crab legal-size catch rate in 2013 (Figure 6) as the summer SST in 2011/2012 and 2012/2013 remained above-average, but lower than the peak in 2010/2011 (Figure 2). Therefore the fishery was opened in 2013/2014 with a nominal catch quota of 400 t that was much lower than the pre-heatwave catches of 700–800 t that were achieved with the fishery under effort controls with no TAC in place (Figure 6). Monitoring of the stock by fishery-independent surveys and commercial catch rates indicated a steady improvement over 2014–2017 in the crab stocks (Figure 6) and an increase in quota since the heatwave from 400 to 550 t for the 2017/2018 season with the fishery assessed as fully recovered with the legal-size abundance in 2017 being 21% higher than the pre-heatwave abundance (Table 1).
Perth Metropolitan Area and Mid-West Coast Roe’s Abalone
The first major impact of the heatwave on invertebrate stocks was the catastrophic mortality of over 99% of Roe’s abalone (Haliotis roei) in the mid-west region (Hart, 2014). This fish kill of Roe’s abalone as well as other fish stocks probably occurred due to a combination of record-high water temperatures and very calm conditions in late February/early March 2011 (Pearce et al., 2011) which may have resulted in deoxygenation of the water. This mid-west stock is at the northern end of its latitudinal range where SSTs are typically warmer than the other locations where the stock occurs. For example, the mid-west would be warmer than the lower west coast by about 1–2°C and south coast by 2–3°C. It was also near the area where the heatwave was most intense (Figure 1A). The high mortality has affected the spawning stock and made the natural recovery of this stock problematic with no evidence of any stock recovery (Table 2). Therefore restocking is being evaluated based on translocation and the release of hatchery-grown abalone (Strain et al., 2019).
In the Perth metropolitan Roe’s abalone fishery, which is south of the area where the heatwave peaked, major mortalities were not observed. However, there was a 30% drop in numbers of the sub-legal cohort growing into the legal-size class (Hart et al., 2018). The fishery has undergone a marked drop in commercial and recreational catches from 85 t in 2009 to 45 t in 2012 as a result of catch quota reductions to increase protection to the spawning stock. The Perth stock has also seen a reduction in 1 + juveniles to record-low levels during 2012–2016 to 21% of the pre-heatwave abundance from the annual dive survey (Figure 7 and Table 1). Record-low juvenile abundance was also observed within a marine protected area adjacent to the fishery (Figure 7) where no fishing occurred which indicated that environmental conditions were the primary cause of the low abundance after the heatwave. The spawning stock in this fishery has also moved to record-low levels since the heatwave and this may be contributing to the delay in the recovery of the juvenile abundance (Hart et al., 2018). There was an improvement in the 1 + juvenile abundance in 2017 (Figure 7) to 47% of the pre-heatwave abundance (Figure 7 and Table 1) which is probably due to the reduced SST in 2015 (Figure 2). The low juvenile abundances may maintain legal-size catch rates at relatively low levels in the subsequent years (2018–2020) as these 1 + juveniles take about 4 years to reach legal size. However, the abundance of legal-size abalone is also negatively related by the water temperature during the juvenile to legal-size phase of the life cycle (Hart et al., 2018). Therefore the legal-size abundance will benefit from the cooler temperatures since 2015.
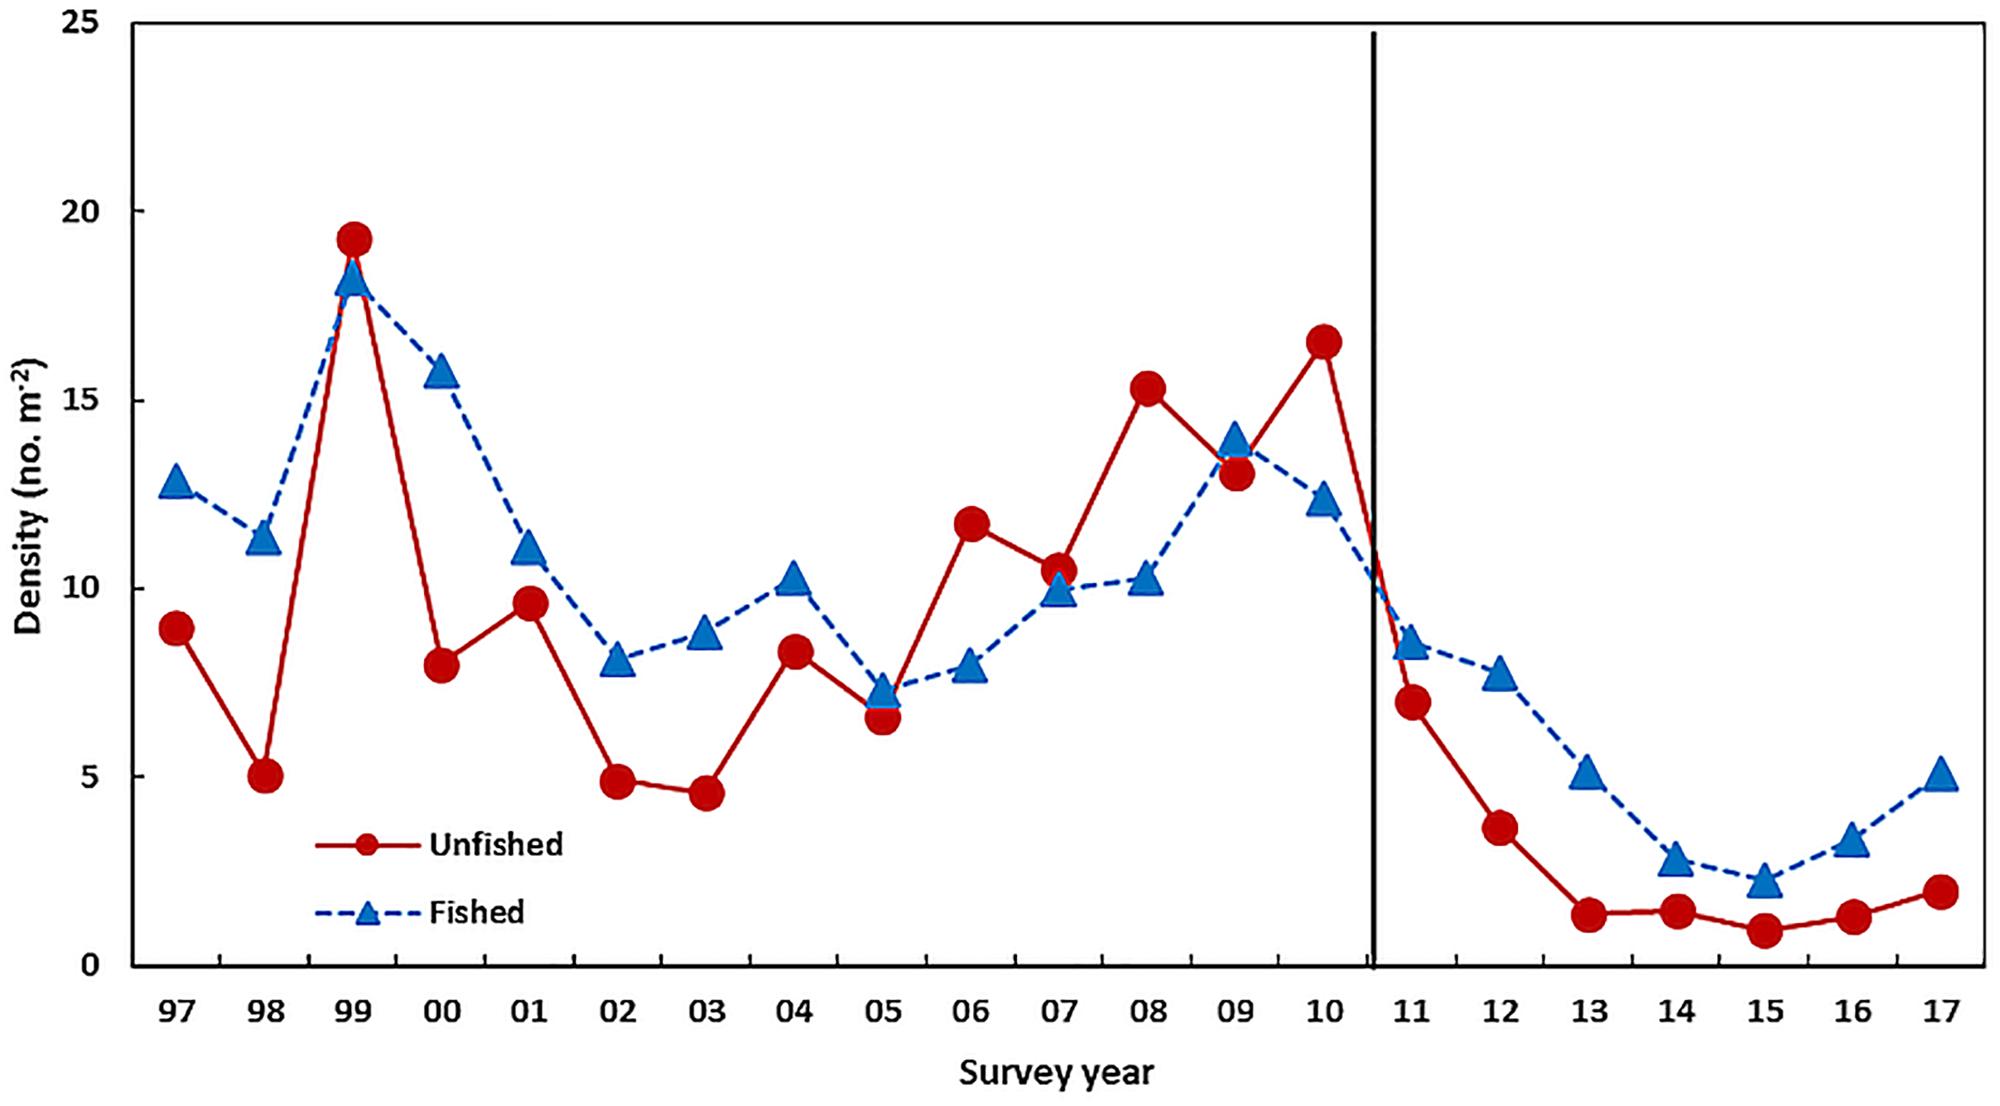
Figure 7. The 1 + juvenile abundance from the Perth Roei abalone fishery-independent dive survey conducted in March each year averaged over a number of fished locations and an unfished area. The vertical line indicates the occurrence of the heatwave.
Exmouth Gulf and Shark Bay Brown Tiger and Western King Prawns
The brown tiger prawns (Penaeus esculentus) in Exmouth Gulf had an above-average recruitment abundance in March–April 2011 following the heatwave peak in February 2011 so that there did not appear to be any direct impact of the heatwave on the stocks. However, in 2012 there was a record-low recruitment abundance to 39% of the pre-heatwave abundance (Figure 8 and Table 1) and this appeared to be due to the heatwave causing the loss of seagrass/algal habitat in the nursery areas (McMahon et al., 2017). There was a moderate improvement in the brown tiger prawn recruitment abundance between 2013 and 2015 with a return to above-average recruitment abundance in 2016 and 2017 (Figure 8). This reflected the previous experience in 2000/2001 when a severe category-5 cyclone in 1999 caused significant physical damage to inshore nursery habitats (Loneragan et al., 2013) (also a strong La Niña in 1999/2000). The brown tiger prawn recruitment abundance slowly recovered between 2002 and 2003 (Figure 8) as the habitats recovered.
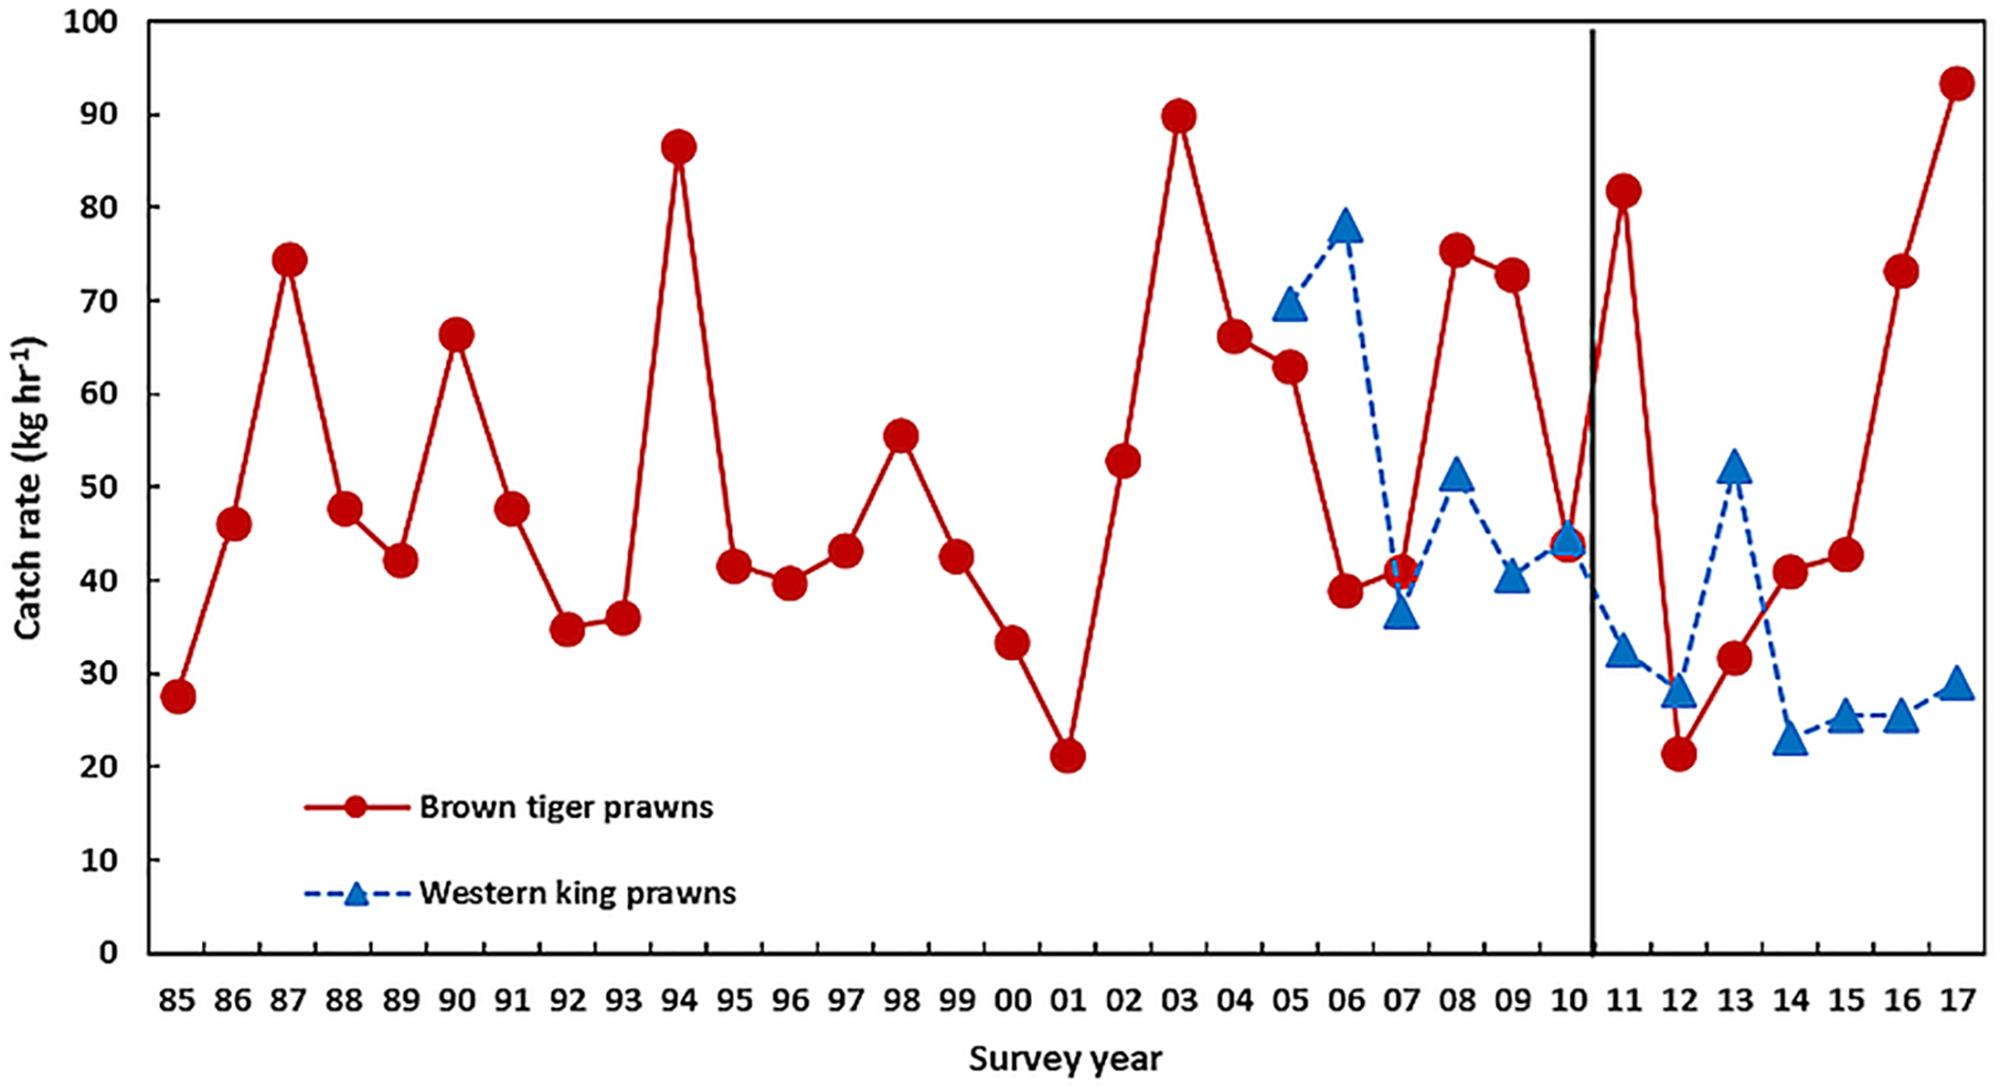
Figure 8. The recruitment abundance (0 +) of brown tiger prawns and western king prawns in Exmouth Gulf from trawl surveys in March–April each year. The vertical line indicates the occurrence of the heatwave.
Conversely, there was a low recruitment abundance of western king prawns (Penaeus latisulcatus) in the surveys of March–April 2011 in Exmouth Gulf suggesting that the heatwave had a direct effect on recruitment (Figure 8). Caputi et al. (2016) showed that water temperature in November-December, during the juvenile phase prior to recruitment to the fishery, was negatively correlated to western king prawn recruitment in Exmouth Gulf (r = −0.62, p < 0.05). The extended period of below-average recruitment during 2014–2016 to 46% of the pre-heatwave abundance (Table 1) reflected the above-average SST experienced over this period and a modest improvement in the 2017 recruitment reflected the cooler SST (Figures 2, 8).
In contrast to Exmouth Gulf, the western king prawn stock in Shark Bay achieved the highest recruitment abundance in 2011 after the heatwave at twice the average pre-heatwave abundance (Table 1 and Figure 9). This is reflected by the positive relationships between the recruitment of western king and also brown tiger prawns with SST during the larval/juvenile phase, November–April (r = 0.63, p = 0.02, and r = 0.83, p < 0.001, respectively, Caputi et al., 2016). Similar positive relationships were previously identified for western king prawn catches (Caputi et al., 1996; Lenanton et al., 2009). The recruitment for both species returned to historical levels during the years following the heatwave (Figure 9).
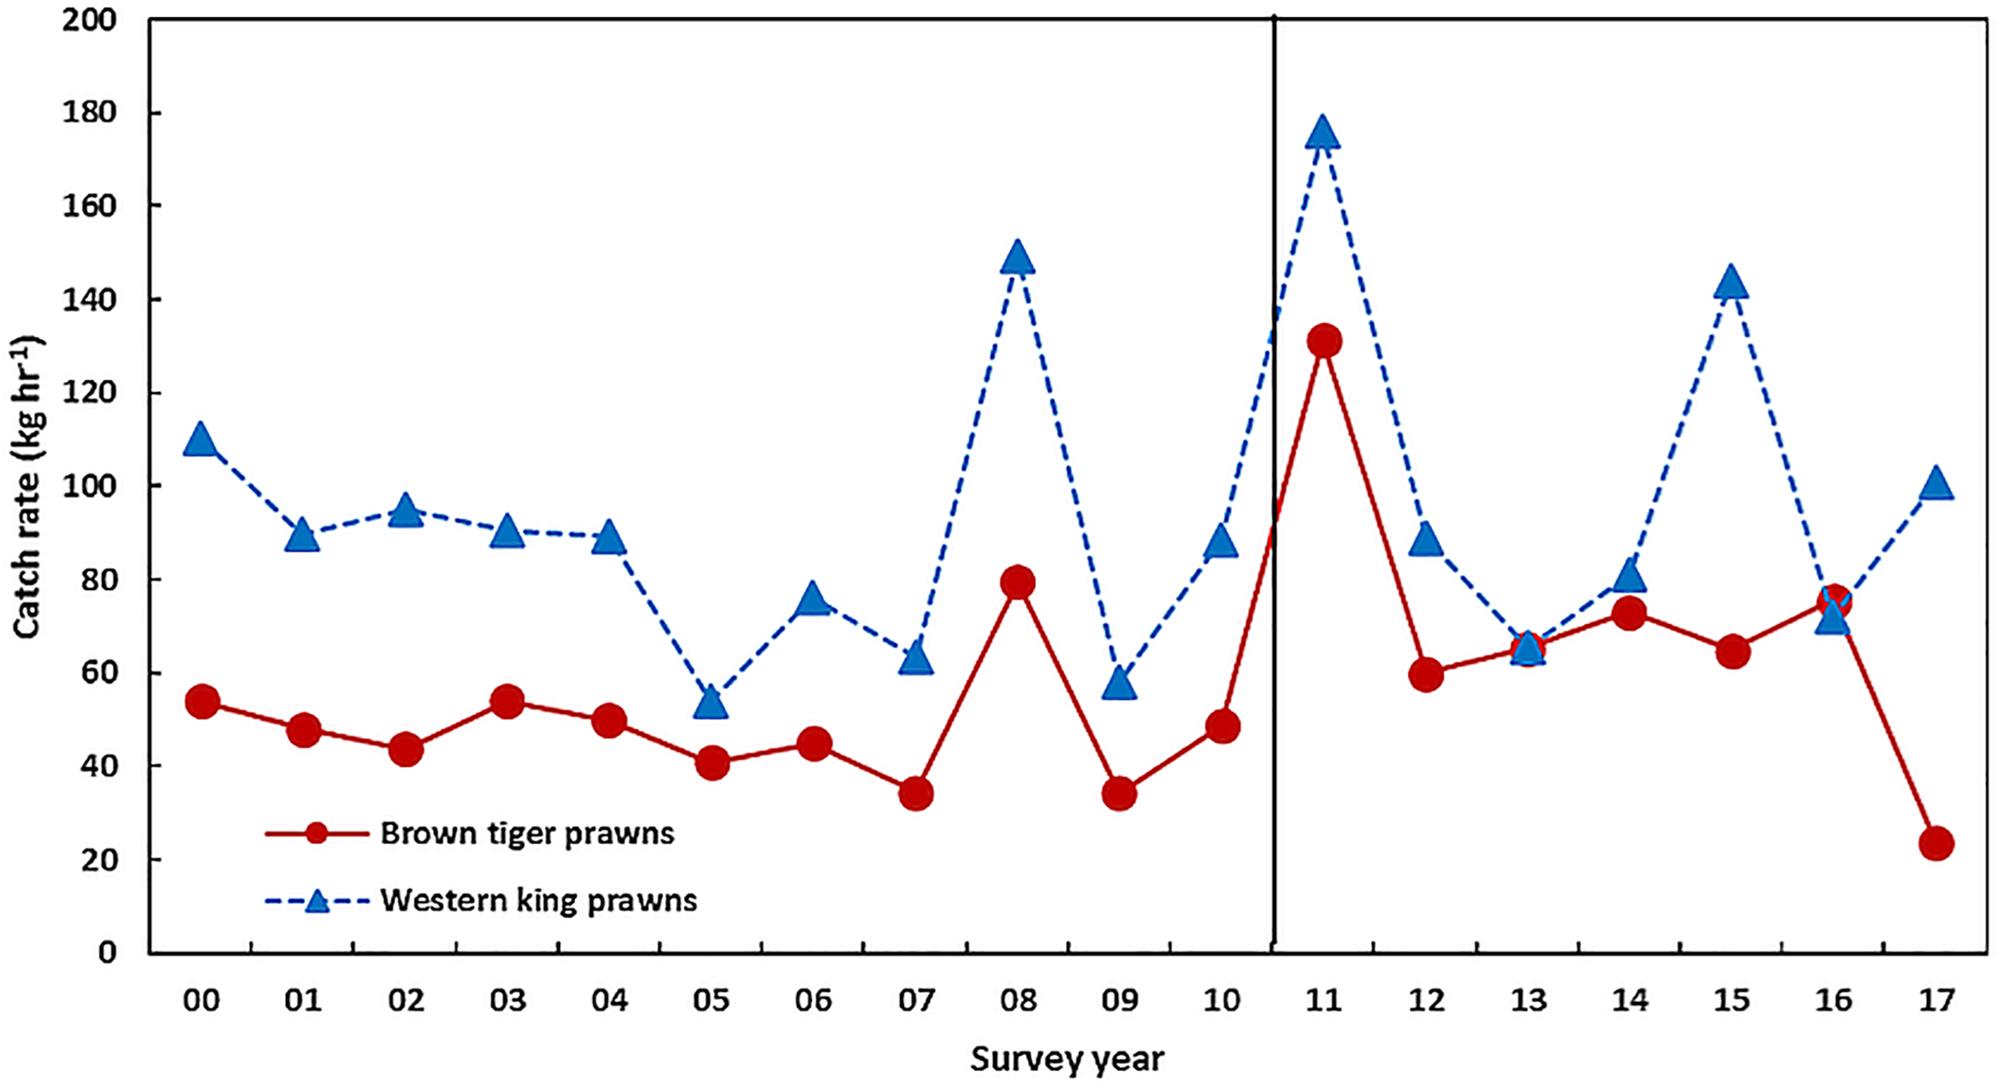
Figure 9. The recruitment abundance (0 +) of brown tiger prawns and western king prawns in Shark Bay from trawl surveys in March–April each year. The vertical line indicates the occurrence of the heatwave.
Caputi et al. (2016) noted that SST in Shark Bay is generally about 2–3°C cooler than Exmouth Gulf. A comparison of the western king prawn recruitment abundance with SST during November–December in Shark Bay and Exmouth Gulf indicated that the 2011 heatwave resulted in SST in Shark Bay reaching 24.5°C which resulted in the record-high recruitment abundance (Figure 10). In Exmouth Gulf good recruitment abundances have historically been achieved when the SST was 23.5–24.5°C in November–December, however, the heatwave resulted in SST reaching 27°C resulting in below-average recruitment (Figure 10). This indicated that the increase in SST during the 2011 heatwave in Shark Bay boosted the SST in November–December to an optimal range of about 23.5–24.5°C for the western king prawn. However, the increase in SST associated with the heatwave in Exmouth Gulf resulted in the SST moving well above the optimal range and hence a reduced recruitment abundance.
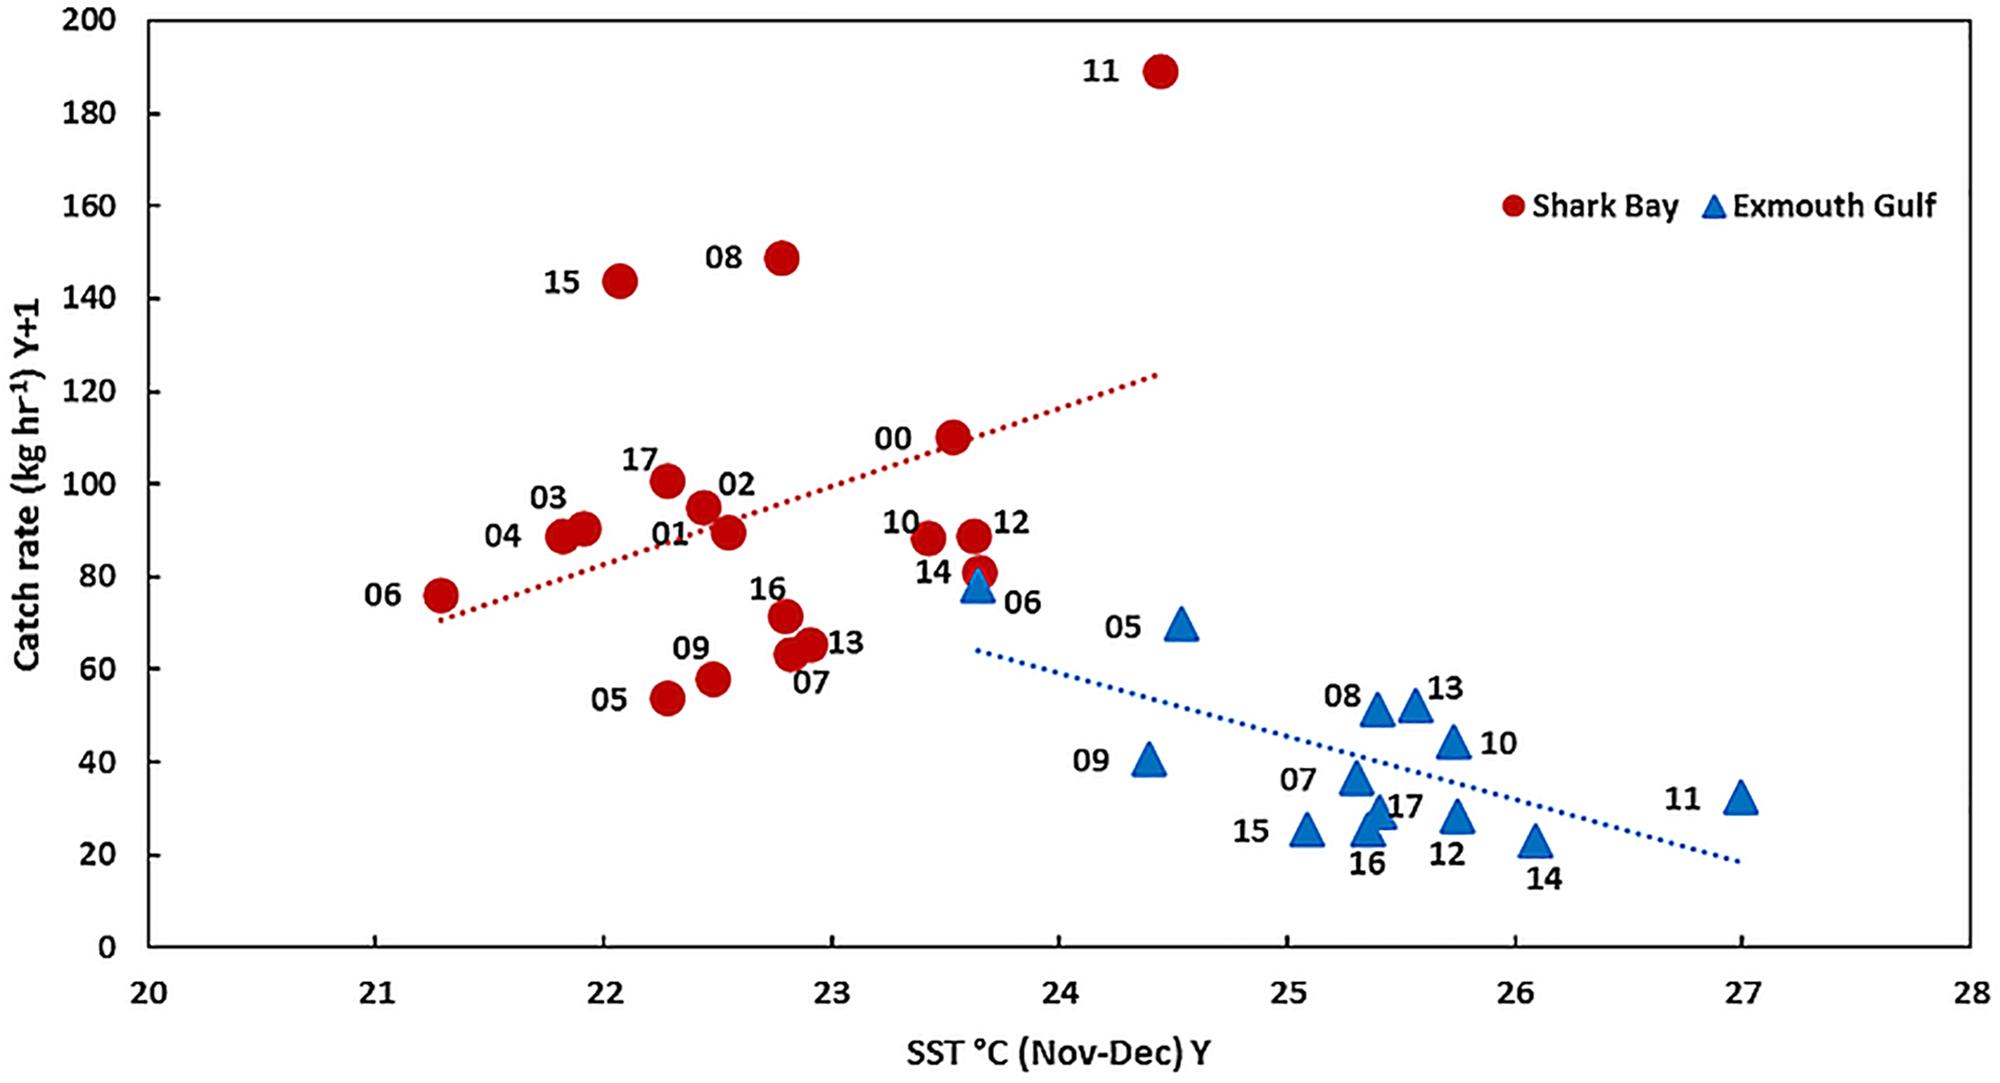
Figure 10. The relationship between western king prawn recruitment abundance in March–April (year Y + 1) and SST during November–December in the previous year (Y) in Shark Bay and Exmouth Gulf. The recruitment year is shown.
Western Rock Lobster
The western rock lobster (Panulirus cygnus) fishery operates on the lower west coast of WA and Kalbarri in the mid-west represents the northern part of the commercial fishery (Figure 3). The stock assessment of this valuable fishery ($400 million) is supported by a long-term monitoring program that examines the stock abundance trend throughout its life cycle including the puerulus (post-larval) stage, undersize, legal size and spawning stock. The northern part of the stock in the Kalbarri region overlapped with the center of the heatwave event.
The puerulus settlement provides a reliable indicator of recruitment to the fishery 3–4 years later (de Lestang et al., 2009). The settlement was below average for an extended period (2006/2007 to 2012/2013) throughout the fishery with the lowest recorded settlement occurring in 2008/2009, well before the heatwave event 2 years later and de Lestang et al. (2014) has assessed the factors contributing to this low settlement period. This low settlement resulted in a decline in undersize abundance during 2011 and 2012 (Figure 11). However, the abundance of undersize rock lobsters in Kalbarri has remained well below what would have been expected based on the puerulus settlement (Figure 11A). The abundance post heatwave in Kalbarri has been at 5–16% of the abundance prior to the heatwave and at about 14% of the predicted abundance based on the puerulus settlement (Table 1 and Figure 11A). This indicated that the survival and growth of the juvenile lobsters may have been affected by the changes in the habitat and prey availability (Smale et al., 2017) so that rock lobsters may have been indirectly affected by the heatwave with no sign of recovery evident after 7 years. The trend in undersize abundance for Jurien, which is south of the peak heatwave area, showed that there was a decline in the undersize abundance during 2011 and 2012 as a result of very low settlement in 2008/2009 (Figure 11B). However, the undersize abundance has recovered and is similar to what was expected from the puerulus settlement after the heatwave.
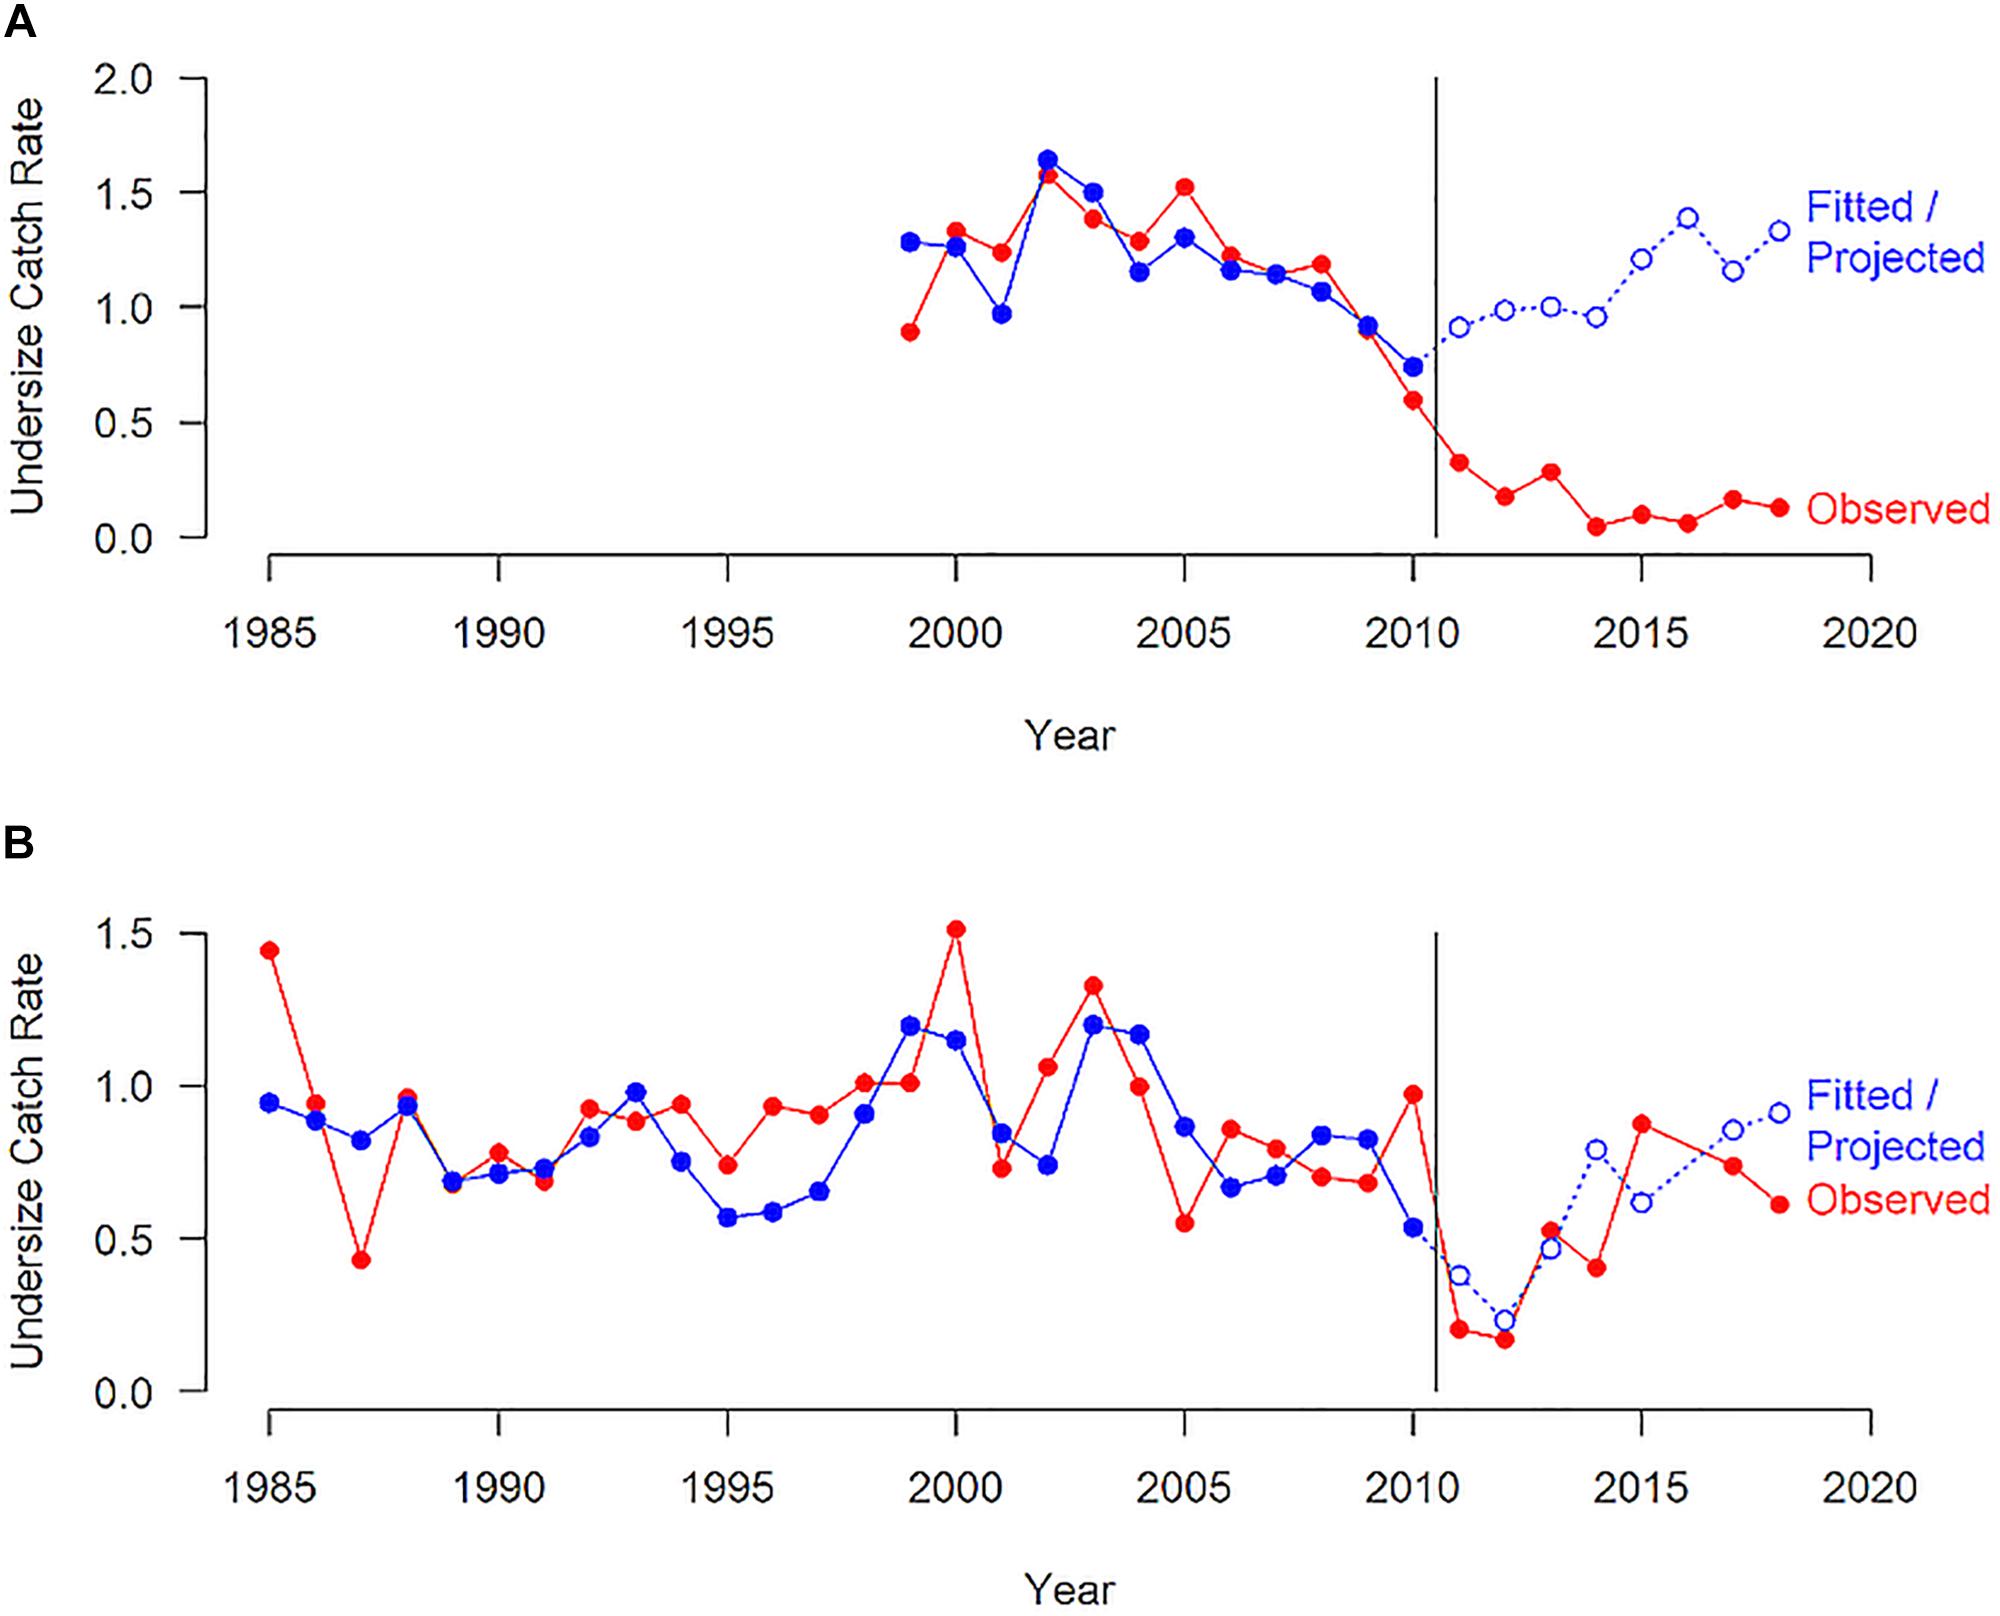
Figure 11. The observed undersize catch rate from a commercial monitoring (number per pot lift) for western rock lobsters in the (A) Kalbarri and (B) Jurien region and the fitted undersize catch rate based on the relationship between undersize and puerulus settlement 3-4 years for the period prior to the heatwave and the projected undersize catch rates post heatwave. The vertical line indicates the occurrence of the heatwave.
Discussion
Marine heatwaves have received increased attention in recent years (Hobday et al., 2016a) and under the present warming trend influenced by anthropogenic forcing, these extreme events are expected to become more common (Oliver et al., 2017, 2018). Two features of many of these marine heatwave events are firstly the negative effect on the habitat structures (Wernberg et al., 2013; Johnson and Holbrook, 2014) with 58% loss of the main seagrass species in Shark Bay (Thomson et al., 2015) and approx. 1,000 km2 lost or severely impacted (Arias-Ortiz et al., 2018) from a total of 4,000 km2 of seagrasses. Secondly there is generally the negative impact on sessile or slow moving invertebrates (Garrabou et al., 2009; Mills et al., 2013; Di Lorenzo and Mantua, 2016; Oliver et al., 2017; Smale et al., 2019). These features have also been prominent in the extreme 2011 Western Australian heatwave. Therefore, it was important to examine the rate of recovery of the invertebrate stocks affected and the reasons this varied between stocks. While there have been numerous studies on the marine heatwave impact on the marine ecosystem, there have been few studies of their overall effect on the commercial fisheries stocks. Fisheries provide an opportunity to assess the effect of an extreme event on interacting social-ecological systems (Pershing et al., 2015; Cavole et al., 2016). As many fish stocks are monitored annually, they provide a good indicator on the relative effect of the heatwave compared to the historic variations experienced under typical environmental variability.
The effect of the marine heatwave on the ecosystem produced some short-term changes (fish kills, extension of tropical fish distributions), as well as some longer-term changes such as loss of kelp forests in mid-west (Wernberg et al., 2016), loss of seagrass stocks in Shark Bay (Arias-Ortiz et al., 2018), loss of macro-invertebrates in Kalbarri (Smale et al., 2017) and the presence of rabbit fish in Cockburn Sound (Lenanton et al., 2017). As parts of the coastal ecosystem appear to have not recovered after 7 years and may have undergone a “permanent” change, the question remained as to whether some of the commercial invertebrate stocks negatively affected by the heatwave would ever recover to pre-heatwave levels given the very low abundance observed for some stocks in the years after the heatwave. The duration of the effect of the heatwave on the invertebrate stocks and the factors contributing to recovery periods have been summarized in Tables 1, 2, respectively. This information provided a basis for assessing the different vulnerabilities of commercial invertebrate species to future heatwaves.
Short-Term Effects
There was an immediate short-term effect of localized fish kills of a number of fish and invertebrate species at the time of the peak heatwave (Pearce et al., 2011) that did not have a major effect on the stocks. The warmer temperatures appeared to have a short-term beneficial effect for the recruitment of the two short-lived prawn species in Shark Bay (Figure 9). The western king prawn stocks in Shark Bay, as well as the brown tiger prawn stocks, produced record-high recruitment in surveys after the heatwave.
Blue swimmer crabs occur over a wide latitudinal range (20–35°S) along the WA coastline. A short-term moderate increase in catches was observed on the south coast of WA after the heatwave which typically only occur for about 2 years after any period of above-average water temperatures (Chandrapavan et al., 2018). The cooler waters of this region represent the southern end of the crab’s distribution. The blue swimmer crab fishery in Shark Bay (25–26°S) in the late 2000s had the highest catch of any crab fishery in Australia and therefore appeared to be situated in an ideal environmental location. However, this crab stock was negatively affected by the heatwave which resulted in poor recruitment and a fishery closure for 18 months. The recovery of the Shark Bay crab stock was relatively fast as the spawning stock did not appear to have been affected to the point that it inhibited the recovery of the stock. The fishery re-opened in late 2013 based on a weight-of-evidence approach to the assessment of the stock that included the survey catch rate of legal-size crabs being above the limit reference point in the draft harvest strategy. The stock was considered recovered in 2017 as the survey catch rate was within the target reference range.
Longer-Term Effects
The period for the recovery of the scallop stocks was longer (3–5 years) than for Shark Bay crabs, even though both species have relatively short life cycles of 2–3 years. Scallops in Shark Bay (25–26°S) and Abrolhos Islands (28–29°S) have historically been documented as having a strong negative response to above-average SST (Joll and Caputi, 1995; Lenanton et al., 2009) and these stocks occurred within the peak heatwave area. Therefore, it was expected that they would undergo a major decline in recruitment abundance (Figures 4, 5). The series of low recruitment abundances resulted in the spawning stock being affected to the point that it impaired recruitment and this increased the time for recovery. The fisheries were closed for 3–5 years and the Denham Sound and Abrolhos Islands stocks are now assessed as recovered as the survey catch rates are above the proposed threshold reference levels and hence within the target area of the draft harvest strategy. Since reopening, the commercial catch from these stocks were commensurate to the pre-recruit survey abundance. However, the northern Shark Bay catch was well below expectation which indicates that this part of the fishery is not fully recovered at this stage. Scallop fisheries are widely known for their high variability in recruitment abundance with environmental factors often identified as influencing recruitment abundance (Hancock, 1973; Joll and Caputi, 1995). The scallop stocks on the east coast of Australia have recently shown a major downturn with near record-low catches in 2014 and 2015 and a spawning biomass as low as 5–6% of the unfished level (Kangas and Zeller, 2018). Environmental influences have been assessed as affecting this stock including water temperature. Management measures have been implemented to assist in recovery of the east coast stock but no recovery is evident to date.
The Roe’s abalone stock in the Perth metropolitan area (32°S) is centrally located within its spatial distribution range (27–35°S) and was the only stock outside the peak area of the warming event that experienced a marked negative effect. The stock is undergoing a relatively slow recovery as its spawning stock declined to record-low levels (Hart et al., 2018). The has undergone a major downturn for over 6 years, and while a complete closure of the fishery may have resulted in a faster recovery time, it was assessed that the stock could recover while operating at lower catch levels during this period of lower abundance. The juvenile 1 + recruitment improved in 2017 which provided an important indicator that the recovery of the stocks was underway. However, the recovery of the legal-size abundance may take longer as it is dependent on the juvenile abundance 4 years previously and the environmental conditions during the juvenile to legal-size phase. Declines in abalone stocks are common around the world as they are vulnerable to overfishing but stocks in Australia have generally fared better because of the management systems such as individual transferable quotas (ITQ) and responsive harvest strategies (Mayfield et al., 2012).
Although the heatwave did not directly impact brown tiger prawns in Exmouth Gulf this stock took about 4 years to recover from lower recruitment levels as it was dependent on the rate of recovery of the inshore nursery habitat. This was similar to the previous experience of habitat destruction due to a cyclone in 1999 (Loneragan et al., 2013). There was, however, no indication of the indirect effect on the habitat for western king prawns as the two species have different habitat preferences with juvenile western king prawns preferring a sandy/muddy habitat (Penn, 1984; Kangas and Jackson, 1998).
No Recovery
The Roe’s abalone stock in Kalbarri (27°40′S) is near the northern edge of its spatial distribution range in WA and located near the center of the warming event which peaked over 24–31°S (Figure 1) and hence suffered over 99% mortality. The stock may prove to be an example of a “permanent change” as there appears no sign of recovery after 7 years. The natural abundance remains at very low levels and monitoring of the research translocation and restocking of juvenile abalone will continue to assess whether this is a viable approach to aid in the recovery. The effect on the abalone stocks reflected that observed by Smale et al. (2017) who demonstrated that the marine heatwave significantly altered the composition of the benthic macro-invertebrate assemblage on subtidal reefs in southwest Australia with the magnitude of the impact inversely related to latitude, i.e., the warmest locations were the hardest hit. The western rock lobster stocks in Kalbarri are also in the northern part of the commercial fishery and their undersize abundance also showed no signs of recovery.
Plagányi et al. (2011) highlighted the importance of an adaptive management response that permits rapid response to short-term changes. Hobday et al. (2016b) demonstrated the value of seasonal climate forecasts that provided some insights into upcoming environmental conditions and improved decision making. They also noted that the effective use of these forecasts required responsive management with strategies that can be implemented on the basis of the forecasts. Similarly, Mills et al. (2017) developed a forecast system of the start of the period of high landings for the Maine lobster fishery. This was in response to disruption caused to fishery by the early onset of lobster landings, and subsequent price collapse, due to the effect the 2012 marine heatwave.
The early detection of the heatwave event in WA and the monitoring of the immediate effects on the ecosystem as well as a qualitative assessment of the likely impacts on the fisheries stocks (Pearce et al., 2011) provided the basis for early management intervention. This highlighted the value of integrated monitoring framework like that developed in Australia through the Integrated Marine Observing System (IMOS)1, to enable early detection of climate extreme events, particularly marine heatwaves. A key factor to enable fisheries to recover quickly after extreme events was the early detection of the effect of the heatwave on invertebrate stocks. This was achieved from pre-recruit surveys that are conducted annually on the key prawn, scallop, abalone, crab and western rock lobster stocks in WA that are reliable indicators of the future recruitment to the fishery and catches (Caputi et al., 2014). These proved valuable in the early detection of the effect of the heatwave on the stocks (Caputi et al., 2016) which enabled early management intervention based on harvest strategies that were responsive to changes in abundance (Department of Fisheries, 2015). The surveys have also been valuable in the early detection of the recovery that has allowed fishing to recommence as soon as the recovery was evident with catches increasing as the stocks moved to full recovery. This was particularly important for the fisheries that had been shut for 1.5 to 5 years. The lessons learnt here have wide application to other fisheries in other regions affected by extreme events and highlighted the valuable role fisheries monitoring and stock assessments and environmental monitoring can play in understanding the effect of extreme events on ecosystems. In particular, they highlight the importance of adopting fishery-independent surveys of pre-recruit abundance of stocks to enable pro-active management response on changes in stock abundance as a result of climate change related extreme events.
Globally, 87% of currently occurring marine heatwaves can be attributed to global warming primarily driven by anthropogenic emissions of greenhouse gasses (Frölicher et al., 2018). Moreover, it is expected that with the continuing warming of the global ocean, the marine heatwave events will occur more often and be more intense under the future warm climate. Global model projections show that the current carbon emissions will result in an average increase in the probability of extreme marine heatwaves in the global ocean by a factor of 3 by the mid-century (Frölicher et al., 2018), which may significantly reduce the recovery time for the marine species after the impacts of a strong marine heatwave.
The 2011 WA marine heatwave was associated with a strong La Niña event in the Pacific (Feng et al., 2013). Future climate projections suggest that extreme La Niña events may become more frequent under a warm climate (Cai et al., 2015). Thus, there may be increased likelihood of occurrences of extreme marine heatwaves off WA compared to the global average. In addition, occurrences of the marine heatwaves off the WA coast can also be triggered or amplified by the local air-sea coupling (Kataoka et al., 2014; Marshall et al., 2015). Future expansion of the tropical warm pool along the WA coast may induce deep convection and enhance the air-sea coupling in the region (Doi et al., 2015). Holbrook et al. (2019) identified important local processes and large scale climate modes that are associated with marine heatwave occurrences in their assessment of 22 case-study regions. Improved oceanographic monitoring and high resolution ocean-atmosphere coupled models are needed to capture the regional processes, to properly assess the marine heatwave risks off the WA coast, as these risks may be graver than the current climate model predictions.
Data Availability
The datasets for this manuscript are not publicly available because of confidentiality restrictions under the Fisheries Act. Requests to access the datasets should be directed to the corresponding author.
Author Contributions
NC wrote the first draft of the manuscript. All authors wrote the sections of the manuscript, contributed to the manuscript revision, and read and approved the submitted version. MK, AC, AH, MF, MM, and SdL contributed to the figures.
Funding
This study was supported by the Fisheries Research and Development Corporation. This study was also partly supported by the CSIRO-Chinese Academy of Sciences collaboration fund on marine science and blue economy.
Conflict of Interest Statement
The authors declare that the research was conducted in the absence of any commercial or financial relationships that could be construed as a potential conflict of interest.
Acknowledgments
The authors would like to thank the Fisheries Research and Development Corporation for their financial support for this study. The authors acknowledge: European Centre for Medium-Range Weather Forecast (ECMWF) interim products; Optimal Interpolation OIv2 SST data were obtained from the NOAA/OAR/ESRL PSD, Boulder, CA, United States, from their web site at http://www.esrl.noaa.gov/psd/; internal reviewers at the Department of Primary Industries and Regional Development (WA), Dr. Gary Jackson, Dr. Rod Lenanton, Dr. Brett Molony, Dr. Brent Wise, and Patrick Cavalli; external reviewers; and Jenny Moore for assistance with the literature search, figures, and editing.
Footnotes
References
Arias-Ortiz, A., Serrano, O., Masqué, P., Lavery, P. S., Mueller, U., Kendrick, G. A., et al. (2018). A marine heatwave drives massive losses from the world’s largest seagrass carbon stocks. Nat. Clim. Change 8, 338–344. doi: 10.1038/s41558-018-0096-y
Benthuysen, J., Feng, M., and Zhong, L. (2014). Spatial patterns of warming off Western Australia during the 2011 Ningaloo Niño: quantifying impacts of remote and local forcing. Cont. Shelf Res. 91, 232–246. doi: 10.1016/j.csr.2014.09.014
Benthuysen, J. A., Oliver, E. C. J., Feng, M., and Marshall, A. G. (2018). Extreme marine warming across tropical Australia during austral summer 2015–2016. J. Geophys. Res. Oceans 123, 1301–1326. doi: 10.1002/2017JC013326
Bond, N. A., Cronin, M. F., Freeland, H., and Mantua, N. (2015). Causes and impacts of the 2014 warm anomaly in the NE Pacific. Geophys. Res. Lett. 42, 3414–3420. doi: 10.1002/2015GL063306
Cai, W., Wang, G., Santoso, A., McPhaden, M. J., Wu, L., Jin, F. F., et al. (2015). Increased frequency of extreme La Niña events under greenhouse warming. Nat. Clim. Change 5, 132–134.
Caputi, N., de Lestang, S., Hart, A., Kangas, M., Johnston, D., and Penn, J. (2014). Catch predictions in stock assessment and management of invertebrate fisheries using pre-recruit abundance; case studies from Western Australia. Rev. Fish. Sci. 22, 36–54. doi: 10.1080/10641262.2013.832144
Caputi, N., Feng, M., Pearce, A., Benthuysen, J., Denham, A., Hetzel, Y., et al. (2015). Management Implications of Climate Change Effect on Fisheries in Western Australia: Part 1 Environmental Change and Risk Assessment. FRDC Project 2010/535. Fisheries Research Report 260. Western Australia, WA: Department of Fisheries, 180.
Caputi, N., Fletcher, W. J., Pearce, A., and Chubb, C. F. (1996). Effect of the Leeuwin Current on the recruitment of fish and invertebrates along the Western Australian coast. Mar. Freshw. Res. 47, 147–155.
Caputi, N., Kangas, M., Denham, A., Feng, M., Pearce, A., Hetzel, Y., et al. (2016). Management adaptation of invertebrate fisheries to an extreme marine heat wave event at a global warming hotspot. Ecol. Evol. 6, 3583–3593. doi: 10.1002/ece3.2137
Cavole, L. M., Demko, A. M., Diner, R. E., Giddings, A., Koester, I., Pagniello, C. M. L. S., et al. (2016). Biological impacts of the 2013–2015 warm-water anomaly in the Northeast Pacific: winners, losers, and the future. Oceanography 29, 273–285.
Cerrano, C., Bavestrello, G., Bianchi, C. N., Cattaneo-vietti, R., Bava, S., Morganti, C., et al. (2000). A catastrophic mass-mortality episode of gorgonians and other organisms in the Ligurian Sea (northwestern Mediterranean), summer 1999. Ecol. Lett. 3, 284–293. doi: 10.1046/j.1461-0248.2000.00152.x
Chandrapavan, A., Kangas, M. I., Johnston, D., Caputi, N., Hesp, A., Denham, A., et al. (2018). Improving Confidence in the Management of the Blue Swimmer Crab (Portunus armatus) in Shark Bay. PART I: Rebuilding of the Shark Bay Crab Fishery. Fisheries Research Report No. 283. Perth: Department of Primary Industries and Regional Development, 133.
de Lestang, S., Caputi, N., Feng, M., Denham, A., Penn, J., Slawinski, D., et al. (2014). What caused seven consecutive years of low puerulus settlement in the western rock lobster fishery of Western Australia? ICES J. Mar. Sci. 72, i49–i58. doi: 10.1093/icesjms/fsu177
de Lestang, S., Caputi, N., and How, J. (2016). Western Australian Marine Stewardship Council Report Series No. 9: Resource Assessment Report: Western Rock Lobster Resource of Western Australia. Western Australia, WA: Department of Fisheries.
de Lestang, S., Caputi, N., and Melville-Smith, R. (2009). Using fine-scale catch predictions to examine spatial variation in growth and catchability of Panulirus cygnus along the west coast of Australia. N. Zeal. J. Mar. Freshw. Res. 43, 443–455. doi: 10.1080/00288330909510013
Department of Fisheries (2015). Harvest Strategy Policy and Operational Guidelines for Aquatic Resources of Western Australia. Western Australian Department of Fisheries, Fisheries Management Paper 271. Western Australia, WA: Department of Fisheries.
Depczynski, M., Gilmour, J. P., Ridgway, T., Barnes, H., Heyward, J., Holmes, T. H., et al. (2012). Bleaching, coral mortality and subsequent survivorship on a West Australian fringing reef. Coral Reefs 32, 233–238. doi: 10.1007/s00338-012-0974-0
Di Lorenzo, E., and Mantua, N. (2016). Multi-year persistence of the 2014/15 North Pacific marine heatwave. Nat. Clim. Change 6, 1042–1047. doi: 10.1038/nclimate3082
Doi, T., Behera, S. K., and Yamagata, T. (2015). An interdecadal regime shift in rainfall predictability related to the Ningaloo Niño in the late 1990s. J. Geophys. Res. Oceans 120, 1388–1396. doi: 10.1002/2014jc010562
Feng, M., McPhaden, M. J., Xie, S. P., and Hafner, J. (2013). La Niña forces unprecedented Leeuwin current warming in 2011. Sci. Rep. 3:1277.
Fraser, M. W., Kendrick, G. A., Statton, J., Hovey, R. K., Zavala-Perez, A., and Walker, D. I. (2014). Extreme climate events lower resilience of foundation seagrass at edge of biogeographical range. J. Ecol. 102, 1528–1536. doi: 10.1111/1365-2745.12300
Frölicher, T. L., and Laufkötter, C. (2018). Emerging risks from marine heat waves. Nat. Commun. 9:650. doi: 10.1038/s41467-018-03163-6
Frölicher, T. L., Fischer, E. M., and Gruber, N. (2018). Marine heatwaves under global warming. Nature 560, 360–364. doi: 10.1038/s41586-018-0383-9
Garrabou, J., Coma, R., Bensoussan, N., Bally, M., Chevaldonné, P., Cigliano, M., et al. (2009). Mass mortality in northwestern mediterranean rocky benthic communities: effects of the 2003 heat wave. Glob. Change Biol. 15, 1090–1103. doi: 10.1111/j.1365-2486.2008.01823.x
Hancock, D. A. (1973). The relationship between stock and recruitment in exploited invertebrates. Rapp. P. Réun. Cons. Int. Explor. Mer. 164, 113–131.
Hart, A. (2014). “The effect of the 2011 marine heat wave on the Roe’s abalone (Haliotis roei) stocks in Western Australia,” in The Marine Heat Wave Off Western Australia During the Summer of 2010/11 - 2 Years On, Fisheries Research Report No. 250, eds N. Caputi, G. Jackson, and A. Pearce (Western Australia, WA: Department of Fisheries), 12.
Hart, A., Strain, L., Hesp, A., Fisher, E., Webster, F., Brand-Gardner, S., et al. (2017). Marine Stewardship Council Full Assessment Report Western Australian Abalone Managed Fishery. Western Australian Marine Stewardship Council Report Series No. 8. Western Australia, WA: Department of Fisheries, 288.
Hart, A. M., Fabris, F., Brown, J., and Caputi, N. (2013). Biology, History and Assessment of Western Australian Abalone Fisheries. Fisheries Research Report [Western Australia] No. 241. Western Australia, WA: Department of Fisheries, 96.
Hart, A. M., Strain, L. W. S., and Brown, J. (2018). Regulation dynamics of exploited and protected populations of Haliotis roei, and their response to a marine heatwave. ICES J. Mar. Sci. 75, 1924–1939. doi: 10.1093/icesjms/fsy064
Hobday, A., and Pecl, G. (2013). Identification of global marine hotspots: sentinels for change and vanguards for adaptation action. Rev. Fish Biol. Fish. 24, 415–425. doi: 10.1007/s11160-013-9326-6
Hobday, A. J., Alexander, L. V., Perkins, S. E., Smale, D. A., Straub, S. C., Oliver, E. C. J., et al. (2016a). A hierarchical approach to defining marine heatwaves. Prog. Oceanogr. 141, 227–238. doi: 10.1016/j.pocean.2015.12.014
Hobday, A. J., Spillman, C. M., Eveson, J. P., and Hartog, J. R. (2016b). Seasonal forecasting for decision support in marine fisheries and aquaculture. Fish. Oceanogr. 25(Suppl. 1), 45–56. doi: 10.1111/fog.12083
Hobday, A. J., Oliver, E. C. J., Gupta, A. S., Benthuysen, J. A., Burrow, M. T., Donat, M. G., et al. (2018). Categorizing and naming marine heatwaves. Oceanography 31, 1–13.
Holbrook, N. J., Scannell, H. A., Gupta, A., Benthuysen, J. A., Feng, M., Oliver, E. C. J., et al. (2019). A global assessment of marine heatwaves and their drivers. Nat. Clim. Change 10:2624. doi: 10.1038/s41467-019-10206-z
Hughes, T. P., Kerry, J. T., Álvarez-Noriega, M., Álvarez-Romero, J. T., Anderson, K. D., Baird, A. H., et al. (2017). Global warming and recurrent mass bleaching of corals. Nature 543, 373–377. doi: 10.1038/nature21707
Johnson, J. E., and Holbrook, N. J. (2014). Adaptation of Australia’s marine ecosystems to climate change using science to inform conservation management. Int. J. Ecol. 2014, 1–12. doi: 10.1155/2014/140354
Joll, L. M., and Caputi, N. (1995). Environmental influences on recruitment in the saucer scallop (Amusium balloti) fishery of Shark Bay, Western Australia. ICES Mar. Sci. Symp. 199, 47–53.
Kangas, M. I., Chandrapavan, A., Hetzel, Y. L., and Sporer, E. C. (2012). Minimising Gear Conflict and Resource Sharing Issues in the Shark Bay Trawl Fisheries and Promotion of Scallop Recruitment. Fisheries Research Report No 229. Western Australia, WA: Department of Fisheries, 136.
Kangas, M. I., and Jackson, W. B. (1998). Sampling juvenile Penaeus latisulcatus Kishinouye with a water jet net compared with a beam trawl; spatial and temporal variation and nursery areas in Gulf St Vincent, South Australia. Mar. Freshw. Res. 49, 517–523.
Kangas, M. I., Sporer, E. C., Hesp, S. A., Travaille, K. L., Moore, N., Cavalli, P., et al. (2015a). Exmouth Gulf Prawn Managed Fishery. Western Australian Marine Stewardship Council Report Series No. 1. Western Australia, WA: Department of Fisheries, 273.
Kangas, M. I., Sporer, E. C., Hesp, S. A., Travaille, K. L., Brand-Gardner, S. J., Cavalli, P., et al. (2015b). Shark Bay Prawn Managed Fishery. Western Australian Marine Stewardship Council Report Series No. 2. Western Australia, WA: Department of Fisheries, 294.
Kangas, M., and Zeller, B. (2018). Ballot’s Saucer Scallop. Available at: https://www.fish.gov.au/report/261-Ballots-Saucer-Scallop-2018
Kataoka, T., Tozuka, T., Behera, S., and Yamagata, T. (2014). On the Ningaloo Niño/Niña. Clim. Dyn. 43, 1463–1482.
Lenanton, R. C., Caputi, N., Kangas, M., and Craine, M. (2009). The ongoing influence of the Leeuwin Current on economically important fish and invertebrates off temperate Western Australia – has it changed? J. R. Soc. West. Aust. 92, 111–127.
Lenanton, R. C. J., Dowling, C. E., Smith, K. A., Fairclough, D. V., and Jackson, G. (2017). Potential influence of a marine heatwave on range extensions of tropical fishes in the eastern Indian Ocean – Invaluable contributions from amateur observers. Reg. Stud. Mar. Sci. 13, 19–31. doi: 10.1016/j.rsma.2017.03.005
Loneragan, N. R., Kangas, M., Haywood, M. D. E., Kenyon, R. A., Caputi, N., and Sporer, E. (2013). Impact of cyclones and aquatic macrophytes on recruitment and landings of tiger prawns Penaeus esculentus in Exmouth Gulf, Western Australia. Estuar. Coast. Shelf Sci. 127, 46–58. doi: 10.1016/j.ecss.2013.03.024
Marshall, A. G., Hendon, H. H., Feng, M., and Schiller, A. (2015). Initiation and amplification of the Ningaloo Niño. Clim. Dyn. 45, 2367–2385. doi: 10.1007/s00382-015-2477-5
Mayfield, S., Mundy, C., Gorfine, H., Hart, A. M., and Worthington, D. (2012). Fifty years of sustained production from the Australian abalone fisheries. Rev. Fish. Sci. 20, 220–250. doi: 10.1080/10641262.2012.725434
McMahon, K., Statton, J., and Lavery, P. (2017). Seagrasses of the North West of Western Australia: Biogeography and Considerations for Dredging-Related Research. Report of Theme 5 - Project 5.1.2 prepared for the Dredging Science Node. Perth, WA: Western Australian Marine Science Institution, 39.
Mills, K. E., Pershing, A. J., Brown, C. J., Chen, Y., Chiang, F.-S., Holland, D. S., et al. (2013). Fisheries management in a changing climate. Lessons from the 2012 Ocean Heat Wave in the Northwest Atlantic. Oceanography 26, 191–195.
Mills, K. E., Pershing, A. J., and Hernandez, C. M. (2017). Forecasting the seasonal timing of Maine’s lobster fishery. Front. Mar. Sci. 4:337. doi: 10.3389/fmars.2017.00337
Oliver, E. C. J., Benthuysen, J. A., Bindoff, N. L., Hobday, A. J., Holbrook, N. J., Mundy, C. N., et al. (2017). The unprecedented 2015/16 Tasman Sea marine heatwave. Nat. Commun. 8:16101. doi: 10.1038/ncomms16101
Oliver, E. C. J., Donat, M. G., Burrow, M. T., Moore, P. J., Smale, D. A., Alexander, L. V., et al. (2018). Longer and more frequent marine heatwaves over the last century. Nat. Commun. 9:1324. doi: 10.1038/s41467-018-03732-9
Pearce, A., and Feng, M. (2007). Observations of warming on the Western Australian continental shelf. Mar. Freshw. Res. 58, 914–920. doi: 10.1038/sdata.2016.70
Pearce, A., Lenanton, R., Jackson, G., Moore, J., Feng, M., and Gaughan, D. (2011). The “Marine Heat Wave” off Western Australia During the Summer of 2010/2011. Fisheries Research Report 222. Western Australia, WA: Department of Fisheries, 36.
Pearce, A. F., and Feng, M. (2013). The rise and fall of the “marine heat wave” off Western Australia during the summer of 2010/2011. J. Mar. Syst. 111-112, 139–156. doi: 10.1016/j.jmarsys.2012.10.009
Penn, J. W. (1984). “The behaviour and catchability of some commercially exploited penaeids and their relationship to stock and recruitment,” in Penaeid Shrimps, their Biology and Management, eds J. A. Gulland and B. J. Rothschild (Surrey: Fishing News Books).
Pershing, A. J., Alexander, M. A., Hernandez, C. M., Kerr, L. A., Le Bris, A., Mills, K. E., et al. (2015). Slow adaptation in the face of rapid warming leads to collapse of the Gulf of Maine cod fishery. Science 350, 809–812. doi: 10.1126/science.aac9819
Plagányi, ÉE., Weeks, S. J., Skewes, T. D., Gibbs, M. T., Poloczanska, E. S., Norman-López, A., et al. (2011). Assessing the adequacy of current fisheries management under changing climate: a southern synopsis. ICES J. Mar. Sci. 68, 1305–1317. doi: 10.1093/icesjms/fsr049
Reynolds, R. W., Smith, T. M., Liu, C., Chelton, D. B., Casey, K. S., and Schlax, M. G. (2007). Daily high-resolution-blended analyses for sea surface temperature. J. Clim. 20, 5473–5496. doi: 10.1175/2007jcli1824.1
Schaeffer, A., and Roughan, M. (2017). Subsurface intensification of marine heatwaves off southeastern Australia: the role of stratification and local winds. Geophys. Res. Lett. 44, 5025–5033. doi: 10.1002/2017gl073714
Schlegel, R. W., Oliver, E. C. J., Perkins-Kirkpatrick, S., Kruger, A., and Smit, A. J. (2017). Predominant atmospheric and oceanic patterns during coastal marine heatwaves. Front. Mar. Sci. 4:323. doi: 10.3389/fmars.2017.00323
Smale, D. A., and Wernberg, T. (2009). Satellite-derived SST data as a proxy for water temperature in nearshore benthic ecology. Mar. Ecol. Prog. Ser. 387, 27–37. doi: 10.3354/meps08132
Smale, D. A., Wernberg, T., Oliver, E. C. J., Thomsen, M., Harvey, B. P., Straub, S. C., et al. (2019). Marine heatwaves threaten global biodiversity and the provision of ecosystem services. Nat. Clim. Change 9, 306–312. doi: 10.1038/s41558-019-0412-1
Smale, D. A., Wernberg, T., and Vanderklift, M. A. (2017). Regional-scale variability in the response of benthic macroinvertebrate assemblages to a marine heatwave. Mar. Ecol. Prog. Ser. 568, 17–30. doi: 10.3354/meps12080
Strain, L. W. S., Brown, J. B., and Hart, A. M. (2019). Recovering a Collapsed Abalone Stock Through Translocation. Final Report for FRDC Project 211/762. Fisheries Research Report. Western Australia, WA: Department of Fisheries.
Thomson, J., Burkholder, D., Heithaus, M., Fourqurean, J., Fraser, M., Statton, J., et al. (2015). Extreme temperatures, foundation species and abrupt ecosystem shifts: an example from an iconic seagrass ecosystem. Glob. Change Biol. 21, 1463–1474. doi: 10.1111/gcb.12694
Wernberg, T., Bennett, S., Babcock, R. C., de Bettignies, T., Cure, K., Depczynski, M., et al. (2016). Climate-driven regime shift of a temperate marine ecosystem. Science 353, 169–172. doi: 10.1126/science.aad8745
Wernberg, T., Smale, D. A., Tuya, F., and Thomsen, M. S. (2013). An extreme climatic event alters marine ecosystem structure in a global biodiversity hotspot. Nat. Clim. Change 3, 78–82. doi: 10.1038/nclimate1627
Keywords: scallop, crab, prawn, abalone, rock lobster, pre-recruit, spawning stock, climate change
Citation: Caputi N, Kangas M, Chandrapavan A, Hart A, Feng M, Marin M and de Lestang S (2019) Factors Affecting the Recovery of Invertebrate Stocks From the 2011 Western Australian Extreme Marine Heatwave. Front. Mar. Sci. 6:484. doi: 10.3389/fmars.2019.00484
Received: 18 March 2019; Accepted: 18 July 2019;
Published: 07 August 2019.
Edited by:
Thomas Wernberg, The University of Western Australia, AustraliaReviewed by:
Dan Alexander Smale, Marine Biological Association, United KingdomAdrian Linnane, South Australian Research and Development Institute, Australia
Copyright © 2019 Caputi, Kangas, Chandrapavan, Hart, Feng, Marin and de Lestang. This is an open-access article distributed under the terms of the Creative Commons Attribution License (CC BY). The use, distribution or reproduction in other forums is permitted, provided the original author(s) and the copyright owner(s) are credited and that the original publication in this journal is cited, in accordance with accepted academic practice. No use, distribution or reproduction is permitted which does not comply with these terms.
*Correspondence: Nick Caputi, Tmljay5DYXB1dGlAZHBpcmQud2EuZ292LmF1