 Darren Wright
 Carol Janzen
 Robert Bochenek3
- 1National Marine Program, National Oceanic and Atmospheric Administration, National Weather Service, Silver Spring, MD, United States
- 2Alaska Ocean Observing System, Anchorage, AK, United States
- 3Axiom Data Science, LLC, Anchorage, AK, United States
- 4Marine Exchange of Alaska, Juneau, AK, United States
The Automatic Identification System (AIS) is a real-time network of transmitters and receivers that allow vessel movements to be broadcast, tracked, and recorded. Though traditionally used for real-time maritime applications related to keeping track of vessel traffic for collision avoidance, there is increasing interest in using AIS data and the AIS platform for maritime safety planning, resource management, and weather forecasting. AIS data are being made tractable for alternative non-real-time applications like determining trends and patterns in vessel traffic and helping to prioritize where modern bathymetric surveys are needed to ensure safe maritime transit. The AIS is also being used for widespread transmission of critical environmental conditions information, such as sea state and weather, to mariners, forecasters, and emergency response providers. Several pilot projects are underway that demonstrate the capacity and promise of AIS data and the AIS platform to serve multiple purposes, providing overall maritime domain awareness while maintaining its most important objective of tracking vessels to aid safe, secure, efficient and environmentally sound maritime operations.
Introduction
The Automatic Identification System (AIS) is a real-time network of transmitters and receivers that allow vessel movements to be broadcasted, tracked and recorded. The international maritime organization (IMO) international convention for the safety of life at sea (SOLAS) requires AIS to be operational aboard international voyaging ships of 300 gross tonnage or larger. It is also required on all passenger vessels with capacity of 12 or more passengers. The original purpose of the AIS was collision avoidance, and knowing the location of ships in real-time supports vessel traffic control, search and rescue operations, and enforcement of fisheries regulations (Natale et al., 2015; DeSouza et al., 2016). As maritime shipping increases worldwide, and ships are transiting new regions, knowing the location of vessels in time, and space becomes even more critical.
In addition to vessel information (e.g., type of vessel, dimensions, destination, position, course, and speed), three other types of data (environmental, area notice, and waterways management) can be incorporated into the AIS message, known as application specific messages (ASMs)(IMO Safety of Navigation Circular 289, 2010). This makes the AIS a valuable platform for the exchange of critical information such as weather, waves, water level, and current data from nearby observation installations. Examples in this paper describe how AIS is currently being tested and utilized to co-host local weather observations from both shore and ship. Emerging roles for the historical, as well as real-time, AIS data and AIS platform are presented in several real-world examples as well.
The focus of this paper is to highlight multiple ways the AIS can be utilized. The examples below highlight three manners of utilizing this system to perform vessel movement analysis and improve weather awareness and forecasting. The three techniques discussed include the use of AIS heat maps, use of application specific messages (ASM), and use of real-time AIS information to determine vessel operator awareness.
Alternative Applications of AIS
AIS Heat Maps
AIS heat maps utilize historic AIS information to determine where vessels typically travel. This information can help determine where to focus resources for identifying where to carry out hydrographic surveys and update outdated bathymetry among other applications. AIS heatmaps can also be used to determine areas where there is no marine traffic, for projects such as wind farm development.
Use of AIS Application Specific Messages
Application specific messages, or ASMs, are IMO approved binary sections of the AIS message that can be used for environmental, area notice, and waterways management information. This document only focuses on examples that use the environmental ASM for transmission of environmental information.
Use of Real-Time AIS Data
Real-time use of AIS data using a holistic approach can help determine ship operator behavior. The example below proposed by the NOAA National Weather Service (NWS) plans to utilize real-time AIS data to determine if vessels are avoiding major storm events to see if they are properly communicating storm warnings. Historic AIS data can also be post processed to look back at historic storms to evaluate vessel operator behavior.
Demonstration of Projects Using Alternative Applications of AIS
AIS PAC: AIS for Prioritizing Arctic Charting
Sea ice coverage has decreased to the point that existing northern shipping lanes around the world are open for longer periods of time and are projected to experience a continued increase in marine vessel traffic (Arctic Council, 2009). An accident in this region could be catastrophic to communities, and difficult to respond to because of the Arctic’s remoteness, harsh environmental conditions, and lack of sufficient infrastructure for support. The grounding of the tanker CHAMPION EBONY in the summer of 2016 near Nunivak Island, Alaska, occurred in an area with outdated bathymetry that falsely reflected adequate water depth for safe passage. This demonstrates the importance of identifying areas where vessels are currently operating and ensuring that the availability of critical navigational charts and bathymetric survey information meet current standards.
In a collaborative effort funded by the Arctic Domain Awareness Center (ADAC) at the University of Alaska, Anchorage, investigators from the Marine Exchange of Alaska (MXAK), Axiom Data Science (Axiom), and the Alaska Ocean Observing System (AOOS) created AIS data products that inform decision-making about vessel traffic and safety in a rapidly changing Arctic environment1. The research effort helped develop and improve the capability to significantly reduce the execution time for handling and analyzing extremely large collections of AIS vessel tracking data, and produced a variety of AIS-derived data products formatted for use in the National Oceanic and Atmospheric Administration (NOAA) Office of Coast Survey (OCS) Hydrographic Health Model (Keown et al., 2016). NOAA uses this model to identify vessel safety risk areas, such as those with outdated bathymetry or insufficient coastal detail for safe passage of vessel traffic.
A pipeline workflow was developed and enhanced during this project in which AIS data are operated on over several stages rather than as a single phase process. The workflow stages take raw AIS messages, pull all valid position reports, create vessel voyages, and finally generate vessel traffic “heat maps.” Heat maps are raster data that are downloadable as GeoTIFF (images) or NetCDF (files) in various resolutions and projections to allow visual and computational means for identifying high concentrations of ship traffic in the areas summarized. A pipeline workflow makes it so the entire process does not have to be rerun if there is a need to redo the analysis at any stage in the processing. The workflow stages also produce individual data products. To illustrate, if a new vessel type query is desired that differs from previous queries, it is easy to simply create new voyages for the new category, rather than rerunning the entire process. This saves time, as it might take 24 h to parse and clean the raw messages for a single dataset, but only take minutes to hours to generate voyages and minutes to generate a heat map from those voyages. The high-compute cluster workflow optimized during this effort was able to rapidly transform a 5-year historical record of terrestrial Arctic AIS data from MXAK for U.S. Exclusive Economic Zone (EEZ) waters into vessel density heat maps. It has since been used on U.S. Coast Guard Terrestrial and Satellite records, as well as Marine Cadastre Terrestrial and Danish Terrestrial AIS records. More details on the processing methods and access to a variety of processed AIS data products are publicly available on the Axiom AIS vessel traffic data products website2.
Stakeholder feedback guided the development of a specialized project portal hosting over 30 data layers for comparison and analysis against this 5-year AIS data record, hosted by the AOOS website3 and data portal4. Data tools continue to advance end-user access to and utility of these datasets as illustrated in Figure 1. AOOS and the Arctic Domain Awareness Center (ADAC) continue to work together to provide annual updates to the AIS PAC data portal with the next update including 2018 data, and will continue to develop user-driven tools that will improve how stakeholders can interact with, visualize, and analyze these data.
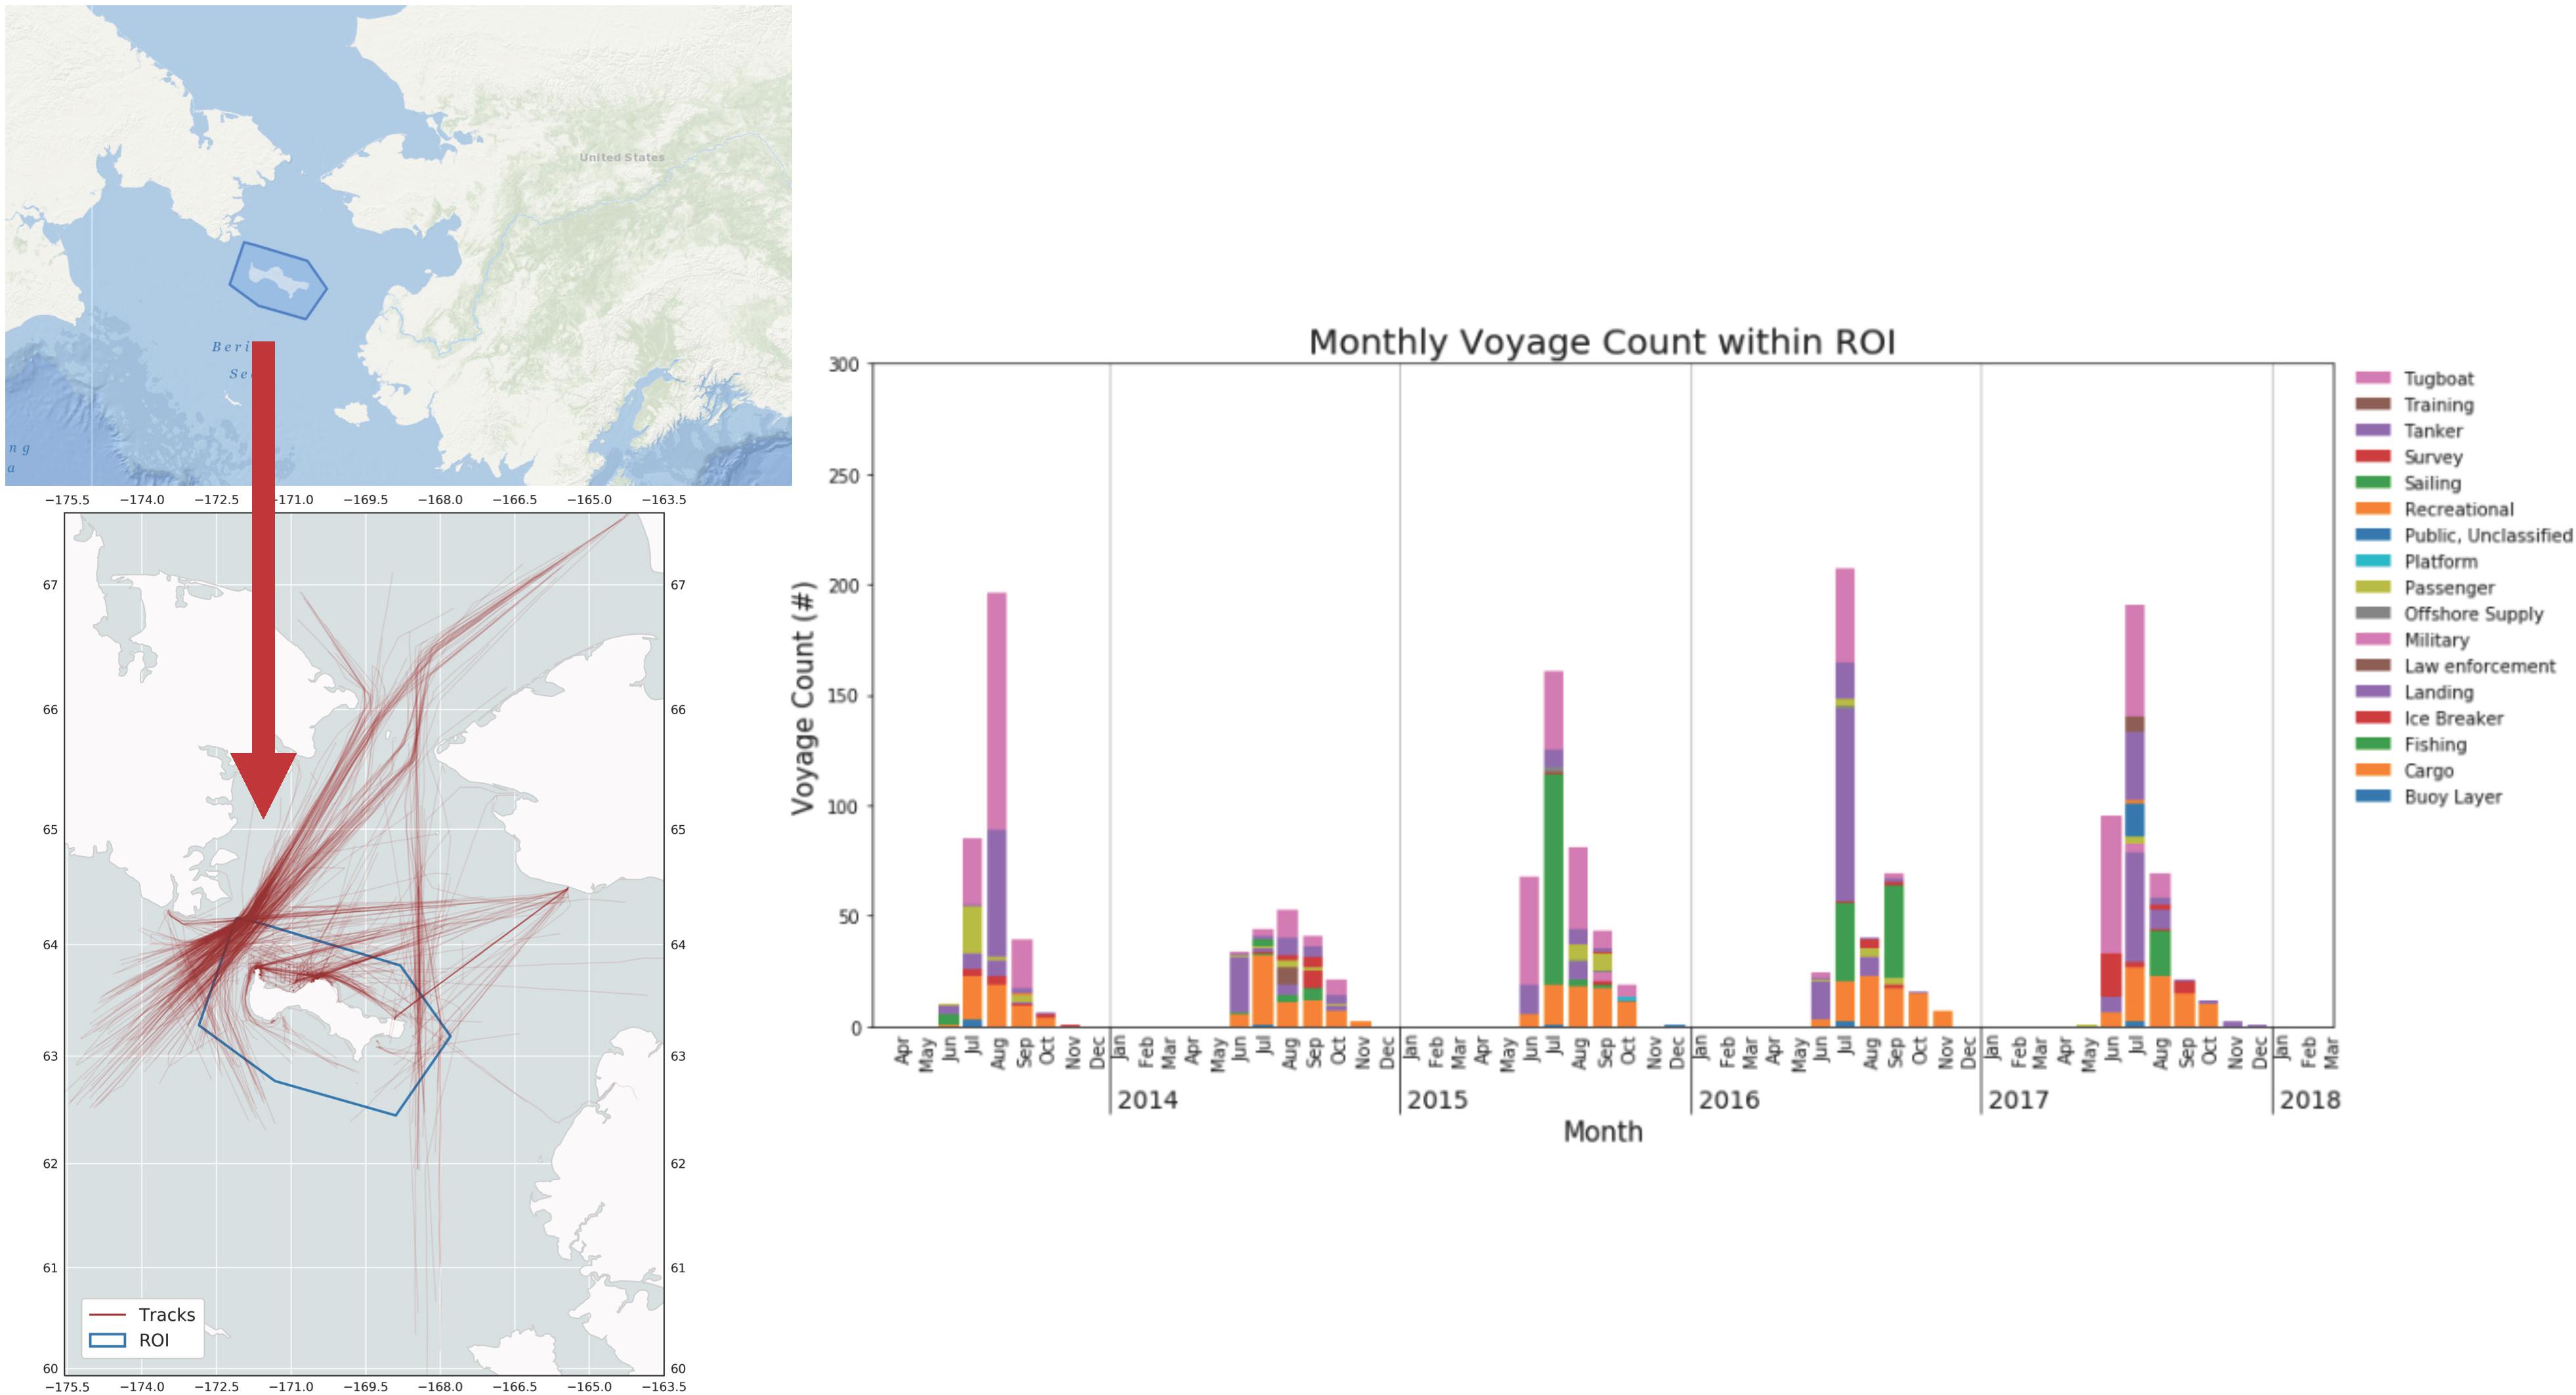
Figure 1. Map of the Bering Sea showing a hexagon drawn around St. Lawrence Island in the Bering Strait. The inset illustrates a heat map showing cumulative 5-Year AIS vessel traffic for the Bering Strait Region, 2013–2017, using data from Marine Exchange of Alaska. The region of interest (ROI) for more focused analysis is inside the blue hexagon around St. Lawrence Island. In this example, the ROI is divided into a grid. Each time a voyage crosses a grid cell in the ROI, total vessel count for that cell increments by one. The vessel count from the ROI is then available for further analysis, such as the histogram time series shown to the right that illustrates the voyage vessel count passing through the ROI broken down by month, year and color-coded by vessel classification.
Synthesizing AIS, Oil Spill Model, and Subsistence Use Information for Planning
AIS information is finding use in socioeconomic planning projects, including a recent effort in the Beaufort Sea region funded by the National Academies of Science. This project integrated data products describing vessel traffic patterns, estimated oil spill impacts, and subsistence use data from the communities of Barrow (Utqiagvik), Nuiqsut, and Kaktovik along the Beaufort Sea coast, and incorporated them into the advanced visualization tools provided by the AOOS data portal for planners and subsistence community members. Spatial heat maps of vessel traffic density were developed by analyzing 2017 AIS data from both the MXAK and NOAA in order to identify the marine vessel corridors in the Beaufort Sea experiencing the heaviest traffic. Investigators from Axiom ran several hundred oil spill trajectory scenarios powered by ocean circulation and atmospheric wind models initialized at randomized locations and times coinciding with vessel traffic hotspots.
Spill trajectory results were then summarized to produce a spill impact density map. Subsistence use patterns were produced from aggregating individual subsistence mapping, harvest, and other socio-economic surveys conducted by Stephen R. Braund and Associates from the Alaska Beaufort Sea communities above. These datasets had been previously unavailable and include species descriptions, timing and area for targeted (hunted) species, and other traditional ecological variables from each community. The subsistence mapping and species distribution data can now be plotted with and compared to the Spill Impact Density maps to understand how different subsistence activities and their relative timing could be impacted in the event of a spill.
All data gathered and synthesized throughout this project are now publicly accessible through a project specific, interactive web-based data portal equipped with mapping tools operated through the AOOS data system. The portal and associated tools provide a mechanism for increasing public, private sector, government, and community knowledge about possible spill effects to subsistence uses in the U.S. Arctic. Results are expected to inform government agency and community emergency response planning and decision-making. The Arctic Oil Spill Risk Assessment Portal5 provides examples of how to visualize data, a tutorial on getting started with the data products and mapping tools offered on the portal, and access to project reports that offer more detailed information on the data sets and methodologies used for the project. Methods developed during this project can be applied to other regions where oil spill risks may impact at-risk resources, such as a fishery or sensitive habitat area.
Reporting Weather Observations in Alaska
An extensive AIS network has been established in Alaska with over 120 AIS receiving stations in place throughout the State. The Marine Exchange of Alaska (MXAK) builds and operates the only terrestrial AIS network in Alaska that is serving as the primary component of the U.S. Coast Guard’s and State of Alaska’s maritime domain awareness network. The MXAK has worked with the U.S. Coast Guard (USCG) in a cooperative research and development agreement (CRADA) to develop the Arctic next generation navigational safety information system that utilizes AIS transmitters to send environmental and safety information to mariners to aid safe and environmentally sound maritime operations.
Partnering with AOOS, the MXAK tested and developed the technology to collect weather observations and transmit this information to mariners using the environmental ASM portion of the AIS message and the internet accessible by smartphones and computers. This project enhances maritime safety and environmental protection in Alaska by providing real-time, environmental information to vessels over the AIS.
By establishing joint weather/AIS stations at existing AIS locations, and installing new stations in remote areas, real-time weather information can be presented on a vessel’s AIS display in a more reliable and clear manner and at greater distances than the method in which weather information is presently disseminated. With most commercial vessels required to be equipped with AIS by the IMO treaties, AIS is one of the most reliable means of communicating weather and other environmental information (e.g., weather and ice reports) to vessels operating in coastal waters out to 50 miles offshore.
Up to 29 of the Alaska AIS stations now have co-located weather sensors that, along with an additional 20 stand-alone weather stations operated by the MXAK, are providing local observations through the AIS. Data are displayed and made publicly available by the MXAK weather and tracking website and phone application product6, AOOS on their real-time sensor map, and can also be accessed through the National Data Buoy Data Center (NDBC). Information is also provided directly to the NWS to aid forecasting and the dissemination of real-time weather information via their very high frequency (VHF) broadcast and web notification system. The success of the AIS weather project in Alaska has led to other environmental and maritime safety information being shared across the AIS, including wave and current observations from the Coastal Data Information Program (CDIP) (https://cdip.ucsd.edu/m/) buoy deployed off the Port of Nome, Alaska.
Transmitting Weather Observations From Ships
In 2018, the USCG, United States Army Corps of Engineers (USACE), Maritime Administration (MARAD), and the NWS partnered on an effort to develop an automated shipboard weather observation system that will format weather observations into an environmental ASM for transmission as part of an AIS message to the USCG and other vessels, and to the NWS for use in its marine weather forecast models. The NWS currently receives many thousands of weather observations terrestrially on an hourly basis or less, but observations from the open ocean are much more sparse. The NWS has to rely on satellite information to help fill large gaps for offshore conditions, but satellites do not provide full coverage and, as a result, large gaps remain (e.g., Figure 2; Smith et al., 2019).
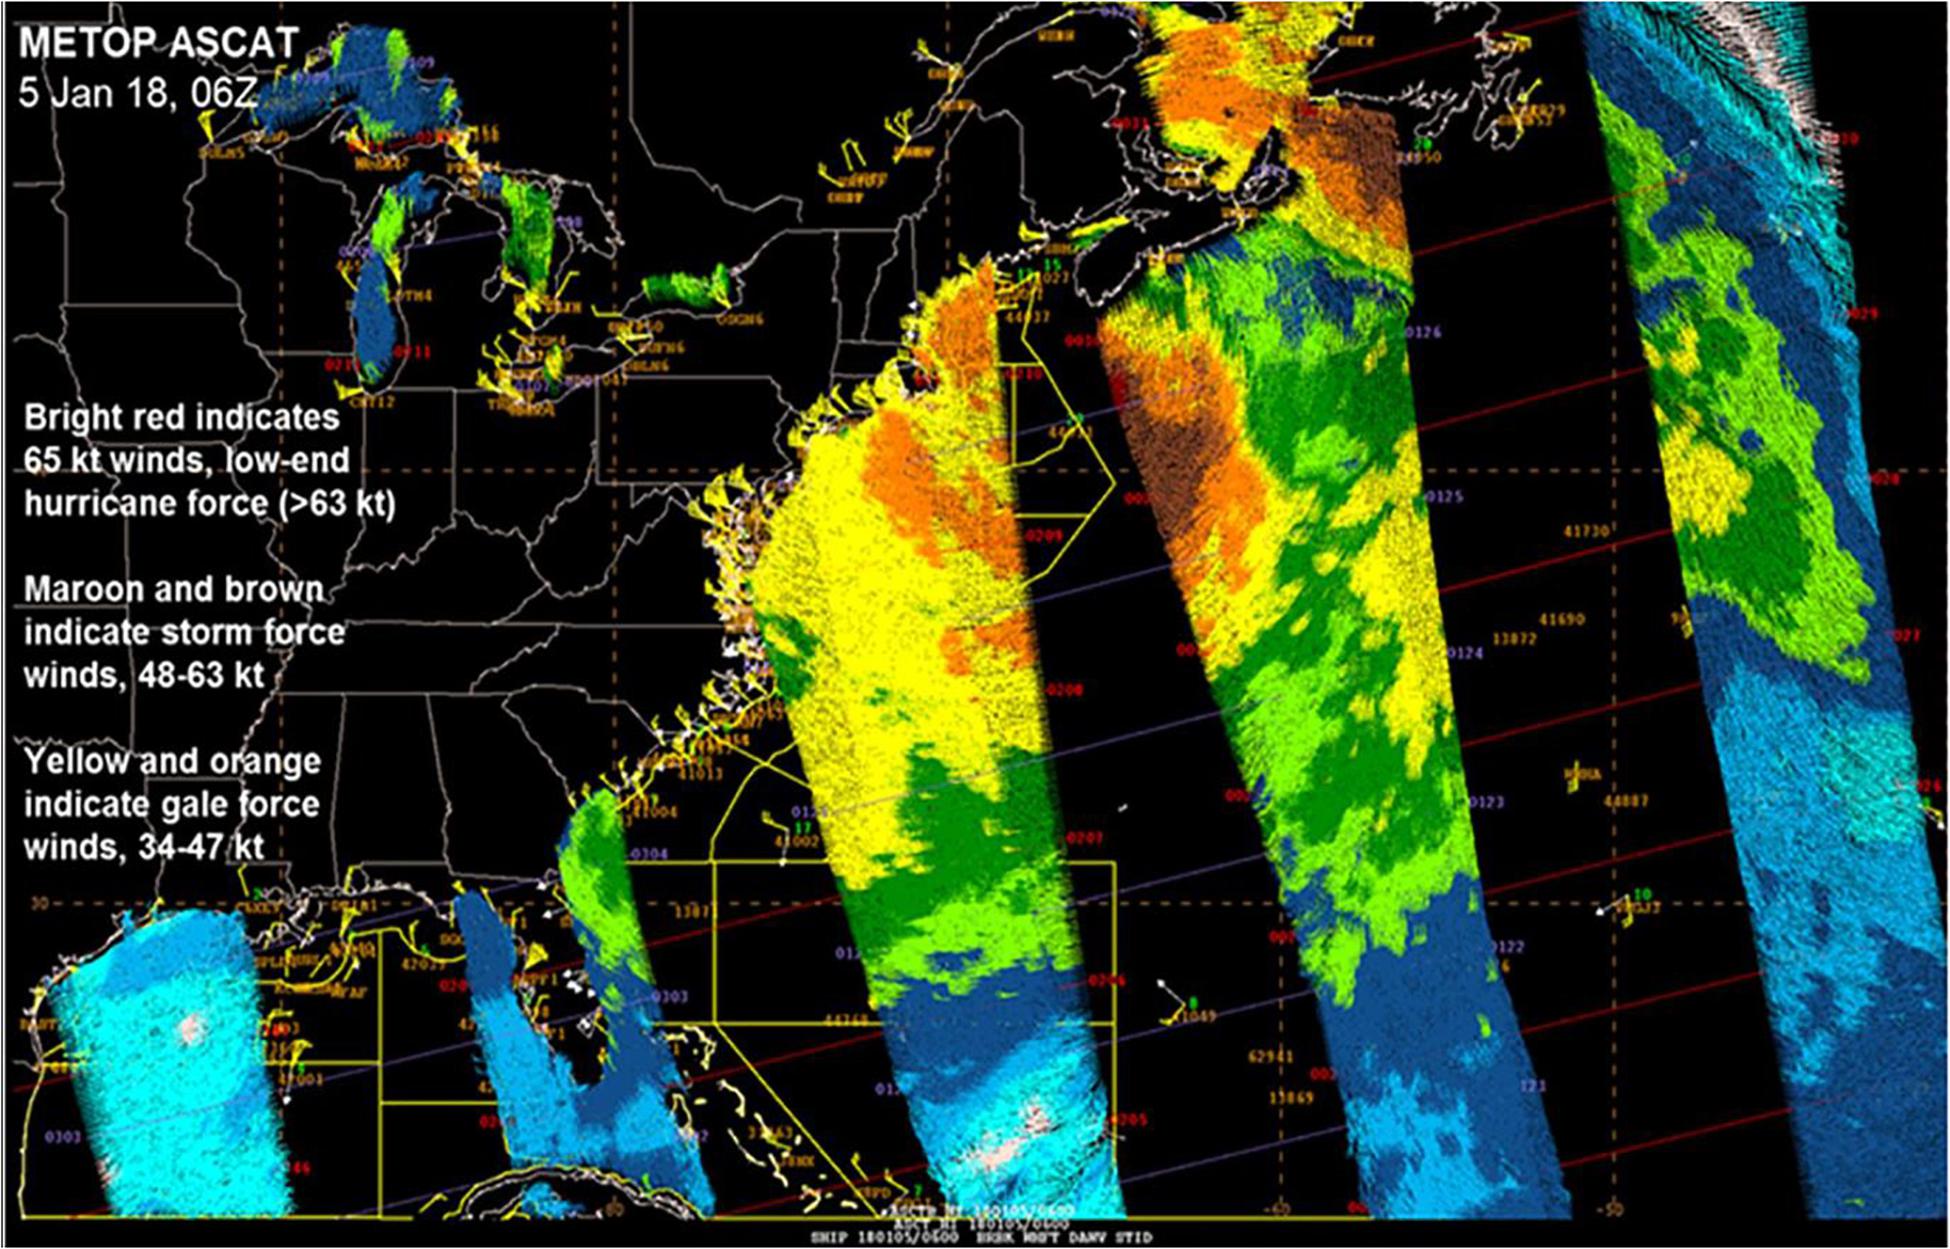
Figure 2. EUMETSAT MetOp Advanced Scatterometer data (colored swaths), with available ship observations (using standard synoptic station notation), from 0600 UTC on January 5, 2018. Courtesy of National Oceanic and Atmospheric Administration, NWS, Ocean Prediction Center.
By working with these agencies and manufacturers of both weather and AIS systems, the NWS hopes to significantly increase the number of observations it receives from ships, and at the same time, reduce workloads of mates on ships that would otherwise have to manually take and report out weather observations. Conditions like cloud cover and in situ wave height, along with a number of essential climate variables, may still need to be reported manually, but information such as air temperature, barometric pressure, sea surface temperature, and wind speed and direction can easily be recorded directly from sensors and formatted for transmission. The increase of observations reported out from ships will help improve forecast models and ultimately will assist the NWS with providing better forecasts and warnings over the open ocean, important for the safety of life at sea.
Transmission of Environmental Information for Safe Maritime Navigation
NOAA’s National Ocean Service (NOS) has been working with the USCG to transmit data from its physical oceanographic real-time system (PORTS®) over AIS to ships, providing critical environmental information to aid ships in navigating safely. PORTS® is a decision support tool for mariners that improves the safety and efficiency of maritime commerce and coastal resource management through the integration of real-time environmental observations, forecasts and other geospatial information. PORTS® measures and disseminates observations and predictions of water levels, currents, salinity, waves and meteorological parameters (e.g., winds, visibility, atmospheric pressure, air, and water temperatures) that mariners need to navigate safely.
By transmitting this information over AIS, manufacturers of ship navigation display systems will be able to integrate this environmental information into one display, so multiple screens or devices to acquire the information onboard are not needed. The NOS and the USCG conducted two demonstration projects in Tampa Bay, Florida and on the Columbia River in Oregon. Both trials demonstrated this as a viable method of transmitting environmental information. The USCG is now working to make this transmission capability operational over its Nationwide AIS Network, which has full coastline coverage in the continental U.S. In the meantime, the Columbia River Pilots, working with U.S. Department of Transportation (USDOT) Volpe Center, have made the transmission of PORTS® data operational on the Columbia River and have integrated PORTS® data into their portable pilot units, which are devices used by the Pilots to assist in navigating ships to port.
With the transmission of real-time and forecast information over AIS, like water levels, one can envision navigational software providing dynamic bathymetry on electronic nautical charts and dynamic ship channel displays, notifying captains and pilots if they are passable, based on the ship’s under keel clearance.
Monitoring Ship Responses to Major Storm Events and Warnings
The NWS is investigating the use of real-time ship locations to see how vessels are responding to storm/hurricane warnings. The NWS, working with the USCG, intends to get access to a real-time AIS data feed, download the information into a database and convert the information into a format that its advanced weather interactive processing system (AWIPS) can read and display. Once ingested, the AIS data can be overlayed on top of weather maps to see if ships are avoiding dangerous weather areas. A plot of ship locations from AIS data during Hurricane Florence in September 2018 shows a zone (red shaded region) of essentially complete ship avoidance in an area where a hurricane warning was in effect (Figure 3). The red arrow within this warning zone represents the hurricane’s predicted path. From this image, it is clear that ships (represented by the small triangles) successfully practiced avoidance of the hurricane.
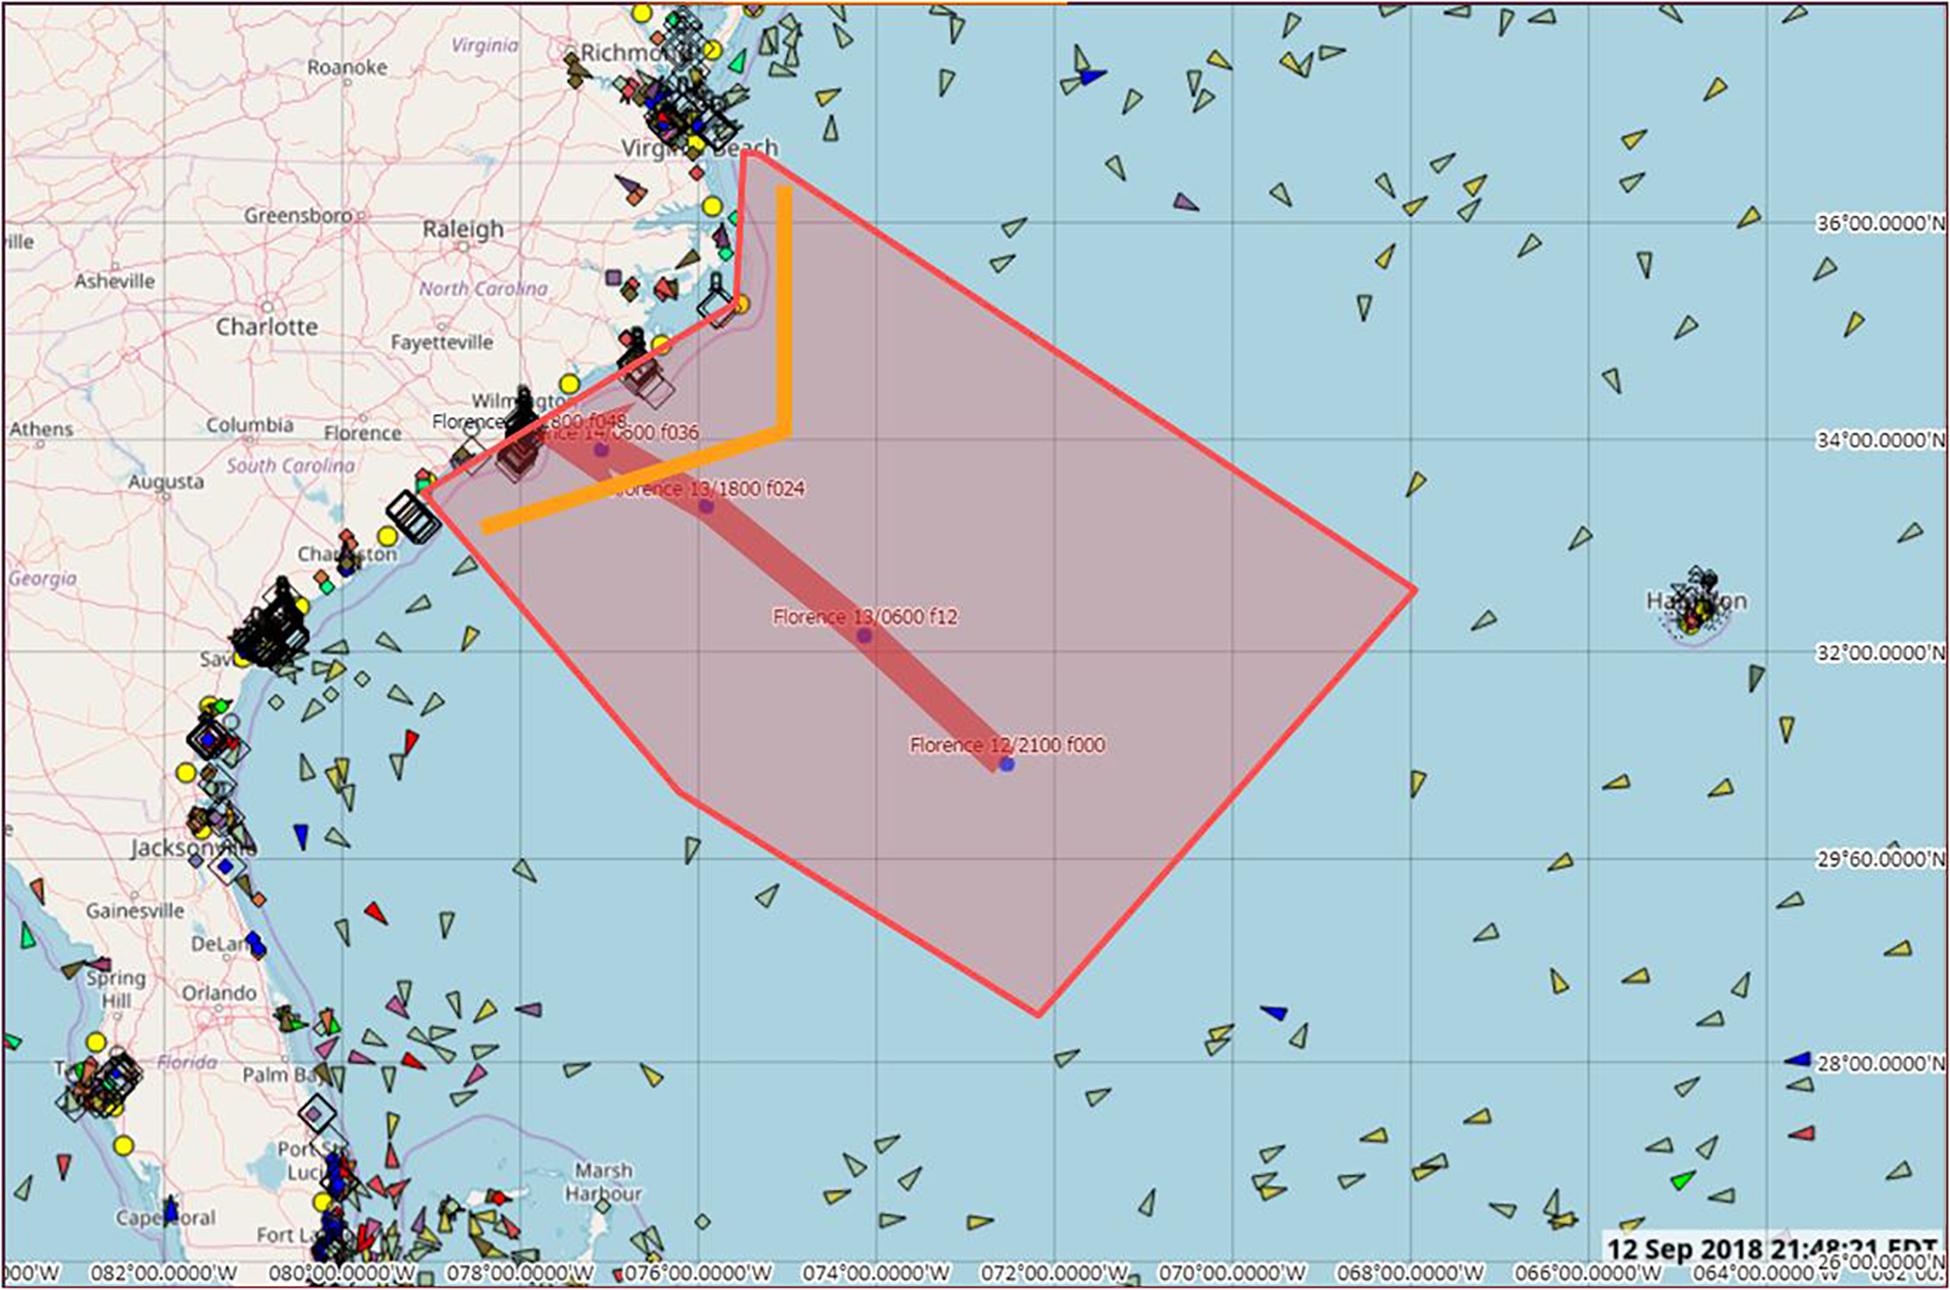
Figure 3. AIS data plot shows ships (small triangles) avoiding Hurricane Florence, 2018. The NWS plans to use this tool to help ensure vessels are receiving the proper warnings and are avoiding hazardous seas, part of a decision support framework in support of a Weather Ready Nation.
Conclusion
AIS was designed and developed as a method of tracking real-time vessel movements for both security and safety of navigation through traffic awareness. There are a variety of other applications in which this technology can be utilized.
Companies and government agencies will continue to use AIS information in new and different ways, like the examples presented in this paper. Some other examples include the USACE transmission of both environmental and lock information on inland rivers via its River Information Service, transmission of weather information all along the St. Lawrence Seaway in the Great Lakes, which has been done for years, and the Columbia River Pilots, who are receiving water level data over AIS through their portable pilot units to assist in navigation. The USCG, in its Maritime Commerce Strategic Outlook document (U.S. Coast Guard, 2018), stated “The Coast Guard will bolster engagement with NOAA to integrate real-time information to broadcast hydrographic and weather data through the AIS, and continue to seek additional partnerships and information sources.” This initiative, along with many others, paints a bright picture for the expanded use of AIS in the future.
Author Contributions
DW is lead author of the manuscript, co-authored the “Abstract,” “Introduction,” and “Conclusion” sections, and was lead author for “Demonstration of Projects Using Alternative Applications of AIS” sections: “Transmitting Weather Observations From Ships,” “Transmission of Environmental Information for Safe Maritime Navigation,” and “Monitoring Ship Responses to Major Storm Events and Warnings.” CJ co-authored the “Abstract,” “Introduction,” and “Conclusion” sections and was lead author on “Alternative Applications of AIS” section and “Demonstration of Projects Using Alternative Applications of AIS” sections: “AIS PAC: AIS for Prioritizing Arctic Charting,” “Synthesizing AIS, Oil Spill Model, and Subsistence Use Information for Planning,” and “Reporting Weather Observations in Alaska.” RB and JA were responsible for developing the data processing protocols for handling large AIS records, for data analysis and performing oil spill modeling scenarios seeded using AIS information, and co-authored the discussions on methods described in “AIS PAC: AIS for Prioritizing Arctic Charting” and “Synthesizing AIS, Oil Spill Model, and Subsistence Use Information for Planning” sections. EP is the Executive Director and founder of the Marine Exchange of Alaska and supported the Alaska projects described in this manuscript by acquiring and providing 100% of quality controlled AIS data, also co-authored the section “Reporting Weather Observations in Alaska.”
Funding
Primary funding for AOOS and associated projects comes from NOAA NOS grant-NA16NOS0120027. Support for the AIS PAC project was provided by the Arctic Domain Awareness Center (ADAC), a U.S. Department of Homeland Security (DHS) Center of Excellence in Maritime Research, hosted by the University of Alaska, where associated activities were supported by DHS under the grant award number 2014-ST-061-ML0002. The Gulf Research Program of the National Academies of Sciences, Engineering, and Medicine project assimilating oil spill, AIS, and subsistence harvest information was supported under the grant award number 2000007630.
Disclaimer
The content is solely the responsibility of the authors and does not necessarily represent the official views of the Gulf Research Program or the National Academies of Sciences, Engineering, and Medicine.
Conflict of Interest Statement
RB and JA are employed by Axiom Data Science, which provides data management support for AOOS, IOOS, SECOORA, and CenCOOS.
The remaining authors declare that the research was conducted in the absence of any commercial or financial relationships that could be construed as a potential conflict of interest.
Acknowledgments
The authors would like to recognize the U.S. Coast Guard, the U.S. Army Corps of Engineers (USACE), the Maritime Administration (MARAD), the NOAA Office of Coast Survey (OCS), the NOAA National Weather Service (NWS), the Integrated Ocean Observing System (IOOS), the Marine Exchange of Alaska, the Arctic Domain Awareness Center (ADAC) at the University of Alaska, the Department of Homeland Security, and the National Academy of Sciences for their role in the development of AIS applications for marine observing.
Footnotes
- ^ https://www.aoos.org/ais-4-bathy/
- ^ http://ais.axds.co/
- ^ https://aoos.org/
- ^ https://pac.portal.aoos.org/
- ^ https://aoos.org/ais-oil-spill-support/
- ^ http://www.mxak.org/mobile/index.html
References
Arctic Council (2009). Arctic Marine Shipping Assessment 2009 Report, Second Printing. Available at: https://www.pmel.noaa.gov/arctic-zone/detect/documents/AMSA_2009_Report_2nd_print.pdf
DeSouza, E. N., Boerder, K., Matwin, S., and Worm, B. (2016). Improving fishing pattern detection from satellite AIS using data mining and machine learning. PLoS One 11:e0158248. doi: 10.1371/journal.pone.0158248
IMO Safety of Navigation Circular 289 (2010). Guidance on the Use of Ais Application-Specific Messages. Available at: https://www.navcen.uscg.gov/pdf/IMO_SN1_Circ289_Guidance_on_use_of_AIS_ASM.pdf
Keown, P., Gonsalves, M., Allen, C., Fandel, C., Gallagher, B., and Hick, L. (2016). “A risk-based approach to determine hydrographic survey priorities using GIS,” in Proceedings: 2016 ESRI Ocean GIS, (Redlands, CA: Forum).
Natale, F., Gibin, G., Alessandrini, A., Vespe, M., and Paulrud, A. (2015). Mapping fishing effort through AIS data. PLoS One 10:e0130746. doi: 10.137/journal.pone.0130746
Smith, S., Alory, G., Andersson, A., Asher, W., Baker, A., Berry, D., et al. (2019). Ship-based contributions to global ocean, weather, and climate observing systems. Front. Mar. Sci. 6:434. doi: 10.3389/fmars.2019.00434
U.S. Coast Guard (2018). Maritime Commerce Strategic Outlook. Available at: https://media.defense.gov/2018/Oct/05/2002049100/-1/-1/1/USCG%20MARITIME%20COMMERCE%20STRATEGIC%20OUTLOOK-RELEASABLE.PDF
Keywords: automatic identification system, vessel tracking, weather observations, nautical charting, oil spill risk, subsistence use, hydrography, maritime domain awareness
Citation: Wright D, Janzen C, Bochenek R, Austin J and Page E (2019) Marine Observing Applications Using AIS: Automatic Identification System. Front. Mar. Sci. 6:537. doi: 10.3389/fmars.2019.00537
Received: 31 October 2018; Accepted: 15 August 2019;
Published: 30 August 2019.
Edited by:
Laura Lorenzoni, University of South Florida, United StatesReviewed by:
Vicki Ferrini, Lamont Doherty Earth Observatory (LDEO), United StatesElizabeth Nyman, Texas A&M University at Galveston, United States
Kurt Schwehr, Google, United States
Copyright © 2019 Wright, Janzen, Bochenek, Austin and Page. This is an open-access article distributed under the terms of the Creative Commons Attribution License (CC BY). The use, distribution or reproduction in other forums is permitted, provided the original author(s) and the copyright owner(s) are credited and that the original publication in this journal is cited, in accordance with accepted academic practice. No use, distribution or reproduction is permitted which does not comply with these terms.
*Correspondence: Darren Wright, ZGFycmVuLndyaWdodEBub2FhLmdvdg==