 Yong Sun Kim1
 Chan Joo Jang1,2
 Jae Hoon Noh1,2
 Kyung-Tae Kim1Jae-Il Kwon1Yongchim Min1Jongmin Jeong1Jaeik Lee1
 In-Ki Min1Jae-Seol Shim1Do-Seong Byun3Jinkwon Kim3
 Jin-Yong Jeong1*
- 1Korea Institute of Ocean Science and Technology, Busan, South Korea
- 2University of Science and Technology, Daejeon, South Korea
- 3Korea Hydrographic and Oceanographic Agency, Busan, South Korea
The Yellow Sea is one of the most productive continental shelves in the world. This large marine ecosystem is experiencing an epochal change in water temperature, stratification, nutrients, and subsequently in ecological diversity. Research-oriented monitoring of these changes requires a sustainable, multi-disciplinary approach. For this purpose, the Korea Institute of Ocean Science and Technology (KIOST) constructed the Socheongcho Ocean Research Station (S-ORS), a steel-framed tower-type platform, in the central Yellow Sea about 50 km off the western coast of the Korean Peninsula. This station is equipped with about forty sensors for interdisciplinary oceanographic observations. Since its construction in 2014, this station has continuously conducted scientific observations and provided qualified time series: physical oceanographic variables such as temperature, salinity, sea level pressure, wave, and current; biogeochemical variables such as chlorophyll-a, photosynthetically active radiation, and total suspended particles; atmospheric variables including air temperature, wind, greenhouse gasses, and air particles including black carbon. A prime advantage is that this platform has provided stable facilities including a wet lab where scientists can stay and experiment on in situ water samples. Several studies are in process to understand and characterize the evolution of environmental signals, including air-sea interaction, marine ecosystems, wave detection, and total suspended particles in the central Yellow Sea. This paper provides an overview of the research facilities, maintenance, observations, scientific achievements, and next steps of the S-ORS with highlighting this station as an open lab for interdisciplinary collaboration on multiscale process studies.
Introduction
The Yellow Sea is a shallow, marginal sea in the northwest Pacific spanning about 1,000 km meridionally and 700 km zonally (see Figure 1). Albeit the small volume, this sea is one of the most productive marine ecosystems (Xie et al., 2002; Belkin, 2009). Scientists have reported that this sea is experiencing epochal, systematic changes in water properties associated with wind, precipitation, and currents bifurcated from the Kuroshio (Liao et al., 2015; Cai et al., 2017; Kim et al., 2018b). These environmental changes likely trigger a regime shift in the ecological diversity of the Yellow Sea (Zhang et al., 2000). Such ecological implications raise the need for a sustainable, multi-disciplinary monitoring system. Surface buoy or bottom mooring type observations are not pertinent to this sea, primarily due to the harsh oceanic conditions and intensive fishing activities, nor does the Yellow Sea’s shallowness allow typical Argo floats. We believe that a steel-framed structure is a unique alternative for a sustained, integral atmosphere-ocean observation system. A prototype of the steel-frame oceanographic tower is the Acqua Alta, constructed in 1970 to address hydraulic issues in the Adriatic Sea (Cavaleri, 2000). While this tower does not operate currently due to a revamping process, it had successfully produced air-sea observations for more than four decades without any deterioration on its steel frame.
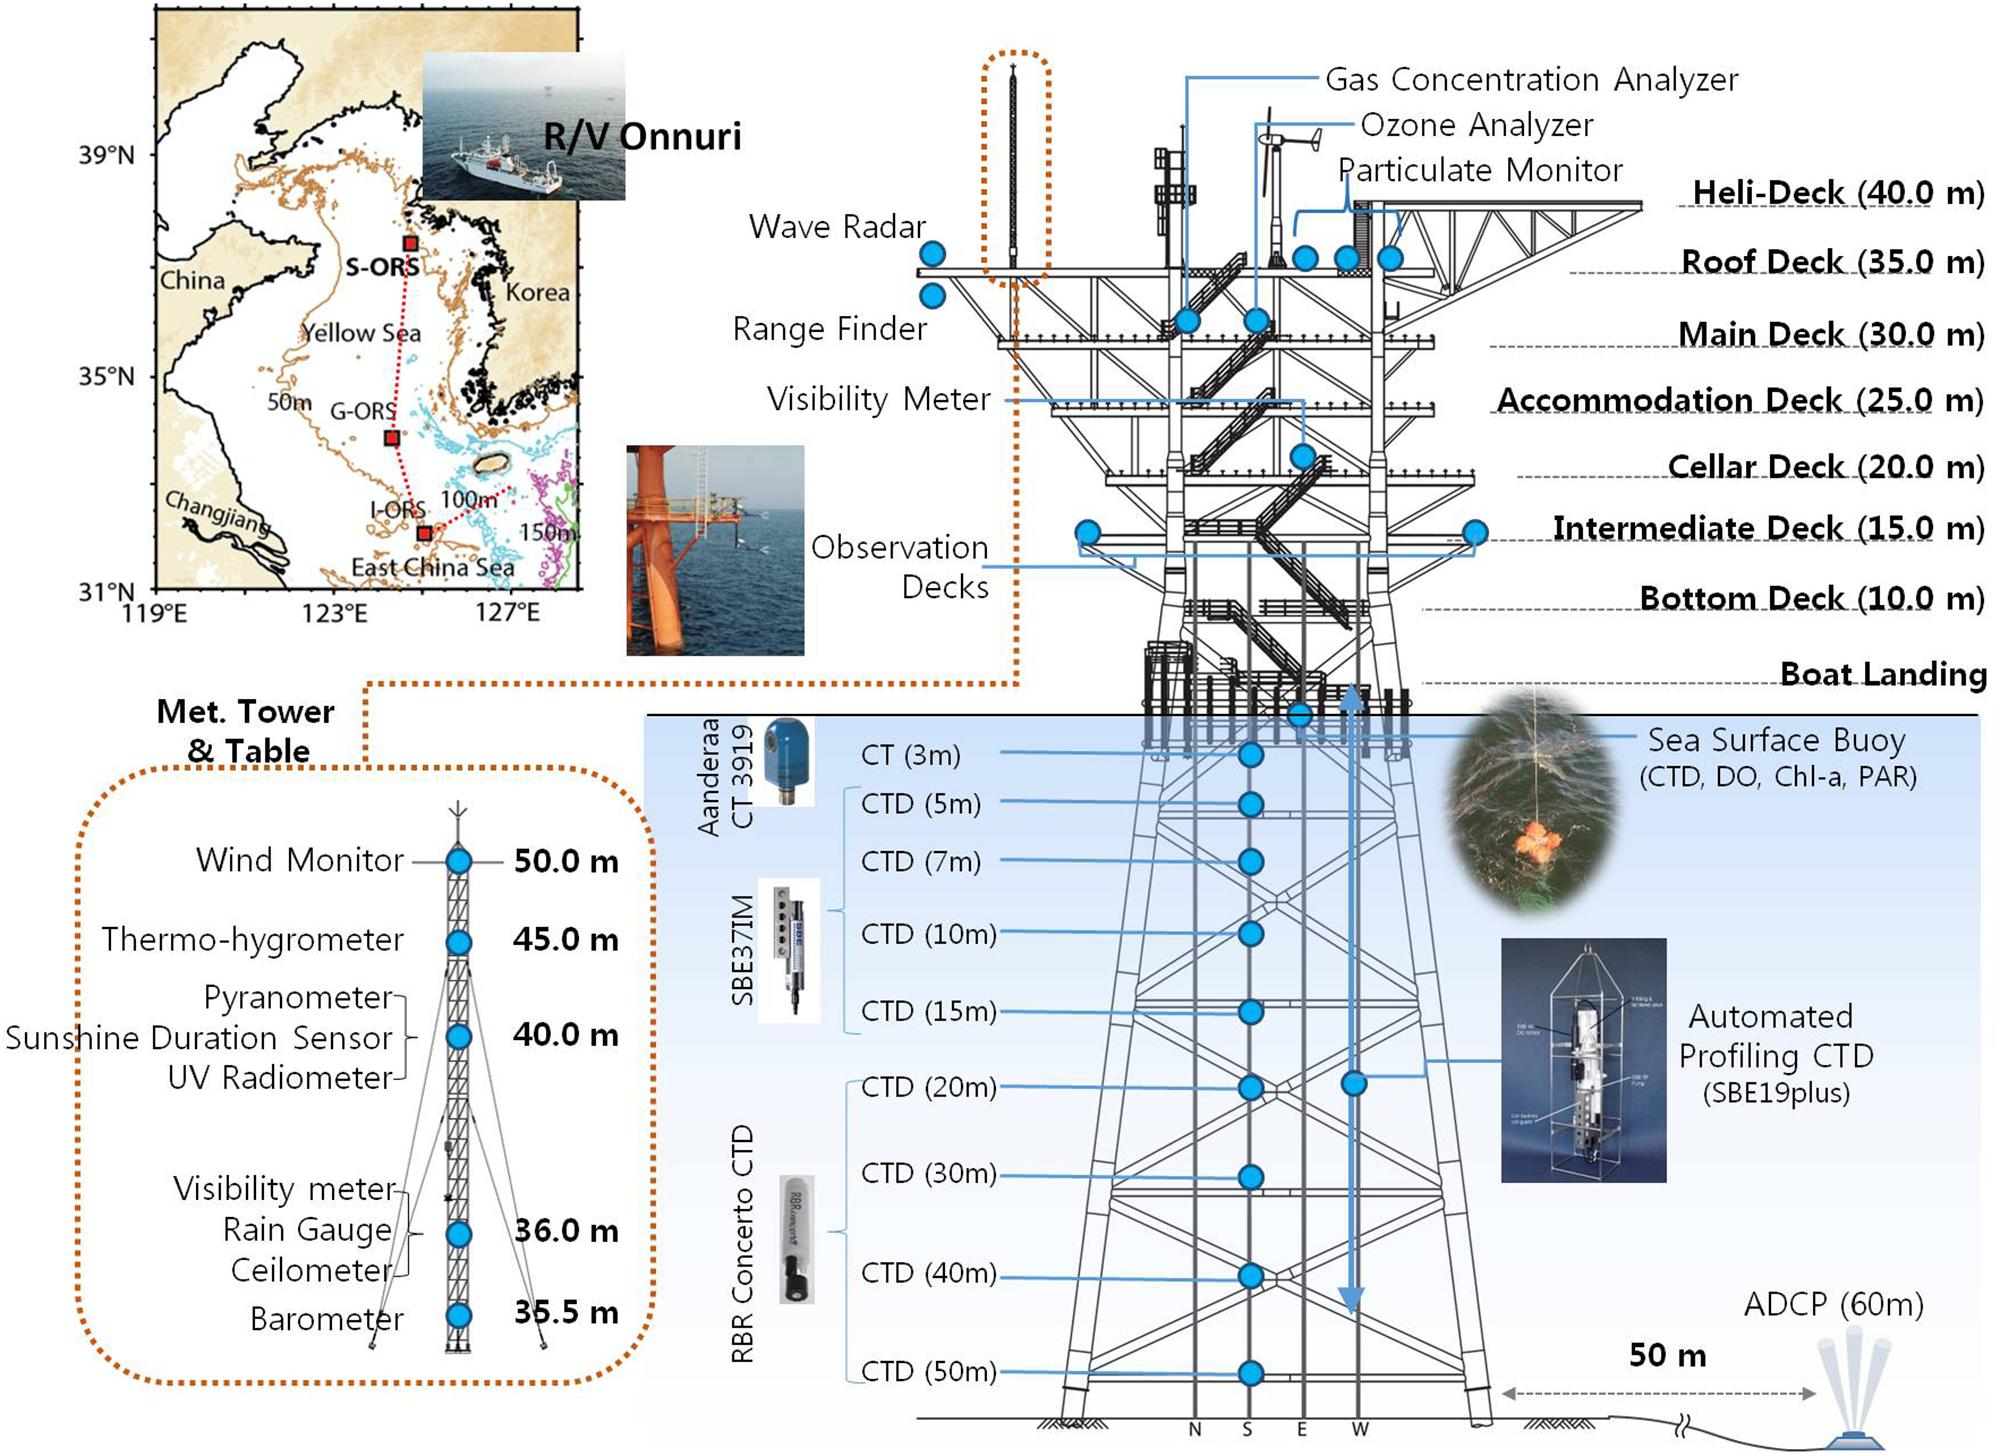
Figure 1. Specification and major observation sensors of the Socheongcho Ocean Research Station (S-ORS), with its geographic location in the Yellow Sea (the upper left-hand map). The red dotted line on the map shows the cruise route of the research vessel during an annual field trip via three KORS, i.e., the S-ORS, the Gageocho Ocean Research Station (G-ORS), and the Ieodo Ocean Research Station (I-ORS) in summer.
The Korea Institute of Ocean Science and Technology (KIOST) has constructed three steel-framed tower-type Korea Ocean Research Stations (KORS) in the Yellow and East China Seas since 2003 (Figure 1; Ha et al., 2019). The first one is the Ieodo Ocean Research Station (I-ORS) in the northern East China Sea, a boundary between the Yellow Sea and the open ocean. The KIOST constructed the Gageocho (G-ORS) in 2009 and the Socheongcho Ocean Research Stations (S-ORS) in 2014 sequentially. Unfortunately, typhoon Muifa swept over the G-ORS in July 2011 and caused structural damage to this station. After its repair, this station has functioned in part concerning air-sea interaction by using the meteorological and optical sensors. After damage inspections on the G-ORS’s structural frame, the S-ORS was designed to withstand various extreme conditions such as waves up to 18-m in height, 60 m/s winds, and 6.5 Richter-scale earthquakes. The planned lifetime of the S-ORS is 50 years while its fatigue lifetime being around 100 years.
A chief aim of these stations is to observe the meridional propagation of atmospheric and oceanic signals between the open ocean and the continental shelf. In this view, the I-ORS is pertinent to investigate oceanic signals from the open ocean into the continental shelf focusing on the hydraulic processes of a typhoon, current, internal wave, and riverine discharge (see Ha et al. (2019) for detailed information on ongoing researches utilizing the I-ORS). The S-ORS is, however, more suite to investigate continent-induced air-sea interactions in the Yellow Sea and also its intrinsic variability than the I-ORS. From an operational perspective, experimental tryouts with cutting-edge technology are examined on the S-ORS owing to the expandability of sensors, facilities with a wet lab and accommodation, as well as efficient logistics. After preliminary optimization, the measurement would be routinely operated on the I-ORS because of its restriction in resources and transportation. In this review, therefore, we highlight the S-ORS by specifying its detailed structure, demonstrating scientific applications, and sharing our next steps as an open lab for multiscale, interdisciplinary process studies.
The Socheongcho Ocean Research Station (S-ORS)
Its Facilities, Instruments, and Measurements
The S-ORS sits on the eastern flank of the central trough of the Yellow Sea with a water depth of 50 m (37° 25′ 23.3″ N, 124° 44′ 16.9″ E). The S-ORS is composed of seven decks, as illustrated in Figure 1. A wind turbine and solar panels on the roof deck, and two diesel generators in the cellar deck supply the S-ORS with electricity. The core facilities – the main control room, switchgear room, and battery room – are located on the main deck for its general administration. Researchers are allowed on board this station on a routine basis roughly every month, by ship or helicopter via the boat landing and heli-deck. Up to forty people can stay at a time in the residence facilities on the main and accommodation decks, which consist of six spacious bedrooms, a public kitchen, a living room, and a rec center. There is a wet lab on the cellar deck, where scientists can carry out necessary processes to their water samples (Figure 2). The wet lab is equipped with FlowCAM and Hplc-flowcytometer to figure out the size and species composition of sampled phytoplankton. By taking advantage of this wet lab and on-site accommodation of the S-ORS, researchers can stay for several days for the immediate in situ analysis of water samples, which need strict procedures to avoid potential degradation during their storage and transportation. Also noteworthy are two observation decks on the northeast and southwest corners of the intermediate deck, which extend 6 m out over the sea. These extended decks aid data collection by minimizing any structural interference associated with the shade of the S-ORS and turbulent currents to the rear of this large-scale structure.
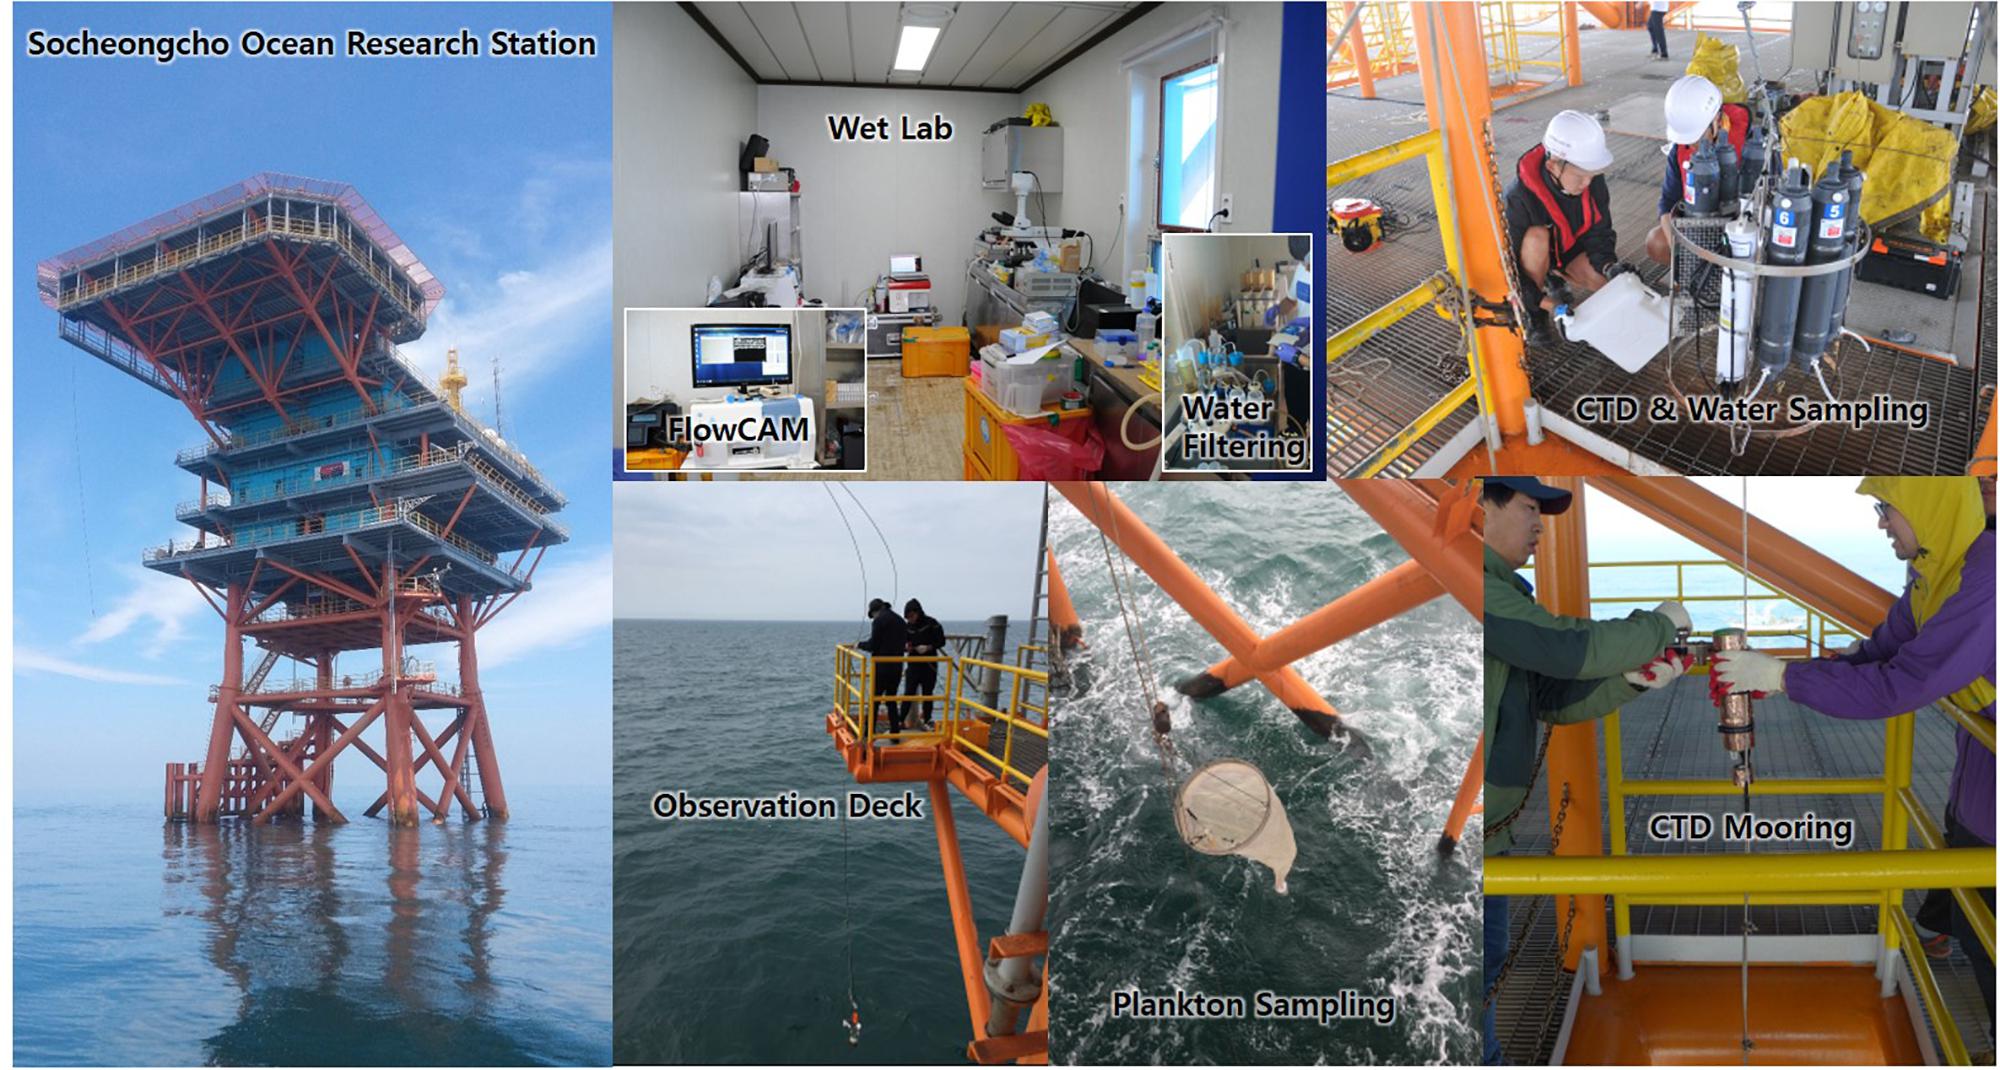
Figure 2. An overview of the S-ORS: Research facilities and activities.
About forty instruments have worked on the S-ORS for multi-disciplinary researches and environmental monitoring (Table 1). A meteorological tower (wind, solar radiance, precipitation, air pressure, and temperature), air particle sensors (PM2.5, PM10, and black carbon), a gas concentration analyzer (CO, CO2, H2O, and CH4), and an ozone analyzer are mounted on the roof deck. There is a radar-type two-dimensional wave monitoring instrument (Miros Wave and Current Radar; SM-050 MKIII) on the northeast rim of the roof deck. This wave sensor looks down onto the sea surface at an angle of 10°, generally identifying waves 100-m away from the station (Min et al., 2018). An electrical winch system on the intermediate deck operates four stainless steel cables, which allow instruments to be lowered into the water. The CTD sensors attached to one of the cables observe real-time temperature and salinity at fixed levels of 3, 7, 10, 15, 20, 30, 40, and 50 m during the water stratification period from May to November while the top CTD sensor works throughout the year. As a complementary measurement to the fixed-depth CTD observations, an automatic CTD profiling is in operation twice a day.
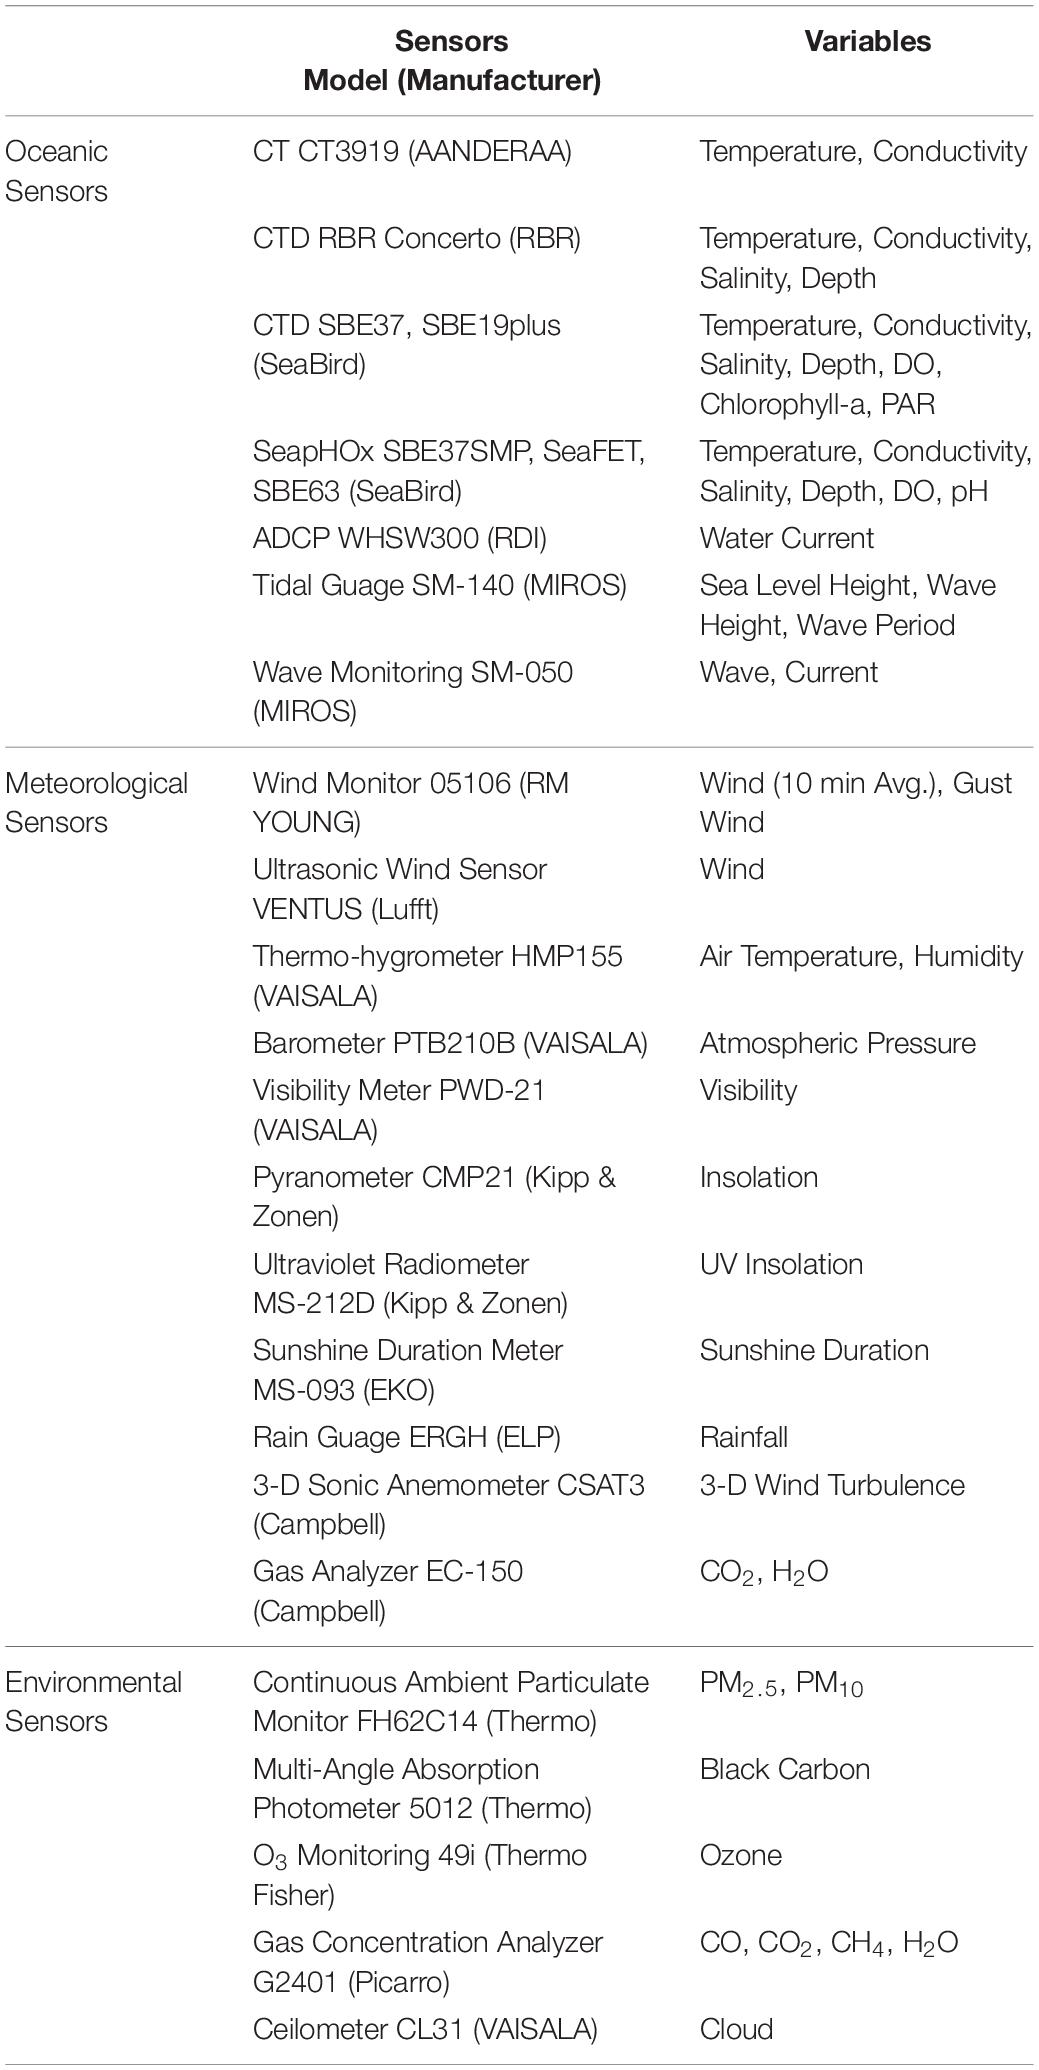
Table 1. List of the major observation sensors and variables of the S-ORS.
Also, we use a floating buoy to measure temperature, salinity, dissolved oxygen (DO), chlorophyll fluorescence, and photosynthetically active radiation (PAR) at the sea surface. An upward-looking 150 kHz acoustic Doppler current profiler (ADCP) is moored on the seafloor to observe vertical profiles of water currents and also for in-direct measurements of the vertical concentration of water particles. The ADCP is about 50-m away from the S-ORS to avoid artificial interference associated with the station’s infrastructure.
Ship-Based Annual Survey
To assess the spatial representativeness of the oceanic time series obtained from the S-ORS we have annually carried out a research cruise on board the R/V Onnuri of KIOST by crossing Yellow Sea via the KORS during the summer (see the cruise route on the map in Figure 1). During this survey, we have routinely collected primary production, hyperspectral radiance, ocean color, and hydrographic profiles using both an underway CTD and a typical CTD. During the 2019 cruise, an ocean acidification monitoring buoy and a directional waverider buoy are situated in the vicinity of the S-ORS.
Maintenance
After the few years of test operations of the S-ORS by KIOST, the Korea Hydrographic and Oceanographic Agency (KHOA) has been responsible for managing the S-ORS with the agreement and cooperation of KIOST. As expected from shallow water observations, biofouling has been an issue for the underwater instruments, particularly the conductivity and oxygen sensors. We have tried several experiments to mitigate this biofouling issue with anti-fouling measures using copper tape, a UV-light bulb, or both, however, the most practical solution until now is to clean the sensors as frequently as possible. At around one-month intervals, KHOA conducts regular maintenance of the sensors by cleaning and recalibration based on in situ CTD profiling and water sampling.
Data Distribution
The satellite antenna on the roof deck of the S-ORS transmits real-time measurements via the Mugungwha V communication satellite to the data storage server at KHOA. These real-time and delayed-mode datasets are publically serviced via the Korea Ocean Observation and Forecasting System (KOOFS) website of KHOA1. OceanSITES, a global network for time series measurements from stationary observations, recently accepted the S-ORS and the other KORS, as pilot stations on the continental shelf. We have prepared to distribute the delayed mode time series via the global data center (GDAC) of OceanSITES by following its standard nomenclature and flag system.
Selective Process Studies
Mixed Layer Depth and Air-Sea Interaction
An oceanic mixed layer modulates the exchange of heat, momentum, and biochemical compounds between the ocean and the atmosphere. Despite its implications for the marine ecosystem, air-sea interaction, and thus climate, the variability of the mixed layer is not well understood in the Yellow Sea, due to a scarcity of oceanic observations. Recently, the seasonal to daily variability of the mixed layer was investigated for April 21-October 15, 2015, using 10-minute interval CTD observations in tandem with atmospheric measurements from the atmospheric tower of the S-ORS (Kim et al., 2018a).
Three distinct periods comprising a fully-mixed stage until late April, a quasi-stable stage from late April to late July, and then a linearly falling stage at a rate of 2.6 m per month characterize the seasonal evolution of the mixed layer depth (MLD). This seasonal evolution was principally related to buoyancy forcing, particularly latent heat fluxes, which also had a gradually declining trend at a rate of −81.6 W/m2 per month during the MLD’s falling stage. On a shorter timescale, the MLD was significantly correlated with wind speed, except for the full-mixed stage. This MLD-wind relationship, however, was not stationary during our study period; a sharp drop of the correlations between the MLD and wind speed was estimated during middle July and middle August. During this period there were three heavy precipitation events – typhoons Chanhom, Halola, and Soudelor, passing near the S-ORS on July 12, July 28, and August 8, respectively. The rainfall on these three events was about a third of the total rainfall in 2015 near the S-ORS. The independent CTD casts during August 3-5 2015 revealed the existence of a 3 m-thick barrier layer over the mixed layer, indicating that heavy rainfall and its attendant freshwater runoffs from the surrounding rivers caused additional buoyancy forcing in the surface layer. This buoyancy seems to form a barrier layer in the lower part of the MLD. This barrier layer likely decoupled the mixed layer from atmospheric perturbation, resulting in reduced MLD variance to wind forcing (Kara et al., 2000; Kim et al., 2018a). These results highlight the role of atmospheric forcing on determining the MLD in the central Yellow Sea, as well as suggesting the possibility of a long-term monitoring study of air-sea interaction by the S-ORS.
Primary Production During the 2017 Spring Bloom
To understand phytoplankton bloom dynamics and thereby to access ecological implications in the Yellow Sea, scientists have conducted regular in situ measurements of chlorophyll fluorescence, PAR, hydrographic profiles, and irradiance at the S-ORS for more than six weeks from April to May. Also, we have obtained water samples at standard depths of 1, 10, 20, 30, 40 m, and at a depth of the subsurface chlorophyll maximum for the analysis of nutrients, chlorophyll-a, pigments, and the phytoplankton community structure, and primary production. In 2017, a spring bloom observation study was conducted for April 4-May 20. Concurrently, we collected total suspended particles (TSP) from the high volume aerosol sampler using Whatman 41 filter papers to understand the pollution levels associated with Asian dust (also known as yellow dust). The TSP samples were analyzed for 33 elements by ICP-MS after mixed acid decomposition.
The concentrations of chlorophyll-a, an indicator of phytoplankton biomass, varied 1.12∼7.38 μg/l, with its maximum on April 28. Consistently, the primary production ranged from 78 to 3,095 mgCm–2d–1 during the study period with a mean value of 974 mgCm–2d–1; its intrinsic variability coincided with the phytoplankton bloom. The biomass of phytoplankton and PAR were the main factors influencing the observed primary production. The observation that the population of nanoflagellates showed a significant correlation with the concentrations of chlorophyll-a indicates that the nanoflagellates were a dominant group in the observed spring blooms. Nitrate, phosphate, and silicate decreased continuously after April 5, while the N/P ratios showed a decreasing trend from the beginning of May. This discrepancy might indicate that the nitrate was one of the limiting factors for phytoplankton growth. Besides the general maximum phytoplankton bloom that occurred on April 28, two additional blooms existed during the study period. These ad hoc blooms seem to be related to the anthropogenic metals and surplus nutrients in the surface waters. The highest metal concentration for Al (5,041 ng/m3) was observed at the ad hoc blooms. Also, the enrichment factor of twelve elements of Se, Cd, Sb, As, Pb, Mo, Zn, Sn, V, Ni, Cu, and Tl in the TSP samples was more than ten. These observations demonstrate that anthropogenic pollution-derived particles were dominant during those periods. These preliminary results seem to demonstrate that the primary productivity in the central Yellow Sea is, at least in part, influenced by surplus metal inputs associated with Asian dust originating from the continent.
Surface Wave
The S-ORS is an adequate research site for investigating wave-current interactions because of not only tidal currents as strong as 1 m/s but also the stability of this station, on which there are no significant fluctuations even in conditions with high waves and strong winds. A stereo wave imaging system on the S-ORS produced a high-quality time sequence of spatial wave images. Benetazzo et al. (2018) utilized these images to investigate the characteristic spatiotemporal length scales of linear and non-linear rogue waves, their power spectrum in a 3-D wavenumber and frequency domain, and the probability of the occurrence of a rogue wave. They argued that the rogue waves occurred ten times more frequently, i.e., one out of a hundred waves, than expected from a theoretical wave model in this study area. This stereo wave imaging system was moved to the G-ORS, where the tidal currents are much stronger than those near the S-ORS; hence, more frequent non-linear rogue waves are expected.
Validation of the Satellite Ocean Color and Operational Ocean Forecasting
An AERONET-OC spectrometer is installed on an extended steel frame on the southwest corner of the main deck, thus monitoring the radiance from the sea surface, including ocean color information without any structural interference. These data, currently serviced via the NASA website2, have been used to validate the ocean color estimated by the GOCI satellite (Kim et al., 2015; Concha et al., 2019).
The Korea Operational Oceanography System (KOOS) has worked to provide a 72-hour forecast of ocean states in terms of sea surface elevation, currents, winds, waves, hydrographic profiles in the seas around the Korean Peninsula. This system consists of various numerical models from atmospheric to oceanic models including Weather Research and Forecasting (WRF), KOOS-OPEM, Coastal KOOS, and a Simulating Waves Nearshore (SWAN) model. The KOOS takes advantage of the observed time series of water temperature, winds, and waves from the KORS for its skill assessment (Park et al., 2015). Intermittent experiments have been conducted near the S-ORS during the annual ship-based surveys by deploying various surface drifts equipped with GPS tracking systems. Choi et al. (2018) utilized drift information to validate the currents forecasted by the KOOS, hence trying to provide precise information to the Korea coast guard in the perspective of maritime search and rescue operation.
The Next Steps
The KIOST has plans to maximize the performance of the S-ORS, as well as to facilitate process studies as follows:
• Automatic and unmanned mobile vehicles including underwater gliders, AUVs, and airborne drones will be operated between the KORS to cover large areas of the Yellow Sea. The KORS can host these vehicles as docking and charging stations. The S-ORS will play a critical role as a testbed for these mobile observations.
• Real-time monitoring and near-future forecasting are needed for governments and relevant stakeholders for proactive approaches toward maritime accidents, red tides, hypoxia, typhoon, surge, marine pollution, etc. We plan to assimilate high-resolution spatiotemporal observations from both the KORS and mobile vehicles into the KOOS to improve the accuracy of prediction and service realistic oceanic fields, thus finally constructing a comprehensive ocean observation and prediction system in the Yellow Sea.
• As a shallow-water pilot station of OceanSITES, the S-ORS will be a local contributor to global collaborative studies. A research group that wants to take advantage of the S-ORS as well as its lab space is welcomed to contact the PI or coordinator of the KORS project to specify the experimental contents under a scientific theme to maximize its utilization.
Concluding Remarks
The S-ORS has provided high-quality, continuous time-series data for multi-disciplinary studies in the central Yellow Sea, including meteorological, physical, and biogeochemical data from more than forty sensors and research facilities. These data should be essential for researchers to understand better regional ecosystems, as well as for governments to have a proactive approach toward maritime issues. This station is designed to work for at least 50 years, thus able to provide data for comprehensive, interdisciplinary studies on climate change, as well as regional phenomena in the Yellow Sea. The S-ORS has sufficient research facilities that include a wet lab for staying scientists to experiment with real-time time series and in situ water samples. A research group can also bring their instruments or sensors to this platform for collaborating studies. As per rapidly developing intellectual and communication technologies in the oceanic observation field, the S-ORS aims to become a more automated ocean observation platform. Unmanned autonomous vehicle operations have been tested for several years to integrate temporal and spatial observations with the operational, ocean forecasting system. The S-ORS has hosted multiscale process studies as an open lab and as a local contributor to international collaborative studies.
Author Contributions
J-YJ led the writing of this manuscript. YK and J-YJ wrote the manuscript based on the reports from JN, K-TK, and J-IK. J-YJ, YK, and YM generated figures and associated text. CJ contributed to the editing and organization of the manuscript. JN, K-TK, JJ, JL, I-KM, and JK conducted in situ observations on the S-ORS and processed the time series data. J-SS and D-SB edited the manuscript by providing corrections and clarifications. All authors reviewed the final version of this manuscript and approved it for publication.
Funding
The scientific resources and preparation of this manuscript were primarily funded by the Ministry of Oceans and Fisheries, South Korea, as a part of the projects entitled “Construction of Ocean Research Stations and their Application Studies” and “Improvements of ocean prediction accuracy using numerical modeling and artificial intelligence technology.” CJ was supported by China Korea Joint Ocean Research Center via the project entitled “Northwestern Pacific Climate Change and Its Prediction”. YK acknowledges the support from a KIOST in-house grant (PE99711).
Conflict of Interest
The authors declare that the research was conducted in the absence of any commercial or financial relationships that could be construed as a potential conflict of interest.
Acknowledgments
We would like to thank the many scientists, engineers, and technicians who have worked on the Korea Ocean Research Stations (KORS) program. We are grateful to the technical staffs at the Korea Hydrographic Observation Agency for the maintenance and operation of the KORS, as well as to the members of OceanSITES for their constructive helps for the KORS.
Footnotes
References
Belkin, I. M. (2009). Rapid warming of large marine ecosystems. Prog. Oceanogr. 81, 207–213. doi: 10.1016/j.pocean.2009.04.0119
Benetazzo, A., Bergamasco, F., Yoo, J., Cavaleri, L., Kim, S.-S., Bertotti, L., et al. (2018). Characterizing the signature of a spatio-temporal wind wave field. Ocean Model. 129, 104–123. doi: 10.1016/j.ocemod.2018.06.007
Cai, R., Tan, H., and Kontoyiannis, H. (2017). Robust surface warming in offshore China Seas and its relationship to the East Asian Monsoon wind field and ocean forcing on interdecadal time scales. J. Clim. 30, 8987–9005. doi: 10.1175/JCLI-D-16-0016.1
Cavaleri, L. (2000). The oceanographic tower Acqua Alta—activity and prediction of sea states at Venice. Coast. Eng. 39, 29–70. doi: 10.1016/S0378-3839(99)00053-8
Choi, J.-W., Kwon, J.-I., Heo, K.-Y., Park, K.-S., and Choi, J.-Y. (2018). Accuracy improvement of particle-tracking simulation considering wind speed using various drift objects. J. Coast. Res. 85, 901–905. doi: 10.2112/si85-181.1
Concha, J., Mannino, A., Franz, B., Bailey, S., and Kim, W. (2019). Vicarious calibration of GOCI for the SeaDAS ocean color retrieval. Int. J. Remote Sens. 40, 3984–4001. doi: 10.1080/01431161.2018.1557793
Ha, K.-J., Nam, S., Jeong, J.-Y., Moon, I.-J., Lee, M., Yun, J., et al. (2019). Observations utilizing Korean ocean research stations and their applications for process studies. Bull. Am. Meteorol. Soc. doi: 10.1175/BAMS-D-18-0305.1
Kara, A. B., Rochford, P. A., and Hurlbutt, H. E. (2000). Mixed layer depth variability and barrier layer formation. J. Geophys. Res. 105, 16783–16801. doi: 10.1029/2000jc900071
Kim, J., Yang, H., Choi, J.-K., Moon, J.-E., and Frounin, R. (2015). Estimating photosynthetically available radiation from geostationary ocean color imager (GOCI) Data. Korean J. Remote Sens. 32, 253–262. doi: 10.7780/kjrs.2016.32.3.5
Kim, Y. S., Jang, C. J., Jeong, J.-Y., and Shim, J.-S. (2018a). Daily to seasonal variability of the mixed layer depth in the central Yellow Sea: effects of atmospheric forcing. J. Coast. Res. 85, 576–580. doi: 10.2112/si85-116.1
Kim, Y. S., Jang, C. J., and Yeh, S. W. (2018b). Recent surface cooling in the Yellow and East China Seas and the associated North Pacific climate regime shift. Cont. Shelf Res. 156, 43–54. doi: 10.1016/j.csr.2018.01.009
Liao, E., Lu, W., Yan, X.-H., Jiang, Y., and Kidwell, K. (2015). The coastal ocean response to the global warming acceleration and hiatus. Sci. Rep. 5:16630. doi: 10.1038/srep16630
Min, Y. C., Jeong, J.-Y., Min, I.-K., Kim, Y. S., Shim, J.-S., and Do, K. (2018). Enhancement of wave radar observation data quality at the Socheongcho Ocean Research Station. J. Coast. Res. 85, 571–575. doi: 10.2112/SI85-115.1
Park, K. S., Heo, K. Y., Jun, K., Kwon, J. Il, Kim, J., Choi, J. Y., et al. (2015). Development of the operational oceanographic system of Korea. Ocean Sci. J. 50, 353–369. doi: 10.1007/s12601-015-0033-1
Xie, S.-P., Hafner, J., Tanimoto, Y., Liu, W. T., Tokinaga, H., and Xu, H. (2002). Bathymetric effect on the winter sea surface temperature and climate of the Yellow and East China Seas. Geophys. Res. Lett. 29:24228. doi: 10.1029/2002GL015884
Keywords: Socheongcho Ocean Research Station (S-ORS), multi-disciplinary observation, long-term time series, steel-framed platform, continental shelf, OceanSITES
Citation: Kim YS, Jang CJ, Noh JH, Kim K-T, Kwon J-I, Min Y, Jeong J, Lee J, Min I-K, Shim J-S, Byun D-S, Kim J and Jeong J-Y (2019) A Yellow Sea Monitoring Platform and Its Scientific Applications. Front. Mar. Sci. 6:601. doi: 10.3389/fmars.2019.00601
Received: 15 November 2018; Accepted: 11 September 2019;
Published: 18 October 2019.
Edited by:
Amos Tiereyangn Kabo-Bah, University of Energy and Natural Resources, GhanaReviewed by:
Dong-Young Lee, Ocean University of China, ChinaTom Trull, Commonwealth Scientific and Industrial Research Organisation (CSIRO), Australia
Johannes Karstensen, GEOMAR Helmholtz Centre for Ocean Research Kiel, Germany
Copyright © 2019 Kim, Jang, Noh, Kim, Kwon, Min, Jeong, Lee, Min, Shim, Byun, Kim and Jeong. This is an open-access article distributed under the terms of the Creative Commons Attribution License (CC BY). The use, distribution or reproduction in other forums is permitted, provided the original author(s) and the copyright owner(s) are credited and that the original publication in this journal is cited, in accordance with accepted academic practice. No use, distribution or reproduction is permitted which does not comply with these terms.
*Correspondence: Jin-Yong Jeong, anlqZW9uZ0BraW9zdC5hYy5rcg==