 Yvonne Barkley
 Erin M. Oleson
 Julie N. Oswald
 Erik C. Franklin
- 1Hawai’i Institute of Marine Biology, School of Ocean and Earth Science and Technology, University of Hawai’i at Mānoa, Kāne‘ohe, HI, United States
- 2Protected Species Division, Pacific Islands Fisheries Science Center, National Marine Fisheries Service, National Oceanic and Atmospheric Administration, Honolulu, HI, United States
- 3Scottish Oceans Institute, University of St. Andrews, St. Andrews, United Kingdom
Cetaceans are ecologically important marine predators, and designating individuals to distinct populations can be challenging. Passive acoustic monitoring provides an approach to classify cetaceans to populations using their vocalizations. In the Hawaiian Archipelago, three genetically distinct, sympatric false killer whale (Pseudorca crassidens) populations coexist: a broadly distributed pelagic population and two island-associated populations, an endangered main Hawaiian Islands (MHI) population and a Northwestern Hawaiian Islands (NWHI) population. The mechanisms that sustain the genetic separation between these overlapping populations are unknown but previous studies suggest that the acoustic diversity between populations may correspond to genetic differences. Here, we investigated whether false killer whale whistles could be correctly classified to population based on their characteristics to serve as a method of identifying populations when genetic or photographic-identification data are unavailable. Acoustic data were collected during line-transect surveys using towed hydrophone arrays. We measured 50 time and frequency parameters from whistles in 16 false killer whale encounters identified to population and used those measures to train and test random forest classification models. Random forest models that included three populations correctly classified 42% of individual whistles overall and resulted in a low kappa coefficient, κ = 0.15, indicating low agreement between models, and the true population. Whistles from the MHI population showed the highest correct classification rate (52%) compared to pelagic and NWHI whistles (42 and 36%, respectively). Pairwise random forest models classifying pelagic and MHI whistles proved slightly more accurate (62% accuracy, κ = 0.24), though a similar pelagic-NWHI model did not (56% accuracy, κ = 0.12). Results suggest that the time-frequency whistle characteristics are not suitable to confidently classify encounters to a specific false killer whale population, although certain features of whistles produced by the endangered MHI population allow for overall higher classification accuracy. Inclusion of other vocalization types, such as echolocation clicks, and alternative whistle variables may improve correct classification success for these sympatric populations.
Introduction
Cetaceans are top predators widely distributed throughout the world’s oceans and can play specific roles in maintaining ecosystem function and structure due to their higher trophic level (Estes et al., 1998; Roman and McCarthy, 2010; Roman et al., 2014). Changes to their abundance and distributions have cascading effects that affect complex interactions between multiple trophic levels within the oceanic food web (Heithaus et al., 2008; Baum and Worm, 2009; Estes et al., 2011; Kiszka et al., 2015). Conservation and management efforts for cetaceans are complicated by the inherent challenges associated with studying animals that live primarily underwater. Most statistical analyses for estimating cetacean density, abundance, and distribution only include data collected by visual observers (Buckland et al., 2001; Durban et al., 2005; Palacios et al., 2013; Urian et al., 2015; Bradford et al., 2017). Visual observations contribute valuable information about cetacean distribution, abundance, and population structure, but poor weather conditions, lack of daylight, and high sea state can limit their effectiveness (Barlow et al., 2001; Barlow, 2015). Some species are also missed by visual observers due to long dive periods or cryptic surface behavior, which then biases the statistical results (Buckland, 2004).
Fortunately, various research tools have emerged to improve empirical data collection for cetaceans, such as unmanned aerial vehicles (UAVs; Aniceto et al., 2018; Torres et al., 2018), satellite and multisensory tags (Woodworth et al., 2012; Citta et al., 2017), and passive acoustic monitoring (PAM; Mellinger et al., 2007; Van Parijs et al., 2009; Bittle and Duncan, 2013). PAM methods are complementary to visual observer methods during shipboard line-transect surveys (Evans and Hammond, 2004; Barlow and Taylor, 2005; Rankin et al., 2008) and do not depend on weather or daylight, nor do they require direct interactions with the animals. Current PAM technology can record all frequencies of known cetacean vocalizations, offering an alternative method for assessing cetacean biodiversity, distribution and occurrence patterns, and behavior.
Acoustic-based detection and classification methods continue to improve for many cetacean species (Charif and Clark, 2009; Delarue et al., 2009; Roch et al., 2011; Baumann-Pickering et al., 2013; Rankin et al., 2017). Many dolphin species can be identified based on characteristics of their whistle and click vocalizations, and in some cases, population-level differences are evident (Rendell et al., 1999; Oswald et al., 2007; Soldevilla et al., 2008; Gannier et al., 2010; Azzolin et al., 2014; Baumann-Pickering et al., 2015). For example, dolphin whistles vary geographically in many species, including striped dolphins (Stenella coeruleoalba), short-beaked common dolphins (Delphinus delphis), Guiana dolphins (Sotalia guianensis), common bottlenose dolphins (Tursiops truncatus), and Indo-Pacific bottlenose dolphins (Tursiops aduncas) with variation found in duration, number of contour inflections points, and the beginning or maximum frequency of whistles (Morisaka et al., 2005; Rossi-Santos and Podos, 2006; May-Collado and Wartzok, 2008; Azzolin et al., 2013; Papale et al., 2013a). Killer whales (Orcinus orca) in the temperate coastal waters of the eastern North Pacific have sympatric ecotypes with corresponding differences in vocal repertoires between social groups (Ford, 1991; Yurk et al., 2002; Saulitis et al., 2005; Deecke et al., 2010; Riesch and Deecke, 2011). Methods to acoustically distinguish reproductively and socially isolated sympatric dolphin populations, such as killer whales, are useful for assessing the population status of these highly mobile marine predators. Differentiation in dolphin whistle characteristics between and within dolphin populations suggest fine-scale adaptations may be driven by different context-specific factors, such as environmental conditions, behavioral states, group composition, or ambient noise levels (Norris et al., 1994; Nowacek, 2005; Oswald et al., 2008; Henderson et al., 2012). False killer whales, Pseudorca crassidens, (Owen, 1846) are a large, highly social dolphin found throughout tropical and semi-tropical waters. In the Hawaiian Archipelago, three genetically differentiated populations of false killer whales are recognized and managed, including a pelagic population dispersed throughout offshore waters, an insular population associated with the Northwestern Hawaiian Islands (NWHI), and an endangered insular population associated with the main Hawaiian Islands (MHI) (Baird et al., 2008, 2013; Chivers et al., 2010; Martien et al., 2014). Abundance estimates for the pelagic, NWHI, and MHI populations indicate population sizes of 1,540, 617, and 167 individuals, respectively (Bradford et al., 2015, 2018). Several years of photo-identification data coupled with genetic analyses and telemetry data from satellite-tagged individuals suggest the populations are demographically independent and do not readily interbreed despite overlapping habitat use (Baird et al., 2010; Martien et al., 2014; Baird, 2016), including areas where the pelagic population overlaps with both island-associated populations and an offshore area near Kauai where all three populations overlap (Bradford et al., 2015). Additionally, individuals from the MHI population associate at a finer scale in five social clusters that also overlap in their habitat ranges with some genetic differentiation (Baird et al., 2012; Martien et al., 2014; pers. comm. R. Baird, October 12, 2018). The mechanisms maintaining the separation between and within these disparate, yet overlapping, populations are unknown.
The three Hawaiian false killer whale populations face threats from multiple human activities, including fisheries interactions (Shallenberger, 1981; Nitta and Henderson, 1993; Baird and Gorgone, 2005; Forney et al., 2011). False killer whales primarily feed on fish and squid, and many of the same fish species are also targeted by Hawaii-based fisheries (Baird, 2009, 2016). Interactions between the longline and other hook-and-line fisheries and Hawaii’s false killer whales have been documented for decades and lead to death or serious injuries of individuals incidentally hooked or entangled (Baird and Gorgone, 2005; Gilman et al., 2006; Baird et al., 2014; Bradford and Forney, 2014; Bradford and Lyman, 2018). The currently estimated ranges of all three of the Hawaiian populations overlap the commercial longline fisheries and recreational fisheries (Bradford et al., 2015; Bayless et al., 2017). As long as the Hawaii-based fisheries continue to target the same fish species as false killer whales and the full ranges of the false killer whale populations are uncertain, these marine predators remain at risk.
Because of human-caused threats to this species, and given the endangered status of the MHI population (Oleson et al., 2010), it is critical to track false killer whale abundance in Hawaiian waters at the population level. False killer whales are primarily monitored by collecting abundance and distribution data during shipboard visual and acoustic line-transect surveys but require genetic samples and photo-identification data to confirm the population identity of sighted individuals, data which are often unavailable due to the challenges inherent to sampling cetaceans. Hawaiian false killer whales are particularly challenging to study due to their low densities, dispersed subgrouping behavior, and tendency to approach research vessels from behind (Bradford et al., 2014). Fortunately, they are vocally active, commonly detected using PAM methods during line-transect surveys (Barlow and Rankin, 2007; Bradford et al., 2014) and their whistles can be classified correctly to species with a high level of certainty compared to other dolphin species (Oswald et al., 2007; Barkley et al., 2011). No studies have examined and compared the characteristics of each Hawaiian false killer whale population’s whistle repertoire. If population-level differences exist between the whistles of the different populations, PAM could provide a method for determining their abundance, ranges, and occurrence patterns.
In this study, we examine the variation in whistle characteristics between and within the three Hawaiian Islands false killer whale populations and build classification models utilizing random forest (RF) classification methods (Breiman, 2001; Liaw and Wiener, 2002). Advancing PAM methods to identify populations of marine predators enhances our ability to address more complex research questions to further understand the distributions and ecological roles of cetacean populations for more robust management and conservation (Fleming et al., 2018; von Benda-Beckmann et al., 2018).
Materials and Methods
Data Collection
Acoustic recordings and visual sighting data were collected during several line-transect cetacean abundance surveys conducted by the Pacific Islands Fisheries Science Center (PIFSC) of the National Oceanic and Atmospheric Administration (NOAA) aboard the NOAA Ship Oscar Elton Sette in 2012, 2013, and 2016. This study also included data from surveys organized by PIFSC and the NOAA Southwest Fisheries Science Center (SWFSC) in 2010 and 2017. All efforts used consistent protocols to search for cetaceans and collect sighting data, methods developed by SWFSC in the 1980s (Kinzey et al., 2000; Bradford et al., 2017). In brief, three marine mammal observers searched for cetaceans 180° forward of the ship from the flying bridge. The port and starboard observers used 25 × 150 binoculars and the third observer in the center searched with unaided eyes or 7× binoculars and acted as the data recorder. When cetaceans were sighted within 5.6 km (3 nmi) of the transect line, the ship diverted from the transect line to estimate group size and identify the species present. A small boat was launched on some cetacean groups to collect photo-identification images, biopsy samples, and deploy satellite telemetry tags when possible.
Continuous acoustic recordings were collected during daylight hours using custom-built hydrophone arrays towed at approximately 4–10 m deep, 300 m behind the ship while traveling at 18.5 km/h (10 kt). Trained acousticians monitored the hydrophones aurally with headphones and visually using spectrographic software (ISHMAEL, Mellinger, 2002; PAMGuard, Gillespie et al., 2008). When cetacean vocalizations were detected, a phone-pair bearing algorithm in ISHMAEL or PAMGuard was used to calculate the direction of the sound source relative to the bow of the ship. These bearings were plotted using a mapping software with a GPS interface, either Whaltrak or PAMGuard, and target motion analysis was used to localize the animals based on the convergence of plotted bearings with left/right ambiguity. The ambiguity in the acoustic location estimate was often resolved either by turning the ship or matching the bearings to an associated sighting by the visual observers (Rankin et al., 2008). Each survey used a different array of hydrophones made up of 4–7 hydrophone elements from various manufacturers, but all had a flat frequency response from 2 kHz to at least 40 kHz and acoustic data were digitized with sampling rates of 192 or 500 kHz, providing sufficient bandwidth for capturing dolphin whistles in their entirety (Table 1).
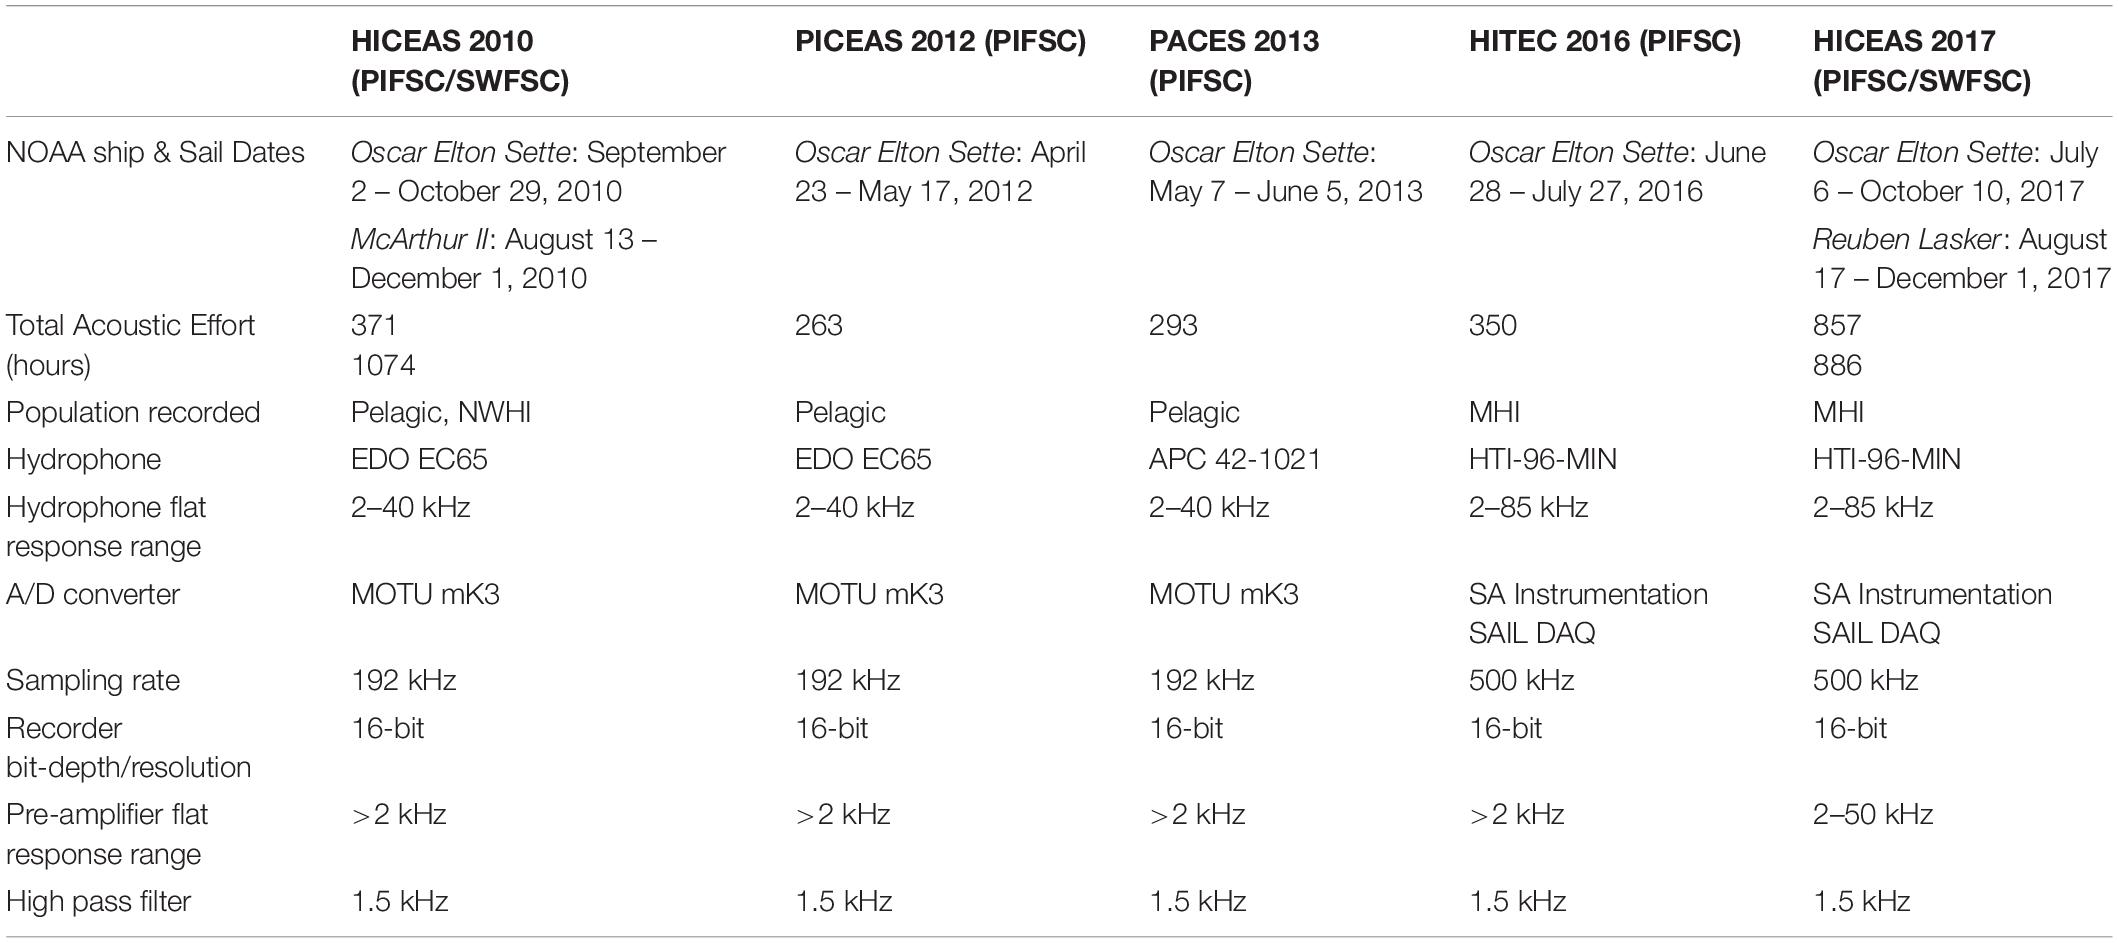
Table 1. Specifications of towed hydrophone array data collected during each survey.
A two-phase protocol specific to false killer whale sightings and acoustic detections was developed to reduce bias in abundance estimates introduced by their subgrouping behavior (Bradford et al., 2014; Yano et al., 2018). All acoustic recordings included in this analysis were collected during the first phase, when the ship traveled in a straight line through the entire false killer whale group. Visual observers estimated the number of individuals in the group (when possible), their initial behavior, and identified the group to the level of species and population (pelagic, NWHI, and MHI) using photo-identification analysis, genetic analysis, and/or satellite telemetry data.
Whistle Selection and Measurement
Acoustic recordings of false killer whales were organized into acoustic encounters, defined as the total length of recording time during the first phase of the associated false killer whale sighting. Recordings were decimated to 192 kHz to maintain consistency in measurements for all surveys. An equal subset of whistles from each acoustic encounter was randomly selected to avoid oversampling individuals and obtain a representative sample of whistle characteristics across the populations. The number of whistles selected for each subset was determined by considering prior whistle classification studies in which total selected whistles ranged between 35 and 811 whistles per acoustic encounter (Bazúa-Durán and Au, 2004; Oswald et al., 2007; May-Collado and Wartzok, 2008) and the constraints of this data set. Initially, we selected 100 whistles per encounter based on the acoustic encounter with the shortest duration (3540 s), which equaled approximately one whistle every 35 s. Selected whistles had signal-to-noise ratios ranging from 0.5 to 8.8 dB and all had clearly visible continuous contours and distinct start and end frequencies for accurate measurement of whistle variables. The recordings were partitioned into 100 equal time increments (in seconds) and the first clear whistle was selected from a spectrogram of each time increment using Raven Pro (4096 FFT, Hann window, 50% overlap, version 1.5; Bioacoustics Research Program, 2017). If a time increment did not include whistles, a whistle was chosen from a different, randomly selected, time increment. Fifty additional whistles were included from randomly selected time increments to increase the sample size for each acoustic encounter.
After whistles were selected and annotated using Raven Pro, whistle contours were manually traced from spectrograms (4096 FFT, Hann window, 50% overlap) using the Real-time Odontocete Call Classification Algorithm (ROCCA) module (Oswald and Oswald, 2013) within PAMGuard (version 1.15.1; Gillespie et al., 2008). ROCCA contains several semi-automated whistle classifiers, including one for eight delphinid species recorded in the eastern tropical Pacific Ocean with particularly high accuracy for false killer whales (Barkley et al., 2011). ROCCA automatically measures 50 time and frequency measurements from traced whistle contours, which can be used in other analyses (Table 2; Oswald, 2013).
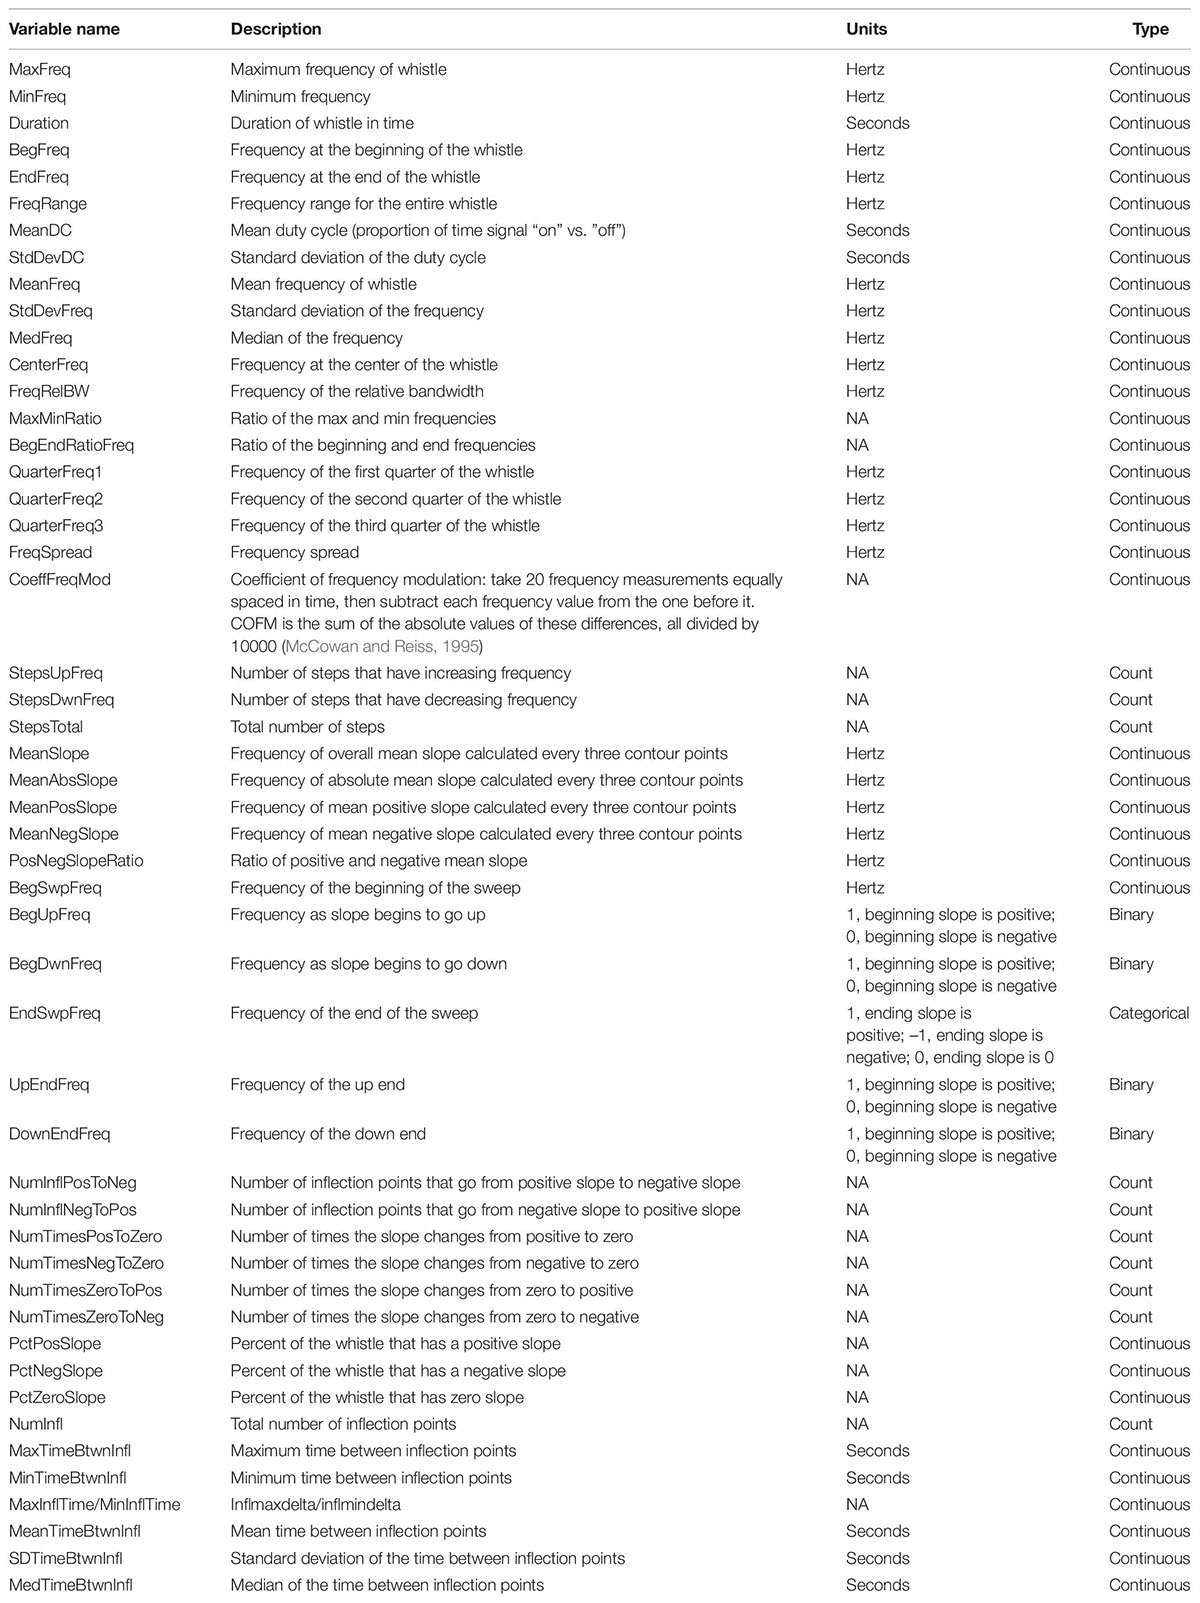
Table 2. Fifty time and frequency whistle variables measured by the real-time odontocete call classification algorithm (ROCCA) were considered in the random forest models.
Model Configuration
The 50 whistle measurements from ROCCA were used as the predictor variables in RF classification models (Breiman, 2001; Liaw and Wiener, 2002) to test whether the three false killer whale populations could be distinguished based on their whistles. The RF algorithm is a non-parametric statistical method capable of modeling complex interactions among ordinal and nominal predictor variables (Cutler et al., 2007). The RF models are an ensemble of decision trees designed to recursively partition data based on the values of the predictor variables (e.g., whistle measurements). Decision trees are grown from a bootstrap sample of the model data with approximately 1/3 of the data omitted as the out-of-bag (OOB) sample for cross-validating the classification accuracy of the model (Efron and Tibshirani, 1997). At each node, predictor variables are selected from a random subset of the predictor variables to split the data into the most homogeneous daughter nodes until the trees are grown to their maximum depth. Data are classified to a target variable (e.g., population) based on the majority vote of the predictions of all trees. The output of RF models includes variable importance measures, a ranking of the predictor variables based on their importance in predicting the outcome. We calculated variable importance as the mean decrease in accuracy (MDA) by permuting each variable and comparing the OOB error rates of the model before and after permutation. Here, RF classification models were developed in the R programing environment (version 3.5.2; R Core Team, 2018) using the randomForest package (version 4.6-14; Liaw and Wiener, 2002).
We developed two RF model configurations to classify the whistle measurement data: one configuration incorporated all false killer whale populations (RF_PNM) and the second configuration was composed of pairwise models incorporating only two populations. The pairwise configurations only applied to regions of the archipelago assumed to be inhabited by two of the three populations, resulting in two pairwise RF models: one for the pelagic and insular northwest Hawaiian populations (RF_PN) and the other for the pelagic and insular main Hawaiian populations (RF_PM). We assumed that no region existed in the archipelago inhabited by only the insular MHI and insular NWHI populations.
Figure 1 provides a schematic diagram detailing the sampling and processing procedures of the whistle measurement data to configure each RF model. For each RF model, an equal number of acoustic encounters (including all 150 whistles) were randomly selected from each population. Next, we performed a correlation analysis on the data to measure the linear dependence between pairs of whistle variables, removing variables if the Pearson’s correlation coefficient exceeded ±0.8. Typically, model overfitting due to correlation does not occur with RFs (Cutler et al., 2012). However, studies have shown that correlated variables strongly bias the ranking of important variables, making it difficult to interpret the results (Strobl et al., 2008; Gregorutti et al., 2017). The subset of whistle data with uncorrelated variables was then partitioned by acoustic encounter into independent training and test data sets for each population, with 75% of the acoustic encounters included in the training data and 25% included in the test data. The RF model configurations include two parameters that can be adjusted to achieve the highest accuracy rate from the model training data: the number of variables randomly selected at each node (mtry) and the number of trees in the forest (ntree). The number of variables was set to the default (the square root of the total number of whistle measurements) and the number of trees was optimized. Optimized RF models sampled 100 different combinations of acoustic encounters (with replacement) to train and test the model configurations and obtain average classification rates.
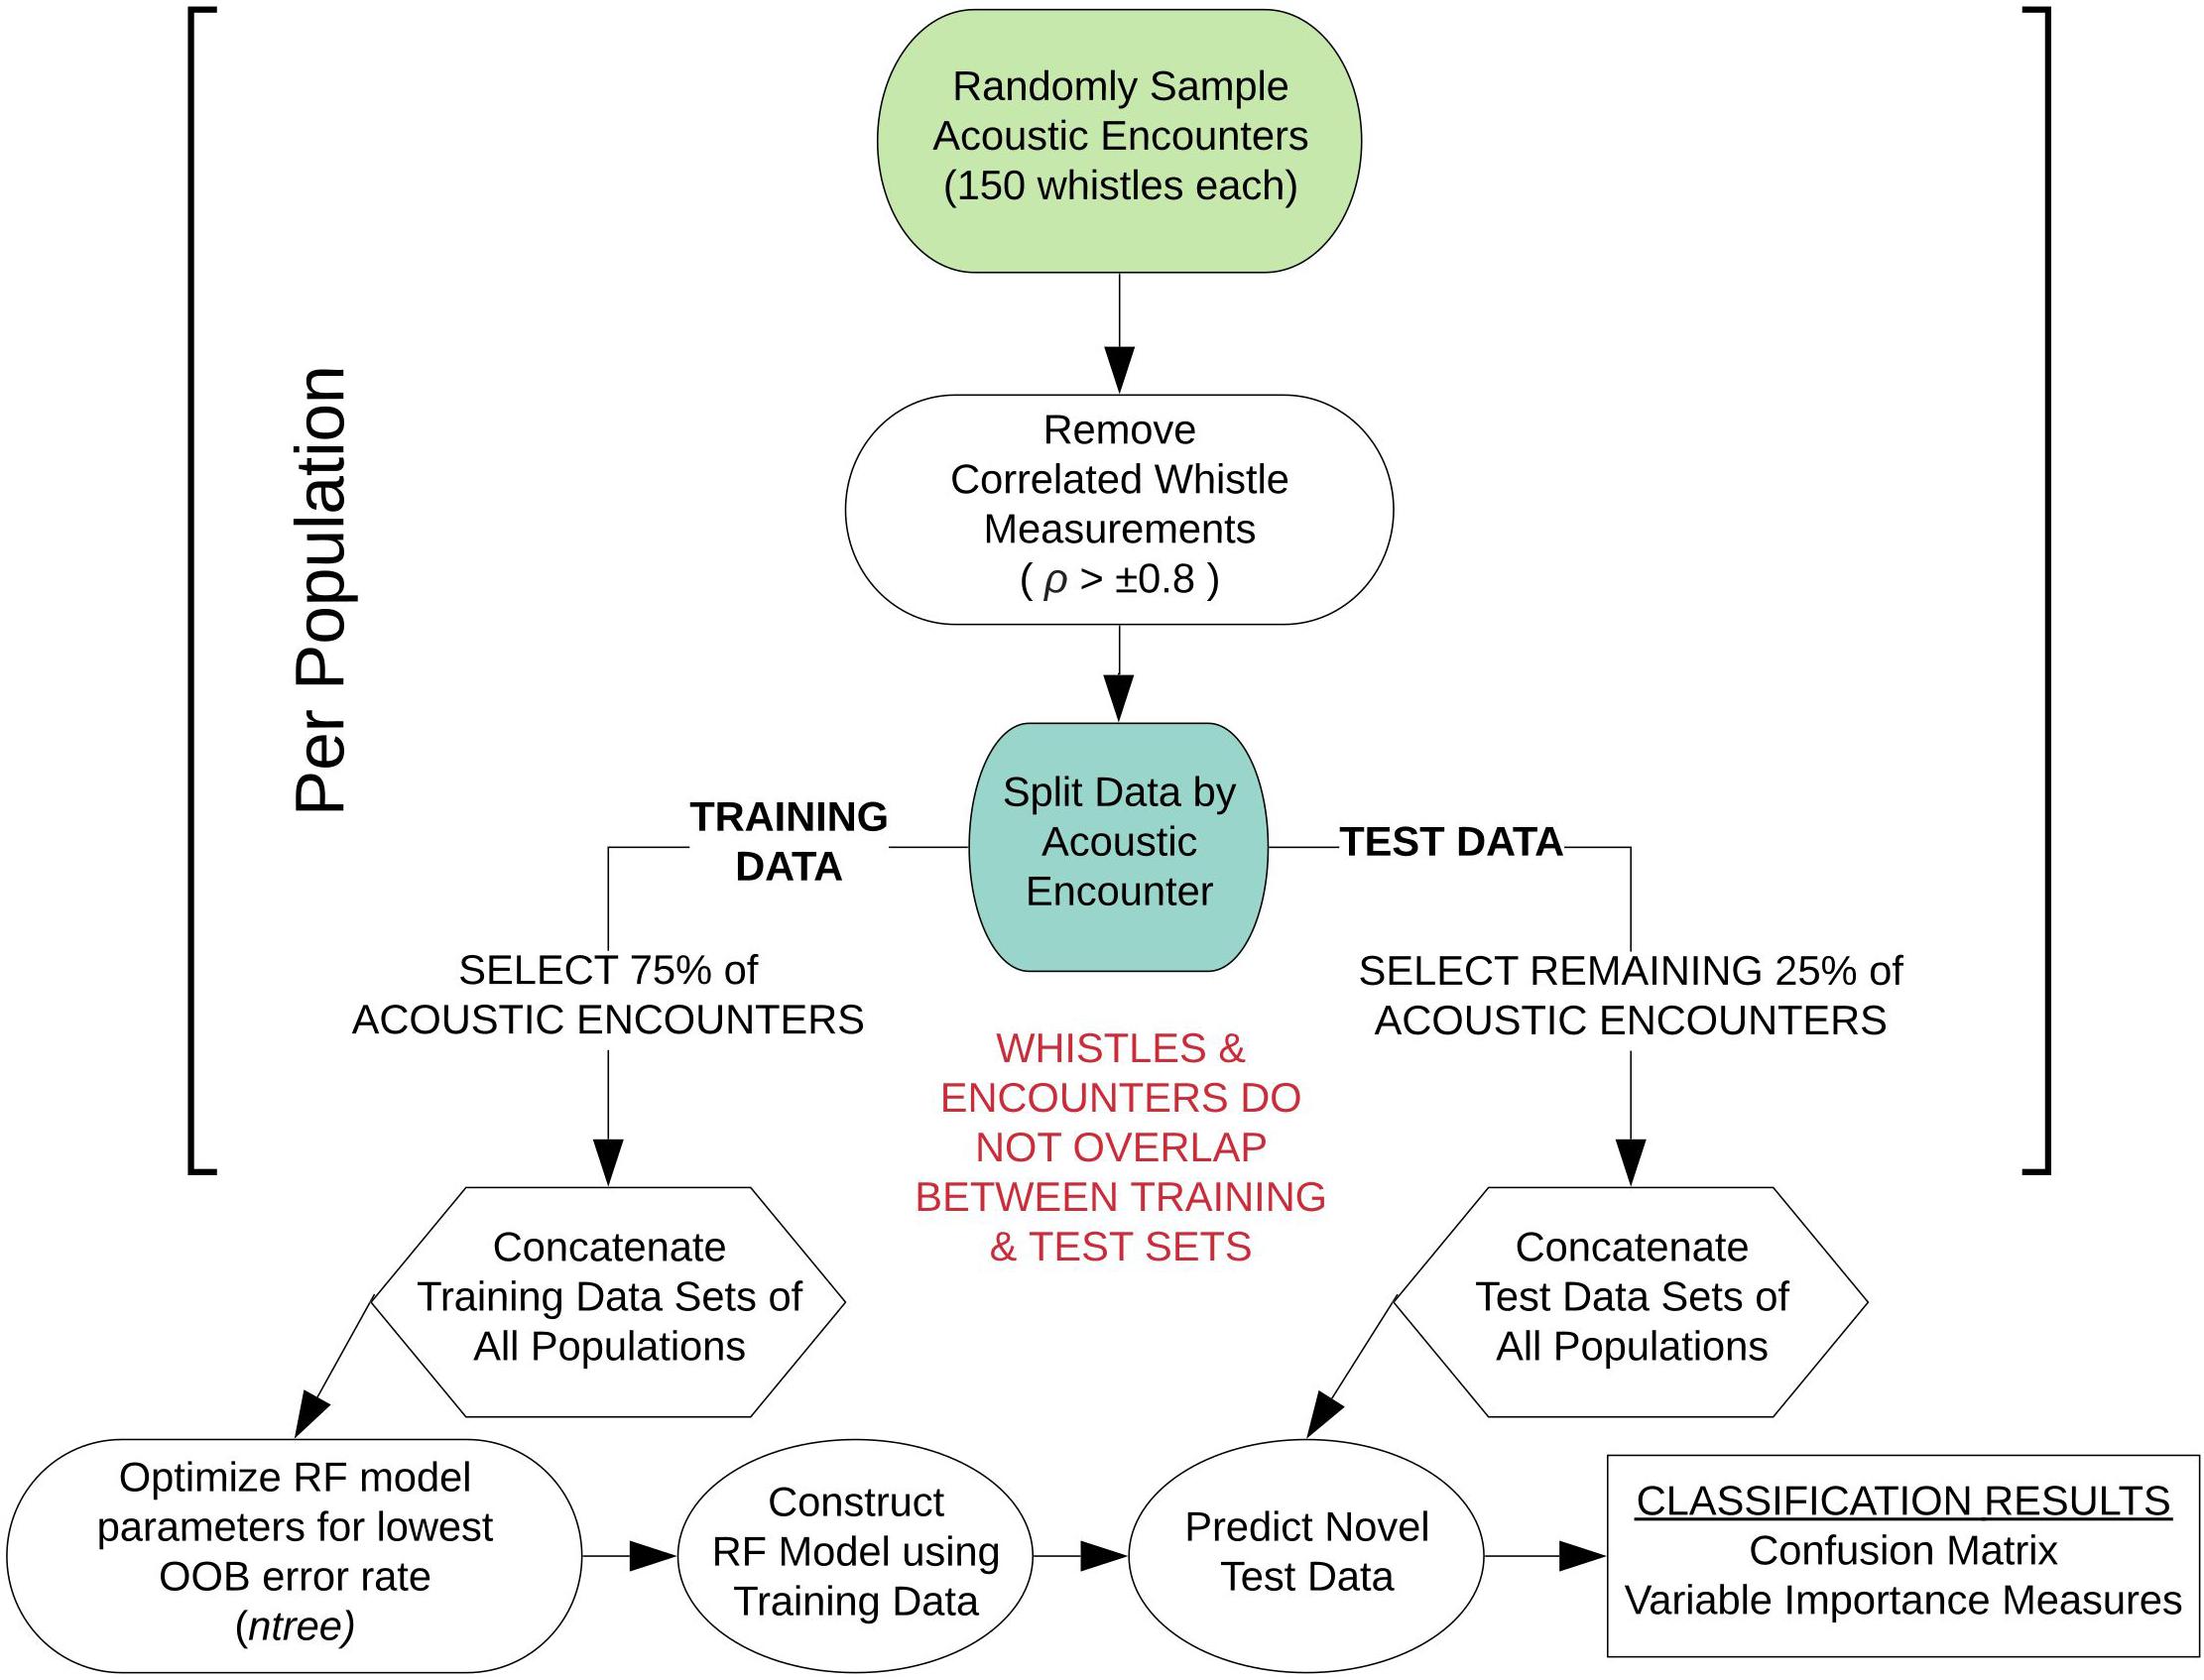
Figure 1. Schematic diagram outlining the modeling approach for sub-sampling the whistle measurement data for each random forest model configuration. This workflow was performed 100 times for each model configuration.
The RF models used the whistle measurement data to classify individual whistles to a population to obtain overall classification rates. Then, since the MHI population associates in social clusters and any form of stable social groups are unconfirmed for the pelagic and NWHI populations, we also examined the variability of whistle measurements within populations in two ways. First, whistles were classified to a given acoustic encounter instead of a population by creating separate RFs per population using the same steps described for classifying individual whistles to a population. Second, acoustic encounters were classified to a population based on the majority of individual whistle classifications within encounters.
Model Evaluation
Classification results for all RF models were summarized in confusion matrices, which included the proportion of correctly and incorrectly classified whistles by population. Cohen’s Kappa statistic, κ, was calculated to evaluate model performance by comparing the classification results of the test data (observed accuracy) to random chance (expected accuracy) (Cohen, 1960). The strength of agreement for κ coefficients is outlined by Landis and Koch (1977) as the following: 0.01–0.20 slight, 0.21–0.40 fair, 0.41–0.60 moderate, 0.61–0.80 substantial, and 0.81–100 nearly perfect. This is a statistic originally used to measure interrater reliability, but is also commonly used for evaluating results of machine learning classification methods as a more informative metric as it accounts for random chance versus only reporting the observed accuracy (Titus et al., 1984; Garzón et al., 2006; Cutler et al., 2007; García et al., 2009).
Variable importance was measured using the mean decrease in accuracy calculated by permuting each variable in the RF model and comparing OOB accuracies for models with and without permutation. We summarized variable importance using the minimum, maximum, and median MDAs for the 10 most important variables from all iterations of each model configuration to better understand which variables contributed the most to the classification results. Pairwise Kolmogorov-Smirnov tests compared cumulative frequency distributions of the most important whistle variables to examine which whistle characteristics significantly differed between populations.
Results
A total of 40.7 h of recordings were analyzed from 16 acoustic encounters of false killer whales identified to a population using visual observer data, including 8 encounters for the pelagic population and 4 encounters for each of the NWHI and MHI populations (Figure 2). Initial behaviors of individuals within encounters varied primarily between foraging, traveling, porpoising, and bow-riding, with no obvious dominant behavior. Photo-identification analyses found a total of 17 individuals resighted between the acoustic encounters, resulting in 1 pelagic animal resighted between P1 and P7, 10 NWHI animals resighted primarily between N1 and N4, and 6 MHI animals from M1 resighted in M2 and/or M4.
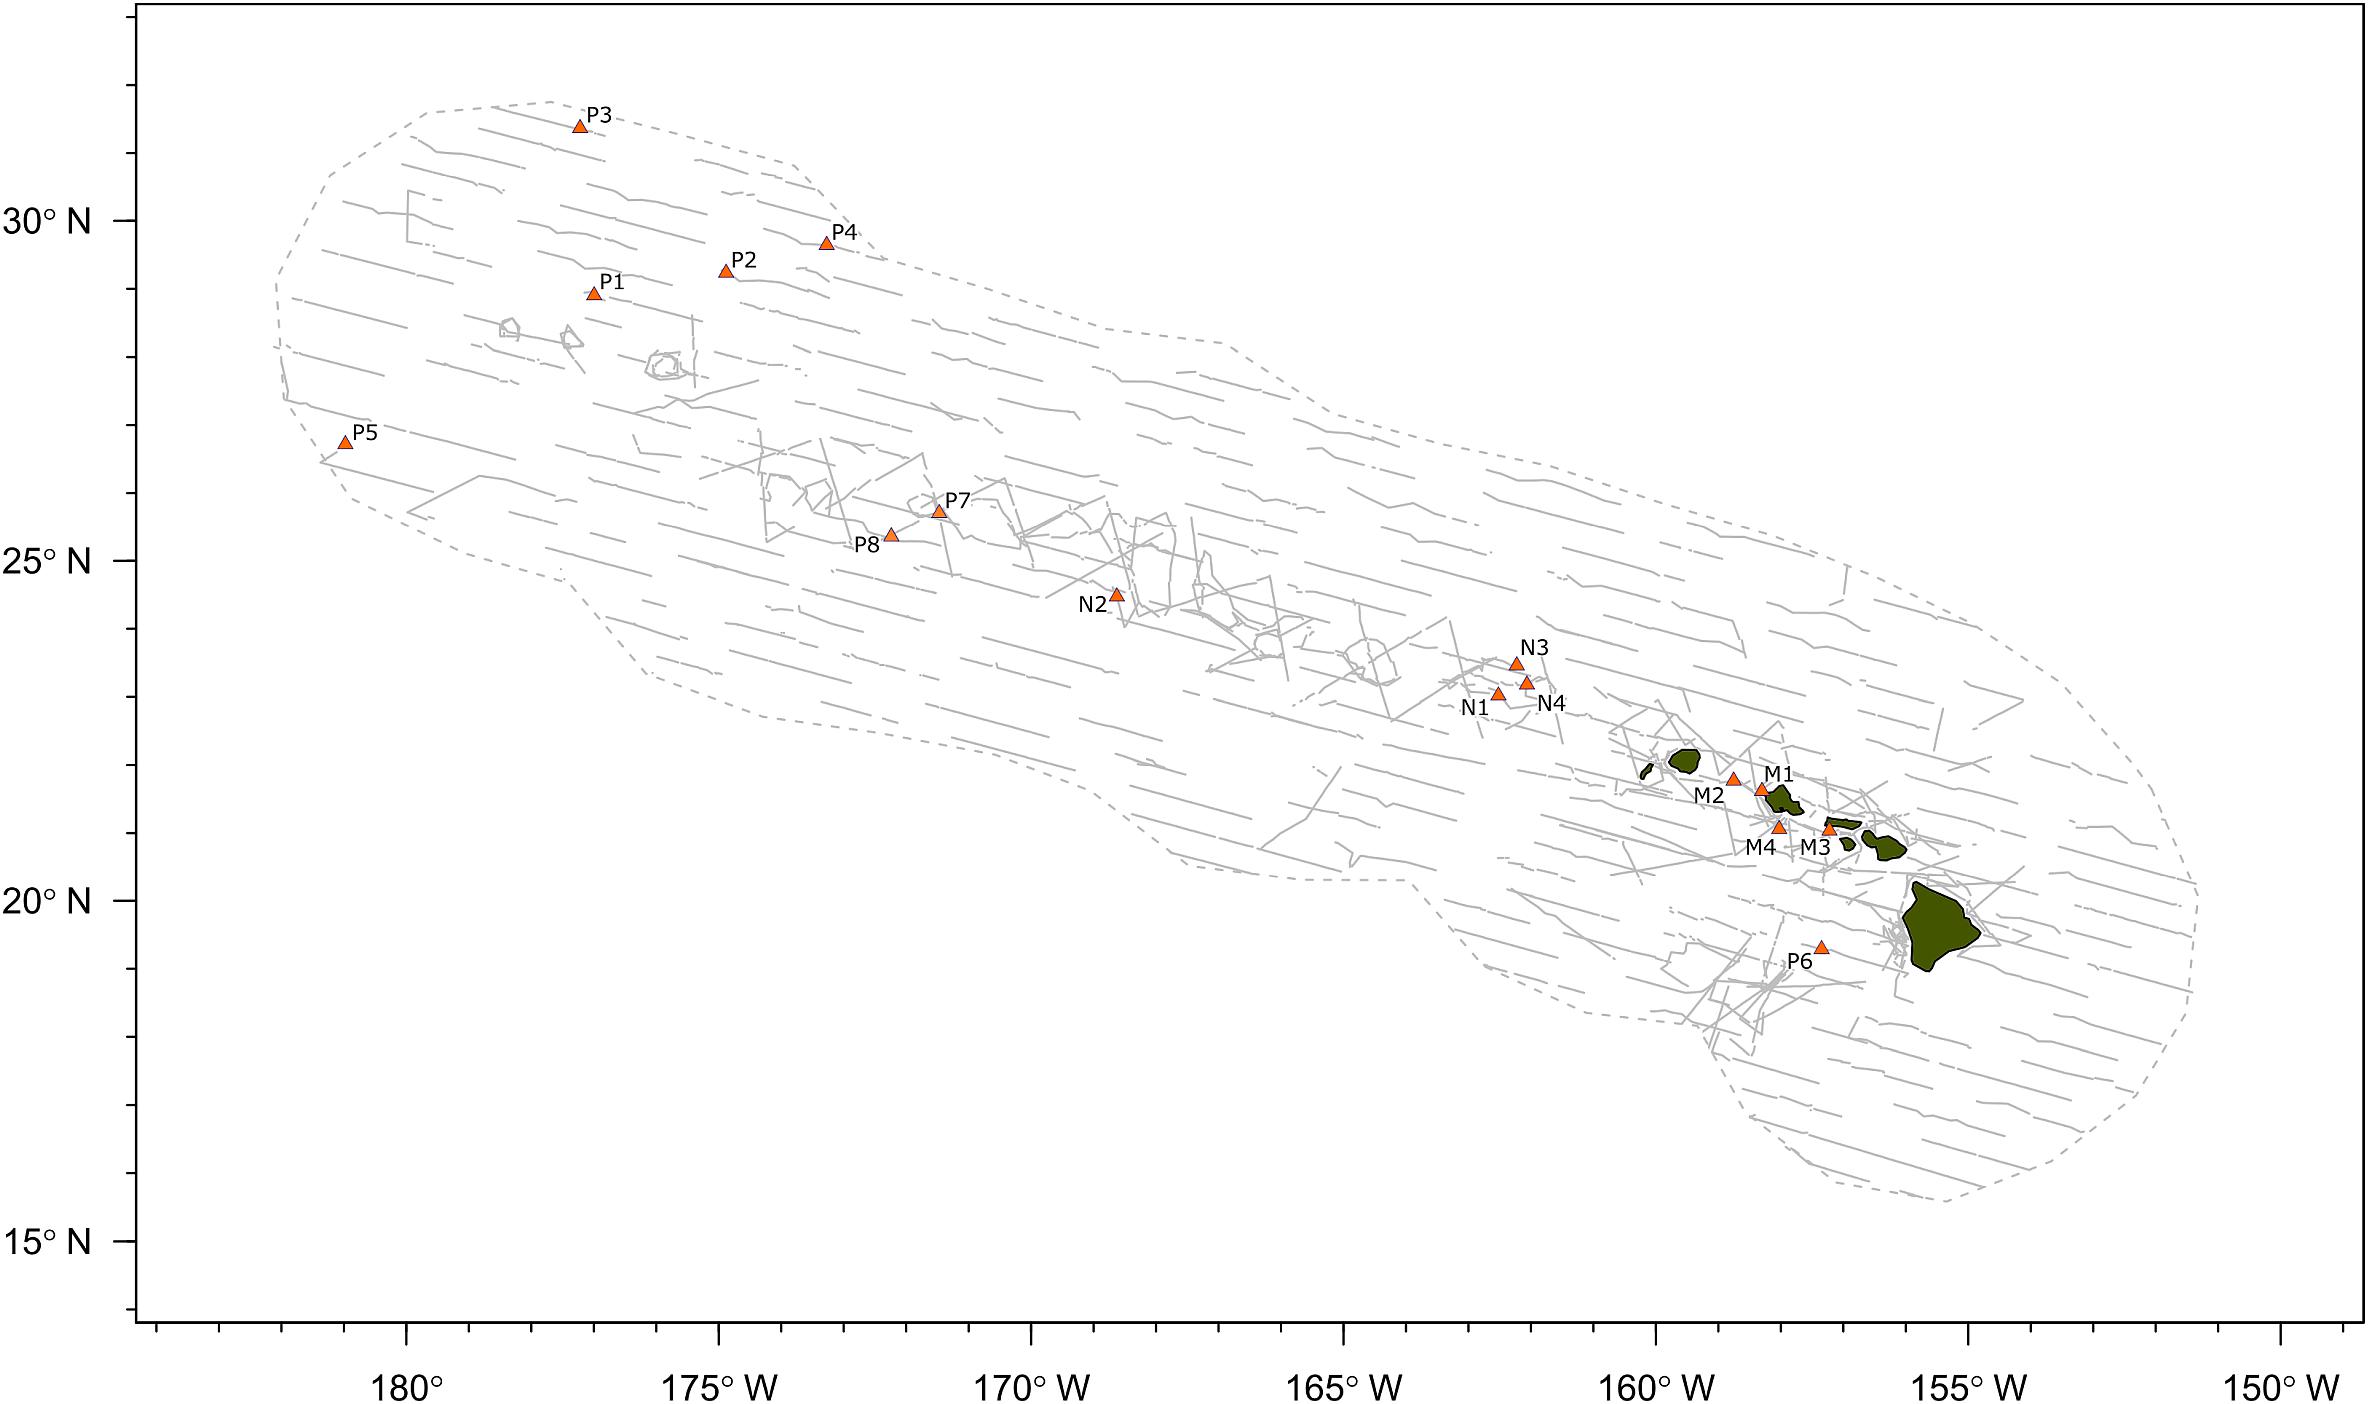
Figure 2. Map of false killer whale acoustic encounters identified to population based on photo-identification data, genetic samples, or satellite telemetry data. Gray dashed line indicates boundary of study area (Hawaiian Exclusive Economic Zone) and gray solid lines indicate transect lines from all line-transect surveys. “P” denotes the pelagic population, “N” denotes the Northwestern Hawaiian Island population, and “M” denotes the main Hawaiian Island population.
A total of 2400 whistles were manually extracted using ROCCA, including 1200 whistles for the pelagic population, 600 whistles for the NWHI population, and 600 whistles for the MHI population. Table 3 summarizes the metadata for each acoustic encounter. Four acoustic encounters were sampled from each population for each model iteration as that was the number of acoustic encounters available for the NWHI and MHI populations. Three acoustic encounters from each population (150 whistles each) were allocated to a training data set with one acoustic encounter allocated to the test data set. For the 100 models of RF_PNM, the total training data set included 135,000 whistles (150 whistles × 3 acoustic encounters × 3 populations × 100 model runs) and the total test data set included 45,000 whistles (150 whistles × 1 acoustic encounter × 3 populations × 100 model runs). The training data for each pairwise model totaled 90,000 whistles (150 whistles × 3 acoustic encounters × 2 populations × 100 model runs) with the test data totaling 30,000 whistles (150 whistles × 1 acoustic encounter × 2 populations × 100 model runs).
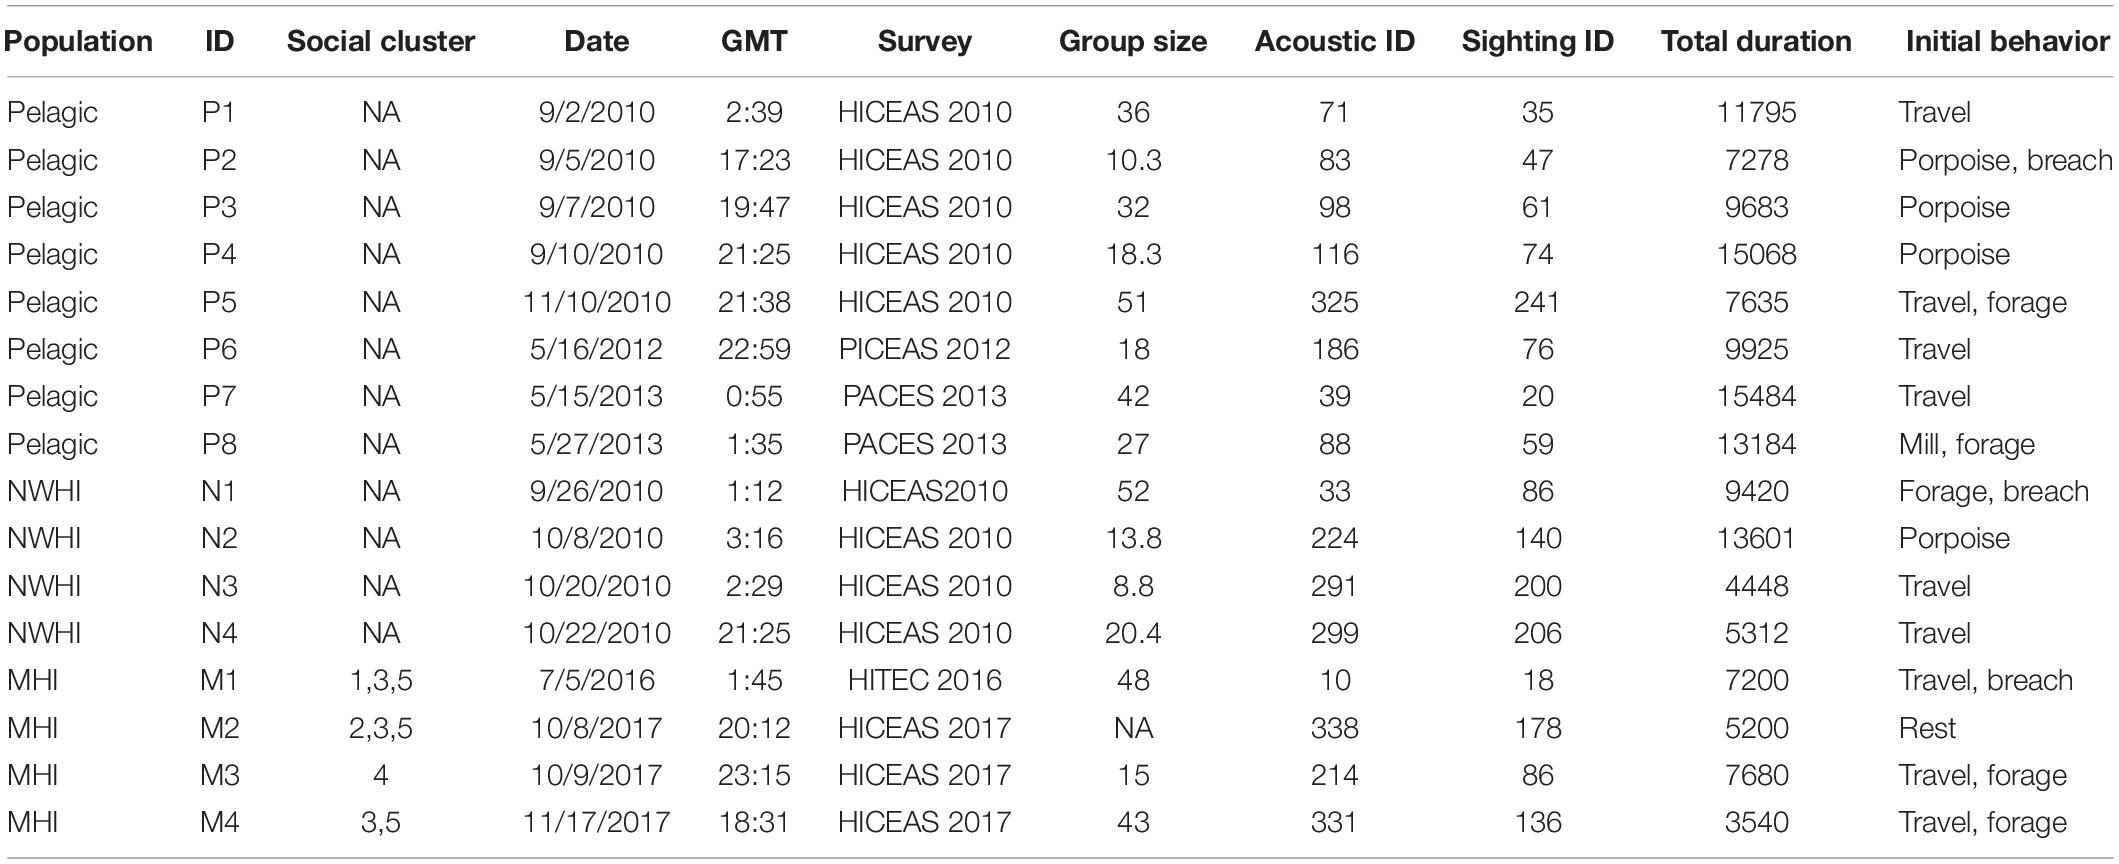
Table 3. Summary table listing information for each acoustic encounter, including population, acoustic encounter ID (“P” denotes the pelagic population, “N” denotes the Northwestern Hawaiian Island population, and “M” denotes the main Hawaiian Island population), social cluster (when applicable; pers. comm. R. Baird), date, time (GMT), survey, group size (the geometric mean of observer best estimates), the acoustic and visual sighting survey IDs, and total duration of the recordings analyzed (s).
The final combination of optimized parameter values for each model included the square root of total uncorrelated variables (∼5) for mtry and 501–5001 decision trees for ntree for all configurations. The resulting OOB accuracy rates for each optimized model are presented in Table 4. The highest accuracy rates across 100 models of RF_PNM ranged between 0.51 to 0.63, with a mean of 0.56. Both pairwise models resulted in higher accuracy rates. RF_PN ranged between 0.68 and 0.69, with a mean of 0.68 and RF_PM showed the highest accuracy rates of 0.68–0.75, with a mean of 0.72.
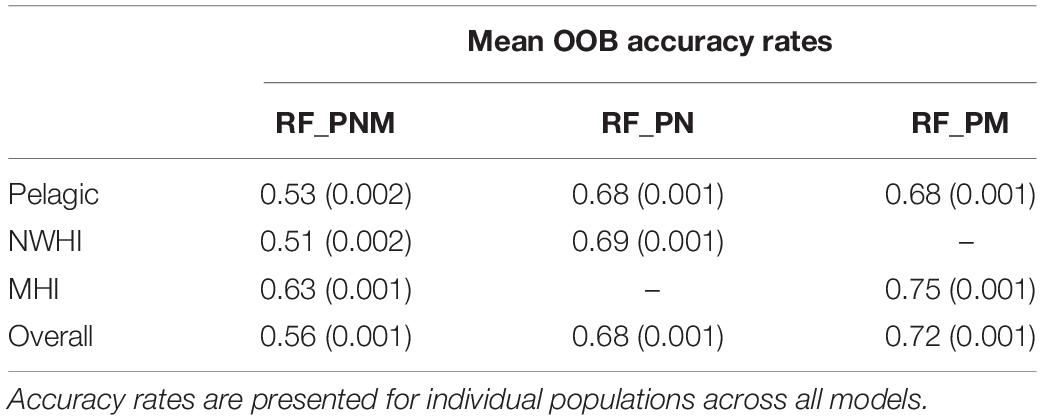
Table 4. Mean OOB accuracy rates (with variances) of the training data for each model configuration.
Classification results of test data for all model configurations were organized into separate confusion matrices. RF_PNM resulted in a mean observed accuracy of 0.42 and κ = 0.15 when compared to the expected accuracy of 0.33. According to the suggested kappa coefficient scale, the classification results of the test data for RF_PNM are in “slight” agreement with the true population of the test data. The confusion matrix (Table 5) also provides information about how the populations were misclassified – the pelagic whistles where mostly misclassified to the NWHI population, and the NWHI whistles were misclassified evenly between the pelagic and MHI population. The MHI whistles had the highest correct classification rate with misclassifications spread evenly between the pelagic and NWHI populations.
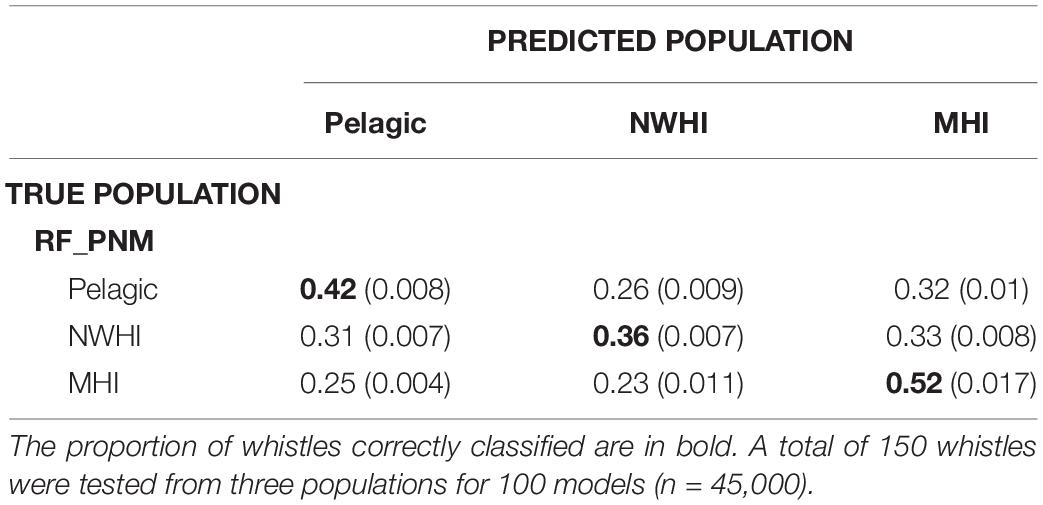
Table 5. Confusion matrix displaying classification results for test data (with variances) using the RF_PNM model.
Table 6 shows separate confusion matrices for both pairwise models. RF_PN resulted in a mean observed accuracy of 0.56 and κ = 0.12 calculated using an expected accuracy of 0.5. The mean observed accuracy for RF_PM equaled 0.62 and κ = 0.24. The low kappa coefficient for RF_PN indicates low agreement between classification results of the test data with the true population while the higher kappa coefficient for RF_PM suggests fair agreement. Correct classification rates of the pelagic population were similar between pairwise models but improved compared to RF_PNM results (by ∼15%), which we expected since fewer populations were included in the pairwise models. The MHI population consistently showed the highest correct classification results for all model configurations while classification results for pelagic and NWHI whistles performed similarly throughout all models relative to the MHI population.
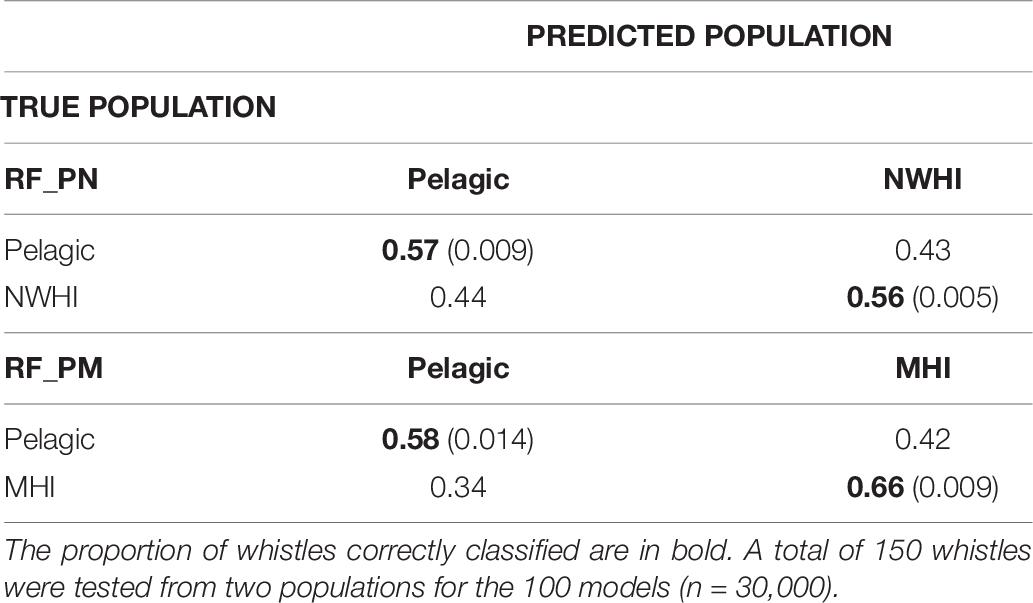
Table 6. Confusion matrices displaying classification results for populations using the pairwise models, RF_PN, and RF_PM.
This study also aimed to better understand the variability in whistle measurements within populations by classifying whistles to acoustic encounters instead of populations (Table 7). Since our data set included an unequal number of acoustic encounters per population (Table 3), we built separate RFs for each population. We selected the training and test whistle data using the same 75%/25% split and included equal proportions of whistles from each acoustic encounter. Pelagic whistles were classified to pelagic encounters with a mean observed accuracy of 0.31 (κ = 0.21) while whistles from the NWHI and MHI populations received higher mean accuracies of 0.49 (κ = 0.32) and 0.45 (κ = 0.26), respectively. These results suggest that the whistles from the NWHI and MHI acoustic encounters maintain certain time-frequency characteristics that allow them to be classified to the correct acoustic encounter more often than pelagic whistles.
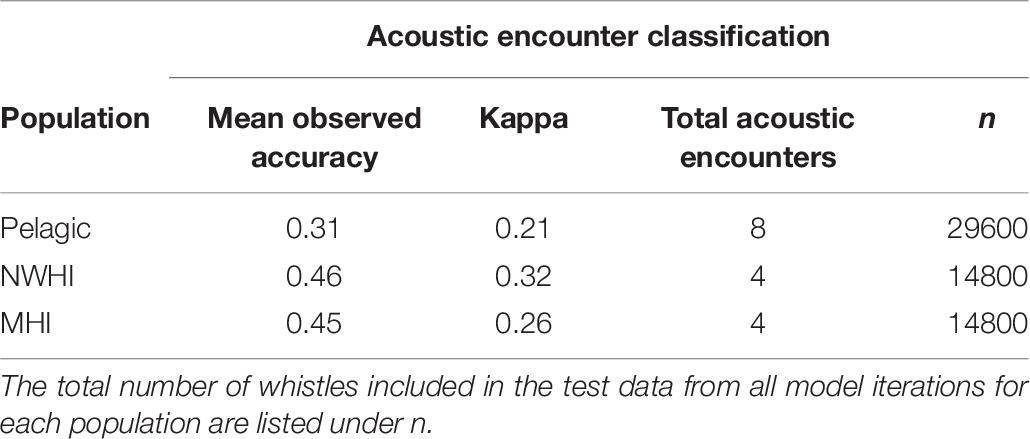
Table 7. Mean observed accuracies and Kappa coefficients for acoustic encounter classification models.
Acoustic encounters were also classified to a population based on the majority classification of individual whistles for each model iteration to examine the variability of classification results among acoustic encounters within populations. Table 8 provides the percentages of correctly classified acoustic encounters for all models. Acoustic encounters of the MHI population were classified correctly more frequently than the pelagic and NWHI encounters. On average, 87% of MHI encounters were correctly classified across models, with the highest average score resulting from the RF_PM model (93%). The averages for the pelagic and NWHI acoustic encounters were lower (72 and 63%, respectively). Specific acoustic encounters, M1, N1, N2, and P7, showed the lowest scores in the RF-PNM model. Upon inspection of how these encounters were misclassified, we found that M1 classified as NWHI 67% of the time (7% as MHI), 100% of the N1 encounters classified as MHI, while 70% of the N2 encounters classified as pelagic. P7 encounters were always classified as MHI. Classifications improved for most acoustic encounters using the pairwise models.
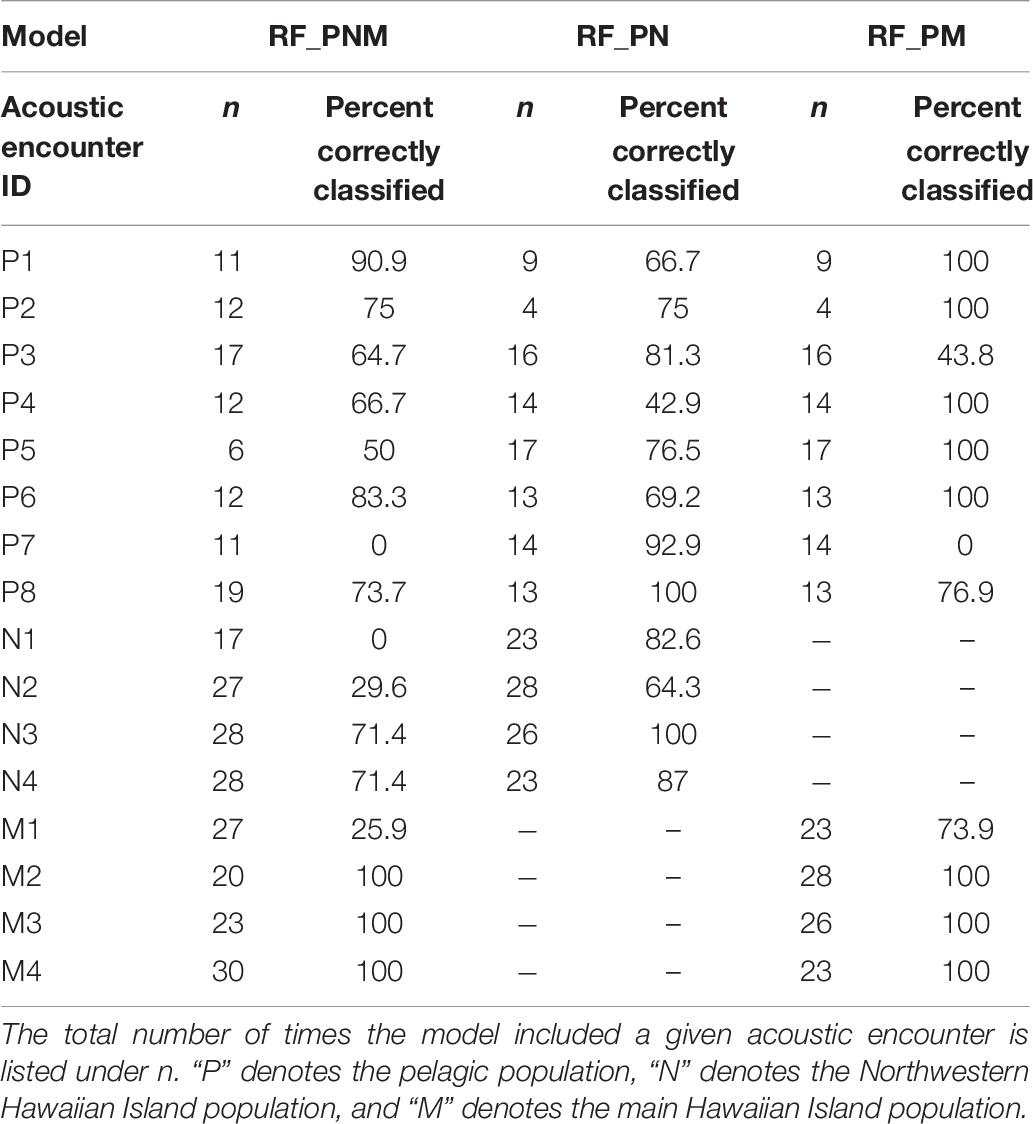
Table 8. Percentage of models in which acoustic encounters were correctly classified based on a majority of whistle classifications.
The important variables from RF classification models of populations were ranked by MDA. Whistle variables with a negligible decline in accuracy when permuted received a lower MDA while permuted variables causing a larger decline in accuracy were deemed more informative and received a higher measure of MDA. Whistle variables that ranked within the top 10 important variables (from approximately 26 uncorrelated variables depending on the model) were consolidated to assess which whistle variables consistently contributed to the most accurate RF models (Figure 3). Not all model configurations resulted in the same top 10 important variables with 14 variables occurring in the top 10 for all model configurations. Since RF models included different numbers of trees and different whistles, variable importance is not directly comparable. However, two variables (mean negative slope and third quarter frequency) consistently produced the highest median values of MDA for all model configurations. Other slope variables (mean slope, percentage of negative slope, and percentage of zero slope) also ranked within the top 10 important variables for 75–100% of all models for each configuration.
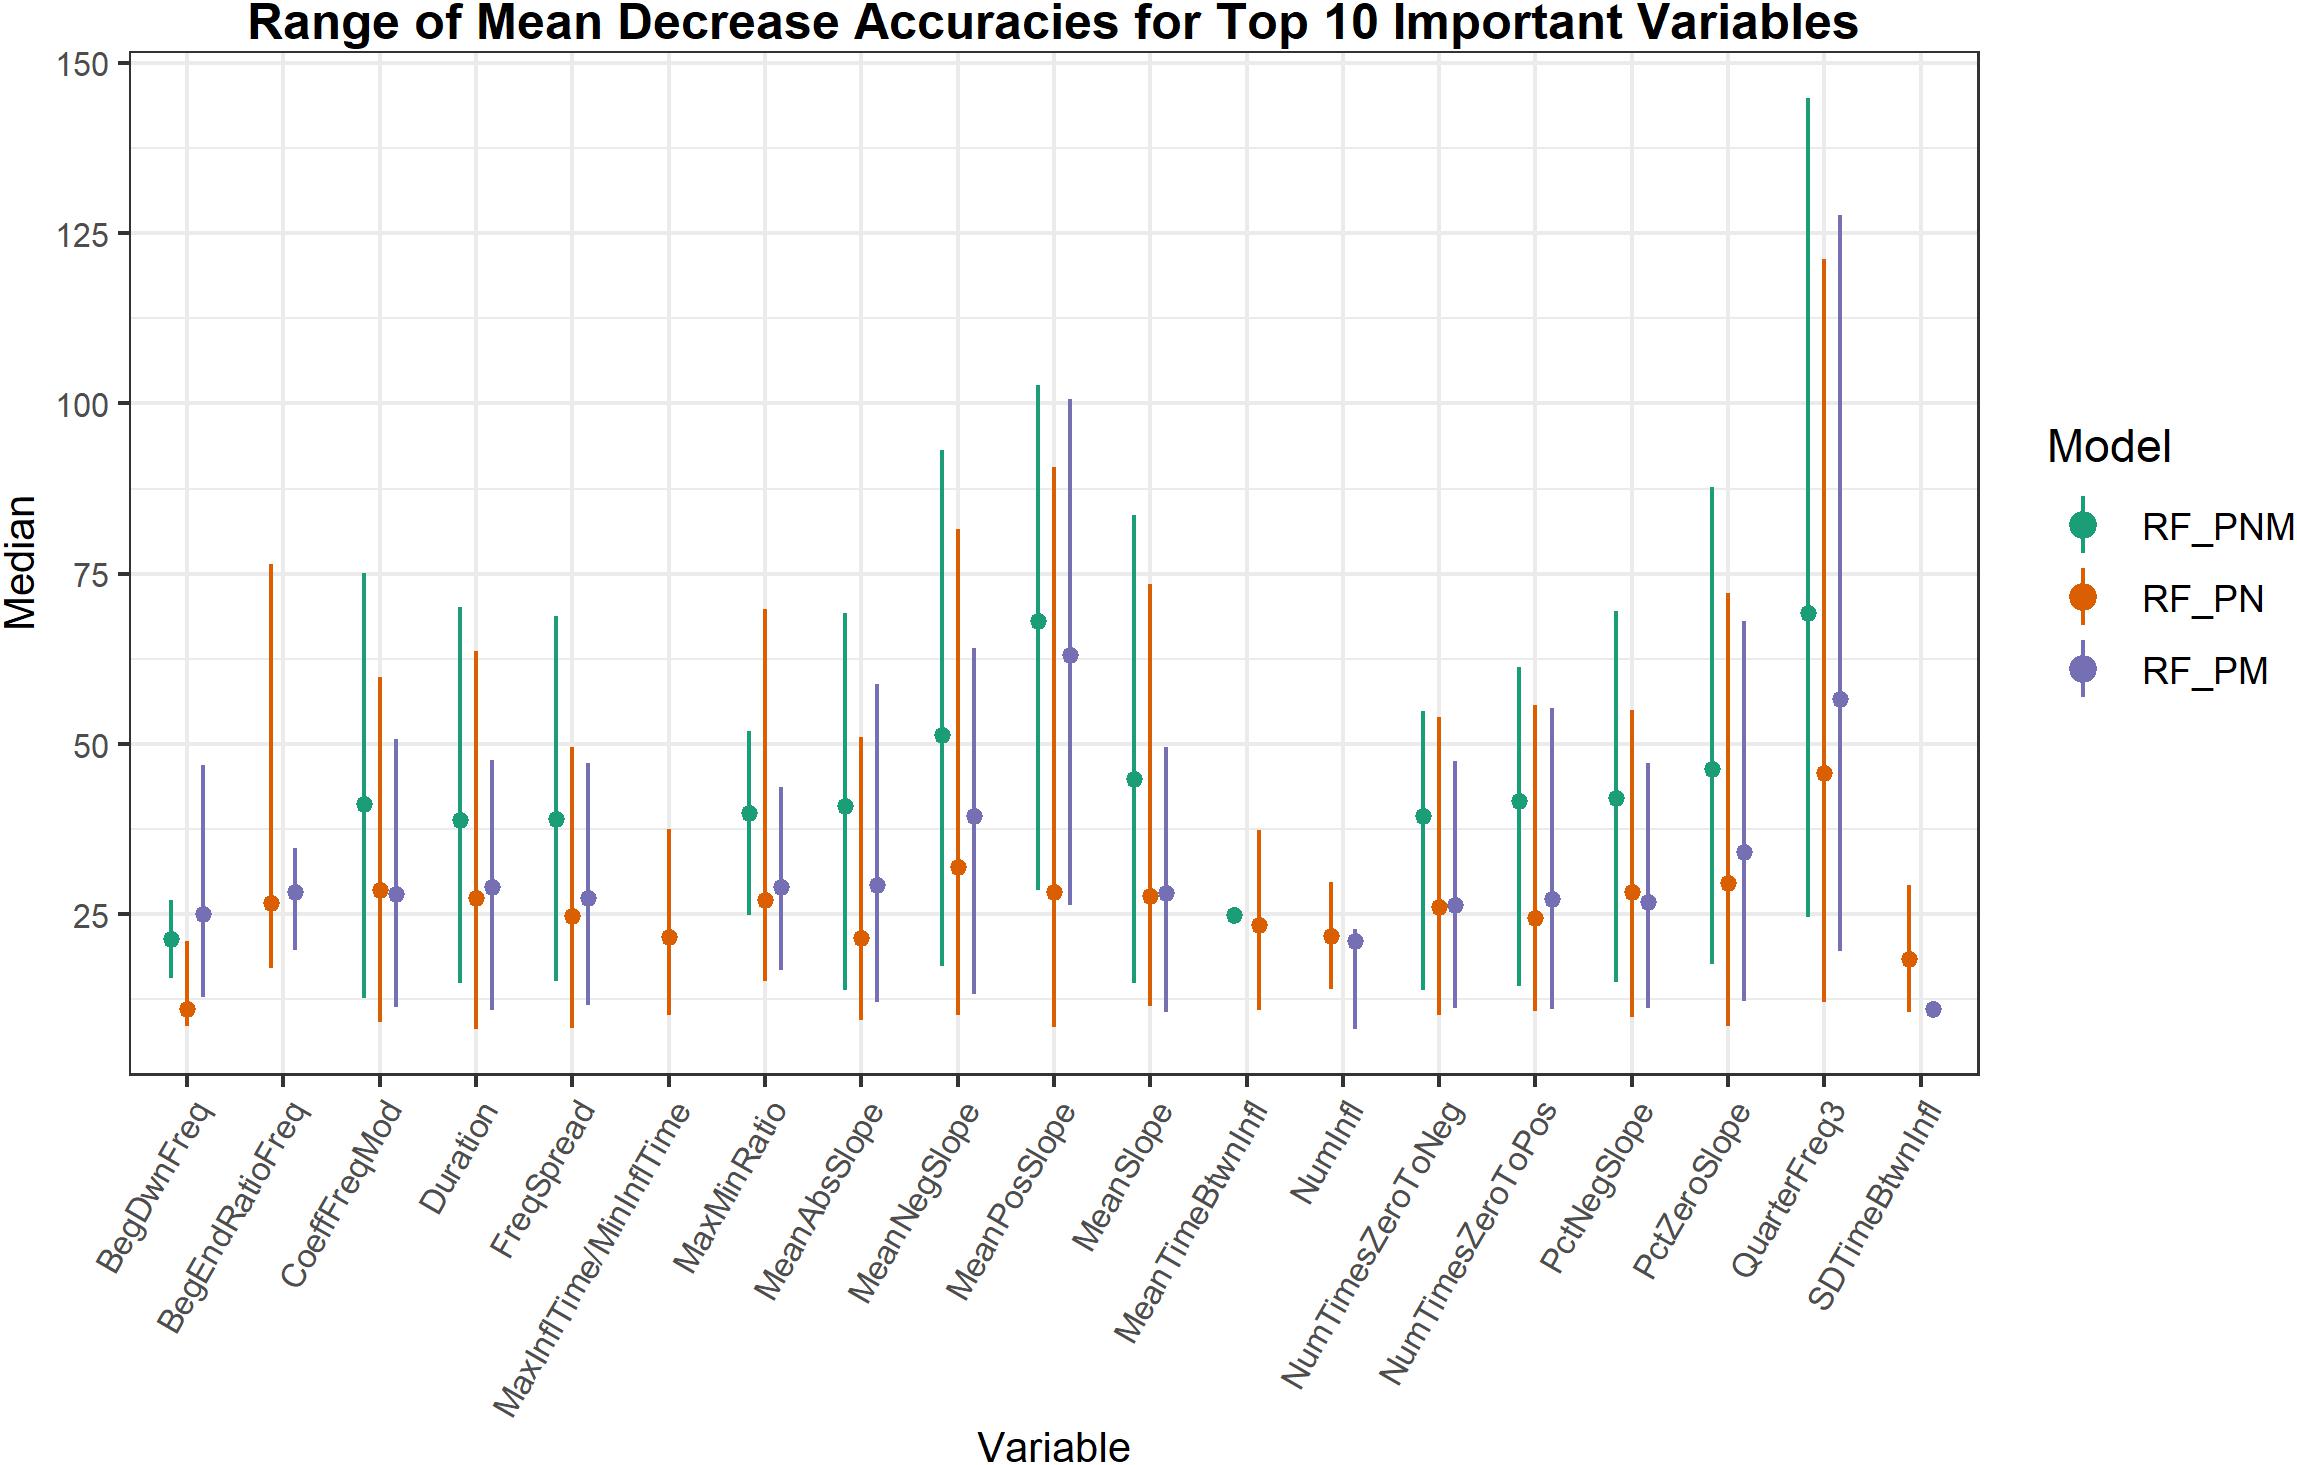
Figure 3. Range of mean decrease accuracies for whistle variables ranked as the 10 most important across all model iterations. Higher values of mean decrease in accuracy indicate whistle variables that are more important to classification. Whistle variables selected in the top 10 for only one model iteration are represented as a single dot.
Pairwise Kolmogorov-Smirnov tests examined whether the 14 whistle variables deemed most important for all model configurations were also significantly different between the populations. Results showed that six out of 14 important whistle variables differed significantly between all populations, including some slope variables, frequency spread, and the third quarter frequency (Figure 4).
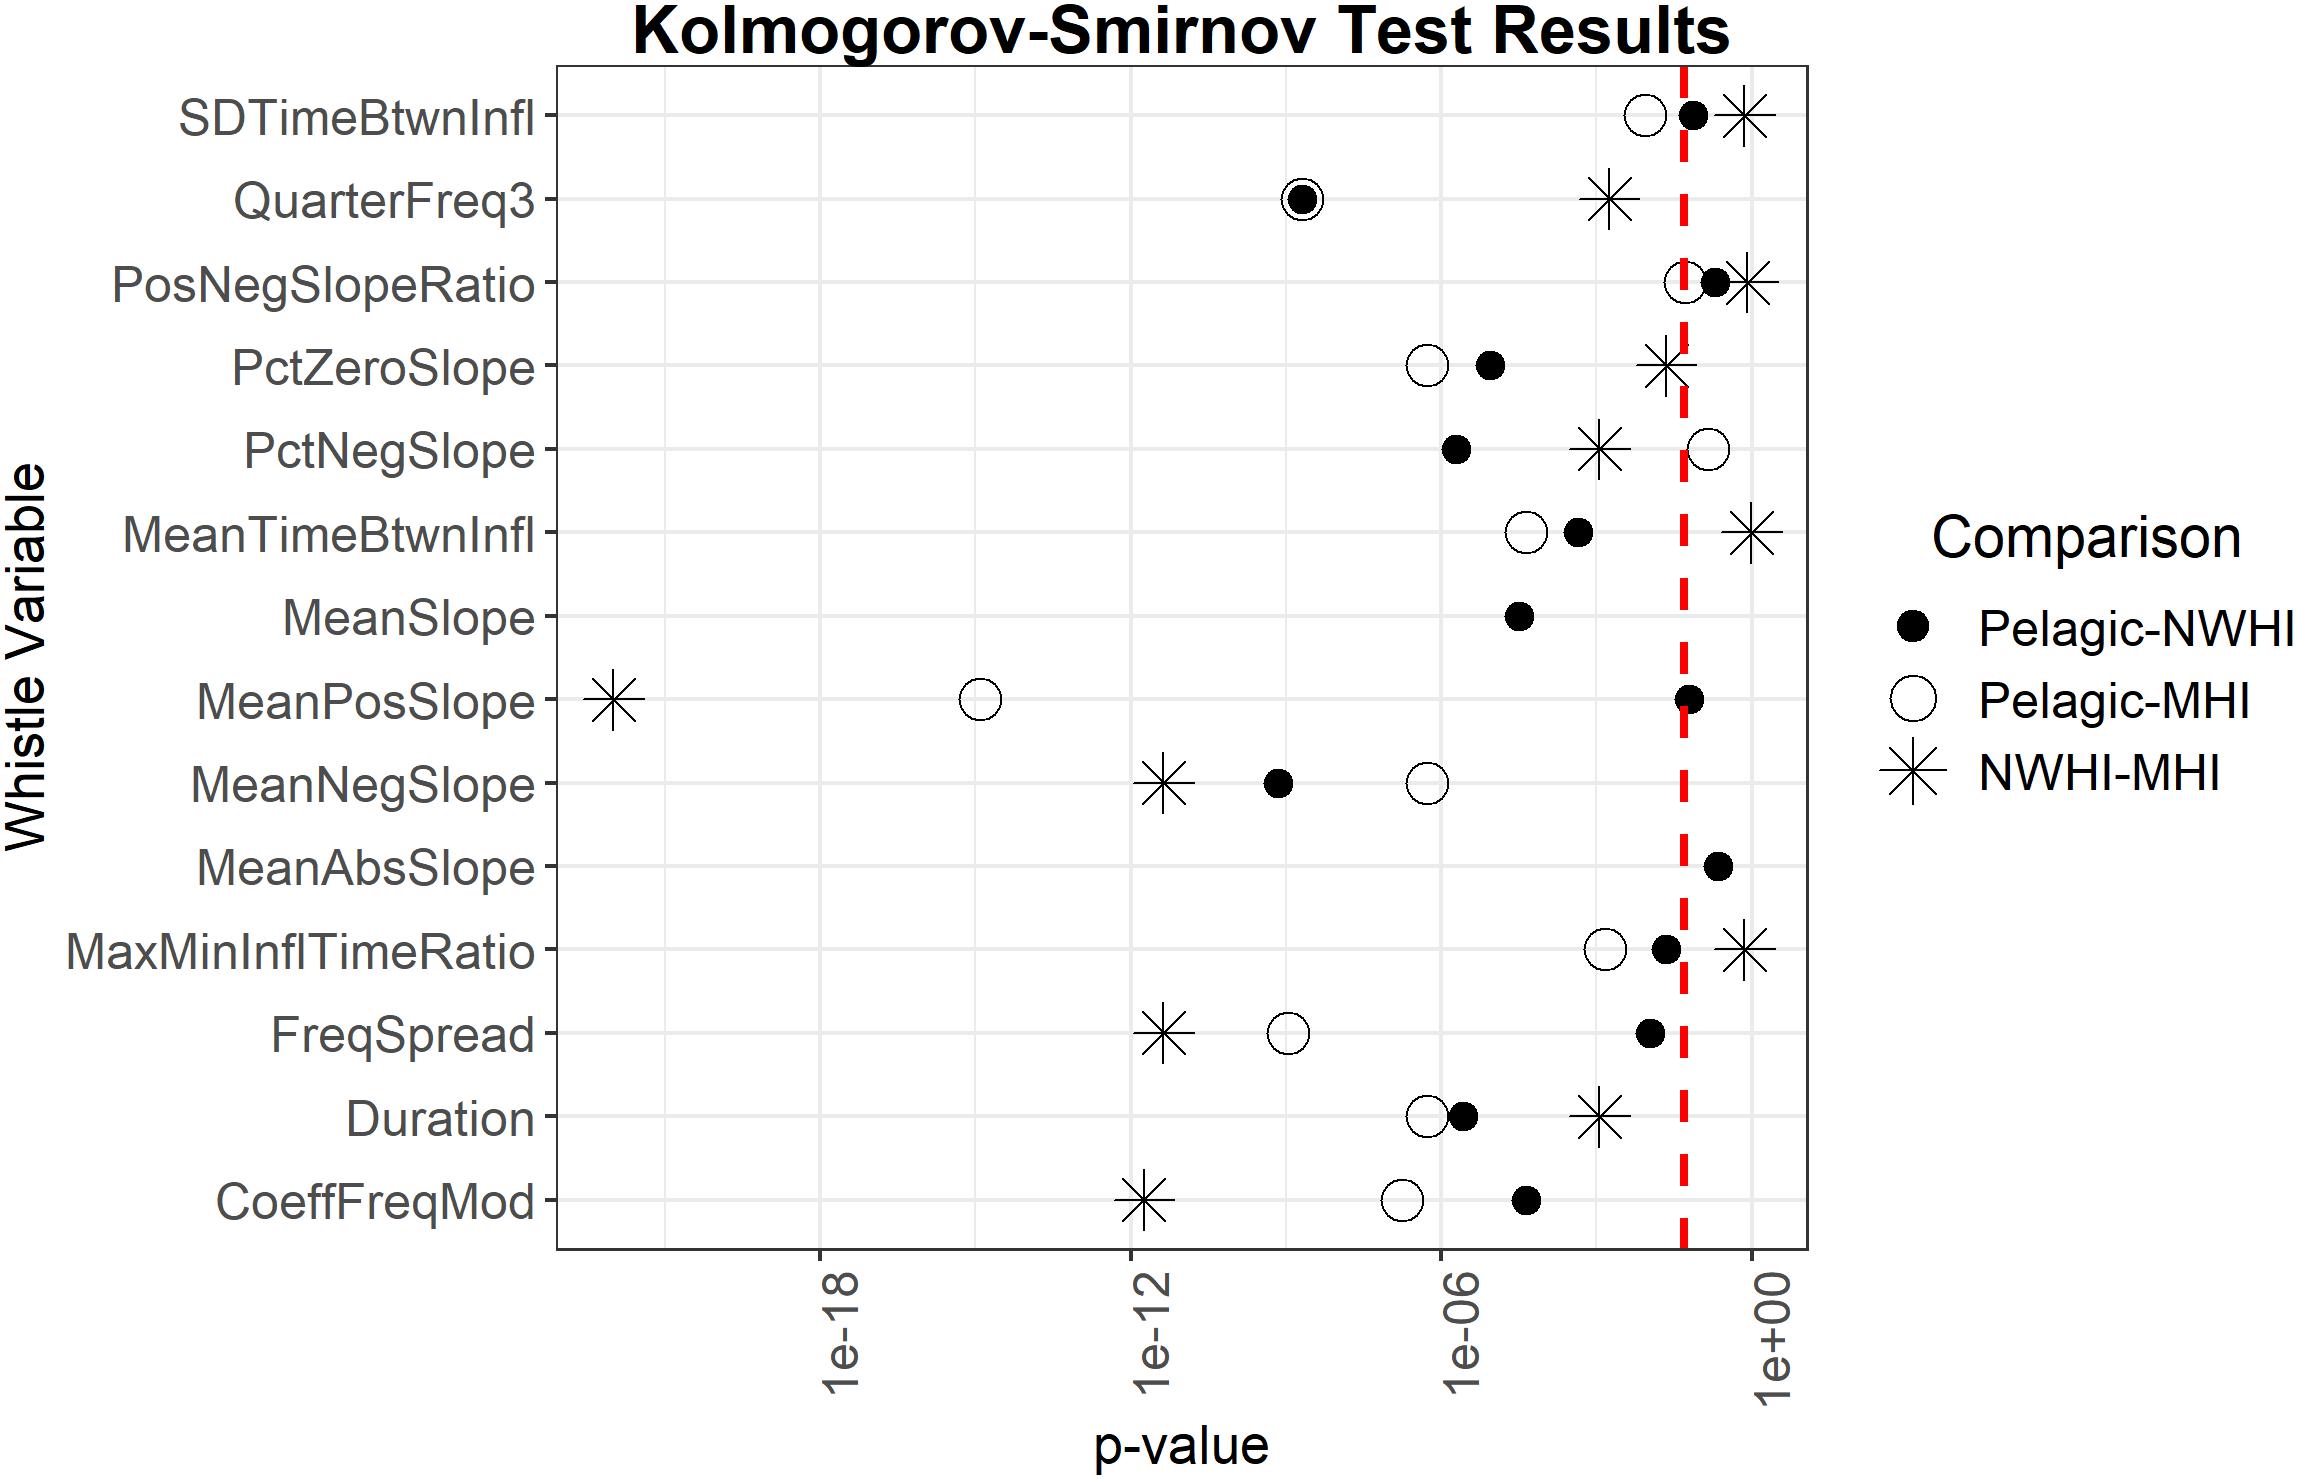
Figure 4. Results of Kolmogorov-Smirnov tests comparing uncorrelated important whistle variables between populations. Red dashed line represents α = 0.05. Points to the left of the red dashed line indicate whistle variables that are significantly different for a given pairwise comparison of populations.
Discussion
The marine environment contains few barriers to the genetic dispersal of cetaceans, yet fine-scale genetic differentiation exists for these highly mobile species. For many cetacean species, measurable differences in their vocal repertoires are consistent with the genetic differentiation between geographically isolated populations and the intricate social structure within a population (Rendell et al., 2012; Papale et al., 2014; Van Cise et al., 2018). This study aimed to develop a whistle classifier to identify whistles from acoustic encounters of Hawaiian false killer whales to the population level. Identifying Hawaiian false killer whale populations using characteristics of their whistle repertoire could complement other population-specific data or provide population identity when other data are unavailable.
We applied the RF machine learning classification method to analyze whistle characteristics of the three false killer whale populations because of its high performance with diverse variables, including prior work differentiating dolphin species based on their whistle characteristics (Pal, 2005; Cutler et al., 2007; Oswald, 2013; Keen et al., 2014; Li et al., 2016; Rankin et al., 2017). Overall, RF classification models poorly differentiated the three populations as is evident from the low correct classification rates and low kappa coefficients for each model. The pelagic and NWHI whistles were correctly classified at similar rates in both RF_PNM and RF_PN models but whistles and acoustic encounters from the MHI population were consistently correctly classified at higher rates for all models.
Previous studies that examined geographic variation in whistle characteristics of allopatric populations found significant differences between several variables and achieved classification scores significantly higher than expected by chance (May-Collado and Wartzok, 2008; Azzolin et al., 2013; Papale et al., 2013b). For this study, the populations are sympatric and overlap in part of their range. Our results indicated that most whistle variables are similar between these populations given that only 6 out of 50 whistle variables significantly differed between all populations (Figure 4). An additional RF was configured using only these six significantly different variables and resulted in even lower classification scores (0.40 overall accuracy, κ = 0.1) suggesting simplified models do not perform better and that a variety of variables should be included in this type of classification model for this species.
Despite the poor classification performance, our results provide insight into potential patterns of whistle characteristics between populations. While each RF model was built using balanced training and testing data, the total whistle data set included twice as many pelagic whistles and acoustic encounters than the NWHI and MHI populations. The pelagic whistle data presumably captured more variability due to behavioral states, group composition, and environment. This additional variability may be responsible for the lower classification scores of the pelagic whistles. Interestingly, while pairwise RF models improved classification scores for all populations, classification results of pelagic whistles still performed similarly to the NWHI whistles despite the disproportionate number of whistles and acoustic encounters.
False killer whale whistles tend to be lower in frequency and less frequency-modulated than most delphinid whistles and have among the highest correct classification rates when other delphinid species are included in the classifier (Oswald et al., 2007). However, these whistle characteristics may make it difficult to discern the subtle differences between populations using the time-frequency measurements commonly implemented in whistle classification analyses. Frequency-modulated calls, e.g., whistles, have been categorized into call types to identify geographically isolated populations of some odontocetes based on contour shape and time-frequency characteristics (Saulitis et al., 2005; Van Cise et al., 2017). No attempt was made to categorize whistle types for false killer whales since this study was interested in the overall classification of all whistles. A cursory look at the whistle data set shows there is potential to identify whistle categories, but it is unknown whether this would improve our ability to classify the three populations since whistle categories types may share the same magnitude of similarities as individual whistles.
Dolphin whistles are thought to act as a mechanism for group cohesion (Janik and Slater, 1998) and may differ depending on differences in the physical and social environments (May-Collado and Wartzok, 2008). Sympatric killer whale populations in the eastern North Pacific maintain social cohesion using dialects of stereotyped calls that are highly modulated in frequency and amplitude and vary between and within ecotypes (Ford, 1991; Thomsen et al., 2002; Saulitis et al., 2005; Riesch et al., 2006; Riesch and Deecke, 2011). In contrast, the sympatric false killer whale populations in Hawaii produce less frequency-modulated whistles overall but can maintain social cohesion between subgroups that can span tens of kilometers (Bradford et al., 2014; Baird, 2016). The overlapping ranges of the populations imply that they experience similar environments and perhaps optimize their whistle characteristics according to the same types of habitat features (such as bathymetry, bottom type, proximity to land or seamounts, and upwelling zones), which may explain the similar time-frequency measurements found in our data set.
Characteristics of vocal repertoires have been used as a proxy for defining geographically separate and/or ecologically distinct populations, as well as different social groupings within populations (Rendell and Whitehead, 2003; Saulitis et al., 2005; Riesch and Deecke, 2011; Rendell et al., 2012; Gero et al., 2016). Social clusters have been recognized for the MHI population from social network analysis of photo-identification data where three main clusters and two additional smaller social clusters were identified (Baird et al., 2012). Results from classifying whistles to an acoustic encounter instead of a population may reflect the finer-scale social structuring of the MHI population and suggest that social clusters may also be present in the NWHI population given the higher kappa coefficients for both populations (Table 7). Although photo-identification data are limited for the NWHI population, acoustic encounter classification results reveal that it may be of value to test whether social structuring exists for this island-associated population using the available association data (Baird et al., 2013).
Classification results of MHI whistles appeared to be influenced by the social clusters present during an acoustic encounter. When acoustic encounters were classified based on the majority of whistles for RF_PNM, M1 classified most frequently as “NWHI” while M2, M3, and M4 always classified as “MHI” (Table 8). Classification of M1 improved dramatically for RF_PM since the NWHI population was not included as a possible target variable. M1 was the only acoustic encounter containing individuals from Cluster 1. Differences in whistle characteristics between false killer whale social clusters have not been examined, nor can we with this data set. Some social clusters may have more highly variable whistles, and groups containing aggregations of several social clusters may use a different collection of whistles than those in single cluster groups (Van Cise et al., 2018). Identifying variability in whistle characteristics among social clusters would require encounters with single cluster groups or accurate localization of vocalizing individuals matched with photographic data to confirm their identity within multi-cluster groups, data not currently available for Hawaiian false killer whale populations.
Several factors affect the vocal repertoire of any species, including behavior, social context, environmental factors, and even data collection methods. The challenge is capturing enough variability to build a successful classification model that can be applied under a variety of circumstances. Whistle quality may influence classification results if they are not representative of the species or population. This study included whistles of various quality to create a more flexible classifier for real-time and post-process classification since, often, there are not enough “high quality” whistles available to confidently classify an encounter. Using various levels of whistle quality presumably captures a variety of individuals engaged in different behaviors that may be located at various distances relative to the hydrophones and result in a more representative, and perhaps, successful classifier. Future studies may test this theory by building separate whistle classifiers based on discrete levels of whistle quality or behavioral states.
Investigating the acoustic classification of whistles for the Hawaiian false killer whale populations is an important step in furthering our understanding of this species for better management and conservation efforts. While overall whistle classification results from this study did not perform well, patterns emerged suggesting characteristics of the endangered MHI population’s whistles are more distinguishable and that there may be fine-scale social structure in the NWHI population, similar to that seen in the MHI population. Additional whistle data for all populations may increase classification performance to differentiate the populations with more confidence and allow further investigation into social and population structure as well as how the populations remain demographically independent. Future analyses may also incorporate characteristics of echolocation clicks to improve classification, hybrid versions of important variables (Rankin et al., 2017) or incorporate additional population or behavior variables (social cluster, group size, etc.) to better capture variability in whistle context and therefore whistle characteristics. Results from this study will inform future acoustic classification analyses for sympatric species that share similar traits in their acoustic repertoire and ecology.
Data Availability Statement
The raw data supporting the conclusions of this manuscript will be made available by the authors, without undue reservation, to any qualified researcher.
Author Contributions
YB, EO, and JO conceived the idea and design of the study. YB, EO, JO, and EF contributed to the analytical methods. YB helped to collect the passive acoustic data and was solely responsible for the data organization, performed the analyses, and wrote the first draft of the manuscript. All authors contributed to interpreting the results, provided the revisions of the manuscript, and read and approved the final version for submission.
Funding
Funding for passive acoustic data collection during the shipboard cetacean line-transect surveys was provided by PIFSC, SWFSC, NOAA Fisheries Pacific Islands Regional Office, and NOAA Fisheries Office of Protected Resources (OPR) for HICEAS 2010, PIFSC for PICEAS, PACES and HITEC, and PIFSC, OPR, NOAA Fisheries Office of Science and Technology, Chief of Naval Operation Environmental Readiness Division and Pacific Fleet, and Bureau of Ocean Energy Management for HICEAS 2017. Funding for passive acoustic data analysis was provided by PIFSC and the National Science Foundation Graduate Research Fellowships Program.
Conflict of Interest
The authors declare that the research was conducted in the absence of any commercial or financial relationships that could be construed as a potential conflict of interest.
Acknowledgments
This work would not have been possible without the help of the officers and crew of the R/V Oscar Elton Sette, R/V McArthur II, and R/V Reuben Lasker. We thank the scientists aboard each survey for their cooperation while collecting false killer whale passive acoustic data; Eiren Jacobson and Patrick Rex for their assistance and patience in measuring whistle data; and Sabre Mahaffy and Marie Hill for supplying the sighting and photo-identification data. We also thank Robin Baird and Jim Carretta for offering their insight and expertise to improve the content of the manuscript. We appreciate the feedback from the editor and reviewers for their thoughtful comments that greatly clarified and polished the text.
References
Aniceto, A. S., Biuw, M., Lindstrøm, U., Solbø, S. A., Broms, F., and Carroll, J. (2018). Monitoring marine mammals using unmanned aerial vehicles: quantifying detection certainty. Ecosphere 9:e02122. doi: 10.1002/ecs2.2122
Azzolin, M., Gannier, A., Lammers, M. O., Oswald, J. N., Papale, E., Buscaino, G., et al. (2014). Combining whistle acoustic parameters to discriminate mediterranean odontocetes during passive acoustic monitoring. J. Acoust. Soc. Am. 135, 502–512. doi: 10.1121/1.4845275
Azzolin, M., Papale, E., Lammers, M. O., Gannier, A., and Giacoma, C. (2013). Geographic variation of whistles of the striped dolphin (Stenella coeruleoalba) within the mediterranean sea. J. Acoust. Soc. Am. 134, 694–705. doi: 10.1121/1.4808329
Baird, R. W. (2009). “False killer whale (pseudorca crassidens),” in Encyclopedia of Marine Mammals, eds W. F. Perrin, B. Würsig, and J. G. M. Thewissen, (Cambridge,MA: Academic Press), 405–406.
Baird, R. W. (2016). The Lives of Hawaii’s Dolphins and Whales: Natural History and Conservation. Honolulu, HI: University of Hawai’i Press.
Baird, R. W., and Gorgone, A. M. (2005). False killer whale dorsal fin disfigurements as a possible indicator of long-line fishery interactions in hawaiian waters. Pacific Sci. 59, 593–601. doi: 10.1353/psc.2005.0042
Baird, R. W., Gorgone, A. M., McSweeney, D. J., Webster, D. L., Salden, D. R., Deakos, M. H., et al. (2008). False killer whales (Pseudorca crassidens) around the main hawaiian islands: long-term site fidelity, inter-island movements, and association patterns. Mar. Mamm. Sci. 24, 591–612. doi: 10.1111/j.1748-7692.2008.00200.x
Baird, R. W., Hanson, M. B., Schorr, G. S., Webster, D. L., McSweeney, D. J., Gorgone, A. M., et al. (2012). Range and primary habitats of hawaiian insular false killer whales: informing determination of critical habitat. Endanger. Species Res. 18, 47–61. doi: 10.3354/esr00435
Baird, R. W., Mahaffy, S. D., Gorgone, A. M., Cullins, T., Mcsweeney, D. J., Oleson, E. M., et al. (2014). False killer whales and fisheries interactions in hawaiian waters: evidence for sex bias and variation among populations and social groups. Mar. Mamm. Sci. 31, 579–590. doi: 10.1111/mms.12177
Baird, R. W., Oleson, E. M., Barlow, J., Ligon, A. D., Gorgone, A. M., and Mahaffy, S. D. (2013). Evidence of an island-associated population of false killer whales (pseudorca crassidens) in the northwestern hawaiian islands. Pacific Sci. 67, 513–521. doi: 10.2984/67.4.2
Baird, R. W., Schorr, G. S., Webster, D. L., McSweeney, D. J., Hanson, M. B., and Andrews, R. D. (2010). Movements and habitat use of satellite-tagged false killer whales around the main hawaiian islands. Endanger. Species Res. 10, 107–121. doi: 10.3354/esr00258
Barkley, Y., Oswald, J. N., Carretta, J. V., Rankin, S., Rudd, A., and Lammers, M. O. (2011). Comparison of Real-Time and Post- Cruise Acoustic Species Identification of Dolphin Whistles Using ROCCA (Real-Time Odontocete Call Classification Algorithm). National Oceanic and Atmospheric Administration: Silver Spring, MA
Barlow, J. (2015). Inferring trackline detection probabilities, g(0), for cetaceans from apparent densities in different survey conditions. Mar. Mamm. Sci. 31, 923–943. doi: 10.1111/mms.12205
Barlow, J., Gerrodette, T., and Forcada, J. (2001). Factors affecting perpendicular sighting distances on shipboard line-transect surveys for cetaceans. J. Cetacean Res. Manag. 3, 201–212.
Barlow, J., and Rankin, S. (2007). False Killer Whale Abundance and Density: PRELIMINARY Estimates for the PICEAS Study Area South of Hawaii and New Estimates for the U.S. Report no EEZ around Hawaii’, Administrative Report LJ-07-02. Silver Spring, MA: National Oceanic and Atmospheric Administration.
Barlow, J., and Taylor, B. L. (2005). Estimates of sperm whale abundance in the northeastern temperate pacific from a combined acoustic and visual survey. Mar. Mamm. Sci. 21, 429–445. doi: 10.1111/j.1748-7692.2005.tb01242.x
Baum, J. K., and Worm, B. (2009). Cascading top-down effects of changing oceanic predator abundances. J. Anim. Ecol. 78, 699–714. doi: 10.1111/j.1365-2656.2009.01531.x
Baumann-Pickering, S., McDonald, M. A., Simonis, A. E., Berga, A. S., Merkens, K. P. B., Oleson, E. M., et al. (2013). Species-specific beaked whale echolocation signals. J. Acoust. Soc. Am. 134, 2293–2301. doi: 10.1121/1.4817832
Baumann-Pickering, S., Simonis, A. E., Oleson, E. M., Baird, R. W., Roch, M. A., and Wiggins, S. M. (2015). False killer whale and short-finned pilot whale acoustic identification. Endanger. Species Res. 28, 97–108. doi: 10.3354/esr00685
Bayless, A. R., Oleson, E. M., Baumann-Pickering, S., Simonis, A. E., Marchetti, J., Martin, S., et al. (2017). Acoustically monitoring the hawai‘i longline fishery for interactions with false killer whales. Fisher. Res. 190, 122–131. doi: 10.1016/j.fishres.2017.02.006
Bazúa-Durán, C., and Au, W. W. L. (2004). Geographic variations in the whistles of spinner dolphins (Stenella longirostris) of the main hawai‘ian Islands. J. Acoust. Soc. Am. 116, 3757–3769. doi: 10.1121/1.1785672
Bioacoustics Research Program (2017). Raven Pro: Interactive Sound Analysis Software (Version 1.5). Ithaca, NY: The Cornell Lab of Ornithology.
Bittle, M., and Duncan, A. (2013). “A review of current marine mammal detection and classification algorithms for use in automated passive acoustic monitoring,” in Proceedings of the Acoustics: Science, Technology and Amenity, Nov 17-20 2013, Victor Harbour, SA.
Bradford, A. L., Baird, R. W., Mahaffy, S. D., Gorgone, A. M., Mcsweeney, D. J., Cullins, T., et al. (2018). Abundance estimates for management of endangered false killer whales in the main Hawaiian Islands. Endanger. Species Res. 36, 297–313. doi: 10.3354/esr00903
Bradford, A. L., and Forney, K. A. (2014). Injury determinations for cetaceans observed interacting with Hawaii and American Samoa longline fisheries during 2007-2011.
Bradford, A. L., Forney, K. A., Oleson, E. M., and Barlow, J. (2014). Accounting for subgroup structure in line-transect abundance estimates of false killer whales (Pseudorca crassidens) in Hawaiian waters. PLoS One 9:e90464. doi: 10.1371/journal.pone.0090464
Bradford, A. L., Forney, K. A., Oleson, E. M., and Barlow, J. (2017). Abundance estimates of cetaceans from a line-transect survey within the U.S. hawaiian islands exclusive economic zone. Fisher. Bull. 115, 129–142. doi: 10.7755/FB.115.2.1
Bradford, A. L., and Lyman, E. (2018). Injury Determinations for Humpback Whales and Other Cetaceans Reported to NOAA Response Networks in the Hawaiian Islands during 2007-2012. Silver Spring, MA: National Oceanic and Atmospheric Administration.
Bradford, A. L., Oleson, E. M., Baird, R. W., Boggs, C. H., Forney, K. A., and Young, N. C. (2015). Revised Stock Boundaries for False killer Whales (Pseudorca crassidens) in Hawaiian waters. Silver Spring, MA: National Oceanic and Atmospheric Administration.
Buckland, S. T., Anderson, D. R., Burnham, K. P., Laake, J. L., Borchers, D. L., and Thomas, L. (2001). Introduction to Distance Sampling Estimating Abundance of Biological Populations. Oxford: Oxford University Press.
Charif, R. A., and Clark, C. W. (2009). Acoustic monitoring of large whales in deep waters north and west of the british isles: 1996-2005. Cornell Lab Ornithol. 08:40. doi: 10.1578/AM.35.3.2009.313
Chivers, S. J., Baird, R. W., Martien, K. M., Taylor, B., Archer, L. E., Gorgone, A. M., et al. (2010). Evidence of Genetic Differentiation for Hawaii Insular False Killer Whales (Pseudorca Crassidens). Silver Spring, MA: National Oceanic and Atmospheric Administration.
Citta, J. J., Richard, P., Lowry, L. F., O’Corry-Crowe, G., Marcoux, M., Suydam, R., et al. (2017). Satellite telemetry reveals population specific winter ranges of beluga whales in the bering sea. Mar. Mamm. Sci. 33, 236–250. doi: 10.1111/mms.12357
Cohen, J. (1960). A coefficient of agreement for nominal scales. Educ. Psychol. Measure. 20, 37–46. doi: 10.1177/001316446002000104
Cutler, D. R., Edwards, T. C. Jr., Beard, K. H., Cutler, A., Hess, K. T., Gibson, J., et al. (2007). Random forests for classification in ecology. Ecol. Soc. Am. 88, 2783–2792. doi: 10.1890/07-0539.1
Deecke, V. B., Barrett-Lennard, L. G., Spong, P., and Ford, J. K. B. (2010). The structure of stereotyped calls reflects kinship and social affiliation in resident killer whales (Orcinus orca). Naturwissenschaften 97, 513–518. doi: 10.1007/s00114-010-0657-z
Delarue, J., Todd, S. K., Van Parijs, S. M., and Di Iorio, L. (2009). Geographic variation in Northwest Atlantic fin whale (Balaenoptera physalus) song: implications for stock structure assessment. J. Acoust. Soc. Am. 125, 1774–1782. doi: 10.1121/1.3068454
Durban, J. W., Elston, D. A., Ellifrit, D. K., Dickson, E., Hammond, P. S., and Thompson, P. M. (2005). Multisite mark-recapture for cetaceans: population estimates with bayesian model averaging. Mar. Mamm. Sci. 21, 80–92. doi: 10.1111/j.1748-7692.2005.tb01209.x
Efron, B., and Tibshirani, R. (1997). Improvements on cross-validation: the .632+ bootstrap method. J. Am. Stat. Assoc. 92, 548–560. doi: 10.1080/01621459.1997.10474007
Estes, J. A., Terborgh, J., Brashares, J. S., Power, M. E., Berger, J., Bond, W. J., et al. (2011). Trophic downgrading of planet Earth. Science 333, 301–306. doi: 10.1126/science.1205106
Estes, J. A., Tinker, M. T., Williams, T. M., and Doak, D. F. (1998). Killer whale predation on sea otters linking oceanic and nearshore ecosystems. Science 282, 473–476. doi: 10.1126/science.282.5388.473
Evans, P. G. H., and Hammond, P. S. (2004). ‘Monitoring cetaceans in european waters’. Mamm. Rev. 34, 131–156. doi: 10.1046/j.0305-1838.2003.00027.x
Fleming, A. H., Yack, T., Redfern, J. V., Becker, E. A., Moore, T. J., and Barlow, J. (2018). Combining acoustic and visual detections in habitat models of Dall’s porpoise. Ecol. Model. 384, 198–208. doi: 10.1016/j.ecolmodel.2018.06.014
Ford, J. K. B. (1991). Vocal traditions among resident killer whales (Orcinus orca) in coastal waters of british columbia. Can. J. Zool. 69, 1454–1483. doi: 10.1139/z91-206
Forney, K. A., Kobayashi, D. R., Johnston, D. W., Marchetti, J. A., and Marsik, M. G. (2011). What’s the catch? Patterns of cetacean bycatch and depredation in hawaii-based pelagic longline fisheries. Mar. Ecol. 32, 380–391. doi: 10.1111/j.1439-0485.2011.00454.x
Gannier, A., Fuchs, S., Quèbre, P., and Oswald, J. N. (2010). Performance of a contour-based classification method for whistles of mediterranean delphinids. Appl. Acoust. 71, 1063–1069. doi: 10.1016/j.apacoust.2010.05.019
García, S., Fernández, A., Luengo, J., and Herrera, F. (2009). A study of statistical techniques and performance measures for genetics-based machine learning: accuracy and interpretability. Soft Comput. 13, 959–977. doi: 10.1007/s00500-008-0392-y
Garzón, M. B., Blazek, R., Neteler, M., Dios, R. S., de Ollero, H. S., and Furlanello, C. (2006). Predicting habitat suitability with machine learning models: the potential area of Pinus sylvestris L. in the Iberian Peninsula. Ecol. Model. 197, 383–393. doi: 10.1016/j.ecolmodel.2006.03.015
Gero, S., Whitehead, H., and Rendell, L. (2016). Individual, unit and vocal clan level identity cues in sperm whale codas. R. Soc. Open Sci. 3, 1–12. doi: 10.1098/rsos.150372
Gillespie, D., Mellinger, D. K., Gordon, J., McLaren, D., Redmond, P., McHugh, R., et al. (2008). PAMGUARD: semiautomated, open source software for real-time acoustic detection and localisation of cetaceans. J. Acoust. Soc. Am. Curran Assoc. 30, 54–62.
Gilman, E., Brothers, N., and McPherson, G. (2006). A review of cetacean interactions with longline gear. J. Cetacean Res. Manag. 8, 215–223.
Gregorutti, B., Michel, B., and Saint-Pierre, P. (2017). Correlation and variable importance in random forests. Stat. Comput. 27, 659–678. doi: 10.1007/s11222-016-9646-1
Heithaus, M. R., Frid, A., Wirsing, A. J., and Worm, B. (2008). Predicting ecological consequences of marine top predator declines. Trends Ecol. Evol. 23, 202–210. doi: 10.1016/j.tree.2008.01.003
Henderson, E. E., Hildebrand, J. A., Smith, M. H., and Falcone, E. A. (2012). The behavioral context of common dolphin (Delphinus sp.) vocalizations. Mar. Mamm. Sci. 28, 439–460. doi: 10.1111/j.1748-7692.2011.00498.x
Janik, V. M., and Slater, P. J. B. (1998). Context-specific use suggests that bottlenose dolphin signature whistles are cohesion calls. Anim. Behav. 56, 829–838. doi: 10.1006/anbe.1998.0881
Keen, S., Ross, J. C., Griffiths, E. T., Lanzone, M., and Farnsworth, A. (2014). A comparison of similarity-based approaches in the classification of flight calls of four species of north american wood-warblers (Parulidae). Ecol. Info. 21, 25–33. doi: 10.1016/j.ecoinf.2014.01.001
Kinzey, D., Gerrodette, T., Barlow, J., Dizon, A., Perryman, W., and Olson, P. (2000). Marine Mammal Data Collected during a Survey in the Eastern Tropical Pacific Ocean Aboard the NOAA Ships McArthur and David Starr Jordan, July 28-December 9, 1999. Silver Spring, MA: National Oceanic and Atmospheric Administration.
Kiszka, J. J., Heithaus, M. R., and Wirsing, A. J. (2015). Behavioural drivers of the ecological roles and importance of marine mammals. Mar. Ecol. Prog. Ser. 523, 267–281. doi: 10.3354/meps11180
Landis, R. J., and Koch, G. G. (1977). The measurement of observer agreement for categorical data. Biometrics 33, 159–174.
Li, J., Tran, M., and Siwabessy, J. (2016). Selecting optimal random forest predictive models: a case study on predicting the spatial distribution of seabed hardness. PLoS One 11:29. doi: 10.1371/journal.pone.0149089
Martien, K. K., Chivers, S. J., Baird, R. W., Archer, F. I., Gorgone, A. M., Hancock-Hanser, B. L., et al. (2014). Nuclear and mitochondrial patterns of population structure in north pacific false killer whales (Pseudorca crassidens)’. J. Hered. 105, 611–626. doi: 10.5061/dryad.2pq32
May-Collado, L. J., and Wartzok, D. (2008). A comparison of bottlenose dolphin whistles in the atlantic ocean: factors promoting whistle variation. J. Mammal. 89, 1229–1240. doi: 10.1644/07-MAMM-A-310.1
McCowan, B., and Reiss, D. (1995). Whistle contour development in captive-born infant bottlenose dolphins (tursiops truncatus): role of learning. J. Comp. Psychol. 109, 242–260. doi: 10.1037//0735-7036.109.3.242
Mellinger, D. K. (2002). Ishmael: 1.0 User’s Guide; Ishmael: Integrated System for Holistic Multi-channel Acoustic Exploration and Localization. Seattle, WA: National Oceanic and Atmospheric Administration.
Mellinger, D. K., Stafford, K. M., Moore, S. E., Dziak, R. P., and Matsumoto, H. (2007). Fixed passive acoustic observation methods for cetaceans. Oceanography 20, 36–45. doi: 10.5670/oceanog.2007.03
Morisaka, T., Shinohara, M., Nakahara, F., and Akamatsu, T. (2005). Geographic variations in the whistles among three Indo-Pacific bottlenose dolphin Tursiops aduncus populations in Japan. Fisher. Sci. 71, 568–576. doi: 10.1111/j.1444-2906.2005.01001.x
Nitta, E. T., and Henderson, J. R. (1993). A review of interactions between hawaii’s fisheries and protected species. Mar. Fisher. Rev. 55, 83–92.
Norris, K. S., Wursig, B., Wells, R. S., and Wursig, M. (1994). The Hawaiian Spinner Dolphin. Berkeley, CA: Univ of California Press.
Nowacek, D. P. (2005). Acoustic ecology of foraging bottlenose dolphins (Tursiops truncatus), habitat-specific use of three sound types. Mar. Mamm. Sci. 21, 587–602. doi: 10.1111/j.1748-7692.2005.tb01253.x
Oleson, E. M., Boggs, C. H., Forney, K. A., Hanson, M. B., Knox, D., Taylor, B. L., et al. (2010). Status review of Hawaiian Insular False Killer Whales (Pseudorca crassidens) Under the Endangered Species Act. Silver Spring, MA: National Oceanic and Atmospheric Administration.
Oswald, J. N. (2013). Development of a Classifier for the Acoustic Identification of Delphinid Species in the Northwest Atlantic Ocean. Final Report no Submitted to HDR Environmental, Operations and Construction, Inc. Contract CON005-4394-009. Encinitas, CA: BioWaves, Inc.
Oswald, J. N., and Oswald, M. (2013). ROCCA (Real-time Odontocete Call Classification Algorithm) User’s Manual. Prepared for Naval Facilities Engineering Command Atlantic, Norfolk, Virginia under HDR Environmental, Operations and Construction, Inc. Encinitas, CA: Bio-Waves, Inc.
Oswald, J. N., Rankin, S., and Barlow, J. (2008). To whistle or not to whistle? geographic variation in the whistling behavior of small odontocetes. Aqua. Mamm. 34, 288–302. doi: 10.1578/AM.34.3.2008.288
Oswald, J. N., Rankin, S., Barlow, J., and Lammers, M. O. (2007). A tool for real-time acoustic species identification of delphinid whistles. J. Acoust. Soc. Am. 122, 587–595. doi: 10.1121/1.2743157
Pal, M. (2005). Random forest classifier for remote sensing classification. Int. J. Remote Sens. 26, 217–222. doi: 10.1080/01431160412331269698
Palacios, D. M., Baumgartner, M. F., Laidre, K. L., and Gregr, E. J. (2013). ‘Beyond correlation: integrating environmentally and behaviourally mediated processes in models of marine mammal distributions’. Endanger. Species Res. 22, 191–203. doi: 10.3354/esr00558
Papale, E., Azzolin, M., Cascao, I., Gannier, A., Lammers, M. O., Martin, V. M., et al. (2013a). Geographic variability in the acoustic parameters of striped dolphin’s (Stenella coeruleoalba) whistles. J. Acoust. Soc. Am. 133, 1126–1134. doi: 10.1121/1.4774274
Papale, E., Azzolin, M., Cascão, I., Gannier, A., Lammers, M. O., Martin, V. M., et al. (2013b). Macro- and micro-geographic variation of short-beaked common dolphin’s whistles in the mediterranean sea and atlantic ocean. Ethol. Ecol. Evol. 26, 392–404. doi: 10.1080/03949370.2013.851122
Papale, E., Azzolin, M., Cascão, I., Gannier, A., Lammers, M. O., Martin, V. M., et al. (2014). Acoustic divergence between bottlenose dolphin whistles from the Central–Eastern North Atlantic and Mediterranean Sea. Acta Ethol. 17, 155–165. doi: 10.1007/s10211-013-0172-2
R Core Team, (2018). R: A Language and Environment for Statistical Computing. Vienna: R Foundation for Statistical Computing.
Rankin, S., Barlow, J., Oswald, J. N., and Ballance, L. (2008). Acoustic Studies of Marine Mammals During Seven Years of Combined Visual and Acoustic Line-Transect Surveys for Cetaceans in the Eastern and Central Pacific Ocean. Silver Spring, MA: National Oceanic and Atmospheric Administration.
Rankin, S., Curtis, A., Oswald, J. N., Barlow, J., Archer, F., Keating, J. L., et al. (2017). Acoustic classification of dolphins in the california current using whistles, echolocation clicks, and burst pulses. Mar. Mamm. Sci. 33, 520–540. doi: 10.1111/mms.12381
Rendell, L., Matthews, J. N., Gill, A., Gordon, J. C. D., and Macdonald, D. W. (1999). Quantitative analysis of tonal calls from five odontocete species, examining interspecific and intraspecific variation. J. Zool. 249, 403–410. doi: 10.1111/j.1469-7998.1999.tb01209.x
Rendell, L., Mesnick, S. L., Dalebout, M. L., Burtenshaw, J., and Whitehead, H. (2012). ‘Can genetic differences explain vocal dialect variation in sperm whales. Phys. Macrocephalus Behav. Gene. 42, 332–343. doi: 10.1007/s10519-011-9513-y
Rendell, L., and Whitehead, H. (2003). Vocal clans in sperm whales (Physeter macrocephalus). Proc. R. Soc. Lond. Ser. B Biol. Sci. 270, 225–231. doi: 10.1098/rspb.2002.2239
Riesch, R., and Deecke, V. B. (2011). Whistle communication in mammal-eating killer whales (Orcinus orca): further evidence for acoustic divergence between ecotypes. Behav. Ecol. Sociobiol. 65, 1377–1387. doi: 10.1007/s00265-011-1148-8
Riesch, R., Ford, J. K. B., and Thomsen, F. (2006). ‘tability and group specificity of stereotyped whistles in resident killer whales, Orcinus orca, off british columbia. Anim. Behav. 71, 79–91. doi: 10.1016/j.anbehav.2005.03.026
Roch, M. A., Scott Brandes, T., Patel, B., Barkley, Y., Baumann-Pickering, S., and Soldevilla, M. S. (2011). Automated extraction of odontocete whistle contours. J. Acoust. Soc. Am. 130, 2212–2223. doi: 10.1121/1.3624821
Roman, J., Estes, J. A., Morissette, L., Smith, C., Costa, D., McCarthy, J., et al. (2014). Whales as marine ecosystem engineers. Front. Ecol. Environ. 12:377–385.
Roman, J., and McCarthy, J. J. (2010). The whale pump: marine mammals enhance primary productivity in a coastal basin. PLoS One 5:e13255. doi: 10.1371/journal.pone.0013255
Rossi-Santos, M. R., and Podos, J. (2006). Latitudinal variation in whistle structure of the estuarine dolphin Sotalia guianensis. Behaviour 143, 347–364. doi: 10.1163/156853906775897905
Saulitis, E. L., Matkin, C. O., and Fay, F. H. (2005). Vocal repertoire and acoustic behavior of the isolated AT1 killer whale subpopulation in southern alaska. Can. J. Zool. 83, 1015–1029. doi: 10.1139/z05-089
Soldevilla, M. S., Henderson, E. E., Campbell, G. S., Wiggins, S. M., Hildebrand, J. A., and Roch, M. A. (2008). Classification of Risso’s and Pacific white-sided dolphins using spectral properties of echolocation clicks. J. Acoust. Soc. Am. 124, 609–624. doi: 10.1121/1.2932059
Strobl, C., Boulesteix, A. L., Kneib, T., Augustin, T., and Zeileis, A. (2008). Conditional variable importance for random forests. BMC Bioinformatics 9:1–11. doi: 10.1186/1471-2105-9-307
Thomsen, F., Franck, D., and Ford, J. K. (2002). ‘On the communicative significance of whistles in wild killer whales (Orcinus orca)’. Naturwissenschaften 89, 404–407. doi: 10.1007/s00114-002-0351-x
Titus, K., Mosher, J. A., and Williams, B. K. (1984). Chance-corrected classification for use in discriminant analysis: ecological applications. Am. Midland Natural. 111, 1–7.
Torres, L. G., Nieukirk, S. L., Lemos, L., and Chandler, T. E. (2018). Drone up! quantifying whale behavior from a new perspective improves observational capacity. Front. Mar. Sci. 5:1–14. doi: 10.3389/fmars.2018.00319
Urian, K., Gorgone, A., Read, A., Balmer, B., Wells, R. S., Berggren, P., et al. (2015). Recommendations for photo-identification methods used in capture-recapture models with cetaceans. Mar. Mamm. Sci. 31, 298–321. doi: 10.1111/mms.12141
Van Cise, A. M., Mahaffy, S. D., Baird, R. W., Mooney, T. A., and Barlow, J. (2018). Song of my people: dialect differences among sympatric social groups of short-finned pilot whales in Hawai’i. Behav. Ecol. Sociobiol. 72, 1–13. doi: 10.1007/s00265-018-2596-1
Van Cise, A. M., Roch, M. A., Baird, R. W., Mooney, T. A., and Barlow, J. (2017). Acoustic differentiation of Shiho- and Naisa-type short-finned pilot whales in the Pacific ocean. J. Acoust. Soc. Am. 141, 737–748.
Van Parijs, S. M., Clark, C. W., Sousa-Lima, R. S., Parks, S. E., Rankin, S., Risch, D., et al. (2009). Management and research applications of real-time and archival passive acoustic sensors over varying temporal and spatial scales. Mar. Ecol. Prog. Ser. 395, 21–36. doi: 10.3354/meps08123
von Benda-Beckmann, A. M., Thomas, L., Tyack, P. L., and Ainslie, M. A. (2018). Modelling the broadband propagation of marine mammal echolocation clicks for click-based population density estimates. J. Acoust. Soc. Am. 143, 954–967. doi: 10.1121/1.5023220
Woodworth, P. A., Schorr, G. S., Baird, R. W., Webster, D. L., Mcsweeney, D. J., Hanson, M. B., et al. (2012). Eddies as offshore foraging grounds for melon-headed whales (Peponocephala electra). Mar. Mamm. Sci. 28, 638–647. doi: 10.1111/j.1748-7692.2011.00509.x
Yano, K. M., Oleson, E. M., Keating, J. L., Ballance, L. T., Hill, M. C., Bradford, A. L., et al. (2018). Cetacean and Seabird Data Collected During the Hawaiian Islands Cetacean and Ecosystem Assessment Survey (HICEAS), July – December 2017. Silver Spring, MA: National Oceanic and Atmospheric Administration.
Keywords: cetaceans, false killer whale, passive acoustic monitoring, population classification, Hawaiian archipelago, machine learning
Citation: Barkley Y, Oleson EM, Oswald JN and Franklin EC (2019) Whistle Classification of Sympatric False Killer Whale Populations in Hawaiian Waters Yields Low Accuracy Rates. Front. Mar. Sci. 6:645. doi: 10.3389/fmars.2019.00645
Received: 20 July 2019; Accepted: 02 October 2019;
Published: 18 October 2019.
Edited by:
Michele Thums, Australian Institute of Marine Science (AIMS), AustraliaReviewed by:
Sarah A. Marley, University of Portsmouth, United KingdomGail Schofield, Queen Mary University of London, United Kingdom
Copyright © 2019 Barkley, Oleson, Oswald and Franklin. This is an open-access article distributed under the terms of the Creative Commons Attribution License (CC BY). The use, distribution or reproduction in other forums is permitted, provided the original author(s) and the copyright owner(s) are credited and that the original publication in this journal is cited, in accordance with accepted academic practice. No use, distribution or reproduction is permitted which does not comply with these terms.
*Correspondence: Yvonne Barkley, eWJhcmtsZXlAaGF3YWlpLmVkdQ==