 Gina M. Selig
 Amanda N. Netburn
 Mashkoor Malik
- 1Marine Science Department, University of Hawai'i at Hilo, Hilo, HI, United States
- 2National Oceanic and Atmospheric Administration Educational Partnership Program/Minority Serving Institute Scholar, Silver Spring, MD, United States
- 3National Oceanic and Atmospheric Administration Office of Ocean Exploration and Research, Silver Spring, MD, United States
Pelagothuria is the only known genus of holothurian that is considered to be holopelagic. There is thought to be only one species, Pelagothuria natatrix, and little is known about its abundance and distribution throughout the global ocean. Most documented observations of Pelagothuria are in tropical regions with many in or near water masses with low dissolved oxygen concentrations, suggesting that Pelagothuria may be associated with oxygen minimum zone regions. During the spring 2017 NOAA Ship Okeanos Explorer Mountains in the Deep Expedition, scientists onboard the ship and participating through telepresence noted seeing an exceptional number of Pelagothuria during ROV dives conducted at sites along a transit from Pago Pago, American Samoa to Honolulu, Hawaii. Video from all dives was later reviewed using the video replay and annotation tool SeaTube and Pelagothuria were seen at 9 of the 12 ROV dive sites explored. A total of 97 Pelagothuria were observed in depths ranging from 196 to 4,440 m, temperatures of 1.3–15.4°C, salinities of 34.5–35.2, and oxygen concentrations of 0.17–3.77 mg L−1. The vertical distribution of Pelagothuria averaged 865 m depth, and their observations occurred at means of 5.24°C, 34.56, 1.71 mg L−1 for temperature, salinity, and dissolved oxygen, respectively. In 30 percent (n = 27) of the occurrences of Pelagothuria, the organism was observed at or within site of the seafloor, suggesting that the species may not actually be entirely holopelagic. A literature review was also conducted to look at the biogeography of the taxon. Results suggest that the horizontal distributions of Pelagothuria may extend to the Equatorial Pacific region, and the relatively high occurrence of Pelagothuria in oxygen minimum zones indicates they may be particularly hypoxia-tolerant. There is some indication that Pelagothuria may also be associated with areas of high particle flux. The strong El Niño event that occurred shortly before the expedition and anomalously warm conditions throughout much of the Pacific could have provided conditions favorable to a Pelagothuria bloom, however the high abundances of the organism seen on a nearby 2015 expedition and a later 2019 expedition suggest that this may be a persistent feature. The water column in this region has never before been explored with ROVs, and this study demonstrated use of an archived and publicly-accessible exploratory dataset to make novel discoveries.
Introduction
The deep (>200 m) pelagic ocean contains more than 90% of the Earth's habitable volume for multicellular organisms (Robison, 2009; Haddock et al., 2017). Also referred to as the midwater, this environment contains a high abundance and diversity of organisms, yet remains one of the least understood ecosystems on Earth due to the logistical challenges of accessing the deep sea (Robison, 2004; Webb et al., 2010; Netburn et al., 2018). With relatively few direct observations in the pelagic ocean, there is likely a significant amount of undescribed biodiversity of mesopelagic organisms (Webb et al., 2010). It was long thought that the deep pelagic ocean was entirely void of life, but midwater trawling conducted on the HMS Challenger expedition in the 1870s revealed that there is a ubiquitous assemblage of animals inhabiting these depths throughout the global ocean. While trawling continued to reveal the diversity of uniquely-adapted organisms living in the deep pelagic ocean, it was not until William Beebe and Otis Barton began to explore the water column environment with submersibles in the 1930s that the fine-scale spatial distribution and behaviors of midwater organisms could be observed in situ (Robison, 2004). While early submersible-based exploration included midwater observations (e.g., Barham, 1966), the focus of deep submergence studies soon largely shifted to seafloor environments. The greatest exception to this was the Johnson Sea-Link program, based at Harbor Branch Oceanographic Institute, which supported significant midwater exploration from the 1970s through the early 2000s (Greene et al., 1988; Widder et al., 1992; Frank and Widder, 1997; Liberatore et al., 1997). In 2016, the human-occupied vehicle (HOV) Alvin was used for the first time in decades to survey the pelagic environment in a study of the distribution of water column organisms at Hydrographer Canyon in the northwest Atlantic Ocean (Netburn et al., 2017). The success of this operation in making novel observations and collections demonstrated the value of bringing people directly into the midwater environment. However, HOVs are expensive to operate and their operational endurance is constrained (National Research Council, 1996).
Beginning in the 1980s, remotely operated vehicles (ROVs)—initially developed for industrial uses—were recognized as potential tools for conducting scientific observations in the deep sea. The Monterey Bay Aquarium Research Institute (MBARI), founded in 1987, developed a ROV-based research program to observe and survey midwater environments. Since 1989, MBARI researchers have conducted depth-stratified ROV transects through the upper kilometer of the water column at a reference station in Monterey Canyon (Robison et al., 2017), providing the longest and most comprehensive time series of visual observations in the deep pelagic environment. New taxa are still regularly discovered (e.g., Matsumoto et al., 2003; Dunn et al., 2005; Osborn et al., 2011) and MBARI's annotated and quality-controlled database provides an unprecedented time series (Schlining and Stout, 2006; Schlining et al., 2013) to investigate the relationships between abundance and distributions of organisms in response to environmental variability, as well as a video archive that can be mined for observations such as trophic interactions (Choy et al., 2017) and distributions of bioluminescent organisms (Martini and Haddock, 2017). While limited work has been done in other locations, such as Hawaii, the Gulf of California, and Japan, much of the ocean remains unexplored for water column organisms.
The National Oceanic and Atmospheric Administration's Office of Ocean Exploration and Research (OER) supports ocean exploration to address both current and emerging science and management needs in unexplored areas of the ocean, with a focus on the U.S. Exclusive Economic Zone (EEZ). OER achieves these goals by conducting seafloor mapping, water column acoustic data collection, and ROV surveys with NOAA Ship Okeanos Explorer to provide baseline habitat characterizations and sharing the data with the public (Eakins et al., 2019). Standard operations have generally focused on the seafloor, however the Okeanos Explorer began conducting water column ROV surveys in 2012 on select dives to collect baseline information on the pelagic environment in response to expressions of interest from the water column scientific community (Ford and Netburn, 2017; Netburn et al., 2018).
During the 2017 Mountains in the Deep Expedition in the Central Pacific ocean, the Okeanos Explorer encountered an unexpected abundance of the pelagic holothurian (Class: Holothuroidea), Pelagothuria, while conducting both midwater and seafloor ROV surveys (Figure 1). There is some disagreement on whether the genus Pelagothuria is comprised of multiple species or a single species, Pelagothuria natatrix (Ludwig, 1893). Since no specimens were collected during the Mountains in the Deep Expedition for genetic or morphological species confirmation, we refer to these observations by genus only. Pelagothuria is the only holothurian that is considered to be holopelagic (Miller and Pawson, 1990) and thus a member of the plankton. Consequently, Pelagothuria have an unusual morphology for a holothurian, which Miller and Pawson (1990) described as resembling “an umbrella turned inside out by a gusting wind.”
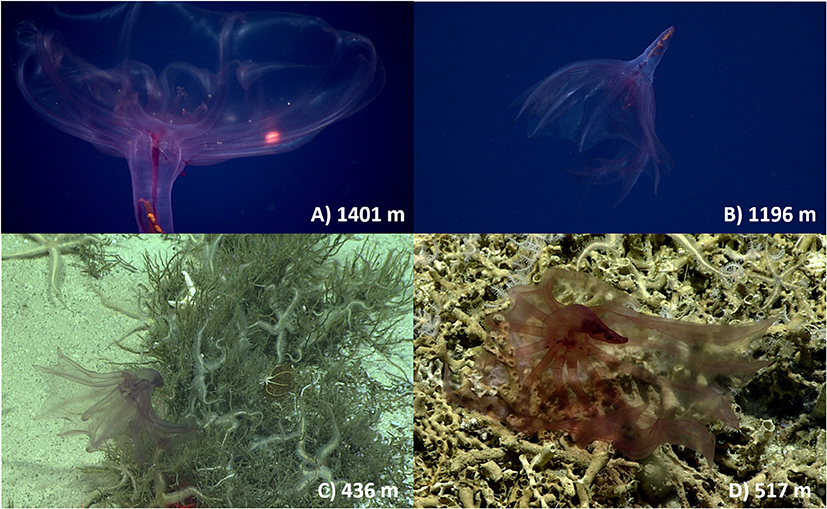
Figure 1. Images of Pelagothuria encountered on the NOAA Ship Okeanos Explorer Mountains in the Deep Expedition. Depths are indicated in the lower right corner of each image. The images were taken by the ROV Deep Discoverer in the water column on: (A) Dive 6—Keli'ihananui (B) Dive 3—Te Kawhiti a Maui Potiki and at the seafloor: (C) Dive 5—Jarvis Island, and (D) Dive 5—Jarvis Island. Image credit: NOAA Office of Ocean Exploration and Research, Mountains in the Deep 2017.
While Pelagothuria is anecdotally a cosmopolitan genus, there are only a limited number of confirmed observations in the scientific record and the global abundance and distributions of the taxon remain poorly documented (Figure 2). Through a review of published literature and online resources archiving publicly-available data, we identified a total of 428 specimens collected or observed by video (Figure 2; Table S1; Ludwig, 1893; Chun, 1900; Clark, 1920; Heding, 1940, 1950; Gebruk, 1989; Miller and Pawson, 1990; Jones et al., 2009; Buglass et al., 2019; Morris, 2019; National Museum of Natural History, 2019; Natural History Museum, 2019; OBIS, 2019; Orrell, 2019; Seid, 2019), including 151 specimens collected in the central Pacific in 2015 (Drazen, unpublished data) and 143 Pelagothuria seen on a 2019 E/V Nautilus expedition to the same region as our study. Pelagothuria are well-documented across tropical regions, however they have been observed in a range of geographies and conditions, such as in the Southern Ocean. The locations of all confirmed Pelagothuria observations are available in Table S1 and Figure 2.
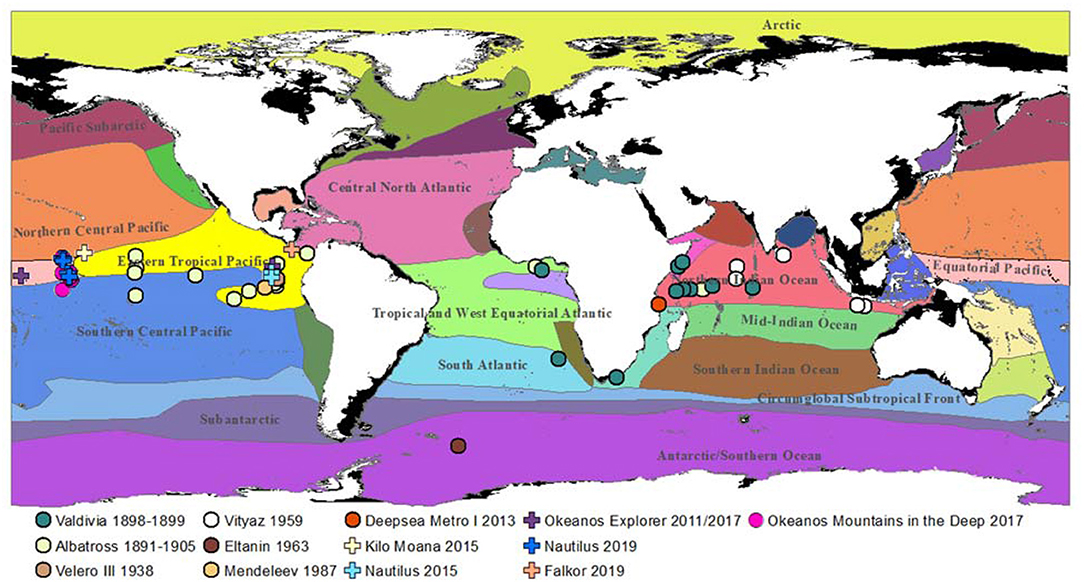
Figure 2. Confirmed observations of Pelagothuria overlaid on map of ecoregions as defined by Sutton et al. (2017). Further details on the expeditions are in Table S1.
Sutton et al. (2017) defined 33 ecoregions—areas with geographically-distinct faunal assemblages (Spalding et al., 2007)—based on daytime distributions of mesopelagic communities, water masses, presence of an oxygen minimum zone, surface productivity, temperature extremes, and biotic partitioning (Figure 2). The limited data available indicate that although Pelagothuria likely have a global distribution, they may be especially concentrated at tropical latitudes with high numbers in the Eastern Tropical Pacific (ETP), Equatorial Pacific, and Northern Indian Ocean ecoregions. Most Pacific observations are associated with the ETP, which is characterized by high primary productivity and strong layering of water masses, indicated by a shallow and abrupt thermocline (Sutton et al., 2017). The circulation of the equatorial Pacific ecoregion is complex, with a westward surface current, an eastward undercurrent within the thermocline, and strong upwelling (Kessler, 2006). This upwelling causes high primary production year round (Sutton et al., 2017). As a result, the assemblage of the mesopelagic fauna of the Equatorial Pacific has been found to differ significantly from those of both the Northern and Southern Central Pacific (Barnett, 1983). The ETP also has an oxygen minimum layer which is notable for both its size and the degree of hypoxia (Fiedler and Talley, 2006). The Northern Indian Ocean has a more broad and homogeneous OMZ than that of the Eastern Pacific margin with localized areas of upwelling (Helly and Levin, 2004; Sutton et al., 2017). Because animals differ greatly in their tolerances to hypoxia (Levin, 2003; Seibel, 2011), the apparent association of Pelagothuria with the ETP, Equatorial Pacific, and Northern Indian Ocean ecoregions suggests that the species may be particularly hypoxia-tolerant and thus able to thrive in oxygen minimum zone regions.
While we did not intentionally set out to study Pelagothuria, they were observed in high numbers and at multiple sites during ROV-based video surveys conducted on the Mountains in the Deep Expedition (EX1705). The aim of this study was to review video to quantify these observations to describe both geographic and vertical distributions of the poorly understood genus, Pelagothuria, examine their distributions in relation to environmental variables to try to identify possible drivers of the high concentrations of Pelagothuria observed in the region, and provide a baseline characterization of their habitat. An ancillary goal was to more broadly demonstrate how data collected in an exploratory context can inform understanding of a rare or rarely-observed taxon. Finally, we evaluated the real-time annotation software that was used during this expedition.
Methods
Shipboard Observations
The Mountains in the Deep Expedition (EX1705) took place on NOAA Ship Okeanos Explorer from 27 April to 19 May 2017, as part of NOAA's 2015–2017 Campaign to Address Pacific monument Science, Technology, and Ocean NEeds (CAPSTONE). CAPSTONE was an initiative to collect deepwater baseline information to support science and management decisions in and around the U.S. marine protected areas in the central and western Pacific, areas which include some of the least explored deep waters on Earth (Leonardi et al., 2019). Goals of the Mountains in the Deep Expedition were to collect geological and ecological data in and around two units of the Pacific Remote Islands Marine National Monument—the Jarvis Island Unit and the Kingman Reef and Palmyra Atoll Unit, as well as at Marae Moana in the Cook Islands (Bohnenstiehl et al., 2018). The Okeanos Explorer is a 68.3 m vessel equipped with a Kongsberg EM302 30 kHz multibeam sonar for seafloor mapping, Knudsen 3.5 kHz sub-bottom profiler to map geological characteristics below the seafloor, and Simrad 5-frequency EK60 echosounders to detect midwater organisms and features (e.g., gas bubbles). The 6,000 m-rated ROV Deep Discoverer (D2) is the primary platform for making in situ observations and collections. D2 is tethered to a secondary ROV, Seirios, which helps dampen the effects of ship heave, and provides a broad view of operations (Quattrini et al., 2015; Gregory et al., 2016). The forward-facing Insite Pacific Zeus Plus high-definition video Camera on D2 was used as the main scientific camera to direct the mission. Forward-facing illumination was provided by LEDs capable of providing 96,000 lumens of light, some of which were mounted on D2's four adjustable swing arms (D. Rogers, GFOE, pers. comm.). D2 was equipped with two mechanical manipulator arms to sample rocks, corals, and sponges, however at the time of this study, the ROV had no capability to collect pelagic organisms (Gregory et al., 2016). Both D2 and Seirios are equipped with SeaBird SBE-911 Plus CTDs with dissolved oxygen, turbidity, and oxygen reduction potential sensors.
All shipboard scientific sonars were typically operating throughout the night and during transits. ROV operations were conducted during the daytime, and the Simrad EK60 echosounders were run during the midwater ROV transects. The ROVs were typically launched at 0830 local time, and recovered after 8 h. Twelve ROV dives were conducted during the expedition between Pago Pago, American Samoa and Honolulu, Hawai'i (Figure 3, Table 1).
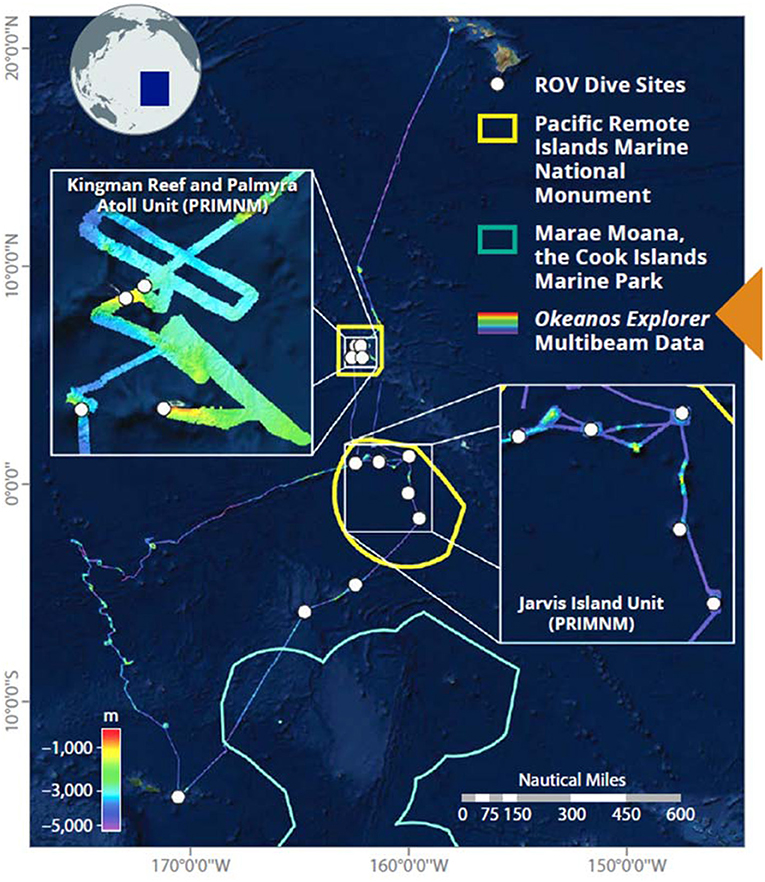
Figure 3. Mountains in the Deep Expedition on NOAA Ship Okeanos Explorer, conducted from 27 April to 19 May 2017. The cruise track shows the multibeam bathymetry and the white points are sites where seafloor ROV surveys were conducted. Midwater transects were conducted at three of these sites. Image courtesy of the NOAA Office of Ocean Exploration and Research.
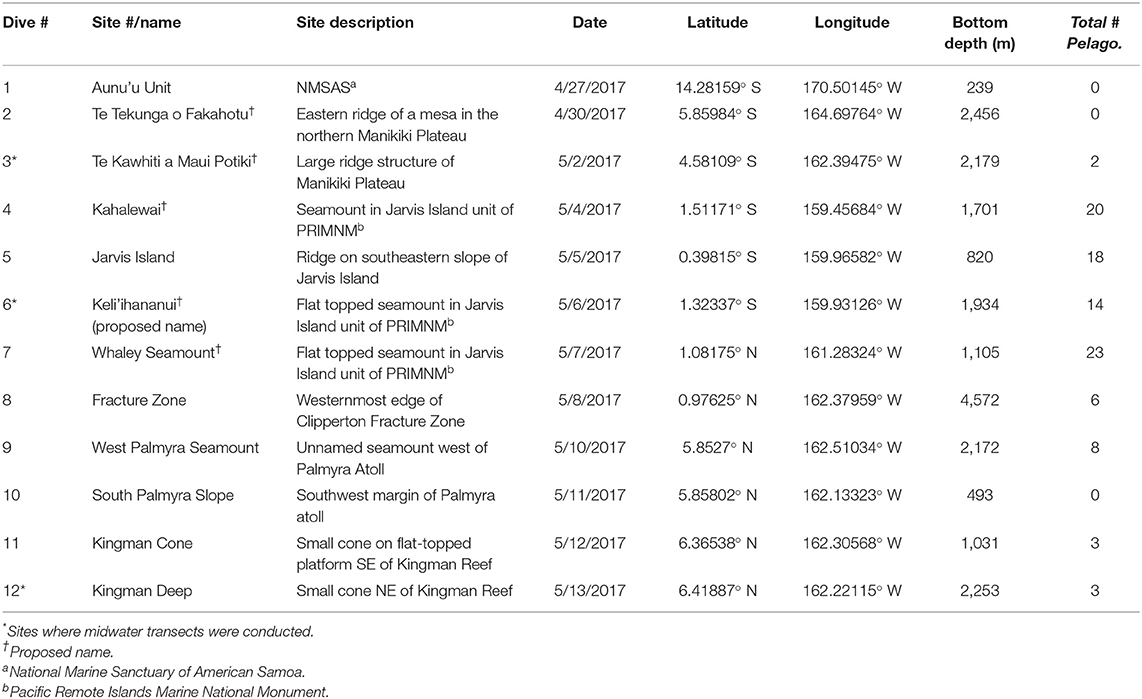
Table 1. ROV dive locations explored during the Mountains in the Deep expedition.
At the beginning of each dive, the ROVs descended to the seafloor, where D2 conducted visual benthic surveys and collected sessile organisms and rocks. At three sites, “Te Kawhiti a Maui Potiki” (Dive 3), “Keliihananui” (Dive 6), and “Kingman Deep” (Dive 12), the total ROV time was extended by 2 h, and exploratory midwater transects were conducted following the seafloor surveys at depths from 300 to 1,800 m during the ascent. While midwater ROV transects should ideally be conducted on descent to minimize known avoidance effects, the dual-body system on the Okeanos Explorer limited operations to ascent only. The Pelagothuria did not exhibit notable avoidance behavior, so it is likely that the data were not biased by this limitation. Scientists participating through telepresence selected depths for the midwater transects based on EK60 backscatter (e.g., to target deep scattering layers), ROV CTD profiles (e.g., to target the oxygen minimum), and an interest in surveying across a range of depths. During midwater transects, the ROV proceeded slowly through the water column at 0.1–0.4 kts while maintaining constant depth (within ±2 m of target depth). Direction of the transects was determined by currents and other conditions to optimize the likelihood of being able to stop the vehicles and take close-up video of target organisms in order to aid species identifications and observe the organisms' behaviors. Exploratory transects were typically conducted for 10 min at each target depth, which included time spent stopped and imaging organisms. Ascent speed between transect depths was on average 30 m min−1. Depths at which the midwater transects were conducted at each site are indicated in Table 2.
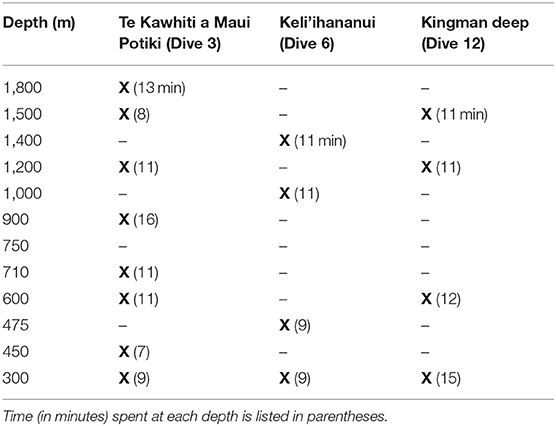
Table 2. For each site, the depths of exploratory water column transects are marked with an X.
Seafloor survey locations were selected based on prior knowledge of the region, existing and newly-collected mapping data, and science and management interests (e.g., potential for high coral and sponge cover). Seafloor surveys started at the deepest end of the target feature and moved upslope until the dive was complete. D2 transited the seafloor at an average speed of 0.2 kts (~0.1 m s−1) and intermittently stopped to focus in on or collect samples of characterization targets. The dives had an average ascent and descent rate of 25–30 m min−1 (Kennedy et al., 2019).
A unique aspect of Okeanos Explorer operations is the use of telepresence technologies to engage a broad range of scientists in expeditions (Peters et al., 2019). Onboard and shore-based scientists collaborated through the use of live-streaming video, a shared conference phone line, a text chatroom, and the SeaScribe annotation system. Live video was broadcast in real time and could be accessed at low-latency through Internet 2 or with a several second delay through standard internet. Scientists from 94 national and international institutions and organizations, as well as 8 divisions within NOAA, participated in the Mountains in the Deep Expedition, providing input on planning, real-time mission guidance, and interpretation of the ROV dives.
Annotations
A new capability introduced to Okeanos Explorer in the 2017 field season is the web-based annotation tool, SeaScribe, developed by Ocean Networks Canada (ONC). SeaScribe allows scientists both onshore and onboard the ship to annotate ROV operations (e.g., start and end of midwater transects), organisms observed, and seafloor characteristics (Jenkyns et al., 2013; Gomes-Pereira et al., 2016; Etnoyer et al., 2018). The real-time annotations provide valuable information to researchers and scientists analyzing the video post cruise, however there is currently no standardized process for quality control and assurance, and organism sightings may have been missed or incorrectly annotated during real-time annotations. Detailed review and post hoc analysis of the video imagery was therefore required to assure the completeness and accuracy of the real-time annotations.
Within 5–10 min after annotations are made in SeaScribe, they are made publicly available along with streaming video capabilities through a second ONC tool called SeaTube, available at the website: https://data.oceannetworks.ca/SeaTubeV2. OER began beta testing SeaTubeV2 for video playback and annotations in 2017. SeaTube has a function to search the video annotations by text for targets of interest, and has the capability to capture screenshots and video clips, and to bookmark video of interest. An additional capability exists to create and edit new annotations. This function is restricted to registered users in order to track the source of annotations and edit history. We used SeaTube to review and annotate all 12 dives of the Mountains in the Deep expedition for Pelagothuria, including during midwater transects, seafloor surveys, and the initial descents and final ascents at each site. For each Pelagothuria observation entered as an annotation in SeaTube, the position, depth, temperature, salinity, and dissolved oxygen were recorded as measured by sensors on the ROV. The video review and annotations were completed in June–July 2018. A complete list of annotations made during the project is available in Table S2.
Analysis/Visualization
We plotted the locations and relative abundances of Pelagothuria over the ecoregions defined by Sutton et al. (2017) to qualitatively evaluate whether the taxon is associated with a particular ecoregion within the vicinity of our 2017 study. We also plotted the locations of all known global Pelagothuria sightings as identified through literature and database review on a global map of the ecoregions. The depths of the Pelagothuria observations were plotted and overlaid with profiles of salinity, temperature, and dissolved oxygen to inspect for associations with depth, hypoxic waters, and other physical-chemical features throughout the water column. We made frequency histograms of the temperature, salinity, and dissolved oxygen values where Pelagothuria were found. The locations of all known Pelagothuria observations—including from this study—were plotted over dissolved oxygen at 200 m to qualitatively evaluate for a possible association of Pelagothuria with oxygen minimum zone regions (Garcia et al., 2018). We also investigated a possible affinity of Pelagothuria for areas with high particle flux by plotting the observations over modeled mean particulate organic carbon flux at 500 m for years 2000–2009 (data provided by A. Yoole; Yoole et al., 2007). Finally, to assess how well the real-time annotations captured occurrences of the taxon, we compared the number of real-time annotations and post-cruise annotations of Pelagothuria.
Results
Data from the expedition can be found at the Ocean Exploration Digital Atlas (https://www.ncddc.noaa.gov/website/google_maps/OE/mapsOE.htm; Cantwell et al., 2017). Streaming video can be accessed through SeaTube and higher-resolution clips are available at the OER Video Portal (https://www.nodc.noaa.gov/oer/video/). Video from all 12 ROV dives was reviewed, totaling 96 h of video replay. Pelagothuria were observed at 9 of the 12 dive sites, with a total of 97 individuals observed throughout the expedition (Figure 4, Tables 1, 2). The last column of Table 1 lists the total number of Pelagothuria observed at each ROV dive site. The ROV dive sites spanned three different ecoregions as defined by Sutton et al. (2017)—Southern Central Pacific, Eastern Tropical Pacific, and the edge of the Northern Central Pacific. Seventy-one percent of the observations of Pelagothuria were found in the Equatorial Pacific ecoregion just west of the Eastern Tropical Pacific, 20% were just south of the boundary between the Equatorial Pacific and the Southern Central Pacific ecoregions, and the remainder just north of the boundary between the Equatorial Pacific and the Northern Central Pacific (Figure 4).
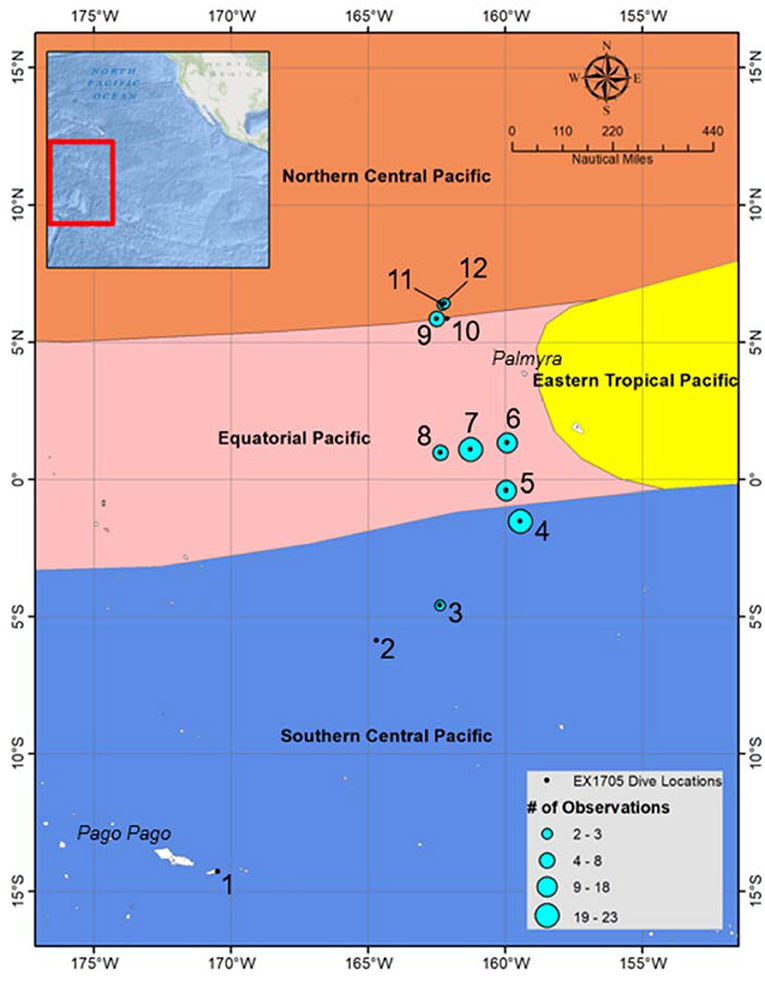
Figure 4. Locations of all dives conducted during the Mountains in the Deep Expedition are marked in black, and labeled by Dive number (refer to Table 1 for site details). Sites where Pelagothuria were observed are indicated by blue circles, sized according to the number of observations. The background is color-coded by ecoregions as defined by Sutton et al. (2017).
Pelagothuria were found in depths ranging from 197 to 4,441 m (Figures 5, 6, Table 3), temperatures ranging from 1.30 to 15.40°C (Figures 5–7, Table 3), salinities from 34.6 to 35.2 (Figures 5, 6, 8, Table 3), and dissolved oxygen concentrations from 0.18 to 3.8 mg L−1 (Figures 5, 6, 9, Table 3).
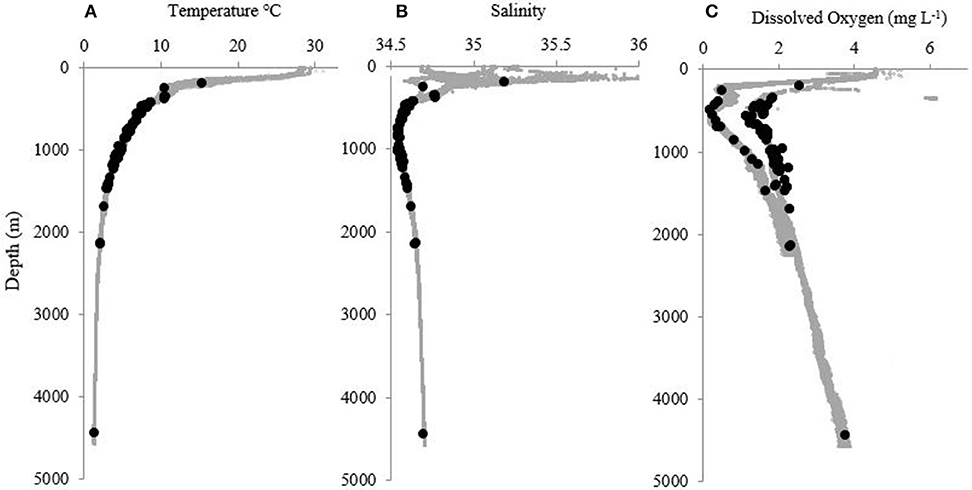
Figure 5. Profiles of (A) temperature (°C), (B) salinity, and (C) dissolved oxygen (mg L−1) at all sites where at least one Pelagothuria was observed during the Mountains in the Deep expedition. Black points indicate the depth of Pelagothuria observations.
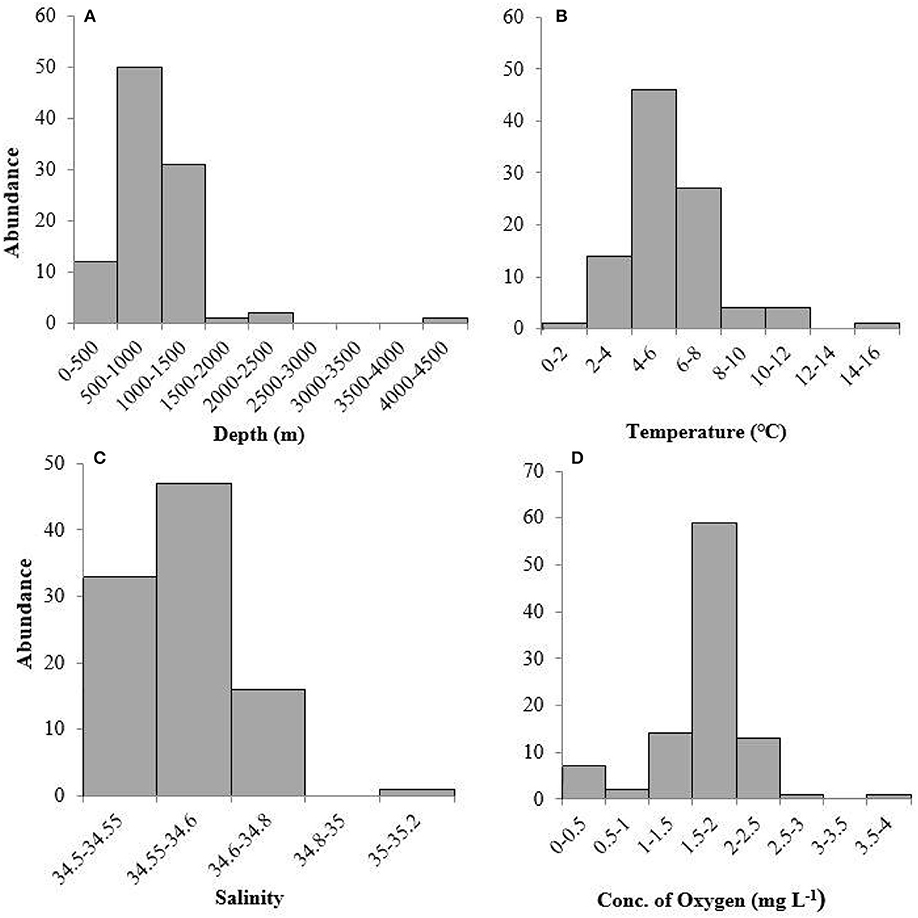
Figure 6. Frequency histograms of (A) depth, (B) temperature, (C) salinity, and (D) dissolved oxygen measurements where Pelagothuria were observed during the 2017 Mountains in the Deep Expedition.
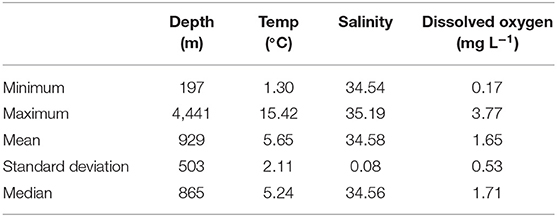
Table 3. Summary statistics for environmental data where Pelagothuria were observed in the 2017 mountains in the Deep Expedition.
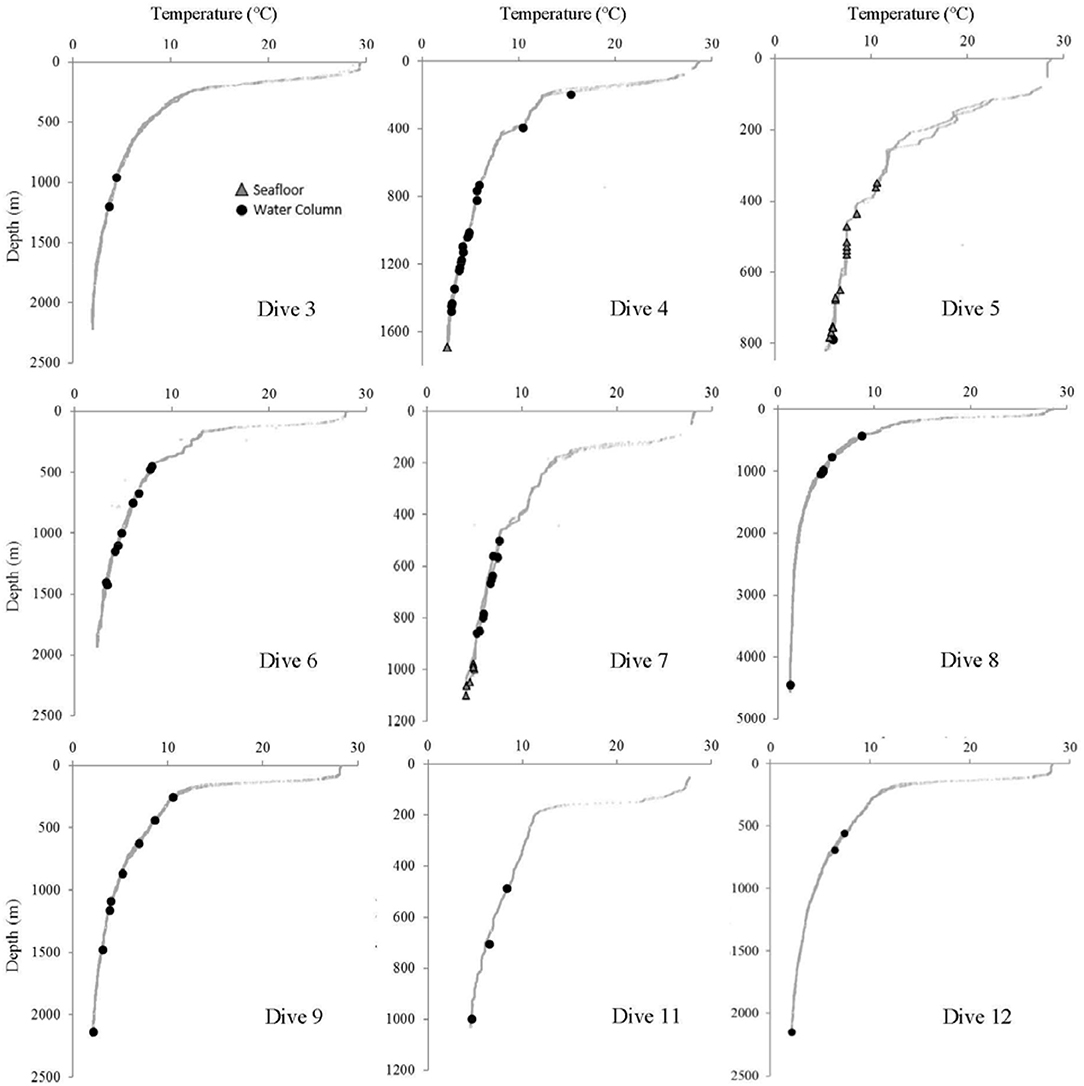
Figure 7. Temperature at every site where at least one Pelagothuria was observed during the Mountains in the Deep Expedition. Black points indicate the depth of water column Pelagothuria observations and gray triangles represent the depth of Pelagothuria seen at the seafloor.
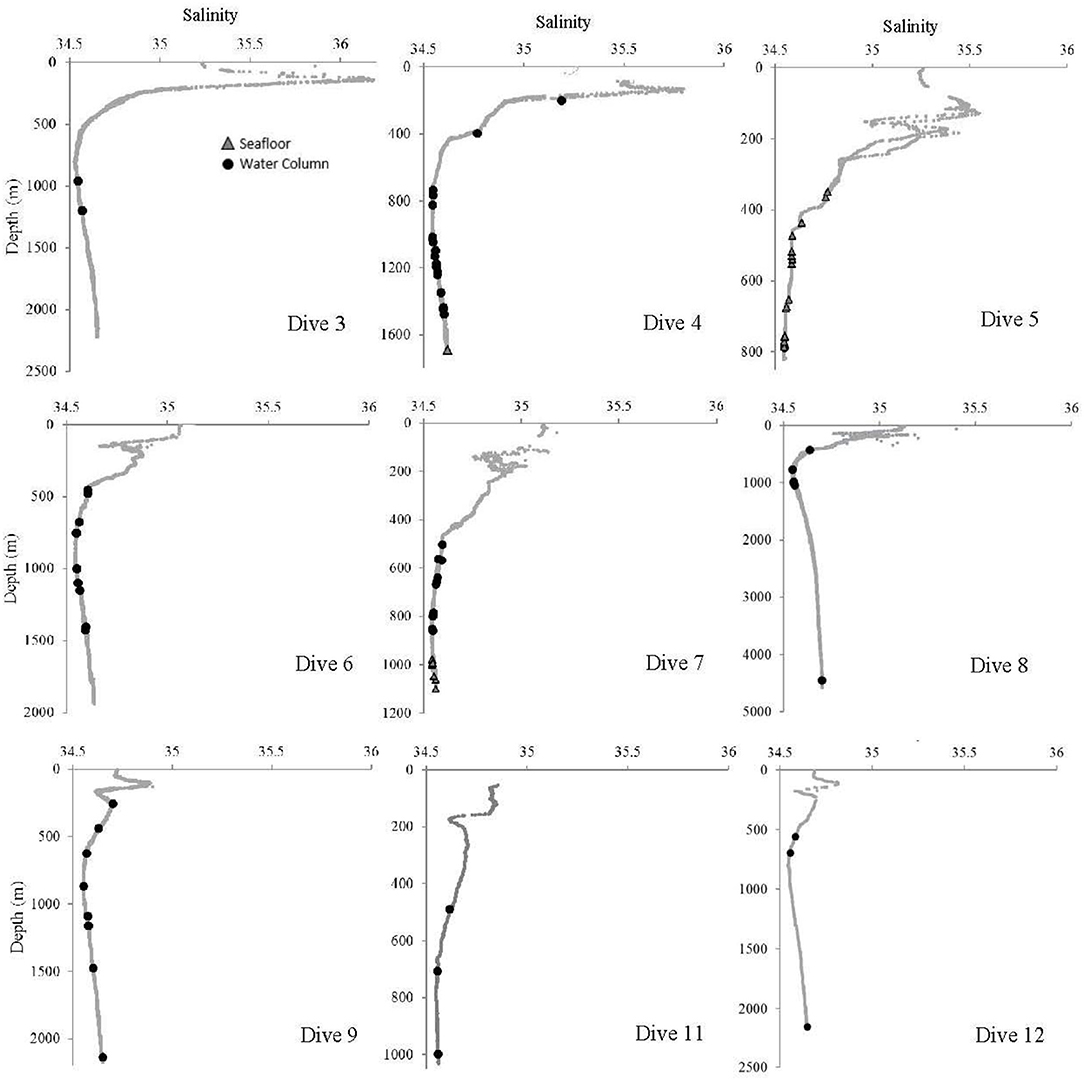
Figure 8. Salinity at each site where at least one Pelagothuria was observed during the Mountains in the Deep Expedition. Black points indicate the depth of water column Pelagothuria observations and gray triangles represent the depth of Pelagothuria seen at the seafloor.
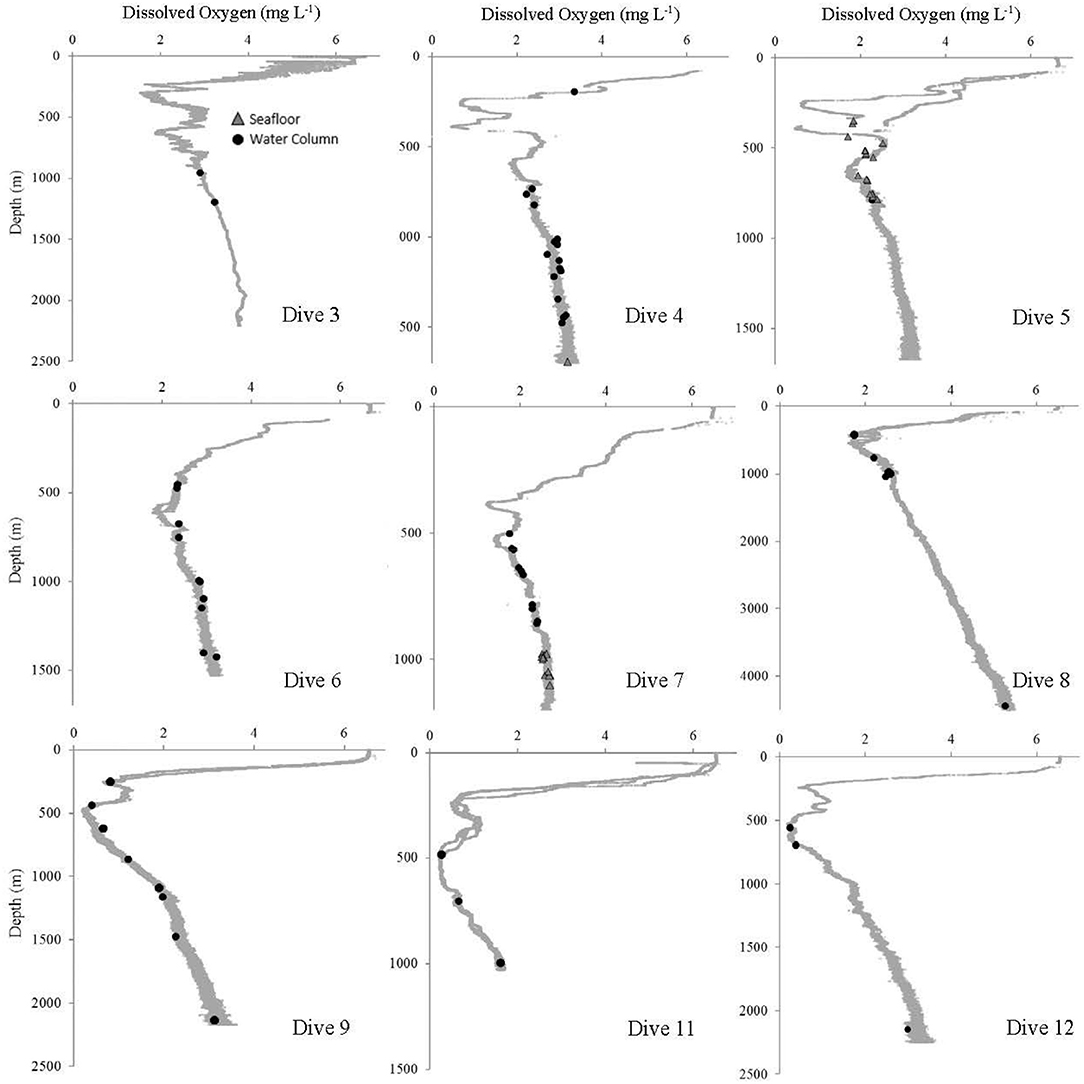
Figure 9. Dissolved oxygen at each site where at least one Pelagothuria was observed during the Mountains in the Deep Expedition. Black points indicate the depth of water column Pelagothuria observations and gray triangles represent the depth of Pelagothuria seen at the seafloor.
Discussion
Biogeography
The data collected from the Mountains in the Deep Expedition, along with the inclusion of other recent unpublished data, significantly increases the number of confirmed direct observations of Pelagothuria in the midwater environment, and contributes data points to fill in the global biogeography of the taxon (Figures 2, 10, 11). While Pelagothuria have previously been documented across tropical latitudes, our results add to the known range southerly into the central portion of the Southern Central Pacific and westward into the Equatorial Pacific, which was also corroborated by the observation from the Okeanos Explorer Discovering the Deep Expedition (Figures 2, 10, 11, Table S1). However, while the observations made in this study were mostly within the Equatorial Pacific and waters just north and south of this ecoregion, the locations were close to the ETP, where the majority of observations of Pelagothuria in the Pacific have previously been made. It is possible that the ETP water mass extended into the Equatorial Pacific ecoregion due to seasonal variation at the time of the Mountains in the Deep Expedition. Sutton et al. (2017) acknowledged that the ecoregion boundaries are not static. We did not see any Pelagothuria during dives (sites 1 and 2) in the southernmost portion of the expedition, which are further from the influence of the ETP water mass.
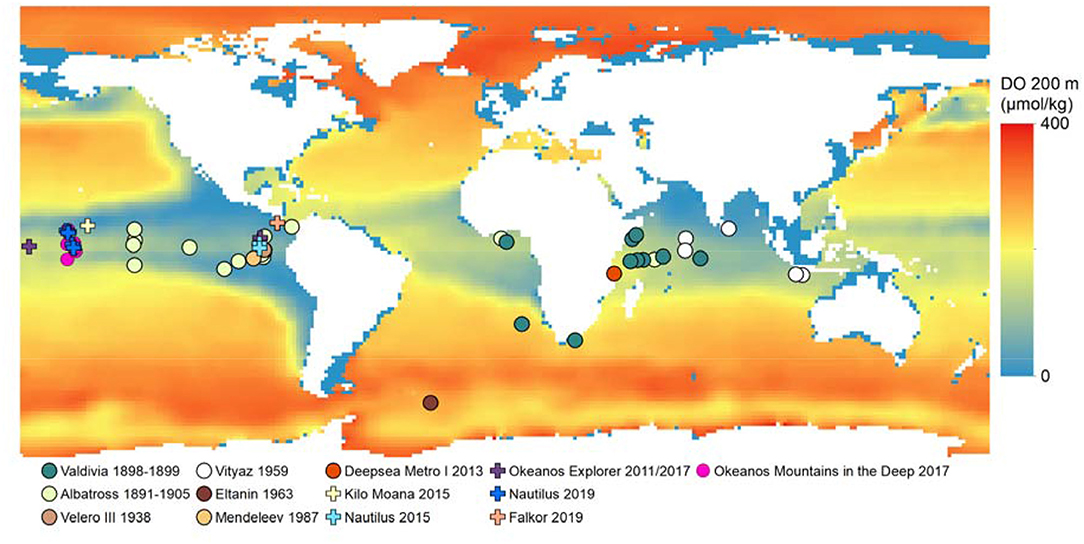
Figure 10. Observations of Pelagothuria overlaid on map of dissolved oxygen (μmol kg−1) at 200 m from the NOAA National Center for Environmental Information (NCEI) World Ocean Atlas 2018 (Garcia et al., 2018). Further details on the expeditions are in Table S1.
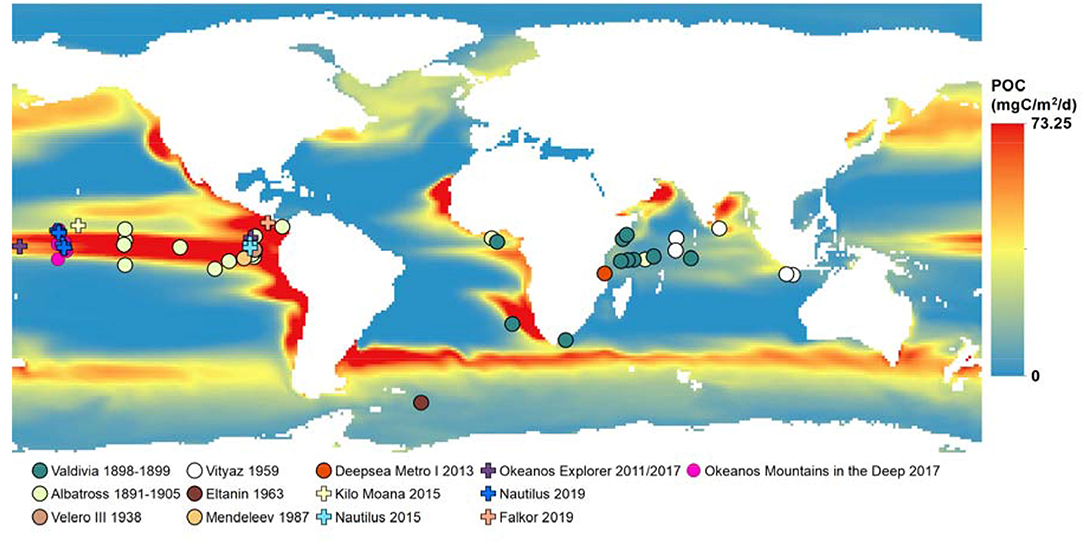
Figure 11. Observations of Pelagothuria overlaid on a map of mean particulate organic carbon flux at 500 m as modeled by Yoole et al. (2007, and Yoole, pers. comm.) for years 2000–2009. Further details on the expeditions are in Table S1.
The increased knowledge of the biogeography of a poorly-documented organism demonstrates the value of making exploratory observations in understudied parts of the ocean. Further observations throughout the global ocean are required to fill in the biogeographic gaps in the distribution of Pelagothuria. Publicly-available ROV video that was not originally collected for these purposes may be leveraged to observe and document pelagic organisms.
The high numbers of Pelagothuria we saw in the Central Pacific begets the question of whether there were environmental parameters that set up conditions favorable to a Pelagothuria bloom or whether high abundance of the taxon is a perennial feature of the region. There were some anomalous climatic events in the region in the couple of years before our observations took place that may have put the ocean in an atypical state to support high numbers of these animals (Di Lorenzo et al., 2015). The unusually warm conditions of 2013-15 throughout much of the Pacific (aka “the warm blob”; Bond et al., 2015; Di Lorenzo and Mantua, 2016) and the strong El Niño event of 2015–2016 (Jacox et al., 2016; Chen et al., 2017) had effects on organisms throughout the north Pacific (Cavole et al., 2016; Racault et al., 2017; Brainard et al., 2018), and could have provided conditions favorable for a Pelagothuria bloom. The high abundances of the organism seen on a nearby 2015 expedition (J. Drazen, pers. comm.; points labeled “RV Kilo Moana” in Figures 2, 10, 11 and listed in Table S1) occurred during the peak of the warming event which supports this hypothesis, but they were also seen in abundance during a 2019 EV Nautilus expedition that occurred after the warm blob/El Niño events. We suggest that dominance of Pelagothuria is a persistent, or at least common, feature in the region. Repeat observations in the region across different climatic conditions would continue to provide data to distinguish between these possibilities and understand the factors that are conducive to large populations of this unique organism in this region.
Vertical Distributions
Some notable environmental features were detected in the vertical profiles of temperature, salinity, and dissolved oxygen. The temperature profiles have a stepwise structure at ~200–300 m at some stations (Dives 4, 5, 6, 7, and 11), indicating there may be submerged mixed layer waters (Figure 7). At all but one site (Dive 4), the Pelagothuria were found below this layer. At Dive sites 5, 6, 7, 9, 11, and 12 there was a sharp salinity inversion around 200 m (Figure 8). The Pelagothuria were all observed well below this feature. A pronounced oxygen minimum, with values below (and in some cases, well below) 1.0 mg L−1 were observed at stations 4, 5, 9, 11, and 12 (Figure 9). At all sites except one (Dive 4), the Pelagothuria were found within or below the oxygen minimum, supporting the hypothesis that they are hypoxia tolerant. There was an oxygen inversion between ~350 and 500 m at Dive sites 3, 4, 5, 7, 9, 11, and 12 that suggest there may be an intrusion at these depths of the more highly-oxygenated Equatorial Pacific water mass into the hypoxic Eastern Tropical Pacific waters. At all but one of these sites, the Pelagothuria were encountered either above or below this intrusion, again suggesting that they associate with the ETP. The one site where Pelagothuria were found within this layer is at Dive 5, where all individuals encountered were at or very near the seafloor, an anomalous observation we discuss below.
Because all ROV dives were conducted during the daytime, it is not possible to say whether Pelagothuria conduct diel vertical migration (DVM), however J. Drazen (pers. comm.) did see distribution patterns suggesting that they do based on paired day-night MOCNESS sampling during his nearby expedition off of the R/V Kilo Moana in 2015. The depths of peak abundance of Pelagothuria as observed by depth-stratified MOCNESS trawls were 700–1,500 m during the day with bimodal peaks at night at 100–400 m and 1,000–1,500 m. We suggest that vertically-stratified exploratory transects be conducted throughout the global ocean in order to provide enough data to quantitatively investigate the factors that affect the vertical distributions of Pelagothuria and other rarely-observed organisms in the water column. Paired day-night surveys at the same location would not only allow us to look for evidence of DVM, but provide an opportunity to observe the mechanism Pelagothuria use to migrate between depths.
Horizontal Distribution
Pelagothuria are broadly distributed across the ocean, and are not limited only to low oxygen regions (Figure 10). For example, a documented observation of the animal in the southern ocean suggests they survive in well-oxygenated and cool, high-latitude waters (Figure 1, Table S1) and they are also seen in relatively well-oxygenated waters off the east coast of Africa. Though observations across the full globe remain limited, we suggest that Pelagothuria is cosmopolitan, but may be more common in hypoxic waters because they may be able to outcompete more active animals in these zones.
Another factor that could determine where Pelagothuria are found in high abundances is related to their feeding habits. As suspension feeders, they are thought to rely heavily on marine snow and other particulate carbon sources. Numerous benthic deep-sea holothurians are known to be reliant on incoming marine snow (organic particle flux); for example, Scotoplanes sp. aggregate toward dead and decaying fish on the seafloor (Miller and Pawson, 1990). A significant correlation between holothurian abundance and organic carbon flux to the seafloor was also found by Sibuet (1985) in the tropical Atlantic. A Pelagothuria found in the Indian Ocean had exclusively pelagic components in its gut, such as pelagic diatoms, radiolaria, foraminifera, and copepod feces (Gebruk, 1990). We examined global patterns of organic particle flux from measurements (Mouw et al., 2016) and models (Yoole et al., 2007; Agostini et al., 2009; DeVries and Weber, 2017). There appears to be an association between areas of high carbon flux and Pelagothuria sightings, particularly in the Pacific Ocean and in coastal areas, though the association is less clear in the Indian Ocean (Figure 11).
Seafloor Observations
Thirty percent (n = 27) of the Pelagothuria seen on the Mountains in the Deep Expedition were encountered at or within sight of the seafloor. Four individuals were observed directly on the seafloor at Jarvis Island (Dive 5, Figure 1), at 517, 473, 436, and 363 m. It was not clear if they were intentionally utilizing the seafloor as habitat or had gotten caught on coral rubble. This benthic survey focused on a small ridge on the southeastern slope of the Jarvis Island Unit of PRIMN which are part of the Line Islands linear volcanic chain (Davis et al., 2002). A high abundance and diversity of marine organisms were observed in this dive compared to others in the expedition which is most likely due to the shallower depth range of 349–820 m. Dead and broken scleractinian coral branches were first encountered at 820 m where the ROV reached bottom. Large carbonate sections of rocks created overhangs that provided a habitat for suspension-feeding fauna. At 415 m bamboo colonies were overgrown by a yellow zoanthid and at 385 m, an area of low relief dense with primnoid fans and urchins was observed (Cantwell et al., 2019).
Pelagothuria are generally described as holopelagic, living and feeding entirely in the water column (Miller and Pawson, 1990). However, there is some evidence that Pelagothuria have been encountered near the seafloor in the past. Lemche et al. (1976) described a Pelagothuria from a blurred image that has since been discounted as being a cnidarian (Miller and Pawson, 1990). Miller and Pawson (1990) described the swimming behavior of a Pelagothuria that was encountered just meters from the seafloor, but did not consider that the organism may have been associating with the seafloor environment. Though they found only pelagic organisms and unidentifiable organisms in the guts, they only collected a single individual, so there was not a lot of data. It is possible that Pelagothuria do settle on the seafloor for periods of time, perhaps related to feeding, reproduction, or shelter. There are thousands of hours of video data available from various deep submergence programs (e.g., Woods Hole Oceanographic Institution's National Deep Submergence Facility, NOAA OER's Okeanos Explorer and grant-funded projects, E/V Nautilus, etc.) that have been collected over several decades for seafloor investigations. It is likely that numerous individuals of Pelagothuria have been imaged but not documented in the literature or available databases. A review of these videos specifically for Pelagothuria would help to understand both the prevalence and purpose of their presence on the seafloor. Targeted studies where Pelagothuria are known to be abundant, such as in the ETP, could provide an opportunity to make longer observations of the organisms in order to examine their behavior at the seafloor.
Evaluation of Real-Time Annotations
The dataset generated from the real-time annotations and available through SeaTube included 33 annotations of Pelagothuria, only about a third of the 97 individuals that were annotated through methodical post hoc review of the ROV dives. The accuracy and completeness of the real-time annotations is limited primarily by two factors: (1) available expertise—the researchers annotating the video must have significant expertise to be able to make accurate identifications of a range of different taxa in real time, and (2) limited observation time—organisms in the water column often move past the camera very quickly and multiple organisms may be seen simultaneously, requiring a very fast response time to input all of the annotations. An inherent challenge of the community-based approach to exploration is the willingness of participating scientists to consistently annotate the video and share these annotations. NOAA Office of Ocean Exploration and Research has started to address this challenge by providing SeaTube as an annotation tool that enables participants to annotate both in real-time and after the dive is complete. However, if the annotations are made only in personal notebooks, in chatrooms, or in individually-managed databases, as often occurs, they will not be available to the broader community.
Creating a quality-controlled database of annotations is a challenge for any operation that utilizes a distributed network of scientists and is committed to providing publicly-available data (e.g., Ocean Exploration Trust's E/V Nautilus, Schmidt Ocean Institute's R/V Falkor). While some powerful tools exist for making both real-time and post hoc annotations, such as Monterey Bay Aquarium Research Institute's Video Annotation and Reference System, such tools are designed for a traditional research expedition, where the onboard team has the needed expertise. Okeanos Explorer operations sail with a limited science team, and rely on a distributed network of experts for annotations.
Tools like SeaTube make the video and environmental data accessible to interested researchers in an online collaborative environment, which alleviates some issues with accessing and integrating the datasets following an expedition. However, reviewing and annotating video remains extremely labor and time intensive. Reviewing the video to build a complete and accurate dataset of Pelagothuria observations for this study required a significant time commitment, around 10 h beyond the 96 h of video reviewed, and this was for a study for just a single target. Though we know of multiple publicly-available video archives, including from other Okeanos Explorer expeditions, this study was limited to a single expedition because of this constraint.
Recommendations to improve the completeness and accuracy of real-time annotations include taxonomic training and delegating individuals to make the annotations. These recommendations would aid scientists across taxonomic interests and disciplines, and apply to post hoc annotations as well. Though there would be costs involved with these approaches (both in money and time), the benefit of having quality-controlled annotations would save scientists significant time in the post-cruise analysis as they would be able to find the video of organisms and features of interest.
A promising opportunity to significantly reduce the time and labor required to make video annotations is to apply machine learning algorithms to image classification. However, many complete and accurate annotations are required in order to train the machine learning algorithms. Other challenges to using machine learning for image classification exist such as the orientation of the marine organism and turbidity of the water (Margolis et al., 2019). Complete and accurate annotations of the whole range of taxa encountered on exploratory expeditions would greatly improve our understanding of biogeography, and provide baseline characterization data at every explored site that can be used to make comparisons between locations and over time.
Conclusion
Documented observations of Pelagothuria are relatively rare throughout the global ocean, however it is clear from this and several other studies that they are not exactly uncommon. Through this study, we contributed substantially to the number of known encounters with Pelagothuria, found evidence that they are able to tolerate highly hypoxic waters, and discovered they associate with the seafloor in fairly significant numbers. Observations throughout the global ocean and over time are required to test whether Pelagothuria exist in high abundances in other water masses and conditions and to understand the nature of their association with the seafloor. While this study focused on just a single taxon, we emphasize the value of conducting similar studies on a range of water column organisms in order to provide a comprehensive understanding of abundances and distributions of deep pelagic organisms.
There has been recent interest in increasing understanding of processes and life in the water column (Netburn, 2018). The water column has historically been overlooked by exploration initiatives, despite the outsize role of the deep pelagic environment in supporting marine food webs and fisheries production, and regulating climate through carbon transport to the deep seafloor (Robinson et al., 2010). Data on the diversity and distributions of the organisms living in the water column provide baseline characterizations which may be used to monitor the responses of this community to both natural climate variability and anthropogenic climate change, marine pollution, and overfishing (Ramirez-Llodra et al., 2011). Though Pelagothuria are not likely to be the direct targets of fisheries, the high numbers we observed in the Central Pacific Ocean and their circumglobal distributions indicate that they may have a critical role in the marine environment. Thus, understanding their distributions and the factors that support their populations is relevant to understanding the marine environment as a whole. This study demonstrates how dedicating survey time and post hoc analysis for water column exploration can fill gaps in our understanding of this underexplored portion of the marine environment. It will take many such studies, as well as a persistent, expansive, and coordinated community effort to achieve the goals of knowing, understanding, and monitoring the distributions and behaviors of the full diversity of fauna in the deep pelagic environment.
Data Availability Statement
All datasets generated for this study are included in the article/Supplementary Material.
Author Contributions
AN led the conceptualization and design of the work, acquisition of data, interpretation of the data, and the writing and editing the paper. GS led the analysis and initial draft of the manuscript, created figures, and contributed to design, writing, and editing of the manuscript. MM contributed to the conceptualization and design of the work, figure generation, and interpretation of the data, particularly with regards to the evaluation of the real-time annotations. He also contributed to writing and editing of the manuscript. All authors approved the final content for submission.
Conflict of Interest
The authors declare that the research was conducted in the absence of any commercial or financial relationships that could be construed as a potential conflict of interest.
Acknowledgments
This study was sponsored by the NOAA Office of Education Educational Partnership Program (EPP) and the NOAA Office of Ocean Exploration and Research and made possible by the efforts of NOAA Ship Okeanos Explorer Expedition Coordinator, Kasey Cantwell, Expedition Mapping Lead, Michael White, and the onboard Science Leads Scott France and Del Bohnenstiehl. We thank all the onboard crew, the Global Foundation for Ocean Exploration ROV pilots, and associated personnel involved with the Mountains in the Deep Expedition, as well as the network of scientists participating via telepresence. Data was made available by Jeff Drazen and Yuuki Niimi, from work supported by the National Science Foundation. Data from the Ocean Exploration Trust's E/V Nautilus cruise NA110 was sponsored by the NOAA-OER grant NA17OAR0110336 and permitted by NOAA, the Pacific Remote Islands Marine National Monument, and the U.S. Fish and Wildlife Service (permit 12543-19002). Timothy DeVries and Andrew Yoole provided assistance on POC flux data. We thank Erica Ta for guidance with ArcGIS. English translations of literature were made available by Andrey Gebruk and Antonina Kremenetskaia. Christopher Mah provided previously-translated literature as well.
Supplementary Material
The Supplementary Material for this article can be found online at: https://www.frontiersin.org/articles/10.3389/fmars.2019.00684/full#supplementary-material
References
Agostini, V., Arico, S., Briones, E., Clark, M., Cresswell, I., Gjerde, K., et al. (2009). Global Open Oceans and Deep Seabed (GOODS) Biogeographic Classification. UNESCO-IOC Technical Series, 84.
Barham, E. G. (1966). Deep scattering layer migration and composition: observations from a diving saucer. Science 151, 1399–1403. doi: 10.1126/science.151.3716.1399
Barnett, M. A. (1983). Species structure and temporal stability of mesopelagic fish assemblages in the Central Gyres of the North and South Pacific Ocean. Mar. Biol. 74, 245–256. doi: 10.1007/BF00403448
Bohnenstiehl, D. R., France, S. C., Cantwell, K., and White, M. (2018). “Mountains in the deep: exploration of the seamounts of the Central Pacific Basin,” in New Frontiers in Ocean Exploration: The E/V Nautilus, NOAA Ship Okeanos Explorer, and R/V Falkor 2017 Field Season, Vol. 31, eds N. A. Raineault, J. Flanders, and A. Bowman (Oceanography), 78–81.
Bond, N. A., Cronin, M. F., Freeland, H., and Mantua, N. (2015). Causes and impacts of the 2014 warm anomaly in the NE Pacific. Geophys. Res. Lett. 42, 3414–3420. doi: 10.1002/2015GL063306
Brainard, R. E., Oliver, T., McPhaden, M. J., Cohen, A., Venegas, R., Heenan, A., et al. (2018). Ecological impacts of the 2015/16 El Niño in the central equatorial Pacific. Bull. Am. Meteorol. Soc. 99, S21–S26. doi: 10.1175/BAMS-D-17-0128.1
Buglass, S., Arnés-Urgellés, C., Marsh, L., and Nagy, S. Data From: Macroinvertebrate Groups Found on Deep-Sea Volcanic Habitats in the Galapagos Marine Reserve in the Eastern Tropical Pacific Ocean: Echinoderms. Version 1.9. Charles Darwin Research Station, Occurrence dataset. (2019).
Cantwell, K., France, S., and Bohnenstiehl, D. (2017). Oceanographic Data and Information Collected During the EX1705 American Samoa, Kingman/Palmyra, Jarvis (ROV and Mapping) Expedition on NOAA Ship Okeanos Explorer in the Pacific Ocean From 2017-04-27 to 2017-05-19 (NCEI Accession 0163984). Version 1.1. NOAA National Centers for Environmental Information, Silver Spring, MD.
Cantwell, K., France, S. C., Bohnenstiehl, D. R., White, M. P., Netburn, A. N., and Bowman, A. (2019). EX1705 Mountains in the Deep: Exploring the Central Pacific Basin Expedition Report. Office of Ocean Exploration and Research, Office of Oceanic and Atmospheric Research, NOAA, Silver Spring, MD.
Cavole, L. M., Demko, A. M., Diner, R. E., Giddings, A., Koester, I., and Pagniello, C. (2016). Biological impacts of the 2013–2015 warm-water anomaly in the Northeast Pacific: winners, losers, and the future. Oceanography 29, 273–285. doi: 10.5670/oceanog.2016.32
Chen, L., Li, T., Wang, B., and Wang, L. (2017). Formation mechanism for 2015/16 super El Niño. Sci. Rep. 7:2975. doi: 10.1038/s41598-017-02926-3
Choy, A., Haddock, S., and Robison, B. H. (2017). Deep pelagic food web structure as revealed by in situ feeding observations. Proc. R. Soc. B Biol. Sci. 284:20172116. doi: 10.1098/rspb.2017.2116
Clark, H. L. (1920). Holothuroidea. Report XXXII on the scientific results of the expedition of the “Albatross” to the Tropical Pacific, 1899-1900 and 1904-1905. Mem. Mus. Comp. Zool. Harv. Coll. 39, 121–154.
Davis, A. S., Gray, L. B., Clague, D. A., and Hein, J. R. (2002). The Line Islands revisited: new 40Ar/39Ar geochronologic evidence for episodes of volcanism due to lithospheric extension. Geochem. Geophys. Geosyst. 3, 1–28. doi: 10.1029/2001GC000190
DeVries, T., and Weber, T. (2017). The export and fate of organic matter in the ocean: new constraints from combining satellite and oceanographic tracer observations. Global Biogeochem. Cycles 31, 535–555. doi: 10.1002/2016GB005551
Di Lorenzo, E., Combes, V., Keister, J. E., Strub, P. T., Thomas, A. C., Franks, P. J. S., et al. (2015). Synthesis of Pacific Ocean climate and ecosystem dynamics. Oceanography 26, 68–81. doi: 10.5670/oceanog.2013.76
Di Lorenzo, E., and Mantua, N. (2016). Multi-year persistence of the 2014/15 North Pacific marine heatwave. Nat. Clim. Change 6, 1042–1047. doi: 10.1038/nclimate3082
Dunn, C. W., Pugh, P. R., and Haddock, S. H. D. (2005). Marrus claudanielis, a new species of deep-sea physonect siphonophore (Siphonophora, Physonectae). Bull. Mar. Sci. 76, 699–714.
Eakins, B., Gottfried, S., Murphy, P., Lovalvo, D., and Sowers, D. (2019). “It takes a village! Managing data from Okeanos Explorer,” in New Frontiers in Ocean Exploration: The E/V Nautilus, NOAA Ship Okeanos Explorer, and R/V Falkor 2018 Field Season, Vol. 150, eds N. A. Raineault and J. Flanders (Oceanography) 106–109.
Etnoyer, P. J., Malik, M., Sowers, D., Ruby, C., Bassett, R, Dijkstra, J., et al. (2018). “Working with video to improve deep-sea habitat characterization,” in New Frontiers in Ocean Exploration: The E/V Nautilus, NOAA Ship Okeanos Explorer, and R/V Falkor 2017 Field Season, Vol. 31, eds N. A. Raineault, J. Flanders, and A. Bowman (Oceanography), 64–67. doi: 10.5670/oceanog.2018.supplement.01
Fiedler, P. C., and Talley, L. D. (2006). Hydrography of the Eastern Tropical Pacific: a review. Prog. Oceanogr. 69, 143–180. doi: 10.1016/j.pocean.2006.03.008
Ford, M., and Netburn, A. N. (2017). “The 2016 midwater exploration of the Mariana Region,” in: New Frontiers In Ocean Exploration: The E/V Nautilus, NOAA Ship Okeanos Explorer, and R/V Falkor 2016 Field Season, Vol. 30, eds K. L. C. Bell, J. Flanders, A. Bowman, and N. A.Raineault (Oceanography), 36–37. doi: 10.5670/oceanog.2017.supplement.01
Frank, T. M., and Widder, E. A. (1997). The correlation of downwelling irradiance and staggered vertical migration patterns of zooplankton in Wilkinson Basin, Gulf of Maine. J. Plankt. Res. 19, 1975–1991. doi: 10.1093/plankt/19.12.1975
Garcia, H. E. K., Weathers, C. R., Paver, I., Smolyar, T. P., Boyer, R., Locarnini, A., et al. (2018). Data From: World Ocean Atlas 2018, Volume 3: Dissolved Oxygen, Apparent Oxygen, Utilization, and Oxygen Saturation. A. Mishonov Technical Ed. NOAA Atlas NESDIS 83, 38.
Gebruk, A. V. (1989). Revision of the family Pelagothuriidae (Holothuroidea, Elasipoda) with a review of Enypniastes eximia and Pelagothuria natatrix. 1. Review of the family Pelagothuriidae (Elasipoda). Russ. J. Zool. 68, 57–66.
Gebruk, A. V. (1990). Revision of Pelagothuriidae (Holothurioidea, Elasipoda) with a review of swimming holothurians and their origin. Russ. J. Zool. 69, 60–68.
Gomes-Pereira, J. N., Auger, V., Beisiegel, K., Benjamin, R., Bergmann, M., Bowden, D., et al. (2016). Current and future trends in marine image annotation software. Prog. Oceanogr. 149, 106–120. doi: 10.1016/j.pocean.2016.07.005
Greene, C. H., Wiebe, P. H., Burczynski, J., and Youngbluth, M. J. (1988). Acoustical detection of high-density krill demersal layers in the submarine canyons off Georges Bank. Science 241, 359–361. doi: 10.1126/science.241.4863.359
Gregory, T., Lovalvo, D., Mohr, B., McLetchie, K., and Ryan, M. (2016). “Advancing undersea technology.” in: New Frontiers In Ocean Exploration: The E/V Nautilus and NOAA Ship Okeanos Explorer 2015 Field Season, Vol. 29, eds K. L. C. Bell, M. L. Brennan, J. Flanders, N. A. Raineault, A. Wagner (Oceanography), 52–55. doi: 10.5670/oceanog.2016.supplement.01
Haddock, S. H. D., Christianson, L. M., Francis, W. R., Martini, S., Dunn, C. W., Pugh, P. R., et al. (2017). Insights into the biodiversity, behavior, and bioluminescence of deep-sea organisms using molecular and maritime technology. Oceanography 30, 38–47. doi: 10.5670/oceanog.2017.422
Heding, S. G. (1940). Die Holothurien der Deutschen Tiefsee-Expedition. II. Aspidochirote und Elasipode Formen. Wiss. Ergebn. Deuts. Tiefsee Exped. 24, 317–375.
Heding, S. G. (1950). Uber die Planktothuria der deutschen Tiefsee-Expedition, nebsteinigen Bemerkungen uber die Systematik der pelagischen Holothurien. Zool. Anzeiger. 145, 111–118.
Helly, J. J., and Levin, L. A. (2004). Global distribution of naturally occurring marine hypoxia on continental margins. Deep Sea Res. Part I Oceanogr. Res. Pap. 51, 1159–1168. doi: 10.1016/j.dsr.2004.03.009
Jacox, M. G., Hazen, E. L., Zaba, K. D., Rudnick, D. L., Edwards, C. A., and Moore, A. M. (2016). Impacts of the 2015-2016 El Nino on the California current system: early assessment and comparison to past events. Geophys. Res. Lett. 43, 7072–7080. doi: 10.1002/2016GL069716
Jenkyns, R., Gervais, F., and Pirenne, B. (2013). “SeaScribe: an annotation software for remotely operated vehicle dive operations,” in 2013 OCEANS-San Diego, 1–5.
Jones, D. O. B., Gates, A. R., Curry, R. A., Thomson, M., Pile, A., and Benfield, M. (2009). Data From: SERPENT Project Media Database Archive. Available online at: http://archive.serpentproject.com/2555/
Kennedy, B. R. C., Cantwell, K., Malik, M., Kelley, C., Potter, J., Elliott, K. P., et al. (2019). The unknown and the unexplored: insights into the Pacific Deep Sea following NOAA CAPSTONE expeditions. Front. Mar. Sci. 6:180. doi: 10.3389/fmars.2019.00480
Kessler, W. S. (2006). The circulation of the eastern tropical Pacific: a review. Prog. Oceanogr. 69, 181–217. doi: 10.1016/j.pocean.2006.03.009
Lemche, H., Hansen, B., Madsen, F., Tendal, O., and Wolff, T. (1976). Hadal life as analysed from photographs. Vidensk Medd fra Dansk naturh Foren. 139, 263–336.
Leonardi, A., Armor, J., Montanio, P., and Cisco, W. (2019). “NOAA's campaign to address pacific monument science, technology, and ocean needs,” in New Frontiers In Ocean Exploration: The E/V Nautilus, NOAA Ship Okeanos Explorer, and R/V Falkor 2018 Field Season, Vol. 150, eds N. A. Raineault and J. Flanders (Oceanography), 48–53.
Levin, L. A. (2003). Oxygen minimum zone benthos: adaptation and community response to hypoxia. Oceanogr. Mar. Biol. 41, 1–45.
Liberatore, D., Askew, T., Tusting, R., and Olson, S. (1997). “The manned submersible as an effective sampling and imaging platform,” in Oceans '97 MTS/IEEE: Conference proceedings: World Trade and Convention Centre, Halifax, Nova Scotia, Canada (Fort Lauderdale, FL: Oceans '96 MTS/IEEE Conference Committee), 51-58.
Ludwig, H. (1893). Reports of an exploration off the West Coast of Mexico, Central and South America, and off the Galapagos Islands, in charge of Alexander Agassiz, by the U.S. Fish Commission Steamer “Albatross,” during 1891, Lieutenant Commander Z.L. Tanner, U.S.N. Commanding, XII: the Holothurioidea. Mem. Mus. Comp. Zool. Harv. Coll. 17, 1–183.
Margolis, S., Michaels, W. L., Alger, B., Beaverson, C., Campbell, M. D., Kearns, E. J., et al. (2019). Accessibility of Big Data Imagery for Next Generation Machine Learning Applications. NOAA Tech. Memo. NMFS-F/SPO-194.O-164.
Martini, S., and Haddock, S. (2017). Quantification of bioluminescence from the surface to the deep sea demonstrates its predominance as an ecological trait. Sci. Rep. 7:45750. doi: 10.1038/srep45750
Matsumoto, G. I., Raskoff, K., and Lindsay, D. (2003). Tiburonia granrojo n. sp. a mesopelagic scyphomedusa from the Pacific Ocean representing the type of a new subfamily (class Scyphozoa: order Semaeostomeae: family Ulmaridae: subfamily Tiburoniinae subfam. nov.). Mar. Biol. 143, 73–77. doi: 10.1007/s00227-003-1047-2
Miller, J. E., and Pawson, D. L. (1990). Swimming Sea Cucumbers (Echinodermata: Holothuroidea): A Survey, With Analysis of Swimming Behavior in Four Bathyal Species. Smithsonian Contributions to the Marine Sciences, 35, 1–18. doi: 10.5479/si.01960768.35.1
Morris, P. J. (2019). Data From: Museum of Comparative, Z.oology, and Harvard University. Occurrence Dataset. 162, 156.
Mouw, C. B., Barnett, A., McKinley, G. A., Gloege, L., and Pilcher, D. (2016). Data from: global ocean flux rates. PANGAEA. Global ocean particulate organic carbon flux merged with satellite parameters. Earth Syst. Sci. Data 8, 531–541. doi: 10.5194/essd-8-531-2016
National Museum of Natural History (NMNH) (2019). Data From: National Museum of Natural History Collection Records. Available online at: https://collections.nmnh.si.edu/search/iz/
National Research Council (NRC) (1996). Undersea Vehicles and National Needs. Washington, DC: National Academy Press.
Natural History Museum (NHM) (2019). Data From: Natural History Museum (London) Collection Specimens. Occurrence dataset.
Netburn, A., Ford, M., and Lindsay, D. (2018). “2017 midwater exploration on Okeanos explorer,” in New Frontiers in Ocean Exploration: The E/V Nautilus, NOAA Ship Okeanos Explorer, and R/V Falkor 2017 Field Season, Vol. 31, eds N. A. Raineault, J. Flanders, and A. Bowman (Oceanography), 61–63.
Netburn, A., Kinsey, J., Bush, S., Djurhuus, A., Fernandez, J., Hoffman, C., et al. (2017). First HOV Alvin study of the pelagic environment at Hydrographer Canyon (NW Atlantic). Deep Sea Res. Part II Top. Stud. Oceanogr. 150, 30–40. doi: 10.1016/j.dsr2.2017.10.001
Netburn, A. N. (ed). (2018). From Surface to Seafloor: Exploration of the Water Column (Workshop Report), Honolulu, HI, 4-5 March 2017. NOAA Technical Memorandum OAR OER; 003, NOAA Office of Ocean Exploration and Research, Silver Spring, MD, United States.
OBIS (2019). Data From:Ocean Biogeographic Information System. Intergovernmental Oceanographic Commission of UNESCO. Available online at: www.iobis.org
Orrell, T. (2019). Data From: NMNH Extant Specimen Records. Version 1.20. National Museum of Natural History and Smithsonian Institution, Occurrence dataset.
Osborn, K. J., Haddock, S. H. D., and Rouse, G. W. (2011). Swima (Annelida, Acrocirridae), holopelagic worms from the deep Pacific. Zool. J. Linn. Soc. 163, 663–678. doi: 10.1111/j.1096-3642.2011.00727.x
Peters, C., Coleman, D. F., and Martinez, C. (2019). “Expedition support from the inner space center,” in New Frontiers in Ocean Exploration: The E/V Nautilus, NOAA Ship Okeanos Explorer, and R/V Falkor 2018 Field Season, Vol. 32, eds N. A. Raineault and J. Flanders (Oceanography), 6–7. doi: 10.5670/oceanog.2019.supplement.01
Quattrini, A. M., Nizinski, M. S., Chaytor, J. D., Demopoulos, A. W. J., Roark, E. B., France, S. C., et al. (2015). Exploration of the canyon-incised continental margin of the Northeastern United States reveals dynamic habitats and diverse communities. PLoS ONE 10:e0139904. doi: 10.1371/journal.pone.0139904
Racault, M. F., Sathyendranath, S., Brewin, R. J., Raitsos, D. E., Jackson, T., and Platt, T. (2017). Impact of El Niño variability on oceanic phytoplankton. Front. Mar. Sci. 4:133. doi: 10.3389/fmars.2017.00133
Ramirez-Llodra, E., Tyler, P. A., Baker, M. C., Bergstad, O. A., Clark, M. R., Escobar, E., et al. (2011). Man and the last great wilderness: human impact on the deep sea. PLoS ONE 6:e22588. doi: 10.1371/journal.pone.0022588
Robinson, C., Steinberg, D. K., Anderson, T. R., Arístegui, J., Carlson, C. A., Frost, J. R., et al. (2010). Mesopelagic zone ecology and biogeochemistry – a synthesis. Deep Sea Res. Part II Top. Stud. Oceanogr. 57, 1504–1518. doi: 10.1016/j.dsr2.2010.02.018
Robison, B. H. (2004). Deep pelagic biology. J. Exp. Mar. Biol. Ecol. 300, 253–272. doi: 10.1016/j.jembe.2004.01.012
Robison, B. H. (2009). Conservation of deep pelagic biodiversity. Conserv. Biol. 23, 847–858. doi: 10.1111/j.1523-1739.2009.01219.x
Robison, B. H., Reisenbichler, K. R., and Sherlock, R. E. (2017). The coevolution of midwater research and ROV technology at MBARI. Oceanography 30, 26–37. doi: 10.5670/oceanog.2017.421
Schlining, B. M., and Stout, N. Y. (2006). “MBARI's video annotation and reference system,” in OCEANS 2006, 1–5. doi: 10.1109/oceans.2006.306879
Schlining, K., von Thun, S., Kuhnz, L., Schlining, B., Lundsten, L., Jacobsen Stout, et al. (2013). Debris in the deep: using a 22-year video annotation database to survey marine litter in Monterey Canyon, central California, USA Deep Sea Res. Oceanogr. Res. Pap. 79, 96–105. doi: 10.1016/j.dsr.2013.05.006
Seibel, B. A. (2011). Critical oxygen levels and metabolic suppression in oceanic oxygen minimum zones. J. Exp. Biol. 214, 326–336. doi: 10.1242/jeb.049171
Seid, C. (2019). SIO Benthic Invertebrate Collection. Scripps Institution of Oceanography. doi: 10.15468/4w9oc7
Sibuet, M. (1985). “Quantitative distribution of echinoderms (Holothuroidea, Asteroidea, Ophiuroidea, Echinoidea) in relation to organic matter in the sediment, in deep-sea basins of the Atlantic Ocean,” in Proceedings of the Fifth International Echinoderm Conference, eds B. F. Keegan and B. D. S. O'Connor (Rotterdam: Balkema), 99–108.
Spalding, M. D., Fox, H. E., Allen, G. R., Davidson, N., Ferdaña, Z. A., Finlayson, M., et al. (2007). Marine ecoregions of the world: a bioregionalization of coastal and shelf areas. BioScience 57, 573–583. doi: 10.1641/B570707
Sutton, T. T., Clark, M. R., Dunn, D. C., Halpin, P. N., Rogers, A. D., Guinotte, J., et al. (2017). A global biogeographic classification of the mesopelagic zone. Deep Sea Res. Part I Oceanogr. Res. Pap.126, 85–102. doi: 10.1016/j.dsr.2017.05.006
Webb, T., Berghe, E., and O'Dor, R. (2010). Biodiversity's Big Wet Secret: the global distribution of marine biological records reveals chronic under-exploration of the deep pelagic ocean. PLoS ONE 5:e10223. doi: 10.1371/journal.pone.0010223
Widder, E. A., Greene, C. H., and Youngbluth, M. J. (1992). Bioluminescence of sound-scattering layers in the Gulf of Maine. J. Plankt. Res. 14, 1607–1624. doi: 10.1093/plankt/14.11.1607
Keywords: Pelagothuria, oxygen minimum zone, eastern tropical pacific, equatorial pacific, water column exploration, Echinodermata, Holothuroidea
Citation: Selig GM, Netburn AN and Malik M (2019) Distributions of the Pelagic Holothurian Pelagothuria in the Central Pacific Ocean as Observed by Remotely-Operated Vehicle Surveys. Front. Mar. Sci. 6:684. doi: 10.3389/fmars.2019.00684
Received: 15 June 2019; Accepted: 22 October 2019;
Published: 14 November 2019.
Edited by:
Diva Amon, Natural History Museum, United KingdomReviewed by:
George I. Matsumoto, Monterey Bay Aquarium Research Institute (MBARI), United StatesAntonina Kremenetskaia, P. P. Shirshov Institute of Oceanology (RAS), Russia
Copyright © 2019 Selig, Netburn and Malik. This is an open-access article distributed under the terms of the Creative Commons Attribution License (CC BY). The use, distribution or reproduction in other forums is permitted, provided the original author(s) and the copyright owner(s) are credited and that the original publication in this journal is cited, in accordance with accepted academic practice. No use, distribution or reproduction is permitted which does not comply with these terms.
*Correspondence: Amanda N. Netburn, YW1hbmRhLm5ldGJ1cm5Abm9hYS5nb3Y=