 Natalya D. Gallo1,2*
 Elizabeth Drenkard1,2
 Andrew R. Thompson2
 Edward D. Weber2
 Deb Wilson-Vandenberg3
 Sam McClatchie4
 J. Anthony Koslow1
 Brice X. Semmens1
- 1Scripps Institution of Oceanography, University of California, San Diego, La Jolla, CA, United States
- 2National Oceanic and Atmospheric Administration Southwest Fisheries Science Center, La Jolla, CA, United States
- 3California Department of Fish and Wildlife, Monterey, CA, United States
- 4FishOcean Enterprises, Auckland, New Zealand
Multidisciplinary, integrated ocean observing programs provide critical data for monitoring the effects of climate change on marine ecosystems. California Cooperative Oceanic Fisheries Investigations (CalCOFI) samples along the US West Coast and is one of the world’s longest-running and most comprehensive time series, with hydrographic and biological data collected since 1949. The pairing of ecological and physical measurements across this long time series informs our understanding of how the California Current marine ecosystem responds to climate variability. By providing a baseline to monitor change, the CalCOFI time series serves as a Keeling Curve for the California Current. However, challenges remain in connecting the data collected from long-term monitoring programs with the needs of stakeholders concerned with climate change adaptation (i.e., resource managers, policy makers, and the public), including for the fisheries and aquaculture sectors. We use the CalCOFI program as a case study to ask: how can long-term ocean observing programs inform ecosystem based management efforts and create data flows that meet the needs of stakeholders working on climate change adaptation? Addressing this question and identifying solutions requires working across sectors and recognizing stakeholder needs. Lessons learned from CalCOFI can inform other regional monitoring programs around the world, including those done at a smaller scale in developing countries.
Introduction
The US West Coast is one of the best studied marine regions of the world due to a high concentration of academic institutions, investment in fisheries, and political support. Consequently, the data-rich environment provides an excellent opportunity to explore how oceanographic monitoring programs can support ecosystem management strategies that are adaptive to climate change. Ideally, more comprehensive oceanographic monitoring should lead to more climate-resilient management (Skern-Mauritzen et al., 2016; Davidson et al., 2019), however, there are unique challenges in linking physical and biological oceanographic data to management needs (Field and Francis, 2006). These include, for example, difficulties in linking meaningful climate indices to fisheries trends to inform management decisions (Myers, 1998; Smith et al., 2007; Pitcher et al., 2009), and in creating data products that support the needs of a diverse community of stakeholders (Rayner et al., 2019).
One reason the US West Coast is so well studied is due to the long-running California Cooperative Oceanic Fisheries Investigations (CalCOFI) Program. CalCOFI began in the late 1940s in response to the collapse of the economically important sardine fishery on the US West Coast (Hewitt, 1988; Scheiber, 1990). Competing hypotheses argued for overfishing versus environmental change as the dominant driver responsible for the sardine decline, and the CalCOFI Program was founded to investigate the relationship between oceanographic conditions and sardine abundance (Hewitt, 1988). From the beginning, CalCOFI represented a unique partnership between academic, federal, and state partners (Scheiber, 1990), which now consists of the Scripps Institution of Oceanography at UCSD, federal scientists at NOAA’s National Marine Fisheries Service (NMFS), and scientists working for the California Department of Fish and Wildlife (Ohman and Venrick, 2003; McClatchie, 2014). Since 2004, CalCOFI also contributes to the California Current Ecosystem Long Term Ecological Research (CCE LTER) Network (Ohman and Hobbie, 2008).
While initially focused on sardines, the scientists who founded CalCOFI had the vision to create an ecosystem monitoring program at a time when ecosystem research was in its infancy (Scheiber, 1997), thus beginning one of the most comprehensive ecosystem monitoring programs that extends the full length of the Keeling Curve (Keeling and Keeling, 2017) – a time series that is fundamental to the scientific understanding of increasing greenhouse gases and anthropogenic climate change. Presently, the overarching objective of CalCOFI is to understand the effects of long-term changes in the California Current Ecosystem (CCE) (Ohman and Venrick, 2003).
The goal of this study is to identify how the CalCOFI Program can best support stakeholder needs for understanding climate change impacts and developing climate change adaptation strategies. To do this, we first review the data that are collected by the CalCOFI Program (1949-current) and synthesize how these data have informed our understanding of the dynamics and climate sensitivity of the CCE. In doing so, we also examine the CalCOFI record for climate relevant variables and compare changes observed over the last 70 years to changes predicted by climate models for the future. We then consider how CalCOFI data are currently used to support ecosystem and fisheries management decision-making, explore these within the context of adaptation to climate change, and consider how CalCOFI data can be used by a diversity of stakeholders to support climate change adaptation needs in the future.
Materials and Methods
What Data Does the CalCOFI Program Collect?
At present, CalCOFI conducts quarterly ship-based surveys in a grid design at fixed stations in the Southern California Current Ecosystem (SCCE) and collects both hydrographic and biological samples. The earliest samples were collected in 1949, and the sampling protocols were standardized by the early 1950s, allowing for comparisons across the 70 years time series. Although the survey region has expanded and contracted, the “core” sampling grid, consistently maintained throughout the time series, is composed of 66 stations along 6 grid lines (Figure 1). This area ranges from the US-Mexico Border to slightly north of Point Conception, California, and extends over 500 km offshore. In 2004, nine additional coastal stations were added to the “core” CalCOFI grid, as part of the Southern California Coastal Ocean Observing System (SCCOOS), to extend sampling further inshore. During the winter and spring cruises, the survey grid typically expands further north to the San Francisco Bay region (Figure 1) to capture most of the sardine spawning spatial domain. The extended CalCOFI grid includes 113 stations, 16 of which fall in California state waters, 89 in U.S. federal waters, and 8 are located in international waters outside of the U.S. exclusive economic zone (Figure 1). Due to fluctuating funding between 1969 and 1983, for this period quarterly cruises were only conducted on a triennial basis. Line 90 represents the best sampled CalCOFI line, and spring and summer samples are more complete within the CalCOFI time-series than winter or fall (Peabody et al., 2018).
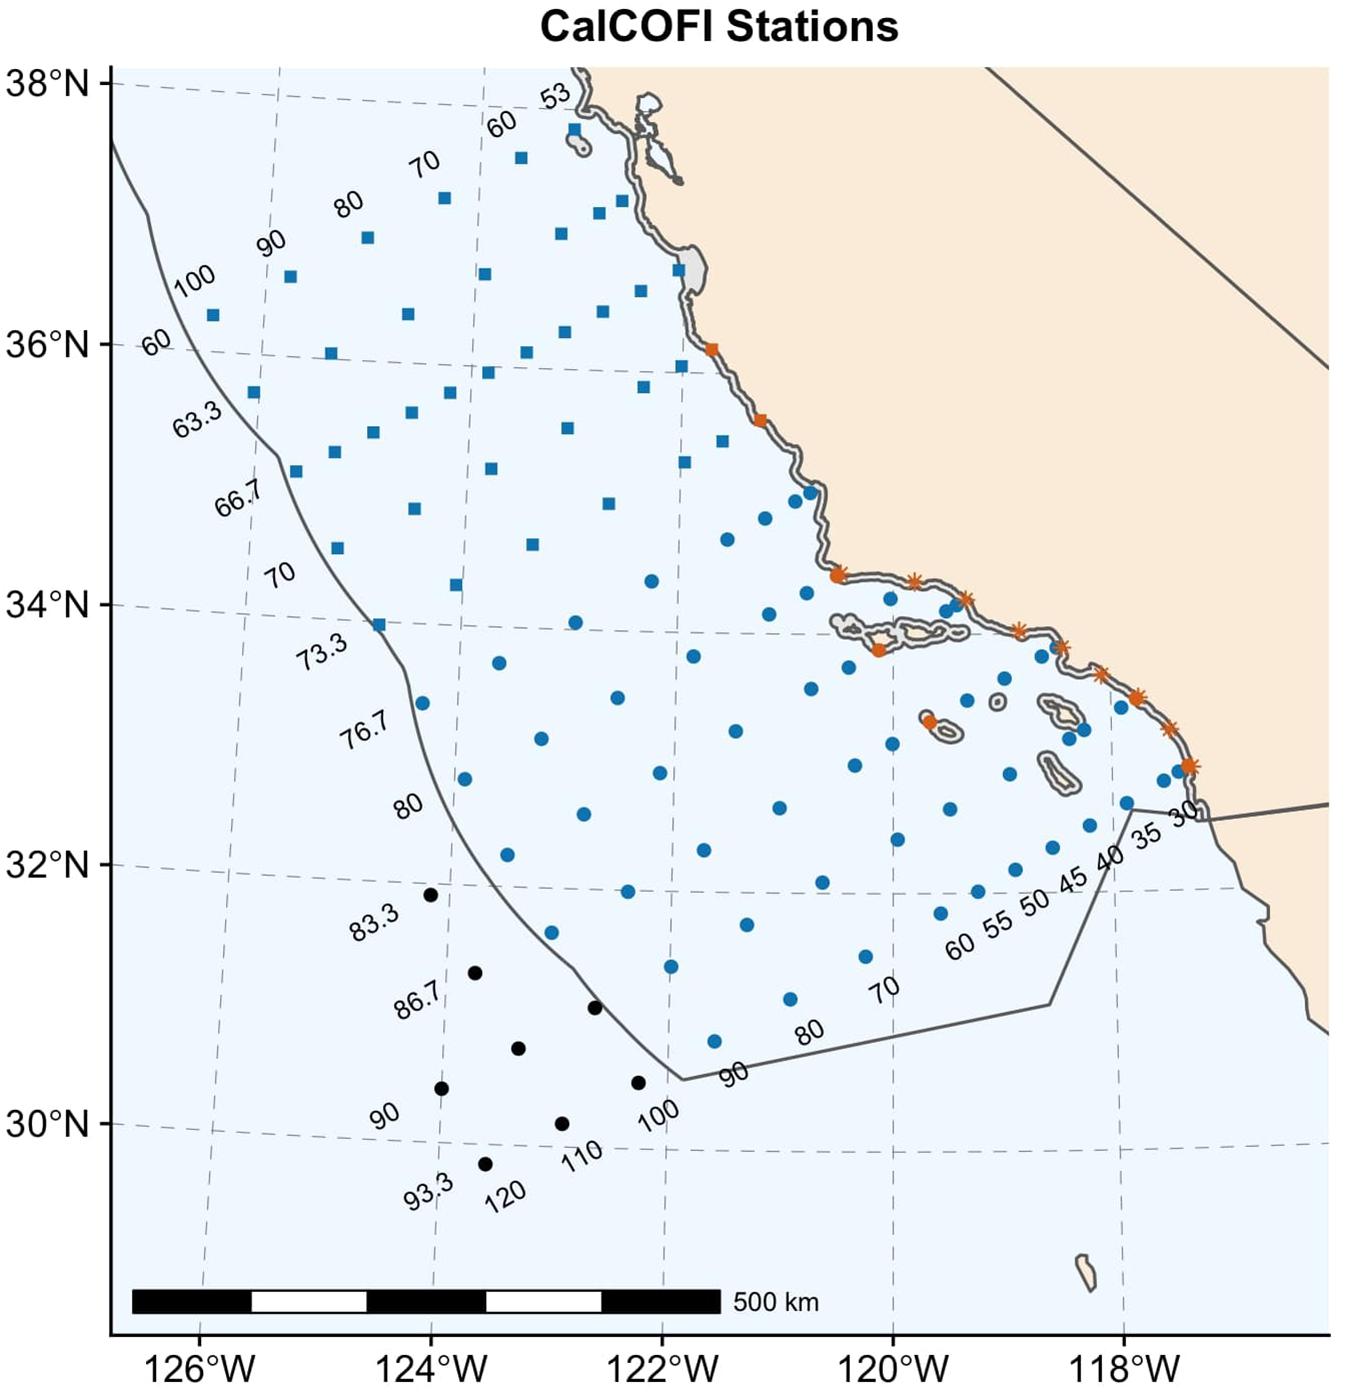
Figure 1. Map of 113 CalCOFI stations as relates to U.S. jurisdictional boundaries. In CalCOFI stations are shown based on if they occur in state (orange), federal (blue), or international (black) waters. The US exclusive economic zone is shown with a black outline and California state waters are shown in gray surrounding land (tan). Circles represent the 66 station “core grid,” squares represent the 38 extended grid stations, and the 9 nearshore stations are represented with asterisks. CalCOFI lines (horizontal) and stations (vertical) are indicated by the labels on the left of the grid and at the top and bottom of the grid, respectively. Not all station labels are shown. A scale bar is provided for spatial reference.
A suite of hydrographic and biological data are collected at CalCOFI stations and during transit between stations. Hydrographic bottle samples for temperature, salinity, oxygen, and phosphate were collected since 1949 at specific depths (up to 500 m). Nutrient analyses expanded to include silicate, nitrate and nitrite for bottle samples starting in 1961, and then chlorophyll in 1973, dissolved inorganic carbon (DIC) in 1983, and primary production using 14C incubations in 1984. CTD profiling began in 1993, and at each station an SBE 911plus CTD is deployed to measure water column temperature, salinity, dissolved oxygen, chlorophyll a, and photosynthetically active radiation up to a depth of ∼515 m. The CTD is an oceanographic sensor package that is surrounded by a rosette of Niskin bottles for discreet water sampling and is deployed vertically through the water column to determine the hydrographic profiles of elements of interest (Williams, 2009). An SBE 18 pH sensor was added to the CTD sensor package starting in 2009.
Biological sampling at stations is conducted predominantly with nets. Vertical, oblique and surface tows are routinely collected. Oblique tows are a consistent feature of CalCOFI, and a tow is conducted at each station to sample the plankton. In 1978, bongo nets replaced ring nets to improve sampling, and an adjustment is applied for abundance estimates for some fish and zooplankton taxa to correct for changes in catchability (Ohman and Lavaniegos, 2002; Thompson et al., 2017b). A flow meter is attached to the net allowing for a measurement of sampling volume as the bongo net is towed obliquely from 212 m to the surface at 1–2 knots. Zooplankton displacement volume is measured for each sample, and all ichthyoplankton are removed. Ichthyoplankton are then identified to lowest possible taxon and enumerated. The ichthyoplankton time series is one of the best studied data products from the CalCOFI Program and includes over 400 species of fish. In recent years, certain invertebrate species of commercial importance have also been sorted and time series are available since 1997 for Market Squid (Doryteuthis opalescens) paralarvae and since 2007 for Spiny Lobster (Palinuridae spp.) phyllosoma. Ichthyoplankton and zooplankton from each tow are preserved in 5% formalin or 95% ethanol and kept in collections. Genetic barcoding has been conducted to identify species such as some rockfishes from ethanol-preserved samples that are difficult or impossible to identify based solely on morphology (Thompson et al., 2016, 2017a). Additionally, zooplankton are sampled using vertically towed PairoVET nets deployed to 70 m depth, and manta nets (1977–present), which are towed at the surface. Information about net sampling procedures are presented in Kramer et al. (1972) and Smith and Richardson (1977). All hydrographic1 and ichthyoplankton data2 are quality-controlled and publicly available; invertebrate zooplankton data are partially available3.
Larval abundances from the CalCOFI ichthyoplankton time-series are used to estimate or index adult spawning stock biomass. Egg and larval abundance data have been used routinely in conjunction with trawl surveys to estimate the spawning stock of Northern Anchovy (Engraulis mordax) and Pacific Sardine (Sardinops sagax) via the daily egg-production method (Lasker, 1985). In the absence of additional trawl data, larval abundance data alone have been used to provide a coarser index of adult spawning stock biomass for Northern Anchovy and Pacific Sardine (Koslow et al., 2011), rockfish (Sebastes spp.; Moser et al., 2000), California Halibut (Paralichthys californicus; Moser and Watson, 1990), and for other rocky nearshore taxa (Moser et al., 2000). The fact that larval fish are predominantly sampled during the preflexion stage when net-sampler avoidance is minimal and post-spawning losses to mortality are still low relative to later larval stages makes them an effective index of spawning stock biomass (Koslow et al., 2018). However, ichthyoplankton counts likely do not correlate with recruitment success due to high and variable mortality at the larval stage. CalCOFI samples are well suited to document dynamics of hundreds of species of fishes because although adult populations reside in different habitats (e.g., pelagic, mesopelagic, benthic), larvae of almost every species are found in the upper 200 m of the water column (Moser, 1996; Moser and Watson, 2006). Thus, the program focuses its efforts on pelagic sampling and no benthic samples are collected.
Since 2014, CalCOFI has incorporated genomic sampling through collaboration with scientists at the J. Craig Venter Institute, La Jolla, CA, United States. Seawater samples at specific stations along the CalCOFI grid are collected and sequenced for RNA and DNA to study the microbial and eukaryotic community composition and gene expression in the water column. This is called the NOAA CalCOFI Genomics Project.
A series of underway samples are also collected on CalCOFI cruises which include ADCP measurements, meteorological data, and marine mammal and seabird observations. Since 1996, the Continuous Underway Fish Egg Sampler (CUFES) (Checkley et al., 1997, 2000) has been used to collect continuous underway data from which Northern Anchovy, Pacific Sardine, Jack Mackerel (Trachurus symmetricus), Pacific Hake (Merluccius productus), and squid (Decapodiformes spp.) eggs are identified. Additional autonomous tools have also expanded the scope of CalCOFI sampling. Since 2005, underwater spray gliders collect hydrographic data, including temperature and salinity, along CalCOFI lines, which have included lines 66.7, 80, 90, and 93 (Davis et al., 2008). Dissolved oxygen sensors are also now being deployed on spray gliders. Additional details on the CalCOFI sampling methodology that are outside of the scope of this study can be found in McClatchie (2014).
Looking Back at the Past 70 Years and Forward to the Future
To examine the CalCOFI record in relation to future changes predicted by climate models, we first compare the length and trends of the CalCOFI time series for climate relevant variables to that of the Keeling Curve (Figure 2). The Keeling Curve is a record of atmospheric carbon dioxide measurements taken at the Mauna Loa Observatory in Hawaii since 1958, and has been fundamental to tracking anthropogenic greenhouse gas forcing and the subsequent relationship to climate change (Keeling and Keeling, 2017). For the CalCOFI time series, we examine trends in winter sea surface temperature (SST) (Figure 2B) and winter dissolved oxygen concentration at 200 m (Figure 2D) across the core 66-station CalCOFI grid. For ocean acidification-relevant measurements, we synthesize a timeline of existing measurements (Figure 2C). As an example of the ichthyoplankton dataset, trends in the annual mean densities of Panama Lightfish, Vinciguerria lucetia, which is a warm-affinity mesopelagic species, are calculated across the core 66-station CalCOFI grid (Figure 2E).
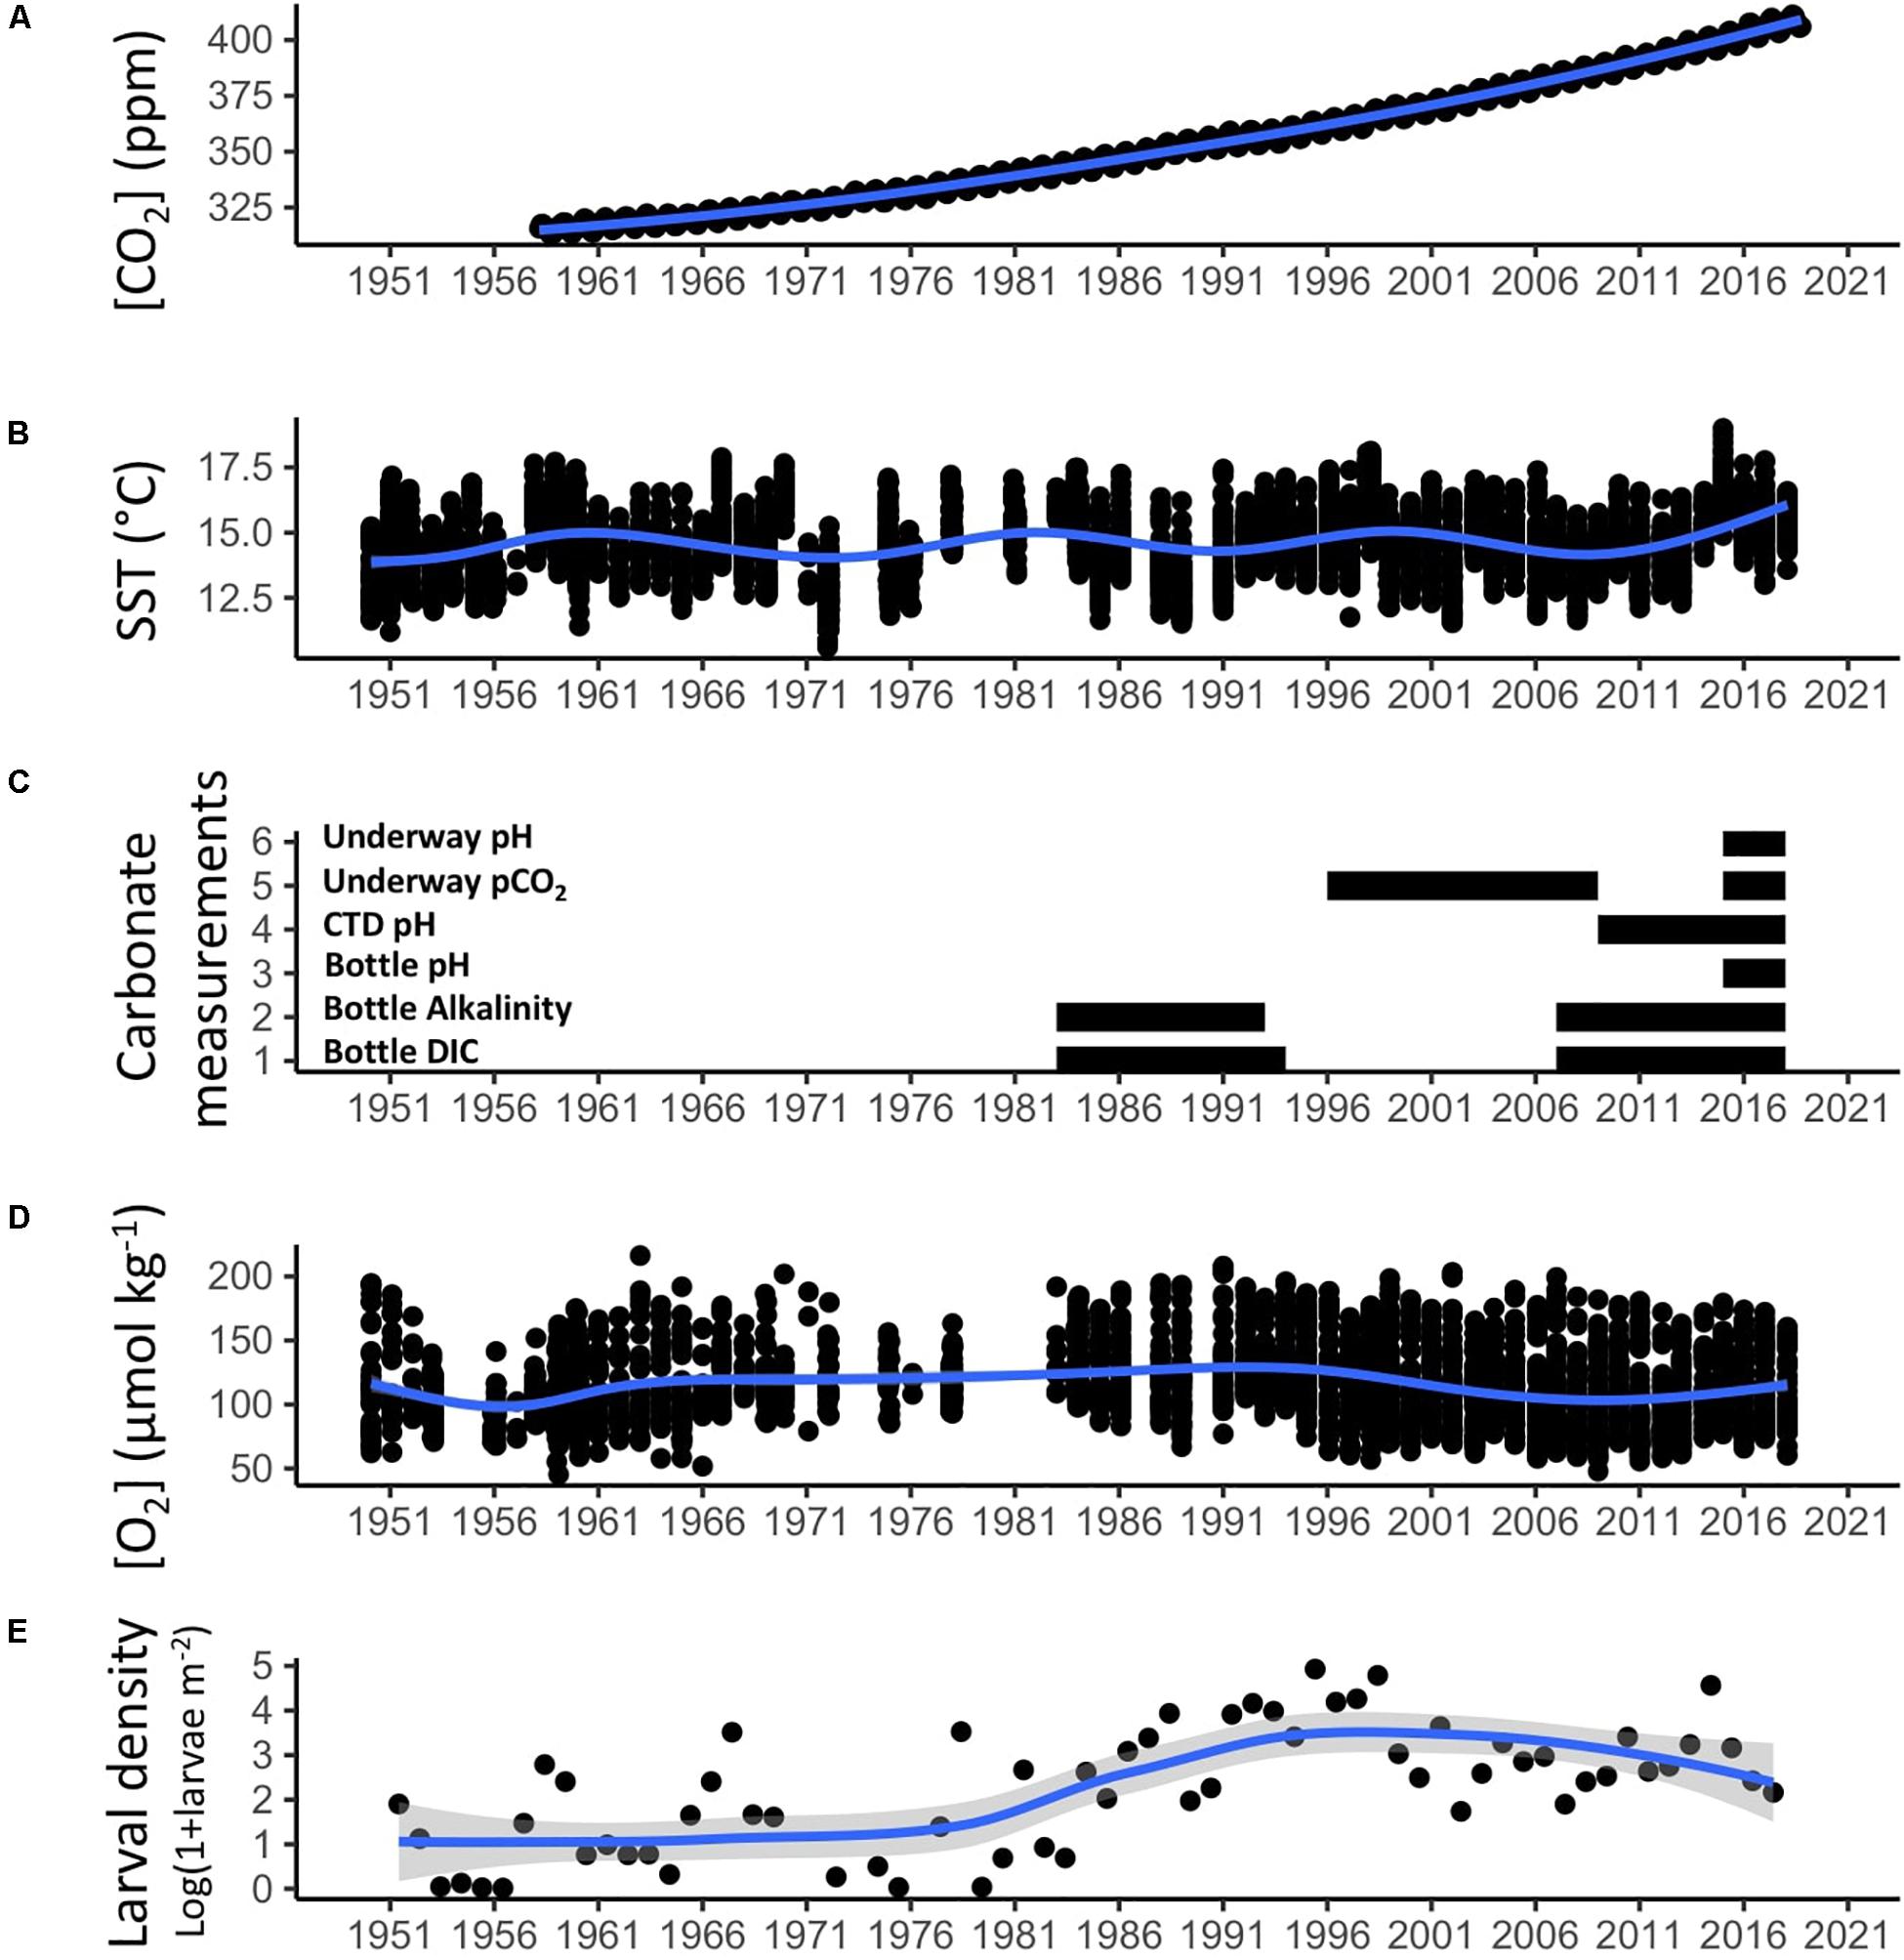
Figure 2. The CalCOFI time-series is a Keeling Curve for the California Current Ecosystem. The Keeling Curve (A) shows the increase in atmospheric CO2 at Mauna Loa through the twentieth and twenty-first century and is an essential record for understanding climate forcing. The CalCOFI record (B–E) extends a similar length and is an essential record of how the ocean responds to climate forcing through hydrographic and biological changes. Unlike the atmospheric record, the oceanic record is noisy and shows pronounced multi-decadal natural variability. Trends in winter sea surface temperature (SST) across the core 66-station CalCOFI grid are shown in (B), the extent of all carbonate chemistry measurements taken on CalCOFI cruises is shown in (C), trends in winter dissolved oxygen at 200 m across the core 66-station CalCOFI grid are shown in (D), and trends in the annual mean density of Panama Lightfish, a warm-affinity mesopelagic species, across the core 66-station CalCOFI grid is shown in (E). Blue trend lines show smoothed conditional means.
We then compare climate trends observed from the CalCOFI dataset with expected warming predicted from a climate model. We use the Large Ensemble Community Project (LENS) (Kay et al., 2015) to look at predicted changes in annual mean SST, pH, and oxygen concentration for the CCE under the “business as usual” emissions scenario (RCP 8.5). LENS includes a 40-member ensemble of fully-coupled Community Earth System Model version 1 (CESM1) simulations for the period 1920–2100. From 1920 to 2005, the simulations use historic emissions data and after 2005 use RCP 8.5 projected emissions (Kay et al., 2015). We selected 1950–2100 as the period of interest to capture the period which corresponds to the CalCOFI time series.
Identifying Management and Stakeholder Use of CalCOFI Data
To evaluate how CalCOFI data currently informs fisheries and ecosystem management, we examine the fisheries and ecosystem management structures for the US West Coast, including federal and state policies, and identify instances where CalCOFI data are used for informing management. We also examine the spatial overlap between the CalCOFI grid and relevant management jurisdictions including state, federal, and international waters, and different marine conservation areas (California Marine Protected Areas, National Marine Sanctuaries, and rockfish conservation areas). We then identify stakeholder user groups of CalCOFI data, by considering both known users (i.e., those who have published CalCOFI data or have actively used it for their organization) and potential users (i.e., new organizations or groups that have not used CalCOFI data but whose activities overlap with the CalCOFI grid). Based on their known activities, we then consider the specific needs of different stakeholder groups related to questions of climate change impacts and adaptation, and where possible identify opportunities for better aligning stakeholder needs with CalCOFI monitoring.
By evaluating the climate change-relevant data collected by an ocean observing program and considering it within the landscape of ocean management policies and spatial overlap with regional stakeholders, other oceanographic observing programs can follow this process to better link their basic monitoring data to stakeholder needs relating to climate change adaptation.
Results
An Overview From CalCOFI Data Regarding Marine Ecosystem Responses to Climate Forcing
Ocean warming, acidification and deoxygenation are some of the main climate change stressors for marine ecosystems (Bopp et al., 2013; Pörtner et al., 2014; Henson et al., 2017). In addition to anthropogenic climate change, strong multidecadal natural climate variability affects the California Current region, which can be seen in the CalCOFI time series (Figure 2).
One of the dominant modes of low-frequency variability (∼30 years) that affects the CCE is the Pacific Decadal Oscillation (PDO) which is based on variability of sea surface temperatures in the North Pacific (Mantua et al., 1997). Negative phases of the PDO are associated with colder, more productive overall conditions in the CCE, and positive phases are associated with warmer, less productive conditions. The North Pacific Gyre Oscillation (NPGO) is also a dominant mode of low-frequency variability and is significantly correlated with multiple oceanographic conditions in the CalCOFI region, including upwelling strength, nutrient fluxes, and sea surface salinity anomalies (Di Lorenzo et al., 2008). Higher frequency variability (2–7 years) is driven by the El Niño Southern Oscillation, which was first recognized as a Pacific-wide phenomenon at a CalCOFI Symposium (Sette and Isaacs, 1960). El Niño conditions are characterized by warm, less productive conditions in the CCE, while La Niña conditions are characterized by colder, more productive conditions. Stronger and more frequent El Niño conditions occur during positive PDO phases, while La Niña conditions are more pronounced and frequent during negative PDO phases. The CalCOFI record captures a negative PDO phase which lasted from 1950 to 1976 and a positive PDO phase that commenced after 1976. Although it was speculated that the PDO returned to a cool phase following a strong La Niña in 1999 (Zwolinski and Demer, 2012), the string of mostly negative PDO values between 1998 and 2003 now appear to have been more of a transient event rather than an actual regime shift (Bond et al., 2003). Consistent with this, there was no evidence of a prolonged change in the CalCOFI ichthyoplankton assemblage after 1998 (Peabody et al., 2018) and record high water temperatures occurred between 2014 and 2016 (Jacox et al., 2018). Therefore, many studies consider the CalCOFI record in terms of the “cold” (1950–1976), “warm” (1977–1998), and present (1999-present) period.
Anthropogenic climate change is a directional change on which these natural modes of variability are layered, and the high amount of natural variability in the system makes it difficult to discern the anthropogenic signal (Figure 2). However, projections of the climate in the North Pacific for the twenty-first century predict an increasing importance of anthropogenic warming over internal modes of variability (Bond et al., 2003; Di Lorenzo et al., 2008; Bonfils and Santer, 2011). Here, we briefly review how the CalCOFI record has informed our understanding of how the SCCE responds to different timescales of climate variability.
Warming
Despite strong inter-annual variability, temperatures within the CalCOFI region have shown a secular warming trend from 1949 to 2000, with stronger warming observed inshore than offshore (McClatchie, 2014). From 1949 to 2000, sea surface temperatures (SST) warmed by 1.3°C or 0.025°C per year on average (Di Lorenzo et al., 2005). The upper 100 m of the water column warmed 0.8°C during the period 1950–1992, representing an average warming of 0.019°C per year (Roemmich, 1992). Comparing the CalCOFI record with the temperature time series maintained at the Scripps pier, showed a slightly stronger warming trend inshore at the Scripps pier (Roemmich, 1992). From 1950 to 1993, the heat content integrated over the upper 200 m of the water column increased by 6.2–9.1% inshore and 2.4–7.1% offshore in the central and southern CCE (Palacios et al., 2004). From 1951 to 2001, heat content in the upper water column (20–200 m) increased with time roughly ten times more than the heat content of the deeper waters (300–500 m) (Hsieh et al., 2009).
Ocean Acidification
In the CCE, changes in carbonate chemistry can be driven both by changing water mass properties and circulation patterns (Meinvielle and Johnson, 2013), as well as the addition of anthropogenic CO2 from the atmosphere into the water (Bednarsek et al., 2014). McClatchie et al. (2016) examined changes in carbonate system parameters using the empirical equations derived for the California Current region (Alin et al., 2012). Near the coast, more acidic conditions were found at shallower depths than at CalCOFI stations offshore; the aragonite saturation horizon (Ω = 1) depth ranged from 84 to 267 m offshore and 50 to 250 m inshore (McClatchie et al., 2016). From 1985 to 2011, an acidification trend was detected; the average aragonite saturation horizon (Ω = 1) depth shoaled by 18 m, and an 11% increase in acidity was observed at nearshore stations for depths between 15 and 100 m (McClatchie et al., 2016). This analysis likely underestimated acidification because it did not incorporate changes due to the rising atmospheric CO2 concentration. For the California Current region, Bednarsek et al. (2014) estimated a potential anthropogenic contribution of 1.19 μmol kg–1 yr–1 to source-water DIC that is upwelled off California, based on an increasing trend in North Pacific surface water DIC.
While a continuous time-series of inorganic carbon system measurements is not available from CalCOFI to study ocean acidification (OA) trends, a multi-decadal record of measurements exists (Figure 2C). From 1983 to 1994, DIC measurements from ∼10 m depth were collected by Charles David Keeling from a number of CalCOFI stations. Since 2008, DIC measurements have been collected at certain CalCOFI stations at depths between 0 and 200 m and analyzed by Andrew G. Dickson’s lab at Scripps Institution of Oceanography, La Jolla, CA. Due to historical factors, Line 90 in the CalCOFI grid has the best coverage for DIC measurements. Alkalinity measurements of CalCOFI bottle samples have also been made during the periods 1984–1993 and 2007-present, and more recently pH measurements have been made from 2015-present. Additionally, underway pCO2 measurements were conducted in collaboration with MBARI scientists from the mid 1990s to late 2000s on CalCOFI cruises, and more recently are being collected by Todd Martz’s group at Scripps Institution of Oceanography, La Jolla, CA, since 2015. Since 2009, a pH sensor has also been added to the CTD package. Integrating these various carbonate system measurements across the CalCOFI time series to look at spatial and temporal OA trends is an area of current research.
Ocean Deoxygenation
Oxygen levels in the ocean are declining (Schmidtko et al., 2017; Breitburg et al., 2018), driven by changes in ocean ventilation, transport, and oxygen consumption linked to climate change (Levin, 2018; Oschlies et al., 2018). CalCOFI oxygen measurements are essential to understanding and resolving the oxygen dynamics in the SCCE. From 1984 to 2006, strong linear declines in oxygen were observed; declines were strongest nearshore, the largest relative declines occurred at 200–300 m depth, while the largest absolute declines occurred in the upper water column with oxygen losses of 1–2 μmol O2 kg–1 year–1 (Bograd et al., 2008). At a nearshore CalCOFI station off San Diego, the depth of the hypoxic boundary (O2 < 60 μmol kg–1) shoaled by up to 90 m during this 23 years period, and shoaled by 41 m on average across the CalCOFI grid (Bograd et al., 2008).
Compared to oxygen loss observed across the world’s oceans (Schmidtko et al., 2017), the SCCE has one of the most rapid observed oxygen declines. However, the unique length of the CalCOFI time-series allowed these changes to be contextualized within longer term regional trends. McClatchie et al. (2010) analyzed the extended CalCOFI time-series (1950–2007) and found that the recent linear decrease in oxygen was not representative of the whole time-series. Instead, a clear multidecadal signal emerged, with the period between 1950 and 1957 characterized by low oxygen conditions, the period between 1980 and 1987 by higher oxygen conditions, and 2000–2007 by low oxygen conditions (Figure 2D, McClatchie et al., 2010).
The non-monotonic nature of changing oxygen conditions in the CCE is related to natural low-frequency variability within the system (Deutsch et al., 2005). Observed declines in oxygen are thought to be associated with increased volume of advected Pacific Equatorial Water which is transported northward by the California Undercurrent (Meinvielle and Johnson, 2013; Bograd et al., 2015; Ren et al., 2018) and has a low oxygen signature. At shallower depths (<150 m), increases in respiration may also contribute to oxygen decline (Booth et al., 2014; Bograd et al., 2015; Ren et al., 2018). At shorter timescales, ENSO events affect the oxygen dynamics in the SCCE by altering the thermocline depth, with La Niña conditions characterized by lower oxygen and pH conditions (Nam et al., 2011). In general, any declines in oxygen are also coupled with decreases in pH; thus, deoxygenation and acidification will be simultaneous stressors for marine organisms in the CCE (Levin, 2018). Due to the high level of natural variability of oxygen in the CCE, forced declines in oxygen due to secular climate change are only predicted to emerge by ∼2030 (Long et al., 2016). The CalCOFI dataset is essential to ongoing monitoring of deoxygenation trends in the SCCE.
Ecosystem Responses to Climate Forcing
Marine communities are not static, but change through time in response to climate forcing. Changes can manifest through shifting species composition, changes in abundance, diversity, distribution, and trophic interactions (Poloczanska et al., 2016; Griffiths et al., 2017). Since CalCOFI collects both hydrographic and biological samples, it offers insight into how the SCCE responds to climate forcing at different timescales.
The CalCOFI ichthyoplankton time series has revealed that the fish community exhibits changes in distribution, abundance, and diversity in relation to climate forcing (Hsieh et al., 2005, 2008, 2009; Koslow et al., 2011, 2013, 2015, 2017, 2018; McClatchie et al., 2016, 2018; Peabody et al., 2018; Siegelman-Charbit et al., 2018). Hsieh et al. (2008, 2009) found that from 1951 to 2002, oceanic and coastal fishes in the SCCE shifted their distribution poleward in response to warming, with diel-vertical migrating species showing higher responsiveness to environmental change than non-migrating species (Hsieh et al., 2009). Abundance of oceanic species was significantly positively correlated with temperature, irrespective of if fish were warm water, cold water, or broadly distributed (Hsieh et al., 2009). Hsieh et al. (2009) posit that intensified stratification observed in the SCCE during the warm period created a more suitable habitat for oceanic species, thus leading to a spatial distribution shift shoreward during this period, and higher abundances within the CalCOFI grid. Similar trends were found when analyzing relationships across interannual and multidecadal scales, suggesting that these relationships may also manifest with secular climate change.
Trends in the CalCOFI ichthyoplankton time-series have also been compared to an independent time-series of ichthyoplankton collected from California power plant cooling water intakes in Southern California. Siegelman-Charbit et al. (2018) found that the abundances of coastal cold-water affinity fish taxa in the SCCE declined dramatically from 1970 to the 2000s, and this decline was related to ocean warming, increased coastal upwelling, reduced offshore upwelling and advection, as well as a decline in productivity and zooplankton prey availability. Koslow et al. (2015) also reported declining larval fish abundances across the same period, driven by declines in Pacific hake, Northern anchovy, and Pacific sardines. These results contrast with findings by Hsieh et al. (2009) for oceanic fish species, and indicate that oceanic and coastal species respond differently to climate forcing in the SCCE.
In general, warm periods in the CalCOFI record are associated with increases in fish species richness due to an influx of tropical or warm-water affinity species from the south (McClatchie et al., 2016, 2018; Koslow et al., 2017). This trend has been seen for both the 1997/1998 El Niño as well as during periods associated with increased intrusion of warm southern water (1985–1996 and 1999–2014) (McClatchie et al., 2016). Species richness increased despite the more acidic signature of southern water, suggesting that fish community species richness is not negatively impacted by current levels of acidification (McClatchie et al., 2016). Across the CalCOFI time-series (1969–2011) fish species richness is positively correlated with periods of warmer temperatures, higher midwater oxygen concentration, and the warm phase of the PDO (Koslow et al., 2017). It is worth noting that conditions that give rise to higher ichthyoplankton diversity (i.e., species richness and community evenness) are associated with poorer primary productivity conditions, and thus correspond to lower fisheries productivity (Koslow et al., 2017).
Analyses of the CalCOFI ichthyoplankton time-series have also informed our understanding of warm and cold-associated fish species (Hsieh et al., 2005; McClatchie et al., 2016, 2018). Mesopelagic cool-assemblage species include the Northern Lampfish (Stenobrachius leucopsarus) and California Smoothtongue (Leuroglossus stilbius), while mesopelagic warm-assemblage species include the Mexican Lampfish (Triphoturus mexicanus) and the Panama Lightfish (Vinciguerria lucetia) (McClatchie et al., 2016). Warm assemblage species tend to increase in abundance during warm events (McClatchie et al., 2016; Koslow et al., 2018) and these species have shown a secular trend of increasing relative abundance from 1951 to 2016 (McClatchie et al., 2018). From 2011 to 2015, mesopelagic fish with tropical or subtropical distributions became increasingly dominant in the SCCE (Koslow et al., 2018). Commercially important species also show relationships with climate forcing. Bocaccio Rockfish (Sebastes paucispinis) ichthyoplankton abundance is negatively correlated with CalCOFI SST, while Pacific Sardine and Pacific Mackerel (Scomber japonicus) ichthyoplankton are positively correlated with CalCOFI SST (Hsieh et al., 2005). To examine changes in fishing pressure, an annual review of California fisheries (CDFW, 2015) can be examined.
Oxygen dynamics in the SCCE also correlate with trends in the CalCOFI ichthyoplankton time-series. Mesopelagic fish abundance showed a 63% decline between periods of high and low oxygen in the CalCOFI record, suggesting that deoxygenation may result in declining mesopelagic fish abundances in the future (Koslow et al., 2011). Lindegren et al. (2017) also found that mesopelagic fish abundance was positively correlated with oxygen concentration, and exhibited a threshold relationship. In contrast, oxygen was not found to be a significant variable in explaining trends in the abundance of zooplankton, euphausiids, pelagic fish, or Pacific hake in the SCCE (Lindegren et al., 2017). The vertical distributions of adult fish may also be affected by oxygen changes but this cannot be seen with the CalCOFI dataset, which only samples the early life history stages.
Key findings have also been made with the CalCOFI zooplankton dataset. Between 1951 and 1993, zooplankton displacement volume decreased significantly, correlated with a warming of surface waters (Roemmich and McGowan, 1995). From 1951 to 2005, the mean zooplankton displacement volume decreased by 64% off southern California and 68% off central California, which was attributed to a decline in high volume-low carbon zooplankton (i.e., “cool phase” salps) in the latter half of the time-series (Lavaniegos and Ohman, 2007). Zooplankton biomass in terms of carbon showed no long-term trend, highlighting that the zooplankton displacement volume is not directly correlated with zooplankton biomass in terms of carbon (Lavaniegos and Ohman, 2007). Planktonic copepods, followed by euphausiids, dominate the carbon biomass in the zooplankton samples (Lavaniegos and Ohman, 2007). The zooplankton data have also shown that certain krill species (euphausiids) have warm (e.g., Nyctiphanes simplex and Euphausia eximia) and cold (e.g., Euphausia pacifica and Thysanoessa spinifera) affinities, and that krill distributions respond to natural climate forcing through ENSO and PDO cycles (Brinton and Townsend, 2003).
Since CalCOFI samples capture species that occupy multiple trophic levels as adults, the data have been used to study how climate forcing affects food web interactions and ecosystem resilience (Lindegren et al., 2016, 2017). Despite the presence of pronounced multidecadal variability and associated changes in the abundance of certain species and groups in the SCCE, ecosystem functioning has largely remained unchanged, due to complementarity of species within trophic levels (Lindegren et al., 2016). In other words, functionally similar species have opposite responses to climate drivers, resulting in overall ecosystem stability. Bottom-up control is the primary mode of ecosystem regulation in the SCCE (Lindegren et al., 2017), meaning that changes to primary production are carried up the food chain and directly affect top predator abundances. However, under El Niño-like conditions (i.e., weak upwelling, low nutrient concentrations, and low primary production), Lindegren et al. (2017) found that bottom-up forcing is reduced in the SCCE and the system exhibits “wasp-waist” dynamics with mid-trophic levels exerting moderate top-down forcing (Cury et al., 2000). Nitrate concentration, wind stress curl-driven upwelling, and temperature were found to be the best single predictors of ecosystem state across multiple trophic levels (Lindegren et al., 2016), suggesting that climate impacts on these variables will have the greatest impact on the overall ecosystem state of the SCCE.
Regime shifts, meaning rapid, abrupt and persistent changes in ecosystem structure and function (Mollmann et al., 2015), have also been detected in the SCCE using the CalCOFI dataset. Based on the ichthyoplankton time-series, regime changes were detected in 1965 and 1976 for both the summer and spring larval fish assemblage, and additionally in 1983 and 1990 for the spring assemblage (Peabody et al., 2018). The dominant pattern since the strong 1976 regime shift has been a long-term trend toward a more southern and offshore assemblage composition in the CalCOFI region (McClatchie et al., 2018; Peabody et al., 2018). When looking at trends across multiple trophic levels in the CalCOFI dataset, significant break points were identified in 1965, 1976, 1987, and 1999 (Lindegren et al., 2016). Major ecosystem regime shifts in the CCE often occur when the PDO and NPGO show strong, simultaneous, and opposite sign reversals (Di Lorenzo et al., 2008). Therefore, climate change impacts in the SCCE will depend on the phase relationship between fluctuations of the PDO and NPGO modes (Di Lorenzo et al., 2008) along with the forcing of secular climate warming.
Future Climate Change Projections for the California Current
While CalCOFI has provided many insights into how the SCCE has responded to natural and anthropogenic climate forcing over the last 70 years, the twenty-first century will likely be defined by more rapid change and a larger contribution of anthropogenic forcing. Several valuable modeling products are available that allow for projecting future conditions in the California Current under different climate scenarios. However, developing accurate models at timescales that matter to resource managers is still an active area of research. Some of the key challenges involve: properly reproducing biogeochemical dynamics, which are essential for projecting changes in nutrients, oxygen, and pH; improving model resolution, which is important for resolving processes such as upwelling at smaller spatial scales; and accurately reproducing coastal dynamics, which are key for nearshore species such as Dungeness Crab (Metacarcinus magister) and California Spiny Lobster (Panulirus interruptus) (Holt et al., 2009, 2014; Stock et al., 2011). For managing some living marine resources, climate projections on the 3–10 years time scale are the most useful, however, these timescales are not well represented within global climate and ocean models (Busch et al., 2016).
From 1950 to 2019, the Large Ensemble Community Project (LENS) model (Kay et al., 2015) predicted an average increase in SST by 0.5°C, a decrease in surface pH by 0.1, and a decrease in surface oxygen concentration of 2.56 mmol m–3 for the SCCE. By 2050, an additional 1.25°C warming, a 0.1 surface pH decrease, and a 5.75 mmol m–3 decrease in surface oxygen concentration is predicted under the RCP 8.5 “business as usual” emissions scenario (Figure 3). By end of century (2100), conditions in the CalCOFI region are projected to be 3.2°C warmer (SST), surface pH will be 0.3 units lower, and surface oxygen concentrations will have decreased by 13.83 mmol m–3 compared to 2019 conditions under the RCP 8.5 emissions scenario (Figure 3).
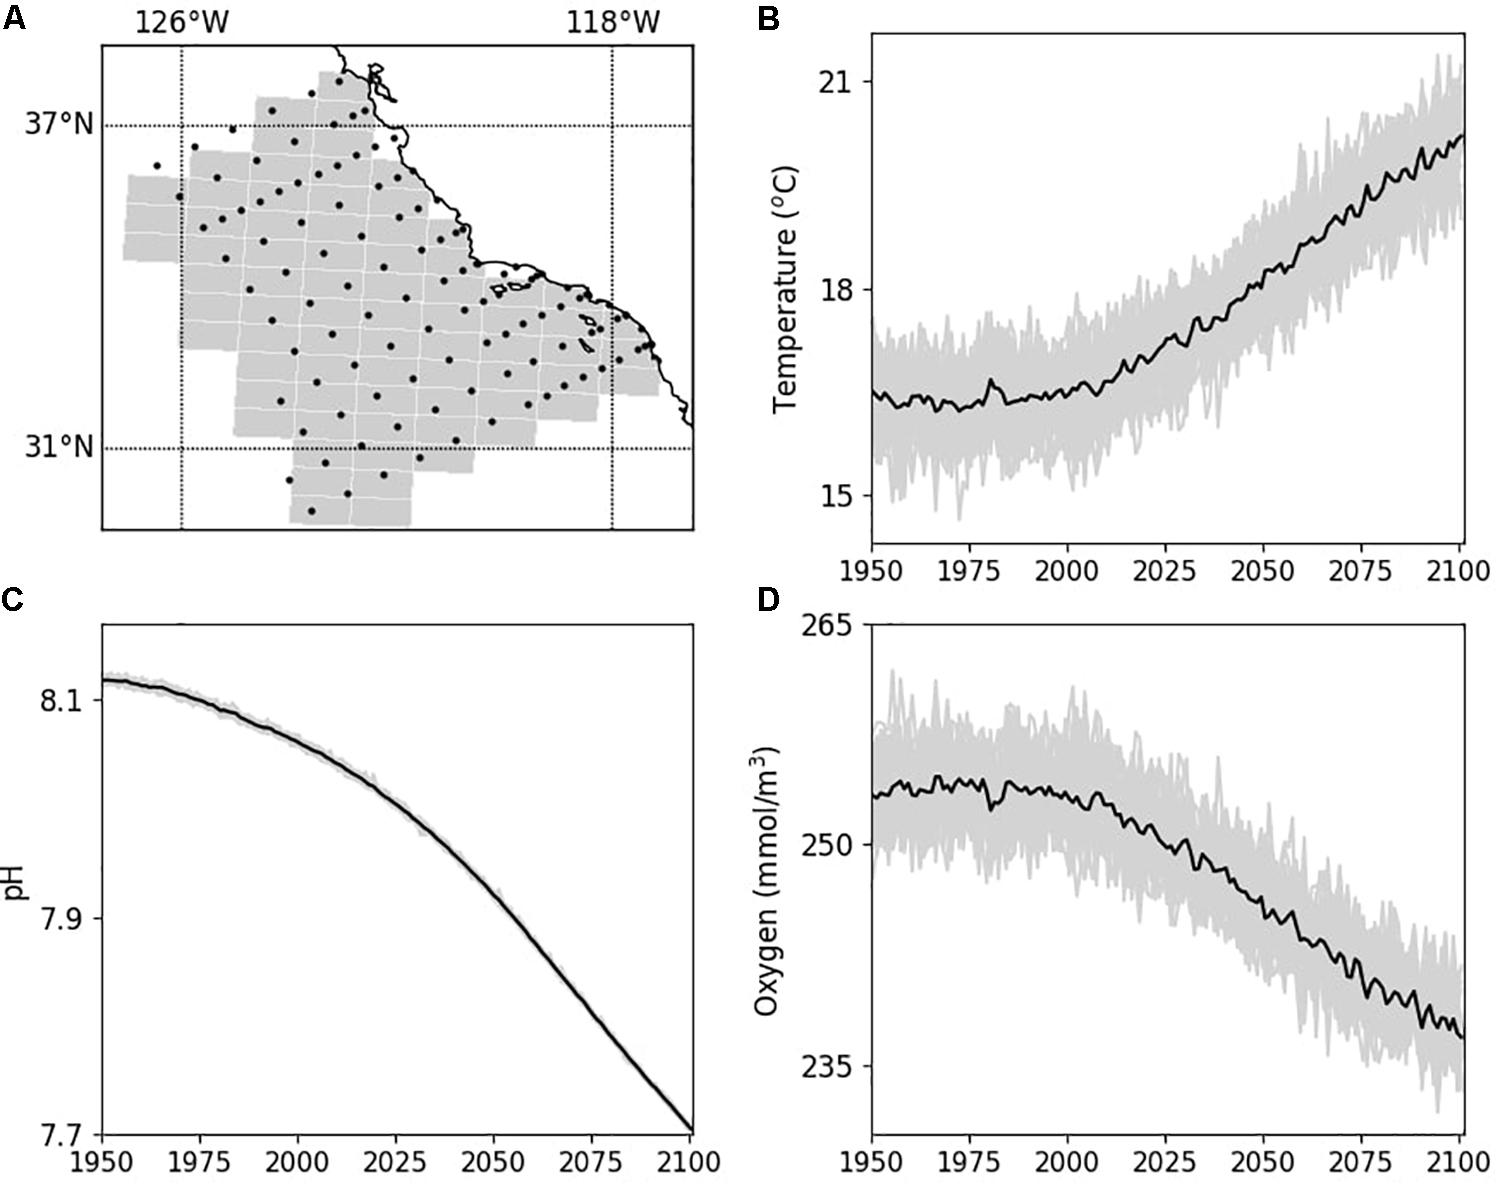
Figure 3. End of twenty-first century climate projections for the CalCOFI region (A) for annual mean sea surface temperature (B), surface pH (C), and surface oxygen concentration (D) forced using RCP 8.5 “business as usual” emissions scenario. For the time-series, gray lines are individual model realizations (35 for temperature and 29 for pH and O2) while the black line is the average of all model realizations. Climate model output obtained from the Large Ensemble Community Project (LENS) (Kay et al., 2015) for shaded grid cells in (A).
The CalCOFI time series shows a stronger warming trend than that projected by the LENS ensemble from 1950 to 2019. While the LENS ensemble showed an average increase in SST by 0.5°C, CalCOFI observations show an average SST warming of 1.45°C for the core CalCOFI grid. For 1950–1952, the average SST across all CalCOFI core stations was 15.16°C (ranging from 10.11 to 21.14°C), while in 2016–2018, average SST in the same region was 16.61°C (ranging from 11.20 to 23.23°C). Thus, observations show a warming trend between ∼1 and 2°C for the mean, minimum and maximum SST values observed across the time series. Thus, the LENS ensemble predictions for warming appear to be conservative compared to CalCOFI observations.
Gruber et al. (2012) and Hauri et al. (2013) used a regional ocean modeling system (ROMS) model at eddy-resolving resolution for the CCE to look at how OA may progress from 1995 to 2050. Under the high emission scenario, which represents 541 ppm PCO2 by 2050, the mean annual pH in the CCE decreased by 0.2 pH units by 2050, compared to pre-industrial conditions, and the aragonite saturation horizon shoaled by ∼250–300 m (Gruber et al., 2012). During the summer upwelling season, low pH conditions were prominent, and by 2050 under the high emission scenario, large stretches of the nearshore central CCE became undersaturated with respect to aragonite (Gruber et al., 2012). These findings suggest that OA will progress rapidly in the CCE, and that nearshore areas (<10 km) are more susceptible to low pH and undersaturated conditions (Gruber et al., 2012). Under current conditions in the CCE, there is a strong positive correlation between the proportion of pteropods with severe shell dissolution and the percentage of water in the upper 100 m that is undersaturated with respect to aragonite (Bednarsek et al., 2014). Therefore, habitat suitability for animals that are sensitive to undersaturated conditions is predicted to decline in the CCE under climate change scenarios (Bednarsek et al., 2014).
Based on observed trends of rapid oxygen loss in the SCCE (Bograd et al., 2008, 2015), predicting future oxygen changes is an area of management interest. A recent study found an intriguing statistical relationship between subsurface anomalies in the core of the North Pacific Current and decadal changes in oxygen in the CCE (Pozo Buil and Di Lorenzo, 2017). Based on ocean observations and an ocean reanalysis product for the period 1950–2010, they found that anomalies in the North Pacific can be used to accurately predict oxygen trends on the US West Coast over a time-scale of 9–12 years and predicted a new period of strong oxygen decline by 2020 (Pozo Buil and Di Lorenzo, 2017). If accurate, predictions at these time-scales could be helpful for guiding management decisions if there exist known relationships between the abundance of fisheries species and environmental oxygen conditions. Trends in salinity showed high correlation with trends in oxygen, suggesting that salinity can be used as a passive tracer of circulation-driven changes in the oxygen dynamics (Pozo Buil and Di Lorenzo, 2017), in contrast with changes due to warming or biological use, which may become more pronounced with climate change in the CCE by year ∼2030 (Long et al., 2016).
Reduction in primary production is an additional climate change stressor predicted to impact marine ecosystems (Bopp et al., 2013). However, there are large regional differences and high levels of uncertainty relating to projected changes in primary production across Earth system models (Steinacher et al., 2010). In eastern boundary upwelling systems (EBUS) such as the CCE, changes in upwelling-favorable winds may drive geographic and temporal changes in primary productivity. A meta-analysis found that upwelling-producing winds have strengthened over the past ∼60 years in three EBUS including the California Current (Sydeman et al., 2014). Coastal upwelling-favorable winds have intensified and will continue to do so in poleward portions of EBUS (Rykaczewski et al., 2015). A climate model ensemble further predicts seasonal variability in CCE upwelling trends with intensification occurring in the spring but weakening in the summer (Brady et al., 2017). Changes in nutrient supply could also modulate productivity: Rykaczewski and Dunne (2010) explored this question using a biogeochemistry-coupled earth system model, showing increases in nitrate supply and productivity for the CCE under climate change, despite increases in stratification and potential dampening of vertical transport. While increased primary production has positive, bottom-up effects for fisheries production, these changes could be accompanied by decreases in oxygen and pH (Rykaczewski and Dunne, 2010).
If upwelling patterns follow current trends and predictions, there may be spatially heterogeneous variability in patterns of ocean warming and primary production in the future, though the CCE is particularly uncertain (Wang et al., 2015). Increased warming and stratification offshore would result in decreased primary production, while the influx of cold, nutrient-rich water due to increased coastal upwelling could mitigate warming and actually increase primary production near the coast (Garcia-Reyes et al., 2015). A pattern of warm offshore waters coupled with cool, productive coastal waters was observed in the central CCE in 2015 (Santora et al., 2017). This unusual oceanographic state resulted in a unique assemblage where subtropical mesopelagic taxa as well as taxa such as rockfishes that thrive under cooler, productive conditions were both very abundant in the same region, and overall species richness was the highest recorded since sampling began in 1990 (Santora et al., 2017).
Fisheries Management on the US West Coast and CalCOFI
To effectively explore how monitoring data can best be incorporated into management decisions from the perspective of climate change adaptation, a basic understanding of the structure of the policy and management framework is necessary. For the US West Coast, several jurisdictional management bodies and policies guide marine resource management. This section briefly discusses how the data collected by CalCOFI fits within the management priorities for the US West Coast.
In the U.S., Fisheries Management Plans (FMPs) are mandated for fisheries occurring in federal waters by U.S. law under the Magnuson-Stevens Fishery Conservation and Management Act (MSA) (NMFS, 2007). FMPs are the main vehicle for managing fisheries, and rely largely on single-species stock assessments for determining stock status and setting harvest limits. Management varies based on the fisheries species, whether it is fished commercially or recreationally, and whether it is managed federally and/or by the state. Federal fisheries species are managed by NOAA National Marine Fisheries Service (NMFS) through the eight regional Fishery Management Councils established under the MSA (NMFS, 2007). The Pacific Fisheries Management Council (PFMC) is responsible for management of fisheries along the US West Coast (NMFS, 2007) and includes federal, state, and tribal partners. In California, the Marine Life Management Act (MLMA) directs the California Department of Fish and Wildlife (CDFW) and the California Fish and Game Commission to manage state fisheries sustainably including developing FMPs (CDFW, 2018).
CalCOFI already contributes directly to US West Coast fisheries population assessments and management (McClatchie, 2014) by providing the PFMC with information about fish population abundances, oceanographic conditions, and ecosystem status. CalCOFI larval abundance time-series are directly used as indices of spawning stock biomass in the Bocaccio (He and Field, 2017) and Cowcod (Sebastes levis; Dick and MacCall, 2014) rockfish stock assessments, and were recently used to monitor population trends of Blue Rockfish (Sebastes mystinus; Dick et al., 2017). CalCOFI data are also used to quantify Daily Egg Production values that contribute to Pacific Sardine (Hill et al., 2017) and Northern Anchovy (Fissel et al., 2011; Dorval et al., 2018) stock assessments. Additionally, CalCOFI larval data track the status of harvested species such as Market Squid (Koslow and Allen, 2011) and Jack Mackerel (Thompson et al., 2018), and taxa such as mesopelagic fishes that are considered by the PFMC to be important forage species for higher trophic levels (McClatchie et al., 2018). This information is used by the PFMC to set harvest limits at levels that support sustainable fisheries.
In addition to evaluating the status of individual species, fisheries management in the United States also emphasizes holistic monitoring of ecosystem dynamics (Levin et al., 2008), and NOAA Fisheries is moving toward a next generation stock assessment approach which incorporates ecosystem links (Lynch et al., 2018). The inclusion of ecosystem factors such as oceanographic variables into single-species stock assessments, termed an Ecosystem Approach to Fisheries Management (EAFM), can allow for better stock-focused management decisions (Link, 2016). Currently, most stock assessments do not take environmental conditions into account due to the difficulty of elucidating predictable recruitment-environment relationships that explain enough recruitment variability to be useful for management (Myers, 1998; Jacobsen and McClatchie, 2013; Lindegren et al., 2013; Tolimieri et al., 2018). A global review of 1200 marine fish stocks revealed that only 24 stocks were managed in a way that incorporated ecosystem drivers such as climate (Skern-Mauritzen et al., 2016). The Pacific Sardine is one example in which oceanographic data directly informs an aspect of single-species stock assessment. Pacific Sardine stock productivity is higher under warmer conditions, so Pacific Sardine management uses SST averaged across the core CalCOFI grid to calculate the over fishing limit and the acceptable biological catch (Hill et al., 2017), with fishing effort increasing under higher temperatures. However, recent efforts to re-evaluate the temperature dependence of Pacific Sardine stock productivity concluded that the earlier positive correlation with SST may no longer be valid (Zwolinski and Demer, 2019).
Beyond a single-species focus, Fisheries Ecosystem Plans (FEPs) have been developed to guide fisheries management toward implementing ecological principles (Marshall et al., 2018). FEPs are encouraged but not mandated by federal fisheries policy, and five of eight regional fisheries management councils, including the PFMC (Pacific Fishery Management Council [PFMC], 2013), have developed FEPs. The PFMC also currently includes an Ecosystem Consideration appendix to their groundfish, coastal pelagic species, and salmon FMPs as an effort to inject monitoring data more directly into fisheries management decisions, which includes some CalCOFI data.
The CalCOFI dataset is well suited to not only inform the status of individual species but also to provide insight into the ecosystem state of the SCCE and how it responds to both short and long-term environmental forcing (McClatchie, 2014). Integrated ecosystem assessments (IEAs) have been developed by NOAA to support Ecosystem Based Management (EBM) (Levin et al., 2009), and the California Current was selected as the first region for the development of a full IEA, which began in 2009 and is called the California Current Integrated Ecosystem Assessment (CCIEA). CalCOFI contributes several of the indicators used by the CCIEA (Figure 4), including the abundances of larval Northern Anchovies, Market Squid, Pacific Hake, Jack Mackerel, Sanddabs, Pacific Sardine, Shortbelly Rockfish (Sebastes jordani), and a category of warmwater and coolwater mesopelagic fish larvae. Since 2013, the IEA team has presented an annual report to the PFMC on the state of the CCE including indicator trends using CalCOFI data (Harvey et al., 2018). Organizations that use the CCIEA to inform decision-making include the PFMC, the West Coast National Marine Sanctuaries, the West Coast Governors Alliance, and the North Pacific Marine Science Organization (Samhouri et al., 2013).
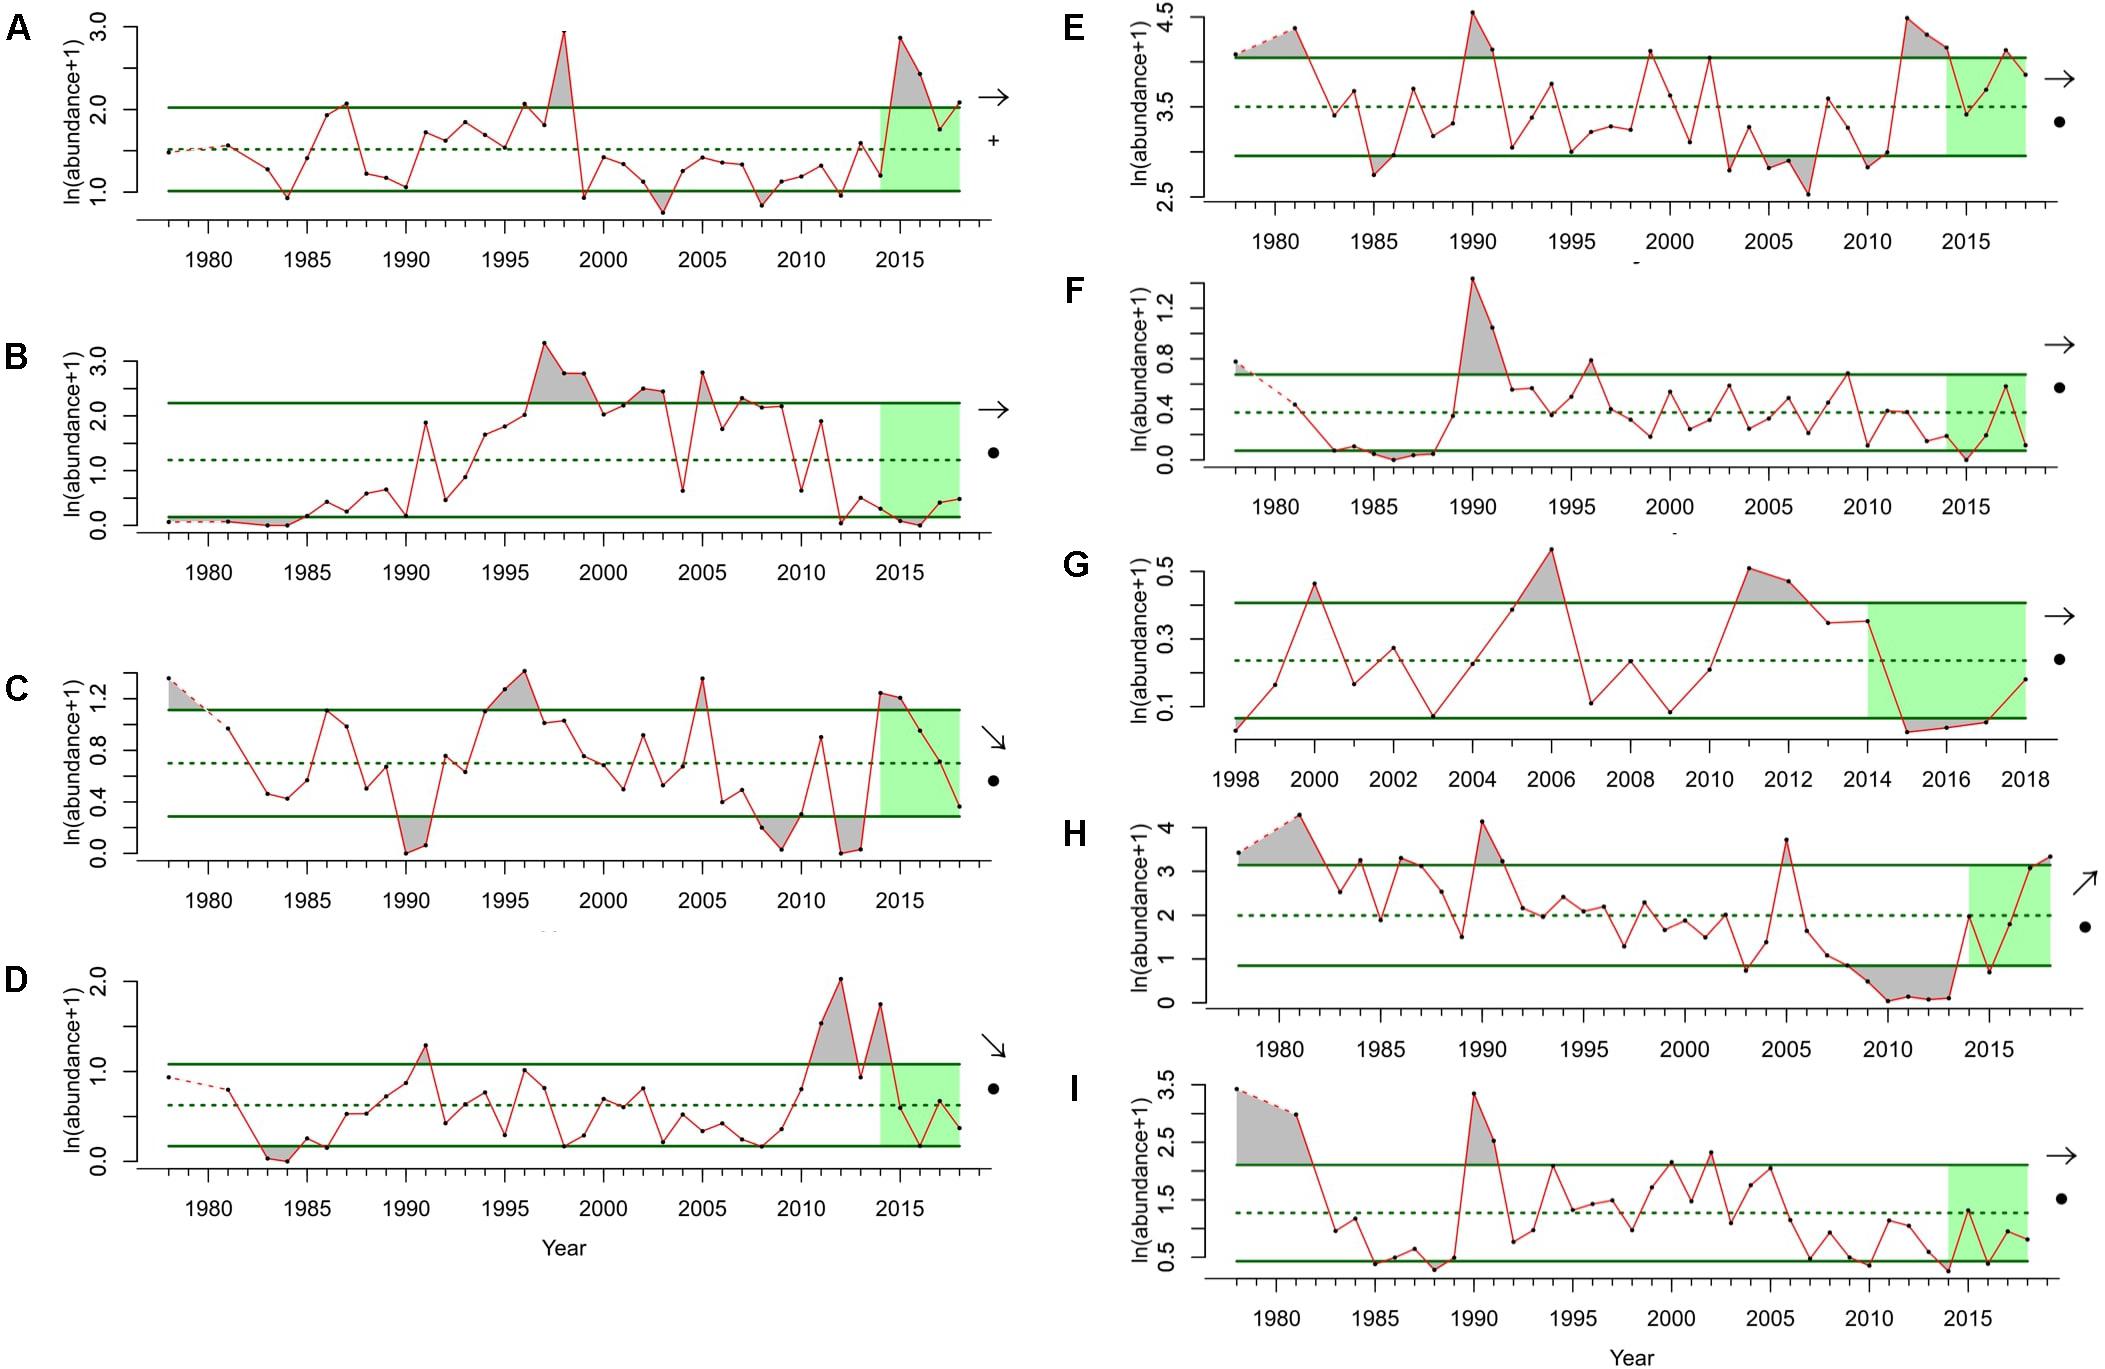
Figure 4. Indicator taxa from the CalCOFI time-series that are used for the California Current Integrated Ecosystem Assessment (CCIEA). On left (A–D) are groups or species that exhibit a warm-affinity and may increase in total and relative abundance in the future: (A) warm-water mesopelagic fish larvae, (B) Pacific Sardine, (C) Jack Mackerel, and (D) Sanddabs. On right (E–I) are groups or species that exhibit a cold-affinity and may decrease in total and relative abundance in the future: (E) cold-water mesopelagic fish larvae, (F) Shortbelly Rockfish, (G) Market Squid, (H) Northern Anchovy, and (I) Pacific Hake. Time series come from spring CalCOFI surveys (1978–2018) on lines 76.7–93.3 and stations 28.0–120.2. Larval fish data are summed across all stations and units are in number of larval fish under 10 m2 of surface area, transformed using ln(abundance + 1). Dotted line shows long term mean, solid green lines show standard deviation, and recent 5 years trend for each taxa is indicated by the arrow on the right of each time-series. Green shading indicates the last 5 years of the time-series.
How Can CalCOFI Support Stakeholder Needs for Addressing Climate Change Adaptation?
While the CalCOFI dataset already supports efforts at the state and federal level to consider management approaches that are adaptive to climate change, progress can be made in linking monitoring data with actionable strategies for climate change adaptation. One approach to this is through recognizing and meeting the needs of stakeholders concerned with climate change adaptation. Here we consider several different stakeholder user groups of CalCOFI data products (Figure 5).
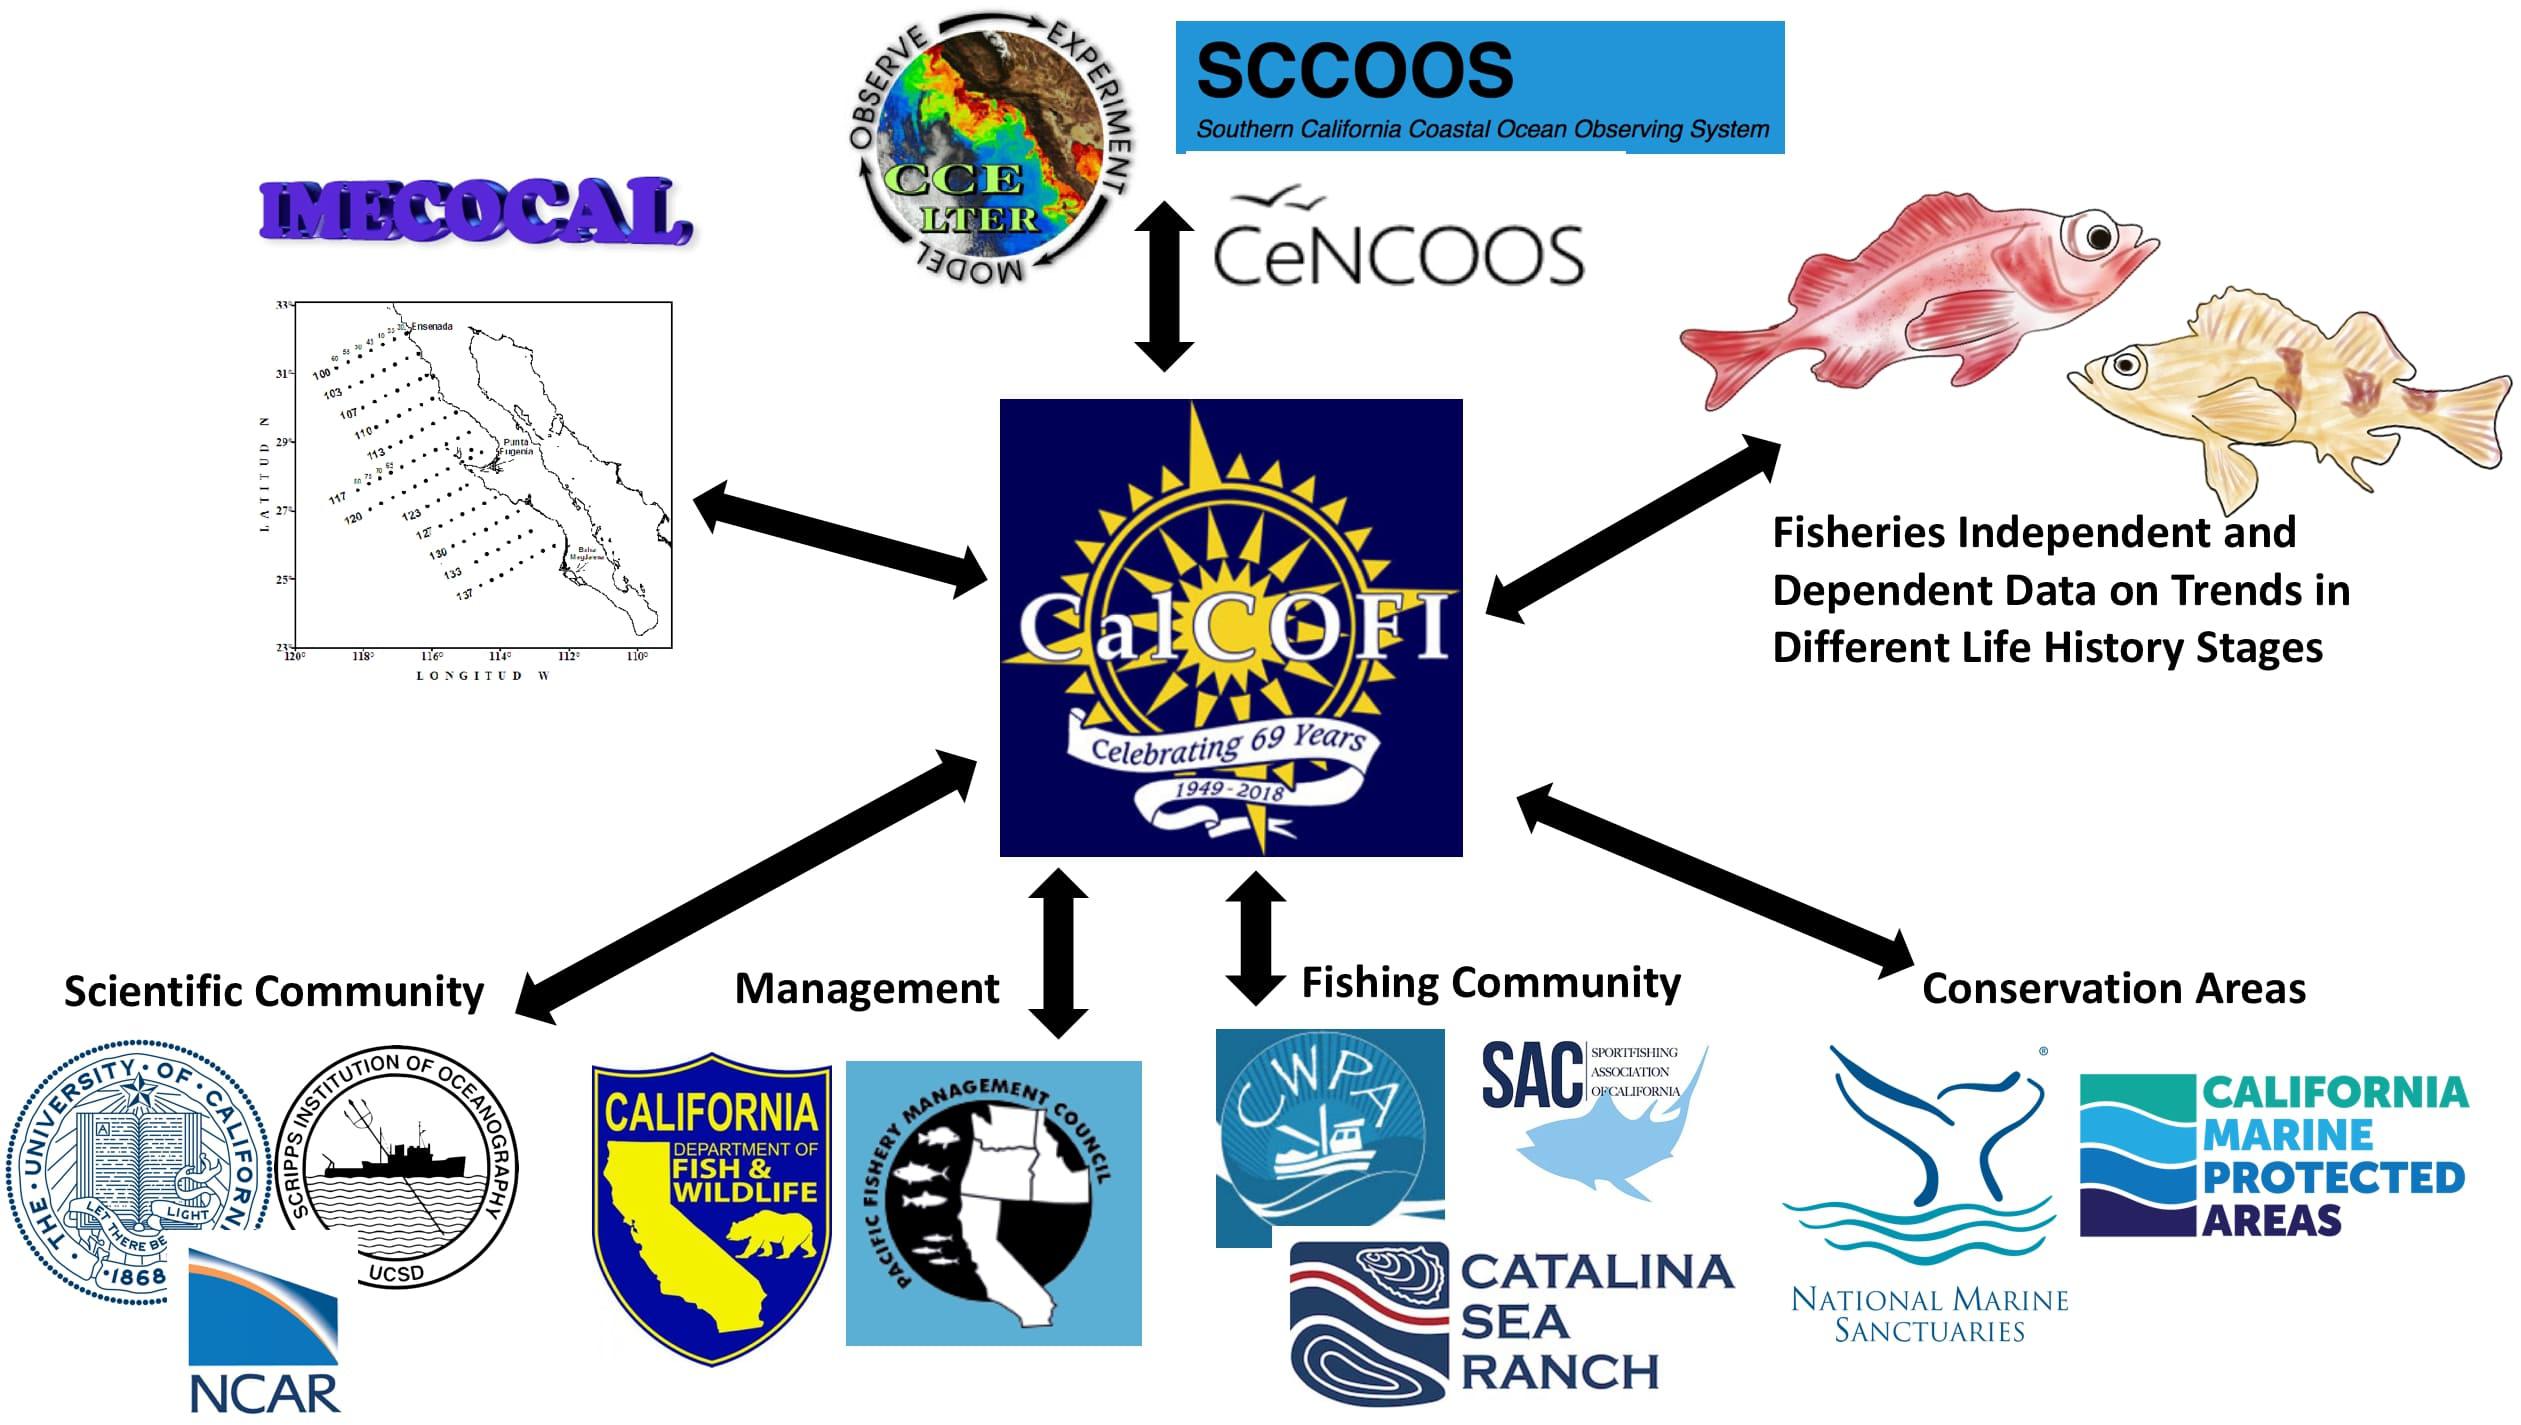
Figure 5. Linking basic monitoring to decision-making for climate change adaptation requires integrating different data streams with the needs of stakeholders. CalCOFI exists alongside a wealth of additional sampling programs that, in concert, allow for comparing changes seen in the CalCOFI record across regions (upper, left), monitoring frameworks within a region (upper, middle), and sampling programs on different fish life stages (upper, right). Trends observed from these monitoring programs can support different stakeholder groups (bottom) including the scientific, management, fishing, and conservation communities on climate change adaptation strategies and actions. Arrows show that information can flow both ways.
Academic Community
One of the most obvious stakeholders is the science community, which includes stock assessors, the climate modeling community, as well as scientists studying the ecological impacts of climate change. For these communities, time series and sampling consistency, attention to accuracy of measurements, rapid data availability following cruises, and easy data access are key. Given that the CalCOFI time series currently extends almost 70 years, it allows analysis of climate related interactions at multidecadal, interannual, and seasonal time scales in addition to secular (long-term) climate change. Consequently, it supports two key research needs identified by the 2009 National Climate Assessment report: improving understanding of the climate system and drivers, and improving understanding of climate impacts and vulnerability. Survey data are essential for validating regional ocean models, Global Circulation Models, and Global Climate Models and CalCOFI data are integrated into regional modeling efforts in terms of model calibration, data assimilation, hindcasting and reanalysis model products. Data-assimilative ROMS which incorporate CalCOFI data have been developed and are used by research groups at the University of California, Santa Cruz and the University of California, Los Angeles.
Fisheries and Aquaculture Community
The management community is also a key stakeholder of CalCOFI data products. Improving the paths by which monitoring data are used by management bodies will improve the ability for managers to make decisions that are more responsive to climate change. Answering how climate-related effects can be incorporated into adaptive marine resource management processes is a key question for NMFS (Busch et al., 2016), and the PFMC is currently considering this as part of its Climate and Fishing Communities Initiative.
Similarly, state management agencies such as CDFW are stakeholders of CalCOFI data products. CalCOFI provides fishery-independent time series that can be incorporated into management for key state-managed fisheries, such as California Spiny Lobster and Market Squid (Koslow and Allen, 2011; Koslow et al., 2012), and the nearshore sampling stations provide a look at more nearshore changes that are relevant to the state. There are no fishery-independent time series for many recreational fisheries, and CalCOFI data are well suited to inform stock status for taxa such as Saltwater Basses (Paralabrax spp.) that may be overfished (Jarvis et al., 2014). Early life history stages of these forage species are captured in the CalCOFI dataset, providing an existing time series index of spawning stock biomass for reference.
Climate change can also lead to fish stocks shifting their distribution, which can have important management implications regarding allocation. When a stock is shared across national boundaries, this can add additional complexity. The southern end of the CalCOFI domain samples along the US-Mexican border meaning that it can provide information on shifting distributions across international boundaries. Data from the Mexican exclusive economic zone are more limited, although data from IMECOCAL (Baumgartner et al., 2008) and some catch data from Mexico are incorporated into the Pacific Sardine stock assessment. In contrast to shared US-Canadian stocks, no explicit fisheries stock sharing agreements exist between the US and Mexico. One potential emerging fishery of interest is the Humboldt Squid, which is fished in Mexican waters but is only periodically caught off California. Humboldt Squid appears to expand its range northward during warm, low oxygen periods (Gilly et al., 2013) and could emerge as a valuable fishery in a warmer future. Since commercial fishermen need specific permits to allow for fishing new species, early indicators of a shift in distribution are key to supporting responsive management actions.
The fisheries industry is also a stakeholder of CalCOFI data. The CalCOFI region captures an area of great interest to the recreational fisheries industry, which is an engine of the economy in Southern California. Many recreational fisheries species are not federally managed and therefore population trends of these species are not as well known. Since CalCOFI samples the early life history stages of over 400 fish species, it provides a valuable record of fisheries species trends that receive less management attention, but may be impacted by climate change. Sport fishing organizations and recreational fishing party boats can all be thought of as potential stakeholders of CalCOFI data. CalCOFI is also important for the commercial fishing industry. The California Wetfish Producers Association pays close attention to CalCOFI data since most wetfish (i.e., sardines, anchovies, squid, and mackerels) in the state come from southern and central California. This group is actively involved with the PFMC and coastal pelagic species management, and industry-funded researchers for the California Wetfish Producers Association use CalCOFI paralarvae counts of Market Squid in their monitoring studies.
Beyond impacts on fisheries species, there is also a need to consider adaptive capacity of the fisheries industry, which depends on the types of fisheries that are present. For example, while stock assessments focus on single-species, fishermen can fish multiple species and switch effort based on both biological and economic factors. Fuller (2018) shows that fisheries in the CCE are strongly connected by human participation, with participants in the Dungeness Crab pot fishery showing high connectedness to many different fisheries. Incorporating considerations about effort-switching may be critical in thinking about climate change adaptation for fisheries. Since CalCOFI samples multiple species, analyses could be catered to reflect fishing practices by grouping species by connectivity of fisheries efforts, as opposed to focusing on single-species analyses or ecological groupings.
While there is currently little offshore aquaculture along the southern U.S. West Coast, there are ongoing efforts to increase its development. Brander (2010) points out that aquaculture resembles terrestrial animal husbandry more than it does wild capture fisheries, and therefore has greater scope for decision-making that is adaptive to climate change. In the future, the aquaculture industry could become an additional stakeholder of CalCOFI data. The Catalina Sea Ranch is a mussel aquaculture farm, which operates in federal waters offshore of Los Angeles, CA. It is the first aquaculture facility permitted for commercial use in federal waters in the US, and the company plans to expand its 100 acre underwater shellfish farm to 1,000 acres. Shellfish aquaculture may be especially concerned about OA impacts. There have also been proposals for finfish aquaculture in federal waters off California, such as a recent proposal by Pacific Ocean Aquafarms (previously the Rose Canyon Fisheries Farm) to raise California Yellowtail (Seriola lalandi) and White Seabass in offshore net pens off San Diego. While it is unclear if this venture will be approved, it is worth noting that just south of the border in Mexico, tuna aquaculture is a widespread practice, with several companies, including Baja Aqua Farms, raising tuna in offshore pens. While aquaculture groups will likely invest in their own ocean monitoring platforms, CalCOFI can provide information on larger-scale trends (i.e., changes in pH or oxygen) that are occurring independent of aquaculture practices.
Ecosystem Management Community
Planners and managers of marine conservation areas can also be considered stakeholders of CalCOFI data. Rockfish conservation areas, marine protected areas (MPAs), and national marine sanctuaries all occur within the CalCOFI region (Figure 6). While these conservation areas have different mandates and roles, CalCOFI can provide regional context for interpreting local trends that may be related to specific management or marine use actions. Nine CalCOFI stations occur within National Marine Sanctuaries (NMS) (seven within the Monterey Bay NMS, one within the Greater Farallones NMS, and one within the Channel Islands NMS) (Figure 6A). The Channel Islands NMS makes use of CalCOFI data in its formal status reports but there are clear opportunities for CalCOFI data to further inform the Monterey Bay and Greater Farallones NMS. CalCOFI stations also occur within three State Marine Reserves (South Point, Begg Rock, and Point Conception) and two State Marine Conservation Areas (Point Dume and Dana Point) (Figure 6B). Six CalCOFI stations also fall within the Cowcod Conservation Area (CCA) (Figure 6C). Data from CalCOFI stations within and outside of the CCA have been used to show trends in recovery of overfished rockfish stocks (Thompson et al., 2017a). Understanding vulnerability of marine conservation areas to climate change and considering adaptation measures are active areas of interest for planners and managers of these areas; the CalCOFI dataset can provide important regional insight for climate change studies and opportunities to evaluate management action.
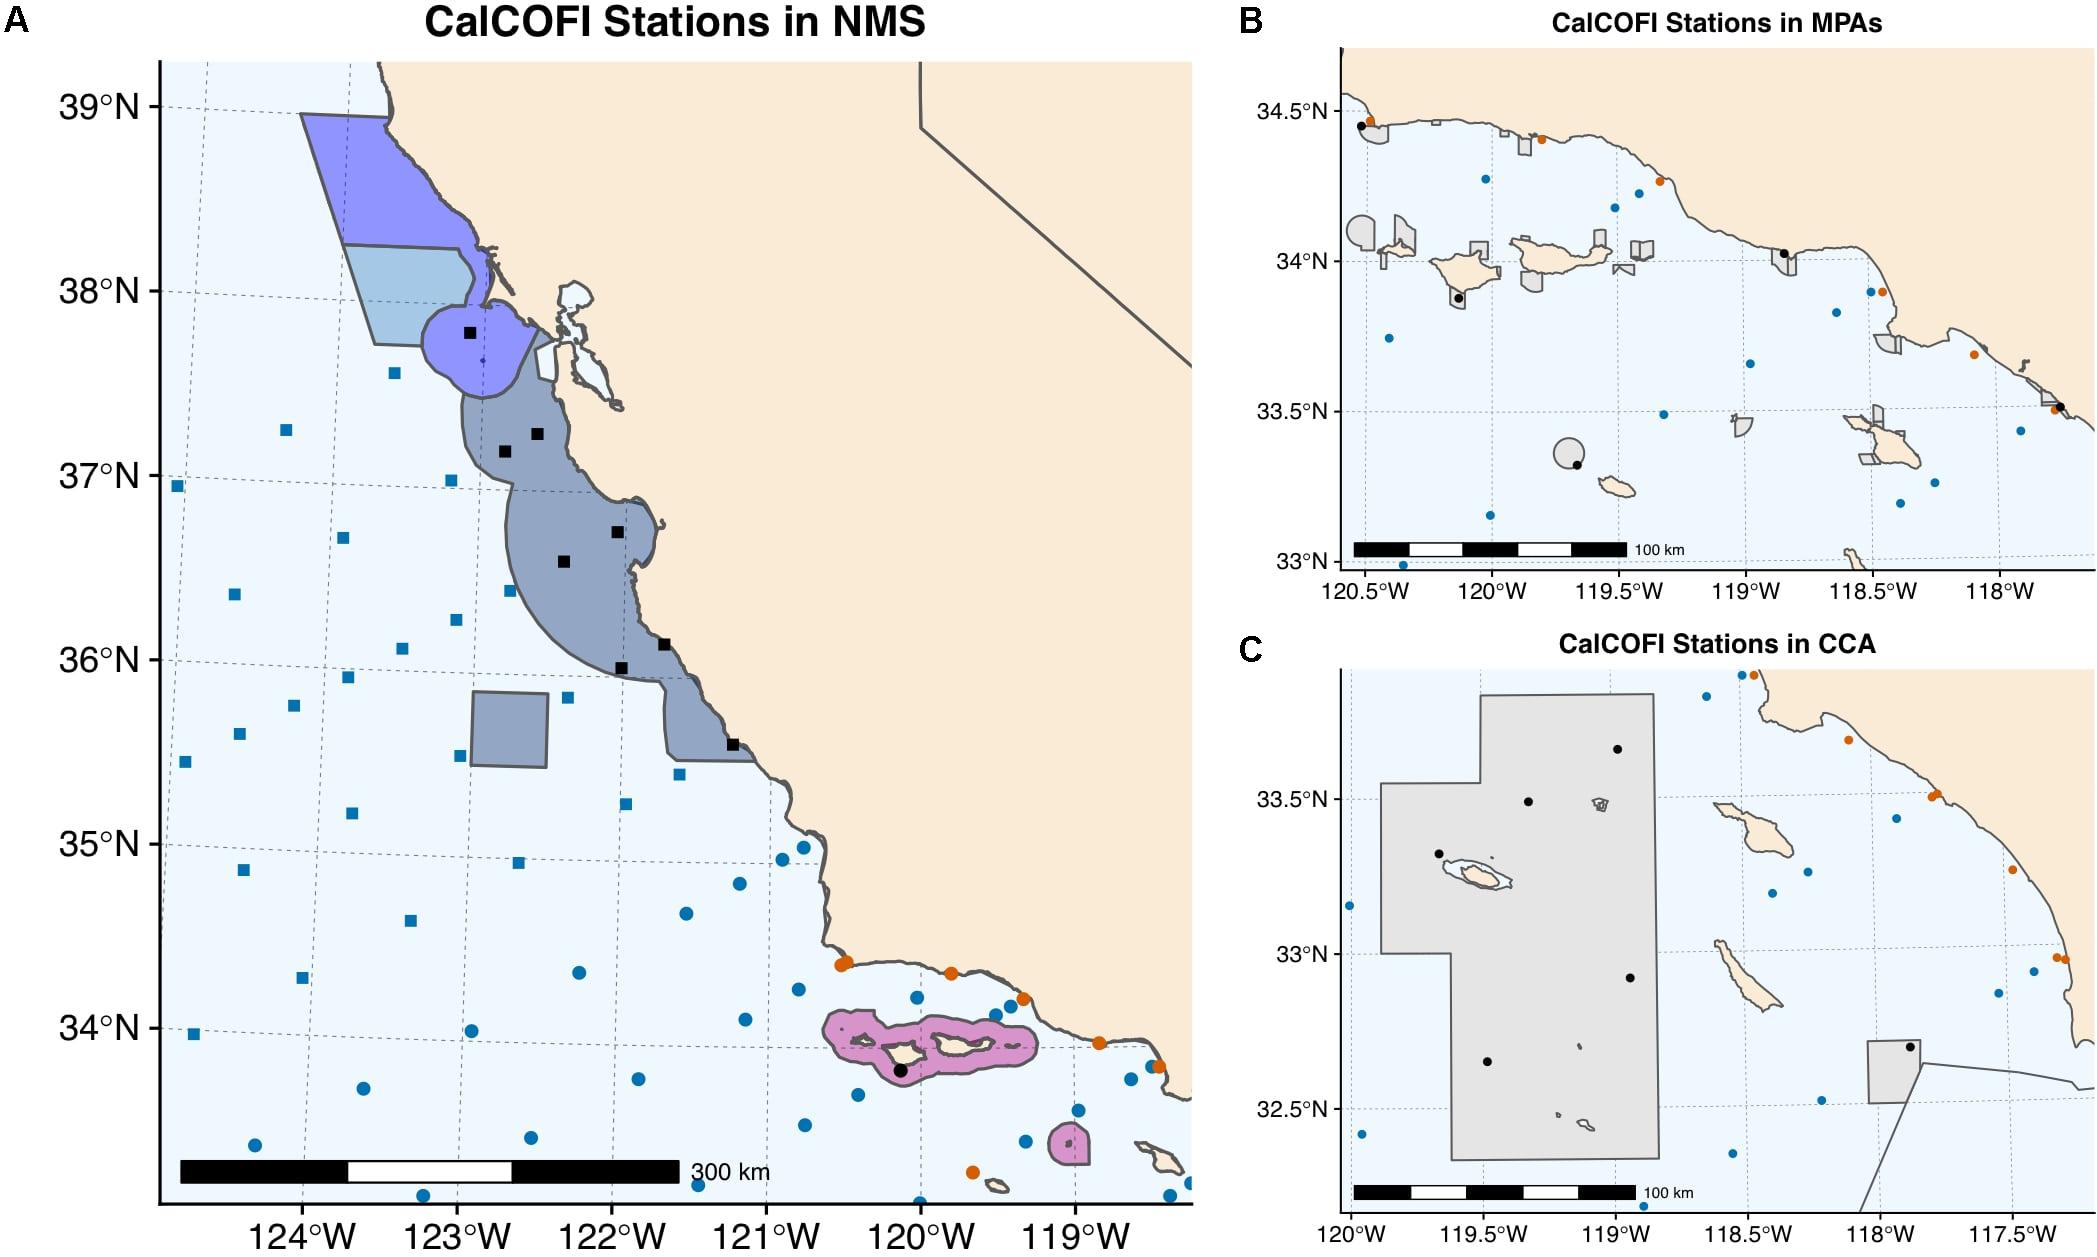
Figure 6. Nine CalCOFI stations fall within the National Marine Sanctuaries (A), five within Marine Protected Areas (B), and six within the Cowcod Conservation Area (C). CalCOFI stations that fall within conservation areas are shown in black within the conservation area boundaries. A scale bar is provided for spatial reference. Color and point type of other CalCOFI stations are consistent with Figure 1.
For the northern and central CCS, Sydeman et al. (2014) developed a Multivariate Ocean Climate Indicator (MOCI) to aid in the evaluation of ecosystem management decisions. The MOCI synthesizes 14 basin- and regional-scale atmospheric and oceanographic indicators from a variety of time series (Sydeman et al., 2014). If this multivariate index proves useful in guiding management decisions, a similar index could be developed for Southern California by incorporating CalCOFI data. Currently, CalCOFI scientists produce an annual State of the California Current report, which provides a review of environmental conditions in the CCE (e.g., Thompson et al., 2018). Species that are responsive to climate forcing and are dominant in abundance in the community can be good bio-indicator species and several taxa from the CalCOFI time series are used as bio-indicators for the CCIEA.
Certain non-governmental organizations such as EcoAdapt and The Nature Conservancy Climate Fisheries group are also actively involved in developing climate change vulnerability assessments and strategies for climate change adaptation for fisheries and marine ecosystem management. These groups may use CalCOFI data or products such as the State of the California Current report. Additionally, the CalCOFI Program now exists alongside a wealth of additional sampling programs that have developed in the region through time. These include: NOAA’s Northwest Fisheries Science Center Groundfish Trawl Survey and the Southwest Fisheries Science Center Pelagic Juvenile Rockfish Recruitment and Ecosystem Assessment Survey and summer Coastal Pelagic Survey, the 40 + years ichthyoplankton time-series from the Southern California coastal power plant intakes (Miller and McGowan, 2013; Siegelman-Charbit et al., 2018), the CCE LTER Program, commercial and recreational fishing data (Perry et al., 2010), the IMECOCAL oceanographic survey south of the border (Baumgartner et al., 2008), the southern (SCCOOS) and central California (CeNCOOS) coastal ocean observing programs, as well as others. Leveraging knowledge, collaborations, and investment across these different groups will allow for better scientific guidance for climate change adaptation for fisheries and ecosystem management.
Discussion
Climate Change Impacts on Fisheries
CalCOFI was originally developed to inform Pacific Sardine management, and continues to inform sustainable fisheries management on the US West Coast. As climate change progresses, CalCOFI can be used to monitor climate change impacts on fisheries species. The effects of climate change on fisheries production is a concern for fisheries management around the world (Barange et al., 2018; Cheung, 2018). Climate change can affect fisheries species through direct effects of hydrographic changes (e.g., temperature, oxygen, pH) on physiology and the indirect effects of ecological changes mediated through the food web and multi-species interactions (Brander, 2010). Overall, trends indicate increased catch potential in high latitudes and decreased catch potential in lower latitudes (i.e., tropics) with climate change (Cheung et al., 2010). On the US West Coast, fisheries for Albacore Tuna (Thunnus alalunga) may increase with climate change and new fisheries, such as on the Humboldt Squid (Dosidicus gigas), may develop (Chavez et al., 2017).
Managing fisheries effectively under climate change will require the ability to identify and track trends, develop indices of change, and develop early indicators of potential shifts in biological communities, which are all areas that CalCOFI directly contributes to. Management bodies need synthesized data products, including relevant indices, to make decisions, as well as reliable climate forecasting abilities over 1–10 years time frames that guide decision-making. To do this, linkages between environmental indices and fisheries need to be effectively identified so that forecasting can be used to inform management decisions.
NOAA Fisheries has developed a Climate Science Strategy (CSS) for including climate-related information in managing fisheries and protected species, which includes conducting climate vulnerability analyses, establishing ecosystem indicators, and developing capacity for conducting management strategy evaluations (MSEs) of climate-related impacts on management targets, priorities, and goals (Busch et al., 2016). MSEs are a modeling tool which allow scientists and managers to compare the performance of different management strategies in meeting specific management objectives (i.e., fishery resource status) (Punt et al., 2016) and can be used to manage climate change risks (Plaganyi et al., 2013). To implement the CSS, regional NMFS offices develop Regional Action Plans, which are developed jointly by scientists, managers, and stakeholders. For the US West Coast, a Western Regional Action Plan has been developed (Noaa Nw/Sw Fisheries Science Centers, 2016) that lays out the NOAA Fisheries climate change strategy and the Western Regional Implementation Plan provides the means to execute the strategy. Incorporating environmental data into stock assessments to improve fisheries management under climate change is also a recognized priority for NMFS (Karp et al., 2018; Lynch et al., 2018).
While the work on climate-ready fisheries management is relatively new, several adaptation approaches have been proposed including: addressing cumulative impacts to reduce stressors for fisheries species, preparing for emerging fisheries, accounting for climate effects in stock assessments, adjusting spatial boundaries for management areas, coordinating across static boundaries such as national borders, developing regional climate change projections to guide management decisions, expanding opportunities for real-time responses to climate, and promoting social-ecological resilience (Pinsky and Mantua, 2014). Vulnerability assessments, modeling tools and MSEs, and the use of adaptation frameworks that incorporate socio-ecological considerations are all tools that can be used to address fisheries adaptation to climate change (Lindegren and Brander, 2018).
Based on CalCOFI data, in the SCCE, secular climate change will likely lead to increased fish community diversity (McClatchie et al., 2016, 2018; Koslow et al., 2017), as warm-affinity species expand their ranges, but may be associated with lower fisheries productivity for current community dominants like Northern Anchovy and Pacific Hake (Koslow et al., 2017). Changes in community composition are also expected. If conditions continue to warm, a change in dominance is expected from California Smoothtongue to Mexican Lampfish inshore and Northern Lampfish to Panama Lightfish offshore (McClatchie et al., 2016). A comparison of the 15 most abundant ichthyoplankton taxa by sampling region between the CalCOFI region and the region to the south off Baja California from the IMECOCAL Program, suggest that warming conditions may lead to increased relative abundances of Sanddabs (Citharichthys spp.), Pacific Sardine, and Pacific Mackerel, and decreased abundances of Pacific Hake, Rockfishes, and Croaker (Scianidae spp.) (Koslow et al., 2018). Additionally, decreases in primary productivity could give rise to greater influence of mid-trophic levels on ecosystem dynamics in the SCCE (Lindegren et al., 2017).
States are also increasingly interested in understanding how climate change may affect their fisheries. In California, a report on readying California’s fisheries for climate change was recently developed for consideration by the CDFW to help inform the state’s process to amend the Marine Life Management Act (MLMA) Master Plan (Chavez et al., 2017). CDFW has also been developing vulnerability assessments of its primary fisheries species, and the California Ocean Science Trust, Ocean Protection Council, and the Ocean and Coastal Climate Advisory Team are actively engaged in considering climate-ready management strategies in California. A challenge of considering climate change in fisheries management is that across “short” time-scales relevant to decision makers (<10 years), the anthropogenic component of climate change only adds a small increment of change compared to the natural variability experienced by fisheries species in the region (Brander, 2010). However, extreme climate events can lead to rapid effects on a fisheries species, so changes to the frequency or timing of extreme events is also a climate change vulnerability (Brander, 2010).
Species that have in the past increased in abundance during warm conditions may fare better under climate change scenarios, while those that favor cooler periods may be negatively impacted. For California fisheries, Chavez et al. (2017) categorized the following as “warm phase” species: California Halibut, Pacific Sardine, California Spiny Lobster, Pacific Mackerel, Kelp Bass (Paralabrax clathratus), Barred Sand Bass (Paralabrax nebulifer), Spotted Sand Bass (Paralabrax maculatofasciatus), California Sheephead (Semicossyphus pulcher), Kellet’s Whelk (Kelletia kelletii), Pacific Bonito (Sarda lineolata), and White Seabass (Atractoscion nobilis). In contrast, the following fisheries species were categorized as “cool phase” species and more likely to be negatively impacted by climate change: Market Squid, Dungeness Crab, Northern Anchovy, most groundfishes, Chinook Salmon (Oncorhynchus tshawytscha), Pacific Geoduck (Panopea generosa), Pacific Pink Shrimp (Pandalus jordani), Pacific Halibut (Hippoglossus stenolepis), and Red Abalone (Haliotis rufescens) (Chavez et al., 2017).
The CalCOFI dataset captures the early life history stages of many of these species, allowing for monitoring of larval relative abundance trends through time as climate change progresses. Analysis of the CalCOFI time series suggests that commercially exploited fish species show clearer distributions shifts in response to climate forcing than unexploited species (Hsieh et al., 2008), and thus may be more sensitive to climate change. The CalCOFI record has also shown that the abundance of several groundfish, such as English Sole (Parophrys vetulus), Cabezon (Scorpaenichthys marmoratus), Aurora Rockfish (Sebastes aurora), Bocaccio Rockfish, Shortbelly Rockfish, and other rockfishes is especially low after El Niño events (1958, 1983, 1997), likely due to the low reproductive output of the adult population for those years (Lindegren et al., 2017). Following El Niño events, both dominance and assemblage spatial structure of the ichthyoplankton community tended to return to the long-term climatological average, suggesting resilience to temporary perturbations (McClatchie et al., 2016, 2018). Given the considerable changes in warming, pH, and oxygen projected for the SCCE for the twenty-first century (Figure 3), as well as the uncertainty surrounding changes in primary production, the role of CalCOFI in monitoring climate change impacts in the SCCE will become even more critical.
Both “bottom up” and “top down” approaches exist to climate adaptation. One example of a “bottom up” approach is Australia’s research program on Marine Climate Impacts and Adaptation (Hobday and Cvitanovic, 2017) that provides local fishermen and enterprises with knowledge and climate forecast products such as seasonal forecasts at small spatial scales. This directly provides fishermen with tools to guide their decisions. In contrast, the European Maritime and Fisheries Fund uses a “top down” approach that emphasizes strategic planning at large spatial and organizational scales (Lindegren and Brander, 2018). The US strategy for climate adaptation is more like the European approach, however, there may be opportunities to incorporate more “bottom up” elements that may increase participation from local stakeholders. Wilson et al. (2018) proposes that developing climate-ready strategies for fisheries will require increasing the level of participation in the management process by bringing together fishermen, non-governmental organizations, and traditional scientific and management bodies within an adaptive co-management framework. Using a “bottom up” approach to climate adaptation by hosting workshops or roundtables could increase participation, knowledge, and investment from the local community, and connect CalCOFI more directly with the fisheries industry stakeholders.
Limitations and Areas for Improvement
One limitation of using past trends to predict future changes is that ENSO, PDO, and NPGO climate forcing may not be representative of changes predicted with secular climate change. Koslow et al. (2018) show an intriguing recent breakdown in the observed relationship in oceanic forcing on the response of mesopelagic fish across the CalCOFI time series. While mesopelagic fish abundance was positively correlated with midwater oxygen concentration for much of the CalCOFI record, this relationship appears to be breaking down in the twenty-first century as more hypoxia-tolerant warm-water affinity mesopelagic fishes such as Panama Lightfish and Mexican Lampfish move into the region and increase in abundance, despite declining oxygen levels (Koslow et al., 2018). It is important to keep in mind that the ranges of most species extend beyond the CalCOFI grid, and therefore species abundance trends within the core CalCOFI grid do not necessarily equate to trends in overall population size (Weber and McClatchie, 2012).
The concept that environment ∼ abundance trends based on correlative data over the past 7 decades may not hold under climate change was also evident in 2018. Northern Anchovy have historically been categorized as a species that does well during relatively cold conditions while Pacific Sardine have been thought to thrive under warm conditions (Chavez et al., 2003). Biomass of adult and larval Northern Anchovy, however, approached record highs throughout the CCE from 2017 to 2018 (Thompson et al., 2018). These spawning adults had to have been born and successfully recruited during the warmest sustained waters on record between 2014 and 2016 (Jacox et al., 2018), thus challenging the notion that Northern Anchovy thrive under cold conditions. By contrast, Pacific Sardine remained at low abundances over the past decade even though ocean conditions superficially supported resurgence. These findings underscore the difficulty in predicting how species will respond to climate change and emphasize the need to understand the precise mechanisms affecting fisheries population dynamics (Checkley et al., 2017). Even with 7 decades of observations, the patterns observed provide correlations in oceanographic processes that support (but do not necessarily prove) mechanistic drivers, such as external climate forcing. For this reason the CCE LTER is built around the goal of demonstrating the mechanisms driving patterns observed in CalCOFI’s observations via experimental oceanography (Ohman and Hobbie, 2008).
In this study, we identify two additional areas where CalCOFI can better support stakeholder needs. The first is developing a more robust framework for OA monitoring within the CalCOFI Program, which aligns with state needs vocalized by the Ocean Protection Council. While many carbonate system measurements have been collected on CalCOFI cruises over the years, there have been no comprehensive efforts to integrate these datasets and couple them with the biological samples. However, these samples can provide a rich baseline for studying OA trends which are predicted to manifest rapidly in the CCS (Gruber et al., 2012; Hauri et al., 2013). Knowledge of baseline carbonate system conditions may also be important in informing the development of offshore shellfish aquaculture in the region and considering future OA vulnerability for this industry. Therefore, supporting continuous OA monitoring along CalCOFI lines should be a high priority.
Lastly, one new area which CalCOFI can contribute to through the NOAA CalCOFI Genomic Project is in monitoring changes in the microbial community. There is a concern that marine infectious diseases will increase under climate change (Burge et al., 2014). Monitoring pathogen abundances and understanding conditions that give rise to outbreaks can help manage this vulnerability. HABs may also increase in frequency and severity under climate change (Wells et al., 2015) with economic implications for the fisheries, aquaculture, and coastal sectors. Since novel high-throughput sequencing approaches can provide a detailed analysis of the composition as well as activity (i.e., gene expression) of the microbial community, these novel methodologies could help inform these emerging climate change adaptation issues. Additionally, these data may be useful for environmental consulting companies that monitor sewage and powerplant outfalls, by providing a regional baseline for their samples. Systematically incorporating this sampling into the CalCOFI cruises would further the ecosystem perspective gained from the CalCOFI Program.
Conclusion
Frusher et al. (2014) outlined four preconditioning factors that are necessary for developing an effective climate adaptation process for fisheries management. These include: (1) early observations of rapid ocean change, coinciding with (2) observations of biological changes that provide focus for action, (3) within a region that has a strong history of marine focus and management, and (4) the presence of well-developed networks involving multiple marine resource users. Based on these, the US West Coast is well positioned to be able to respond to climate change effectively with an adaptive management framework for fisheries, aquaculture, and marine ecosystem use. The CalCOFI Program contributes in an essential way to all four of these factors, by collecting paired oceanographic and biological data on the marine ecosystem, fostering the long record and history of fisheries oceanography and studies on the effects of climate variability on marine resources for the region, and the presence of many partnerships (other scientific surveys, academic contributions, governmental scientists, and NGOs). For CalCOFI information to be most useful, managers need a fuller understanding of the linkages between biological and oceanographic changes in managed species and the whole ecosystem.
The time-series length as well as the spatial scale of CalCOFI sampling has shown that, overall, trends for warming, acidification, and deoxygenation appear to be more pronounced inshore than offshore, which suggests that coastal and nearshore ecosystems may be more vulnerable to rapid climate change. Thus, climate change effects may be felt more rapidly within state waters than federal waters, and nearshore marine protected areas may also experience more rapid change than offshore areas. While the CalCOFI record provides many examples of how marine communities in the SCCE respond to climate forcing, Koslow et al. (2018) caution that the impacts of secular climate change are unlikely to manifest as simply an extension of the warm phase of the ENSO or PDO cycles, and therefore past trends may not always be reliable guides for future ecosystem responses, which emphasizes the need for continued monitoring.
Monitoring programs will be essential to track the progression of anthropogenic climate change and understand associated ecosystem impacts. We suggest that existing oceanographic monitoring programs conduct an internal review to assess how the data collected from these programs can better contribute to stakeholder needs related to climate change adaptation. For countries working on developing new oceanographic monitoring programs to address climate issues, the following elements of CalCOFI have contributed in a valuable way to understanding the effects of climate change on the marine ecosystem: sampling inshore to offshore has revealed that nearshore trends are more pronounced, sampling below the thermocline in the upper 500 m of the water column has shown different manifestations of climate forcing, the collection of paired biological and hydrographic data allows for analysis of trends between environmental change and ecological responses, the positioning of the CalCOFI grid in a biogeographic boundary zone means that ecological communities are more responsive to climate change, and sampling across multiple trophic levels allows for an understanding of ecosystem functioning and food web impacts of climate change. The biological sampling strategy of CalCOFI is powerful in that early life history stages of many species are captured, allowing for a comparison of community trends through time for both fished and unfished species. However, the methodology also provides challenges in inferring adult habitat distributions, adult fitness, and recruitment success, which require complementary additional surveys to address.
Given the wealth of research and data along the US West Coast, this region is well primed to develop and test innovative strategies for climate change adaptation for marine ecosystem management and the CalCOFI Program is a key part of this process.
Data Availability Statement
The datasets analyzed for this study can be found in the CalCOFI Database for hydrographic data (http://new.data.calcofi.org) and the ERDDAP database for ichthyoplankton data (https://oceanview.pfeg.noaa.gov/erddap/search/index.html?page=1&itemsPerPage=1000&searchFor=CalCOFI).
Author Contributions
NG and BS conceptualized the manuscript. NG performed the analysis and wrote the manuscript. ED contributed to the climate projection analysis. All authors contributed to the manuscript revision, and read and approved the submitted version.
Funding
Funding for this study was provided by a NOAA QUEST grant to BS and NG and an NSF OCE1600283 grant supported ED.
Conflict of Interest
The authors declare that the research was conducted in the absence of any commercial or financial relationships that could be construed as a potential conflict of interest.
Acknowledgments
We acknowledge the CESM Large Ensemble Community Project and supercomputing resources provided by NSF/CISL/Yellowstone. We also acknowledge Wiley Wolfe for providing information on carbonate chemistry measurements. We thank Debbie Aseltine-Neilson, Noelle Bowlin, Amy Hays, Ralf Goericke, Todd Martz, Theresa Talley, Andrew Dickson, and Francisco Chavez for providing helpful information. We also thank Peter Kuriyama, an anonymous NOAA internal reviewer, and the two reviewers for providing feedback on the manuscript. We also acknowledge and thank many scientists, technicians, and volunteers who have contributed to collecting the CalCOFI dataset over the last 70 years.
Footnotes
- ^ https://new.data.calcofi.org
- ^ https://upwell.pfeg.noaa.gov/erddap
- ^ https://oceaninformatics.ucsd.edu/zoodb
References
Alin, S. R., Feely, R. A., Dickson, A. G., Hernandez-Ayon, J. M., Juranek, L. W., Ohman, M. D., et al. (2012). Robust empirical relationships for estimating the carbonate system in the southern California Current System and application to CalCOFI hydrographic cruise data (2005-2011). J. Geophys. Res. 117:C05033.
Barange, M., Bahri, T., Beveridge, M. C. M., Cochrane, K. L., Funge-Smith, S., and Poulain, F. (2018). “Impacts of climate change on fisheries and aquaculture: synthesis of current knowledge, adaptation and mitigation options,” in Paper Presented at the FAO Fisheries and Aquaculture Technical Paper No. 627, Rome.
Baumgartner, T., Durazo, R., Lavaniegos, B., Gaxiola, G., Gómez, J., and García, J. (2008). Ten years of change from IMECOCAL observations in the southern region of the California current ecosystem. GLOBEC Int. Newslett. 14, 43–54.
Bednarsek, N., Feely, R. A., Reum, J. C. P., Peterson, B., Menkel, J., Alin, S. R., et al. (2014). Limacina helicina shell dissolution as an indicator of declining habitat suitability owing to ocean acidification in the California current ecosystem. Proc. R. Soc. B 281:20140123. doi: 10.1098/rspb.2014.0123
Bograd, S. J., Buil, M. P., Lorenzo, E. D., Castro, C. G., Schroeder, I. D., Goericke, R., et al. (2015). Changes in source waters to the southern California bight. Deep Sea Res II 112, 42–52. doi: 10.1002/etc.2006
Bograd, S. J., Castro, C. G., Di Lorenzo, E., Palacios, D. M., Bailey, H., Gilly, W., et al. (2008). Oxygen declines and the shoaling of the hypoxic boundary in the California current. Geophys. Res. Lett. 35:L12607.
Bond, N., Overland, J., Spillane, M., and Stabeno, P. (2003). Recent shifts in the state of the North Pacific. Geophys. Res. Lett. 30:2183.
Bonfils, C., and Santer, B. (2011). Investigating the possibility of a human component in various pacific decadal oscillation indices. Clim. Dyn. 37, 1457–1468. doi: 10.1007/s00382-010-0920-1
Booth, J. A. T., Woodson, C. B., Sutula, M., Micheli, F., Weisberg, S. B., Bograd, S. J., et al. (2014). Patterns and potential drivers of declining oxygen content along the southern California coast. Limnol. Oceanogr. 59, 1127–1138. doi: 10.4319/lo.2014.59.4.1127
Bopp, L., Resplandy, L., Orr, J. C., Doney, S. C., Dunne, J. P., Gehlen, M., et al. (2013). Multiple stressors of ocean ecosystems in the 21st century: projections with CMIP5 models. Biogeosciences 10, 6225–6245. doi: 10.5194/bg-10-6225-2013
Brady, R. X., Alexander, M. A., Lovenduski, N. S., and Rykaczewski, R. R. (2017). Emergent anthropogenic trends in California current upwelling. Geophys. Res. Lett. 44, 5044–5052. doi: 10.1002/2017gl072945
Breitburg, D., Levin, L. A., Oschlies, A., Grégoire, M., Chavez, F. P., Conley, D. J., et al. (2018). Declining oxygen in the global ocean and coastal waters. Science 359:eaam7240. doi: 10.1126/science.aam7240
Brinton, E., and Townsend, A. (2003). Decadal variability in abundances of the dominant euphausiid species in southern sectors of the California current. Deep Sea Res. II 50, 2449–2472. doi: 10.1016/s0967-0645(03)00126-7
Burge, C. A., Eakin, C. M., Friedman, C. S., Froelich, B., Hershberger, P. K., Hofmann, E. E., et al. (2014). Climate change influences on marine infectious diseases: implications for management and society. Annu. Rev. Mar. Sci. 6, 249–277. doi: 10.1146/annurev-marine-010213-135029
Busch, D. S., Griffis, R., Link, J., Abrams, K., Baker, J., Brainard, R. E., et al. (2016). Climate science strategy of the US national marine fisheries service. Mar. Pol. 74, 58–67. doi: 10.1016/j.marpol.2016.09.001
CDFW (2015). Review of selected California fisheries for 2014: coastal pelagic finfish, market squid, groundfish, pacific herring, dungeness crab, ocean salmon, true smelts, hagfish, and deep water ROV surveys of MPAs and surrounding nearshore habitat. Calif. Coop. Ocean Fish. Invest. Rep. 56, 1–30.
CDFW (2018). 2018 Master Plan for Fisheries: A Guide for Implementation of the Marine Life Management Act. Sacramento, CA: CDFW.
Chavez, F. P., Costello, C., Aseltine-Neilson, D., Doremus, H., Field, J. C., Gaines, S. D., et al. (2017). Reading California Fisheries for Climate Change. Oakland, CA: California Ocean Science Trust.
Chavez, F. P., Ryan, J., Lluch-Cota, S. E., and Niquen, C. M. (2003). From anchovies to sardines and back: multidecadal change in the Pacific Ocean. Science 299, 217–221. doi: 10.1126/science.1075880
Checkley, D. Jr., Dotson, R., and Griffith, D. (2000). Continuous underway sampling of eggs of Pacific sardine (Sardinops sagax) and northern anchovy (Engraulis mordax) in spring 1996 and 1997 off southern and central California. Deep Sea Res. 47, 1139–1155. doi: 10.1016/s0967-0645(99)00139-3
Checkley, D. Jr., Ortner, P., Settle, L., and Cummings, S. (1997). A continuous underway fish egg sampler. Fisher. Oceanogr. 6, 58–73. doi: 10.1046/j.1365-2419.1997.00030.x
Checkley, D. M. Jr., Asch, R. G., and Rykaczewski, R. R. (2017). Climate, anchovy, and sardine. Annu. Rev. Mar. Sci. 9, 469–493. doi: 10.1146/annurev-marine-122414-033819
Cheung, W. W. L. (2018). The future of fishes and fisheries in the changing oceans. J. Fish. Biol. 92, 790–803. doi: 10.1111/jfb.13558
Cheung, W. W. L., Lam, V. W. Y., Sarmiento, J. L., and Kearney, K. (2010). Large-scale redistribution of maximum fisheries catch potential in the ocean under climate change. Glob. Change Biol. 16, 24–35. doi: 10.1111/j.1365-2486.2009.01995.x
Cury, P., Bakun, A., Crawford, R. J. M., Jarre, A., Quiñones, R. A., Shannon, L. J., et al. (2000). Small pelagics in upwelling systems: patterns of interaction and structural changes in “wasp-waist” ecosystems. ICES J. Mar. Sci. 57, 603–618. doi: 10.1006/jmsc.2000.0712
Davidson, F. J., Chassignet, E., Vinayachandran, P. N., Lu, Y., Smith, G. C., Zhu, X., et al. (2019). Synergies in operational oceanography: the intrinsic need for sustained ocean observations. Front. Mar. Sci. 6:450. doi: 10.3389/fmars.2019.00450
Davis, R. E., Ohman, M. D., Rudnick, D. L., Sherman, J. T., and Hodges, B. (2008). Glider surveillance of physics and biology in the southern California current system. Limnol. Oceanogr. 53, 2151–2168. doi: 10.4319/lo.2008.53.5_part_2.2151
Deutsch, C., Emerson, S., and Thompson, L. (2005). Fingerprints of climate change in North pacific oxygen. Geophys. Res. Lett. 32:L16604.
Di Lorenzo, E., Miller, A., Schneider, N., and McWilliams, J. (2005). The warming of the California Current system: dynamics and ecosystem implications. J. Phys. Oceanogr. 35, 336–362. doi: 10.1175/jpo-2690.1
Di Lorenzo, E., Schneider, N., Cobb, K., Franks, P., Chhak, K., Miller, A., et al. (2008). North Pacific Gyre Oscillation links ocean climate and ecosystem change. Geophys. Res. Lett. 35, L08607. doi: 10.1111/gcb.13171
Dick, E. J., Bizzarro, J., Bosley, K., Cope, J., Field, J., Gilbert-Horvath, L., et al. (2017). The Combined Status of Blue and Deacon Rockfishes in U.S. Waters off California and Oregon in 2017. Portland, OR: Pacific Fishery Management Council.
Dick, E. J., and MacCall, A. D. (2014). Status and Productivity of cowcod, Sebastes Levis, in the Southern California Bight. Portland, OR: Pacific Fishery Management Council.
Dorval, E., Macewicz, B. J., Griffith, D. A., and Gu, Y. (2018). Spawning Biomass of the Central Stock of Northern Anchovy (Engraulis mordax) Estimated From the Daily Egg Production Method Off California in 2017. Silver Spring, MA: NOAA.
Field, J. C., and Francis, R. C. (2006). Considering ecosystem-based fisheries management in the California Current. Mar. Pol. 30, 552–569. doi: 10.1016/j.marpol.2005.07.004
Fissel, B. E., Lo, N. C. H., and Herrick, S. F. Jr. (2011). Daily egg production, spawning biomass and recruitment for the central subpopulation of northern anchovy 1981–2009. Calif. Coop. Ocean. Fish. Invest. Rep. 52, 116–129.
Frusher, S. D., Hobday, A. J., Jennings, S. M., Creighton, C., D’Silva, D., Haward, M., et al. (2014). The short history of research in a marine climate change hot-spot: from anecdote to adaptation in south-east Australia. Rev. Fish Biol. Fisher. 24, 593–611.
Fuller, E. C. (2018). “Food webs with humans,” in Name only? In: Effective Conservation Science: Data not Dogma, eds P. Kareiva, M. Marvier, and B. Silliman, (Oxford: Oxford University Press).
Garcia-Reyes, M., Sydeman, W. J., Schoeman, D. S., Rykaczewski, R. R., Black, B. A., Smit, A. J., et al. (2015). Under pressure: climate change, upwelling, and Eastern boundary upwelling systems. Front. Mar. Sci. 2:109. doi: 10.3389/fmars.2015.00109
Gilly, W. F., Beman, J. M., Litvin, S. Y., and Robison, B. H. (2013). Oceanographic and biological effects of shoaling of the oxygen minimum zone. Annu. Rev. Mar. Sci. 5, 393–420. doi: 10.1146/annurev-marine-120710-100849
Griffiths, J. R., Kadin, M., Nascimento, F. J. A., Tamelander, T., Törnroos, A., Bonaglia, S., et al. (2017). The importance of bentho-pelagic coupling for marine ecosystem functioning in a changing world. Glob. Change Biol. 23, 2179–2196. doi: 10.1111/gcb.13642
Gruber, N., Hauri, C., Lachkar, Z., Loher, D., Frölicher, T. L., and Plattner, G.-K. (2012). Rapid progression of ocean acidification in the California current system. Science 337, 220–223. doi: 10.1126/science.1216773
Harvey, C., Garfield, N., Williams, G., Tolimieri, N., Schroeder, I., Hazen, E., et al. (2018). Ecosystem Status Report of the California Current for 2018: A Summary of Ecosystem Indicators Compiled by the California Current Integrated Ecosystem Assessment Team (CCEIA). Silver Spring, MA: NOAA.
Hauri, C., Gruber, N., Vogt, M., Doney, S. C., Feely, R. A., Lachkar, Z., et al. (2013). Spatiotemporal variability and long-term trends of ocean acidification in the California current system. Biogeosciences 10, 193–216. doi: 10.5194/bg-10-193-2013
He, X., and Field, J. C. (2017). Stock Assessment Update: Status of Bocaccio, Sebastes Paucispinis, in the Conception, Monterey and Eureka INPFC Areas for 2017. Portland, OR: Pacific Fisheries Management Council.
Henson, S. A., Beaulieu, C., Ilyina, T., John, J. G., Long, M., Séférian, R., et al. (2017). Rapid emergence of climate change in environmental drivers of marine ecosystems. Nat. Commun. 8, 14682. doi: 10.1038/ncomms14682
Hewitt, R. (1988). Historical review of the oceanographic approach to fishery research. Calif. Coop. Ocean. Fish. Invest. Rep. 29, 27–41.
Hill, K. T., Crone, P. R., and Zwolinski, J. (2017). Assessment of the Pacific sardine Resource in 2017 for U.S. Management in 2017-18 (Technical Memo No. NOAA-TM-NMFS-SWFSC-576). Silver Spring, MA: NOAA.
Hobday, A. J., and Cvitanovic, C. (2017). Preparing Australian fisheries for the critical decade: insights from the past 25 years. Mar. Freshwater Res. 68, 1779–1787.
Holt, J., Harle, J., Proctor, R., Michel, S., Ashworth, M., Batstone, C., et al. (2009). Modeling the global coastal ocean. Philos. Trans. R. Soc. A Math. Phys. Eng. Sci. 367, 939–951.
Holt, L., Allen, J. I., Anderson, T. R., Brewin, R., Butenschön, M., Harle, J., et al. (2014). Challenges in integrative approaches to modelling the marine ecosystems of the north atlantic: physics to fish and coasts to ocean. Prog. Oceanogr. 129, 285–313. doi: 10.1016/j.pocean.2014.04.024
Hsieh, C., Reiss, C., Hewitt, R., and Sugihara, G. (2008). Spatial analysis shows fishing enhances the climatic sensitivity of marine fishes. Can. J. Fish. Aquat. Sci. 65, 947–961. doi: 10.1139/f08-017
Hsieh, C., Reiss, C., Watson, W., Allen, M., Hunter, J., Lea, R., et al. (2005). A comparison of long-term trends and variability in populations of larvae of exploited and unexploited fishes in the southern California region: a community approach. Prog. Oceanogr. 67, 160–185. doi: 10.1016/j.pocean.2005.05.002
Hsieh, S., Kim, H., Watson, W., Di Lorenzo, E., and Sugihara, G. (2009). Climate-driven changes in abundance and distribution of larvae of oceanic fishes in the southern California region. Glob. Change Biol. 15, 2137–2152. doi: 10.1111/j.1365-2486.2009.01875.x
Jacobsen, L. D., and McClatchie, S. (2013). Comment on temperature-dependent stock-recruit modeling for Pacific sardine (Sardinops sagax) in Jacobsen and MacCall (1995), McClatchie et al. (2010), and lindegren and checkley (2013). Can. J. Fish. Aquat. Sci. 70, 1566–1569. doi: 10.1139/cjfas-2013-0128
Jacox, M. G., Alexander, M. A., Mantua, N. J., Scott, J. D., Hervieux, G., Webb, R. S., et al. (2018). Forcing of multiyear extreme ocean temperatures that impact California current living marine resources in 2016. Bull. Am. Meteorol. Soc. 99, S27–S33.
Jarvis, E. T., Loke-Smith, K. A., Evans, K., Kloppe, R. E., Young, K. A., and Valle, C. F. (2014). Reproductive potential and spawning periodicity in barred sand bass (Paralabrax nebulifer) from the San Pedro Shelf, southern California. CA Fish Game 100, 289–309.
Karp, M. A., Peterson, J., Lynch, P. D., and Griffis, R. (2018). Accounting for Shifting Distributions, and Changing Productivity in the Fishery Management. (process): From Detection to Management Action. Silver Spring, MA: NOAA.
Kay, J. E., Deser, C., Phillips, A., Mai, A., Hannay, C., Strand, G., et al. (2015). The community earth system model (CESM) large ensemble project: a community resource for studying climate change in the presence of internal climate variability. Bull. Am. Meteorol. Soc. 96, 1333–1349. doi: 10.1175/BAMS-D-13-00255.1
Keeling, R. F., and Keeling, C. D. (2017). Atmospheric Monthly In Situ CO2 Data - Mauna Loa Observatory, Hawaii. In Scripps CO2 Program Data. Oakland, CA: University of California.
Koslow, A., Goericke, R., and Watson, W. (2013). Fish assemblages in the southern California current: relationships with climate, 1951–2008. Fish. Oceanogr. 22, 207–219. doi: 10.1111/fog.12018
Koslow, J., Miller, E., and McGowan, J. (2015). Dramatic declines in coastal and oceanic fish communities off California. Mar. Ecol. Prog. Ser. 538, 221–227. doi: 10.3354/meps11444
Koslow, J. A., and Allen, C. (2011). The influence of the ocean environment on the abundance of market squid Doryteuthis (Loligo) opalescens, paralarvae in the southern California bight.”. CalCOFI Rep. 52, 205–213.
Koslow, J. A., Davison, P., Ferrer, E., Jimenez Rosenberg, S. P. A., Aceves-Medina, G., and Watson, W. (2018). The evolving response of mesopelagic fishes to declining midwater oxygen concentrations in the southern and central California current. ICES J. Mar. Sci. 76, 626–638. doi: 10.1093/icesjms/fsy154
Koslow, J. A., Goericke, R., Lara-Lopez, A., and Watson, W. (2011). Impact of declining intermediate-water oxygen on deepwater fishes in the California current. Mar. Ecol. Prog. Ser. 436, 207–218. doi: 10.3354/meps09270
Koslow, J. A., McMonagle, H., and Watson, W. (2017). Influence of climate on the biodiversity and community structure of fishes in the southern California current. Mar. Ecol. Prog. Ser. 571, 193–206. doi: 10.3354/meps12095
Koslow, J. A., Rogers-Bennett, L., and Neilsen, D. J. (2012). A time series of California spiny lobster (Panulirus interruptus) phyllosoma from 1951 to 2008 links abundance to warm oceanographic conditions in southern California.”. CalCOFI Rep. 53, 132–139.
Kramer, D., Kalin, M., Stevens, E., Thrailkill, J., and Zweifel, J. (1972). Collecting and Processing Data on Fish Eggs and Larvae in the California Current Region. Silver Spring, MA: NOAA.
R. Lasker, (ed.). (1985). An Egg Production Method for Estimating Spawning Biomass of Pelagic Fish. Application to the Northern Anchovy Engraulis Mordax. La Jolla, CA: NOAA.
Lavaniegos, B., and Ohman, M. (2007). Coherence of long-term variations of zooplankton in two sectors of the California current. Prog. Oceanogr. 75, 42–69. doi: 10.1016/j.pocean.2007.07.002
Levin, L. A. (2018). Manifestations, drivers, and emergence of open ocean deoxygenation. Ann. Rev. Mar. Sci. 10, 229–260. doi: 10.1146/annurev-marine-121916-063359
Levin, P. S., Fogarty, M. J., Matlock, G. C., and Ernst, M. (2008). Integrated Ecosystem Assessments.in N. T. M. N.-N.-. U.S. Department of Commerce, NOAA Technical Memorandum NMFS-NWFSC-92. Silver Spring, MA: NOAA.
Levin, P. S., Fogarty, M. J., Murawski, S. A., and Fluharty, D. (2009). Integrated ecosystem assessments: developing the scientific basis for ecosystem-based management of the ocean. PLoS Biol. 7:e14. doi: 10.1371/journal.pbio.1000014
Lindegren, M., and Brander, K. (2018). Adapting fisheries and their management to climate change: a review of concepts, tools, frameworks, and current progress towards implementation. Rev. Fisher. Sci. Aquac. 26, 400–415. doi: 10.1080/23308249.2018.1445980
Lindegren, M., Checkley, D. M. Jr., Koslow, J. A., Goericke, R., and Ohman, M. D. (2017). Climate-mediated changes in marine ecosystem regulation during El Niño. Glob. Change Biol. 2017, 1–14. doi: 10.1111/gcb.13993
Lindegren, M., Checkley, D. M. Jr., Ohman, M. D., Koslow, J. A., and Goericke, R. (2016). Resilience and stability of a pelagic marine ecosystem. Proc. R. Soc. B 283:20151931. doi: 10.1098/rspb.2015.1931
Lindegren, M., Checkley, D. M. Jr., Rouyer, T., MacCall, A. D., and Stenseth, N. C. (2013). Climate, fishing, and fluctuations of sardine and anchovy in the California current. Proc. Natl. Acad. Sci. U.S.A. 110, 13672–13677. doi: 10.1073/pnas.1305733110
Link, J. S. (2016). NOAA Fisheries Ecosystem-Based Fisheries Management Road Map. Washington, DC: NOAA.
Long, M. C., Deutsch, C., and Ito, T. (2016). Finding forced trends in oceanic oxygen. Glob. Biogeochem. Cycles 30, 381–397. doi: 10.1002/2015gb005310
Lynch, P. D., Methot, R. D., and Link, J. S. (eds) (2018). Implementing a Next Generation Stock Assessment Enterprise. An Update to the NOAA Fisheries Stock Assessment Improvement Plan. Silver Spring, MA: NOAA.
Mantua, N., Hare, S., Zhang, Y., Wallace, J., and Francis, R. (1997). A Pacific interdecadal climate oscillation with impacts on salmon production. Bull. Am. Meteorol. Soc. 78, 1069–1079. doi: 10.1175/1520-0477(1997)078<1069:apicow>2.0.co;2
Marshall, K. N., Levin, P. S., Essington, T. E., Koehn, L. E., Anderson, L. G., Bundy, A., et al. (2018). Ecosystem-based fisheries management for social-ecological systems: renewing the focus in the United States with next generation fishery ecosystem plans. Conserv. Lett. 11:e12367. doi: 10.1111/conl.12367
McClatchie, S. (2014). Regional Fisheries Oceanography of the California Current System. The CalCOFI Program. New York, NY: Springer.
McClatchie, S., Gao, J., Drenkard, E. J., Thompson, A. R., Watson, W., Ciannelli, L., et al. (2018). Interannual and secular variability of larvae of mesopelagic and forage fishes in the Southern California current system. J. Geophys. Res. 123, 6277–6295. doi: 10.1029/2018JC014011
McClatchie, S., Goericke, R., Cosgrove, R., Auad, G., and Vetter, R. (2010). Oxygen in the Southern California bight: multidecadal trends and implications for demersal fisheries. Geophys. Res. Lett. 37:L19602.
McClatchie, S., Thompson, A., Alin, S., Siedlecki, S., Watson, W., and Bograd, S. (2016). The influence of pacific equatorial water on fish diversity in the southern california current system. J. Geophys. Res. 121, 6121–6136. doi: 10.1002/2016jc011672
Meinvielle, M., and Johnson, G. C. (2013). Decadal water-property trends in the California undercurrent with implications for ocean acidification. J. Geophys. Res. Oceans 118, 6687–6703. doi: 10.1002/2013jc009299
Miller, E. F., and McGowan, J. A. (2013). Faunal shift in southern California’s coastal fishes: a new assemblage and trophic structure takes hold. Estuarine Coastal Shelf Sci. 127, 29–36. doi: 10.1016/j.ecss.2013.04.014
Mollmann, C., Folke, C., Edwards, M., and Conversi, A. (2015). Marine regime shifts around the globe: theory, drivers and impacts. Philos. Trans. R. Soc. B. 370:20130260. doi: 10.1098/rstb.2013.0260
Moser, H., Charter, R., Watson, W., Ambrose, D., Butler, J., Charter, S., et al. (2000). Abundance and distribution of rockfish (Sebastes) larvae in the Southern California bight in relation to environmental conditions and fishery exploitation. Calif. Coop. Ocean. Fish. Invest. Rep. 41, 132–147.
Moser, H., and Watson, W. (1990). Distribution and abundance of early life history stages of the California halibut, paralichthys californicus, and comparison with the fantail sole, Xystreurys liolepis. Calif. Dep. Fish Game Fish Bull. 174, 31–84.
H. G. Moser, (ed.) (1996). The early stages of fishes in the California current region. calif coop. oceanic fish. Invest. Atlas 33:1505.
Moser, H. G., and Watson, W. (2006). “Ichthyoplankton,” in The Ecology of Marine Fishes: California and Adjacent Waters, eds L. G. Allen, and M. Horn, (Los Angeles, CA: University of California Press), 269–319.
Myers, R. (1998). When do environment-recruitment correlations work? Rev. Fish Biol. Fish. 8, 285–305.
Nam, S., Kim, H. J., and Send, U. (2011). Amplification of hypoxic and acidic events by La Niña conditions on the continental shelf off California. Geophys. Res. Lett. 38:L22602.
Noaa Nw/Sw Fisheries Science Centers (2016). Western Regional Action Plan (WRAP), NOAA Fisheries Climate Science Strategy. Silver Spring, MA: NOAA.
Ohman, M., and Lavaniegos, B. (2002). Comparative zooplankton sampling efficiency of a ring net and bongo net with comments on pooling subsamples. Calif. Coop. Ocean. Fish. Invest. Rep. 43, 162–173.
Ohman, M., and Venrick, E. (2003). CalCOFI in a changing ocean. Oceanography 16, 76–85. doi: 10.5670/oceanog.2003.34
Ohman, M. D., and Hobbie, J. E. (2008). Aquatic research in the U.S. LTER network. Limnol. Oceanogr. Bull. 17, 74–79. doi: 10.1002/lob.200817373
Oschlies, A., Brandt, P., Stramma, L., and Schmidtko, S. (2018). Drivers and mechanisms of ocean deoxygenation. Nat. Geosci. 11, 476–473. doi: 10.1098/rsta.2016.0325
Pacific Fishery Management Council [PFMC] (2013). Pacific Coast Fishery Ecosystem Plan for the U.S. Portion of the California Current Large Marine Ecosystem. Pacific Fishery Management Council, 7700 NE Ambassador Place, Suite 101. Portland, OR: Pacific Fishery Management Council.
Palacios, D., Bograd, S., Mendelssohn, R., and Schwing, F. (2004). Long-term and seasonal trends in stratification in the California current, 1950–1993. J. Geophys. Res. 109:C100116.
Peabody, C. E., Thompson, A. R., Sax, D. F., Morse, R. E., and Perretti, C. T. (2018). Decadal regime shifts in southern California’s ichthyoplankton assemblage. Mar. Ecol. Prog. Ser. 607, 71–83. doi: 10.3354/meps12787
Perry, R. I., Cury, P., Brander, K., Jennings, S., Mollmann, C., and Planque, B. (2010). Sensitivity of marine systems to climate and fishing: concepts, issues and management responses. J. Mar. Syst. 79, 427–435. doi: 10.1016/j.jmarsys.2008.12.017
Pinsky, M. L., and Mantua, N. J. (2014). Emerging adaptation approaches for climate-ready fisheries management. Oceanography 27, 146–159. doi: 10.5670/oceanog.2014.93
Pitcher, T. J., Kalikoski, D., Short, K., Varkey, D., and Pramod, G. (2009). An evaluation of progress in implementing ecosystem-based management of fisheries in 33 countries. Mar. Pol. 33, 223–232. doi: 10.1016/j.marpol.2008.06.002
Plaganyi, E. E., Skewes, T. D., Dowling, N. A., and Haddon, M. (2013). Risk management tools for sustainable fisheries management under changing climate: a sea cucumber example. Clim. Change 119, 181–197. doi: 10.1007/s10584-012-0596-0
Poloczanska, E. S., Burrows, M. T., Brown, C. J., Molinos, J. G., Halpern, B. S., Hoegh-Guldberg, O., et al. (2016). Responses of marine organisms to climate change across oceans. Front. Mar. Sci. 6:62. doi: 10.3389/fmars.2016.00062
Pörtner, H. O., Karl, D., Boyd, P. W., Cheung, W., Lluch-Cota, S. E., Nojiri, Y., et al. (2014). “Ocean systems,” in Climate Change 2014: Impacts, Adaptation, and Vulnerability. Part A: Global and Sectoral Aspects. Contribution of Working Group II to the Fifth Assessment Report of the Intergovernmental Panel of Climate Change, eds C. B. Field, V. R. Barros, D. J. Dokken, K. J. Mach, M. D. Mastrandrea, and T. E. Bilir, (New York, NY: Cambridge University Press), 411–484.
Pozo Buil, M., and Di Lorenzo, E. (2017). Decadal dynamics and predictability of oxygen and subsurface tracers in the California current system. Geophys. Res. Lett. 44, 4204–4213. doi: 10.1002/2017gl072931
Punt, A. E., Butterworth, D. S., de Moor, C. L., De Oliveira, J. A., and Haddon, M. (2016). Management strategy evaluation: best practices. Fish Fisher. 17, 303–334.
Rayner, R., Jolly, C., and Gouldman, C. (2019). Ocean observing and the blue economy. Front. Mar. Sci. 6:330. doi: 10.3389/fmars.2019.00330
Ren, A. S., Chai, F., Xue, H., Anderson, D. M., and Chavez, F. P. (2018). A sixteen-year decline in dissolved oxygen in the central California current. Sci. Rep. 8:7290. doi: 10.1038/s41598-018-25341-8
Roemmich, D. (1992). Ocean warming and sea level rise along the southwest U.S. coast. Science 257, 373–375. doi: 10.1126/science.257.5068.373
Roemmich, D., and McGowan, J. (1995). Climatic warming and the decline of zooplankton in the California current. Science 267, 1324–1326. doi: 10.1126/science.267.5202.1324
Rykaczewski, R. R., and Dunne, J. P. (2010). Enhanced nutrient supply to the California current ecosystem with global warming and increased stratification in an earth system model. Geophys. Res. Lett. 37:L21606. doi: 10.1038/s41598-018-21247-7
Rykaczewski, R. R., Dunne, J. P., Sydeman, W. J., García-Reyes, M., Black, B. A., and Bograd, S. J. (2015). Poleward intensification of coastal upwelling in response to global warming. Geophys. Res. Lett. 42, 6424–6431.
Samhouri, J. F., Haupt, A. J., Levin, P. S., Link, J. S., and Shuford, R. (2013). Lessons learned from developing integrated ecosystem assessments to inform marine ecosystem-based management in the USA. ICES J. Mar. Sci. 71, 1205–1215. doi: 10.1093/icesjms/fst141
Santora, J. A., Hazen, E. L., Schroeder, I. D., Bograd, S. J., Sakuma, K. M., and Field, J. C. (2017). Impacts of ocean climate variability on biodiversity of pelagic forage species in an upwelling ecosystem. Mar. Ecol. Prog. Ser. 580, 205–220. doi: 10.3354/meps12278
Scheiber, H. N. (1990). California marine research and the founding of modern fisheries oceanography: CalCOFI’s early years, 1947-1964. Calif. Coop. Ocean. Fish. Invest. Rep. 31, 63–83.
Scheiber, H. N. (1997). From science to law to politics: an historical view of the ecosystem idea and its effect on resource management. Ecol. Law Q. 24, 631–652.
Schmidtko, S., Stramma, L., and Visbeck, M. (2017). Decline in global oceanic oxygen content during the past five decades. Nature 542, 335–339. doi: 10.1038/nature21399
Sette, O. E., and Isaacs, J. D. (eds) (1960). Symposium on “the changing pacific ocean in 1957 and 1958”. CalCOFI Rep. 7, 13–217.
Siegelman-Charbit, L., Koslow, J. A., Jacox, M. G., Hazen, E. L., Bograd, S. J., and Miller, E. F. (2018). Physical forcing on fish abundance in the southern California current system. Fisher. Oceanogr. 27, 475–488. doi: 10.1111/fog.12267
Skern-Mauritzen, M., Ottersen, G., Handegard, N. O., Huse, G., Dingsor, G. E., Stenseth, N. C., et al. (2016). Ecosystem processes are rarely included in tactical fisheries management. Fish Fisher. 17, 165–175. doi: 10.1111/faf.12111
Smith, A. D. M., Fulton, E. J., Hobday, A. J., Smith, D. C., and Shoulder, P. (2007). Scientific tools to support the practical implementation of ecosystem-based fisheries management. ICES J. Mar. Sci. 64, 633–639. doi: 10.1093/icesjms/fsm041
Smith, P., and Richardson, S. (1977). “Standard techniques for pelagic fish egg and larva surveys,” in Paper Presented at the FAO Fisheries Technical Paper 175, Rome.
Steinacher, M., Joos, F., Frölicher, T. L., Bopp, L., Cadule, P., Cocco, V., et al. (2010). Projected 21st century decrease in marine productivity: a multi-model analysis. Biogeosciences 7, 979–1005. doi: 10.5194/bg-7-979-2010
Stock, C. A., Alexander, M. A., Bond, N. A., Brander, K., Cheung, W. W. L., Curchitser, E. N., et al. (2011). On the use of IPCC-class models to assess the impact of climate on living marine resources. Prog. Oceanogr. 88, 1–27. doi: 10.1016/j.pocean.2010.09.001
Sydeman, W. J., Thompson, S. A., Garcia-Reyes, M., Kahru, M., Peterson, W. T., and Largier, J. L. (2014). Multivariate ocean-climate indicators (MOCI) for the central California current: environmental change, 1990-2010. Prog. Oceanogr. 120, 352–369. doi: 10.1016/j.pocean.2013.10.017
Thompson, A. R., Hyde, J. R., Watson, W., Chen, D. C., and Guo, L. W. (2016). Rockfish assemblage structure and spawning locations in southern California identified through larval sampling. Mar. Ecol. Prog. Ser. 547, 177–192. doi: 10.3354/meps11633
Thompson, A. R., McClatchie, S., Weber, E. D., Watson, W., and Lennert-Cody, C. E. (2017b). Correcting for bias in CalCOFI ichthyoplankton abundance estimates associated with the 1977 transition from ring to bongo net sampling. CalCOFI Rep. 58, 1–11.
Thompson, A. R., Chen, D. C., Guo, L., Hyde, J. R., and Watson, W. (2017a). Larval abundances of rockfishes that were historically targeted by fishing increased over 16 years in association with a large marine protected area. R. Soc. Open Sci. 4:170639. doi: 10.1098/rsos.170639
Thompson, A. R., Schroeder, I. D., Bograd, S., Hazen, E. L., Jacox, M., Leising, A. W., et al. (2018). State of the California current 2017-18: still not quite normal in the north and getting interesting in the south. CalCOFI Rep. 59, 1–66.
Tolimieri, N., Haltuch, M. A., Lee, Q., Jacox, M. G., and Bograd, S. J. (2018). Oceanographic drivers of sablefish recruitment in the California current. Fisher. Oceanogr. 27, 458–474. doi: 10.1111/fog.12266
Wang, D., Gouhier, T. C., Menge, B. A., and Ganguly, A. R. (2015). Intensification and spatial homogenization of coastal upwelling under climate change. Nature 518, 390–394. doi: 10.1038/nature14235
Weber, E. D., and McClatchie, S. (2012). Effect of environmental conditions on the distribution of Pacific mackerel (Scomber japonicus) larvae in the California current system. Fish Bull. 110, 85–97.
Wells, M. L., Trainer, V. L., Smayda, T. J., Karlson, B. S. O., Trick, C. G., Kudela, R. M., et al. (2015). Harmful algal blooms and climate change: learning from the past and present to forecast the future. Harmf. Algae 49, 68–93. doi: 10.1016/j.hal.2015.07.009
Williams, A. J. (2009). “CTD (Conductivity, temperature, depth) profiler,” in Encyclopedia of Ocean Sciences: Measurement Techniques, Sensors and Platforms, eds J. H. Steele, S. A. Thorpe, and K. K. Turekian, (Boston: Elsevier), 25–34.
Wilson, J. R., Lomonico, S., Bradley, D., Sievanen, L., Dempsey, T., Bell, M., et al. (2018). Adaptive comanagement to achieve climate-ready fisheries. Conserv. Lett. 11:e12452. doi: 10.1111/j.1523-1739.2009.01358.x
Zwolinski, J. P., and Demer, D. A. (2012). A cold oceanographic regime with high exploitation rates in the northeast pacific forecasts a collapse of the sardine stock. Proc. Natl. Acad. Sci. 109, 4175–4180. doi: 10.1073/pnas.1113806109
Keywords: climate change, CalCOFI, fisheries, ecosystem management, ocean observing, monitoring
Citation: Gallo ND, Drenkard E, Thompson AR, Weber ED, Wilson-Vandenberg D, McClatchie S, Koslow JA and Semmens BX (2019) Bridging From Monitoring to Solutions-Based Thinking: Lessons From CalCOFI for Understanding and Adapting to Marine Climate Change Impacts. Front. Mar. Sci. 6:695. doi: 10.3389/fmars.2019.00695
Received: 24 March 2019; Accepted: 29 October 2019;
Published: 14 November 2019.
Edited by:
Fiorenza Micheli, Stanford University, United StatesReviewed by:
Catarina Frazão Santos, University of Lisbon, PortugalEva Plaganyi, Commonwealth Scientific and Industrial Research Organisation (CSIRO), Australia
Copyright © 2019 Gallo, Drenkard, Thompson, Weber, Wilson-Vandenberg, McClatchie, Koslow and Semmens. This is an open-access article distributed under the terms of the Creative Commons Attribution License (CC BY). The use, distribution or reproduction in other forums is permitted, provided the original author(s) and the copyright owner(s) are credited and that the original publication in this journal is cited, in accordance with accepted academic practice. No use, distribution or reproduction is permitted which does not comply with these terms.
*Correspondence: Natalya D. Gallo, bmRnYWxsb0B1Y3NkLmVkdQ==