 Angel Amores
 Gabriel Jordà
 Sebastià Monserrat
- 1Mediterranean Institute for Advanced Studies (University of the Balearic Islands-Spanish National Research Council), Esporles, Spain
- 2Centre Oceanogràfic de Balears, Instituto Español de Oceanografía, Palma, Spain
- 3Departament de Física, Universitat de les Illes Balears, Palma, Spain
Mesoscale eddies are a key oceanic feature relevant to the transport of water properties and biological material. These structures, through their surface signature, have been characterized and widely investigated using sea level anomaly (SLA) maps retrieved from satellite altimetry observations. Gridded SLA fields are routinely computed combining SLA data along satellite tracks with an optimal interpolation algorithm using a selected set of parameters. These are crucial because they define and constrain the temporal and spatial scales of the structures resolved. Here, we investigate the impact of the choice of the interpolation parameters in global and in the Mediterranean SLA products. Our findings demonstrate that the number of eddies detected in SLA maps over the Mediterranean Sea regional products is significantly larger along the satellite tracks than between the tracks, irrespective of the number of satellites used to produce the gridded maps, of the time period considered and of the eddy size. We also show that this is not the case of the global SLA product. We attribute the anomalously high number of eddies detected along the tracks in the regional products to the correlation scales of the optimal interpolation algorithm, which are different from those in the global product due to a smaller Rossby radius of the Mediterranean structures. Among these, we find that the time correlation scale is more restrictive than the spatial one.
Keypoints
- Anomalous larger eddy number detected along Topex/Poseidon tracks in the Mediterranean SLA products.
- Result observed during 23 years of SLA maps for all eddy radius but not for the Global SLA products.
- The parameters used in the optimal interpolation algorithm have an important contribution to the observed result.
1. Introduction
Mesoscale eddies are found across all oceans (Chelton et al., 2011) and play an important role in several physical and biological processes through their ability to transport material inside their cores (Wunsch, 1999). The most common way to study them is analyzing the signal that most of eddies have in sea surface height. Automatic eddy detection and tracking algorithms are widely used to detect eddies in gridded satellite sea level anomaly (SLA) products (Nencioli et al., 2010; Chelton et al., 2011; Halo et al., 2014; Mason et al., 2014; Mkhinini et al., 2014; Faghmous et al., 2015; Conti et al., 2016; Le et al., 2018). However, a recent study has shown that the characteristics of the satellite measuring process and the mapping procedure applied to compute the gridded maps distorts the features of the eddy field (Amores et al., 2018). The resulting field tends to aliase the unresolved scales into the larger ones overestimating the number of big eddies and strongly modifying the eddy amplitude. Moreover, the separation between the satellite tracks is often larger than the Rossby radius of deformation, which seriously compromise the ability of present day satellite observations to correctly represent the eddy field. In the present study, we further extend the results shown by Amores et al. (2018) by pointing out and explaining an anomalous result observed on the position of the eddies detected in the SLA AVISO/CMEMS products for the Mediterranean sea: the number of eddies along the Topex/Poseidon satellite tracks is abnormally much larger than in the gaps left between the tracks, a result that is not observed in the global SLA AVISO/CMEMS products.
The paper is organized as follows: the SLA data used and the eddy identification and tracking algorithm are detailed in section 2. In section 3, the spatial distribution and temporal evolution of the density of eddies for the Mediterranean and global SLA satellite products is closely checked. We also shed some light about how the parameters chosen for the optimal interpolation algorithm can explain the anomalous observed eddy density distribution. Finally, the main conclusions are included in section 4.
2. Data and Methods
2.1. Sea Level Anomaly Data
The satellite sea level anomaly (SLA) maps and their associated errors used in this study to compute the different eddy datasets correspond to DT-2014 product version [this product is not longer available and has been recently substituted by the DT-2018 version (Taburet et al., 2019)] provided by AVISO/Copernicus (http://marine.copernicus.eu/) for the time period from January 1st 1993 to December 31st 2015. For the global eddy dataset, SLA products cover the global ocean with a spatial and temporal resolution of 1/4 of a degree and 1 day, respectively. For the Mediterranean sea, the temporal resolution is also 1 day but the spatial resolution is decreased down to 1/8 of a degree. Also, although the mapping algorithm used to generate both products is very similar, the parameters of the algorithm (spatial and temporal correlation length scales) are different (AVISO, 2016; Pujol et al., 2016).
Two different SLA datasets were used for each one of the regions analyzed (global ocean and Mediterranean sea). The first one is the so called all satellite SLA product that it is computed with all the available satellites at a given time (ranging from 1 to 4 over the period considered in this paper). The second one is the two satellite SLA product and is obtained combining, during the whole time period, only two satellites. The advantage of using the all satellite dataset is that it gives the best product we can get, since it uses all the available information, but the error is not constant in time since it depends on the number of satellites used. On the other hand, the two satellite version of the SLA product does not contain all the available information but the standard error is consistent during the whole time period. A complete description of the satellite SLA datasets can be found in AVISO (2016).
2.2. Eddy Tracking Algorithm
We applied the eddy identification and tracking algorithm developed by Faghmous et al. (2015) to the original SLA fields. This algorithm identifies an eddy as a SLA area with a single extreme that is defined, for an anticyclone, as a grid cell whose value is greater than its 24 neighbors (5 × 5 pixels) and is surrounded by a closed-contour of SLA. This threshold has been selected following the recommendation by Faghmous et al. (2015). This algorithm is considered parameter-free since it does not impose any minimum amplitude and the identified boundaries of the eddy are only dependent on the presence of other extrema within its neighborhood. Once all possible eddies are identified, they are tracked in time and only those eddies that last longer than 7 days, without introducing any fake eddy, are kept. Using slightly different thresholds for the duration of the tracks (10 and 15 days) do not significantly affect the results.
3. Results
The maps of eddy density (number of eddy centers per square degree and day in a grid of 0.1 × 0.1°) in the Mediterranean sea computed from both SLA products (two satellite in Figure 1A and all satellite in Figure 1C) show suspicious linear structures with a larger number of eddies. Indeed, if the tracks of Topex/Poseidon satellites are plotted on top of the eddy density maps (black lines in Figure 1), it can be seen that the number of eddies along those tracks is larger than in the gaps between the tracks. This result is observed in Figure 9 of Escudier et al. (2016) and they described it like “a seesaw pattern (…) that is likely attributable to the sampling tracks of satellite altimeters.” On the other hand, the eddy density maps for the global SLA product in the North Atlantic ocean (two satellite in Figure 1B and all satellite in Figure 1D) do not show these inhomogeneities in the eddy density.
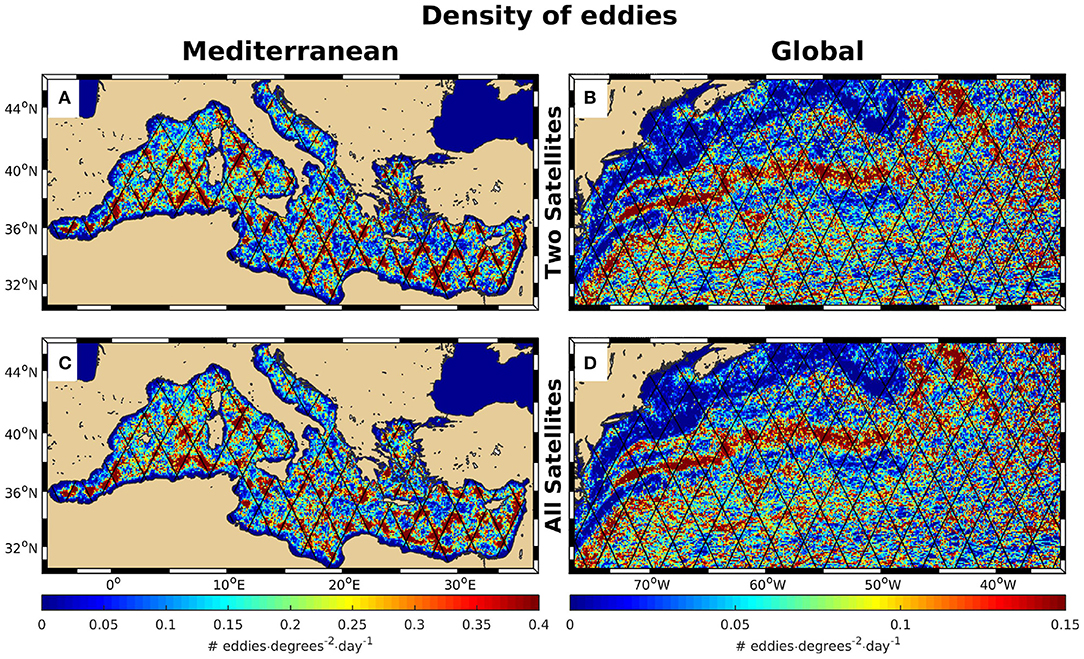
Figure 1. Eddy density maps computed on a 0.1° grid for the Mediterranean Sea (A,C) and the North Atlantic ocean (B,D). The maps for the Mediterranean Sea (North Atlantic ocean) are computed from the two versions of the regional (global) SLA product delivered by Copernicus: the two satellites version (A,B) and the all satellites version (C,D). Black lines indicate the position of the Topex/Poseidon satellite ground tracks. The area shown in the maps have the same size for the Mediterranean and global SLA products.
The abnormal eddy density distribution in the Mediterranean sea is observed during the whole period covered by the SLA products. We have averaged the eddy density in a 0.5° strip along the Topex/Poseidon satellite tracks and in the gaps between tracks (thick lines) for each map (using 0.25° strip did not change the results significantly indicating that this is not a critical parameter). The 6 months-low-pass filtered time series for both computations is shown in Figure 2a for both SLA products (red lines for all satellite product and blue lines for the two satellite one). During the whole time period (1993–2015) the density of eddies along the satellite tracks is considerably larger than the density of eddies in the gaps for both SLA products. The ratio between the number of eddies along track and the eddies in the gaps (hereafter referred as TG ratio) for the two satellite SLA dataset (blue line in Figure 2b) shows that the eddy density is around two times larger along the satellite tracks than in the gaps during the whole time period. However, the TG ratio is not constant in time for the all satellite SLA dataset (red line in Figure 2b) but it clearly depends on the number of satellites operating at once (Figure 2e). For the time period between 1993 and 2000, there were two satellites operating for most of the time and, consequently, the density of eddies along track and in the gaps and their ratio was identical for both SLA products (Figures 2a,b). But from 2000 onwards, the number of satellites operating at a given time oscillated between 2 and 4 and the same oscillations are observed in TG ratio for the all satellite SLA product. For example, when the number of satellites increased (2003–2006; 2011–2012), the TG ratio reached the lower values (around 1.1 and 1, respectively) and when the number of satellites was lower (between 2006 and 2011), the value of the TG ratio was higher (around 2). This difference between the density of eddies along tracks and in the gaps is not observed in the eddy dataset computed from the global SLA maps, neither in the all satellite SLA maps (red lines in Figures 2c,d) or the two satellite SLA maps (blue lines in Figures 2c,d). So, this phenomenon is only affecting the Mediterranean SLA products. There is an exception to this around January 1994 when a peak in the TG ratio is found in both domains (Figures 2b,d). Interestingly, this peak coincides with a period when a single satellite was operating (Figure 2e).
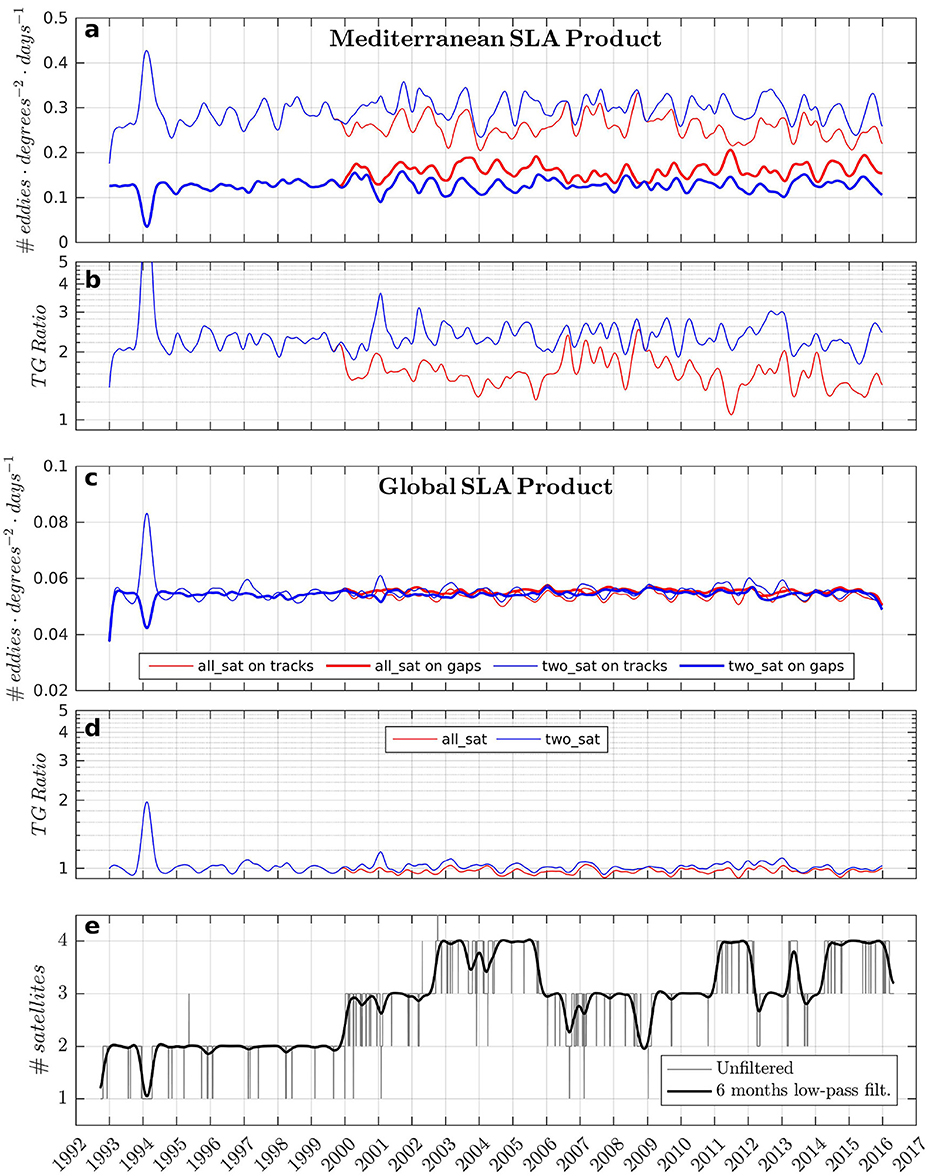
Figure 2. (a) Six months low-pass filtered time series of the number of eddies on a 0.5° strip along the Topex/Poseidon tracks (thin lines) and in the gaps between the tracks (thick lines) for the Mediterranean Sea all satellites SLA product (red lines) and the two satellites SLA product (blue lines). (b) Ratio between the number of eddies on the satellite tracks and between the tracks for the all satellites product (red) and the two satellites (blue) for the Mediterranean Sea. (c,d) Same as (a,b), respectively, but for the global SLA products distributed by Copernicus and for the whole global ocean. (e) Original (gray) and 6 months low-pass-filtered time series (black) of number of satellites operating at a given time.
This difference in the density of eddies along the Topex/Poseidon tracks and in the gaps between tracks is found for all eddy sizes (eddy radius computed as the radius of a circle with the same area of the eddy) with significant eddy density in both Mediterranean SLA products (Figure 3a) but not observed in the global SLA products. The TG ratio (not shown) is not the same for all eddy radius since other effects, such as small eddy merging, are inherent to all SLA products (Amores et al., 2018). The TG ratios for the most common eddy radius in the Mediterranean sea (around 45 km) are 1.70 and 2.22 for the all satellite and two satellite SLA products, respectively. These ratios are 1.03 (all satellite) and 1.07 (two satellite) for the most common eddy radius (80 km) in the global SLA products.
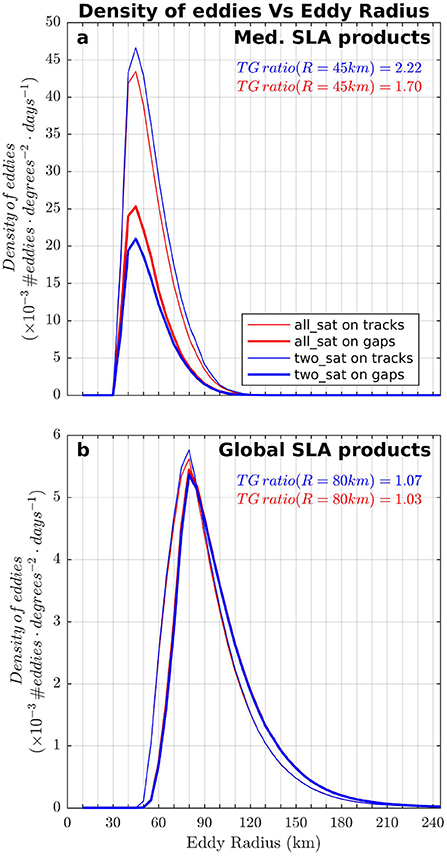
Figure 3. (a) Eddy density on a 0.5° strip along the Topex/Poseidon tracks (thin lines) and in the gaps between the tracks (thick lines) for the Mediterranean Sea all satellites SLA product (red lines) and the two satellites SLA product (blue lines) as a function of eddy radius (computed as the radius of a circle with the same area of the eddy) for the 23 years of daily SLA maps. (b) Same as (a) but for the global SLA products distributed by Copernicus and for the whole global ocean.
It is worth mentioning that the aim of this study is not to determine the exact eddy density in a given region or to determine the exact value of the TG ratio, since their precise values may depend on the SLA product used and the details of the eddy detection and tracking algorithm. The real aim of this manuscript is to show that there is an anomalous result in the spatial distribution of the eddies detected in the SLA maps for the Mediterranean Sea and to analyze its possible origin. Pursuing the latter goal, it can be stated that the global and Mediterranean SLA products have only two main differences, namely: (1) the spatial resolution (1/4 or 1/8 of a degree, respectively) and (2) the parameters used in the optimal interpolation (OI) algorithm (AVISO, 2016; Pujol et al., 2016), that are different due to the smaller Rossby radius of the Mediterranean structures. The spatial resolution of the grid cannot be the origin of the observed results since the spatial correlation scales are several times larger than both grid sizes and increasing the resolution (i.e., reducing the grid size) will not create smaller structures, so it leaves the OI parameters as a single possible responsible. In order to shed some light about the role of the OI parameters in the inhomogeneities of the Mediterranean eddy density maps, we apply an OI algorithm to the actual along track satellite observations in order to mimic the Copernicus SLA maps. This algorithm has been developed and tested by Amores et al. (2018) to provide comparable fields to the Copernicus SLA products. We compute the daily SLA products for the Mediterranean sea, from 1993 to 2015 (8,400 maps), in a 1/8 of a degree grid using the data of all available satellites at a given time (these products would be equivalent to the all satellite SLA product distributed by Copernicus). We repeat the procedure changing the spatial and temporal correlation scales of the OI algorithm (from 75 to 95 km and from 10 to 30 days, respectively). Then, we apply the eddy detection and tracking algorithm to the 15 different SLA products and compute the mean of the 6-months high-pass filtered TG ratio timeseries for each product (each of these timeseries is analogous to the all satellite TG ratio timeseries in Figure 2b). It has to be noted that this exercise does not pretend to optimize the OI algorithm but to illustrate the impact of the OI parameters in the eddy density inhomogeneities.
The results show that the TG ratio strongly depends on the combination of correlation scales chosen (Figure 4). The ratio reaches maximum values for the minimum temporal correlation scale considered (i.e., T = 10 days), independently of the spatial correlation scale used. The combination of correlation scales of this OI algorithm (R = 85 km and T = 10 days; black square in Figure 4) that gives as a result the most similar maps to the Copernicus Mediterranean product by minimizing the root mean square difference (RMSD) (Amores et al., 2018) is found in this area of the diagram. The ratios tend to decrease when the spatial correlation decreases and the temporal correlation increases. Moving in that direction in the diagram is where the OI parameters (R = 80 km and T = 25 days; black circle in Figure 4) that give maps resembling the Copernicus global product by minimizing the RMSD (Amores et al., 2018) are found.
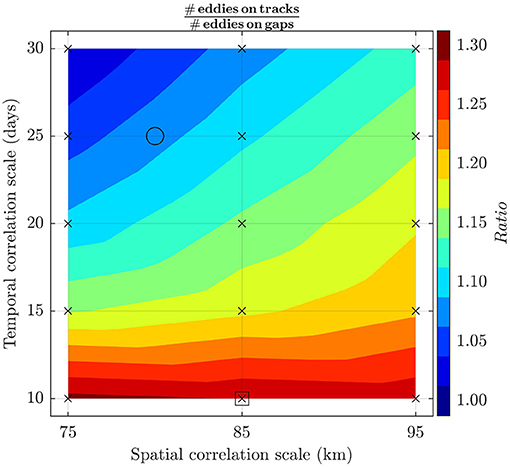
Figure 4. Ratio of number of eddies along Topex/Poseidon tracks and number of eddies between tracks depending on the spatial (R) and temporal (T) correlation scales used by the optimal interpolation algorithm. The contour plot has been computed linearly interpolating the points indicated by black crosses. The black square (circle) indicates the combination of parameters that (Amores et al., 2018) used for the Mediterranean Sea (North Atlantic Ocean) and that gave the closer results to the Copernicus SLA fields.
4. Conclusions
We have shown that the eddy density maps (number of eddies per square degree and day) computed in the Mediterranean Sea from altimetry based SLA products (all satellite and two satellite) display suspicious larger values along the Topex/Poseidon satellite tracks than in the gaps between those tracks (Figures 1A,C). This result was observed during the whole period of time analyzed (Figures 2a,b) and for all eddy radii (Figure 3a). However, this inhomogeneity was not detected in any of the two global SLA products analyzed (Figures 1B,D, 2c,d, 3b). The only singular moment where a larger eddy density along track was observed in the global SLA products coincided with a period of time when only one single satellite was operating (around 1994 in Figure 2c). We have shown that the OI parameters chosen to compute the satellite SLA maps contribute greatly to the larger density of eddies found along the Topex/Poseidon tracks (the most common tracks) in the Mediterranean product distributed by Copernicus. In particular, provided the characteristics of the satellite altimetry sampling, using a short temporal correlation scale in the OI algorithm induces strong inhomogeneities in the eddy density field. A too short temporal correlation scale could provoke that an eddy would be well-represented in the SLA maps when it lies below a satellite track but it would be lost when it is traveling from one track to another. Increasing the correlation time scale would connect the signal of the eddy detected on two neighboring tracks and include the eddy signal in the gap between those tracks. The spatial correlation scale chosen becomes relevant for temporal correlation scales larger than 15 days. In any case, it has to be kept in mind that changing the correlation scales would also modify the eddy properties, such as amplitude or radius as shown by Amores et al. (2018). Moreover, the separation between satellite tracks is often larger than the Rossby radius of deformation, which seriously compromise the ability of present day satellite observations to correctly represent the eddy field, disregarding the mapping algorithm used. This fact could be only solved by increasing the amount of satellite tracks in both, time and space at least for those regions, as the Mediterranean, where Rossby radius of deformation become smaller than in most of the global ocean.
Data Availability Statement
Publicly available datasets were analyzed in this study. This data can be found here: https://www.aviso.altimetry.fr/en/home.html.
Author Contributions
AA wrote the paper and did the computations. GJ helped writing the paper and contributed to the idea. SM helped improving the paper and suggested the study of the optimal interpolation parameters.
Funding
This research has been funded by the Spanish-funded CLIFISH project (CTM2015-66400-C3-2-R).
Conflict of Interest
The authors declare that the research was conducted in the absence of any commercial or financial relationships that could be construed as a potential conflict of interest.
Acknowledgments
GJ acknowledges a Ramón y Cajal contract (RYC-2013-14714) funded by the Spanish Ministry of Economy and the Regional Government of the Balearic Islands.
References
Amores, A., Jordà, G., Arsouze, T., and Le Sommer, J. (2018). Up to what extent can we characterize ocean eddies using present-day gridded altimetric products? J. Geophys. Res. 123, 7220–7236. doi: 10.1029/2018JC014140
AVISO (2016). Ssalto/duacs User Handbook: (M)SLA and (M)ADT Near-Real Time and Delayed Time Products. CLS-DOS-NT-06-034, Issue 5rev0.
Chelton, D. B., Schlax, M. G., and Samelson, R. M. (2011). Global observations of nonlinear mesoscale eddies. Progr. Oceanogr. 91, 167–216. doi: 10.1016/j.pocean.2011.01.002
Conti, D., Orfila, A., Mason, E., Sayol, J. M., Simarro, G., and Balle, S. (2016). An eddy tracking algorithm based on dynamical systems theory. Ocean Dyn. 66, 1415–1427. doi: 10.1007/s10236-016-0990-7
Escudier, R., Renault, L., Pascual, A., Brasseur, P., Chelton, D., and Beuvier, J. (2016) Eddy properties in the Western Mediterranean Sea from satellite altimetry a numerical simulation. JGR Oceans 121, 3990–4006. doi: 10.1002/2015JC011371
Faghmous, J. H., Frenger, I., Yao, Y., Warmka, R., Lindell, A., and Kumar, V. (2015). A daily global mesoscale ocean eddy dataset from satellite altimetry. Sci. Data 2:150028. doi: 10.1038/sdata.2015.28
Halo, I., Backeberg, B., Penven, P., Ansorge, I., Reason, C., and Ullgren, J. (2014). Eddy properties in the mozambique channel: a comparison between observations and two numerical ocean circulation models. Deep Sea Res. II Top. Stud. Oceanogr. 100, 38–53. doi: 10.1016/j.dsr2.2013.10.015
Le, B., Stegner, A., and Arsouze, T. (2018). Angular momentum eddy detection and tracking algorithm (ameda) and its application to coastal eddy formation. J. Atmos. Ocean. Technol. 35, 739–762. doi: 10.1175/JTECH-D-17-0010.1
Mason, E., Pascual, A., and McWilliams, J. (2014). A new sea surface height–based code for oceanic mesoscale eddy tracking. J. Atmos. Ocean. Technol. 31, 1181–1188. doi: 10.1175/JTECH-D-14-00019.1
Mkhinini, N., Santi Coimbra, A. L., Stegner, A., Arsouze, T., Taupier-Letage, I., and Béranger, K. (2014). Long-lived mesoscale eddies in the eastern Mediterranean Sea: analysis of 20 years of AVISO geostrophic velocities. J. Geophys. Res. 119, 8603–8626. doi: 10.1002/2014JC010176
Nencioli, F., Dong, C., Dickey, T., Washburn, L., and McWilliams, J. C. (2010). A vector geometry-based eddy detection algorithm and its application to a high-resolution numerical model product and high-frequency radar surface velocities in the southern california bight. J. Atmos. Ocean. Technol. 27, 564–579. doi: 10.1175/2009JTECHO725.1
Pujol, M.-I., Faugère, Y., Taburet, G., Dupuy, S., Pelloquin, C., Ablain, M., et al. (2016). Duacs dt2014: the new multi-mission altimeter data set reprocessed over 20 years. Ocean Sci. 12, 1067–1090. doi: 10.5194/os-12-1067-2016
Taburet, G., Sanchez-Roman, A., Ballarotta, M., Pujol, M.-I., Legeais, J.-F., Fournier, F., et al. (2019). Duacs dt-2018: 25 years of reprocessed sea level altimeter products. Ocean Sci. Discuss. 2019, 1–30. doi: 10.5194/os-2018-150
Keywords: mesoscale eddies, satellite altimeter data, Mediterranean sea, satellite track, optimal interpolation (OI)
Citation: Amores A, Jordà G and Monserrat S (2019) Ocean Eddies in the Mediterranean Sea From Satellite Altimetry: Sensitivity to Satellite Track Location. Front. Mar. Sci. 6:703. doi: 10.3389/fmars.2019.00703
Received: 03 May 2019; Accepted: 01 November 2019;
Published: 15 November 2019.
Edited by:
Gilles Reverdin, Centre National de la Recherche Scientifique (CNRS), FranceReviewed by:
Isabelle Taupier-Letage, UMR7294 Institut Méditerranéen d'Océanographie (MIO), FranceMarie Isabelle Pujol, Collecte Localisation Satellites (CLS), France
Copyright © 2019 Amores, Jordà and Monserrat. This is an open-access article distributed under the terms of the Creative Commons Attribution License (CC BY). The use, distribution or reproduction in other forums is permitted, provided the original author(s) and the copyright owner(s) are credited and that the original publication in this journal is cited, in accordance with accepted academic practice. No use, distribution or reproduction is permitted which does not comply with these terms.
*Correspondence: Angel Amores, YW5nZWwuYW1vcmVzQHVpYi5lcw==