 Rhian G. Waller1,2*
 Robert P. Stone3
 Lauren N. Rice2,4
 Julia Johnstone2
 Ashley M. Rossin2,5
 Elise Hartill2Keri Feehan2
 Cheryl L. Morrison6
- 1Sven Lovén Centre, Tjärnö, University of Gothenburg, Strömstad, Sweden
- 2Darling Marine Center, School of Marine Sciences, University of Maine, Walpole, ME, United States
- 3Alaska Fisheries Science Center, National Marine Fisheries Service, National Oceanic and Atmospheric Administration, Juneau, AK, United States
- 4Oregon Institute of Marine Biology, University of Oregon, Charleston, OR, United States
- 5College of Fisheries and Ocean Sciences, University of Alaska Fairbanks, Fairbanks, AK, United States
- 6Leetown Science Center, U.S. Geological Survey, Kearneysville, WV, United States
Red tree corals (Primnoa pacifica) are abundant in the eastern Gulf of Alaska, from the glacial fjords of Southeast Alaska where they emerge to as shallow as 6 m, to the continental shelf edge and seamounts where they are more commonly found at depths greater than 150 – 500 m. This keystone species forms large thickets, creating habitat for many associated species, including economically valuable fishes and crabs, and so are important benthic suspension feeders in this region. Though the reproductive periodicity of this species was reported in 2014 from a shallow fjord (Tracy Arm), this study examined reproductive ecologies from 8 sites – two within Glacier Bay National Park and Preserve, three on the continental shelf edge, one within Endicott Arm (Holkham Bay) and two time points from the Tracy Arm (Holkham Bay) study. Male reproductive traits were similar at all sites but there were distinct differences in oogenesis. Though per polyp fecundity mostly showed no significant difference between sites, there was a non-significant trend of increasing number of oocytes with depth. In addition, the average oocyte size from Tracy Arm (the shallowest site) was 105 μm, whereas from Shutter Ridge (one of the deepest sites) the average size was 309 μm. Moreover, the maximum oocyte size at Endicott Arm was 221 μm and at Tracy Arm was 802 μm (both shallow sites), whereas at Dixon Entrance (a deep site) it was 2120 μm, a difference not usually observed within a single species. We propose two theories to explain the observed differences, (a) this species shows great phenotypic plasticity in reproductive ecology, adjusting to different environmental variables based on energetic need and potentially demonstrating micro-evolution; or (b) the fjord sites are at a reproductive dead end, with the stress of shallow-water conditions effectively preventing gametogenesis reaching full potential and likely limiting successful reproductive events from occurring, at least on a regular basis.
Introduction
The family Primnoidae is one of the most abundant and dominant octocoral families in the world, containing 233 valid azooxanthellate species to date (Cairns, 2011). Species are found in all ocean basins primarily in deep water (>100 m). They are the most abundant corals in Alaska with 27 taxa confirmed from the region (Stone and Cairns, 2017). Within the family Primnoidae, the genus Primnoa Lamouroux, 1812 contains only five valid species: P. resedaeformis (Gunnerus, 1763) from the Atlantic, P. pacifica (Kinoshita, 1907) and P. wingi (Cairns and Bayer, 2005) from the North Pacific, P. notialis (Cairns and Bayer, 2005) from the Subantarctic, and Primnoa bisquama (Taylor and Rogers, 2017) from the Indian Ocean (Cordeiro et al., 2019). Primnoa pacifica is one of the more well-known and studied cold-water corals in the world. Growth rates (Andrews et al., 2002; Aranha et al., 2014), reproduction (Waller et al., 2014), effects of ocean acidification (Rossin et al., 2019), distribution, ecology, and taxonomy have all been investigated (Krieger, 2001; Krieger and Wing, 2002; Cairns and Bayer, 2005; DuPreez and Tunnicliffe, 2011; Stone et al., 2014; Stone and Mondragon, 2018). Primnoa pacifica is one of only a few species world-wide known to display deep-sea emergence, a phenomenon where animal populations primarily found in deep water are able to thrive in much shallower water, likely due to unique conditions in these rare locations (Stone and Mondragon, 2018).
Thickets of P. pacifica, also known as red tree corals, are important elements of benthic ecosystems in Alaska and are considered to be both ecosystem engineers (Jones et al., 1994), and to exhibit keystone species characteristics (Power et al., 1996; King and Beazley, 2005; Stone et al., 2014). Red tree corals are slow growing with linear growth estimates of only 2.32 cm per year (Andrews et al., 2002), yet may reach massive sizes up to 5 m in height and width (R. Stone, personal observations). These thickets form important habitat for the myriad of associated species including many of commercial importance (Krieger and Wing, 2002; DuPreez and Tunnicliffe, 2011; Stone et al., 2014). Their characteristics of large size, arborescent morphology, and slow growth make them particularly vulnerable to anthropogenic impacts, including interactions with fishing gear (Krieger, 2001; Stone et al., 2014) but also global climate change (Stone and Mondragon, 2018; Rossin et al., 2019). In June 2006 five small areas (46 km2 in total) in the Gulf of Alaska were designated as Habitat Areas of Particular Concern, prohibiting the use of bottom contact gear to protect these important cold-water coral ecosystems (Stone et al., 2014).
Given the ecological importance of this coral species and in an effort to gauge its potential recovery from negative effects of human activities, a study on the reproductive ecology was undertaken in Tracy Arm fjord, Holkham Bay, Southeast Alaska (Waller et al., 2014). The study examined a single shallow-water (6–18 m depth) thicket and sampled 38 colonies over a 16-month period (sampling every 3 months) to gain insights into reproductive ecology, morphology, seasonality, and reproductive responses to simulated fisheries damage. The study found no reproductive differences in colonies that underwent simulated fisheries damage (other than decrease of total colony fecundity) but did provide important information indicating size-dependent reproduction, asynchronous and long duration of gametogenesis, presumed spawning behavior and external fertilization, and probable lecithotrophic larvae (due to large oocyte sizes). The results of this study led Waller et al. (2014) to hypothesize that this population showed highly sporadic recruitment events taking place in this glacial fjord area.
Given that fisheries interactions with red tree corals most commonly occurs in the deeper waters of the Gulf of Alaska where the corals are far more abundant and ecologically important (Krieger, 2001; Stone et al., 2014), this study had the primary objective of examining P. pacifica reproductive ecology from sites spanning broad geographical and depth ranges in the eastern Gulf of Alaska, including sites at its more common depth range of 150–200 m. This study also aimed to determine if the findings of the Waller et al. (2014) fjord study could be applied to deep water populations of this species.
Materials and Methods
Sample Collection
Samples were collected from five new locations across Southeastern Alaska (with one location, White Thunder Ridge, in Glacier Bay National Park and Preserve (GBNPP), sampled in both deep and shallow zones), and 2 months of data from the Waller et al. (2014) study from Tracy Arm were incorporated and reanalyzed, giving eight population data sets (Figure 1 and Table 1). All samples in this study were collected with either SCUBA or Remotely Operated Vehicles (ROV). Subsamples of all specimens were sent to Dr. Stephen Cairns at the U.S. National Museum of Natural History (Smithsonian Institution) for morphological identification and to Dr. Cheryl Morrison (U.S. Geological Survey) and were confirmed as Primnoa pacifica. All collection details for samples used in this study are in Table 1.
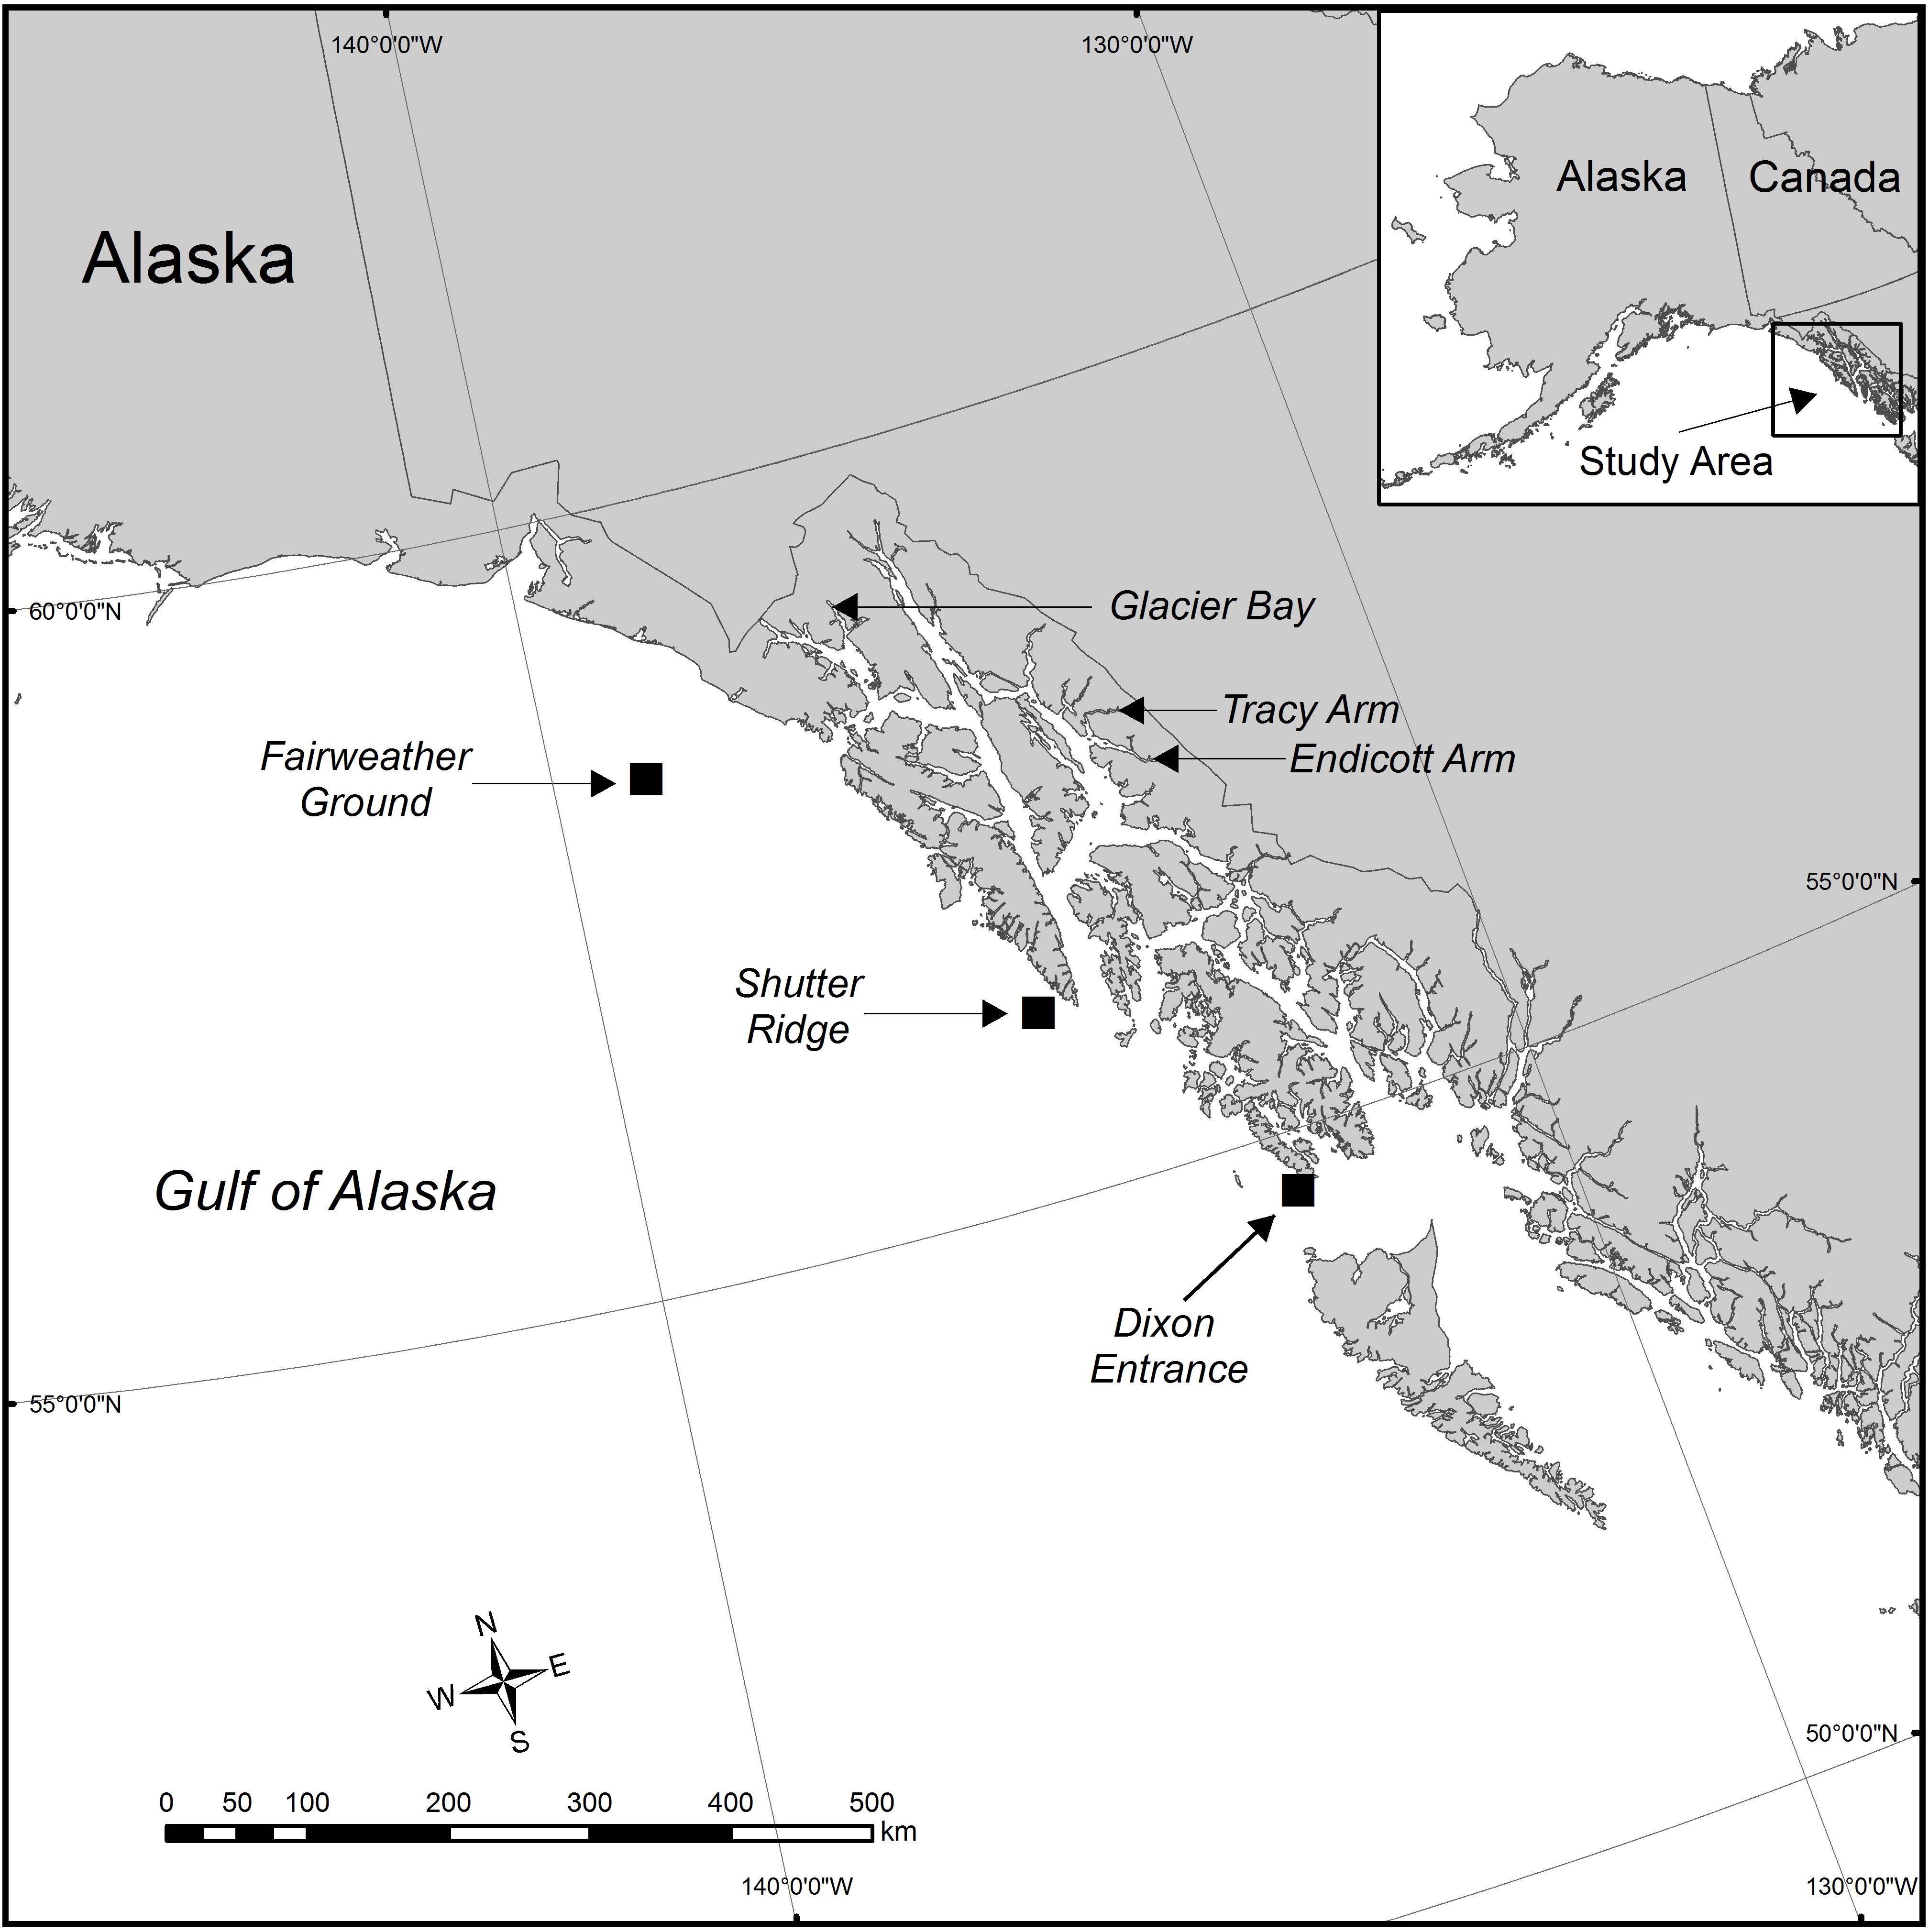
Figure 1. The study area in the eastern Gulf of Alaska showing the six geographical locations where red tree coral samples were collected. Eight data sets were generated from these six collection locations. Samples were collected in Glacier Bay at the same site (latitude and longitude) but at two distinct depth zones. At the Tracy Arm site, samples were collected during two distinct seasons (June and January). Squares show areas of deep sites.
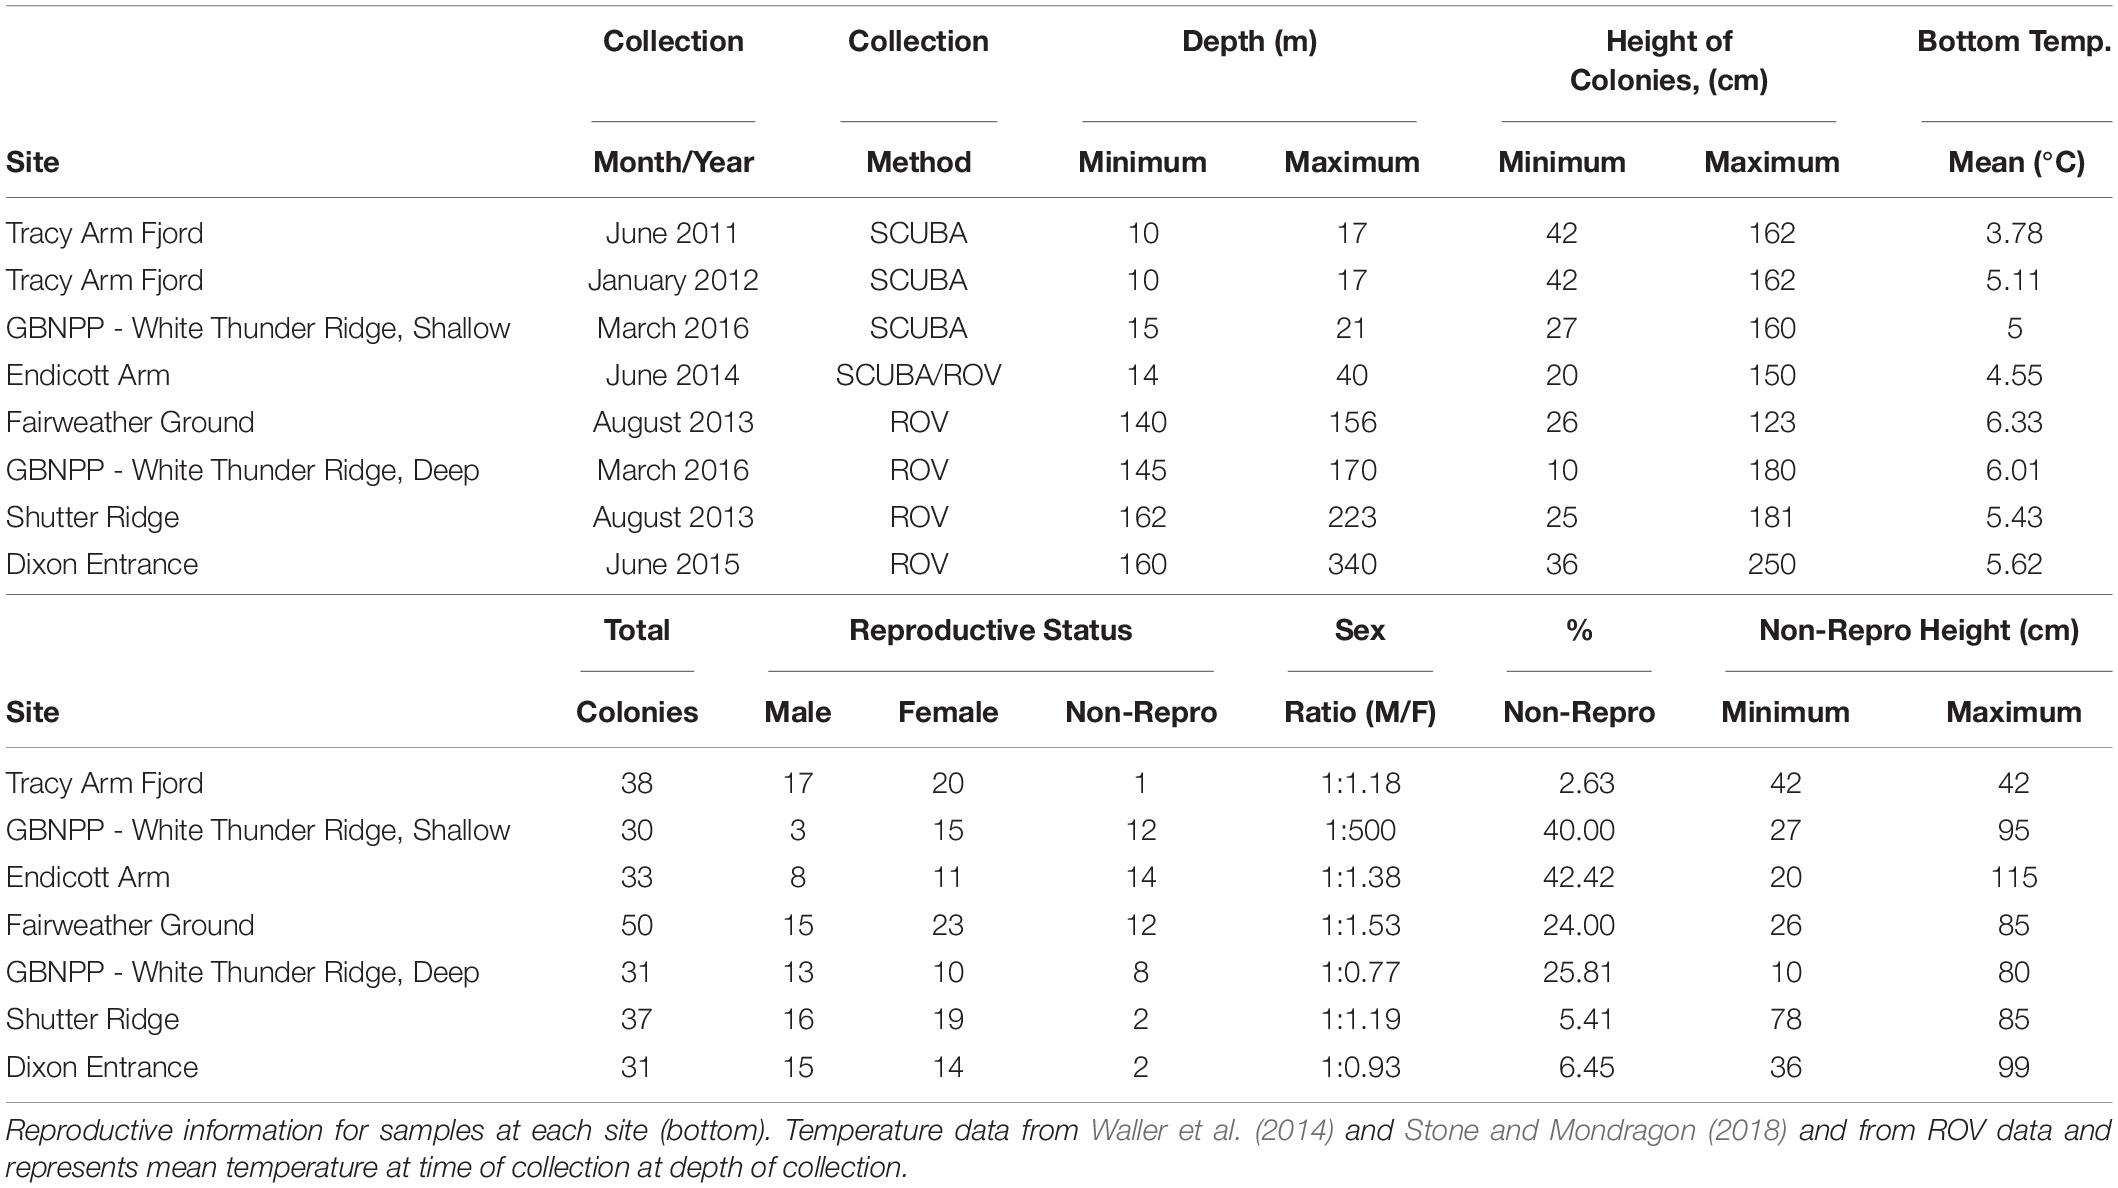
Table 1. Sample collection details for each site ordered by shallowest to deepest (top).
A standardized collection protocol was used for SCUBA and ROV sampling. Depth was recorded for each colony sampled and the height of each colony was measured in situ with a meter stick (SCUBA) or with two parallel laser marks set 10 cm apart projected onto coral colonies (ROV). Approximately 4–10 cm of tissue was sampled from distal branch tips and placed into individual collecting jars (SCUBA) or individual collecting quivers [Remotely Operated Vehicle (ROV)], both capped after collection. Samples were collected as branch tips near the distal region of colonies only to allow for comparative analysis, though previous study indicated no inter-colonial differences in reproductive parameters (Waller et al., 2014).
Tracy Arm Fjord, Holkham Bay (TA)
Tracy Arm is the northern fjord of Holkham Bay, is up to 378 m deep and terminates in two tidewater glaciers (Sawyer and South Sawyer Glaciers). The collection site for P. pacifica was ∼14.5 km from the head of the fjord (Waller et al., 2014), and on a vertical wall composed of graywacke and granodiorite (Stone and Mondragon, 2018). Colonies were found in small patches along the vertical walls, and the same colonies were tagged and resampled six times in 16 months during a previous study (see Waller et al., 2014 for collection methodology). For this current study, June 2011 and January 2012 from Waller et al. (2014) were chosen for analysis alongside the new data sets. June was chosen for this analysis to best temporally match collections from the other sites, while January was chosen as it showed the greatest oocyte sizes from the Waller et al. (2014) study. Raw data were taken from that manuscript and reanalyzed for this study.
Glacier Bay National Park and Preserve – White Thunder Ridge (WTR-S and WTR-D)
White Thunder Ridge is located in Muir Inlet (or East Arm) of GBNPP, and is a glacially cut, narrow fjord similar to Tracy Arm, though is shallower at 240 m maximum depth. The fjord terminates near the Muir Glacier that grounded in 1993 (Stone and Mondragon, 2018). The collection site for P. pacifica is located 11.6 km from the head of the fjord (Stone and Mondragon, 2018). Like Tracy Arm and Endicott Arm, all corals were attached firmly to vertical walls (schist and plutonics) and distributed in scattered patches (Stone and Mondragon, 2018).
Two distinct depth zones (hereafter referred to as sites) were sampled at this location (Table 1) – one “Shallow” (less than 22 m depth) and one “Deep” (greater than 145 m depth) along the same location of the fjord wall (i.e., the deep collection was taken directly below the shallow collection). All shallow samples were collected with SCUBA and all deep samples were collected with the ROV Kraken II (University of Connecticut).
Endicott Arm Fjord, Holkham Bay (EA)
Endicott Arm is the southern arm of Holkham Bay, is more than 350 m deep, and terminates in the tidewater Dawes Glacier. The collection site for. P. pacifica is located 7.9 km from the head of the fjord (Stone and Mondragon, 2018). Samples (∼8–10 cm) were collected with SCUBA for depths less than 22 m, or with an ROV Phantom XTL (Deep Ocean Engineering, San Jose, CA, United States) at depths greater than 23 m.
Gulf of Alaska – Fairweather Ground (FW), Shutter Ridge (SR) and Dixon Entrance (DE)
Three sites on the continental shelf edge in the eastern Gulf of Alaska were sampled based on knowledge from previous studies (Krieger, 2001; Krieger and Wing, 2002; Stone et al., 2014; Masuda and Stone, 2015; Table 1). Fairweather Ground is a large offshore shoal on the outer edge of the continental shelf in the northeastern GOA (Figure 1) and has complex bathymetry and highly varied seabed geological features (Stone et al., 2014). Shutter Ridge is located on the continental shelf 28 km west of Cape Ommaney, Baranof Island, and is a bedrock ridge of complex pinnacles (Stone et al., 2014). Dixon Entrance, the southernmost site, is a deep glacially scored basin separating northern British Columbia, Canada and Southeast Alaska (Barrie and Conway, 1999). The basin is littered with many glacial erratic boulders (i.e., dropstones) and bounded in many places by glacially scoured bedrock (Barrie and Conway, 1999).
All samples from the Gulf of Alaska were collected using ROV H2000 (Deep Ocean Exploration and Research) in 2013 and ROV Zeus II (Pelagic Research Services) in 2015. Small pieces (∼10 cm) were collected from intact, healthy colonies.
Histological Processing
Methods followed those of Waller et al. (2014) to ensure comparability across the data sets. As soon as samples from all locations were brought to the surface, they were immersed in 10% borax-buffered formalin for 24–48 h and then washed and stored in 70% ethanol to ensure quality tissue preservation. All samples were then shipped back to the Darling Marine Center (University of Maine) for histological analysis. Three to five polyps from each sample were then taken and decalcified in Rapid Bone Decalcifier (Electron Microscopy Sciences), serially dehydrated in a graded ethanol series, cleared with toluene and then infiltrated in paraffin wax for 48 h at 56°C. Wax blocks were then serially sectioned at 5 microns on a Leica RM2235 rotary microtome, leaving 90 microns between slides. This distance has been determined to be the nuclear diameter (Waller et al., 2014; Rossin et al., 2019), and thus provides adequate distance between sections allowing for accurate imaging of all oocytes within a polyp and prevents double counting when calculating fecundities. Sections were then stained using either Masson’s trichrome or Hematoxylin Eosin stains (using standard procedures) and cover-slipped. Slides were observed under an Olympus CX21 microscope with Moticam 5 camera attachment (Motic Optical). Colonies were categorized as male, female or non-reproductive (i.e., absence of gametes). Non-reproductive samples were then re-processed from the original tissue, taking another 3 to 5 polyps for additional observation and analysis. This process was repeated three times until a total of at least 9 polyps had been examined and either sex was determined or the colony was categorized as non-reproductive.
Image Analysis
Microscope images were analyzed using ImageJ (NIH). Males were observed and ∼100 haphazard spermatocysts staged and recorded as in Waller et al. (2014) and Rossin et al. (2019). Bar charts were constructed for each site (using averaged data) showing percentage of each stage per site. For females, ∼100 haphazard oocytes were measured (measuring only oocytes with a visible nucleus to prevent double-measuring) and oocyte size frequency graphs for each colony were constructed using feret diameters (the calculated diameter as if the oocytes were a perfect circle). If the original three polyps did not yield ∼100 oocytes, more original tissue was reprocessed until either that number was reached or tissue was used completely. Mean oocyte sizes were also calculated and then data were averaged per collection site. These three polyps per female had all oocytes counted (counting only those with a visible nucleus) for per polyp fecundity estimations.
Statistical Analysis
Statistical analysis of per polyp fecundity (i.e., all previtellogenic and vitellogenic oocytes combined), oocyte diameter, and colony size data were conducted using RStudio version 3.4.3 (R Core Team, 2017) with the FSA [RW1] (v0.8.22, Ogle et al., 2018), and car (Fox and Weisberg, 2011) packages. Distributions and variances for each sample site were examined utilizing the Shapiro–Wilk Test (Shapiro and Wilk, 1965) and Levene’s Test (Levene, 1960), respectively. Following a logarithmic transformation of the per polyp fecundity measurements, the mean values for each of the eight sample sites were compared using the Kruskal–Wallis Test (Kruskal and Wallis, 1952) and Dunn’s post hoc test (Dunn, 1964). Calculated p-values were adjusted using the Holm Method (Holm, 1979). Average oocyte diameters for each of the eight sample sites were also logarithmically transformed prior to being analyzed using the same statistical framework. Following the results of the Shapiro–Wilk Test, intra-site comparisons of per polyp fecundity and oocyte diameters were conducted using the Wilcoxon Signed Rank Test (Wilcoxon, 1945) for non-normal distributions, or the one sample t-Test for normal distributions. Non- parametric Friedman tests (SPSS 2012) were conducted on percentage of spermatocyst stages in males, to test for synchronicity between sites. A one-way ANOVA was conducted on size class data to assess differences in size at onset of reproduction. Finally, linear regression analysis was used to determine the effect of increasing depth on average per polyp fecundity and colony size.
Results
The reproductive morphology of all samples from all sites followed Waller et al. (2014) closely. As in the previous study, gametes were located within the eight mesenteries often filling the gastrovascular cavity. No larvae were observed in any samples examined and colonies sampled from different sites (and depths) comprised similar size ranges (Table 1 and Supplementary Figure S1).
All populations displayed gonochorism, with no hermaphroditic colonies present in any of the 250 samples examined (288 counting the second sampling of the same Tracy Arm colonies). A total of 104 males, 132 females and 52 non-reproductive colonies were found in this study with sex ratios close to 1:1 except for WTR-S which had a 1:5 sex ratio (Table 1). A combined sex ratio for all datasets was 1:1.27. Sites with the most non-reproductive colonies were EA and WTR-S (42.4 and 40%, respectively) and the site with the fewest was TA (2.6%). The largest non-reproductive colony was found at SR (115 cm), and the smallest non-reproductive colony examined was 20 cm (EA) (Figure 2). Sizes of reproductive colonies varied per site (Figure 2) from 25 and 30 cm minimum (female and male respectively) to a maximum size of 250 cm (for both female and male). The average sizes across all sites were 52.96 cm (SE 24.7) for non-reproductive, 87.77 cm (SE 45.09) for males and 93.53 cm (SE 40.73) for females. There was no statistical difference between sizes of non-reproductive colonies (for all sites that had sufficient non-reproductive colonies for analysis, i.e., WTR-S, EA, FW and WTR-D; p = 0.69334). There is no difference in color or morphology between sexes or reproductive and non-reproductive colonies.
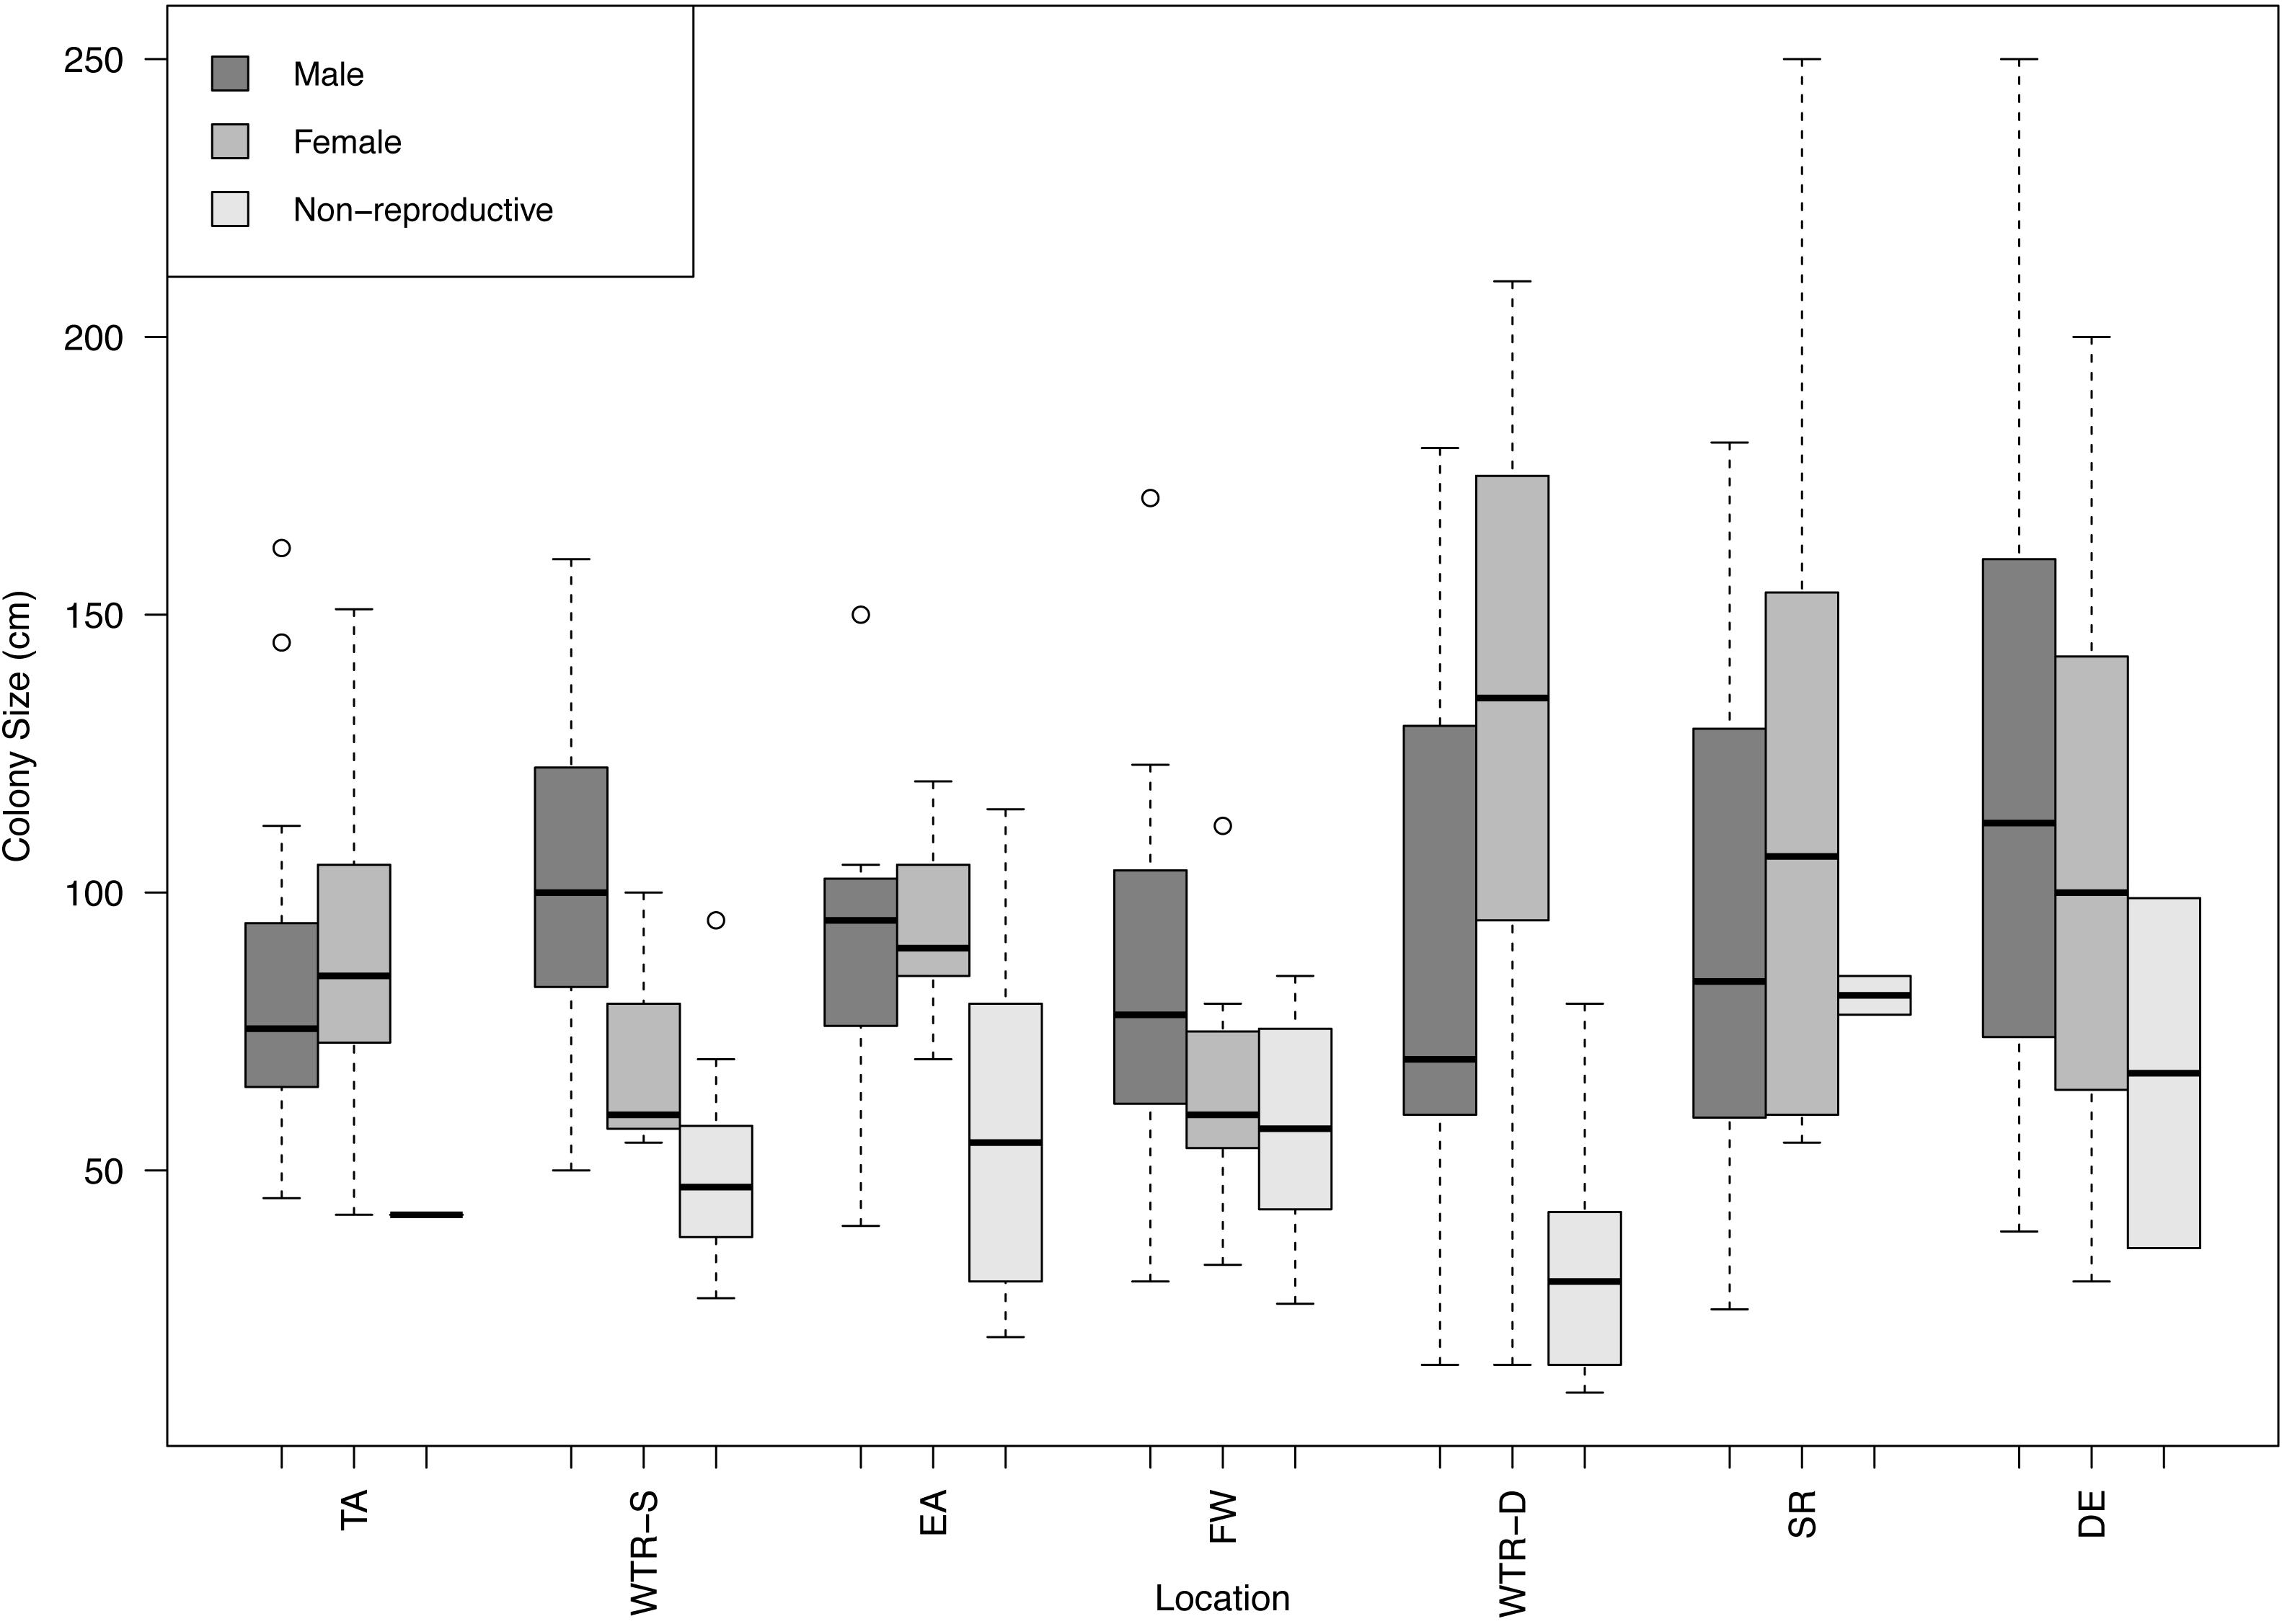
Figure 2. Boxplot of male, female and non-reproductive red tree coral colony sizes at each study site. Sites are arranged from shallowest (left) to deepest (right). Circles represent outliers in the data.
Oocyte Sizes
In total 121 females were used for oocyte size analysis, and approximately 100 haphazard oocytes per female were measured for this study. All populations showed females with overlapping oocyte cohorts, with both previtellogenic and vitellogenic oocytes being present in each polyp (Figure 3). Although there was variation in oocyte sizes between colonies at each site (Figure 4A, also found in Waller et al., 2014), the average oocyte size for each colony did not differ significantly from the mean oocyte diameter for that site (P-values from 1–0.11 using either a one sample T-test for normal distributions or the Wilcoxon Signed Rank test for non-normal).
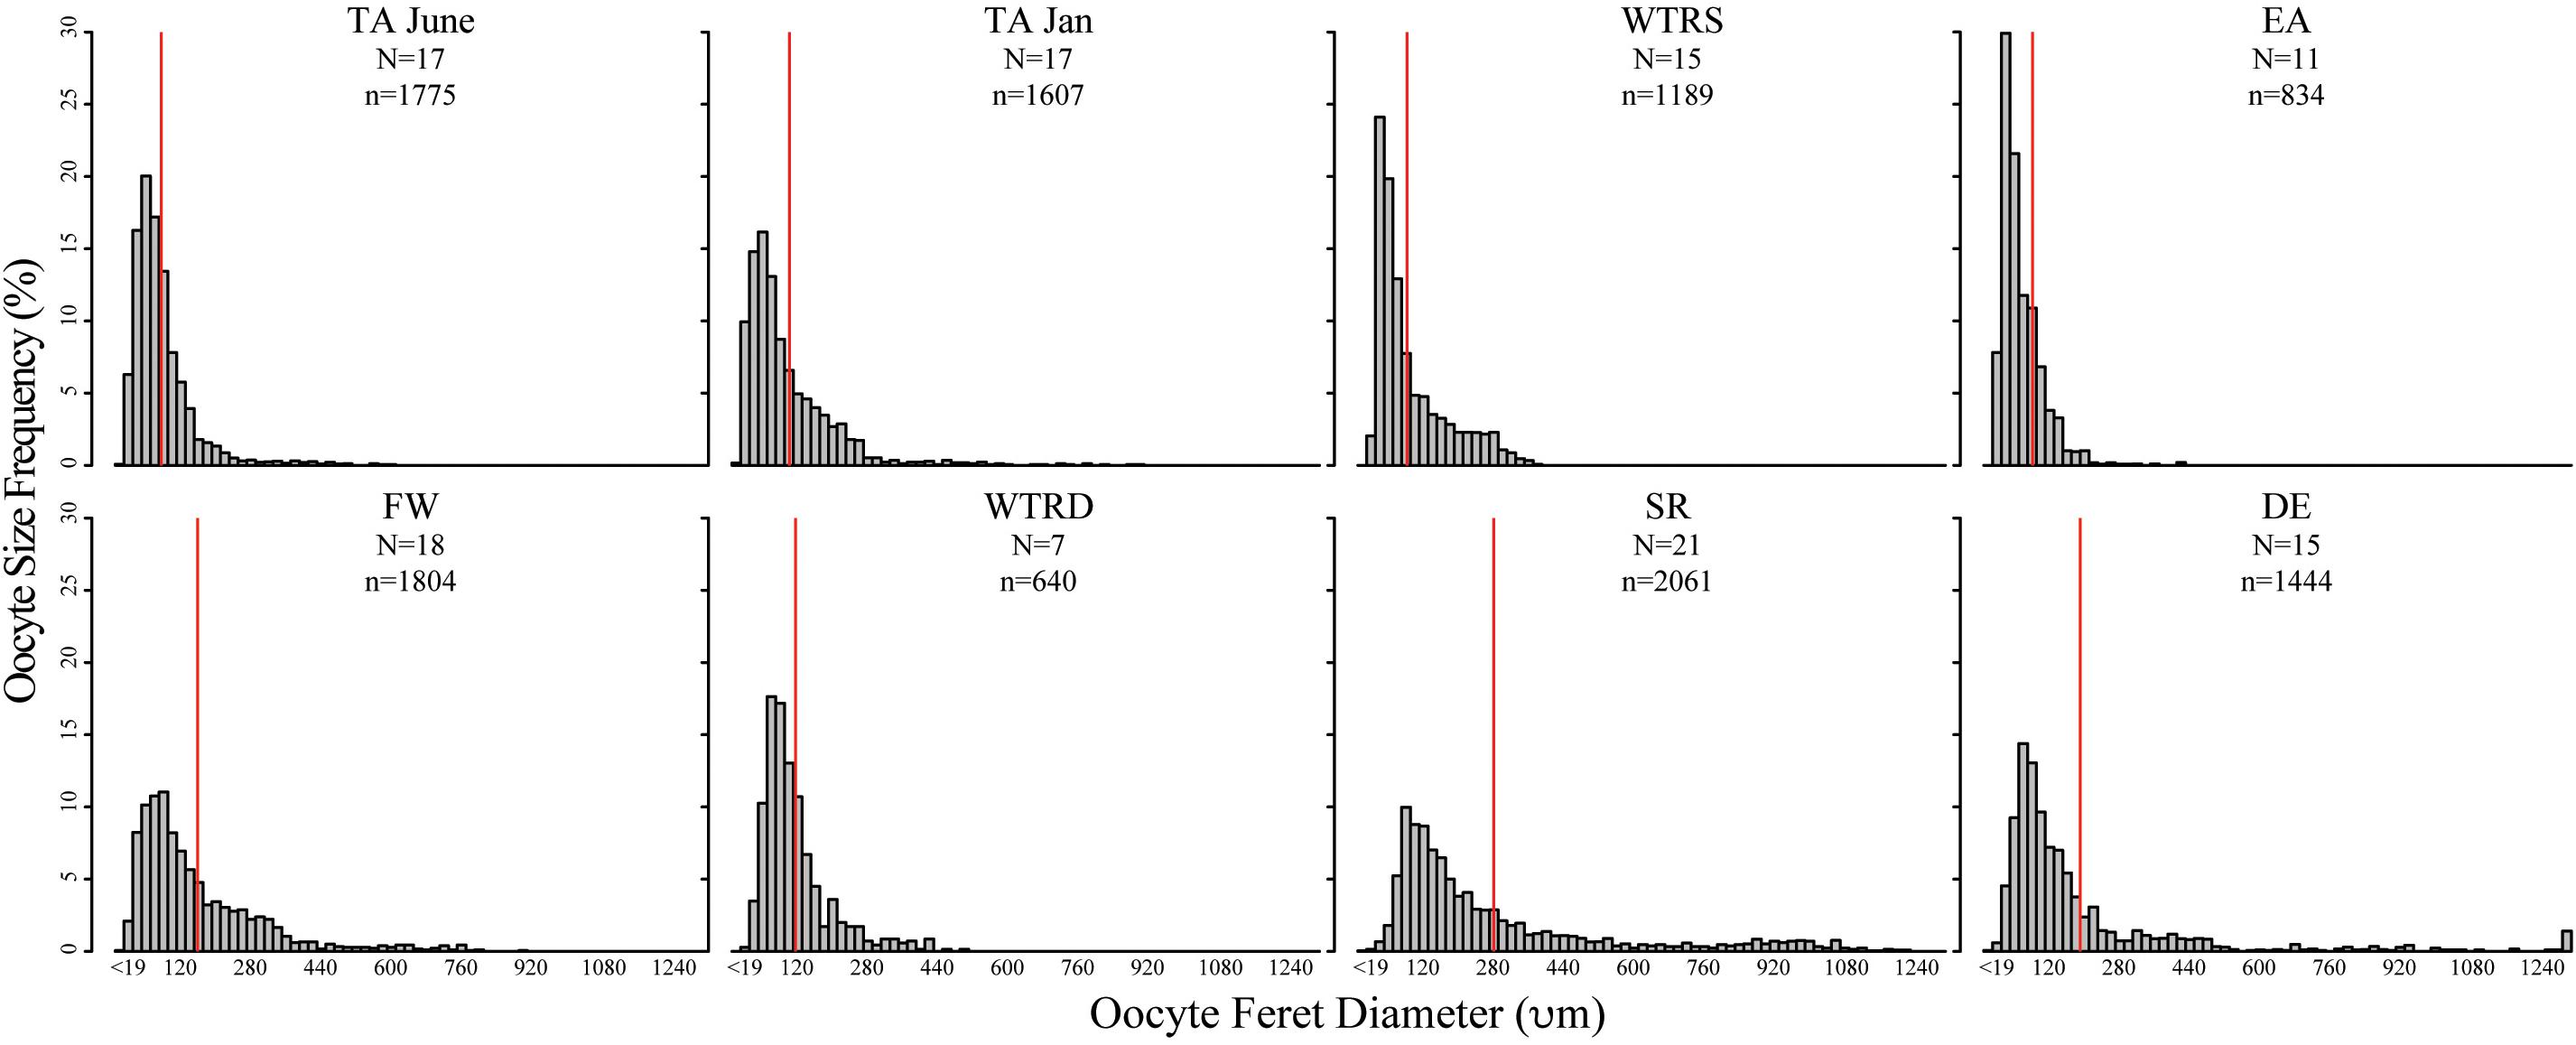
Figure 3. Oocyte size-frequency histograms for sampling sites in this study. Red lines indicate the mean oocyte size. Histograms are arranged from are arranged from shallowest site (top left) to deepest site (bottom right). Scales are identical for each plot. N, number of colonies used; n, number of total oocytes counted.
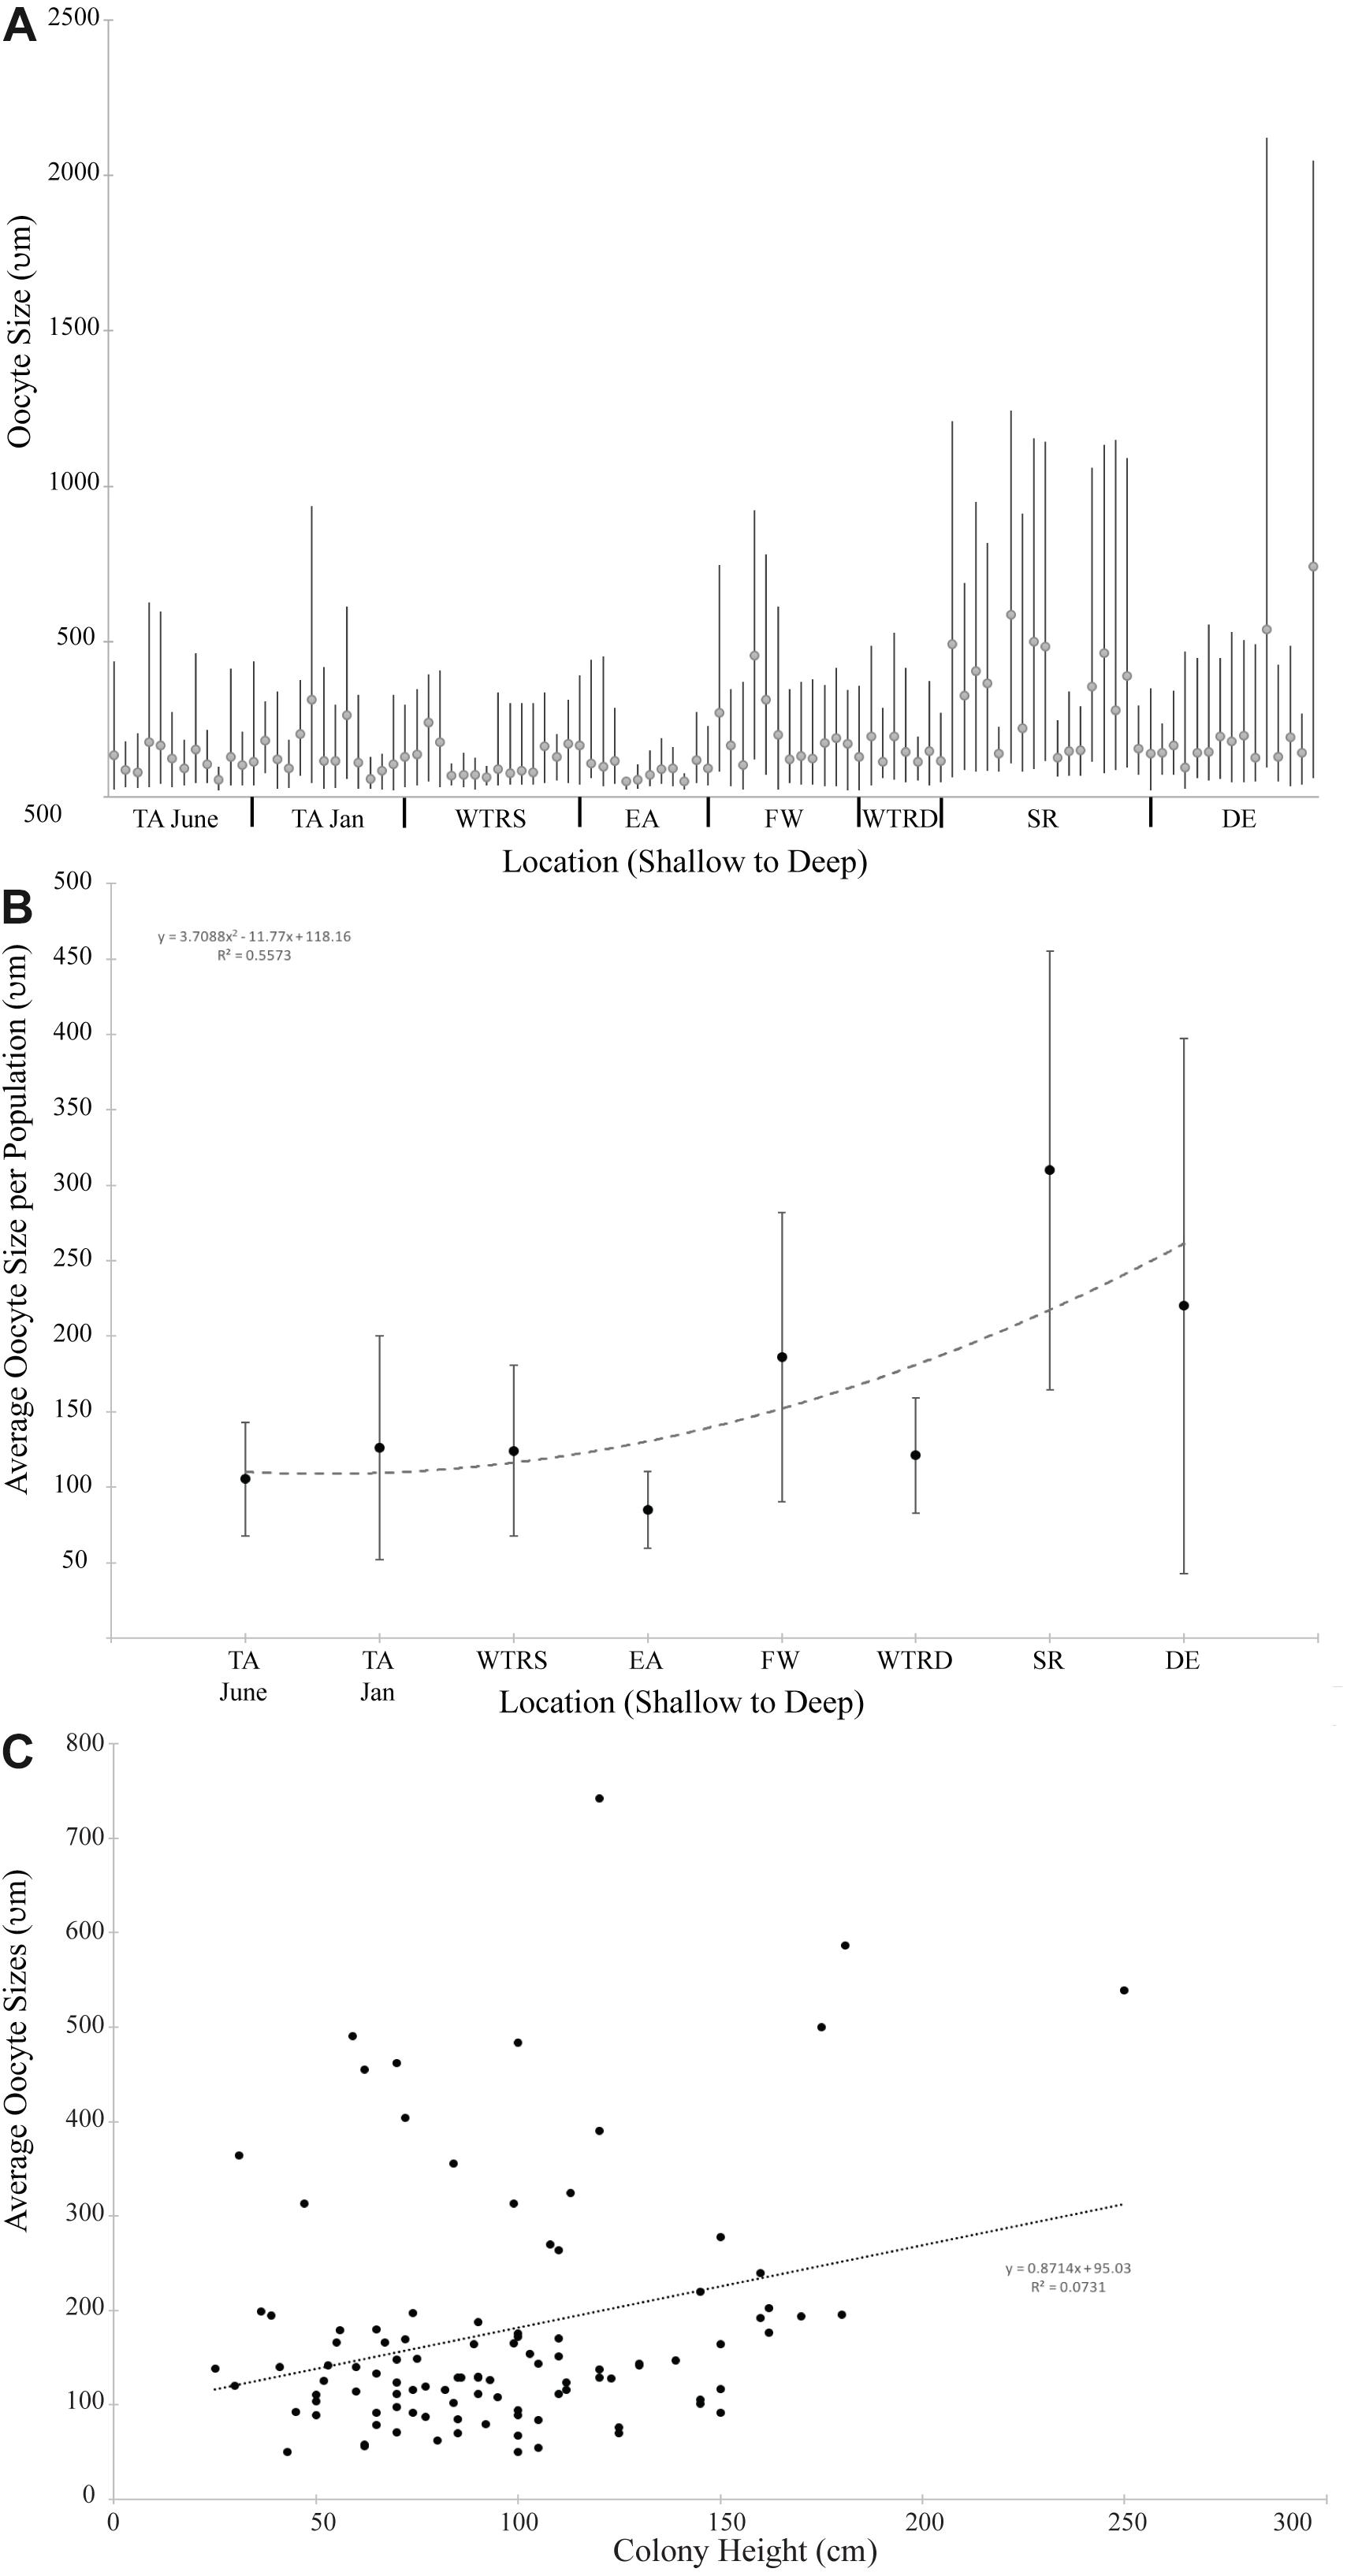
Figure 4. (A) Oocyte size distribution for all females colonies at each study site. Bars delineate the minimum and maximum oocyte size for each colony; circles indicate mean oocyte size. (B) Average oocyte size plotted by location. The trend line is a second order polynomial; (C) Average oocyte size plotted by colony height for all females in this study. The trend line is linear. For (A,B), sites are arranged from shallowest (left) to deepest (right).
Oocyte sizes varied between sites (Figures 3, 4) with EA having the smallest oocytes (average 85 μm, maximum 221 μm), DE having the largest oocytes (average 220 μm, maximum 2120 μm) and SR having the highest average oocyte size (310 μm). Comparisons of the average oocyte diameters between sites indicate that SR is significantly different from all shallow sites; DE is significantly different from WTR-S; and FW and EA are significantly different from each other (Table 2). All the shallow sites had similar average oocyte sizes.
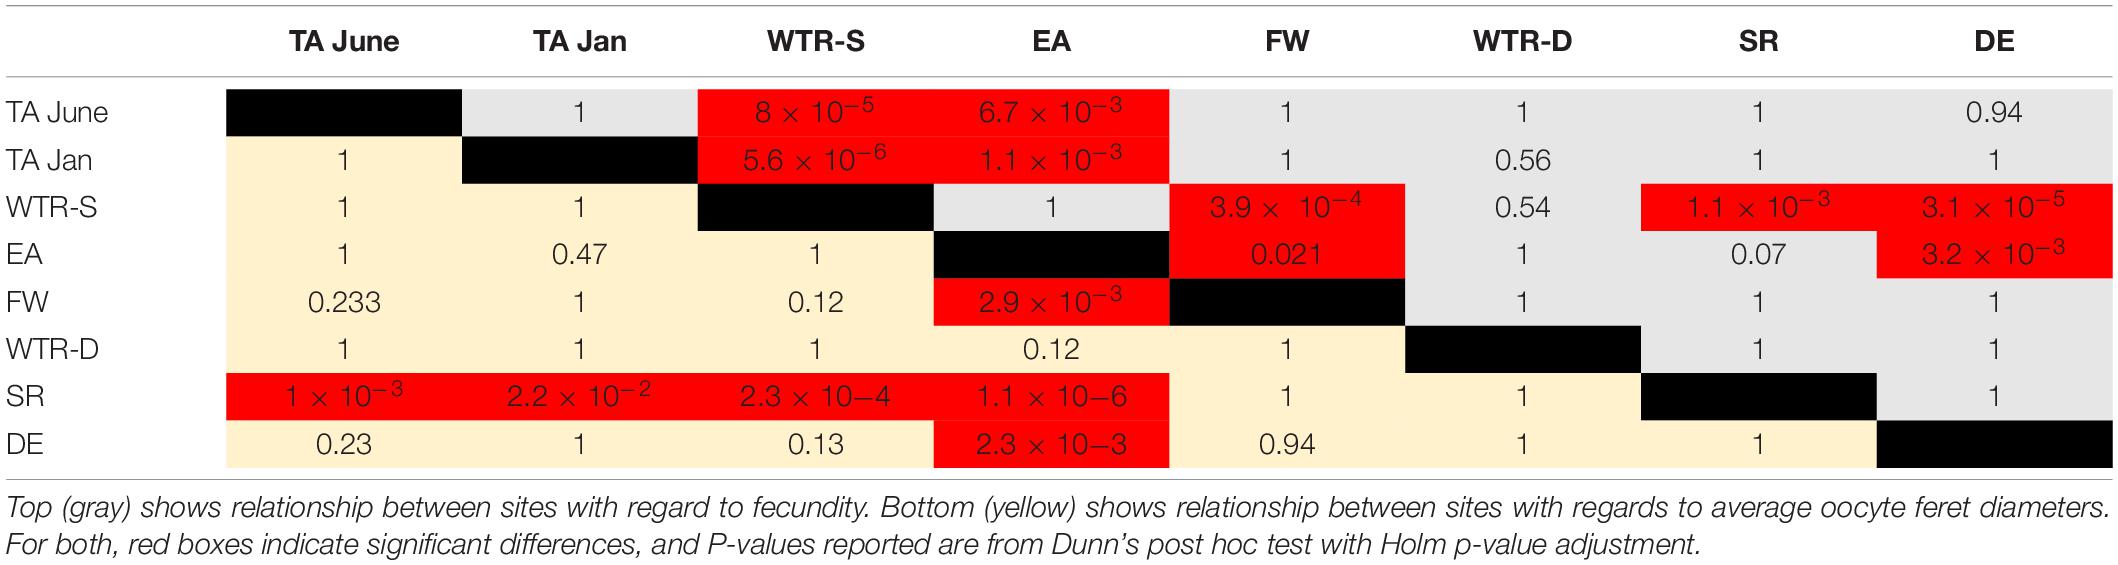
Table 2. Relationships between oocyte sizes and fecundity amongst sites.
When analyzed by depth of sampling (Figure 4B) there is a slight (R2 = 0.55) positive relationship (2nd order polynomial) between average oocyte size and depth (Figure 4B). When analyzed by colony height (Figure 4C), there is a weak linear relationship (R2 = 0.07) where larger colonies produce, on average, larger oocytes.
Fecundity
Per polyp fecundity of separate colonies within a population showed no significant differences from the site averages (P-values from 0.99–0.56, using either a one sample t-test for normal distributions or the Wilcoxon Signed Rank test for non-normal distributions). There were, however, per polyp fecundity differences between sites (Figure 5), with significant differences observed between WTR-S and all sites except WTR-D and EA and between EA and all sites except SR, WTR-D and WTR-S (Table 2).
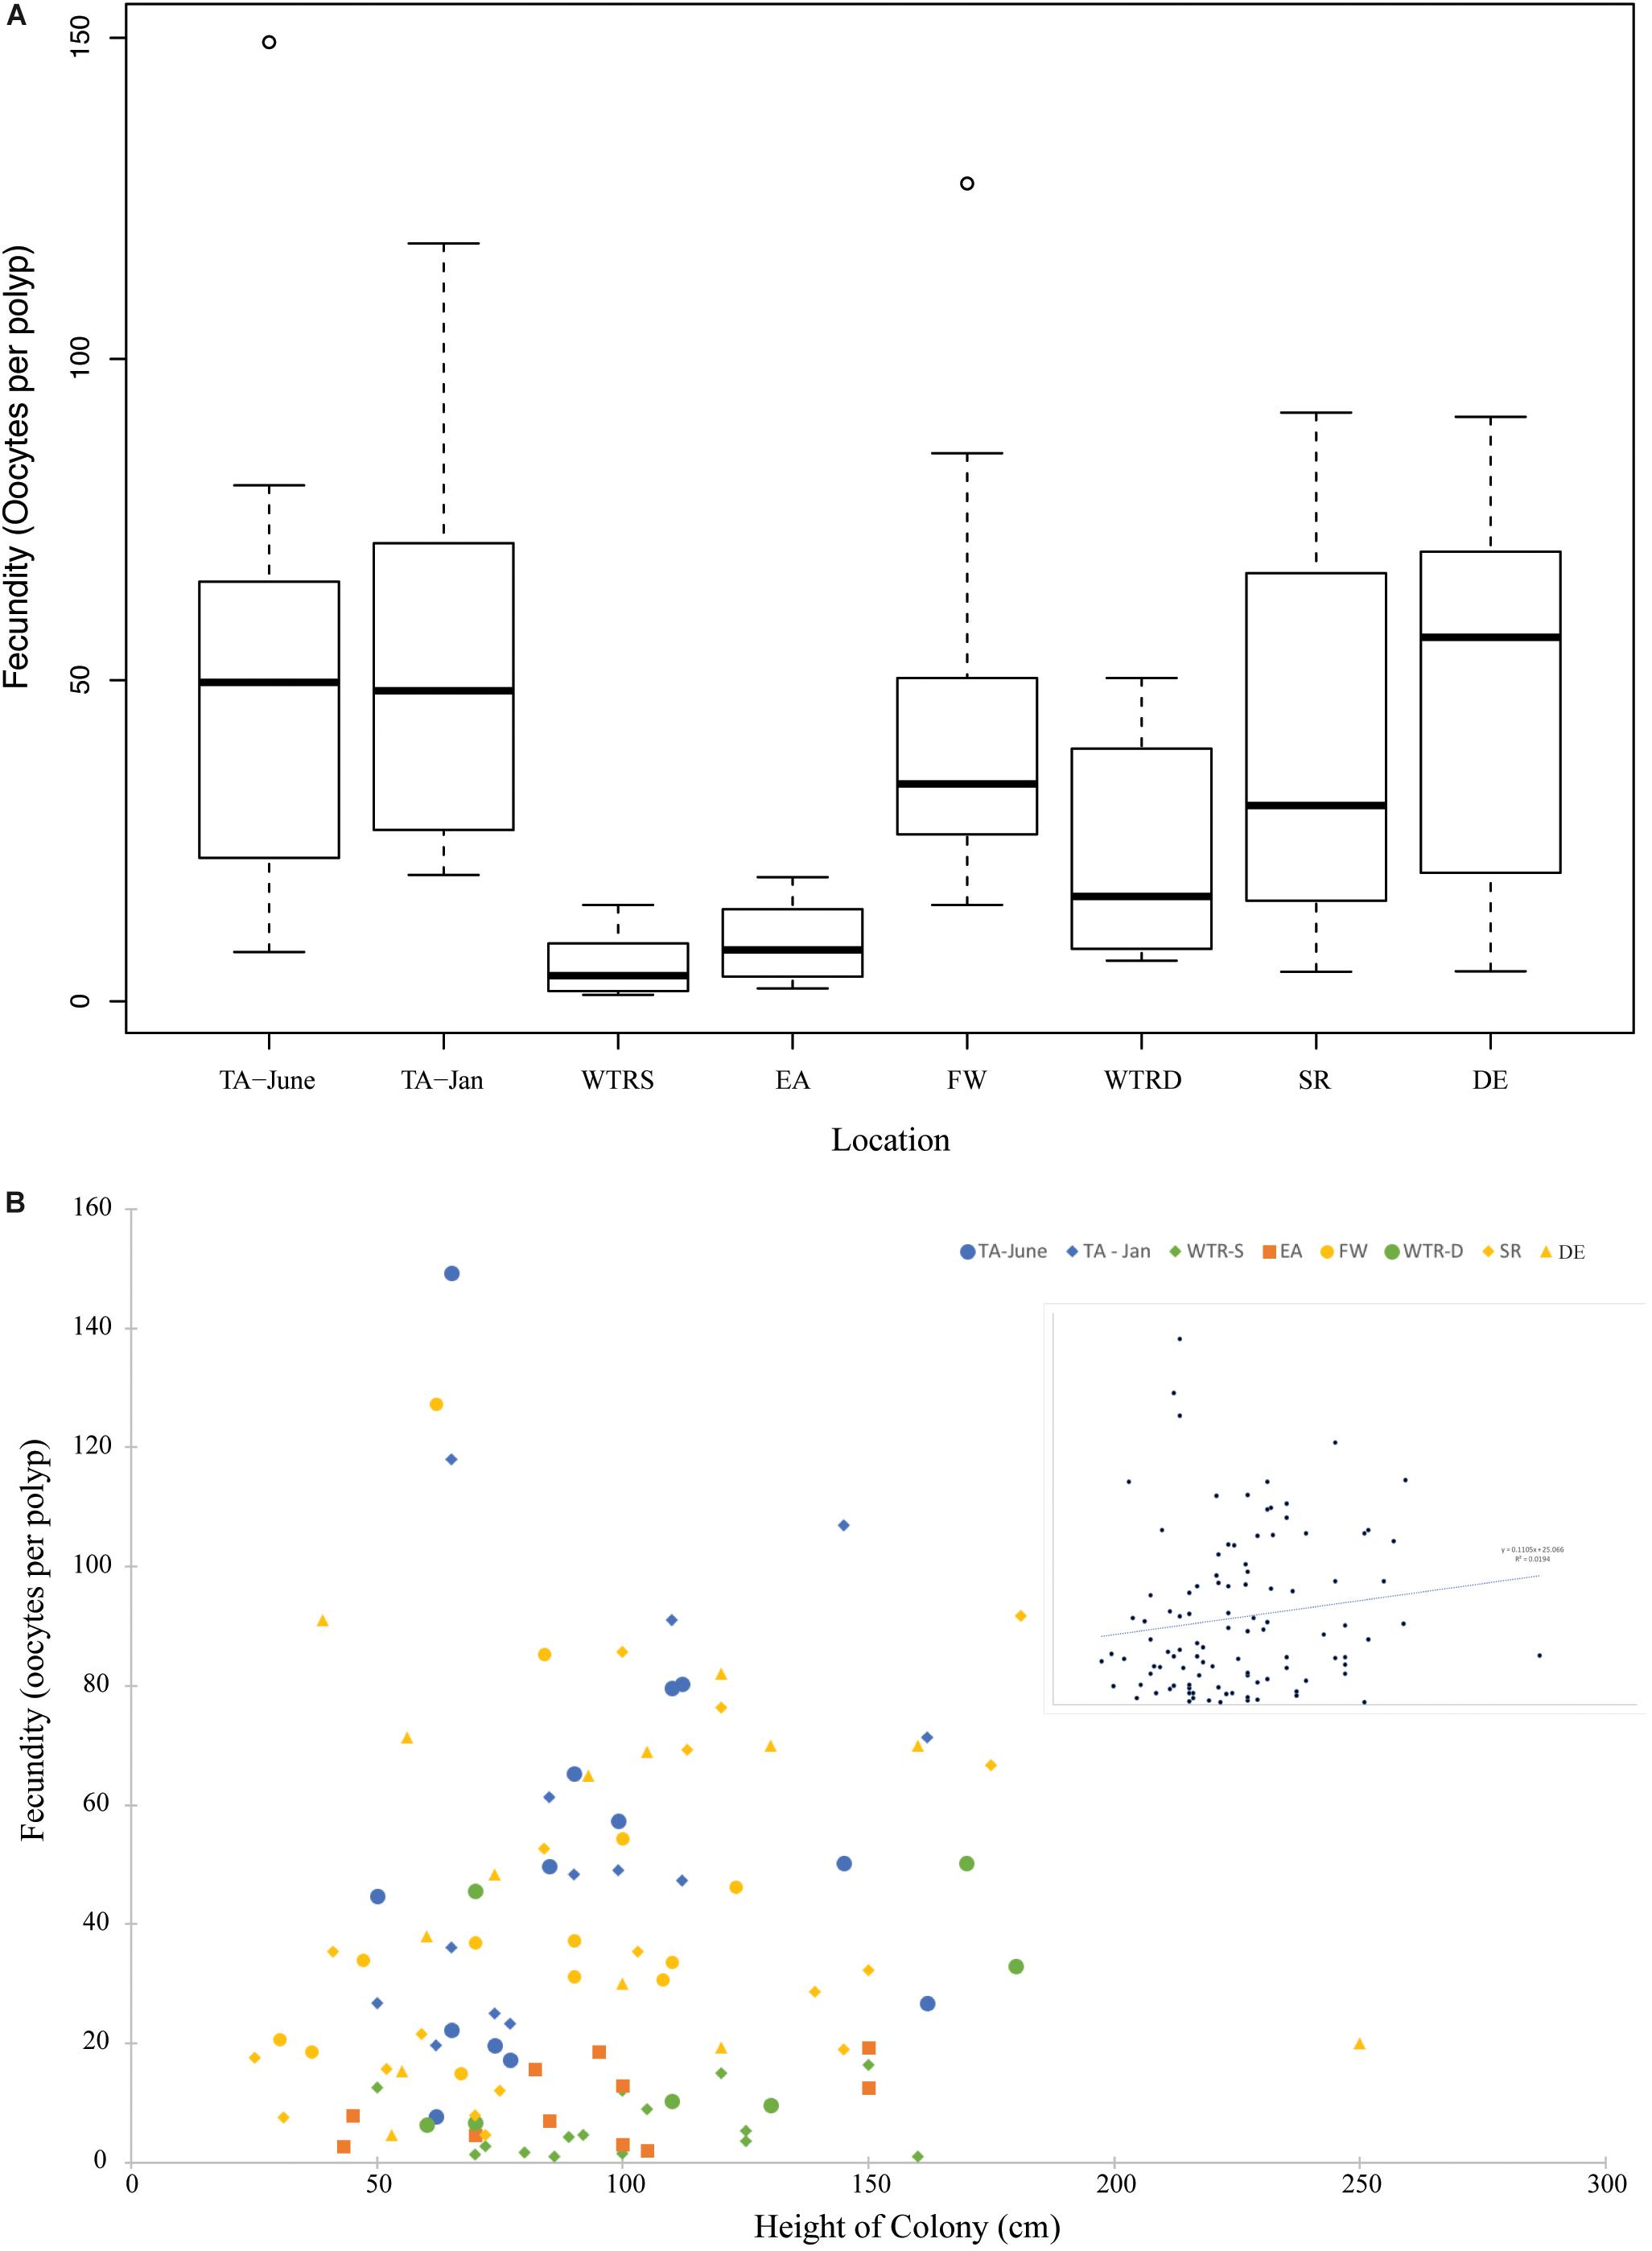
Figure 5. (A) Boxplot showing total fecundity by study site. Sites are arranged from shallowest (left) to deepest (right). (B) The relationship of fecundity and colony height for all females in this study. Colors represent different locations and inset shows relationship for all colonies combined. The trend line is linear.
Average per polyp fecundities were: TA (June), 51.6 oocytes per polyp (oop) (SE ± 15.5); TA (January), 55.7 oop (SE ± 14.5); WTR-S, 6.1 oop (SE ± 3.7); EA, 9.7 oop (SE ± 4.2); FW, 44.0 oop (SE ± 5.9); WTR-D, 23.1 oop (SE ± 4.8); SR, 37.8 oop (SE ± 8.4); and DE, 49.6 oop (SE ± 8.3). Similar to Waller et al. (2014), per polyp fecundity showed an increasing but non-significant trend with size of colony (Figure 5B, R2 = 0.02), and a non-significant trend of higher numbers of oocytes with increasing depth (Supplementary Figure S1, R2 = 0.03).
Spermatocyst Stages
In total, we examined and staged approximately 100 spermatocysts for each of 107 male colonies. Similar to Waller et al. (2014) males had overlapping stages of spermatocysts at all locations (Figure 6), with all four stages of spermatocysts frequently observed within the same polyp. Though similarities in the percent frequency of stages (Figure 6) was evident with location (FW, SR and DE) and with month of collection (TA-January, WTR-S, and WTR-D), there were no statistically significant differences between sample locations (X2r = 0.32, P = 0.988).
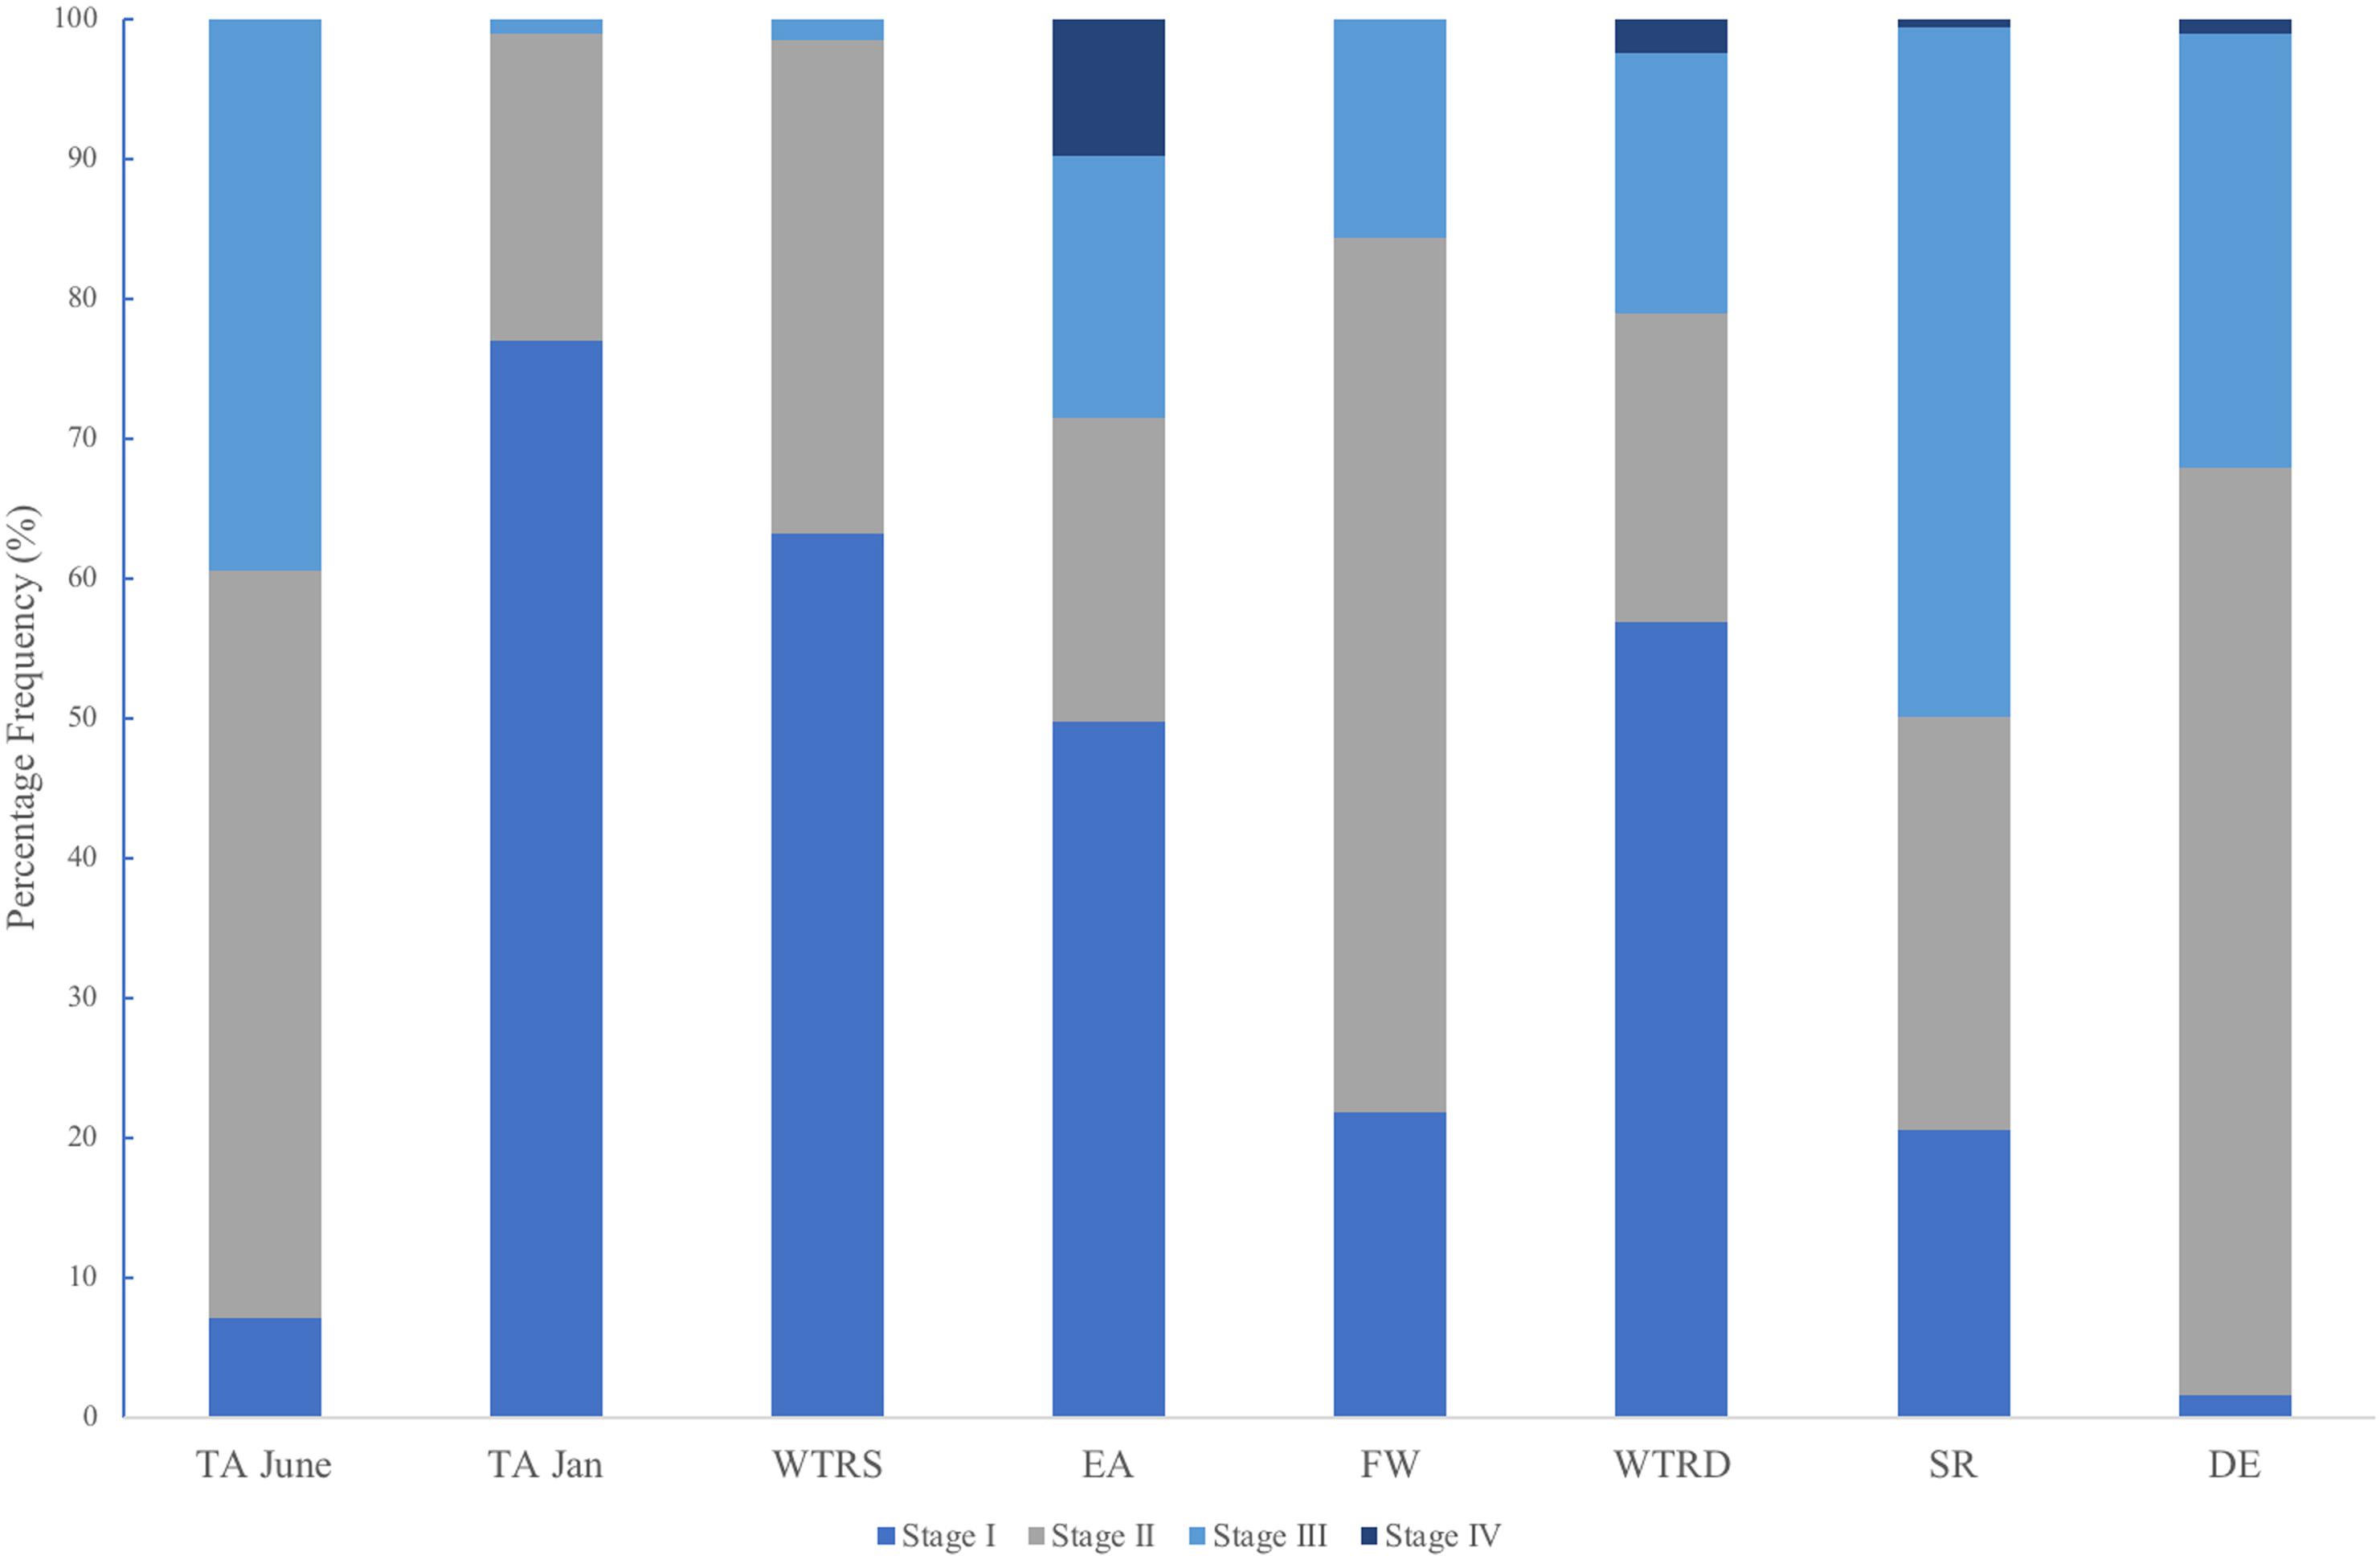
Figure 6. Percent frequency distribution of each spermatocyst stage (I-IV) for each study site. Sites are arranged from shallowest (left) to deepest (right).
Discussion
The reproductive morphology of P. pacifica, as expected, did not deviate from that found in Tracy Arm (Waller et al., 2014). The previous study sampled 38 corals over a period of 16 months (228 data points), whereas this study examined at 250 corals (288 data points). Given that neither hermaphroditism nor larvae were observed in any of the corals examined over these two studies, we now report with confidence that the natural mode of reproduction in this species (across different habitats) is gonochoric broadcast spawning. Gonochorism is uncommon within zooxanthellate corals (e.g., Richmond, 1997), but it is more common in azooxanthellate deep-sea corals (e.g., Waller, 2005; Kahng et al., 2011), and within the Primnoidae in particular (Kahng et al., 2011; Waller et al., 2014; Feehan and Waller, 2015; Rossin et al., 2017). The Waller et al. (2014) study also showed asynchronous timing of gamete maturation and release between colonies within the Tracy Arm population (inferred from disparate oocyte size frequency diagrams within a single month, and the disappearance of larger cohorts of oocytes over all months analyzed). The same variable patterns in oocyte size frequencies within a single timepoint were observed at all sites in this study, spanning broad geographical and bathymetric scales. This suggests that timing of gametogenesis and spawning may not be environmentally influenced (Eckelbarger and Watling, 1995) but may instead be a phylogenetically constrained trait within this species (and potentially genus, e.g., data on P. resedaeformis from the Atlantic shows similar asynchronicity, Fountain et al., 2019). Though knowledge is limited, there are other examples within corals where certain reproductive traits are conserved with changes in depth and/or location (Richmond, 1987; Waller et al., 2002; Flint et al., 2007; Waller and Feehan, 2013; Holstein et al., 2016; Prasetia et al., 2016).
Differences in the maximum height of non-reproductive colonies were however observed across sites in this study (Table 1 and Figure 2). The original study from TA reported a size of 42 cm as the size of first gametogenesis (i.e., appearance of first gametes), however, that study only included a single non-reproductive colony (Waller et al., 2014). Though a systematic review of all colonies within a population is not possible for these habitats due to logistical constraints, a total of 43 non-reproductive colonies were sampled in the present study, with a much broader size range than expected (20–115 cm), and more than 50% of the non-reproductive colonies were over the 42 cm threshold. Some of the larger colonies may have been in poor condition (e.g., a 90 cm coral from EA was noted as being “very spindly”), suggesting that other external pressures may affect the reproductive potential of colonies. There is also the possibility that larger sections of corals may become senescent for unknown reasons, and as just one area of each coral was assessed for this study, this would have been missed. Ecomorphs of P. pacifica have been reported from shallow fjords that might represent colonies in poor health and living at the edge of their physiological tolerance (Stone and Mondragon, 2018), and thus this large non-reproductive colony from EA might be such an example. It should be noted however, that not all non-reproductive colonies showed evidence of damage or stress (e.g., the 115 cm coral from EA appeared to be healthy). Environmental stress has been shown to reduce reproductive output in corals (Kojis and Quinn, 1984; Tomascik and Sander, 1987) as limited energy resources are allocated between base physiological processes (e.g., reproduction, homeostasis and somatic growth) and contending with stressors (e.g., predation, injury, sedimentation). EA (42%, 115 cm) and WTR-S (40%, 95 cm) had the highest percentage of and largest non-reproductive corals (Table 2). These two sites are the shallow fjord sites closest to the tide-water glaciers and the corals there would experience higher seasonal oceanographic variability including temperature (discussed below), heavy sedimentation from glacial meltwater, and lowered surface salinity from heavy autumnal rainfall in comparison to the more stable conditions at the deep-water sites in the Gulf of Alaska.
The wide size range of non-reproductive colonies found in this study brings into question whether a single size for the onset of gametogenesis can be established for this species, and whether it may vary between locations, as size is an important species-specific reproductive characteristic. Corals are thought to be at a reproductive advantage if they postpone the onset of reproduction until they attain large size, as larger corals have been shown to have lower mortality rates (Highsmith, 1982; Hughes and Jackson, 1985; Hughes and Connell, 1987), have higher colonial fecundities (Hughes and Cancino, 1985; Soong, 1992; Waller et al., 2014), and potentially invest more in reproduction than in growth that slows with age (Soong, 1992). Given there was no significant difference in the size of non-reproductive colonies between sites in this study (aside from potentially TA, SR and DE which had too few colonies for analysis), this study proposes the “average size of the onset of gametogenesis” would be 53 cm. Axial (i.e., height) growth rates were estimated for P. pacifica colonies from DE and ranged from 1.60–2.32 cm per year (Andrews et al., 2002). Using this growth rate we estimate a range of 23–33 years for age at onset of gametogenesis, adding to previous work showing that this species is slow growing (Andrews et al., 2002; Aranha et al., 2014), slow to reproduce (Waller et al., 2014) and thus particularly vulnerable to both anthropogenic and natural stressors.
The more unanticipated finding of this study was that P. pacifica produces significantly larger oocytes at our deep sites compared to our shallow sites. The average oocyte sizes from all our sites (per colony) ranged from 85 – 310 μm, demonstrating a nearly four-fold difference in average diameters (averaging all oocytes regardless of vitellogenic state). However, when taking into account only the most mature oocytes within the colonies, the maximum oocyte sizes per colony show even larger differences. The maximum oocyte diameter from EA was 221 μm (the smallest maximum observed); 802 μm from TA (which was more representative of our shallow sites) and 2102 μm from DE (our largest deep site). This represents a nearly ten-fold difference in oocyte sizes between EA and DE, and a nearly three-fold difference between TA and DE. Though oocyte size differences within a species have been reported (review in Jaeckle, 1995; Laptikhovsky, 2006) it is uncommon, and to our knowledge this is the largest intraspecific variability in mean oocyte size reported amongst any phylum. For example, George et al. (1990) examined the sea urchin Arbacia lixula from two different populations and found small but significant differences in mean oocyte size (3.7 μm). Similarly, small differences in oocyte size have been reported at small spatial scales for intertidal mussels from California (Phillips, 2007), polychaetes from the Mediterranean (Simonini and Prevedelli, 2003), bivalves from Florida (Barber and Blake, 1983) and multiple species of echinoderms (reviewed in George, 1996). Indeed many early reports of poecilogony (e.g., where a single species produces different oocyte sizes and/or different larval types) were actually incidences of cryptic or sibling species (i.e., multiple versus shared ancestors; Levin et al., 1991; Knowlton, 1993; Levin and Bridges, 2001) and so this trait is thought to be rare. Given that sibling species are relatively ubiquitous across many marine phyla, including the Cnidaria (reviewed in Knowlton, 1993), and can be morphologically similar or even indistinguishable (Mayr and Ashlock, 1991), it may be that P. pacifica contains morphologically similar sibling species. Additional evidence, such as genetic or physiological differences, may confirm this hypothesis.
Parental investment in producing larger oocytes does have benefits including increased target size for successful fertilization (Levitan, 2006) and increased potential fitness of offspring (Smith and Fretwell, 1974; Hartmann et al., 2013). High energy allocation to reproduction is usually a trade-off however, since larger oocytes typically result in lowered fecundity (Smith and Fretwell, 1974; Levitan, 2006). Yet in P. pacifica this pattern was not observed. WTR-S and EA fecundities showed statistical differentiation from most other sites, but were similar to one another (Table 2), while TA polyp fecundities (in both seasons) showed no statistical differences from the Gulf of Alaska deep sites. All azooxanthellate corals (Waller et al., 2002; Flint et al., 2007; Waller and Feehan, 2013) and most zooxanthellate species (Richmond, 1987; Holstein et al., 2016; Prasetia et al., 2016) studied to date display reduced fecundity with increasing depth. However there are exceptions. Mesophototic populations of the zooxanthellate scleractinian Orbicella spp. (Holstein et al., 2015) has significantly greater per polyp fecundity than populations at shallow depths. Holstein et al. (2015) suggest that deeper waters at this location (US Virgin Islands) may be less energy limited and more stable with less disturbance and environmental stress than shallow ecosystems, allowing this greater investment in numbers of oocytes.
For species within a genus, temperature is often implicated to control changes in oocyte sizes - following both Thorson’s Rule and Rass’s Rule – with oocyte size increasing with decreasing temperatures (reviewed in Laptikhovsky, 2006; Moran and McAlister, 2009). However the trend we see with P. pacifica is a reversal of these theories, with the smallest oocytes being seen in EA (4.55°C) and TA (3.78°C in June), and the largest oocytes found at the Gulf of Alaska sites (FW, 6.33°C; SR, 5.43°C; and DE, 5.62°C). Stone and Mondragon (2018) reported full-year temperature records for both Holkham Bay (TA, with additional CTD measurements of Endicott Arm) and Glacier Bay National Park and Preserve (East Arm, WTR-S) that show similar seasonal patterns. Both sites cool through the summer months (likely owing to glacial melt water) and are warmer in the winter, though Tracy Arm is considerably cooler with average temperatures of 4.4°C compared to 6.4°C at WTR-S, and low temperatures near 3.5°C in TA and near 4.8°C at WTR-S (Table 3, Stone and Mondragon, 2018). Similarly, temperature probes deployed at FW and SR for a 1-year period (August 2013–2014 – Table 3) show warming over the winter months and cooling in the summer, but with temperatures in the cool periods remaining higher than in the fjords (FW lowest at 5.57°C in May and highest at 7.18°C in November; SR lowest at 5.30°C in August and highest at 7.65°C in December). Overall the deep sites experience temperature ranges up to 4°C, whereas the fjord environments only experience differences up to 3°C over the course of a year, indicating comparative stability in the fjords, at least in terms of temperature. The effects of salinity on reproduction of marine invertebrates have been less studied than water temperature (see review in Moran and McAlister, 2009), however, some crustaceans produce larger oocytes in estuarine environments with lower salinity (Skadsheim, 1989; Gimenez and Anger, 2001). The deep-water populations we studied are well below the halocline year-round and in stable high-salinity waters (range at time of sampling 33.17–34.08 psu) whereas the shallow-water fjord sites are often above the halocline and subjected to lower salinity during periods of high glacial melt and rainfall (Waller et al., 2014; Stone and Mondragon, 2018). The opposite trend to these studies (Moran and McAlister, 2009) occurred in this study, however, where corals from the higher salinity deep sites produced larger oocytes than their shallow-water counterparts.
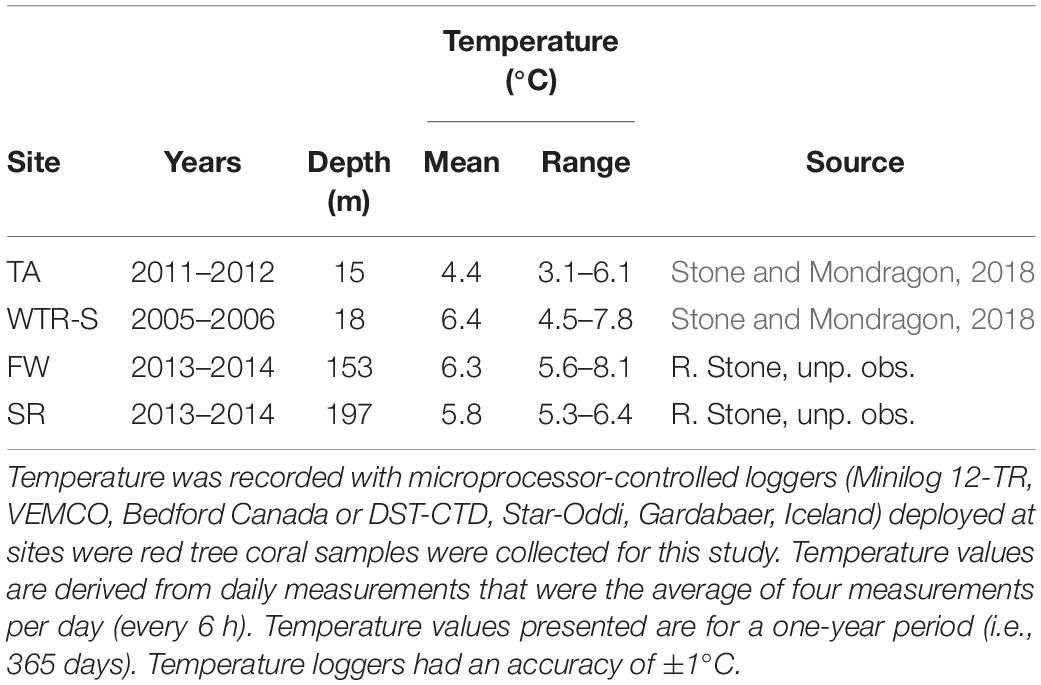
Table 3. Annual mean water temperature and range recorded at four sites in the eastern Gulf of Alaska.
Food quality and availability are also frequently implicated as a control for changes in oocyte sizes (George, 1996), and that could to some degree explain our observations. In this study, larger females from deeper locations produced larger oocytes (though not statistically significant), and although food availability to the deep sea is usually regarded as limited compared to shallow-water environments, the fjords present an entirely different ecosystem. The fjord areas that were sampled for this study (WTR-S, WTR-D, TA and EA) are all heavily glacially influenced sites, where substantial sedimentation and strong stratification of the water column can limit food availability (i.e., phytoplankton biomass) in shallow waters (Etherington et al., 2007). This could be a factor in the smaller oocytes observed in the fjords, however, this strong stratification could also lead to increased food fall to deeper areas, where vertically migrating plankton area may be trapped deep and die off, and so we would have expected to see more dissimilarity in oocyte sizes between WTR-S and WTR-D, which was not observed. It should also be noted that while it is generally regarded that larger oocytes represent a higher maternal investment, and therefore higher energy content and increased potential for reproductive success (Jaeckle, 1995), McAlister and Moran (2012) found this not to be the case with three genera of urchins. In that study, larger oocyte sizes did not necessarily constitute more energy availability, and given food is usually more limited at depth (Gage and Tyler, 1991) the larger oocytes observed in this study may not be influenced by energy availability for reproduction.
Waller et al. (2014) studied the same 38 colonies in Tracy Arm for a 16-month period (6 individual time-periods, with no intra-colonial differences), so the maximum oocyte size observed during that period (802 μm) likely represents the “real” maximum oocyte size for that site. Given the dynamic environmental variability of glacial fjords corals might produce larger oocytes during periods of more favorable conditions that occur infrequently or even at decadal scales. These events seem likely to be rare (given their absence over 16 months) and may be associated with more permanent changes in the fjord habitats (e.g., grounding glaciers). Indeed, the addition of the WTR sites to this study provided comparisons of both shallow and deep areas within the same fjord system, at the same latitude and longitude, and at the same time period (something not available from the Holkham Bay Sites). Results from this study showed these two sites in GBNPP to have statistically similar patterns of oogenesis, oocyte sizes, per polyp fecundity and spermatogenesis (Figure 5). WTR-D colonies did however, have higher per polyp fecundity than colonies from WTR-S and given that size ranges of colonies were similar at both depth zones at this location, and that there is only a weak relationship with either height of colony or depth with numbers of oocytes (Figure 5), we suggest that the difference in oocyte numbers is due at least in part to more favorable environmental conditions for reproduction at depth. It should also be noted that in this study no intra-colonial analysis was completed at our different sites due to logistical constraints. Although no reproductive variability within colonies was observed in the Tracy Arm study (Waller et al., 2014), it is not unfeasible that in different locations there may be differences in colony structuring with regards to reproduction. Sampling just the distal tips, though standard across the sites, may have therefore missed uneven distribution in reproductive areas. Though this species has been shown to be asynchronous, seasonal data from colonies in each location would be ideal to tease out patterns of spawning events as observed in Tracy Arm (Waller et al., 2014).
The differences in oogenesis observed between sites for P. pacifica are noteworthy and warrant further study. Certainly the availability of food to the corals via flux of particulate organic matter and consequent energy for reproduction is likely not equal for all sites we investigated. Indeed, while red tree corals have emerged to shallow depths in the fjords where oceanographic conditions are favorable, they may be residing at the edge of their physiological tolerances (Stone and Mondragon, 2018). The fjord populations had the smallest oocytes and so may be stressed beyond the limits of successful reproduction. Poecilogony, while not previously reported for any species of coral worldwide, may be a strategy that works for populations of P. pacifica. Though this species does not appear to conform with the basic principles of either Thorson’s or Rass’s rules of temperature dependence, there may be other confounding environmental factors contributing to the large range in oocyte size. What may have started as simple phenotypic plasticity of reproductive characteristics (i.e., oocyte size), could now be leading to micro-, or even macro-, evolution in these environments and eventually to speciation (sensu Laptikhovsky, 2006). Given the environmental variability between our locations, it is also plausible that episodic influxes of larvae settled in the fjords as the glaciers retreated and habitat became available, creating populations that then became isolated over time from Gulf of Alaska populations, providing the setting for allopatric speciation.
Conclusion
We studied the reproductive biology of Primnoa pacifica from eight population data sets in the eastern Gulf of Alaska using standardized laboratory methodology. To our knowledge, this represents the broadest reproductive dataset for any single species of cold-water coral in the world. The goal of this study was to examine reproduction of this species across a gradient of depth and associated environmental change and to observe species-specific changes, or shifts, of reproductive ecology with geographical location. We were able to compare our findings, specifically regarding the timeline of reproductive events, with those from a previous comprehensive study (Waller et al., 2014). Our findings, however, were unexpected. Rather than finding shifts in reproductive timing or per polyp fecundity (which remained the same) we observed a nearly fourfold difference in oocyte size, an observation both rare and to our knowledge never reported in a single species and questions whether successful fertilization is regularly occurring within the fjord populations. We propose two possible interpretations for our findings – (1) P. pacifica has high phenotypic plasticity with respect to allocation of energy resources to oogenesis. This would allow this species to utilize environments efficiently through poecilogony, and raises questions about whether this truly represents an evolutionary shift to a subspecies or sibling species. And (2) the fjord populations are currently at a reproductive “dead end.” Larvae have entered the fjords, settled successfully and established populations, but are unable to attain sufficient energy resources to produce optimum sized oocytes for successful reproductive events to occur (or to occur regularly). Further molecular genetics studies and detailed studies of seasonality and larval morphology and dynamics are warranted to evaluate which one of these interpretations is the most likely scenario for these important keystone species, especially in an era of rapidly changing climate and oceanography.
Data Availability Statement
The raw data supporting the conclusions of this manuscript will be made available by the authors, without undue reservation, to any qualified researcher.
Author Contributions
RW and RS contributed to the conception and design of the study, and collected all samples for this study. LR and RW performed the statistical analysis. LR, JJ, AR, KF, and EH performed the laboratory analysis of samples. CM provided molecular context for these data. RW wrote the first draft of the manuscript with RS and LR writing sections. All authors contributed to the manuscript revision, and read and approved the submitted version.
Funding
The research cruises that supported the collections and the laboratory analyses were funded by NOAA’s Alaska Fisheries Science Center (WE-133F-12-SE-1502, WE-133F-14-SE-3544, and WE-33F-13-SE-1847 to RS and RW), NOAA’s Deep-Sea Coral Research and Technology Program to RS, and NOAA’s Office of Ocean Exploration (NA14OAR0110267 to RW, RS, and CM). The Glacier Bay National Park and Preserve samples were collected under authority of the National Park Service (permit GLBA-2016-SCI-0002) and the Tracy Arm and Endicott collections were authorized under Alaska Department of Fish and Game (permits CF-11-010, CF-12-009, CF-14-031).
Conflict of Interest
The authors declare that the research was conducted in the absence of any commercial or financial relationships that could be construed as a potential conflict of interest.
Acknowledgments
This large amalgamation of data sets could not have been made possible without the help of many people. We thank Captain Dan Foley and crew of the FV Steller (TA, 2011 and 2012), Ocean Science Services and the captain and crew of the FV Alaska Provider (DE and SR, 2013), Captain Jim deLaBruere and crew of the Alaska Department of Fish and Game RV Medeia (EA, 2014), Pelagic Research Services and the captain and crew of the RV Dorado Discovery (DE, SR, and FW, 2015), and the captain and crew of the MV Norseman II (WTR, 2016) for their assistance with the research cruises that made these collections possible. We also thank the many Darling Marine Center (University of Maine) summer undergraduate interns who have come through the Waller Laboratory since 2010 and aided in the mammoth job of processing, slicing, and staining all these samples. Many thanks to Stephen Cairns for identifying these species, and for continuing to humor our requests to reidentify samples when reproductive data became available. Many thanks to Jennifer Mondragon and David Csepp for assistance with specimen collection and field preparation, and Michele Masuda for crafting Figure 1. Kevin Eckelbarger and Jon Havenhand pre-reviewed this manuscript, and, along with Will Jaeckle, also provided constructive comments and conversation on this reproductive puzzle. The findings and conclusions in this report are those of the author(s) and do not necessarily represent the views of the National Marine Fisheries Service (NOAA). Any use of trade, firm, or product names is for descriptive purposes only and does not imply endorsement by the U.S Government.
Supplementary Material
The Supplementary Material for this article can be found online at: https://www.frontiersin.org/articles/10.3389/fmars.2019.00709/full#supplementary-material
FIGURE S1 | (A) Fecundity for each female arranged by colony depth; (B) The relationship between height of all colonies (both male and female) in this study. Both trend lines are linear.
References
Andrews, A. H., Cordes, E., Mahoney, M. M., Munk, K., Coale, K. H., Cailliet, G. M., et al. (2002). Age, growth and radiometric age validation of a deep-sea, habitat-forming gorgonian (Primnoa resedaeformis) from the Gulf of Alaska. Hydrobiologia 471, 101–111.
Aranha, R., Edinger, E., Layne, G., and Piercey, G. (2014). Growth rate variation and potential paleoceanographic proxies in Primnoa pacifica: insights from high-resolution trace element microanalysis. Deep Sea Res. Part 2 Top. Stud. Oceanogr. 99, 213–226. doi: 10.1016/j.dsr2.2013.07.001
Barber, B. J., and Blake, N. J. (1983). Growth and reproduction of the bay scallop Argopecten irradians (Lamarck) at its southern distributional limit. J. Exp. Mar. Biol. Ecol. 66, 247–256. doi: 10.1016/0022-0981(83)90163-6
Barrie, J., and Conway, K. (1999). Late quaternary glaciation and postglacial stratigraphy of the northern pacific margin of canada. Q. Res. 51, 113–123. doi: 10.1006/qres.1998.2021
Cairns, S. D. (2011). A revision of the primnoidae (octocorallia:acyonacea) from the aleutian islands and bering Sea. Smithson. Contrib. Zool. 634:55.
Cairns, S. D., and Bayer, F. M. (2005). A review of the genus Primnoa (Octocorallia: Gorgonacea: Primnoidae), with the description of two new species. Bull. Mar. Sci. 77, 225–256.
Cordeiro, R., Van Ofwegen, L., and Williams, G. (2019). World List of Octocorallia. Available at: http://www.marinespecies.org/aphia.php?p=taxdetails&id=125321 (accessed June, 2019).
Dunn, O. J. (1964). Multiple comparisons using rank sums. Techometrics 6, 241–252. doi: 10.1080/00401706.1964.10490181
DuPreez, C., and Tunnicliffe, V. (2011). Shortspine thornyhead and rockfish (Scorpaenidaea) distribution in response to substratum, biogenic structures and trawling. Mar. Ecol. Prog. Ser. 425, 217–231. doi: 10.3354/meps09005
Eckelbarger, K., and Watling, L. (1995). Role of phylogenetic constraints in determining reproductive patterns in deep-sea invertebrates. Invertebr. Biol. 114, 256–269.
Etherington, L. L., Hooge, P. N., Hooge, E. R., and Hill, D. F. (2007). Oceanography of glacier bay alaska: implications for biological patterns in a glacial fjord estuary. Estuaries Coasts 30, 927–944. doi: 10.1007/bf02841386
Feehan, K. A., and Waller, R. G. (2015). Notes on reproduction of eight species of eastern pacific cold-water octocorals. J. Mar. Biol. Assoc. U.K. 95, 691–696. doi: 10.1017/S0025315415000053
Flint, H., Waller, R. G., and Tyler, P. A. (2007). Reproductive ecology Fungiacyathus marenzelleri from 4100 m depth in the northeast Pacific Ocean. Mar. Biol. 151, 843–849. doi: 10.1007/s00227-006-0539-2
Fountain, C. T., Waller, R. G., and Auster, P. J. (2019). Individual and population level variation in the reproductive potential of deep-sea corals from different regions within the gulf of maine. Front. Mar. Sci. 6:172. doi: 10.3389/fmars.2019.00172
Fox, J., and Weisberg, S. (2011). An {R} Companion to Applied Regression, 2nd Edn, Thousand Oaks CA: Sage Publications.
Gage, J., and Tyler, P. A. (1991). Deep Sea Biology: A Natural History of Organisms at the Deep-Sea Floor. Cambridge: Cambridge University Press.
George, S. B. (1996). Echinoderm egg and larval quality as a function of adult nutritional state. Oceanol. Acta 19, 297–308.
George, S. B., Cellario, C., and Fenaux, L. (1990). Population differences in egg quality of Arbacia lixula (Echinodermata: Echinoidea): proximate composition of eggs and larval development. J. Exp. Mar. Biol. Ecol. 141, 107–118. doi: 10.1016/0022-0981(90)90217-z
Gimenez, L., and Anger, K. (2001). Relationships among salinity, egg size, embryonic development, and larval biomass in the estuarine crab Chasmagnathus granulata Dana, 1851. J. Exp. Mar. Biol. Ecol. 260, 241–257. doi: 10.1016/s0022-0981(01)00258-1
Hartmann, A. C., Marhaver, K. L., Chamberland, V. F., Sandin, S. A., and Vermeij, M. J. A. (2013). Large birth size does not reduce negative latent effects of harsh environments across life stages in two coral species. Ecology 94, 1966–1976. doi: 10.1890/13-0161.1
Highsmith, R. C. (1982). Reproduction by fragmentation in corals. Mar. Ecol. Prog. Ser. 7, 207–226. doi: 10.3354/meps007207
Holm, S. (1979). A simple sequentially rejective multiple test procedure. Scand. J. Statist. 6, 65–70.
Holstein, D. M., Smith, T. B., Gyory, J., and Paris, C. B. (2015). Fertile fathoms: deep reproductive refugia for threatened shallow corals. Sci. Rep. 5:12407. doi: 10.1038/srep12407
Holstein, D. M., Smith, T. B., and Paris, C. B. (2016). Depth-independent reproduction in the reef coral Porites astreoides from shallow to mesophotic zones. PLoS One 11:e0146068. doi: 10.1371/journal.pone.0146068
Hughes, R. N., and Cancino, J. M. (1985). “An ecological overview of cloning in metazoa. in book: population biology and evolution of clonal organisms,” in An Ecological Overview of Cloning in Matazoa, eds B. C. Jeremy, L. W. Jackson, and R. E. C. Buss, (London: Yale University Press), 153–186. doi: 10.2307/j.ctt2250w9n.8
Hughes, T. P., and Connell, J. H. (1987). Population dynamics based on size or age? Reef Coral Analy. Am. Nat. 129, 818–829. doi: 10.1086/284677
Hughes, T. P., and Jackson, J. B. C. (1985). Population dynamics and the life histories of foliaceous corals. Ecol. Monogr. 55, 141–166.
Jaeckle, W. B. (1995). “Variation in the size, energy content, and biochemical composition of invertebrate eggs: correlates to the mode of larval development,” in Ecology of Marine Invertebrate Larvae, ed. L. McEdward, (Boca Raton, FL: CRC Press), 49–78.
Jones, C. G., Lawton, J. H., and Shachak, M. (1994). Organisms as ecosystem engineers. Oikos 69, 373–386.
Kahng, S. E., Benayahu, Y., and Lasker, H. R. (2011). Sexual reproduction in octocorals. Mar. Ecol. Prog. Ser. 443, 265–283. doi: 10.3354/meps09414
King, M. C., and Beazley, K. F. (2005). Selecting focal species for marine protected area network planning in the scotia-fundy region of atlantic Canada. Aquat. Conserv. 15, 367–385. doi: 10.1002/aqc.682
Knowlton, N. (1993). Sibling species in the sea. Annu. Rev. Ecolo. Syst. 24, 189–216. doi: 10.1146/annurev.es.24.110193.001201
Kojis, B. L., and Quinn, N. J. (1984). Seasonal and depth variation in fecundity of Acropora palifera at two reefs in papua new Guinea. Coral Reefs 3, 165–172. doi: 10.1007/bf00301961
Krieger, K. J. (2001). “Coral (Primnoa) impacted by fishing gear in the Gulf of Alaska,” in Proceedings of the First International Symposium on Deep-Sea Corals, Nova Scotia.
Krieger, K. J., and Wing, B. L. (2002). Megafaunal associations with deepwater corals (Primnoa spp.) in the Gulf of Alaska. Hydrobiologia 471, 83–90.
Kruskal, W. H., and Wallis, W. A. (1952). Use of ranks in one-criterion variance analysis. J. Am. Stat. Assoc. 47, 583–621. doi: 10.1080/01621459.1952.10483441
Laptikhovsky, V. (2006). Latitudinal and bathymetric trends in egg size variation: a new look at thorson’s and rass’s rules. Mar. Ecol. 27, 7–14. doi: 10.1111/j.1439-0485.2006.00077.x
Levene, H. (1960). “Robust tests for equality of variances,” in Contributions to Probability and Statistics, ed. I. Olkin, (Palo Alto, CA: Stanford University Press).
Levin, L. A., and Bridges, T. S. (2001). “Pattern and diversity in the reproduction and development,” in Ecology of Marine Invertebrate Larvae, ed. L. McEdward, (London: CRC Press), 2–48.
Levin, L. A., Zhu, J., and Creed, E. L. (1991). The genetic basis of life-history characters in a polychaete exhibiting planktotrophy and lecithotrophy. Evolution 45, 380–397. doi: 10.1111/j.1558-5646.1991.tb04412.x
Levitan, D. R. (2006). The relationship between egg size and fertilization success in broadcast-spawning marine invertebrates. Integr. Comp. Biol. 46, 298–311. doi: 10.1093/icb/icj025
Masuda, M. M., and Stone, R. P. (2015). Bayesian logistic mixed-effects modelling of transect data: relating red tree coral presence to habitat characteristics. ICES J. Mar. Sci. 72, 2674–2683. doi: 10.1093/icesjms/fsv163
Mayr, E., and Ashlock, P. D. (1991). Principles of Systematic Zoology, 2nd Edn, New York, NY: McGraw-Hill.
McAlister, J. S., and Moran, A. L. (2012). Relationships among egg size, composition, and energy: a comparative study of geminate sea urchins. PLoS One 7:e41599. doi: 10.1371/journal.pone.0041599
Moran, A. L., and McAlister, J. S. (2009). Egg size as a life history character of marine invertebrates: is it all it’s cracked up to be? Biol. Bull. 216, 226–242. doi: 10.1086/bblv216n3p226
Ogle, D. H., Wheeler, P., and Dinno, A. (2018). FSA: Fisheries Stock Analysis. R Package Version 0.8.22. Available at: https://github.com/droglenc/FSA (accessed June, 2019).
Phillips, N. E. (2007). High variability in egg size and energetic content among intertidal mussels. Biol. Bull. 212, 12–19. doi: 10.2307/25066576
Power, M. E., Tilman, D., Estes, J. A., Menge, B. A., Bond, W. J., Mills, L. S., et al. (1996). Challenges in the quest for keystones. Bioscience 46, 609–620. doi: 10.2307/1312990
Prasetia, R., Sinniger, F., and Harii, S. (2016). Gametogenesis and fecundity of Acropora tenella (Brook 1892) in a mesophotic coral ecosystem in Okinawa Japan. Coral Reefs 35, 53–62. doi: 10.1007/s00338-015-1348-1
Richmond, R. H. (1987). Energetic relationships and biogeographical differences among fecundity, growth and reproduction in the reef coral Pocillopora damicornis. Bull. Mar. Sci. 41, 594–604.
Richmond, R. H. (1997). “Reproduction and recruitment in corals: critical links in the persistence of reefs,” in Life and Death of Coral Reefs, ed. C. Birkeland, (New York, NY: Chapman & Hall).
Rossin, A., Waller, R. G., and Forseterra, G. (2017). Seasonal oocyte maturation in the fjord soft coral Primnoella chillensi (Philippi, 1894). Cont. Shelf Res. 144, 31–37. doi: 10.1016/j.csr.2017.06.010
Rossin, A. M., Waller, R. G., and Stone, R. P. (2019). The effects of in-vitro pH decrease on the gametogenesis of the red tree coral, Primnoa pacifica. PLoS One 14:e0203976. doi: 10.1371/journal.pone.0203976
Shapiro, S. S., and Wilk, M. B. (1965). An analysis of variance test for normality (complete samples). Biometrika 52, 591–611. doi: 10.1093/biomet/52.3-4.591
Simonini, R., and Prevedelli, D. (2003). Effects of temperature on two Mediterranean populations of Dinophilus gyrociliatus (Polychaeta: Dinophilidae). I. Effects on life history and sex ratio. J. Exp. Mar. Biol. Ecol. 291, 79–93. doi: 10.1016/s0022-0981(03)00099-6
Skadsheim, A. (1989). Regional variation in amphipod life history: effects of temperature and salinity on breeding. J. Exp. Mar. Biol. Ecol. 127, 25–42. doi: 10.1016/0022-0981(89)90207-4
Smith, C. C., and Fretwell, S. D. (1974). Optimal balance between size and number of offspring. Am. Nat. 108, 499–506. doi: 10.1086/282929
Soong, K. (1992). Colony size as a species character in massive coral reefs. Coral Reefs 12, 77–83. doi: 10.1007/bf00302106
Stone, R. P., and Cairns, S. D. (2017). Deep-Sea Coral Taxa in the Alaska Region: Depth and Geographical Distribution. Available at: https://deepseacoraldata.noaa.gov/ (accessed June, 2019).
Stone, R. P., Masuda, M. M., and Karinen, J. F. (2014). Assessing the ecological importance of red tree coral thickets in the eastern Gulf of Alaska. ICES J. Mar. Sci. 72, 900–915. doi: 10.1093/icesjms/fsu190
Stone, R. P., and Mondragon, J. (2018). Deep-sea emergence of red tree corals (Primnoa pacifica) in Southeast Alaska glacial fjords. NOAA Prof. Paper NMFS 20:33. doi: 10.7755/PP.20
Tomascik, T., and Sander, F. (1987). Effects of eutrophication on reef-building corals. III: Reproduction of the reef-building coral Porites porites. Mar. Biol. 94, 77–94. doi: 10.1007/bf00392901
Waller, R. G. (2005). “Deep water scleractinians: current knowledge of reproductive processes,” in Cold-water Corals and Ecosystems, eds A. Freiwald, and J. M. Roberts, (Berlin: Springer), 691–700. doi: 10.1007/3-540-27673-4_35
Waller, R. G., and Feehan, K. A. (2013). Reproductive ecology of a polar deep-sea scleractinian Fungiacyathus marenzelleri (Vaughan, 1906). Deep Sea Res. Part 2 Top Stud. Oceanogr. 92, 201–206. doi: 10.1016/j.dsr2.2013.03.006
Waller, R. G., Stone, R. P., Johnstone, J., and Mondragon, J. (2014). Sexual reproduction and seasonality of the alaskan red tree coral, primnoa pacifica. PLoS One 9:e90893. doi: 10.1371/journal.pone.0090893
Waller, R. G., Tyler, P. A., and Gage, J. D. (2002). The reproductive ecology of the deep-sea solitary coral Fungiacyathus marenzelleri (Scleractinia) in the NE Atlantic Ocean. Coral Reefs 21, 325–331.
Keywords: octocoral reproduction, oocyte sizes, deep-sea corals, deep-water emerged, glacial fjords, Primnoidae, poecilogony
Citation: Waller RG, Stone RP, Rice LN, Johnstone J, Rossin AM, Hartill E, Feehan K and Morrison CL (2019) Phenotypic Plasticity or a Reproductive Dead End? Primnoa pacifica (Cnidaria: Alcyonacea) in the Southeastern Alaska Region. Front. Mar. Sci. 6:709. doi: 10.3389/fmars.2019.00709
Received: 13 June 2019; Accepted: 04 November 2019;
Published: 20 November 2019.
Edited by:
Ana Colaço, Marine Research Institute (IMAR), PortugalReviewed by:
Tina Molodtsova, P.P. Shirshov Institute of Oceanology (RAS), RussiaAnnie Mercier, Memorial University of Newfoundland, Canada
Copyright © 2019 Waller, Stone, Rice, Johnstone, Rossin, Hartill, Feehan and Morrison. This is an open-access article distributed under the terms of the Creative Commons Attribution License (CC BY). The use, distribution or reproduction in other forums is permitted, provided the original author(s) and the copyright owner(s) are credited and that the original publication in this journal is cited, in accordance with accepted academic practice. No use, distribution or reproduction is permitted which does not comply with these terms.
*Correspondence: Rhian G. Waller, UmhpYW4ud2FsbGVyQG1haW5lLmVkdQ==