 Glen Gawarkiewicz1*
 Ke Chen1
 Jacob Forsyth1,2
 Frank Bahr1
 Anna M. Mercer3
 Aubrey Ellertson4
 Paula Fratantoni3
 Harvey Seim5Sara Haines5Lu Han5
- 1Department of Physical Oceanography, Woods Hole Oceanographic Institution, Woods Hole, MA, United States
- 2Department of Earth, Atmospheric, and Planetary Sciences, Massachusetts Institute of Technology, Cambridge, MA, United States
- 3NOAA Fisheries, Northeast Fisheries Science Center, National Marine Fisheries Service, Woods Hole, MA, United States
- 4Commercial Fisheries Research Foundation, Saunderstown, RI, United States
- 5Department of Marine Sciences, University of North Carolina at Chapel Hill, Chapel Hill, NC, United States
There has been wide interest in Marine Heatwaves and their ecological consequences in recent years. Most analyses have focused on remotely sensed sea surface temperature data due to the temporal and spatial coverage it provides in order to establish the presence and duration of Heatwaves. Using hydrographic data from a variety of sources, we show that an advective Marine Heatwave was initiated by an event in late December of 2016 south of New England, with temperature anomalies measuring up to 6°C and salinity anomalies exceeding 1 PSU. Similar features were observed off of New Jersey in February 2017, and are associated with the Shelfbreak Front migrating from its normal position to mid-shelf or further onshore. Shelf water of 34 PSU was observed just north of Cape Hatteras at the 30 m isobath and across the continental shelf in late April 2017. These observations reveal that the 2017 Marine Heatwave was associated with a strong positive salinity anomaly, that its total duration was approximately 4 months, and its advective path extended roughly 850 km along the length of the continental shelf in the Middle Atlantic Bight. The southward advective velocity implied by the arrival north of Cape Hatteras is consistent with previous estimates of alongshelf velocity for the region. The origin of this Marine Heatwave is likely related to cross-shelf advection driven by the presence of a Warm Core Ring adjacent to the shelfbreak south of New England.
Introduction
There has been considerable attention focused recently on Marine Heatwaves, which are warm anomalies persisting for days to months and on spatial scales from one to a thousand kilometers or more (Hobday et al., 2016). Further studies have examined the frequency of Marine Heatwaves in the North Pacific and North Atlantic (Scannell et al., 2016), the influence of global warming on the frequency of Marine Heatwaves under various carbon emission scenarios (Frohlicher et al., 2018), significant historical changes globally based on historical data (Oliver et al., 2018), and the contributions of various ocean-atmosphere modes on the global distribution of heatwaves (Holbrook et al., 2019).
While Marine Heatwaves lasting over days may disturb the marine environment, it is the long lasting events that have the most significant impact. The most dramatic recent example in the Northwest Atlantic coastal ocean was the warming of 2012 (Mills et al., 2013; Chen et al., 2014). This event, which lasted over 6 months with ocean temperature anomalies exceeding 2°C, was caused by a northward shift in the atmospheric Jet Stream during winter that resulted in a 50% reduction of heat loss from the ocean to the atmosphere compared to a normal winter (Chen et al., 2014).
As recent technological improvements and deployment of ocean observatories have allowed further examination of shelf and slope processes, it has become apparent that offshore forcing of the continental shelf and slope is becoming more prevalent and that processes driving shelfbreak exchange may be significant contributors to Marine Heatwaves in the Middle Atlantic Bight. Two observational programs that have been particularly important in recent years are the Ocean Observatories Initiative (OOI) Pioneer Array (Gawarkiewicz and Plueddemann, 2019) and the Commercial Fisheries Research Foundation/Woods Hole Oceanographic Institution Shelf Research Fleet (Gawarkiewicz and Malek Mercer, 2019). The Pioneer Array is a multi-scale shelfbreak observatory designed to study shelfbreak exchange processes, while the Shelf Research Fleet utilizes the commercial fishing fleet in Rhode Island to regularly sample the continental shelf using CTDs provided by Woods Hole Oceanographic Institution (WHOI). Data from these two programs have revealed a dramatic warming event in January 2017 south of New England in which warm water fish typically found in the Gulf Stream were caught at the 30 m isobath off Block Island, RI (Gawarkiewicz et al., 2018). The magnitude of the temperature anomaly reached 6°C relative to a monthly climatology of shelf temperature in the region (Fleming, 2016). However, this event was not examined closely in context with historical data from the region, nor was the fate of the warm water flooding the continental shelf established in Gawarkiewicz et al. (2018).
In this study, we examine a broad suite of observations to characterize the origin of the event, compare its statistical properties with a Marine Heatwave definition, and track the fate of the anomalous water mass on the northeast US Shelf. The outline of the paper is as follows. Section “Data Sources and Methods,” describes the data sources used to examine the 2017 event as well as the criteria used to qualify as a Marine Heatwave using limited sub-surface data. The characteristics of the warm and salty anomalies and their duration south of New England are described in section “Shelfbreak Exchange–Initiation of the Marine Heatwave South of New England.” Anomalous conditions subsequently observed over the New Jersey shelf are described in section “The Marine Heatwave Over the New Jersey Continental Shelf.” The fate of the Heatwave is presented in section “The Fate of the Marine Heatwave” using data showing the anomalous water mass over the continental shelf north of Cape Hatteras. A discussion follows, which includes ecosystem effects and directions for future research. The results are briefly summarized in the final section.
Data Sources and Methods
Because of the spatial and temporal extent of this Extreme Shelfbreak Exchange Event, a number of different data sources were used to track the thermohaline anomalies along the length of the Middle Atlantic Bight. These include the Commercial Fisheries Research Foundation/Woods Hole Oceanographic Institution (CFRF/WHOI) Shelf Research Fleet, the Ocean Observatories Initiative Pioneer Array, the CMV Oleander ship of opportunity temperature data set, the National Marine Fisheries Service (NMFS) Ecosystem Monitoring (ECOMON) program, and the National Science Foundation Processes driving Exchange At Cape Hatteras (PEACH) experiment. It is interesting to note that the first identification of this Marine Heatwave event was from Captain Michael Marchetti of the F/V Mister G based in Point Judith, Rhode Island, who emailed photographs and descriptions of unusual conditions and catch to Anna Malek Mercer at CFRF and Glen Gawarkiewicz at WHOI. As reported in Gawarkiewicz et al. (2018), Marchetti noted several unusual species in his catch in January 2017, including Gulf Stream flounder and juvenile black sea bass. Marchetti is a participant in the CFRF/WHOI Shelf Research Fleet, and thus has frequent communications with both CFRF and WHOI.
CFRF/WHOI Shelf Research Fleet
The CFRF/WHOI Shelf Research Fleet was initiated in November, 2014 to enhance interactions between scientists and local communities to discuss adaptation to climate change impacts from the ocean in southern New England. Since then, a fleet of commercial fishing vessels, all based out of Rhode Island, have collected biweekly water column profiles within a region ranging from 40°00′ North to 41°18′ North and 70°30′ West to 71°30′ West. The depth range of the profiles used in the analysis in section “Shelfbreak Exchange–Initiation of the Marine Heatwave South of New England” extended from the 37 to 88 m isobaths. A description of the Shelf Research Fleet activities appears in Gawarkiewicz and Malek Mercer (2019). The domain of Shelf Research Fleet sampling appears in Figure 1.
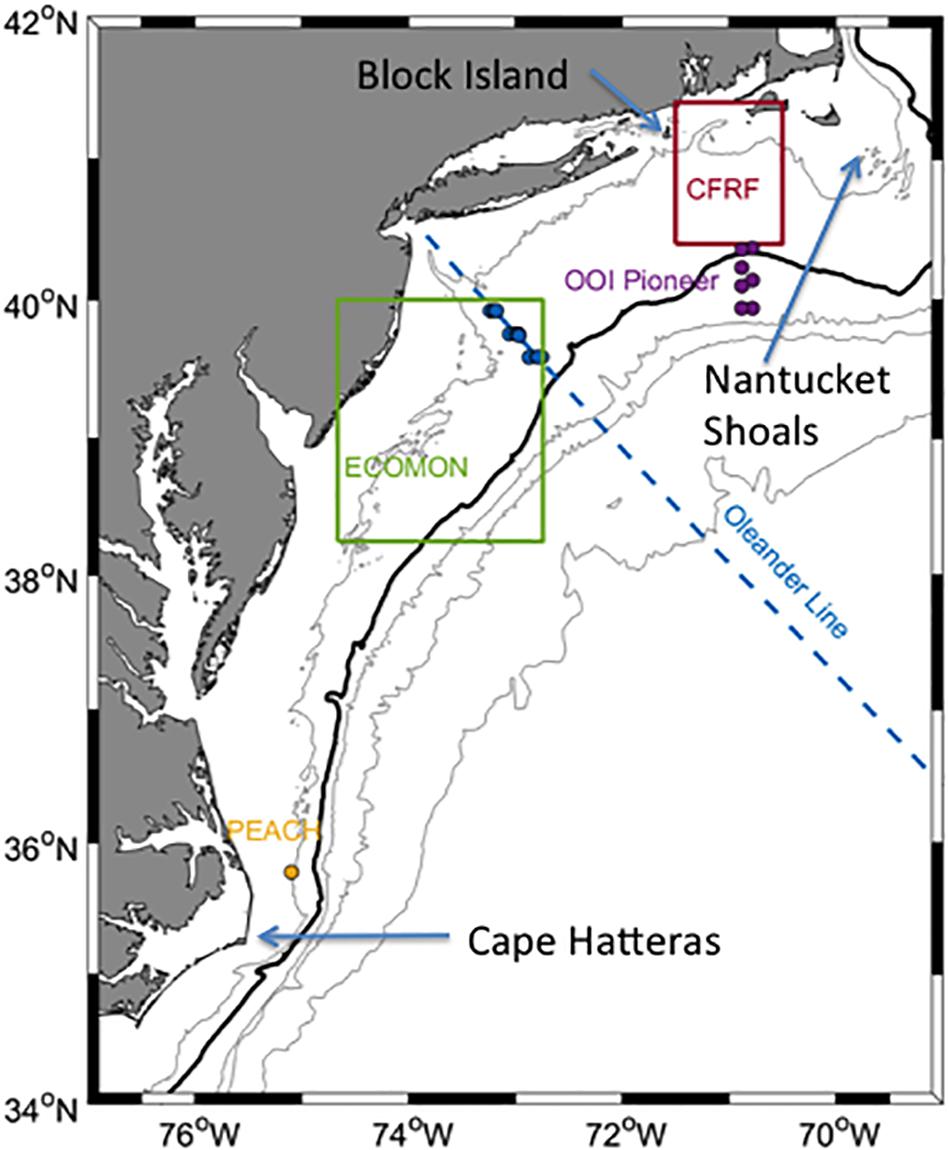
Figure 1. A map of the Middle Atlantic Bight showing the locations of the primary data sources used in the analysis. The Commercial Fisheries Research Foundation (CFRF)/WHOI Shelf Research Fleet operational area is denoted by the red box south of New England. Moorings from the OOI Pioneer Array are indicated by the purple circles. The region comprising the ECOMON profiles from February 2017 is denoted by the green rectangle. The blue dashed line indicates the path of the CMV Oleander, with the XBT stations used marked with blue circles. The B1 mooring from the PEACH mooring array is denoted by the orange circle just north of Cape Hatteras. The cross-shelf hydrographic transect from PEACH in April 2017 was at the same latitude as the B1 mooring. The 40, 100 m (bold line), 1000, 2000, and 3000 m isobaths are indicated by the contour lines offshore.
Participant fishing vessels are trained to use the RBR Concerto CTD to collect water column profiles. The CTDs are routinely rotated and calibrated at RBR facilities in Ontario, Canada. Typical accuracy of the data for this particular CTD is ± 0.03 mS/cm and ± 0.002°C. The two primary considerations driving this choice of instrument were the high degree of accuracy as well as the wireless data communications that enable real-time plotting and viewing of profiles on an iPad without connecting cables to the CTD. Further details on the use of CTDs by the Shelf Research Fleet appear in Gawarkiewicz and Malek Mercer (2019).
Profiles of temperature and salinity sampled by commercial fishers as part of Shelf Research Fleet sampling were examined for December 2016 and January/February 2017. Ten profiles were collected in December 2016, 11 in January 2017, and 24 profiles were collected in February 2017.
Historical Hydrographic Data Archive and Sea Surface Temperature
In order to produce statistics on historical temperature and salinity distributions south of New England, we used the World Ocean Database (WOD) 2018 from the National Center for Environmental Information. For southern New England, profiles from January were used to calculate the distribution of depth-averaged temperature and salinity to compare to data collected by the Shelf Research Fleet during January 2017. Historical profiles from 40°24′ North to 41°18′ North and 71°30′ West to 70°30′ West were included, spanning the northern edge of the Shelf Research Fleet operational area south to the latitude at which frequent excursions of the Shelfbreak Front were no longer evident in the historical data (40°24′ North). Forsyth et al. (2015) have shown that enhanced warming in the Middle Atlantic Bight (over the New Jersey shelf) has occurred since 2004. We wished to explicitly compare the 2017 warm event to conditions that occurred before the recent decadal warming. Thus we use all the historical profiles in WOD 2018 before 2004 for comparisons.
The profiles within the historical archive for the months of January through March extend from 1940 to 1996 within the region defined by the sampling domain of the Shelf Research Fleet north of the typical range of variability of the Shelfbreak Front. For the purposes of comparison, the historical data was limited to 40°24′ North to 41°18′ North and 70°30′ West to 71°30′ West.
For the purposes of calculating anomalies for temperature and salinity, the four-dimensional climatology compiled by Fleming (2016) is used. The climatological fields are monthly and are gridded onto a three dimensional field using a weighted least squares regression technique. The climatological fields, named MOCHA (Middle Atlantic Climatological and Hydrographic Atlas) are also described in Levin et al. (2018).
The cross-shelf temperature and salinity fields from MOCHA along 71°00′ West in January appear in Figure 2. The Shelfbreak Front is the area of pronounced gradients extending offshore from the 100 m isobath. Typical shelf temperature values in January range from 4 to 7°C and typical shelf salinities are in the range of 32–34 PSU. For the purposes of interpretation, we take the inshore boundary of the Shelfbreak Front to be the 10°C isotherm and the 34.0 PSU isohaline. Slope Water is present offshore of the Shelfbreak Front with typical temperatures of 12–14°C and salinities greater than 35.0 PSU.
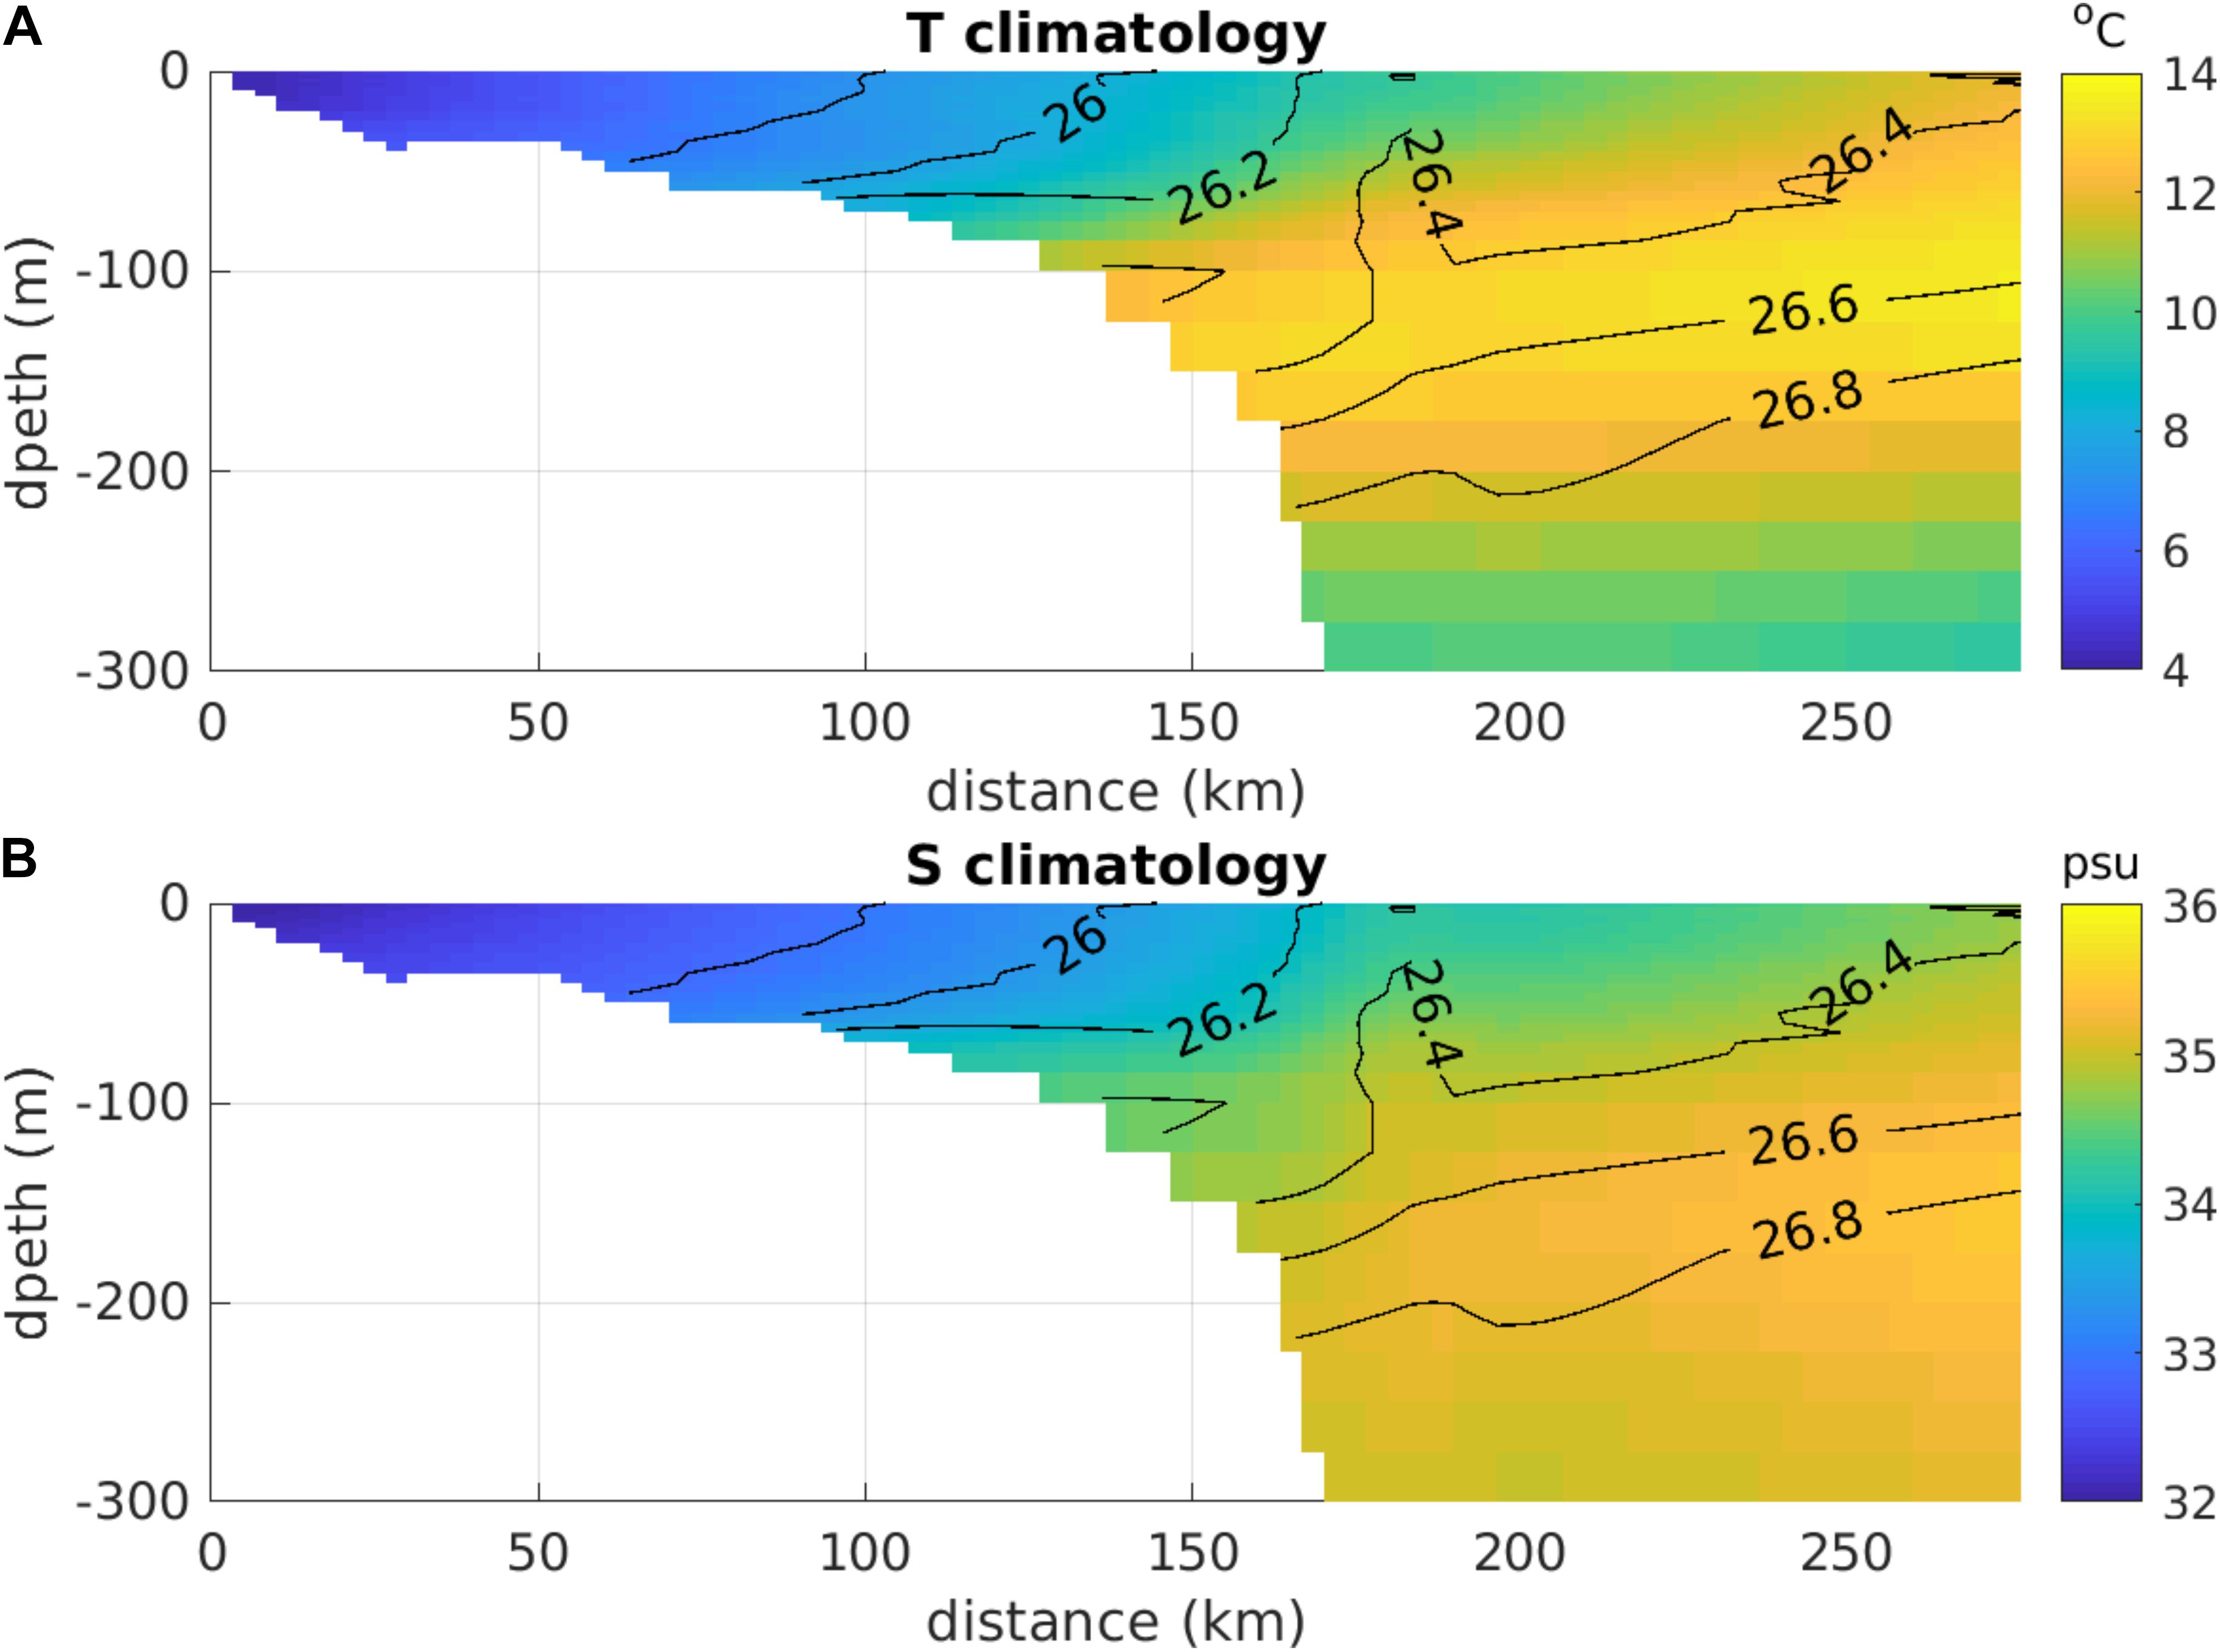
Figure 2. Cross-shelf sections of Climatological mean temperature (A) and salinity (B) in January across the continental shelf and slope south of New England along 71°00′ West. The black contour lines indicate isopycnals. Units are Degrees Centigrade for temperature, Practical Salinity Units for salinity, and kg/m3 for density.
A common feature in recent years south of New England are Warm Core Rings abutting the continental shelf. These have substantially increased in numbers since 2000 (Gangopadhyay et al., 2019). The rings are anti-cyclonic with typical diameters of 50–100 km and lifetimes on the order of months. Water mass properties include temperatures near 18°C and salinities greater than 35.5 PSU for rings nearing the edge of the continental shelf.
The SST images are based on the Advanced Very High Resolution Radiometer (AVHRR) unmasked data provided by the Mid-Atlantic Regional Association Coastal Ocean Observing System (Dr. Matthew Oliver, University of Delaware)1.
Long-Term Ship of Opportunity Temperature Measurements Off New Jersey
To trace the Marine Heatwave through the New Jersey shelf, we utilize the CMV Oleander datasets. The CMV Oleander is a container ship that traverses a round trip from New Jersey to Bermuda every week (Figure 1). Since 1977, expendable bathythermographs (XBTs) have been deployed from the Oleander creating a consistent and continuous record of temperature across the shelf and to the Gulf Stream. XBTs are deployed along the line approximately 14 times a year, generally once a month during January for the time period of analysis. Here we restrict the XBT data set to the shelf region, only using data collected between the 40 m isobath and the 80 m isobath, the latter corresponding with the climatological position of the foot of the shelfbreak front (Linder and Gawarkiewicz, 1998). For comparison with the New England shelf data we consider data from the months of January to March from 1977 to 2017 as our baseline to calculate Heatwave statistics. This baseline includes 24 cross-shelf transects of XBT data. Four transects were occupied during the period of the event, including January 14th, January 21st, February 18th, and March 18th in 2017. We also use thermosalinograph (TSG) data from January to March to track surface salinity and temperature changes through the New Jersey Bight. Data from the CMV Oleander have been previously used to describe the variability of the shelf and slope velocity structure (Flagg et al., 2006) as well as recent accelerated warming over the New Jersey shelf (Forsyth et al., 2015).
The Ecosystem Monitoring Program in the Middle Atlantic Bight
The Ecosystem Monitoring program (ECOMON) is a long term hydrographic and ecosystem monitoring program that has been in operation since 1992. Earlier efforts with joint hydrographic and plankton sampling in this region extend back to the 1970s. It is conducted under the auspices of the Oceans and Climate Branch of NOAA’s Northeast Fisheries Science Center in Woods Hole, MA. Typically two of the ECOMON cruises in a given year are conducted jointly with bottom trawl surveys and four of the surveys involve both hydrographic and plankton sampling.
Cruises normally involve stratified sampling with CTD profiles at 120 randomly selected stations and 35 stations at fixed locations in the northeast. The geographical coverage extends from Cape Hatteras in the south through the Gulf of Maine and Georges Bank.
In February 2017, an ECOMON cruise on the R/V Henry Bigelow collected 23 CTD profiles over the New Jersey continental shelf in water depths ranging from 13 to 196 m. The profiles were collected between February 12 and 16, 2017.
The Processes Driving Exchange at Cape Hatteras (PEACH) Experiment
In addition to the long-term observational programs described above, a National Science Foundation sponsored experiment, the Processes driving Exchange at Cape Hatteras (PEACH) experiment was initiated in April 2017 with hydrographic sampling and mooring deployments from the R/V Neil Armstrong. The cruise occurred from April 15 to 29. Two cross-shelf CTD transects were sampled along 35°45′ North on April 18 and 25, 2017. Sampling was conducted with a SeaBird 911 + CTD.
A surface meteorological buoy with CTDs at 3 and 15 m depths was deployed at 35°46.7′ North and 75°05.7′ West on April 17; a small bottom frame with CTD and ADCP was deployed on the 30 m isobath directly adjacent to the surface buoy. The time series from this mooring, designated B1 for this experiment, extended for 18 months until November 2018. Data from B1 is used to examine the progression of the anomalous water mass to the Cape Hatteras region, where it is evident as a salinity anomaly but only a mild temperature anomaly (section “The Fate of the Marine Heatwave”).
Methodology for Identifying Marine Heatwave Status for the Sub-Surface
The methodology for identifying Marine Heatwaves, initially formulated by Hobday et al. (2016), is problematic for the analysis of sub-surface data. There is significantly less sub-surface data than surface temperature data, so that the resolution in both time and space is orders of magnitude less than satellite-sensed surface temperature values. Two key criteria for the prior method are the use of a 30s year record and the use of a climatology with daily resolution. For sub-surface data, 30 years records are limited and daily resolution would likely be obtainable only from mooring records and not from hydrography.
We choose to present for our baseline the time period 1940 to 1996 because this is the time period for which there is January data south of New England in the WOD data archive (we note that there is no January data between 1997 and 2004, which was when the warming rate increased substantially). January is a particularly bad month in terms of the number of CTD profiles available in the WOD archive.
Fortunately, for the New Jersey shelf, we have data through the present and can use the data from the CMV Oleander for the time period from the start of the record (1977) through the present which extends through the significant warming period as described in Forsyth et al. (2015).
The WOD archive is used for calculating the percentile of the present observations compared to the statistics of the historical data. For calculating anomalies, we use the climatology compiled by N. Fleming (Fleming, 2016; Levin et al., 2018). This climatology calculates monthly averages for the entire Middle Atlantic Bight with a high resolution spatially enabling the detailed comparison for the locations of CTD profiles from 2017. There is a scale mis-match temporally, using monthly averages for the climatology, but this is the best climatological field at present.
We discuss the duration locally in terms of the 5 days duration criterion from Hobday et al. (2016). However, given the very intermittent nature of the hydrographic sampling, it is difficult to precisely define the duration at a specific location. A key point is that this thermohaline anomaly event occurred over a large alongshelf spatial scale, so time scales are both for the local passage as well as the eventual transport offshore north of Cape Hatteras. We also use the criterion of a temperature value above the 90th percentile, consistent with the definition of Hobday et al. (2016).
We explicitly compare the statistics of the 2017 event with the time period before 2004 because of the recent significant warming. As shown in Gawarkiewicz et al. (2018), shelfbreak exchange events with considerable onshore penetration across the continental shelf have occurred since 2014. We wish to understand the 2017 event within the context of a previous state of shelfbreak variability that has been described in the literature and covered by previous large field programs such as the Shelf Edge Exchange Processes program in the early 1980s south of New England. There have clearly been other unusual events in the past 5–10 years, but it is unclear if the sub-surface data have sufficient resolution to place recent individual events in a proper statistical context given the rapid rate of warming for the past decade. The availability of consistent data from the CMV Oleander allows us to use statistics up to the present for the New Jersey shelf as well as to the beginning of the enhanced warming in 2004.
Shelfbreak Exchange–Initiation of the Marine Heatwave South of New England
The Warm Core Ring intrusion that initiated this event was briefly described in Gawarkiewicz et al. (2018) and a review of the data presented there sets the stage for the current analysis. Glider data from the OOI Pioneer Array roughly along the 200 m isobath was used to show that Ring water with a temperature of 15°C was present on January 22–24, 2017. Sea Surface Temperature imagery showed the presence of a large Warm Core Ring abutting the continental shelf south of New England on January 25. The glider data from February 11–13 shows temperatures in the range of 9–13°C, and by March 13–16 the temperature in the top 100 m of the water column was approximately 7°C (see Figure 5 in that paper). Two Shelf Research Fleet CTD profiles were presented to further detail the unusual conditions on the continental shelf south of New England. The first profile, from January 29, had a surface temperature of 10°C and a bottom temperature of 13.5°C, while the profile from February 14 had a well-mixed water column with a temperature of 7°C. The surface salinity value from January 29 was 33.9 PSU and the bottom value was 35 PSU. By February 14 the salinity was well mixed with a value of 33.2 PSU. These data all appear in Figure 5 of Gawarkiewicz et al. (2018). Climatological values of temperature and salinity from Fleming (2016) for January south of New England are 5°C and 33 PSU, so that the anomalies are over 5°C at the surface and 8.5°C at the bottom on January 29. Salinity anomalies were 0.9 PSU at the surface and 2.0 PSU at the bottom. Neither the temporal nor the spatial extent of the anomalies were addressed, nor the statistical properties relative to previous measurements.
Eleven profiles were collected by the Shelf Research Fleet in January 2017. The depth-averaged temperature from these 11 profiles relative to the historical distribution by latitude (north of 40°24′ North) appears in Figure 3A. Seven of the 11 profiles from January 2017 exceed 10°C. The 11 profiles were collected between January 1 and January 31. The profile collected at 41°03′ North is particularly striking with a value of 11.6°C while the historical range does not exceed 7.5°C.
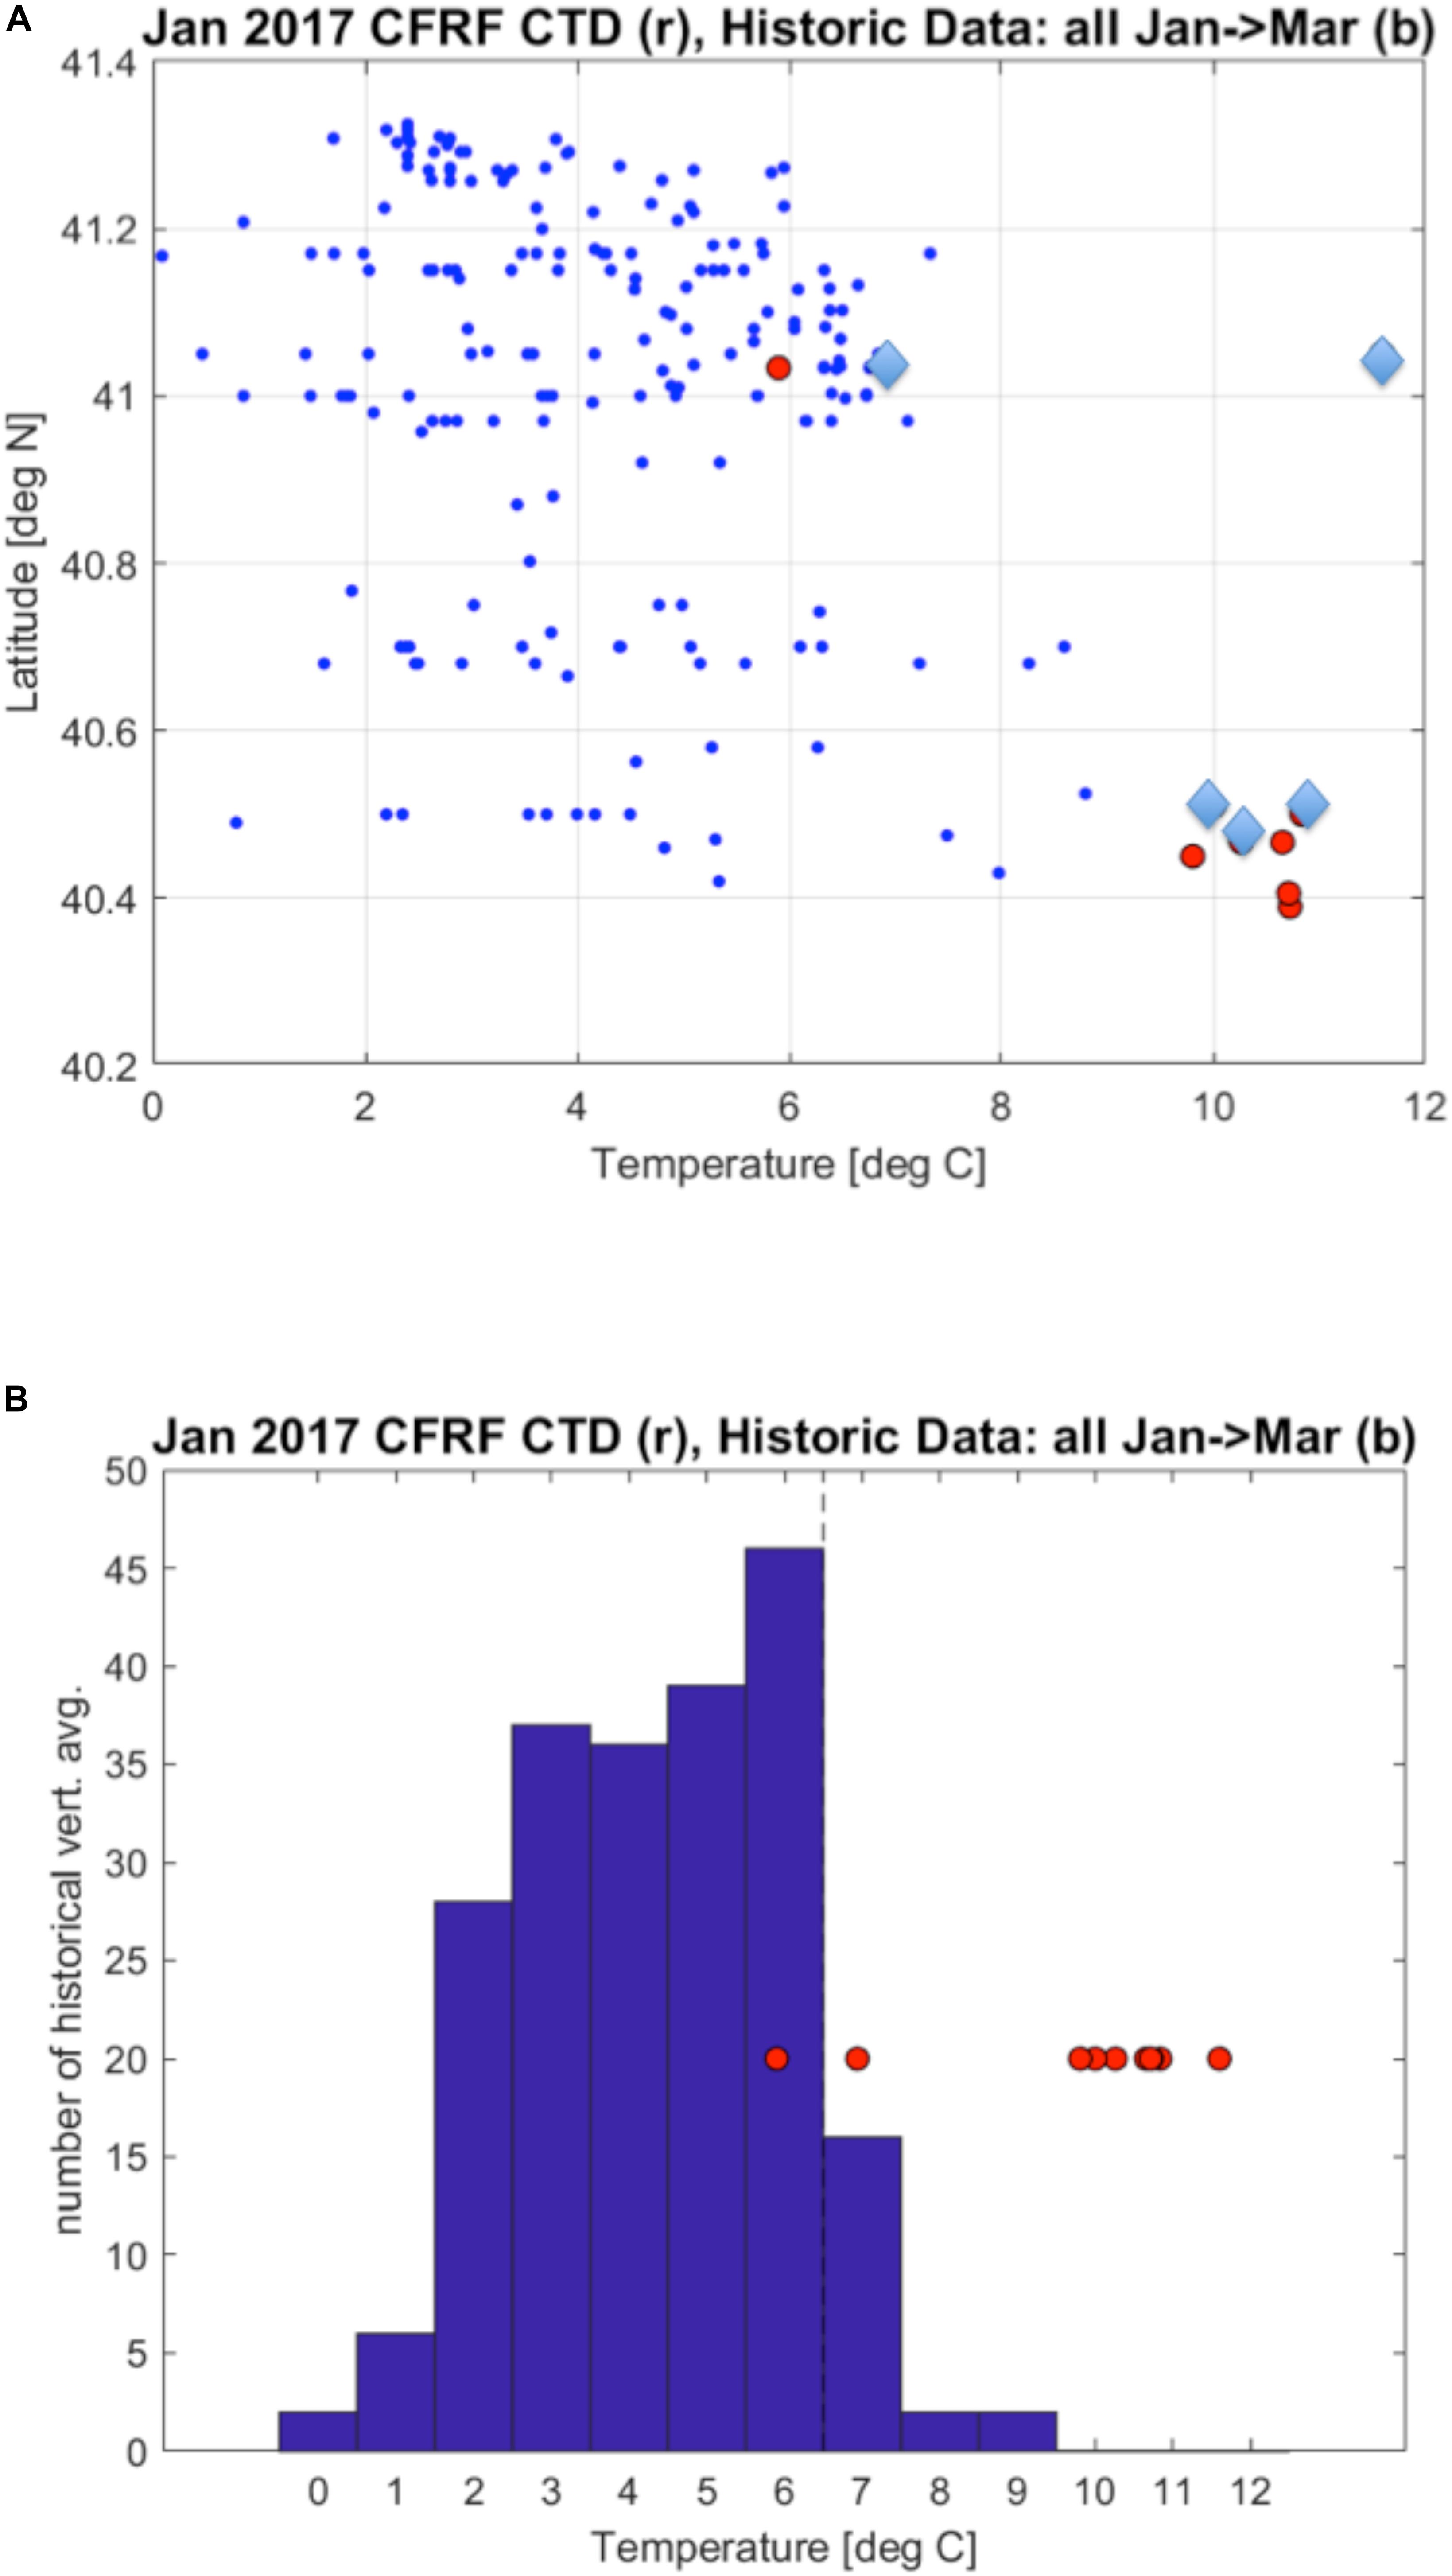
Figure 3. (A) Latitudinal distribution of historical depth averaged temperature (blue circles) and January 2017 (red circles) from the Shelf Research Fleet. Values from January 2017 for which the positions are uncertain are denoted by the blue diamonds. (B) A histogram of historical depth-averaged temperatures compared to depth averaged values from January 2017 (red circles). The dashed line indicates the 90th percentile for the temperature in January–March for the historical data.
The January 2017 values relative to the distribution of historical depth-averaged temperature data (January-March) appear in Figure 3B. The histogram is segmented into 1°C bins centered at integer values, with the most common value being centered at 6°C. The seven warmest profiles, that exceed 10°C, are above the 98th percentile of the historical values. Two of the coldest values of the month appear on January 29 and 30 (6.1°C) indicative of colder shelf water starting to sweep into the Shelf Research Fleet sampling area in 2017.
The distribution of depth-averaged salinity values for January 2017 versus the historical values appears in Figure 4A. Six of the 11 profiles show salinities exceeding 34.0 PSU, with one profile at 41°03′ North with a value of 34.1 PSU. Only two of the historical profiles show values exceeding 34 PSU in this latitude range.
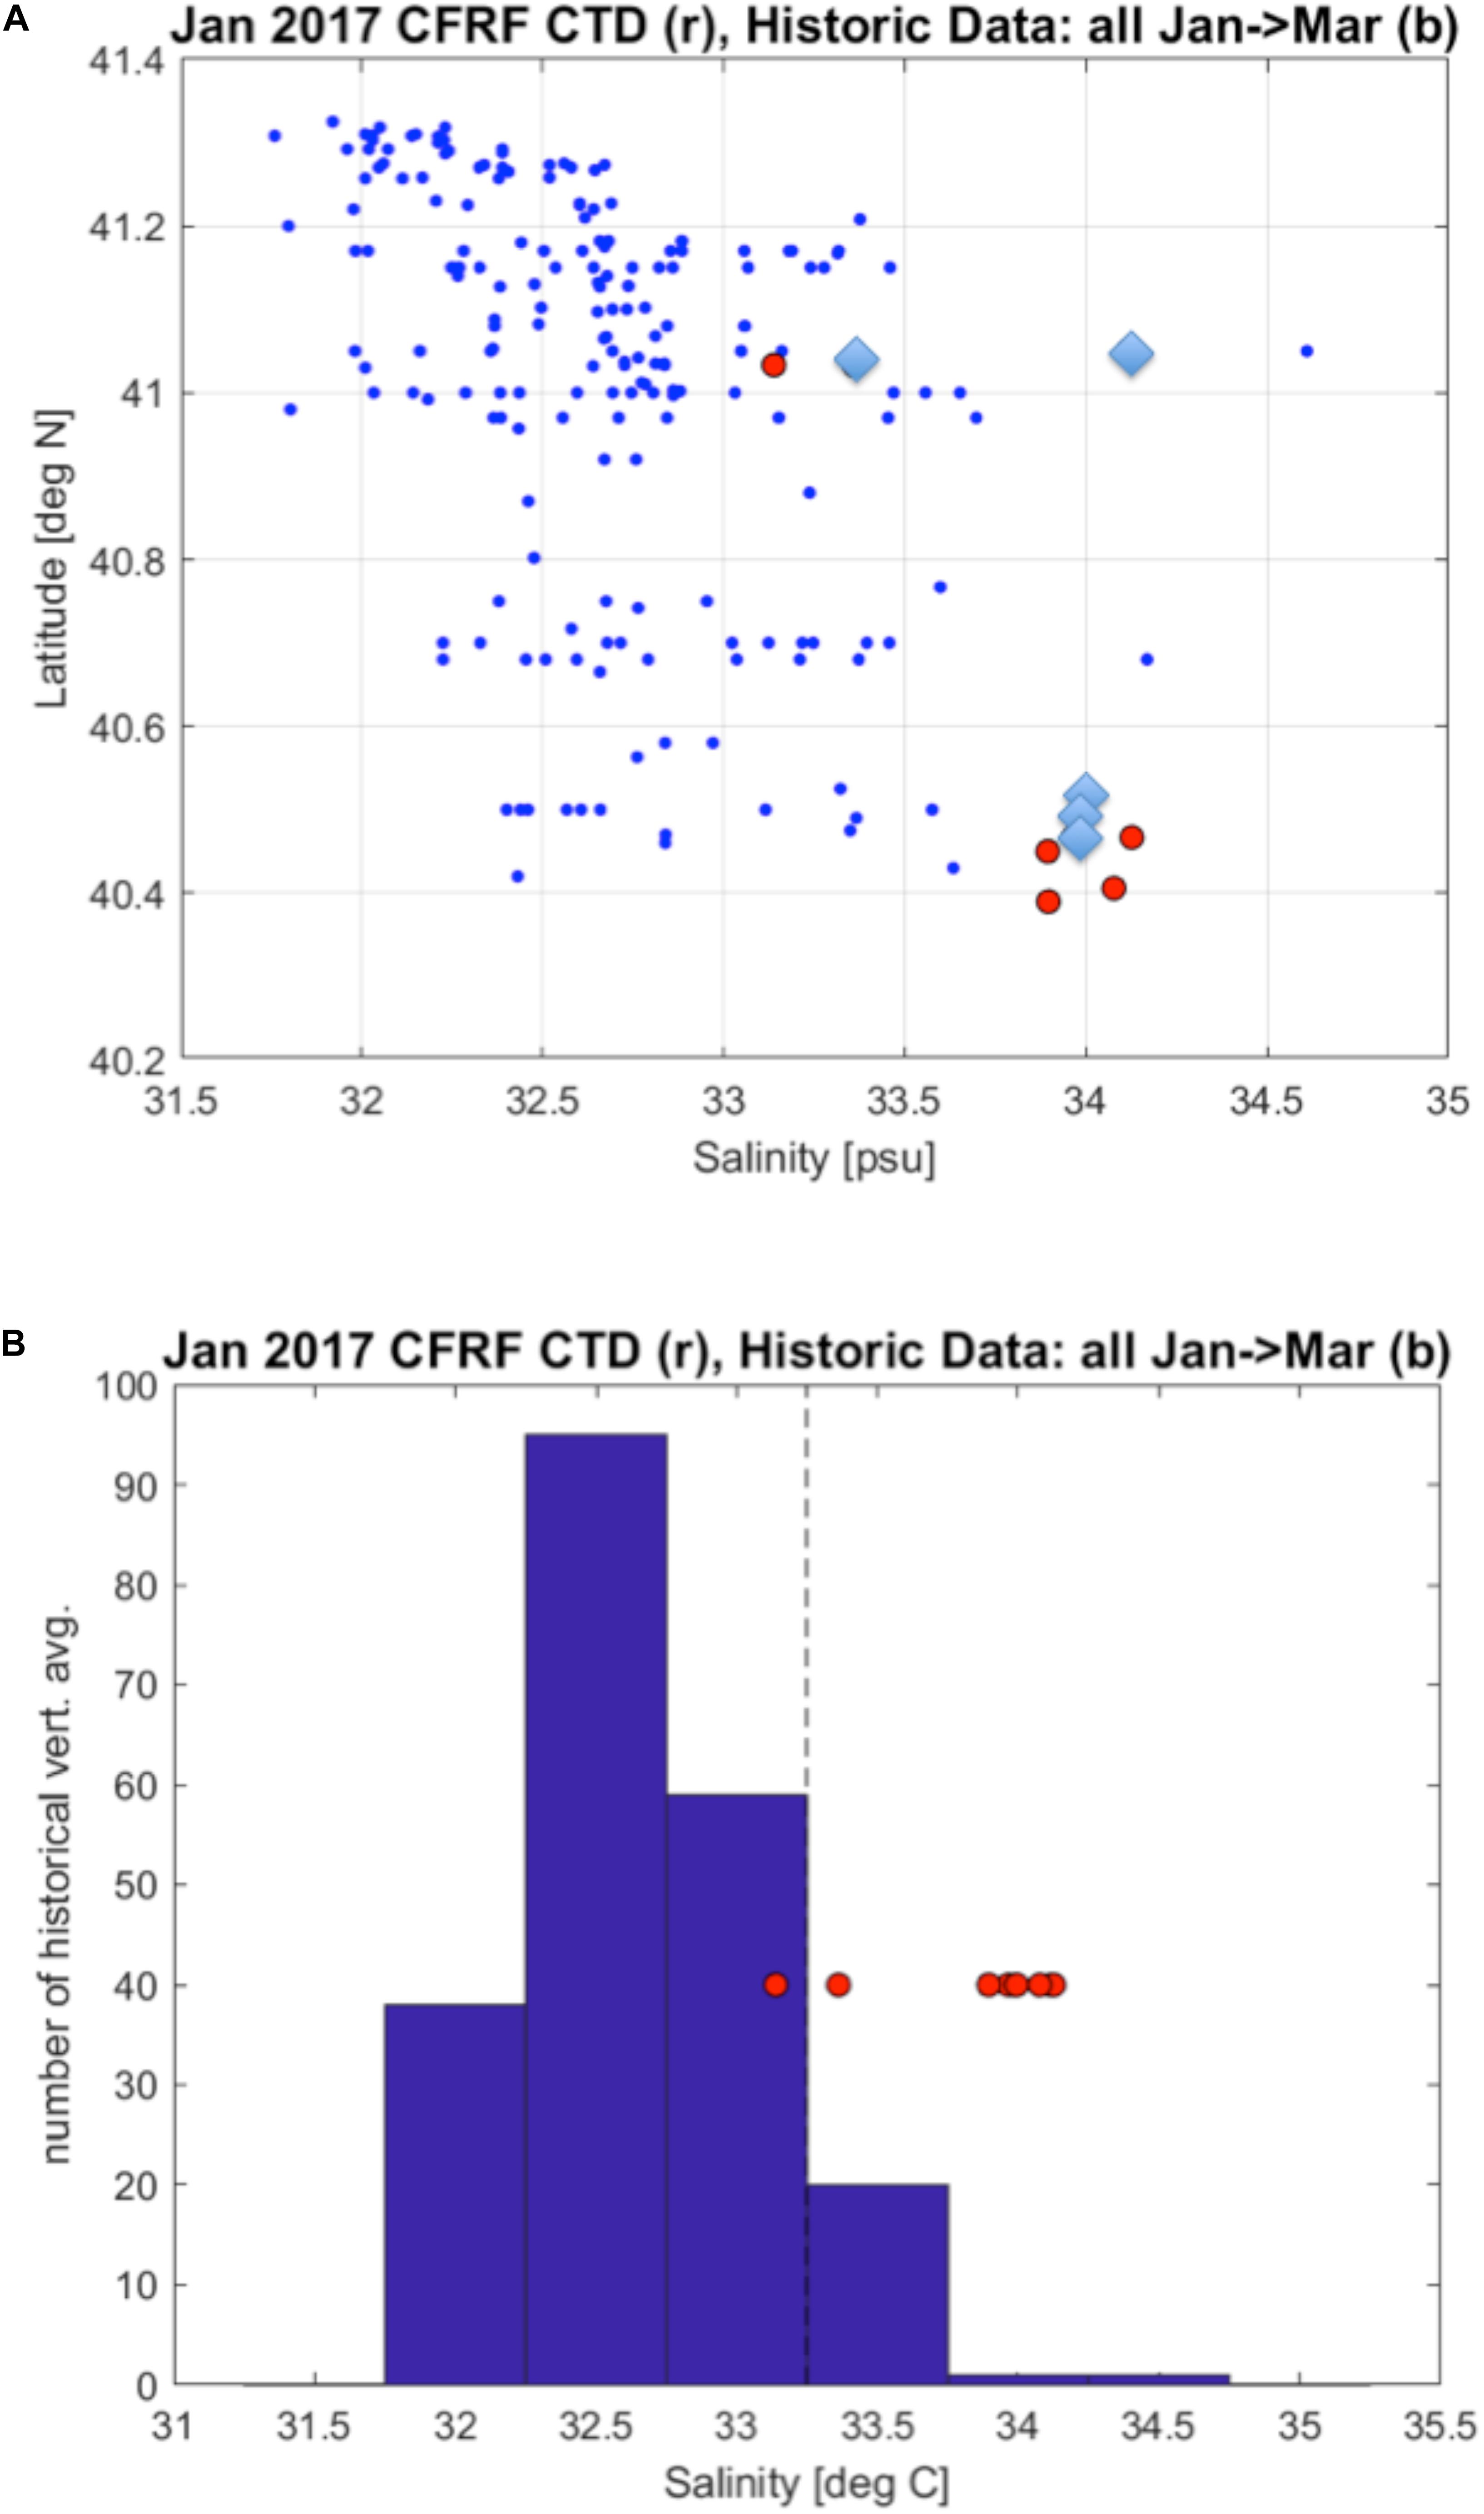
Figure 4. Same as in Figure 3 but with depth-averaged salinity.
There are a cluster of profiles with salinities above 33.8 PSU that occur above the 97th percentile of the historical values (Figure 4B). For both the temperature and salinity values, the January 2017 profiles exceed the 90th percentile, and the duration extends through all of January. Thus, the event in January 2017 exceeds the criteria established for a Marine Heatwave as defined in Hobday et al. (2016). The statistical thresholds are also exceeded for salinity. The high salinities combined with the warm temperatures strongly suggest that the origin of the anomalies was a Warm Core Ring abutting the continental shelf, as suggested in Gawarkiewicz et al. (2018), with mixing processes reducing salinities to 34 PSU from typical ring values of 35.5 PSU. Temperatures in the intrusion moving across the continental shelf were 10–11°C, cooler than the 15°C temperatures recorded by the Pioneer Array glider on January 22–24. The cooling may have resulted from air-sea interaction or mixing with cooler shelf waters as Ring water moved onshore across the continental shelf.
Two important sources of uncertainty exist relative to the criteria for choosing Marine Heatwave events presented in Hobday et al. (2016). The first is that we have chosen a non-standard time period for the historical archive instead of the 30 years reference period previously suggested. In the WOD archive January profiles prior to 2004 are available from 1940 to 1996 south of New England. The second limitation is the absence of position information for 5 of the 11 profiles collected by the Shelf Research Fleet. These were not recorded at the time of data collection. In order to include these points, we compared the depth of the collected profiles to the depth distribution of profiles collected in December 2016 and February 2017. We used the latitude of the December or February profile that was closest in depth. The points with uncertain positions are marked with blue diamonds in Figures 3A, 4A. This does introduce uncertainty in the exact latitude for the profiles. However, given the difficulty of collecting data in the middle of winter while active fishing activities are underway and rare nature of this event relative to historical data we feel that it is important to include the 5 profiles even with the uncertainty in position.
In order to establish the spatial structure of the warm anomalies as well as establish the temporal evolution of the anomalously warm shelf water in winter (>10°C), a sequence of Sea Surface Temperature images ranging from November 11, 2016 to February 18, 2017 appears in Figure 5. In mid-November 2016, an extremely large Warm Core Ring with surface temperatures of 20°C abutted the shelfbreak from approximately 66°–68° West. Surface water warmer than 10°C extended from Nantucket Shoals to Delaware in the images at least from December 25, 2016 to January 1 2017 across virtually the entire continental shelf (two upper right panels in Figure 5). Cooler water appears near the coast by January 25, and colder shelf water advects into the entire Shelf Research Fleet operational area by February 18, 2017. Because of long periods of cloud cover during the winter, these six images offer the best view of the spatial structure of the Sea Surface Temperature, but do not appear frequently enough to provide a detailed evolution of the spatial structure of the intrusion and surface temperature anomalies.
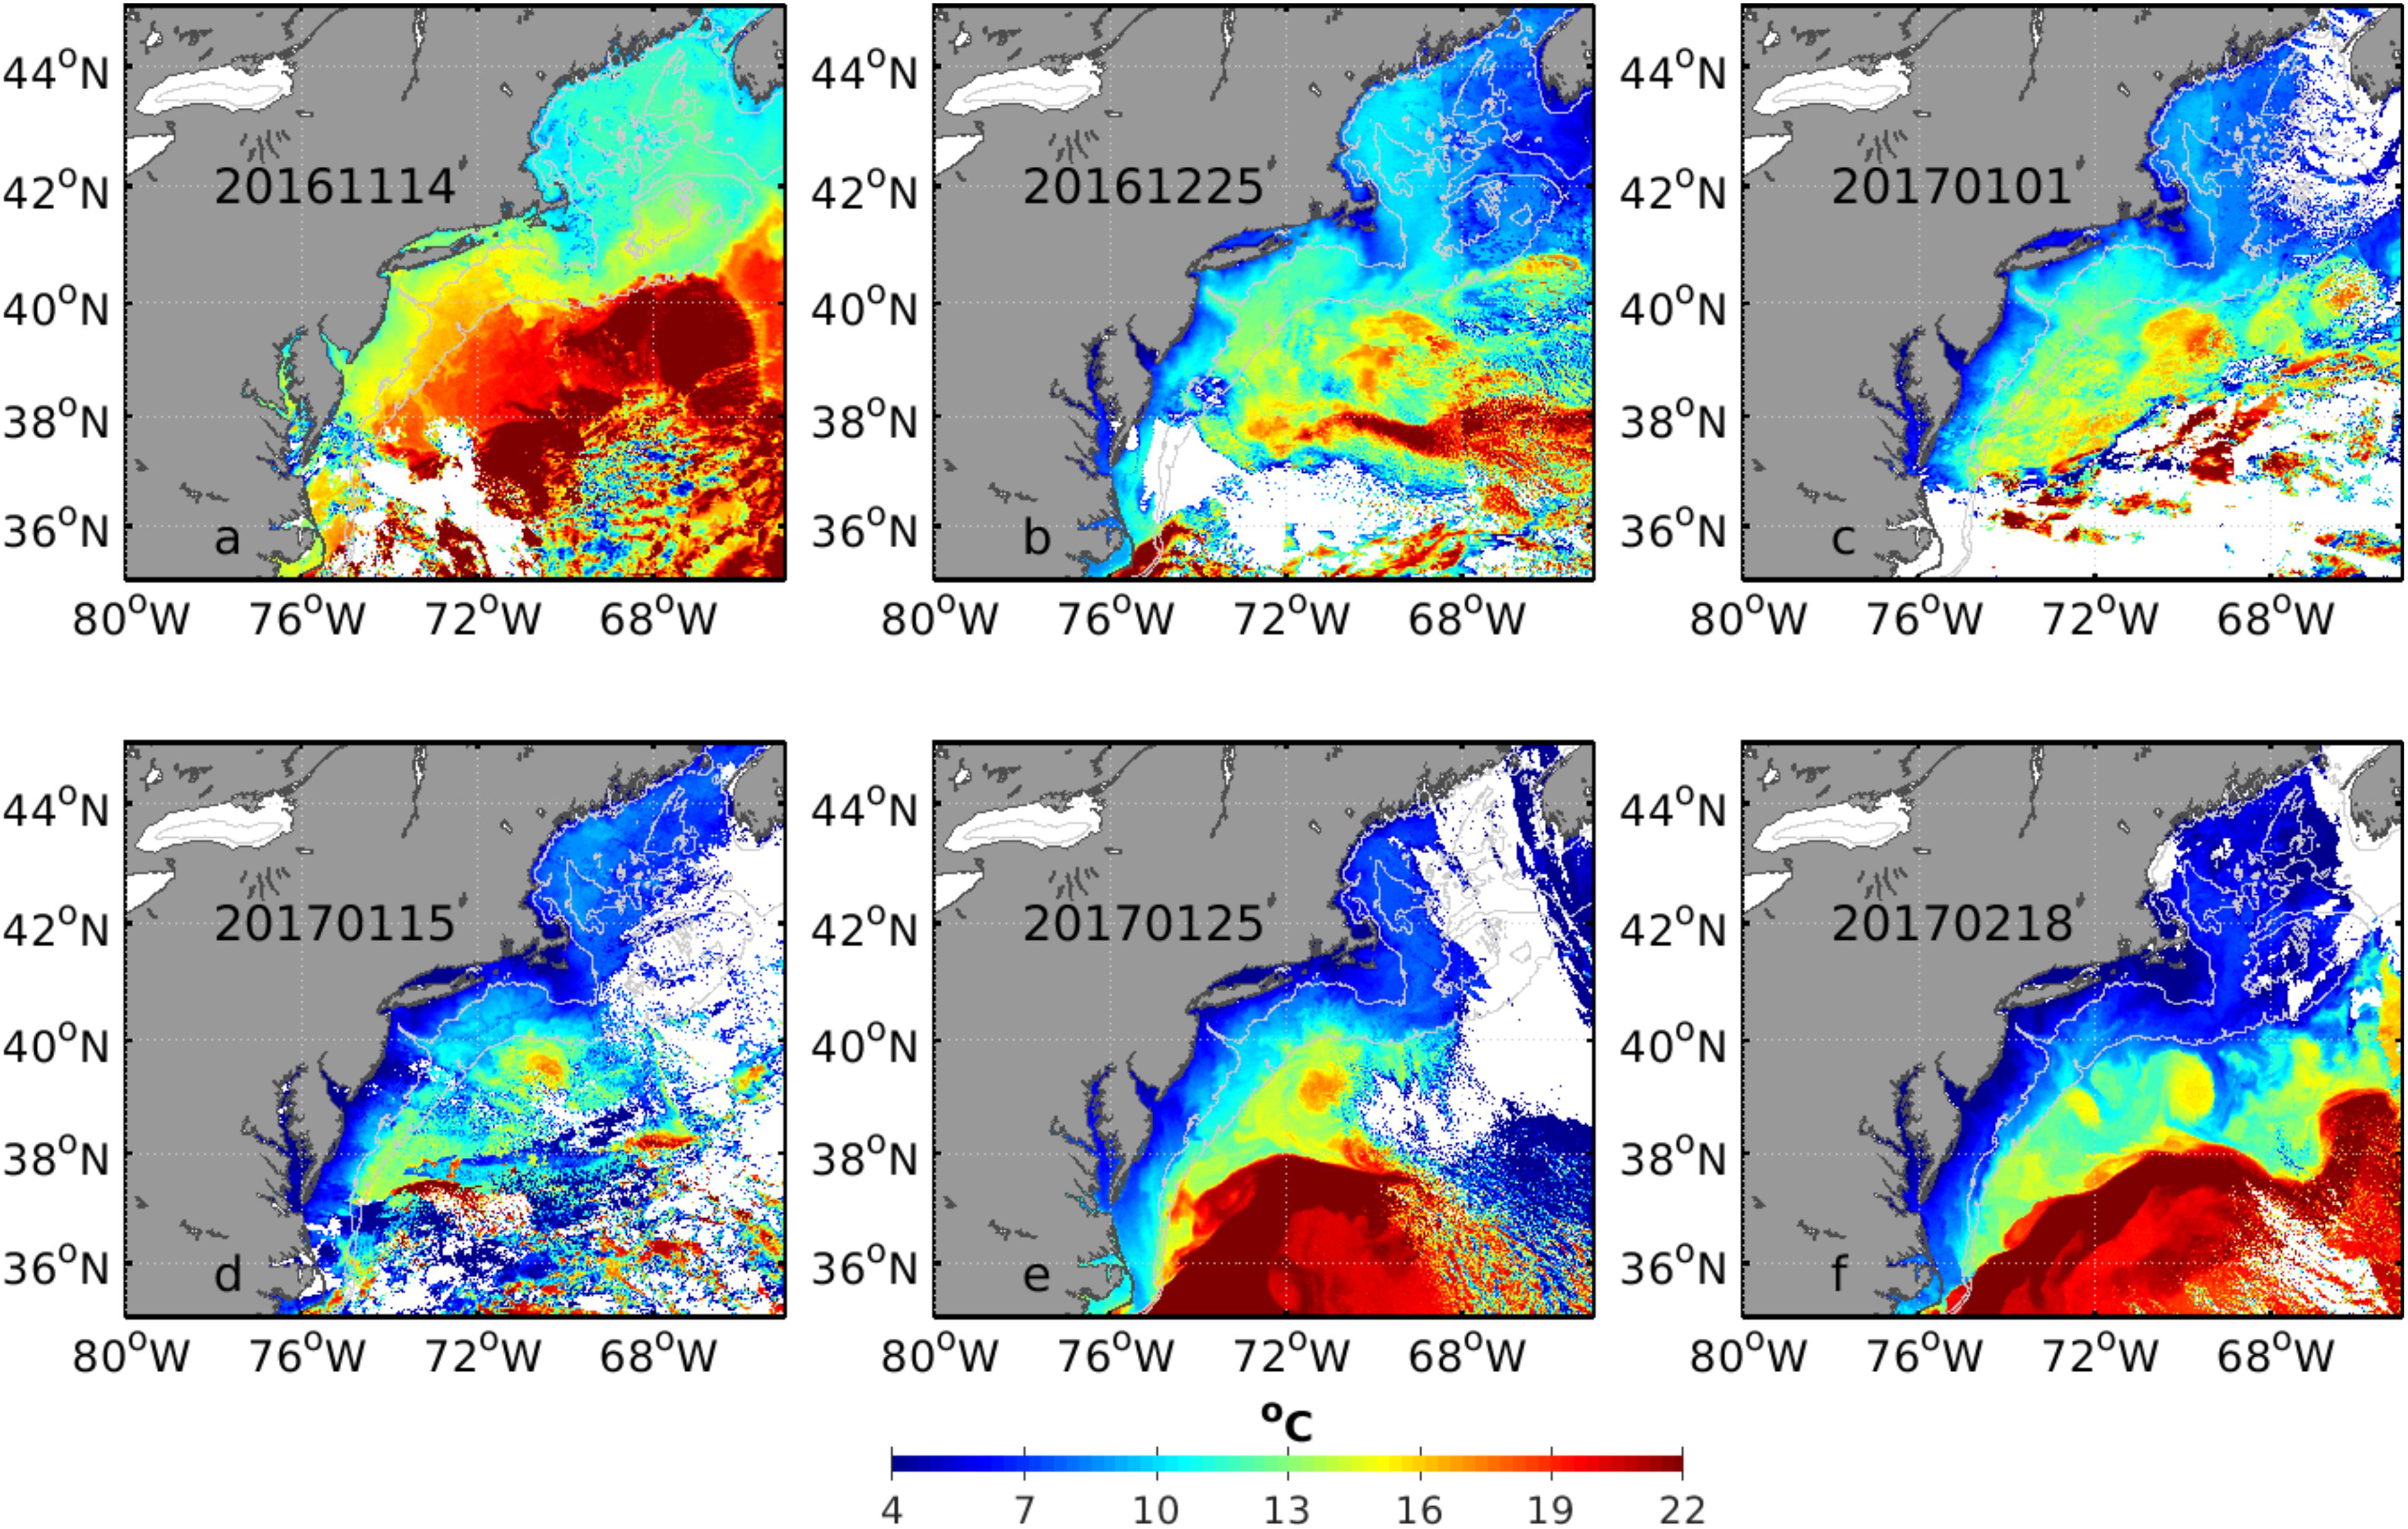
Figure 5. A sequence of Sea Surface Temperature images of the Middle Atlantic Bight from November 14, 2016 through February 18, 2017. The dates are given in the upper left portion of each panel. The 50 and 200 m isobaths are also plotted.
The Marine Heatwave Over the New Jersey Continental Shelf
The normal continental shelf circulation in the Middle Atlantic Bight continues to the southwest from south of New England to the Cape Hatteras region, where the shelf water deflects offshore under the influence of the Gulf Stream (e.g., Gawarkiewicz et al., 2008). As seen in the Sea Surface Temperature imagery, the warm water observed in January 2017 extended a substantial alongshelf distance to the southwest. Two sources of data can be used to examine the sub-surface thermohaline properties of this feature, the temperature data from the CMV Oleander XBT line and the temperature and salinity data from ECOMON surveys. We will use the CMV Oleander XBT data to examine the temperature fields to see if the anomalies reach the threshold of declaring a Marine Heatwave using data collected from the CMV Oleander from 1977 to 2017. We then use near surface data from the thermo-salinograph to further characterize the timing and cross-shelf extent of the anomalies.
The depth-averaged temperatures observed by CMV Oleander during January 2017 appear as filled red circles in Figure 6. These are superimposed on a histogram of temperature values from prior Oleander transects occupied between 1977 to 2017. Only temperature profiles from positions between the 40 and 80 m isobaths over the continental shelf are considered in order to minimize variability from the Shelfbreak Front and influence by the coastal current from the Hudson River. The dashed line in Figure 6 indicates the 90th percentile for temperature for the historical depth-averaged data from January. Half of the XBT profiles in January 2017 exceed the criterion for designation as a Marine Heatwave.
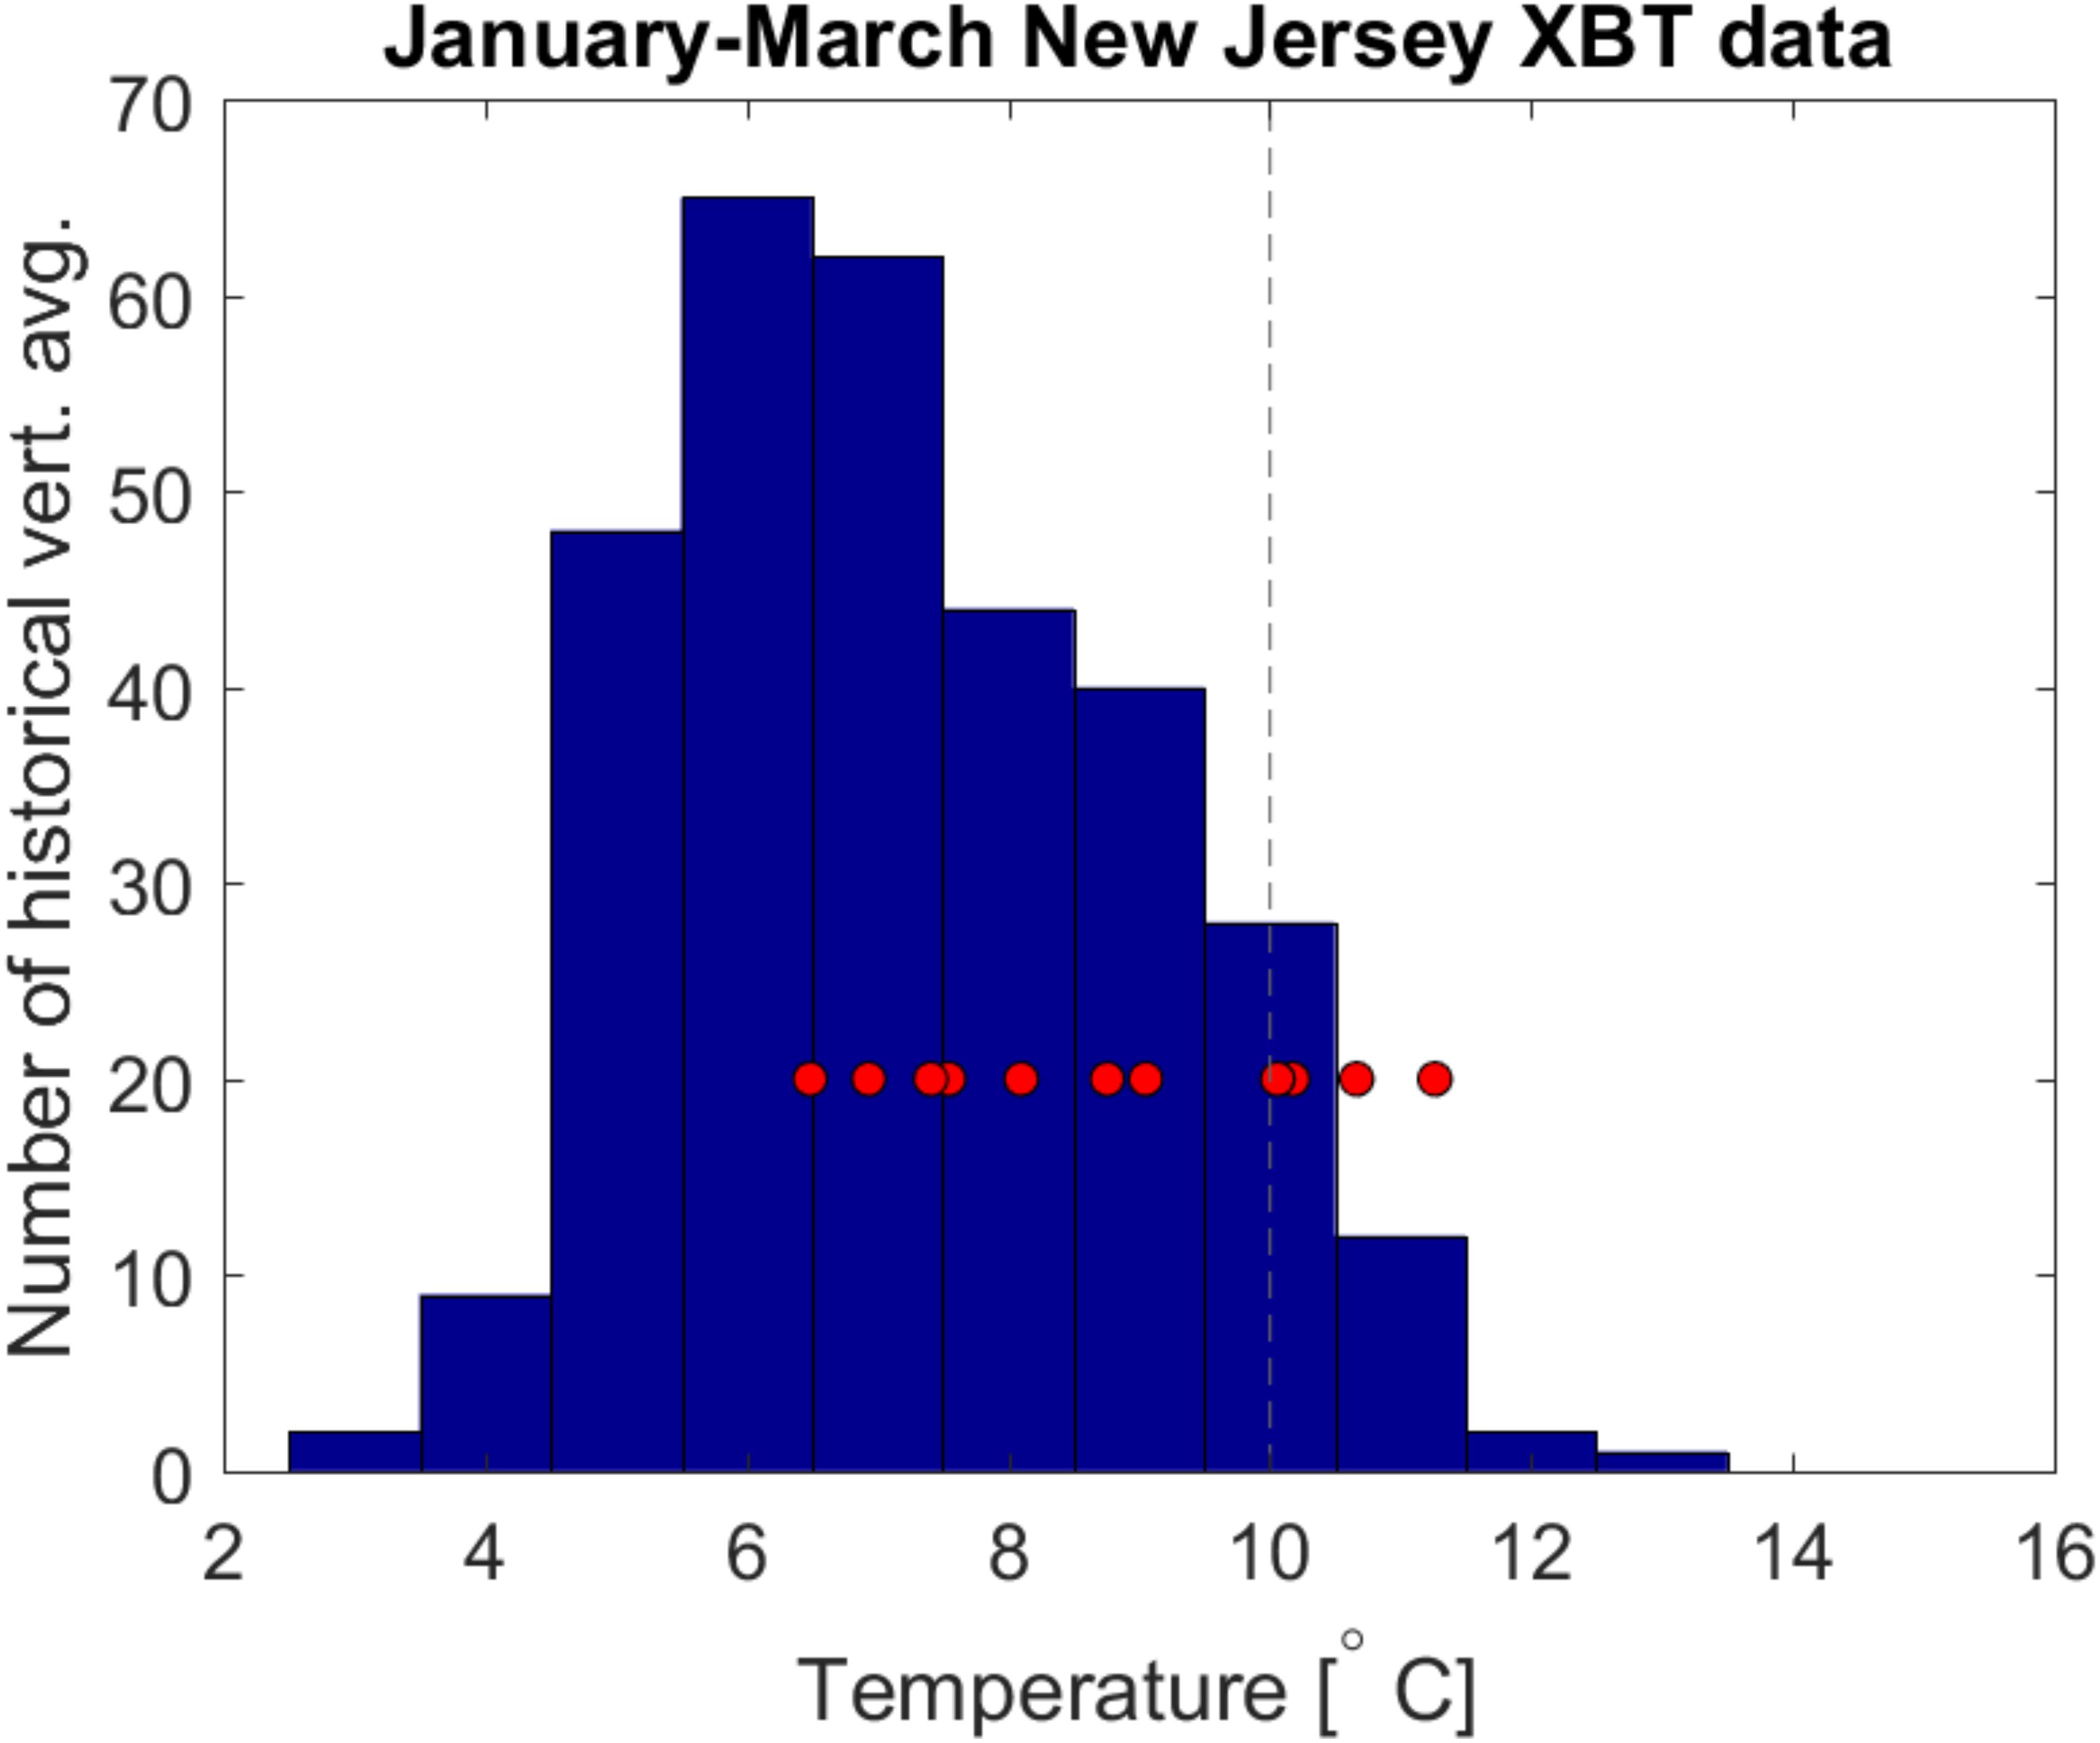
Figure 6. Depth-averaged temperature from New Jersey from January 2017 relative to the distribution of historical depth averaged values from 1977 to 2017. Four of the eleven profiles qualify as a Marine Heatwave over the outer portion of the continental shelf. Two of the profiles have nearly identical temperatures. The area covered is between the 40 and 80 m isobaths, thus shoreward of the climatological position of the foot of the Shelfbreak Front. The dashed line indicates the 90th percentile for the historical temperature data.
The thermo-salinograph data confirms maximum cross-shelf penetration of warm saline water in late January (Figure 7). The temperature exceeded 10°C and 34.0 PSU as far west as 73°15′ West on January 21, more than 50 km west of the shelfbreak (marked by the vertical dotted line in the figure). The Oleander data show that the Shelfbreak Front extended approximately halfway across the continental shelf in late January. The ECOMON data from February 2017 confirms this onshore displacement of the Shelfbreak Front and allows estimation of the duration of the Heatwave.
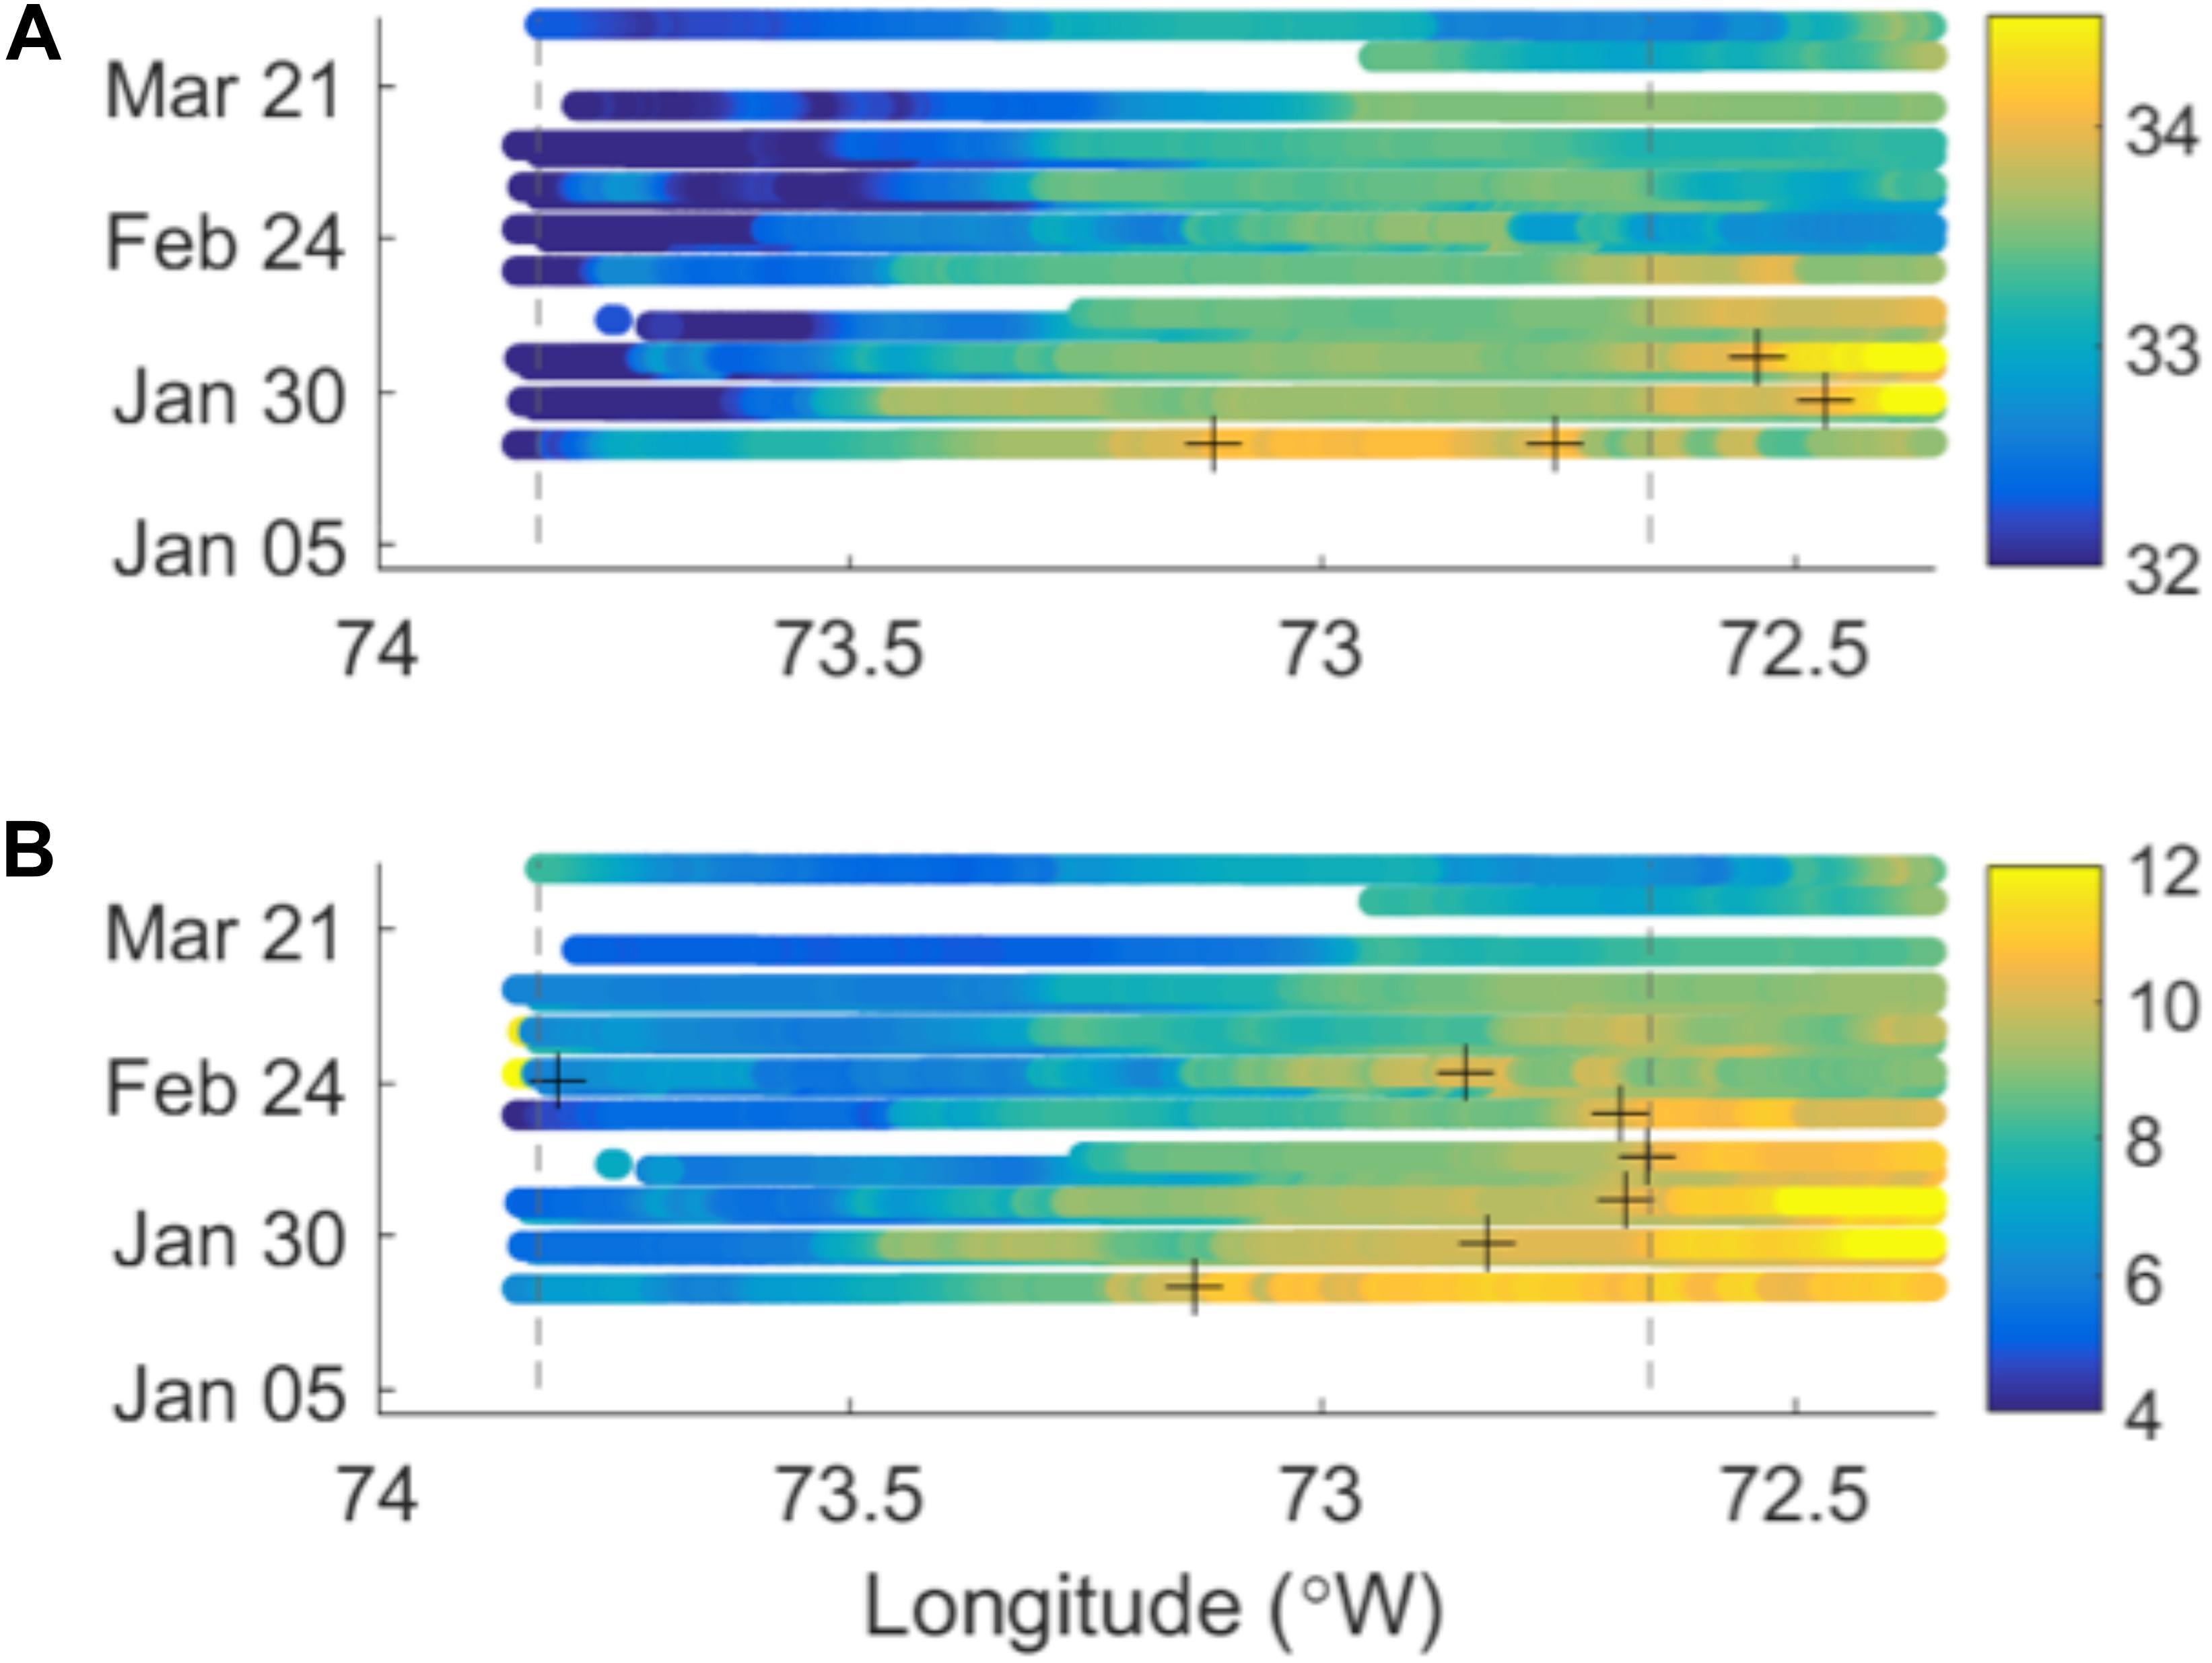
Figure 7. Time series of (A) cross-shelf salinity and (B) temperature (lower panel) from the CMV Oleander thermo-salinograph from mid-January 2017 through late March 2017. The dotted line on the left is near the Ambrose Light off New Jersey at the 30 m isobath and the shelfbreak is at the dotted line on the right. The crosses indicate the most shoreward position of the 34.0 isohaline and 10°C isotherm. The units are Practical Salinity Units for salinity and Degrees Centigrade for temperature.
A map of the depth-averaged temperature from the ECOMON cruise in February 2017 appears in Figure 8A. The profiles with temperatures that exceed 10°C are generally seaward of the 80 m isobath, in contrast to both the Oleander data in January 2017 as well as observations from the shelf south of New England where 10°C water occurred well shoreward of the shelfbreak. Between the 40 and 80 m isobaths the temperature was generally in the range of 8–10°C (8 of 12 profiles) with the remaining values between 7 and 8°C.
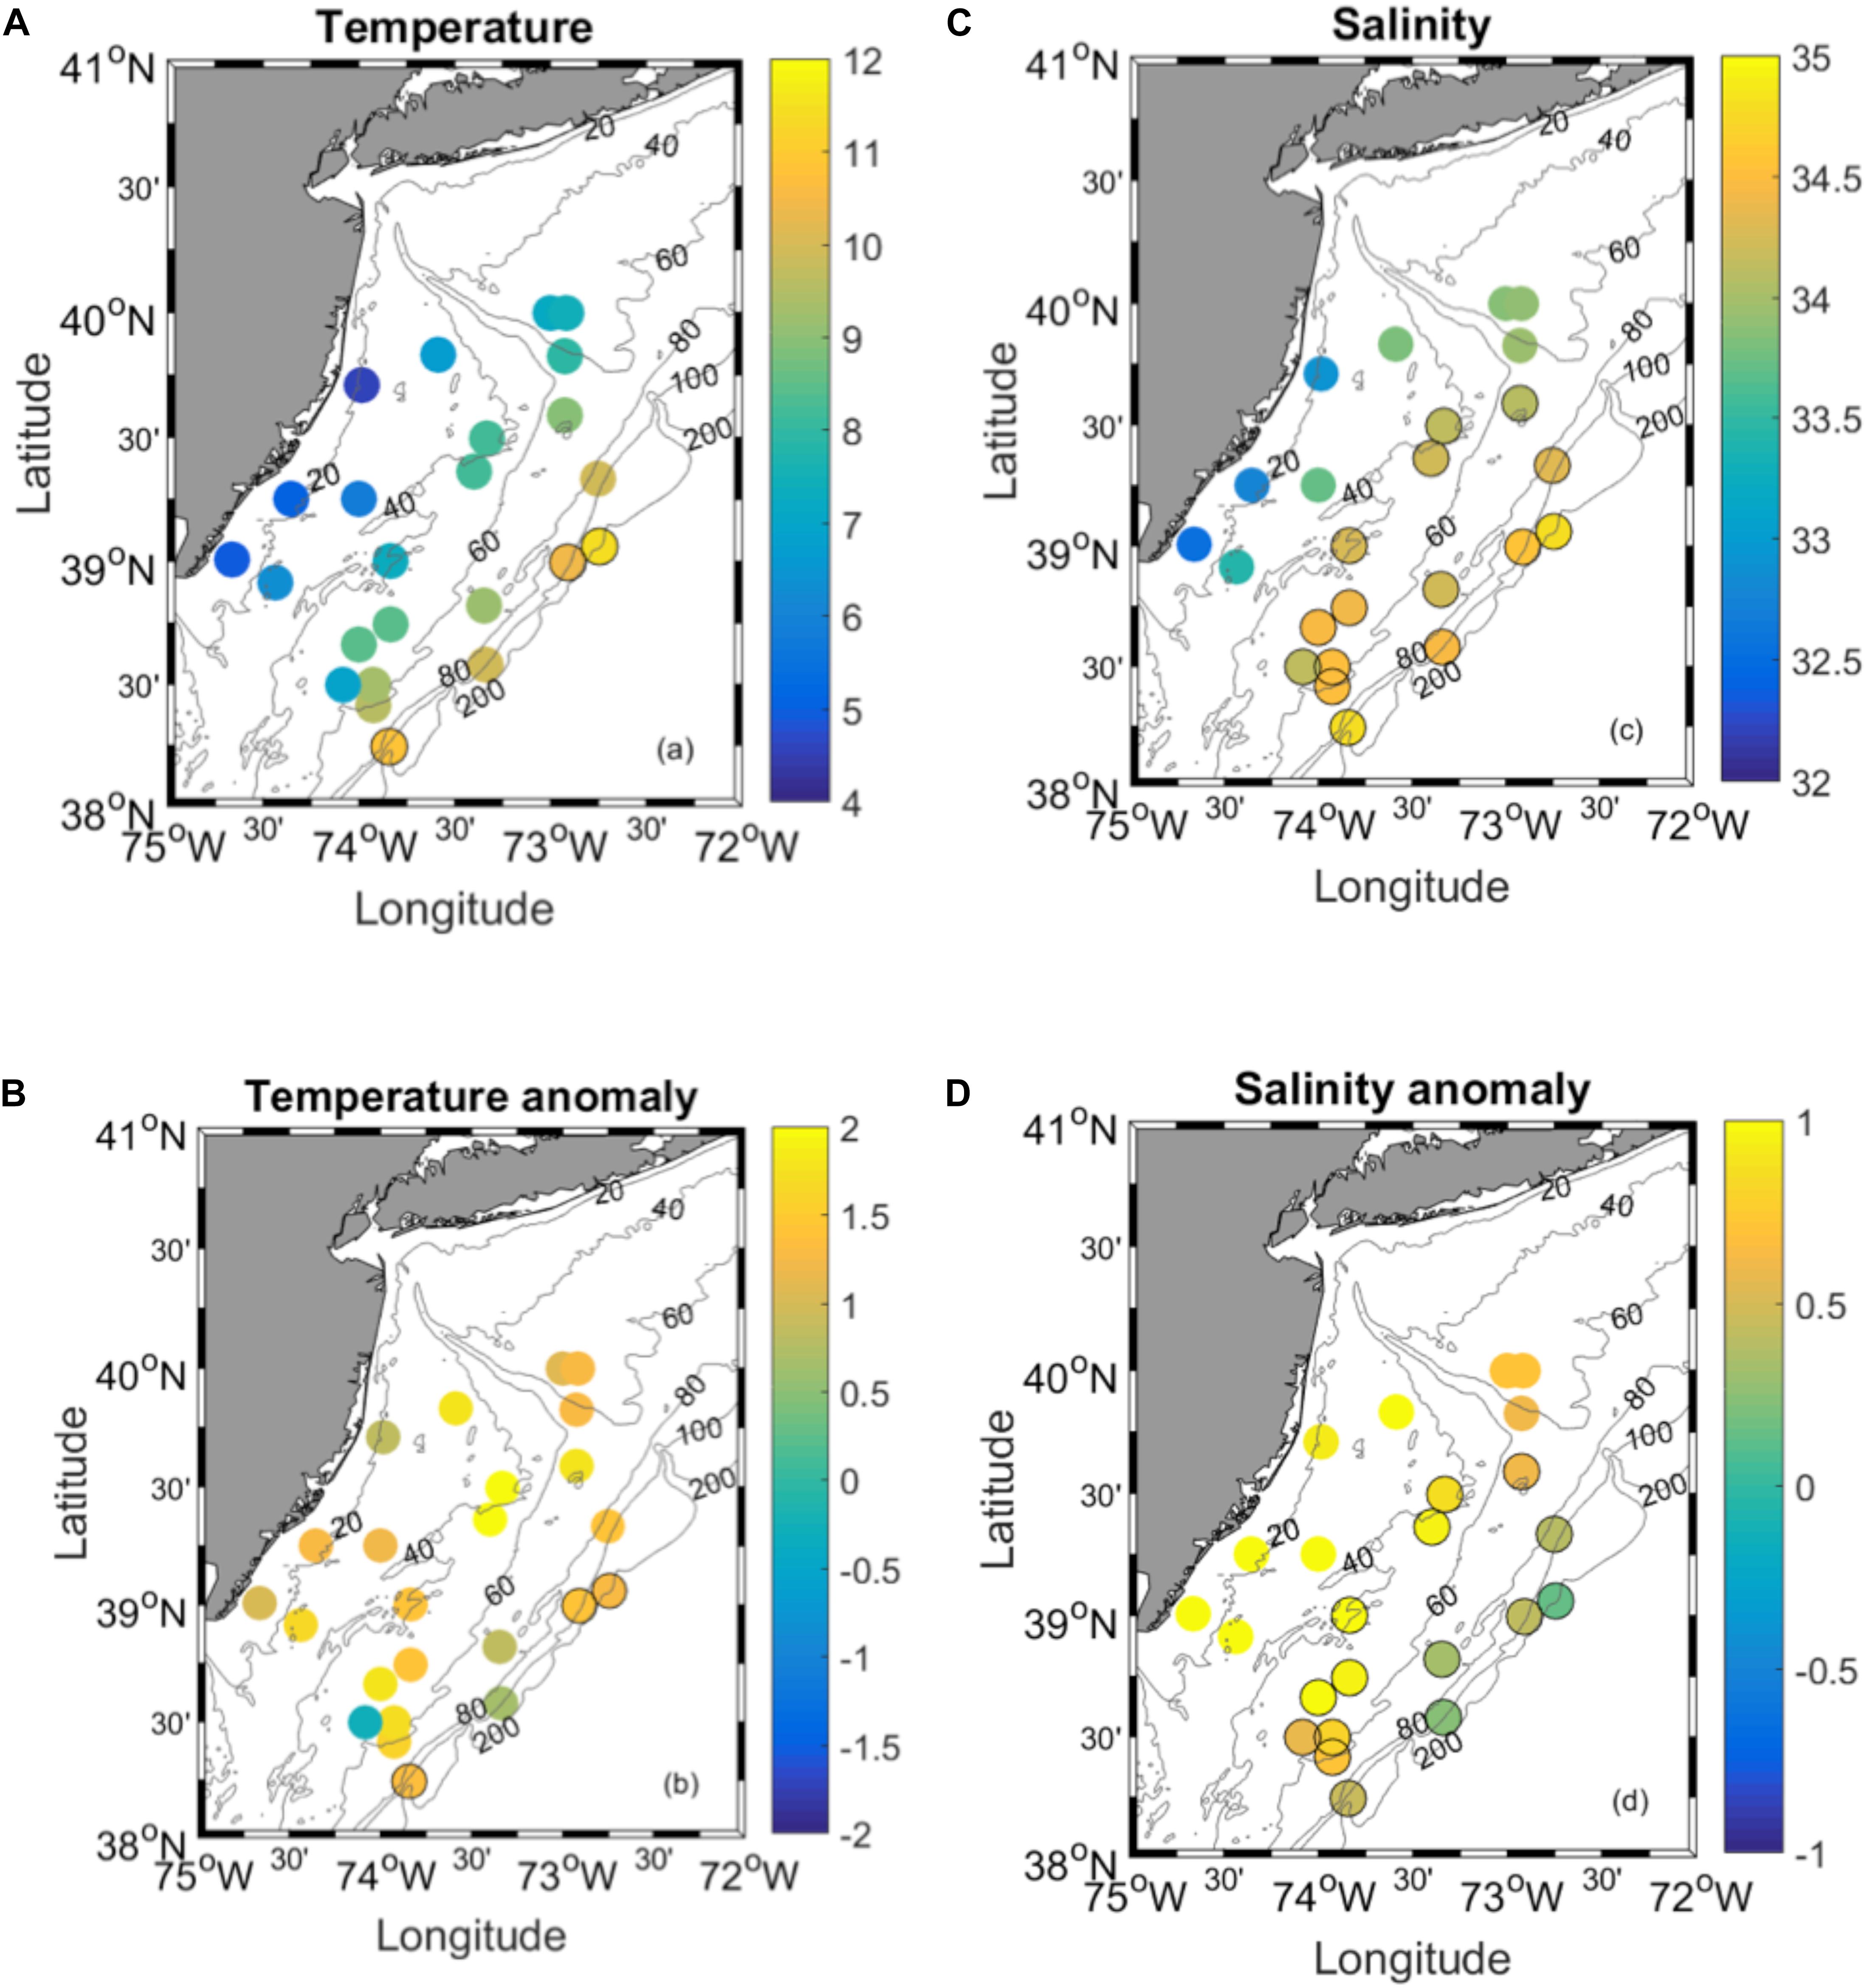
Figure 8. (A) Depth averaged temperature from an ECOMON cruise of the R/V Bigelow in February 2017. Note the warm temperatures (8–9°C) extending to the 40 m isobath. (B) Temperature anomalies relative to the MOCHA climatology for January. (C) Depth-averaged salinity. Note that the 34.0 isohaline extends to the 40 m isobath, it is typically seaward of the 80 m isobath. (D) Salinity anomalies relative to the MOCHA climatology for January. The dark rings indicate stations in which either temperature is higher than 10°C or salinity is greater than 34.0 PSU.
The spatial pattern of the temperature anomalies in February 2017 relative to the climatology of Fleming (2016) appears in Figure 8B. The largest anomalies are located from mid-shelf to the coast, and range in value from 1.5 to 2.0°C.
The depth-averaged salinity distributions from the ECOMON cruise in February 2017 suggest that the Shelfbreak Front migrated well shoreward of its mean position. Typically, the foot of the front (bottom outcrop) is located at the 80 m isobath over the New Jersey shelf (Linder and Gawarkiewicz, 1998), but observations in 2017 show salinities exceeding 34.0 PSU as far inshore as the 40 m isobath with values over 34.5 PSU reaching the 60 m isobath. Lentz et al. (2003) have defined shelf water in the Middle Atlantic Bight as less than 34.0 PSU, with frontal water in the range of 34.0–35.0 PSU. By this definition the Shelfbreak Front did indeed translate onshore to the 40 m isobath, as shown in the map in Figure 8C. It is important to note that the foot of the front is likely further shoreward of the depth-averaged salinity value of 34.0 PSU for individual profiles.
The spatial pattern of the salinity anomalies appears in Figure 8D. The largest salinity anomalies, approaching 1 PSU, are adjacent to the coast extending offshore to the 50 m isobath. This is consistent with the pattern of the temperature anomalies. Combined, the patterns suggest that the thermohaline anomalies that originated up in New England are most unusual at their greatest cross-shelf extent, i.e., closer to the coast.
The ECOMON cruise on the R/V Henry Bigelow sampled the New Jersey continental shelf from February 12 to 16 and thus does not quite reach the 5 days duration used in the Hobday et al. (2016) criteria. The difficulty of collecting data during January and February in this region can be extreme as this particular cruise was cut short due to stormy conditions. However, combined with the near-surface thermo-salinograph data from the CMV Oleander, the duration of the unusual conditions over the New Jersey shelf can be estimated. The time frame is roughly a month between the first CMV Oleander line in 2017 and the end of the ECOMON survey (January 14 to February 16).
The Fate of the Marine Heatwave
The mean flow over the continental shelf in the Middle Atlantic Bight progresses southward to the vicinity of Cape Hatteras where the flow is exported near the Gulf Stream (Savidge and Bane, 2001; Gawarkiewicz and Linder, 2006; Gawarkiewicz et al., 2008). Fortunately, during 2017 a field program, the Processes driving Exchange at Cape Hatteras (PEACH), began on April 12–29 with a mooring deployment and hydrographic sampling cruise on the R/V Neil Armstrong.
The CTDs present near the surface (2 m depth) and bottom at the B1 mooring in the PEACH array (see Figure 1 for location) indicate the arrival of a surge of near bottom Cold Pool water (Houghton et al., 1982) on April 23 2017 (Figure 9). During the initial deployment on April 18 there was a near bottom water mass present with a temperature of 14°C and salinity of 35.0 PSU, indicative of the presence of Slope water over the continental shelf. However, a strong southward flow appeared on April 23 with a velocity of over 0.4 m/s carrying near bottom temperature of 9.8°C and a salinity of 34.0 PSU. Relative to the climatology of Fleming (2016), the anomaly was approximately 1°C and 1 PSU along 35°45′ North.
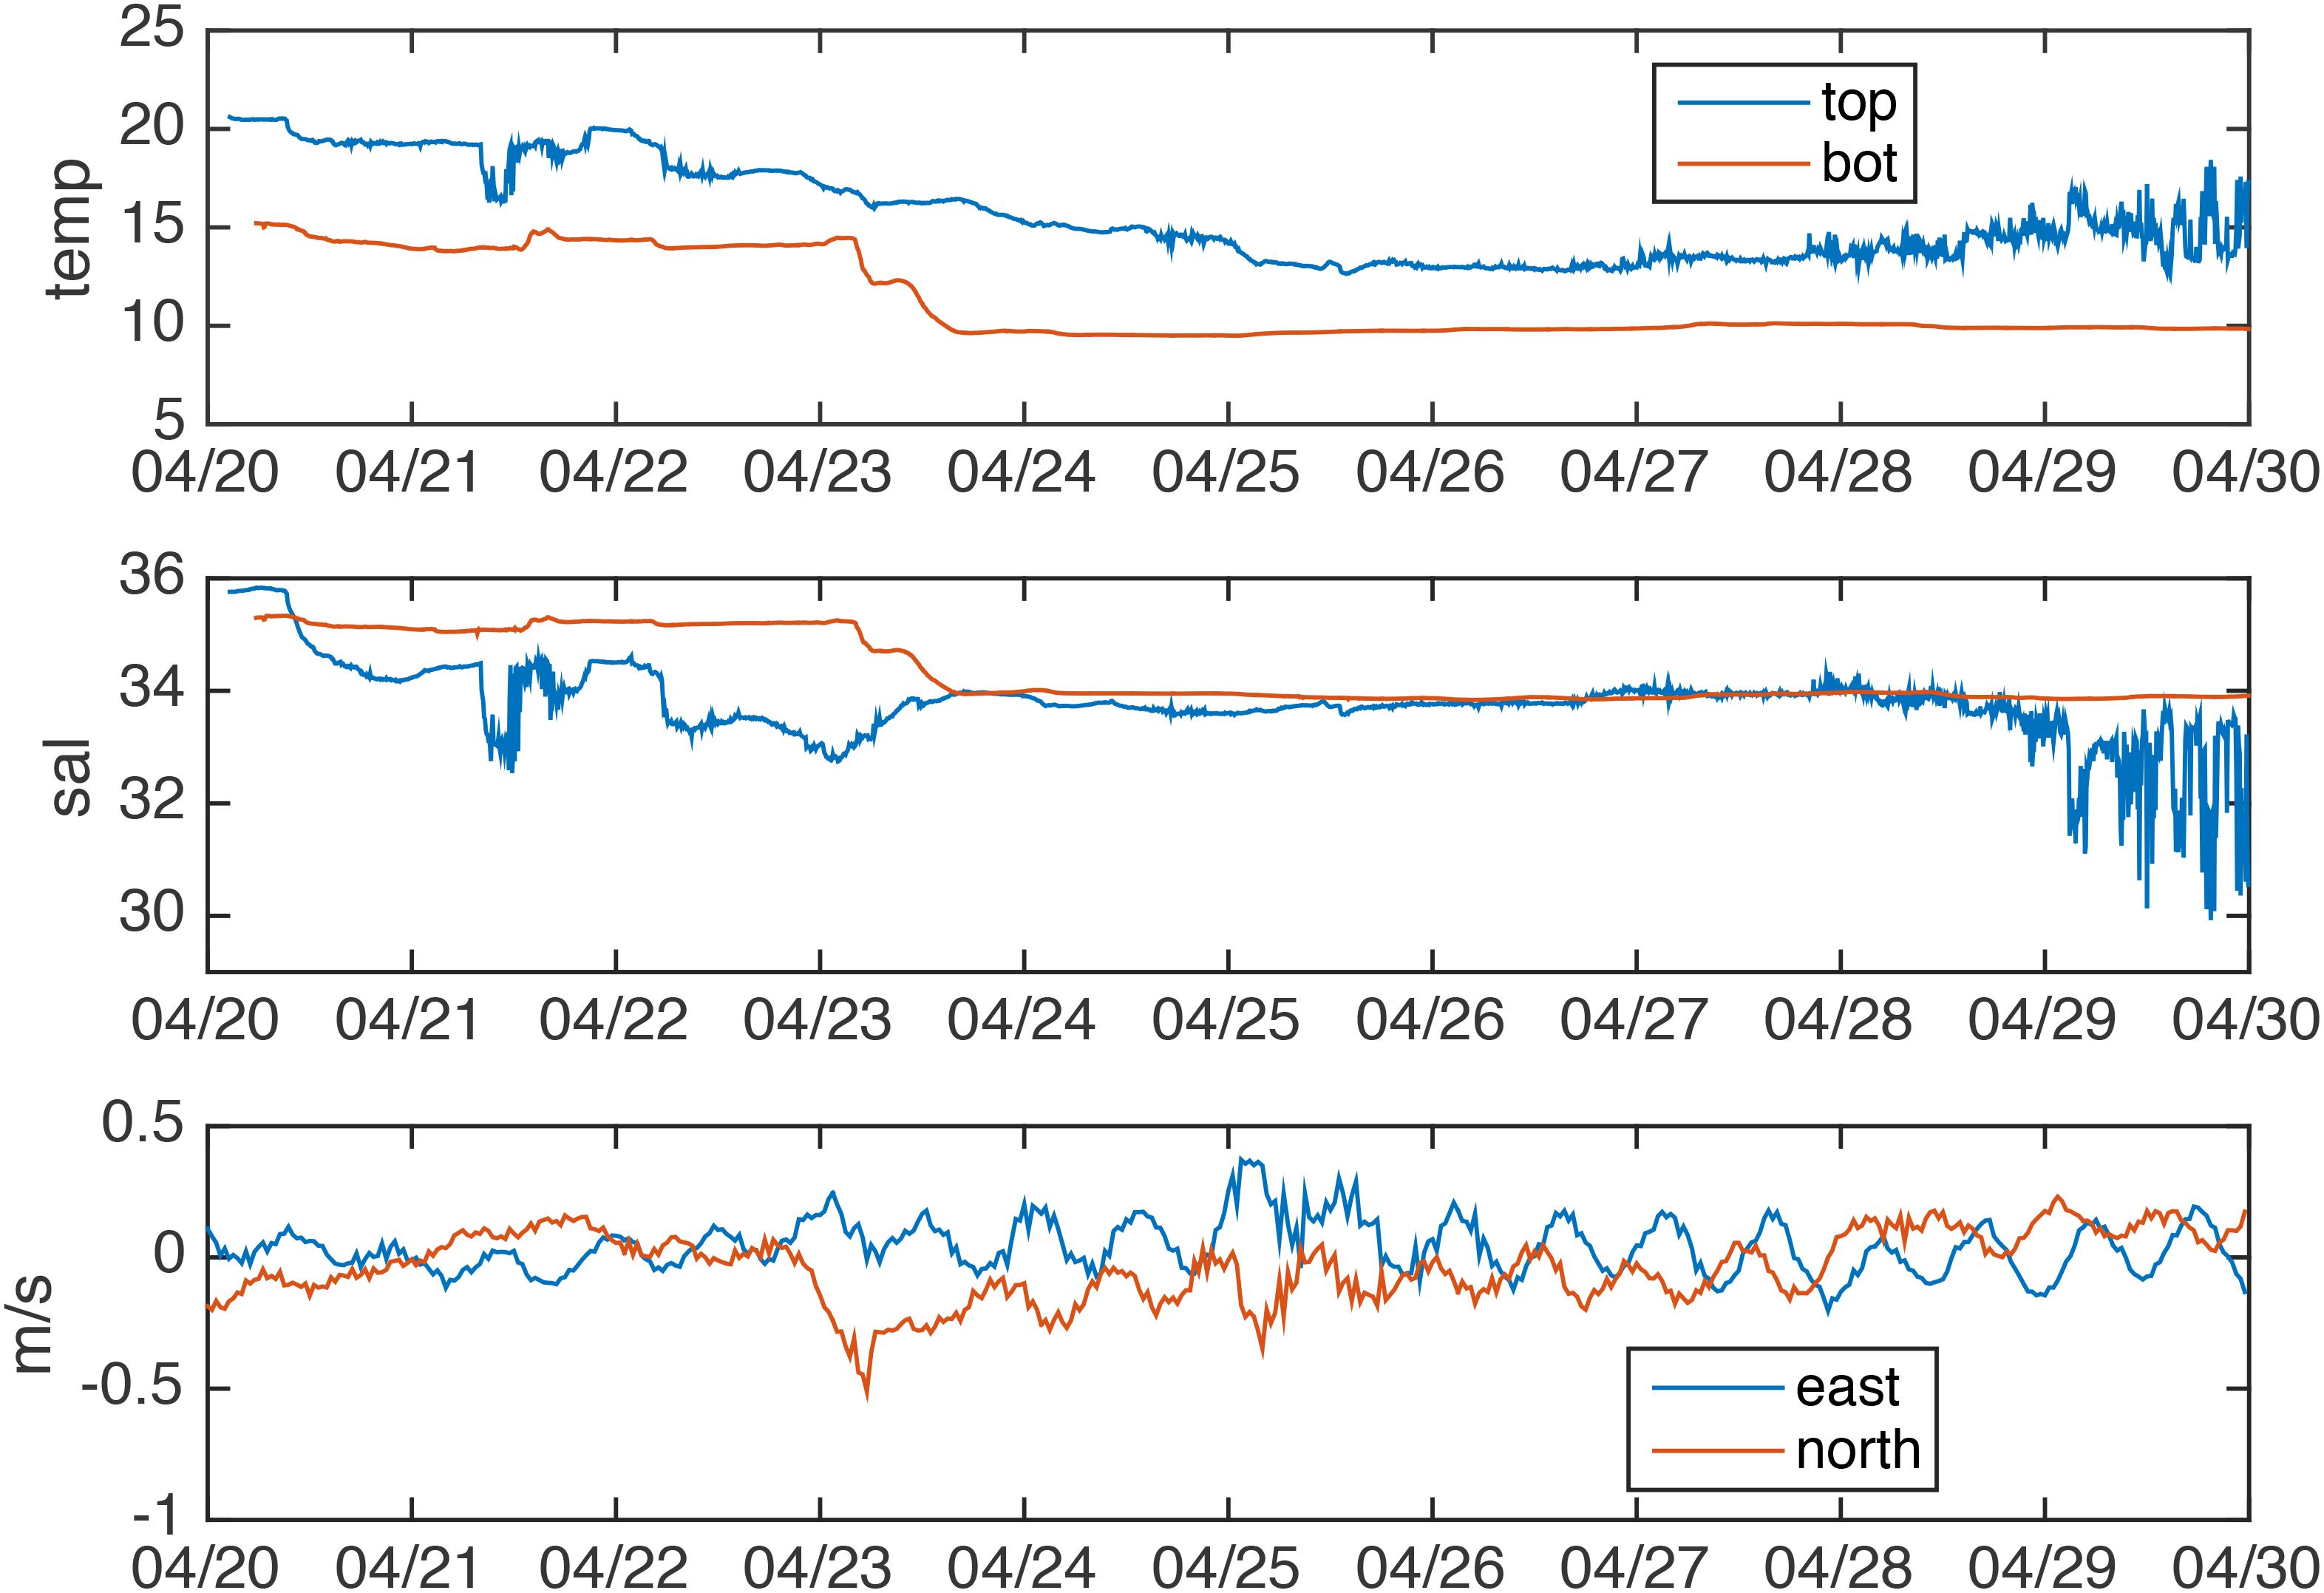
Figure 9. Time series of temperature (upper panel) and salinity (middle panel) and depth-averaged velocity (bottom panel) from the B1 mooring in the PEACH array. Note the rapid drop in temperature and salinity near April 23, 2017, potentially indicative of the remnants of the Marine Heatwave reaching the continental shelf just north of Cape Hatteras.
While the evolution of temperature and salinity near Cape Hatteras (Figure 9) cannot conclusively establish that this is the same water mass initially transported onto the continental shelf in early January south of New England, a crude estimate of the advection rate offers a hint as to how plausible this scenario is. If we assume that the initial onshore transport of Warm Core Ring water occurred near 40°00′ North and 70°00′ West on January 1 2017, the estimated along-isobath distance to the PEACH array is approximately 850 km. The anomalous watermass was observed at the B1 mooring approximately 113 days after the Warm Core Ring intrusion on the New England Shelf, giving an estimated advection rate of 8.7 cm/s. This is in reasonable agreement with estimated flow rates of 5–10 cm/s over the outer continental shelf (e.g., Lentz, 2008). Thus we find it plausible for the pulse recorded at the B1 mooring of the PEACH array on April 23 to be a remnant of the upstream Marine Heatwave as it passed through the Middle Atlantic Bight. Because of the extreme variability of the water mass properties over the continental shelf in the vicinity of Cape Hatteras, it is unlikely that the anomalies recorded in the hydrographic cross-shelf transect on April 25 (1°C and 1 PSU) exceeded the 90th percentile for temperature or salinity. Nevertheless, the similarity of the T/S properties (Figure 10) to those recorded south of New England and over the New Jersey shelf suggests that the ultimate fate of the water mass carried in the Marine Heatwave was to exit the shelf near Cape Hatteras. This is consistent with Lagrangian properties of the flow field near Cape Hatteras (e.g., Gawarkiewicz and Linder, 2006). While the temperature recorded in the hydrographic section and the B1 mooring does not meet the definition of a Marine Heatwave by Hobday et al. (2016), it is suggestive that the Warm Core Ring intrusion that initiated south of New England was carried the length of the Middle Atlantic Bight, influencing the continental shelf in this region over a 4 months period and an along-shelf span of 850 km. A schematic of the Ring Intrusion with the timing and temperature range at various locations is shown in Figure 11.
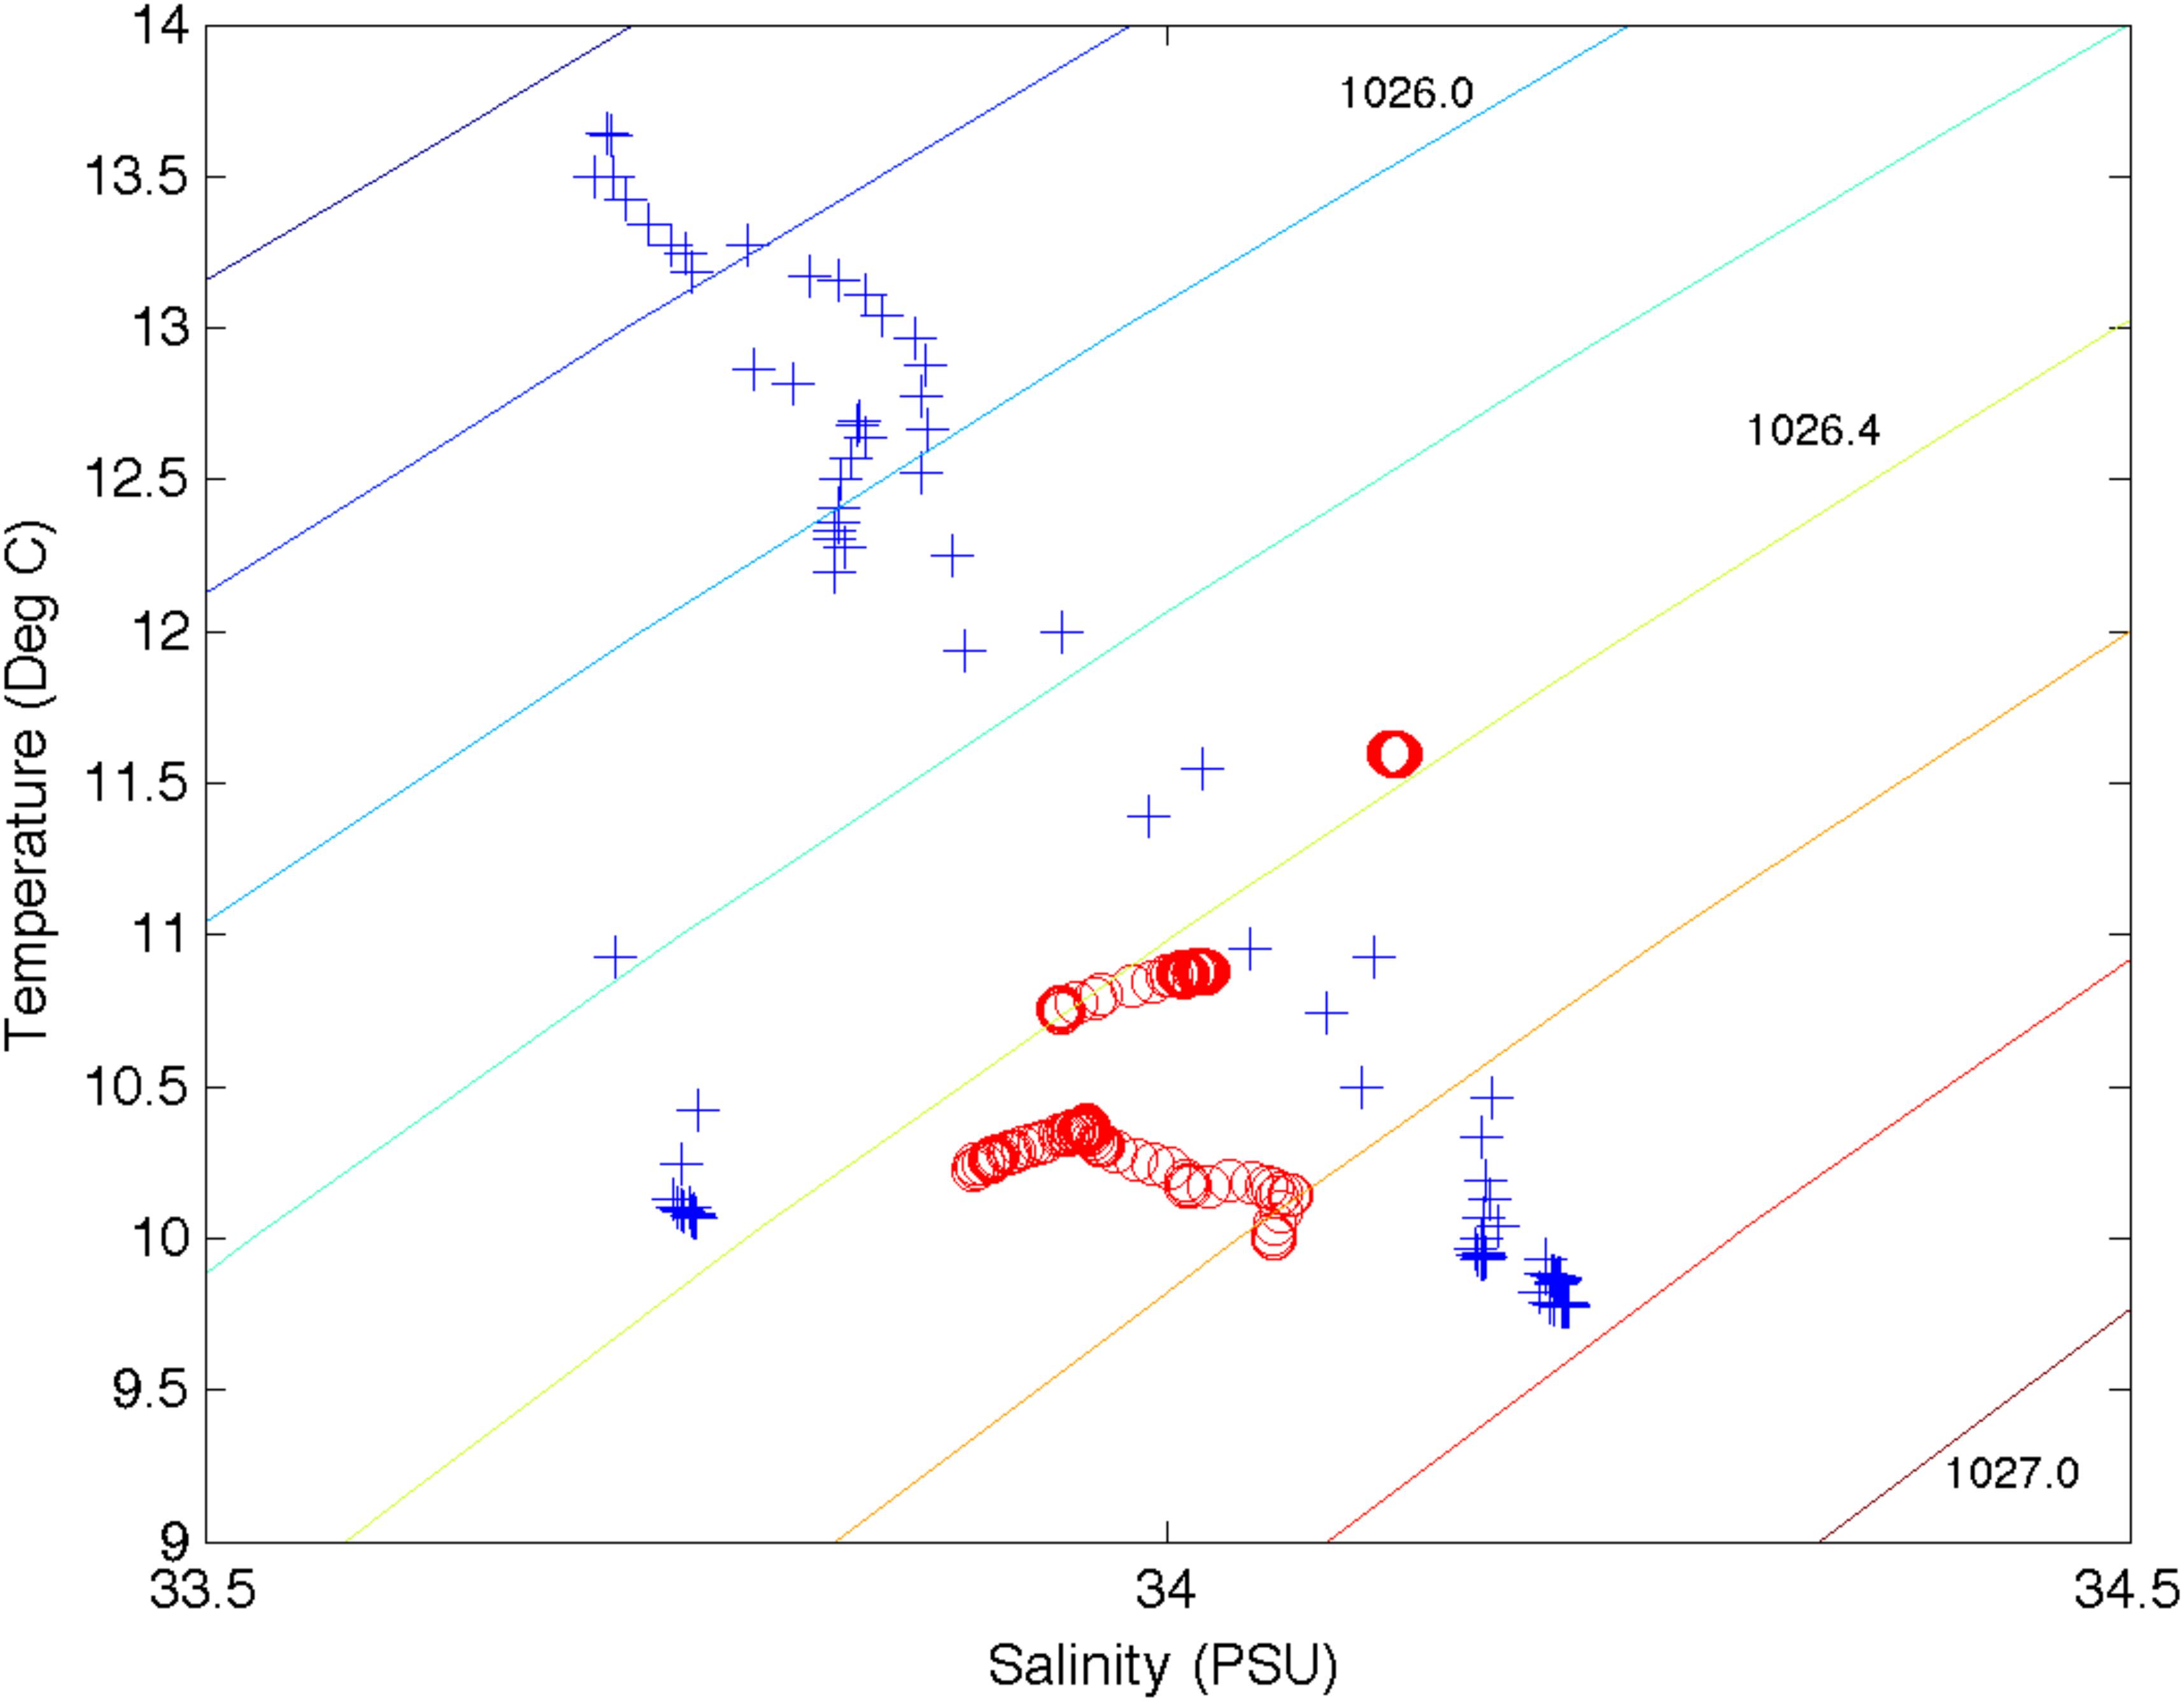
Figure 10. T/S diagram from three profiles from New England in January (red circles) and three profiles north of Cape Hatteras (blue crosses) in April 2017. Note that the New England water mass properties fall in the middle of the three outermost profiles inside the shelfbreak from the cross-shelf transect of the R/V Neil Armstrong on April 25, 2017. Isopycnals are plotted in 0.2 kg/m3 increments, with a value of 1025.6 km/m3 in the upper left corner and 1027.0 km/m3 in the lower right corner.
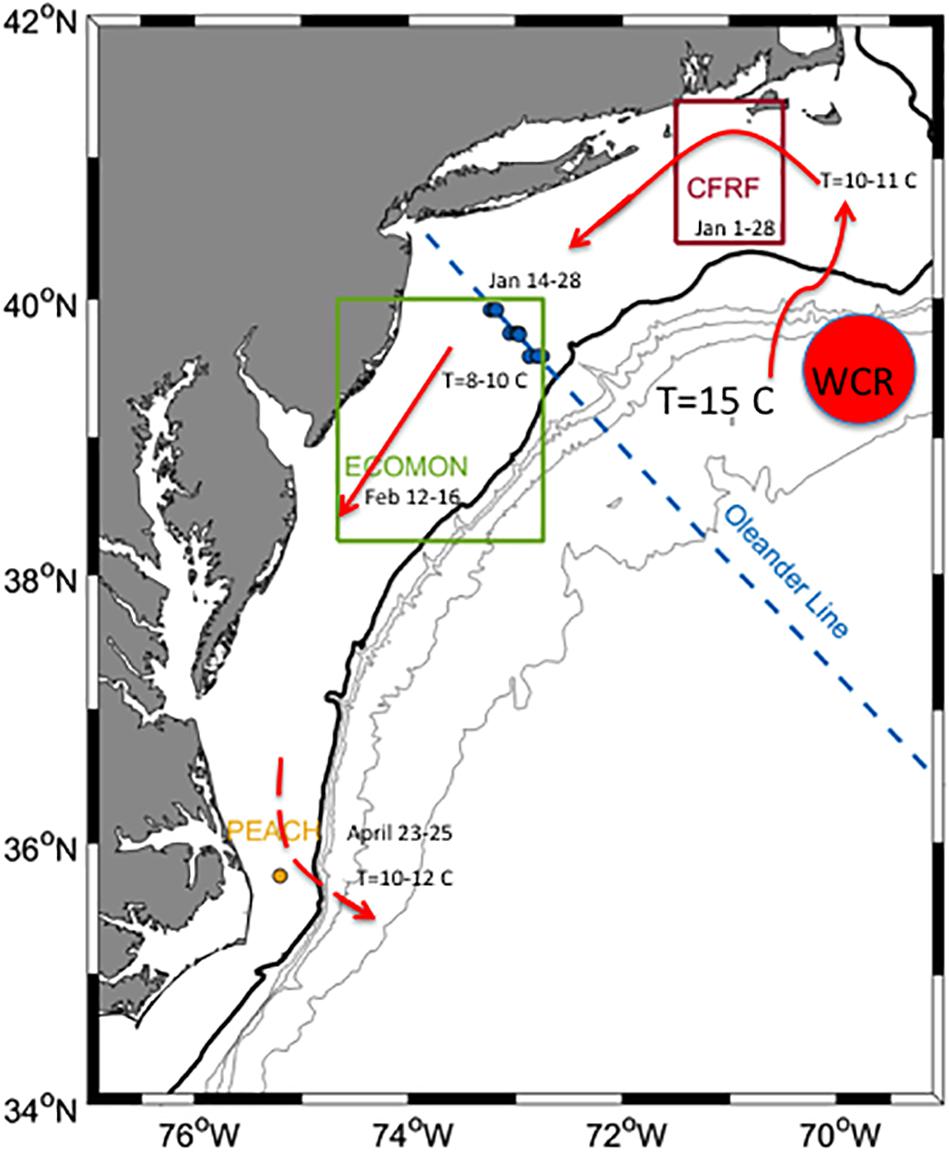
Figure 11. A schematic diagram of the Marine Heatwave from January–April 2017 extending through the entire Middle Atlantic Bight. The date of passage is indicated along with the temperature values as it advects through the region. The dotted arrow near Cape Hatteras indicates that the feature was no longer a Marine Heatwave but retained a distinct salinity anomaly with salinity greater than 34.0 PSU.
We suggest that the continental shelf south of Nantucket Shoals has in recent years become a hotspot for shelfbreak exchange, with Warm Core Ring water masses preferentially carried onshore in this region. Recent evidence has shown that the upper continental slope has become considerably more saline, from a 2.5 year record of glider transects from the OOI Pioneer Array (Gawarkiewicz et al., 2018). This is consistent with evidence from Sea Surface Height Anomalies that large amplitude meanders of the Gulf Stream have been more frequent and occur further to the west than in previous decades (Gawarkiewicz et al., 2012; Andres, 2016). There has been a recent regime shift occurring in the year 2000 with a substantial increase in the number of Warm Core Rings forming each year (33 per year from 2000 to 2017 and 18 per year from 1980 to 1999; Gangopadhyay et al., 2019). We hypothesize that the continental shelf south of Nantucket Shoals traps Warm Core Rings. Because of the proximity of Nantucket Shoals, ring water masses that travel onshore here would flow along isobaths that curve well to the north toward Block Island, Rhode Island. Further investigation is warranted to see if other Marine Heatwaves that have occurred in recent years originate south of Nantucket Shoals to establish whether this area is indeed a new hot spot for shelfbreak exchange. We note that this area was not an area of enhanced onshore flow in the late 1990s, based on drifters released in the Gulf of Maine (Limeburner et al., 2000; Lozier and Gawarkiewicz, 2001). It is possible that the greater amplitude of Gulf Stream meanders combined with the more frequent appearance of Warm Core Rings may have resulted in the formation of a new hot spot for enhanced shelfbreak exchange.
Discussion
Implications for the Marine Ecosystem
The Marine Heatwave in January 2017 was an unprecedented event that had significant impacts on the marine ecosystem, including unusual occurrences of warm water fish in Rhode Island coastal waters, as reported by commercial fishers.
According to the NOAA National Marine Fisheries Service ECOMON survey, the annual average sea surface temperature in 2017 was above 13°C, among the highest in the times series that stretches back to 1854. Conversely, the average chlorophyll a concentrations over the northeastern continental shelf in 2017 were the lowest since 1998 (approximately 1.06 mg/m3). In general, Chlorophyll a over the northeastern continental shelf has been in decline since 2011, when the annual average value was approximately 1.49 mg/m3 (National Marine Fisheries Service [NOAA], 2018). While other factors, including mixing dynamics, impact chlorophyll production, the Marine Heatwave likely contributed to the low productivity on the northeastern continental shelf in 2017.
Another possible effect of the Marine Heatwave is the enhanced mortality of Humpback Whales. The National Marine Fisheries Service declared an unusual mortality event for Humpback Whales in 2017. Thirty-four strandings of Humpback whales were reported in 2017, with the majority occurring in the Middle Atlantic Bight. The strandings are broken down by state at https://www.fisheries.noaa.gov/national/marine-life-distress/2016-2019-humpback-whale-unusual-mortality-event-along-atlantic-coast.
We suggest that the onshore shift of the Shelfbreak Front in January/February south of New England and off New Jersey may have resulted in an onshore displacement of the Humpback Whales relative to their normal cross-shelf position. The Shelfbreak Front is known to have persistent upwelling (e.g., Linder et al., 2004; Zhang et al., 2013). It is quite possible that Humpback Whales may have tracked the frontal zone with associated upwelling cell and thus moved into areas with both higher concentrations of fishing gear as well as greater shipping activity. NOAA reported that over 50% of humpback strandings had evidence of human activity in terms of either entanglement or ship strike. Further investigation is needed into the exact timing of the Humpback Whale mortality events relative to the passage of the Marine Heatwave in 2017.
Future Research Directions
There is a clear need to examine the dynamics of this Marine Heatwave using numerical hindcasts. The exact mechanisms and processes by which Warm Core Ring water is transported across the shelfbreak and eventually to the 30–40 m isobaths must be explored in detail to determine the triggering mechanism. Both vertical mixing processes as well as altered air-sea fluxes are likely to modify Warm Core Ring water as it passes onto the continental shelf. One possible mechanism for initiation of this event is the reversal of density gradients at the shelfbreak. We note that Zhang and Gawarkiewicz (2015) have previously shown that ring water may be less dense than shelf water during spring (April/May 2014) and this may even be more pronounced in winter. Further investigation is necessary to establish how density gradients across the shelfbreak may be varying in the presence of more frequent Warm Core Ring encounters with the outer continental shelf. The OOI Pioneer Array should be useful in providing systematic (seasonal and inter-annual) reversals of density gradients that might generate large temperature and salinity anomalies over the continental shelf.
Future research should also be directed to establish whether the shelfbreak south of Nantucket Shoals has become a recent Hot Spot for the onshore transport of Warm Core Ring water masses. The presence of the Great South Channel likely complicates the interaction of Warm Core Ring induced flows over the continental shelf due to bathymetric steering and the establishment of local along and cross-isobath pressure gradients. Further analysis of both sea surface temperature imagery and OOI Pioneer Array glider data is clearly warranted.
Conclusion
A suite of observations is used to establish the occurrence of a Marine Heatwave south of New England in January 2017 and over the New Jersey continental shelf in late January and February 2017. The warm anomalies reached 6°C relative to a long-term climatology and salinity anomalies as large as 1 PSU could be tracked downstream to the continental shelf north of Cape Hatteras in late April.
The Marine Heatwave and associated salinity anomalies traversed the entire Middle Atlantic Bight, moving from the shelf south of Nantucket Shoals to a region just north of Cape Hatteras over a period of 4 months. Much more research is needed to investigate the dynamics of these ring intrusions and their frequency of occurrence as well as their possible effects on shelf and slope ecosystems.
Data Availability Statement
The datasets generated for this study are available on request to the corresponding author.
Author Contributions
GG identified Heatwave event initially organized analysis, wrote first draft, directed figures and made some figures, identified possible link to Unusual Mortality Event for Humpback whales, oversaw edits, compiled references. KC analyzed SST data, discussed historical databases and obtained WOD data and analyzed this data, discussed interpretation and overall structure of manuscript at every stage, placed event into larger context of Heatwave literature. JF analyzed Oleander data from New Jersey, made figures, and wrote section. FB processed Shelf Fleet data, made preliminary figures, discussed choices of data presentation, extensively discussed comparisons between Shelf Fleet data and historical observations. AM and AE oversaw collection of Shelf Fleet data, added material on ecosystem impacts, and edited first draft of manuscript. PF provided ECOMON data and assisted in analysis and improvement of figures, provided important feedback and comments on first draft of manuscript. HS, SH, and LH deployed B1 mooring, made figures, commented on first draft, important edits, and feedback on first draft.
Funding
GG was supported by the van Beuren Charitable Foundation, the National Science Foundation under grants OCE-1657853 and OCE-1558521 as well as a Senior Scientist Chair from the Woods Hole Oceanographic Institution. KC was supported by the National Science Foundation under grants OCE-1558960 and OCE-1634094. JF was supported by the National Science Foundation OCE-1634094. AM and AE were supported by the van Beuren Charitable Foundation. HS, SH, and LH were supported by the National Science Foundation OCE-1558920.
Conflict of Interest
The authors declare that the research was conducted in the absence of any commercial or financial relationships that could be construed as a potential conflict of interest.
Footnotes
References
Andres, M. (2016). On the recent destabilization of the gulf stream path downstream of cape hatteras. Geophys. Res. Lett. 43, 836–839. doi: 10.1002/2016GL069966
Chen, K., Gawarkiewicz, G. G., Lentz, S. J., and Bane, J. M. (2014). Diagnosing the warming of the northeastern US coastal ocean in 2012: a linkage between the atmospheric jet stream variability and ocean response. J. Geophys. Res. 119, 218–227. doi: 10.1002/2013JC009393
Flagg, C., Dunn, M., Wang, D.-P., Rossby, H., and Benway, R. L. (2006). A study of the currents of the outer shelf and upper slope from a decade of shipboard ADCP observations in the middle atlantic bight. J. Geophys. Res. Oceans 111:C06003.
Fleming, N. (2016). Seasonal and Spatial Variability in Temperature, Salinity, and Circulation of the Middle Atlantic Bight. Ph.D. thesis, Rutgers University, Camden, NJ.
Forsyth, J. S. T., Andres, M., and Gawarkiewicz, G. G. (2015). Recent accelerated warming of the continental shelf off New Jersey: observations from the CMV Oleander expendable bathythermograph line. J. Geophys. Res. Oceans 120, 370–372. doi: 10.1002/2014JC010516
Frohlicher, T., Fischer, E., and Gruber, N. (2018). Marine heatwaves under global warming. Nature 560, 360–366. doi: 10.1038/s41586-018-0383-9
Gangopadhyay, A., Gawarkiewicz, G., Etige, E. N., Monim, M., and Clarke, J. (2019). An observed regime shift in the formation of warm core rings from the gulf stream. Sci. Rep. 9:12319. doi: 10.1038/s41598-019-48661-9
Gawarkiewicz, G., Bahr, F., Linder, C., and Marquette, C. (2008). Shelfbreak frontal structure and processes north of cape hatteras in winter. J. Mar. Res. 66, 775–799. doi: 10.1357/002224008788064595
Gawarkiewicz, G., and Linder, C. (2006). Lagrangian flow patterns north of Cape Hatteras using near-surface drifters. Prog. Oceanogr. 70, 181–195. doi: 10.1016/j.pocean.2006.03.020
Gawarkiewicz, G., and Malek Mercer, A. (2019). Partnering with fishing fleets to monitor ocean conditions. Ann. Rev. Mar. Sci. 11, 391–411. doi: 10.1146/annurev-marine-010318-095201
Gawarkiewicz, G., and Plueddemann, A. J. (2019). Scientific rationale and conceptual design of a process-oriented shelfbreak observatory: the OOI Pioneer Array. J. Operat. Oceanogra. 1–18. doi: 10.1080/1755876X.2019.1679609
Gawarkiewicz, G., Todd, R., Plueddemann, A., and Andres, M. (2012). Direct interaction between the gulf stream and the shelf break south of new England. Sci. Rep. 2:553. doi: 10.1038/srep00553
Gawarkiewicz, G., Todd, R. E., Zhang, W., Partida, J. A., Gangopadhyay, M.-U.-H., and Monim, P. (2018). The changing nature of shelfbreak exchange revealed by the OOI pioneer array. Oceanography 31, 60–70. doi: 10.5670/oceanog.2018.110
Hobday, A. J., Lisa, V. A., Sarah, E. P., Dan, A. S., Sandra, C. S., Eric, C. J. O., et al. (2016). A hierarchical approach to defining marine heatwaves. Prog. Oceanogr. 141, 227–238. doi: 10.1016/j.pocean.2015.12.014
Holbrook, N. J., Scannell, H. A., Sen Gupta, A., Benthuysen, J. A., Feng, M., and Oliver, E. C. J. (2019). A global assessment of marine heatwaves and their drivers. Nat. Commun. 10:2624. doi: 10.1038/s41467-019-10206-z
Houghton, R. W., Schlitz, R., Beardsley, R. C., Butman, B., and Lockwood Chamberlin, J. (1982). The middle atlantic bight cold pool: evolution of the temperature structure during summer 1979. J. Phys. Oceanogr. 12:19.
Lentz, S. (2008). Observations and a model of the mean circulation over the middle atlantic bight continental shelf. J. Phys. Oceanogr. 38, 1203–1221. doi: 10.1175/2007jpo3768.1
Lentz, S., Shearman, K., Anderson, S., Plueddemann, A., and Edson, J. (2003). Evolution of stratification over the new england shelf during the coastal mixing and optics study. J. Geophys. Res. 108:3008. doi: 10.1029/2001JC001121
Levin, J., Wilkin, J., Fleming, N., and Zavala-Garay, J. (2018). Mean circulation of the Mid-atlantic bight from a climatological data assimilative model. Ocean Model. 128, 1–14. doi: 10.1016/j.ocemod.2018.05.003
Limeburner, R., Beardsley, R., and Brink, K. (2000). GLOBEC Drifter Data Report. Falmouth, MA: Woods Hole Oceanographic Institution.
Linder, C. A., and Gawarkiewicz, G. (1998). A climatology of the shelfbreak front in the middle atlantic bight. J. Geophys. Res. 103, 405–418. doi: 10.1029/98JC01438
Linder, C. A., Gawarkiewicz, G. G., and Pickart, R. S. (2004). Seasonal characteristics of bottom boundary layer detachment at the shelfbreak front in the middle atlantic bight. J. Geophys. Res. 109:C03049. doi: 10.1029/2003JC002032
Lozier, M. S., and Gawarkiewicz, G. (2001). Cross-frontal exchange in the middle atlantic bight as evidenced by surface drifters. J. Phys. Oceanogr. 31, 2498–2510. doi: 10.1175/1520-0485(2001)031<2498:cfeitm>2.0.co;2
Mills, K., Pershing, A., Brown, C., Chen, Y., Chiang, F.-S., and Holland, D. (2013). Fisheries management in a changing climate: lessons from the 2012 ocean heat wave in the Northwest Atlantic. Oceanography 26, 191–195. doi: 10.5670/oceanog.2013.27
National Marine Fisheries Service [NOAA] (2018). Ecosystem Monitoring Cruise Results. Silver Spring, MD.: NOAA.
Oliver, E. C. J., Donat, M. G., Burrows, M. T., Moore, P. J., Smale, D. A., Alexander, L. V., et al. (2018). Longer and more frequent marine heatwaves over the past century. Nat. Commun. 9:1324. doi: 10.1038/s41467-018-03732-9
Savidge, D., and Bane, J. (2001). Wind and gulf stream influences on along-shelf transport and off-shelf export at cape hatteras, North Carolina. J. Geophys. Res. Oceans 106, 11505–11527. doi: 10.1029/2000jc000574
Scannell, H. A., Pershing, A., Alexander, M., Thomas, A., and Mills, K. (2016). Frequency of marine heatwaves in the North Atlantic and North Pacific since 1950. Geophys. Res. Lett. 43, 2069–2076. doi: 10.1002/2015gl067308
Zhang, W., and Gawarkiewicz, G. (2015). Dynamics of the direct intrusion of gulf stream ring water onto the mid-atlantic bight shelf. Geophys. Res. Lett. 42, 687–687. doi: 10.1002/2015GL065530
Keywords: Heatwave, Middle Atlantic Bight, shelfbreak front, warm core ring, coastal ocean circulation
Citation: Gawarkiewicz G, Chen K, Forsyth J, Bahr F, Mercer AM, Ellertson A, Fratantoni P, Seim H, Haines S and Han L (2019) Characteristics of an Advective Marine Heatwave in the Middle Atlantic Bight in Early 2017. Front. Mar. Sci. 6:712. doi: 10.3389/fmars.2019.00712
Received: 27 May 2019; Accepted: 05 November 2019;
Published: 22 November 2019.
Edited by:
Katrin Schroeder, National Research Council, ItalyReviewed by:
Alberto Ricardo Piola, Naval Hydrography Service, ArgentinaJacopo Chiggiato, Italian National Research Council (CNR), Italy
Copyright © 2019 Gawarkiewicz, Chen, Forsyth, Bahr, Mercer, Ellertson, Fratantoni, Seim, Haines and Han. This is an open-access article distributed under the terms of the Creative Commons Attribution License (CC BY). The use, distribution or reproduction in other forums is permitted, provided the original author(s) and the copyright owner(s) are credited and that the original publication in this journal is cited, in accordance with accepted academic practice. No use, distribution or reproduction is permitted which does not comply with these terms.
*Correspondence: Glen Gawarkiewicz, Z2xlbmdAd2hvaS5lZHU=