 Rafael Gonçalves-Araujo
 Rüdiger Röttgers
 Lumi Haraguchi
 Frederico Pereira Brandini
- 1Oceanographic Institute, University of São Paulo, São Paulo, Brazil
- 2National Institute of Aquatic Resources, Technical University of Denmark (DTU-Aqua), Lyngby, Denmark
- 3Remote Sensing Department, Institute of Coastal Research, Centre for Materials and Coastal Research, Helmholtz-Zentrum Geesthacht, Geesthacht, Germany
- 4Marine Research Centre, Finnish Environment Institute (SYKE), Helsinki, Finland
- 5Department of Bioscience, Aarhus University, Aarhus, Denmark
The South Brazilian Bight (SBB) is a hydrographically dynamic environment with strong seasonality that sustains a diverse planktonic community involved in diverse biogeochemical processes. The inherent optical properties (IOPs; e.g., absorption and scattering coefficients) of optically actives constituents of water (OACs; phytoplankton, non-algal particles–NAP, and colored dissolved organic matter–CDOM) have been widely employed to retrieve information on biogeochemical parameters in the water. In this study conducted in the SBB, a cross-shelf transect was performed for biogeochemistry and hydrographic sampling during a summer expedition. Our research aimed to determine the distribution and amount of the OACs based on their spectral signature, in relation to the distribution of water masses in the region. That allows us to get insights into the biogeochemical processes within each water mass and in the boundaries between them. We observed a strong intrusion of South Atlantic Central Water (SACW) over the shelf, mainly driven by the wind action. With that, phytoplankton development was fueled by the input of nutrients, and increased chlorophyll-a (Chl-a) concentrations were observed within the shallowest stations. Colored dissolved organic matter did not follow the distribution of dissolved organic carbon (DOC). Both CDOM and DOC presented high values at the low salinity Coastal Water (CW), as an indication of the continental influence over the shelf. However, CDOM was inversely correlated with salinity and lowest values were observed within Tropical Water (TW), whereas DOC values within TW were as high as within CW, indicating an autochthonous DOM source. Additionally, a deep Chl-a maximum (DCM) was noticed in the boundary between the TW and SACW. Along with the DCM, we observed the production of fresh, non-colored DOM attributed to the microbial community. Finally, our results suggest that CDOM is photodegraded at the surface of CW. This is mainly due to the Ekman transport effect over the region that traps CW at the surface, making it longer exposed to solar radiation.
Introduction
Satellite remote sensing and bio-optical, autonomous, sensor-based monitoring have become the state-of-the-art regarding oceans surveying in the past decades, by effectively increasing sampling resolution. Hence, an extensive effort has been devoted for developing and improving those sensors and platforms (IOCCG, 2008, 2011; Moline et al., 2012). The optical properties of the water, classified as inherent optical properties (IOPs, e.g., absorption and scattering coefficients) and apparent optical properties (AOPs, e.g., diffuse attenuation coefficients, reflectance) can provide valuable information on the oceans’ biogeochemistry and therefore have been extensively sampled throughout the global oceans (IOCCG, 2006). IOPs and AOPs, in turn, have their characteristics determined by the distribution of the optically active constituents of water (OACs), e.g., phytoplankton, colored dissolved organic matter (CDOM), and non-algal particles (NAP). OACs absorb light primarily at ultra-violet (UV) and short visible (VIS) wavelengths (IOCCG, 2006) and are responsible for most of the absorption budget in those spectral regions (Murray et al., 2015; Pérez et al., 2016). Information on the spectral properties of those components are generally applied, for instance, as a proxy to assess the amount of CDOM present in the water, the phytoplankton biomass and the concentration of particles (IOCCG, 2006). On top of that, with a deeper look into the spectral shape of the non-water absorbers, one can retrieve information on the different phytoplankton functional types (IOCCG, 2014) and the composition of the DOM-pool (Coble, 2007), its origins and reactivity (Stedmon and Markager, 2001; Helms et al., 2008).
In global, open, clear, case 1 waters, the estimates of bio-optical- and biogeochemical properties from remotely sensed ocean color are robust and reliable (Mobley et al., 2004). On the other hand, in coastal, dark, case 2 waters and in under-sampled regions, global ocean color algorithms tend to provide poor estimates and, therefore, regional improvements are required (Mobley et al., 2004). This is the case for the Southwestern (SW) Atlantic (Giannini et al., 2013), where ocean color algorithms tend to overestimate chlorophyll-a (Chl-a) concentrations, mostly due to the under-sampling of water optical properties (Giannini et al., 2013). To rectify this and to increase the understanding about the optical properties of water in the SW Atlantic, this study brings novel data on the non-water absorbers and their relation to hydrographic conditions within the South Brazilian Bight (SBB), a very dynamic region of the SW Atlantic (Figure 1). Those results can be further used for validation of ocean color remote sensing estimates (e.g., through the so-called “match up” exercises) and thus contribute to establishing a more accurate bio-optical monitoring platform in the SW Atlantic.
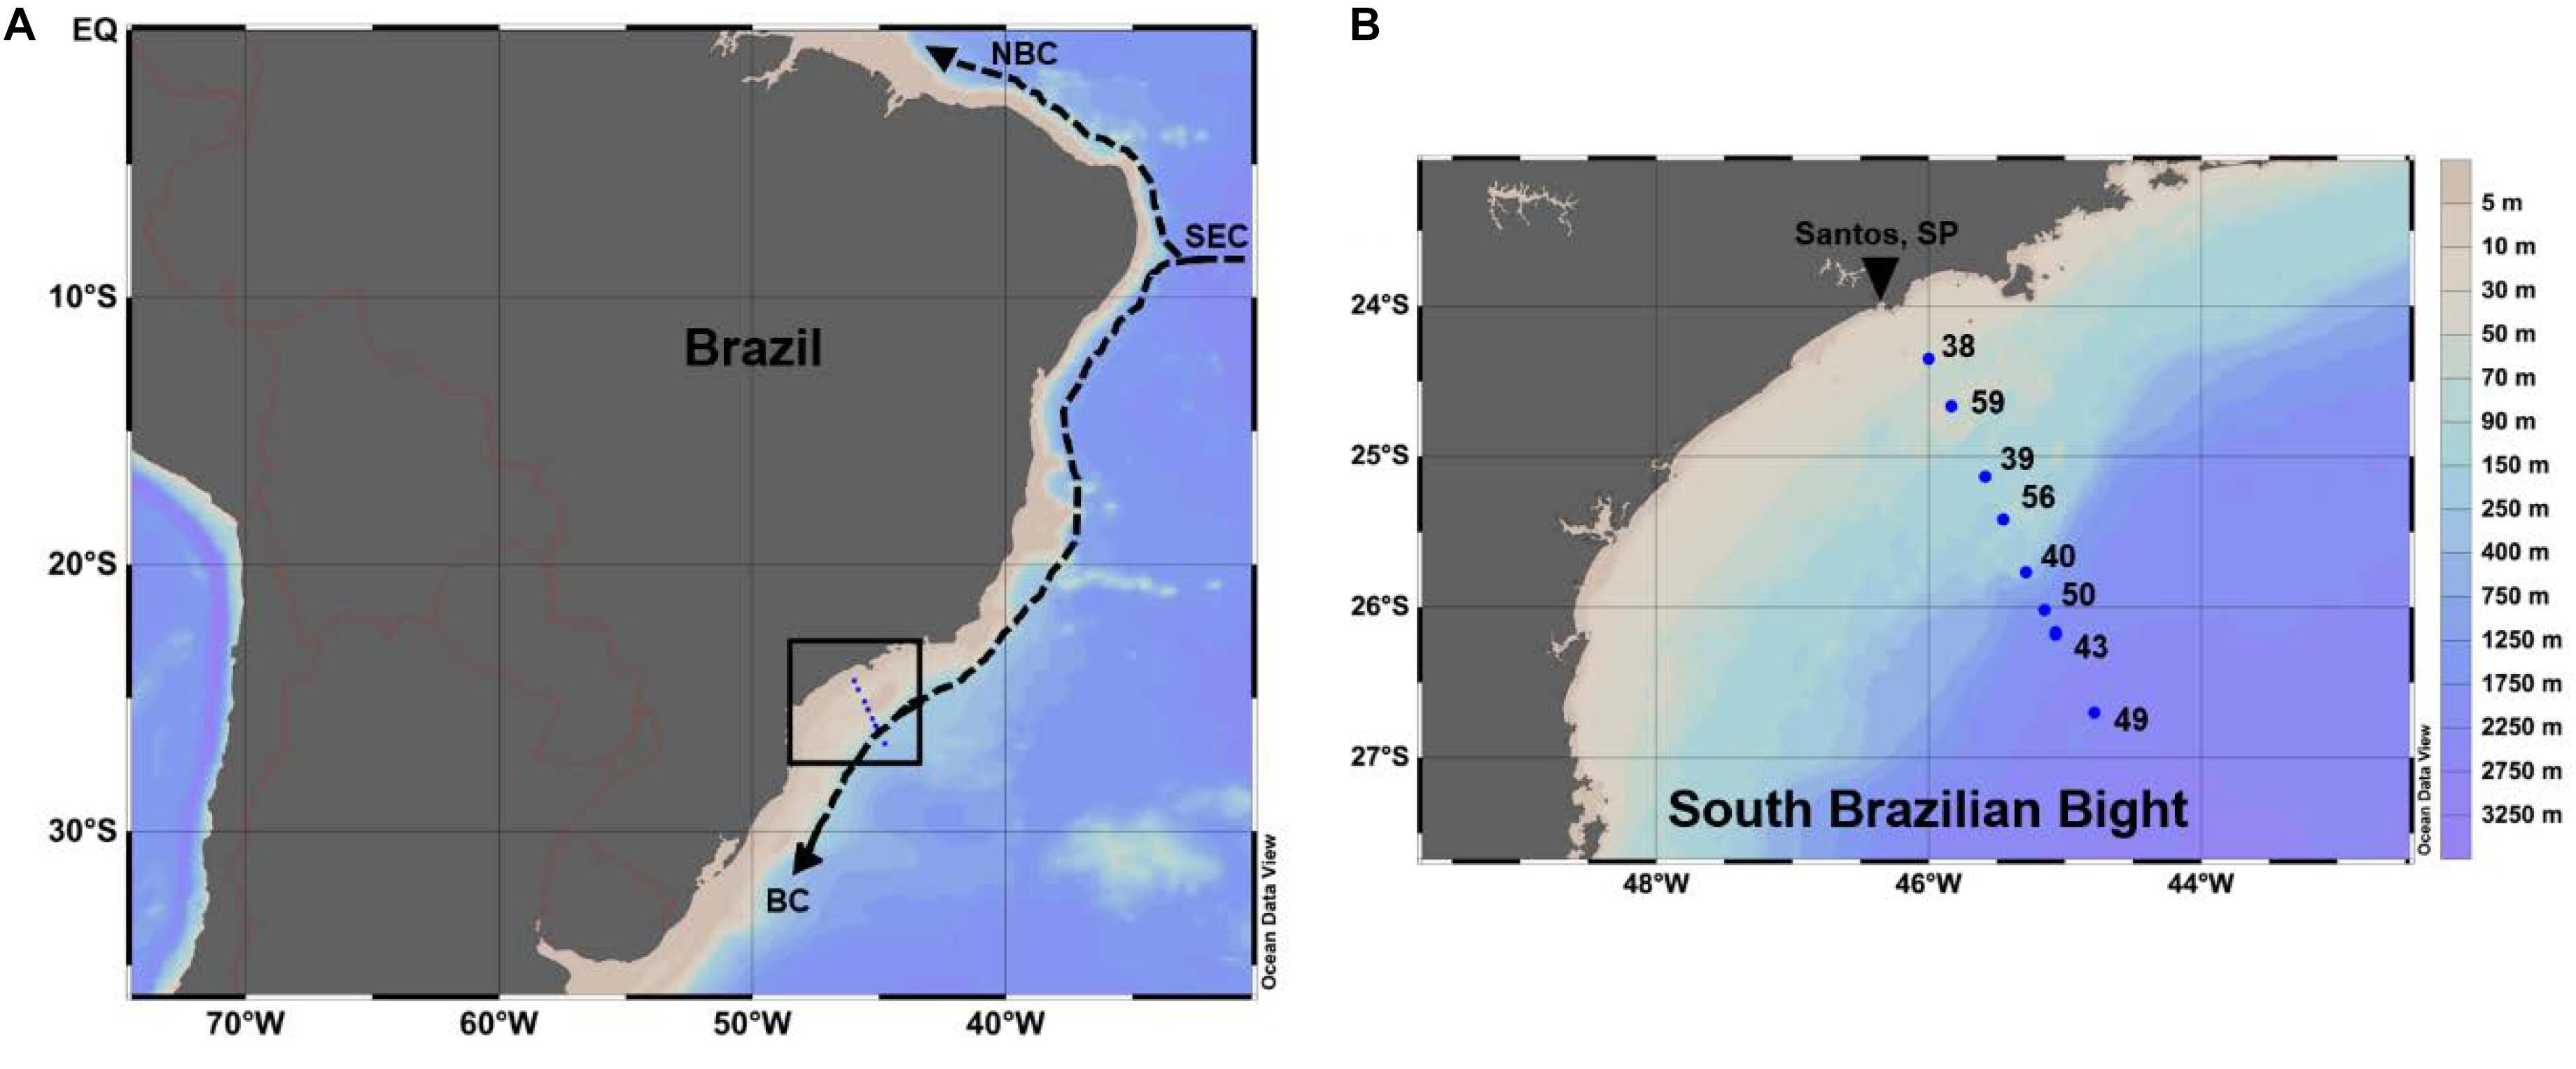
Figure 1. (A) Southwestern Atlantic Ocean and (B) the South Brazilian Bight (SBB). Blue dots show the position of oceanographic stations occupied during the CARBOM-3 cruise in January 2013. Arrows in panel (A) shows the most prominent currents in the SW Atlantic: South Equatorial Current–SEC, North Brazil Current–NBC and Brazil Current–BC. Produced with Ocean Data View (Schlitzer, 2016).
The SSB, is a transitional zone that encompasses the shelf and shelf-break environments between the subtropical and temperate domains (23–28.5°S) in the SW Atlantic (Longhurst, 2007). It is influenced by distinct hydrographic conditions, with a continental runoff influence over the inner and mid-shelf, where the coastal water (CW) is observed with salinity generally <35 (Castro et al., 2006). At the same time, the surface layer along the outer-shelf and shelf-break is influenced by the Tropical Water (TW) transported by the Brazil Current. Beneath the surface layer, the entire water column is characterized by the presence of the South Atlantic Central Water (SACW) (Castro, 2014). High phytoplankton biomass with great contribution of micro-planktonic organisms is observed in the inner-shelf, fueled by the nutrient input from continental runoff, whereas small organisms dominate within the oligotrophic TW (Brandini et al., 2007; Bergo et al., 2017; Gonçalves-Araujo et al., 2018a). During summer time, with the intense action of NE winds coupled to the Ekman transport, the shelf waters are pushed offshore, allowing for the intrusion of nutrient-rich SACW within the entire continental shelf (Castro, 2014). This promotes, in the euphotic zone, the fertilization of the shallower waters, triggers the phytoplankton development and, thus, stimulates the primary production within the region (Brandini et al., 2014; Bergo et al., 2017).
Given the hydrographical and biogeochemical complexity of the SBB, this study brings results from a novel expedition conducted in the region, where the absorption budget of non-water constituents was analyzed in conjunction with hydrographical and biogeochemical parameters. Therefore, we aim at characterizing the absorption by CDOM and particulate matter (i.e., phytoplankton+NAP) with respect to the hydrographic variability in the region, and how biogeochemical processes modulate such a spatial variability observed within that region. Additionally, we test the hypothesis that, analogously to what has been observed for river plumes (Gonçalves-Araujo et al., 2015), the relatively high-CDOM CW would be more exposed to sun light leading to photochemical changes in DOM spectral features. Finally, considering the novelty of the bio-optical dataset here presented and the limited amount of oceanographic campaigns conducted in the region, the findings and data reported in this study are of great importance for understanding the biogeochemical processes within the SBB and has the potential to be further used for designing future projects and campaigns in the region.
Materials and Methods
Water and Sensor Sampling and Hydrography
The CARBOM-3 expedition was conducted onboard the R/V Alpha Crucis between January 25th and 30th in 2013. Sampling was performed along a cross-shelf transect in the SBB, which was split into eight oceanographic stations. Sampling stations were strategically chosen to cover the inner-, mid- and outer shelf sections of the bight (Figure 1). The hydrographic characteristics of the water column were assessed through vertical profiles acquired with a CTD SeaBird® 911. Chl-a fluorescence profiles [in Relative Fluorescence Units (RFU)] were collected with an in situ fluorometer (ECO FL) attached to a combined rosette carrousel system including the CTD. All profiles were vertically binned to a 1-m resolution. At each station, water samples were taken during the upcast using twelve 10-L Niskin bottles attached to the rosette system at surface and up to six discrete depths were chosen based on CTD and fluorometer downcast profiles. The water masses found within the sampled region were classified according to the thermohaline intervals described for the region’s water masses (Möller et al., 2008).
DOC and Chlorophyll-a (Chl-a) Analyses
After collection, water samples were immediately filtered through 0.22-μm Sterivex filters (Durapore, Millipore) for further determination of DOC concentration. Filtrates were then transferred to glass amber vials (max. volume of 200 mL), and kept frozen until analysis in the laboratory at the Oceanographic Institute of the University of São Paulo (IOUSP). The samples were analyzed in a Total Organic Analyzer (TOC-V 2.0 with a VNP module, Shimadzu Scientific Instruments) with the Pt-catalyzed high-temperature combustion method (Benner and Strom, 1993).
Samples for Chl-a analysis were filtered onto Whatman GF/F filters immediately after sampling. The filtered volume varied between 0.5 L and 2 L from coastal to offshore oligotrophic stations, respectively, depending on visual concentration of suspended matter. The filters were shock-frozen and stored in liquid nitrogen until analysis at the IOUSP. Total Chl-a retained on the filter was extracted in 90% acetone and its concentration was determined using a Turner Designs TD-700 fluorometer, following the non-acidification method (Welschmeyer, 1994).
Particulate Absorption Analysis
Absorbance measurements (370–726 nm) with a point-source integrating-cavity absorption meter (PSICAM) were used to determine the particulate absorption coefficient [ap(λ)] and filtrate (or CDOM) absorption coefficient [ag(λ)] (Röttgers and Doerffer, 2007; Röttgers et al., 2007). In short, the absorption of the sample, i.e., the sum of particulate [ap(λ)] and dissolved [ag(λ)] matter, ag+p(λ), is determined with the PSICAM when purified water served as the reference. Purified water was freshly prepared with a Synergy Ultrapure water system (Millipore) and used as reference. Temperature and salinity effects on the water absorption were corrected using instrument-specific correction factors, and the instrument was calibrated daily using colored solutions of the dye nigrosine (Röttgers and Doerffer, 2007). Each sample was measured three times alternating with measurements of the reference, i.e., purified water. The sample was then filtered, first through a combusted GF/F-filter, then through 0.2 μm (GSWP; Millipore). The absorption of the filtrate, ag(λ), was then measured in the PSICAM. The difference of these two absorption determinations gives the particulate absorption, as follows:
Particulate absorption results are presented in the blue wavelength range (440 nm) to make them comparable to studies conducted in other regions and to be further used for ocean color remote sensing applications.
CDOM Analysis
Samples for analysis of the chromophoric fraction of DOM (CDOM) were taken from Niskin bottles and immediately filtered through 0.2 μm GSWP-Millipore filters. The absorbance of filtrate was measured onboard, directly after filtration, in a Liquid Waveguide Capillary Cell (LWCC) system (World Precision Instruments Inc., United States). The instrument has an optical path length of 2.5 m connected to Deuterium Halogen UV/VIS light sources (DH-2000-BAL, Ocean Optics Inc., United States) and photodiode array spectrometers (AvaSpec ULS2048XL, Avantes, Netherlands). More details on the method are given in the related literature (Lefering et al., 2017). Raw absorbance [A(λ)] spectra (300–700 nm) acquired with the LWCC system were processed and the CDOM absorption coefficients aCDOM(λ) (m–1) were calculated by:
where L is the optical path length and the factor 2.303 is the natural logarithm of 10. CDOM absorbance spectra were not recorded at <300 nm wavelengths due to the unavailability of a LCWW system with a shorter path length for that cruise. In this study, aCDOM is presented for the visible [440 nm—aCDOM(440)] and UV [350 nm—aCDOM(350)] bands only. aCDOM(440) was chosen given its application to ocean color remote sensing (Siegel et al., 2005) and to make it comparable with the particulate matter absorption coefficients (Prieur and Sathyendranath, 1981; Gonçalves-Araujo et al., 2018b). The UV band aCDOM(350) is used in this study due to its correlations with lignin and to allow for comparison with other open water studies conducted worldwide (Spencer et al., 2009; Stedmon et al., 2011; Massicotte et al., 2017).
Besides the determination of the DOM content, the optical characteristics of DOM can give insights into the origin and degree of transformation of DOM through the calculation of optical indices. The spectral slope of CDOM absorption spectrum (S) is such an index and it varies in relation to the source of CDOM (Stedmon and Markager, 2001). It has also been shown to be inversely correlated with the molecular weight of DOM and can be related to photo bleaching (Carder et al., 1989; Blough and Green, 1995; Helms et al., 2008). S is determined by applying an exponential function to the 300–650 nm spectral range (Stedmon and Markager, 2001). It is possible to derive the spectral slope of absorption spectra (S, in μm–1) with the following equation:
where aλ0 is the absorption coefficient at a reference wavelength, λ0.
Data Analysis
Handling and processing of data, as well as statistical analyses, were performed in MATLAB©. We obtained the total absorption budget by summing the pure water absorption spectra from the literature (Pope and Fry, 1997) to the CDOM and particulate absorption spectra obtained in this study. The relationships between all pairs of variables were investigated using Pearson correlation coefficients. To compare the variables among themselves or among different groups of samples, two-sample Kolmogorov–Smirnov tests were applied, after performing normality tests. Furthermore, the relationship between each pair of variables was determined based on reduced major axis (RMA) linear regressions or power function regression (when applicable).
Results
Hydrography
Hydrographic results for the CARBOM-3 expedition have already been reported in a recent study focused on the planktonic component (Bergo et al., 2017) and, therefore, will be briefly presented in this paper. Here we present results based on hydrography profiles from the surface layer comprised between 0 and 500 m. Three water masses were observed, considering the thermohaline indices for the study region: CW, TW and SACW (Figure 2). CW was characterized, on average, by high temperature and the lowest salinity (Table 1) and being observed as a thin surface layer (max. 25 m), over the continental shelf. The offshore TW, on the other hand, presented the highest salinity values and high temperatures (Table 1) and occupied a layer of max. 150 m at the surface of the easternmost stations from the shelf-break to the pelagic domain. SACW was observed at the subsurface layer over the entire sampling region, immediately below TW and CW. It presented the lowest temperatures and intermediate salinity values, on average (Table 1). Apart from the intrusion of SACW over the subsurface layer of the continental shelf, the presence of a seasonal thermocline was noticeable over the entire sampling region. It led to the development of a shallower upper mixed layer at inner shelf stations (ca. 6 m) which deepened toward offshore stations, reaching up to 40 m.
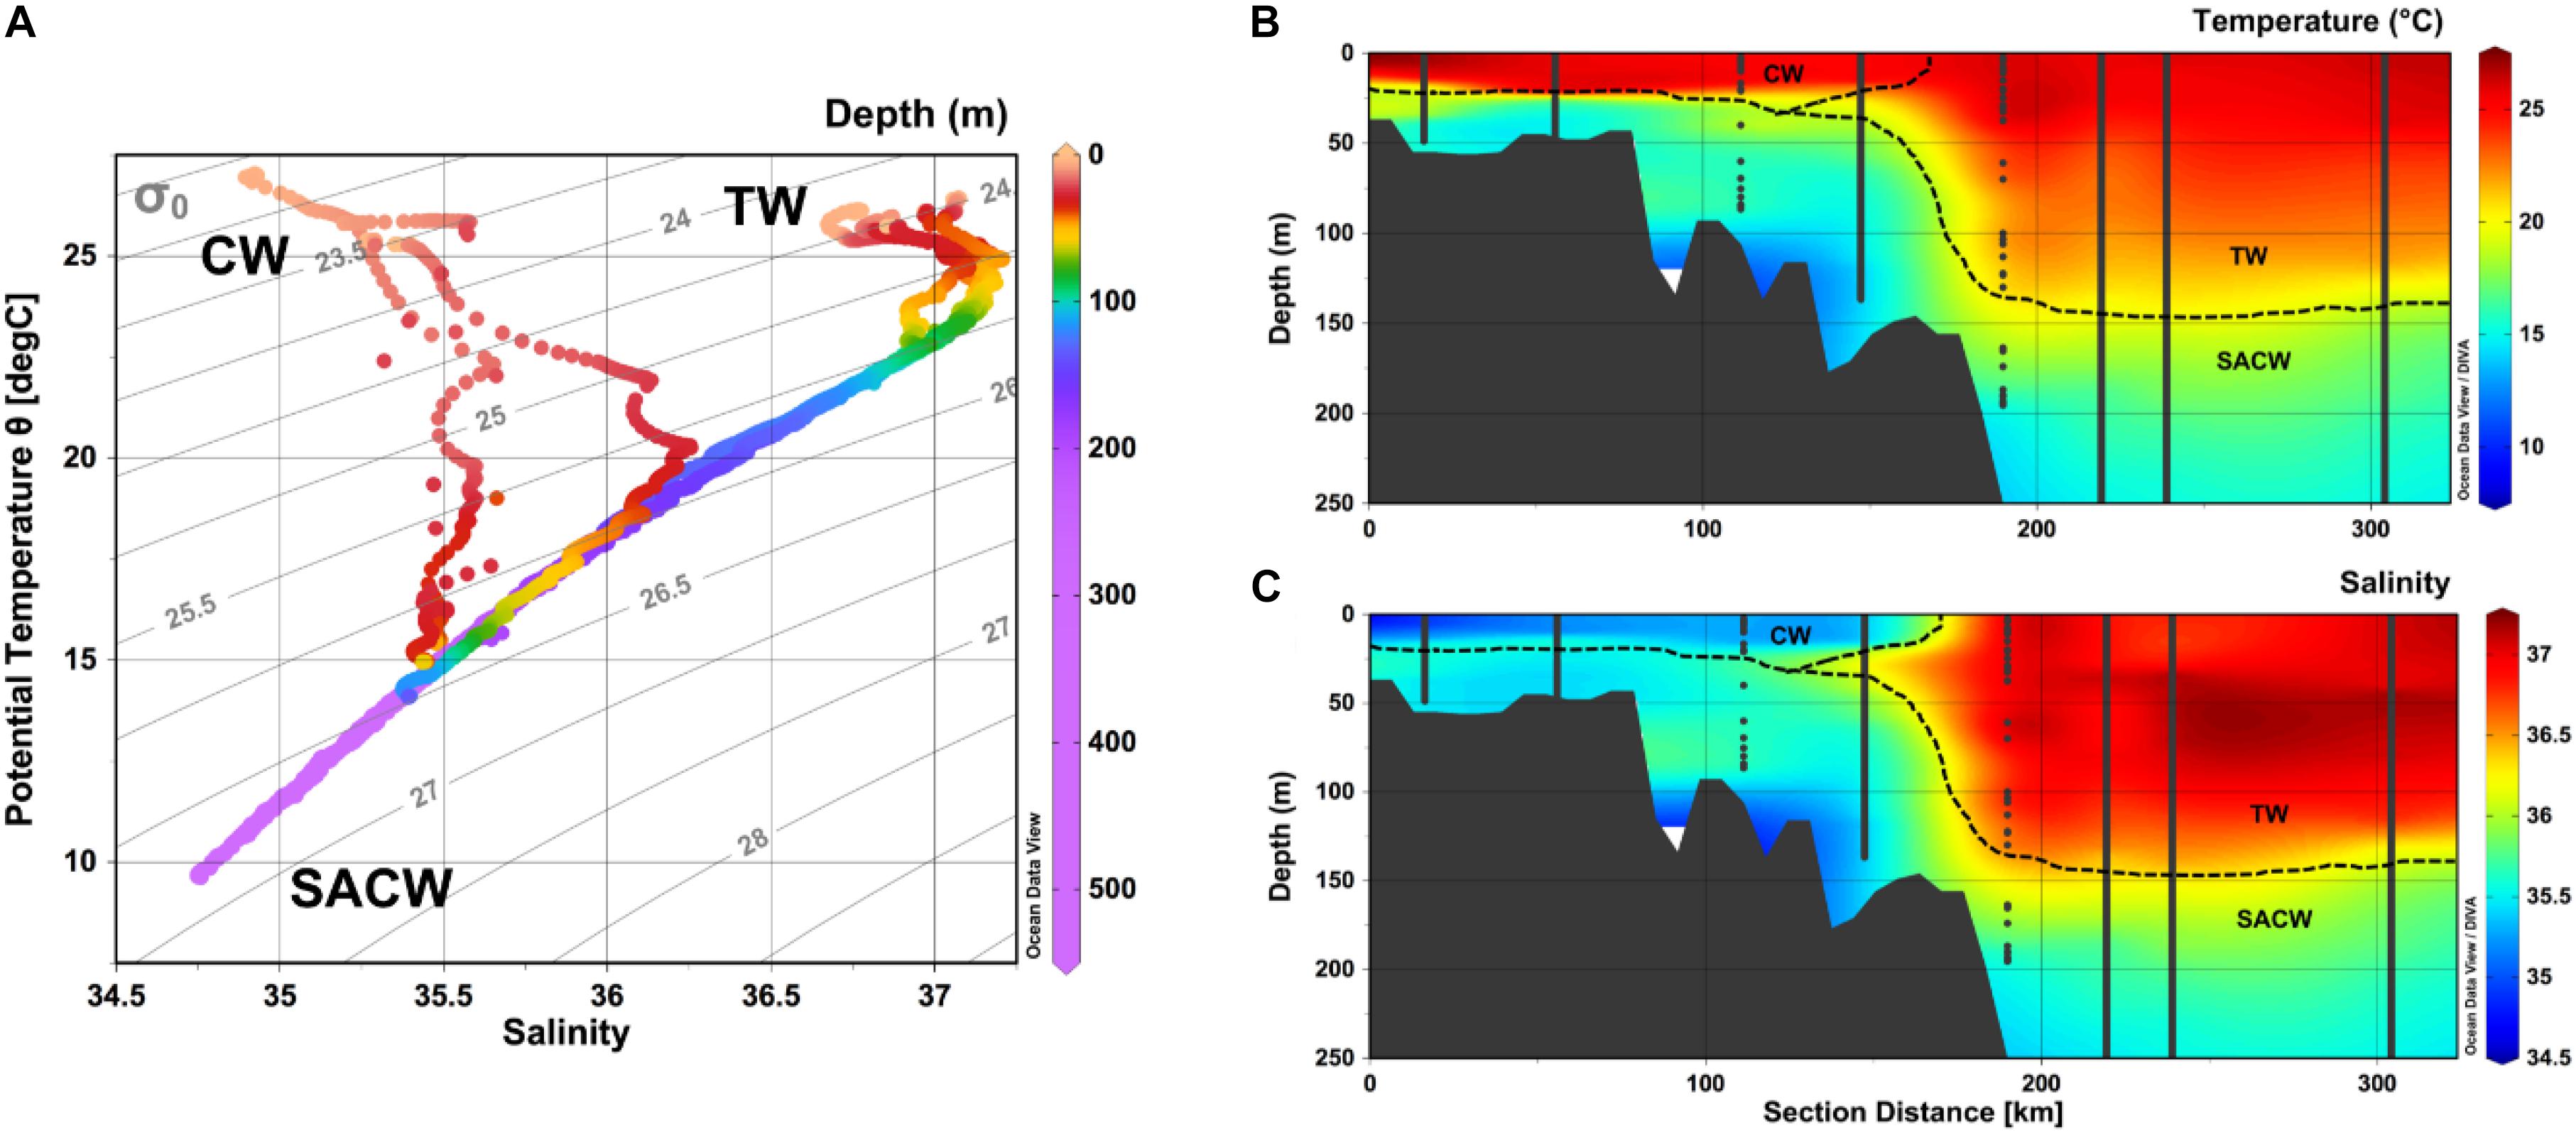
Figure 2. (A) Temperature-Salinity-Depth diagram (0–500 m) depicting the water masses observed within the sampled region (TW, Tropical Water; CW, Coastal Water; SACW, South Atlantic Central Water) with gray lines indicating the isopycnals. Vertical distribution (0–200 m) of (B) temperature and (C) salinity showing the spatial distribution of the identified water masses. Produced with Ocean Data View (Schlitzer, 2016).
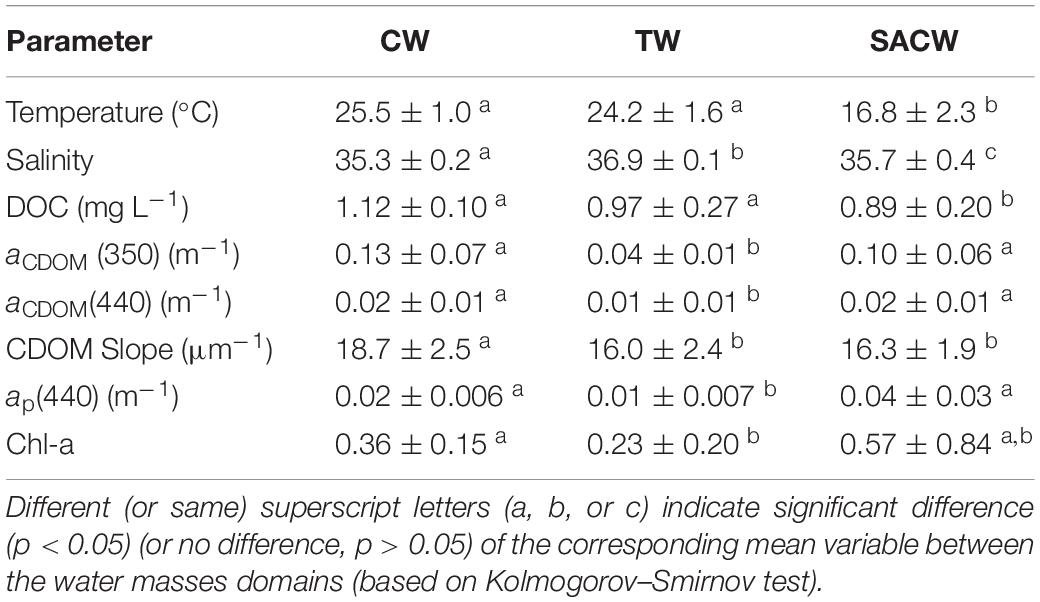
Table 1. Averaged values (±SD) for each water mass (CW, TW, and SACW) of the parameters considered in this study.
Chl-a and Particles Distribution
The highest Chl-a concentrations were observed within the SACW, increasing toward the inner-shelf region (Table 1 and Figure 3). A similar behavior was observed for the other indicators for phytoplankton biomass, such as fluorescence and ap(440), which were significantly correlated with Chl-a concentrations [ap(440) = 0.02875∗Chl-a0.7147, r = 0.89, p < 0.0001] (Table 2 and Figure 4). Additionally, an increase in all of the three parameters [Chl-a, ap(440) and fluorescence] at depth (∼100 m) was observed at stations over the slope and pelagic regions, depicting a clear deep Chl-a maximum (DCM).
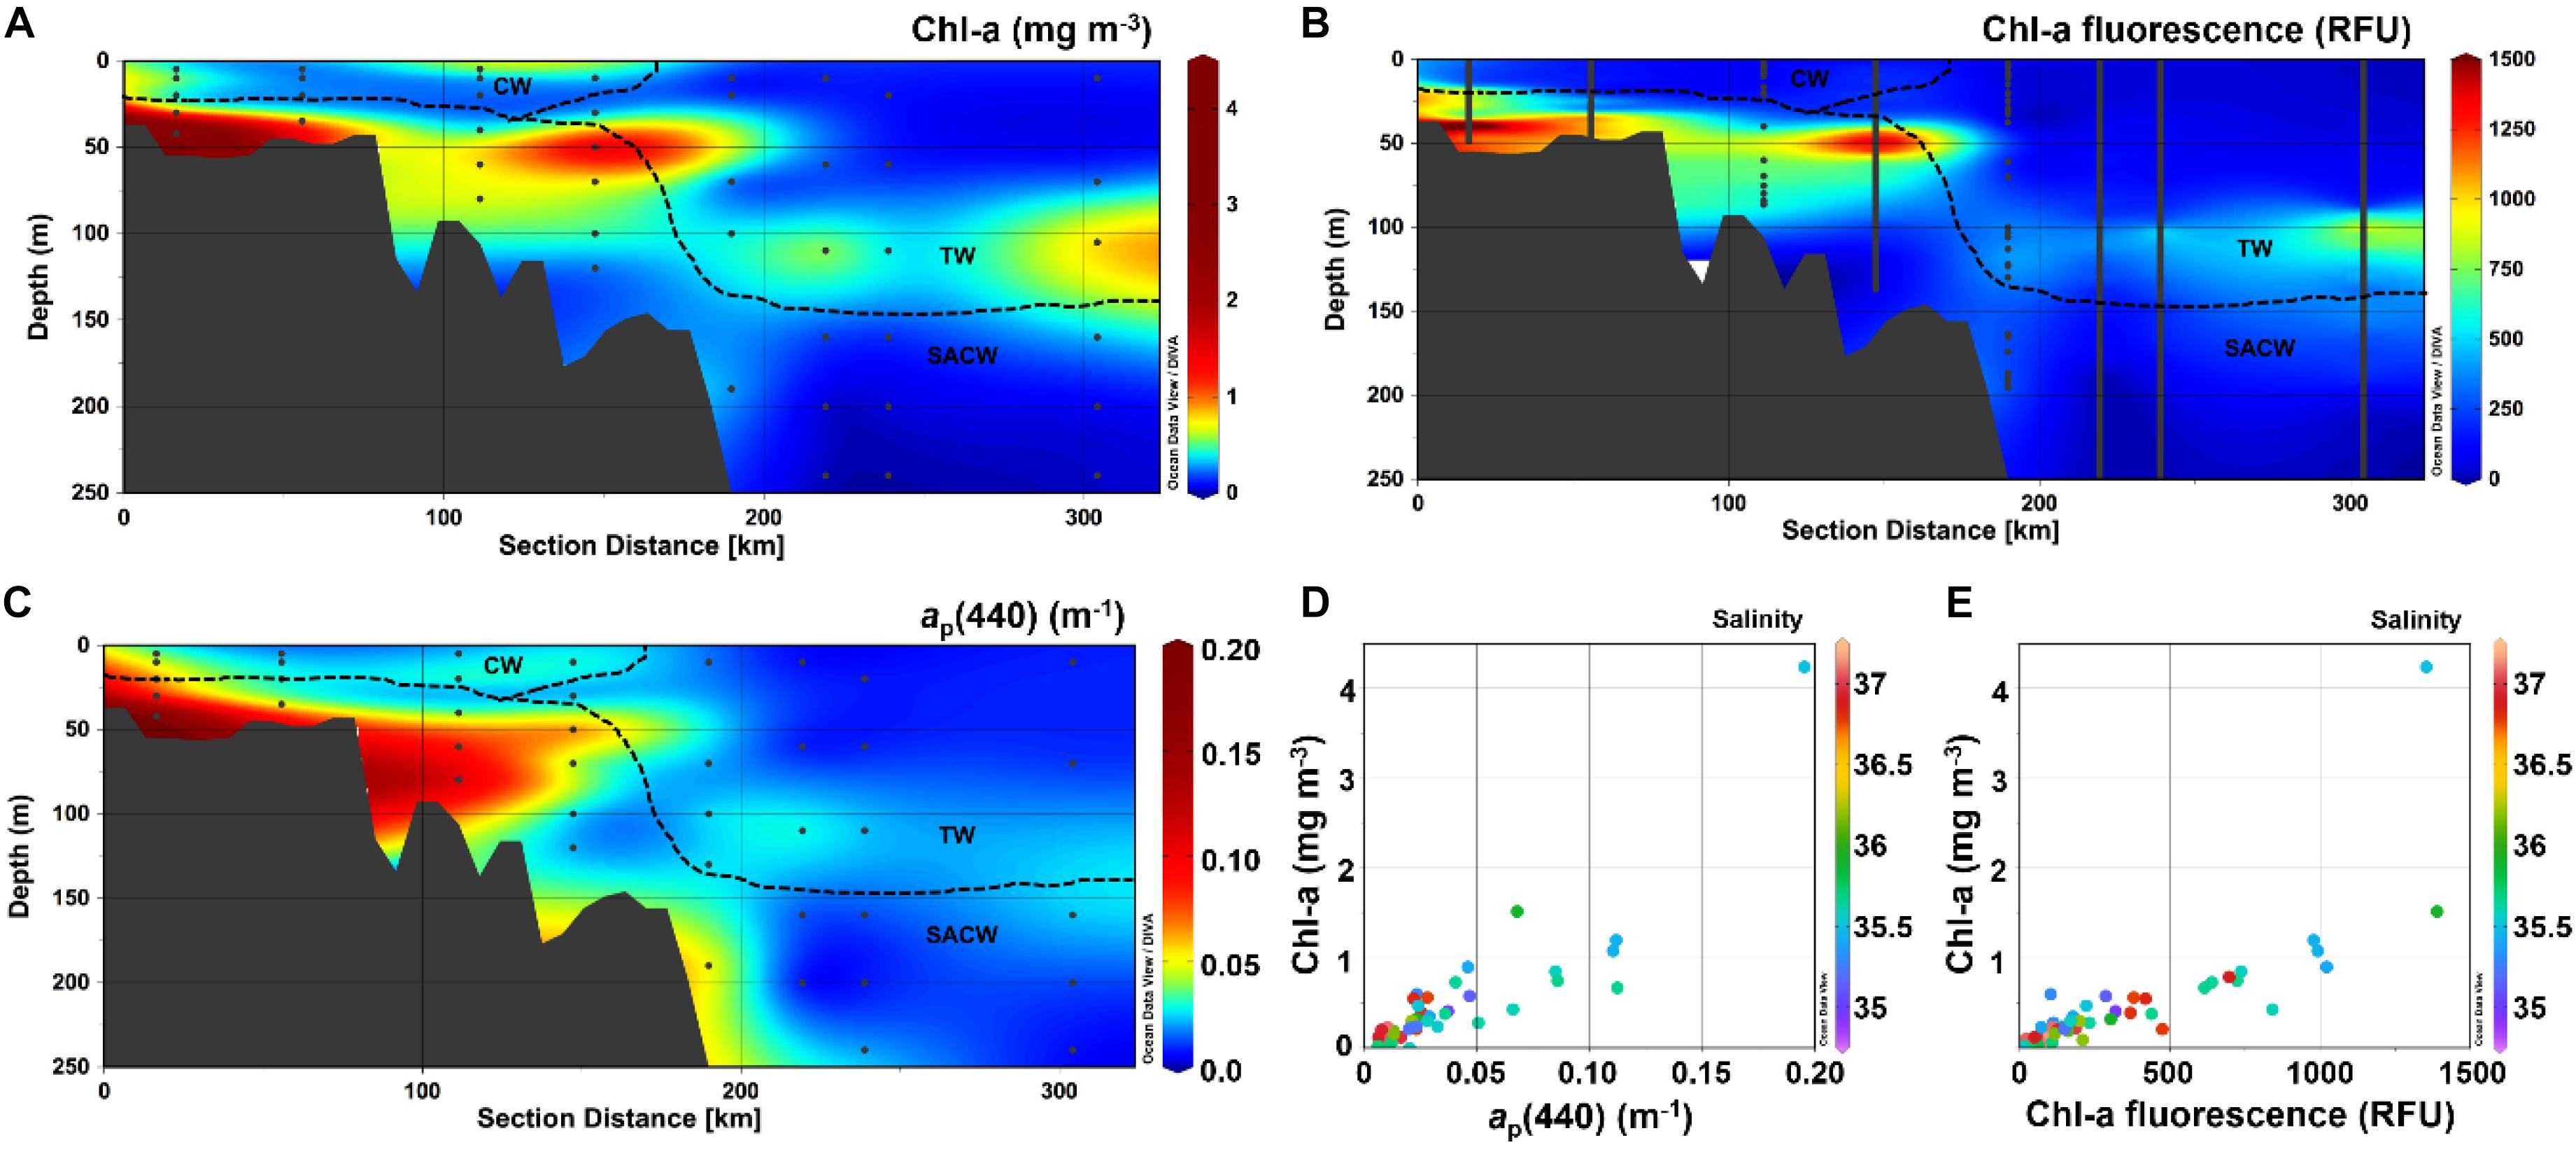
Figure 3. Vertical distribution (0–200 m) of (A) Chl-a (mg m– 3), (B) Chl-a fluorescence (RFU) and (C) ap(440) (m– 1). Scatter plots of (D) ap(440) vs. Chl-a and (E) Chl-a fluorescence against Chl-a, both with Salinity as colorbar. Produced with Ocean Data View (Schlitzer, 2016).
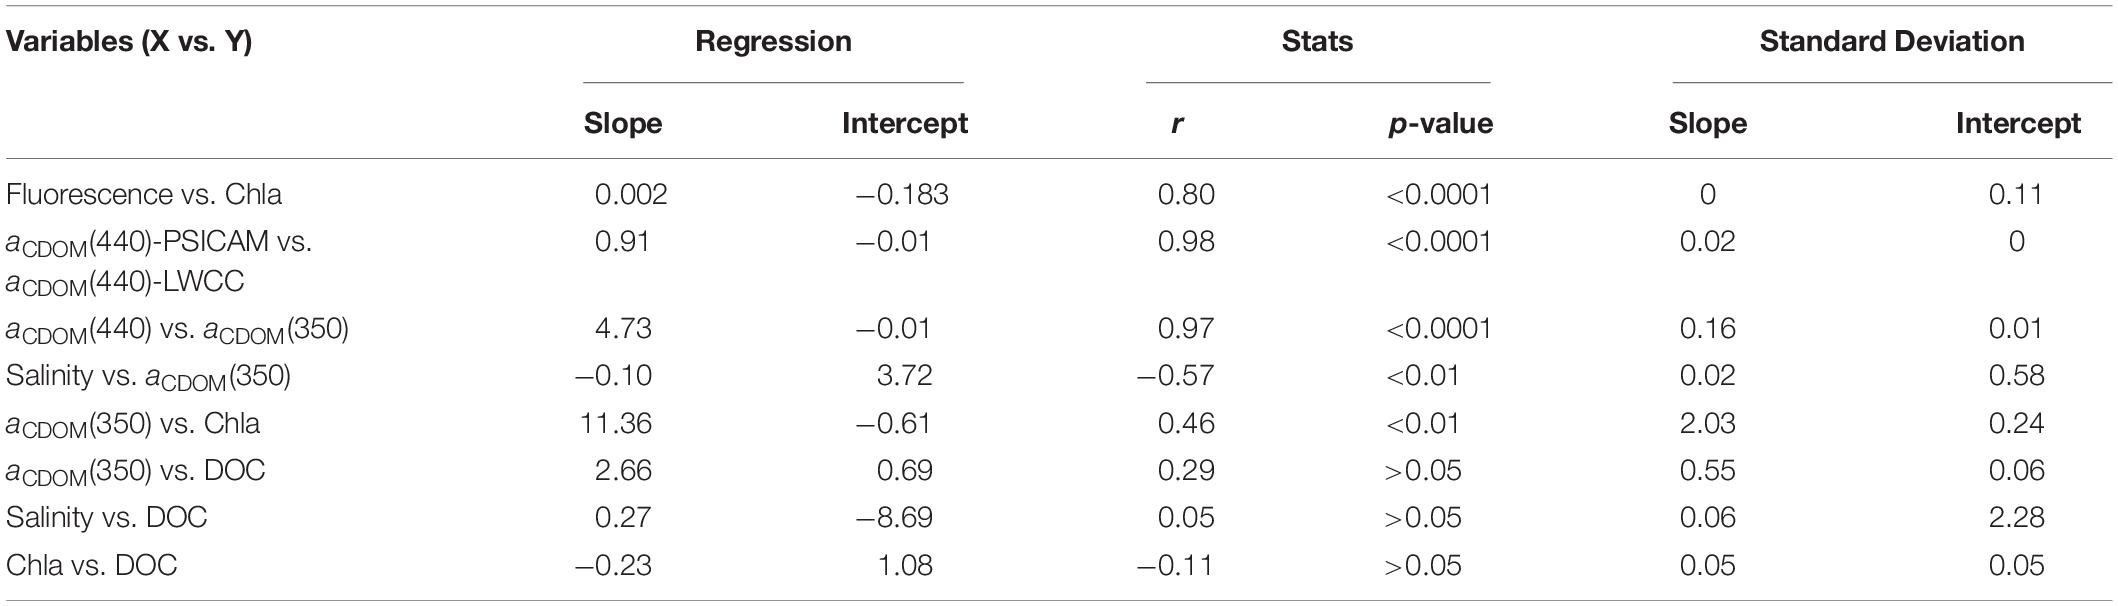
Table 2. Results of the linear regressions applied to different pairs of variables in this study. For all the cases, n = 45.
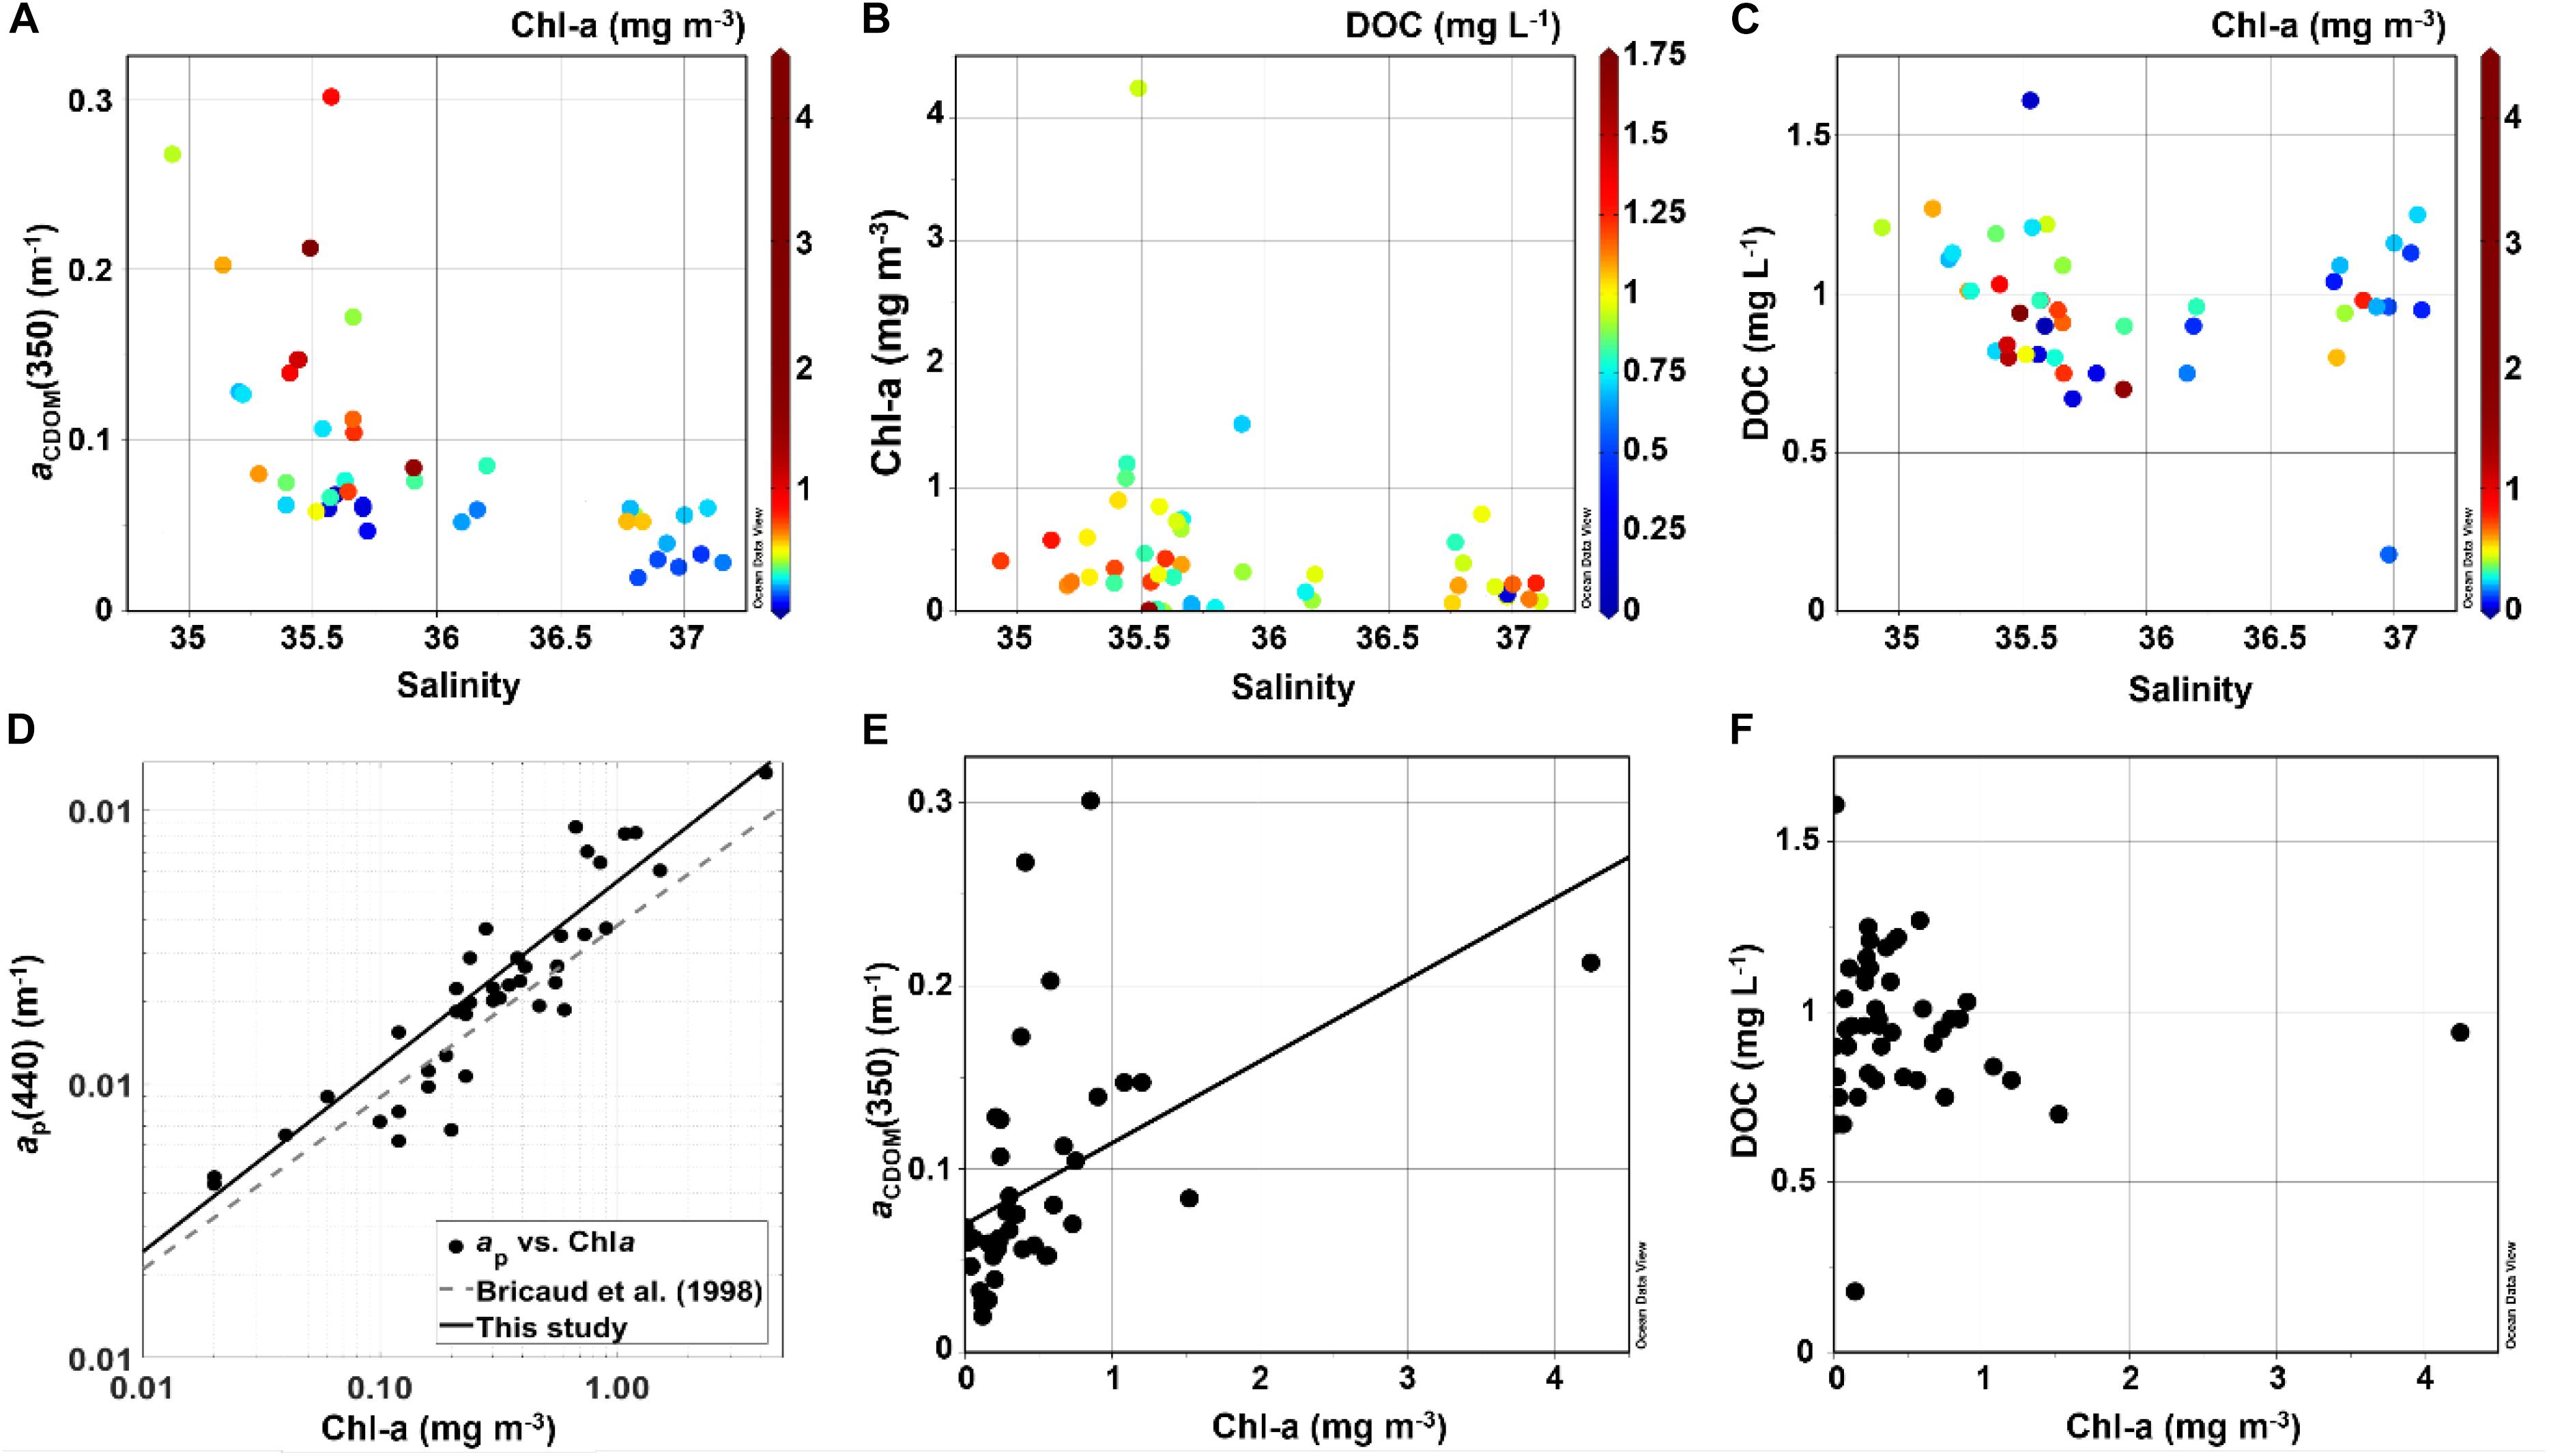
Figure 4. Scatter plots of (A) Salinity vs. aCDOM(350) color-coded as Chl-a, (B) Salinity against Chl-a with DOC as colorbar, (C) Salinity against DOC and Chl-a as colorbar, (D) Chl-a vs. ap(440), (E) Chl-a vs. aCDOM(350) and (F) Chl-a against DOC. All plots except (D) were produced with Ocean Data View (Schlitzer, 2016).
DOM
The CDOM absorption spectra were recorded in this study by two different approaches, as described in the methodology section. The measurements performed with the two instruments (LWCC and PSICAM) were strongly correlated and with a linear regression slope close to 1 (Table 2). Thus, as the LWCC and PSICAM measurements are comparable and given that the LWCC has a wider spectral range in the UV region, we have decided to present CDOM results based only on LCWW measurements. aCDOM(350) was significantly correlated with aCDOM(440) (Table 2 and Figure 5) and, thus, only results using the UV band region will be presented in this study due to the stronger absorption by CDOM and, hence lower measurements errors at this wavelength (Bricaud et al., 1981; Prieur and Sathyendranath, 1981). The highest aCDOM(350) values were observed in the inner-shelf, under influence of both low-salinity CW and SACW, whereas the lowest values were found within TW (Table 1 and Figure 5). Additionally, a subtle increase in aCDOM(350) was observed in the boundary TW–SACW at the easternmost stations. aCDOM(350) was inversely correlated with salinity and positively correlated with Chl-a (Table 2). Although aCDOM(350) was not significantly correlated with DOC (Table 2), the highest DOC concentration was also observed within CW, followed by TW and SACW (Table 1 and Figure 5). Contrarily to aCDOM(350), there was no significant correlation between DOC and salinity nor between DOC and Chl-a (Table 2). The highest S values, on average, were associated to CW (Table 1 and Figure 5). However, a patch with higher S values were observed very close to the surface, over the out-shelf and slope, encompassing both the CW and TW domain.
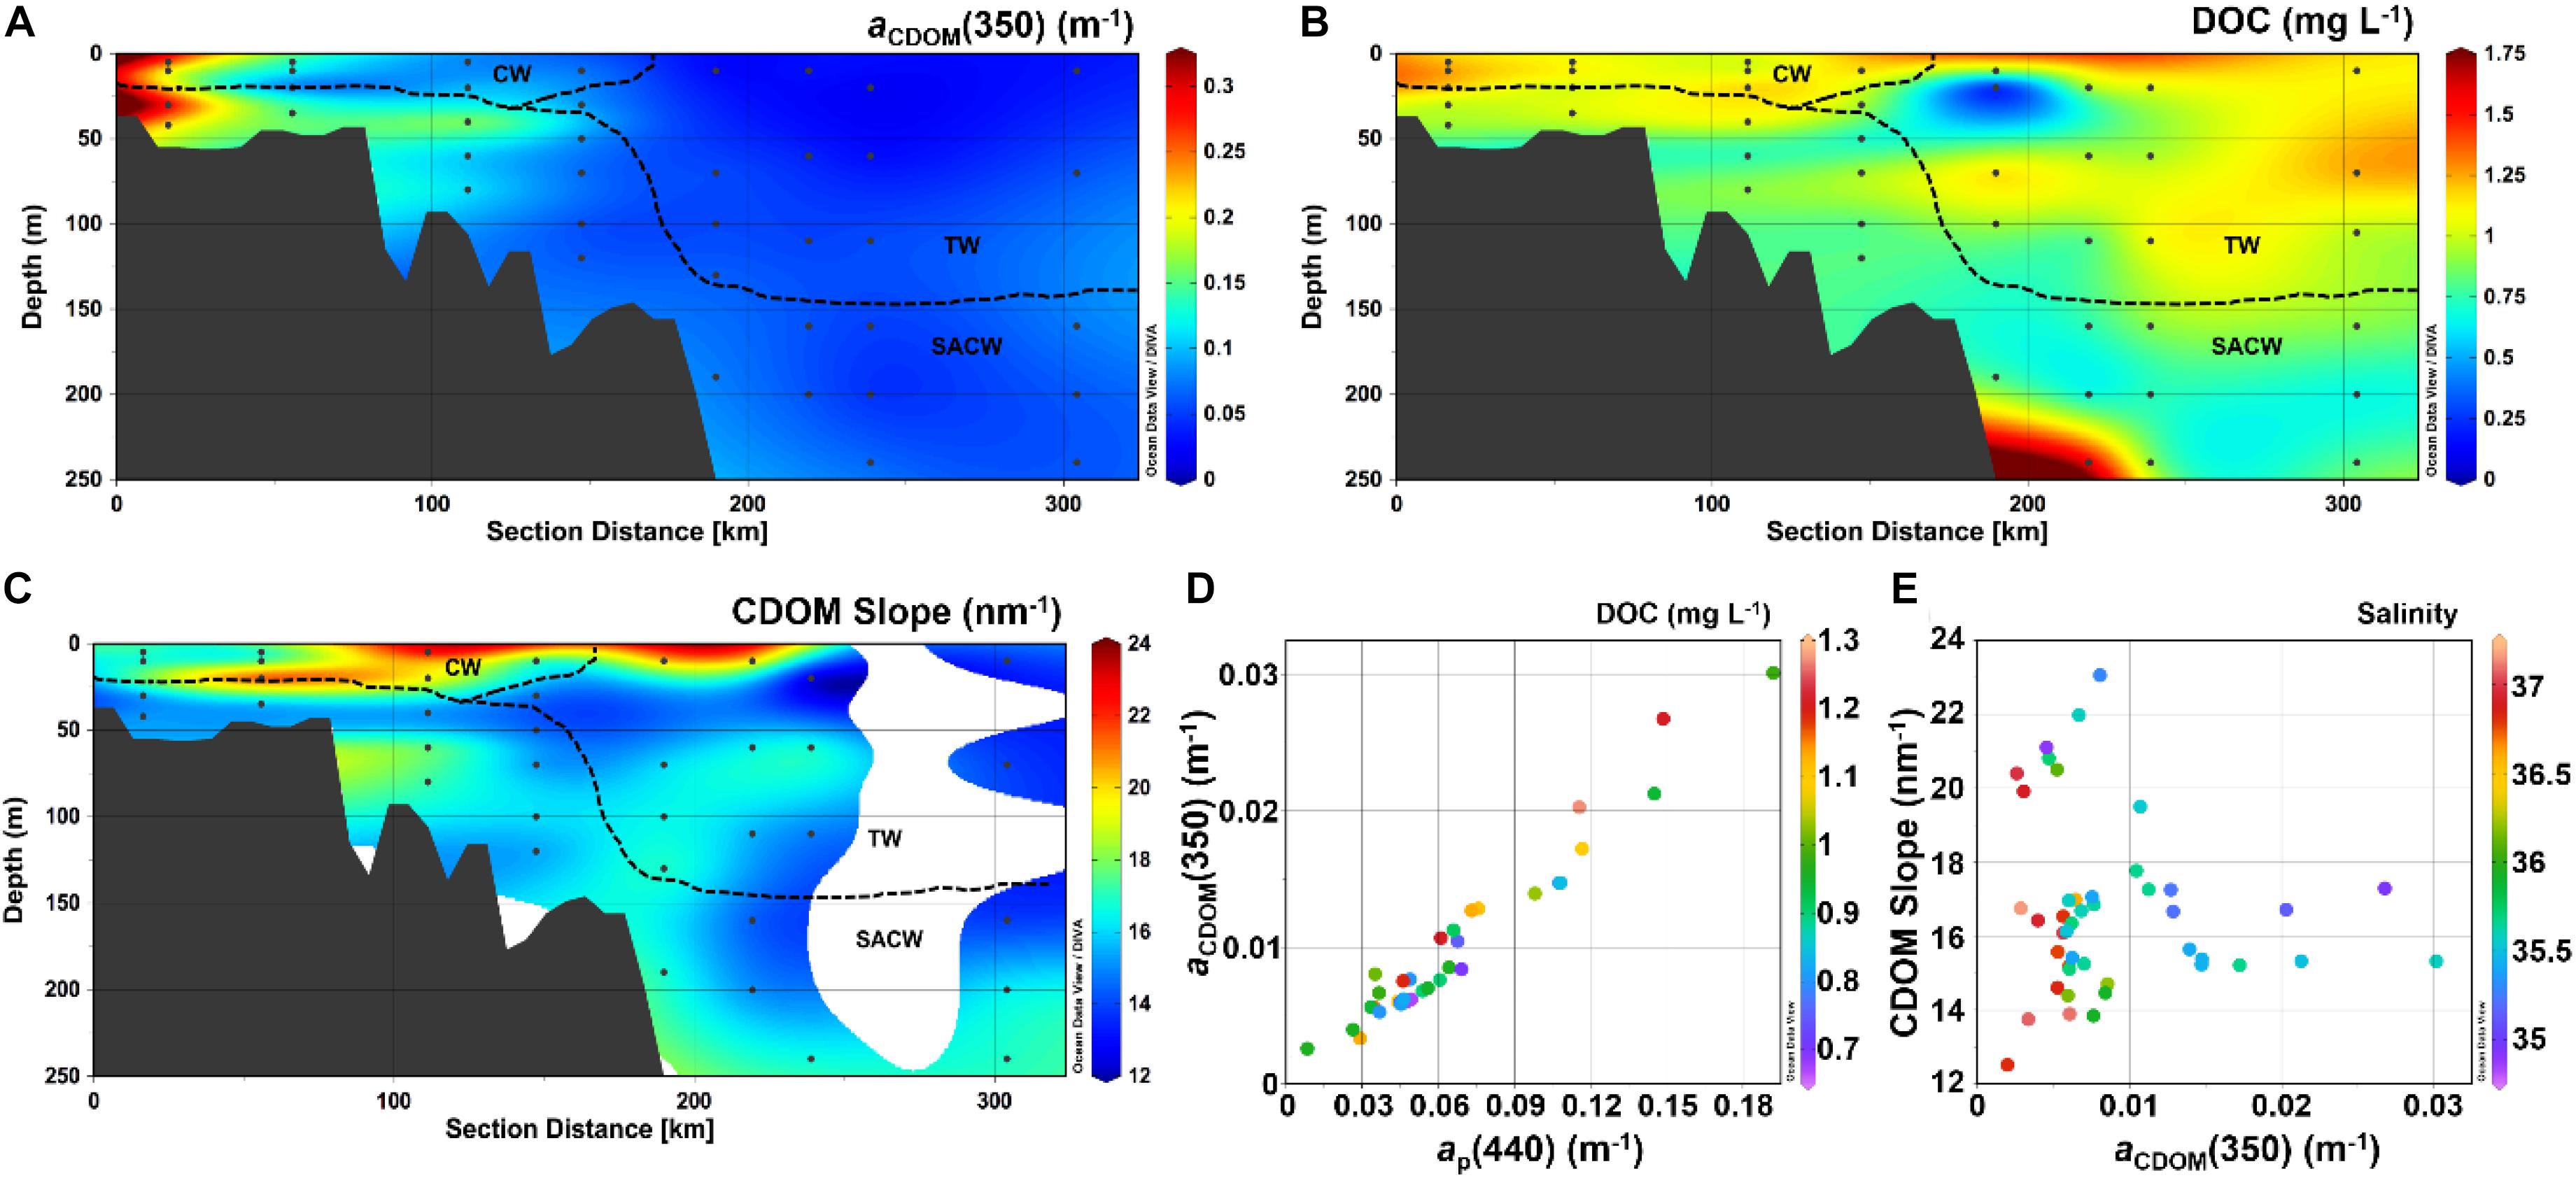
Figure 5. Vertical distribution (0–200 m) of (A) aCDOM(350) (m– 1), (B) DOC (mg L– 1) and (C) CDOM spectral slope (S, nm– 1). (D) Scatter plots of aCDOM(440) vs. aCDOM(350) with DOC color-coded, and (E) aCDOM(350) vs. S with salinity color-coded. Produced with Ocean Data View (Schlitzer, 2016).
Absorption Budget at the Surface
The total absorption coefficient at 440 nm at the surface showed higher values associated to the CW, and decreasing toward TW, as a response to the decrease in the amount of CDOM and particles (Figure 6). Absorption spectra showed a dominance of absorption by water toward the longer wavelengths in the visible band (i.e., red), whereas CDOM and particles were responsible for most of the light absorption in the short visible (i.e., violet-blue) range (Figure 6). Additionally, there was a clear variability in the relative contributions of the optically active water constituents at the surface for CW and TW, especially in the short visible bands (Figure 6). At the higher absorption sites under influence of CW, CDOM was the dominating light absorber in the short visible bands. On the other hand, at the TW water with low absorption, the relative contribution of particles to the total absorption budget at short visible bands increased.
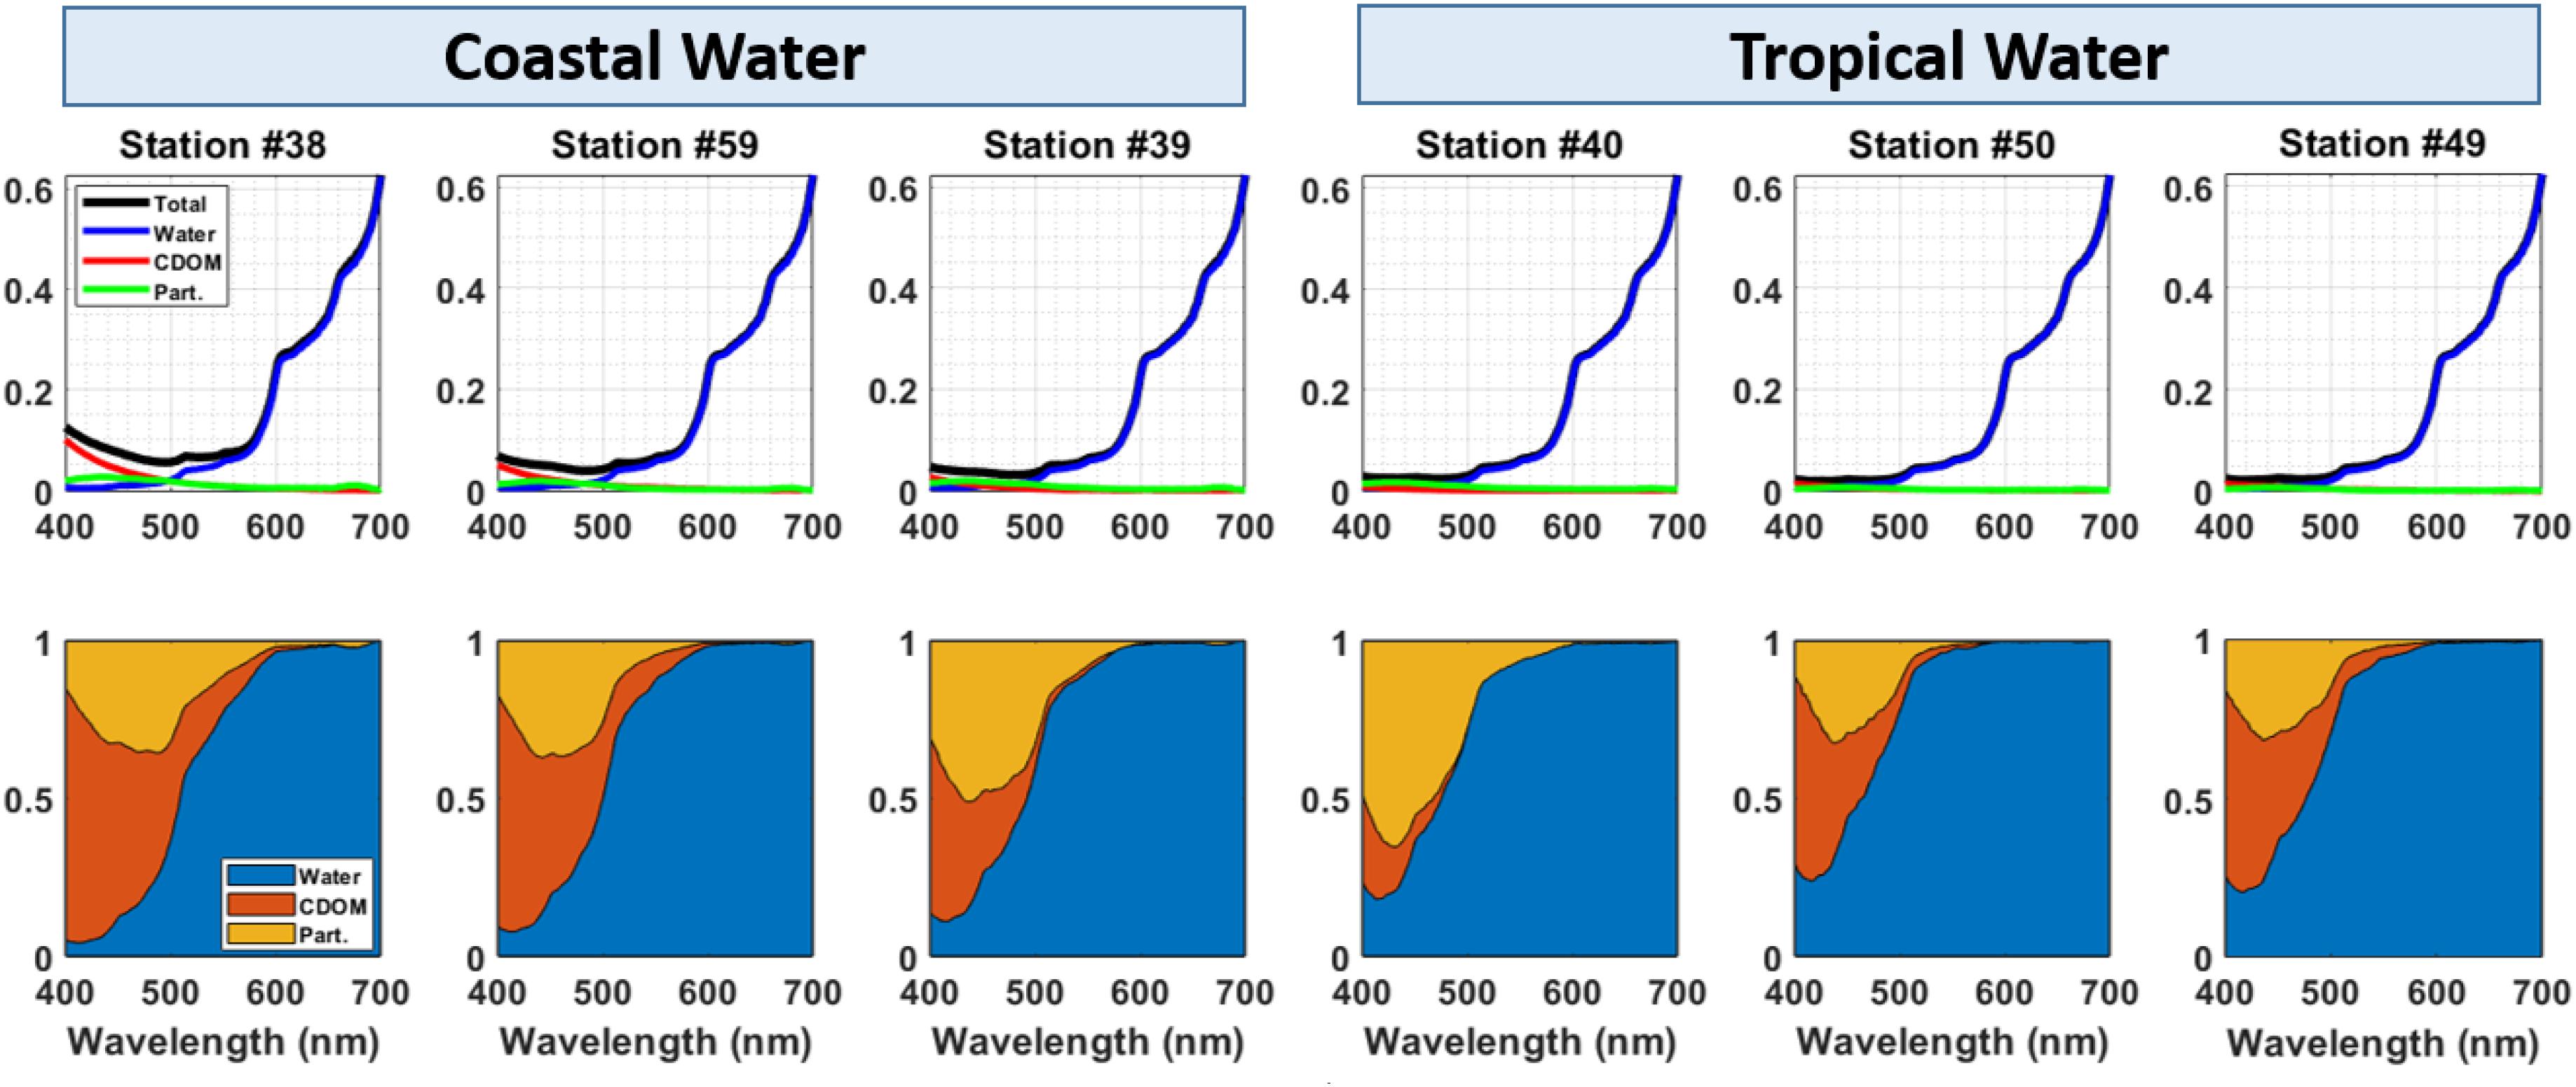
Figure 6. Absorption coefficient spectra (m– 1) at the surface for water (blue), CDOM (red), particles (Part., green) and total absorption (black). Surface relative contributions of water (blue), CDOM (red) and particles (Part., orange) to total absorbance in the PAR range (400—700 nm).
Discussion
The SBB is a hydrographically dynamic environment with strong seasonality and the presence of mesoscale features as meanders and eddies (Castro, 2014). It sustains a diverse planktonic community encompassing a wide range of auto- and heterotrophic organisms from picophytoplankton to microzooplankton (Brandini, 1990; Brandini et al., 2014; Detoni et al., 2016; Bergo et al., 2017; Gonçalves-Araujo et al., 2018a). During the Austral summer expedition CARBOM-3, we analyzed the hydrographic conditions and the OACs along a cross-shelf transect in the poorly sampled SBB. Although this could be considered a pilot study, it brings new insights into the spatial dynamics of OACs and absorption budget. Along with that, we provide a novel dataset with potential use for validation of ocean color remote sensing estimates (Bricaud et al., 1998; Siegel et al., 2005) that need significant improvement in the region (Giannini et al., 2013).
As previously described and observed for the region (Brandini et al., 2014; Castro, 2014), the surface layer was dominated by CW and the TW, whereas SACW was observed in the subjacent layer over the entire sampled region. Results for hydrography and dissolved inorganic nutrients for the CARBOM-3 cruise have already been reported in a previous study (Bergo et al., 2017) and, therefore, will be briefly discussed in our study. Overall, CW was restricted to the inner- and mid-continental shelf exhibiting continental influence through the relatively low salinity and high nutrient levels toward the innermost stations. The oligotrophic TW, on the other hand, was observed over the outer shelf and continental shelf slope with high salinity and low nutrient concentration. SACW is a nutrient-rich water mass with low temperature and relatively low-salinity. At the surface layer, the presence of a seasonal thermocline was prominent in all stations forming a shallow upper mixed layer in the innermost stations that was thicker in the offshore stations, most likely due to deeper solar light penetration. Such a strong stratification led to the establishment of a nutricline, thus influencing nutrient supply from underneath layers and limiting the development of autotrophic communities in the surface euphotic layer (Brandini, 1990; Brandini et al., 2014; Moser et al., 2016; Bergo et al., 2017). Due to the predominance of northeasterly winds and the influence of Ekman transport during spring and summer, CW is displaced offshore allowing for the intrusion of SACW through the SBB (Castro, 2014). The strong uplift of nutrient-rich SACW over the shelf was responsible for the fertilization of the boundary between SACW and the upper layer allowing for the formation of DCM, that is responsible for fueling the phytoplankton development at the inner-shelf (Brandini et al., 2014; Bergo et al., 2017).
The overall distribution of DOM, Chl-a and particles did not strictly follow the water masses distribution. In fact, the distribution of those parameters was patchy through the surface and over the water column. However, an onshore-offshore gradient was noticed at the surface when considering the total absorption budget (accounting for the absorption by water, CDOM and particles) (see Figure 6). Particularly at the short visible bands, where absorption by non-water absorbers is dominant, a noticeable decrease toward TW was observed, in response to the decrease in CDOM and particles (also for Chl-a), thus portraying the hydrographical variability observed within the region. Studies have shown that biogeochemical changes due to the influence of distinct water mass backgrounds can be resembled by bio-optical properties, leading to the establishment of bio-optical provinces at larger spatial scales (Taylor et al., 2011; Gonçalves-Araujo et al., 2018b). There was a strong correlation between Chl-a and ap(440) with a regression line lying close to the one observed for the global pelagic oceans (Bricaud et al., 1998; Figure 4). A study conducted in an estuary in the SBB reported distinct correlation parameters between Chl-a and ap(440) (Ferreira et al., 2014). Although being from relatively close geographic regions, such a difference observed between the two studies is mainly because estuaries have much greater contribution of non-algal particles (detritus) and CDOM and are not comparable to marine studies. The highest values for both CDOM and particles (and also for Chl-a) were observed within SACW over the continental shelf (see Figures 3, 5). The great amount of particles (and Chl-a) is most likely fueled by the increase in nutrient concentration (due to the intrusion of SACW into shallower layers), associated to the high light availability during summer time (Brandini, 1990; Brandini et al., 2014; Bergo et al., 2017). At the same time, the nutrient exchange at the boundary between the nutrient-rich SACW and the nutrient-depleted TW promoted the establishment of a DCM, as already demonstrated for this cruise (Bergo et al., 2017). That feature was detected by three monitored parameters [Chl-a, fluorescence and ap(440)] and is thought to be dominated by diatoms and/or other picoautotrophs (Brandini et al., 2014; Bergo et al., 2017). DCMs are common features observed through the global oceans and are hypothesized to have an important role on primary production and biogeochemical cycling in nutrient-limited environments (Cullen, 2015), such as the TW domain in this study.
Although DOC and aCDOM(350) tend to be significantly correlated in the global coastal and shelf seas (Massicotte et al., 2017), and especially in the highly continentally influenced Arctic Ocean (Stedmon et al., 2011; Gonçalves-Araujo et al., 2015), this correlation does not hold true for the SBB as shown in this study. Both aCDOM(350) and DOC presented high values at low salinity, as expected due to the continental influence on CW. However, the increase in aCDOM(350) at the inner-shelf stations is more noticeable if compared to DOC (see CW stations in Figure 3). In counterpart, average DOC values did not differ between CW and TW, whereas TW presented the lowest aCDOM(350) values. Thus, our results show the production of DOM (DOC) within TW that was not identified within the chromophoric fractions analyzed in this study [aCDOM(350) and aCDOM(440)]. This is further evidenced from the lack of correlation between DOC and aCDOM(350) and aCDOM(440). The oligotrophic TW presented the lowest averaged phytoplankton biomass (Table 1), and it has been shown to be dominated by nano- and picophytoplankton, and cyanobacteria (Gonçalves-Araujo et al., 2012; Moser et al., 2014; Detoni et al., 2016; Bergo et al., 2017). This suggests the production of fresh, non-colored DOM by those tiny organisms, as freshly produced DOM by phytoplankton has a low proportion of CDOM (Rochelle-Newall and Fisher, 2002; Romera-Castillo et al., 2011). DOM production by phytoplankton has been shown to occur through multiple mechanisms such as exudation, excretion and cell lysis (Thornton, 2014). The autochthonous production of DOM by phytoplankton is one of the major sources to the marine environment, especially when with limited continental influence (Stedmon and Markager, 2005; Jørgensen et al., 2014; Organelli and Claustre, 2019). As aCDOM(350) was positively correlated with Chl-a (see Figure 4), one can infer that the distribution and consequent source/production of DOM in the region was related to the autotrophic community. This is evidenced from the increase in aCDOM(350) values at the DCM and it is supported by the fact that it is known that many phytoplankton species are able to produce CDOM and DOC (Myklestad, 1995; Romera Castillo et al., 2010, Romera-Castillo et al., 2011; Fukuzaki et al., 2014; Asmala et al., 2018a) with nutrients as a main driver on the production of different DOM compounds (Myklestad, 1995; Asmala et al., 2018a; Haraguchi et al., 2019). Thus, in this study, CDOM was supplied not only by the continental runoff (given the increase toward the coast) but also by the phytoplankton community (as evidenced by the strong correlation with Chl-a), as recently reported for the oligotrophic North Atlantic subtropical gyre (Organelli and Claustre, 2019).
With the predominance of northeasterly winds during summer along the SE Brazilian coast the resultant Ekman effect drags the surface waters off the coast, allowing for the intrusion of SACW over the continental shelf (Brandini et al., 2014; Castro, 2014). That offshore displacement of high-DOM CWs traps it at the surface layer, leading it to more intense light exposure, especially during longer summer days with very low solar zenith angle in the region. This would be an analogous condition to what has been observed for river plumes, that while being trapped at the surface due to lower density, allows for the photodegradation of its DOM due to long exposure to solar radiation during summer (Gonçalves-Araujo et al., 2015). An efficient and relatively easy way to track such changes in DOM is to assess the slope ratio (Sr) index. It is thought that Sr values are inversely correlated with aCDOM and molecular weight whereas high Sr values might also be interpreted as an indication of photochemical degradation (Helms et al., 2008; Heim et al., 2019). Unfortunately, our measurements with the PSICAM and LWCC were restricted to the long-UV and VIS wavelength ranges and, therefore, it was not possible to calculate the Sr (Helms et al., 2008). Yet, our results show the highest S values at surface waters along the mid-shelf to shelf-break areas. Thus, we suggest that such high values associated to low aCDOM are an indication of photodegradation processes occurring during the offshore displacement of those high CDOM CWs, as already observed for river plumes trapped at the surface layer and subject to intense light exposure (Gonçalves-Araujo et al., 2015). This is supported by the fact that, at the same time, increase in S due to photochemical reactions as response to light exposure have been reported from incubation experiments (Helms et al., 2014; Cao et al., 2016).
Concluding Remarks
This study brings novel results on the biogeochemistry and absorption budget for the OACs in the under-sampled SBB. Along with that, we also present new insights into the absorption budget and distribution of CDOM and particles in the sampled area. CDOM was significantly correlated to Chl-a suggesting the presence of an autochthonous source of CDOM to the region driven mostly by the phytoplankton community over the shelf domain, generally composed by diatoms (Brandini et al., 2007, 2014; Bergo et al., 2017; Gonçalves-Araujo et al., 2018a). DOC, on the other hand, was not correlated with salinity and presented high values within the TW, suggesting an input other than the continental runoff within those waters. Those high values indicate autochthonous production of DOC that might be related to phytoplankton, given DOC was not significantly correlated with salinity, and cyanobacteria and picophytoplankton are known to be the dominant organisms in TW (Gonçalves-Araujo et al., 2012, 2018a; Moser et al., 2014; Bergo et al., 2017). Additionally, production of fresh, non-colored DOM was observed within the DCM, at the boundary between TW and SACW, and we suggest that this differential DOM production is related to the specific biochemistry of those organisms. As organic matter research priorities are directed toward multidisciplinary approaches involving production and mineralization (Asmala et al., 2018a, b; Derrien et al., 2019; Haraguchi et al., 2019), sampling for more in situ data for performing laboratory incubations would be necessary to better elucidate those findings on DOC production by picophytoplankton. Finally, we show that due to the Ekman transport over the region (Castro, 2014), there is a displacement of high-CDOM shelf waters toward offshore leading those waters to be trapped at the surface layer. As similarly to river plumes (Gonçalves-Araujo et al., 2015), we observed changes values for the S index within those samples. This is an evidence of photodegradation processes occurring at the surface layer due to intense light exposure, especially during summer time, as in our study, what is supported from incubation experiment results (Helms et al., 2008, 2014; Cao et al., 2016).
Data Availability Statement
The datasets generated for this study are available on request to the corresponding author.
Author Contributions
FB designed the study. FB and RR collected the samples. RR analyzed the samples and quality checked the data. RG-A prepared the figures and wrote the manuscript with contribution from all co-authors. Results and elaboration of figures were discussed among all co-authors.
Funding
This study was part of the Project OCEANOS/CARBOM (Environmental Characterization and Evaluation of Biogenic Ocean Resources from the Brazilian Continental Shelf and the Adjacent Oceanic Zone-CNPq 565060/2010-4). RG-A was funded by a Postdoctoral fellowship from The São Paulo Research Foundation-FAPESP (Process Number 2017/19907-7).
Conflict of Interest
The authors declare that the research was conducted in the absence of any commercial or financial relationships that could be construed as a potential conflict of interest.
Acknowledgments
We thank the captain and the crew of the R/V Alpha Crucis (IOUSP; FAPESP Process Number 2010/06147-5) for their assistance during the expedition.
References
Asmala, E., Haraguchi, L., Jakobsen, H. H., Massicotte, P., and Carstensen, J. (2018a). Nutrient availability as major driver of phytoplankton-derived dissolved organic matter transformation in coastal environment. Biogeochemistry 137, 93–104. doi: 10.1007/s10533-017-0403-0
Asmala, E., Haraguchi, L., Markager, S., Massicotte, P., Riemann, B., Staehr, P. A., et al. (2018b). Eutrophication leads to accumulation of recalcitrant autochthonous organic matter in coastal environment. Global Biogeochem. Cycles 32, 1673–1687. doi: 10.1029/2017GB005848
Benner, R., and Strom, M. (1993). A critical evaluation of the analytical blank associated with DOC measurements by high-temperature catalytic oxidation. Mar. Chem. 41, 153–160. doi: 10.1016/0304-4203(93)90113-3
Bergo, N. M., Signori, C. N., Amado, A. M., Brandini, F. P., and Pellizari, V. H. (2017). The partitioning of carbon biomass among the Pico- and nano-plankton community in the South Brazilian bight during a strong summer intrusion of south atlantic central water. Front. Mar. Sci. 4:238. doi: 10.3389/fmars.2017.00238
Blough, N. V., and Green, S. A. (1995). “Spectroscopic characterization and remote sensing of non-living organic matter,” in The Role of Non-living Organic Matter in the Earth’s Carbon Cycle, eds R. G. Zepp, and C. Sonntag, (Hoboken, NJ: Wiley), 23–45.
Brandini, F. P. (1990). Hydrography and characteristics of the phytolankton in shelf and oceanic waters off southeastern Brazil during winter (July/August 1982) and summer (February/March 1984). Hydrobiologia 196, 111–148. doi: 10.1007/bf00006105
Brandini, F. P., Nogueira, M., Simião, M., Ugaz Codina, J. C., and Noernberg, M. A. (2014). Deep chlorophyll maximum and plankton community response to oceanic bottom intrusions on the continental shelf in the South Brazilian Bight. Cont. Shelf Res. 89, 61–75. doi: 10.1016/j.csr.2013.08.002
Brandini, F. P., Scheffer da Silva, A., Teixeira, da Silva, E., and Kolm, H. (2007). Sources of nutrients and seasonal dynamics of chlorophyll in the inner shelf off Paraná State—South Brazil Bight. J. Coast. Res. 235, 1131–1140. doi: 10.2112/04-0360.1
Bricaud, A., Morel, A., Babin, M., Allali, K., and Claustre, H. (1998). Variations of light absorption by suspended particles with chlorophyll a concentration in oceanic (case 1) waters: analysis and implications for bio-optical models. J. Geophys. Res. Ocean. 103, 31033–31044. doi: 10.1029/98JC02712
Bricaud, A., Morel, A., and Prieur, L. (1981). Absorption by dissolved organic matter of the sea (yellow substance) in the UV and visible domains1. Limnol. Oceanogr. 26, 43–53. doi: 10.4319/lo.1981.26.1.0043
Cao, F., Medeiros, P. M., and Miller, W. L. (2016). Optical characterization of dissolved organic matter in the Amazon River plume and the Adjacent Ocean: examining the relative role of mixing, photochemistry, and microbial alterations. Mar. Chem. 186, 178–188. doi: 10.1016/j.marchem.2016.09.007
Carder, K. L., Steward, R. G., Harvey, G. R., and Ortner, P. B. (1989). Marine humic and fulvic acids: their effects on remote sensing of ocean chlorophyll. Limnol. Oceanogr. 34, 68–81. doi: 10.4319/lo.1989.34.1.0068
Castro, B. M. (2014). Summer/winter stratification variability in the central part of the South Brazil Bight. Cont. Shelf Res. 89, 15–23. doi: 10.1016/j.csr.2013.12.002
Castro, B. M., Brandini, F. P., Pires-Vanin, A. M. S., and Miranda, L. B. (2006). “Multidisciplinary oceanographic processes on the western Atlantic continental sheltf between 4°N and 34°S,” in The Global Coastal Ocean, eds A. R. Robinson, and K. H. Brink, (Cambridge: Harvard University Press).
Coble, P. G. (2007). Marine optical biogeochemistry: the chemistry of ocean color. Chem. Rev. 107, 402–418. doi: 10.1021/cr050350
Cullen, J. J. (2015). Subsurface chlorophyll maximum layers: enduring enigma or mystery solved? Ann. Rev. Mar. Sci. 7, 207–239. doi: 10.1146/annurev-marine-010213-135111
Derrien, M., Retelletti Brogi, S., and Gonçalves-Araujo, R. (2019). Characterization of aquatic organic matter: assessment, perspectives and research priorities. Water Res. 163:114908. doi: 10.1016/j.watres.2019.114908
Detoni, A. M. S., Ciotti, ÁM., Calil, P. H. R., Tavano, V. M., and Yunes, J. S. (2016). Trichodesmium latitudinal distribution on the shelf break in the southwestern Atlantic Ocean during spring and autumn. Global Biogeochem. Cycles 30, 1738–1753. doi: 10.1002/2016GB005431
Ferreira, A., Ciotti, ÁM., and Coló Giannini, M. F. (2014). Variability in the light absorption coefficients of phytoplankton, non-algal particles, and colored dissolved organic matter in a subtropical bay (Brazil). Estuar. Coast. Shelf Sci. 139, 127–136. doi: 10.1016/j.ecss.2014.01.002
Fukuzaki, K., Imai, I., Fukushima, K., Ishii, K.-I., Sawayama, S., and Yoshioka, T. (2014). Fluorescent characteristics of dissolved organic matter produced by bloom-forming coastal phytoplankton. J. Plankton Res. 36, 685–694. doi: 10.1093/plankt/fbu015
Giannini, M. F. C., Garcia, C. A. E., Tavano, V. M., and Ciotti, ÁM. (2013). Effects of low-salinity and high-turbidity waters on empirical ocean colour algorithms: an example for Southwestern Atlantic waters. Cont. Shelf Res. 59, 84–96. doi: 10.1016/j.csr.2013.04.013
Gonçalves-Araujo, R., De Souza, M. S., Mendes, C. R. B., Tavano, V. M., Pollery, R. C., and Garcia, C. A. E. (2012). Brazil-Malvinas confluence: effects of environmental variability on phytoplankton community structure. J. Plankton Res. 34, 399–415. doi: 10.1093/plankt/fbs013
Gonçalves-Araujo, R., de Souza, M. S., Tavano, V. M., Mendes, C. R., Souza, R. B., de Schultz, C., et al. (2018a). Phyto- and protozooplankton assemblages and hydrographic variability during an early winter survey in the Southern Brazilian Continental Shelf. J. Mar. Syst. 184, 36–49. doi: 10.1016/j.jmarsys.2018.04.005
Gonçalves-Araujo, R., Rabe, B., Peeken, I., and Bracher, A. (2018b). High colored dissolved organic matter (CDOM) absorption in surface waters of the central-eastern Arctic Ocean: implications for biogeochemistry and ocean color algorithms. PLoS One 13:e0190838. doi: 10.1371/journal.pone.0190838
Gonçalves-Araujo, R., Stedmon, C. A., Heim, B., Dubinenkov, I., Kraberg, A., Moiseev, D., et al. (2015). From fresh to marine waters: characterization and fate of dissolved organic matter in the lena river delta region. Siberia. Front. Mar. Sci. 2:108. doi: 10.3389/fmars.2015.00108
Haraguchi, L., Asmala, E., Jakobsen, H. H., and Carstensen, J. (2019). Composition of natural phytoplankton community has minor effects on autochthonous dissolved organic matter characteristics. Mar. Biol. Res. 15, 357–375. doi: 10.1080/17451000.2019.1662449
Heim, B., Juhls, B., Abramova, E., Bracher, A., Doerffer, R., Gonçalves-Araujo, R., et al. (2019). “Ocean colour remote sensing in the Laptev Sea,” in Remote Sensing of the Asian Seas, eds V. Barale, and M. Gade, (Cham: Springer International Publishing).
Helms, J. R., Mao, J., Stubbins, A., Schmidt-Rohr, K., Spencer, R. G. M., Hernes, P. J., et al. (2014). Loss of optical and molecular indicators of terrigenous dissolved organic matter during long-term photobleaching. Aquat. Sci. 76, 353–373. doi: 10.1007/s00027-014-0340-0
Helms, J. R., Stubbins, A., Ritchie, J. D., Minor, E. C., Kieber, D. J., and Mopper, K. (2008). Absorption spectral slopes and slope ratios as indicators of molecular weight, source, and photobleaching of chromophoric dissolved organic matter. Limnol. Oceanogr. 53, 955–969. doi: 10.4319/lo.2008.53.3.0955
IOCCG, (2008). Why Ocean Colour? The Societal Benefits of Ocean- Colour Technology. IOCCG Report Number 7. Dartmouth, NS: IOCCG.
IOCCG, (2006). Remote Sensing of Inherent Optical Properties : Fundamentals, Tests of Algorithms, and Applications. IOCCG Report number 5. Dartmouth, NS: IOCCG.
IOCCG, (2014). Phytoplankton Functional Types From Space. IOCCG Report number 15. Dartmouth, NS: IOCCG.
Jørgensen, L., Stedmon, C. A., Granskog, M. A., and Middelboe, M. (2014). Tracing the long-term microbial production of recalcitrant fluorescent dissolved organic matter in seawater. Geophys. Res. Lett. 41, 2481–2488. doi: 10.1002/2014GL059428
Lefering, I., Röttgers, R., Utschig, C., and McKee, D. (2017). Uncertainty budgets for liquid waveguide CDOM absorption measurements. Appl. Opt. 56:6357. doi: 10.1364/ao.56.006357
Massicotte, P., Asmala, E., Stedmon, C., and Markager, S. (2017). Global distribution of dissolved organic matter along the aquatic continuum: across rivers, lakes and oceans. Sci. Total Environ. 609, 180–191. doi: 10.1016/j.scitotenv.2017.07.076
Mobley, C., Stramski, D., Bissett, P., and Boss, E. (2004). Optical modeling of ocean waters: is the case 1 - case 2 classification still useful? Oceanography 17, 60–67. doi: 10.5670/oceanog.2004.48
Moline, M. A., Robbins, I., Zelenke, B., Pegau, W. S., and Wijesekera, H. (2012). Evaluation of bio-optical inversion of spectral irradiance measured from an autonomous underwater vehicle. J. Geophys. Res. Ocean. 117, 1–12. doi: 10.1029/2011JC007352
Möller, O. O., Piola, A. R., Freitas, A. C., and Campos, E. J. D. (2008). The effects of river discharge and seasonal winds on the shelf off southeastern South America. Cont. Shelf Res. 28, 1607–1624. doi: 10.1016/j.csr.2008.03.012
Moser, G. A., Castro, N., Takanohashi, R., Fernandes, A., Pollery, R. C., Tenenbaum, D., et al. (2016). The influence of surface low-salinity waters and cold subsurface water masses on picoplankton and ultraplankton distribution in the continental shelf off Rio de Janeiro, SE Brazil. Cont. Shelf Res. 120, 82–95. doi: 10.1016/j.csr.2016.02.017
Moser, G. A. O., Takanohashi, R. A., de Chagas Braz, M., de Lima, D. T., Kirsten, F. V., Guerra, J. V., et al. (2014). Phytoplankton spatial distribution on the continental shelf off Rio de Janeiro, from Paraíba do Sul River to Cabo Frio. Hydrobiologia 728, 1–21. doi: 10.1007/s10750-013-1791-3
Murray, C., Markager, S., Stedmon, C. A., Juul-Pedersen, T., Sejr, M. K., and Bruhn, A. (2015). The influence of glacial melt water on bio-optical properties in two contrasting Greenlandic fjords. Estuar. Coast. Shelf Sci. 163, 72–83. doi: 10.1016/j.ecss.2015.05.041
Myklestad, S. M. (1995). Release of extracellular products by phytoplankton with special emphasis on polysaccharides. Sci. Total Environ. 165, 155–164. doi: 10.1016/0048-9697(95)04549-G
Organelli, E., and Claustre, H. (2019). Small phytoplankton shapes colored dissolved organic matter dynamics in the North Atlantic subtropical gyre. Geophys. Res. Lett. 2019:GL084699. doi: 10.1029/2019GL084699
Pérez, G. L., Galí, M., Royer, S., Sarmento, H., Gasol, J. M., Marrasé, C., et al. (2016). Bio-optical characterization of offshore NW Mediterranean waters: CDOM contribution to the absorption budget and diffuse attenuation of downwelling irradiance. Deep Sea Res. Part I Oceanogr. Res. Pap. 114, 111–127. doi: 10.1016/j.dsr.2016.05.011
Pope, R. M., and Fry, E. S. (1997). Absorption spectrum (380–700 nm) of pure water. II Integrating cavity measurements. Appl. Opt. 36:8710. doi: 10.1364/AO.36.008710
Prieur, L., and Sathyendranath, S. (1981). An optical classification of coastal and oceanic waters based on the specific spectral absorption curves of phytoplankton pigments, dissolved organic matter, and other particulate materials1. Limnol. Oceanogr. 26, 671–689. doi: 10.4319/lo.1981.26.4.0671
Rochelle-Newall, E. J., and Fisher, T. R. (2002). Production of chromophoric dissolved organic matter f luorescence in marine and estuarine environments: an investigation into the role of phytoplankton. Mar. Chem. 77, 7–21. doi: 10.1016/s0304-4203(01)00072-x
Romera Castillo, C., Sarmento, H., Álvarez-Salgado, X. A., Gasol, J. M., and Marraséa, C. (2010). Production of chromophoric dissolved organic matter by marine phytoplankton. Limnol. Oceanogr. 55, 446–454. doi: 10.4319/lo.2010.55.1.0446
Romera-Castillo, C., Sarmento, H., Álvarez-Salgado, X. A., Gasol, J. M., and Marrasé, C. (2011). Net production and consumption of fluorescent colored dissolved organic matter by natural bacterial assemblages growing on marine phytoplankton exudates. Appl. Environ. Microbiol. 77, 7490–7498. doi: 10.1128/AEM.00200-11
Röttgers, R., and Doerffer, R. (2007). Measurements of optical absorption by chromophoric dissolved organic matter using a point-source integrating-cavity absorption meter. Limnol. Oceanogr. Methods 5, 126–135. doi: 10.4319/lom.2007.5.126
Röttgers, R., Häse, C., and Doerffer, R. (2007). Determination of the particulate absorption of microalgae using a point-source integrating-cavity absorption meter: verification with a photometric technique, improvements for pigment bleaching, and correction for chlorophyll fluorescence. Limnol. Oceanogr. Methods 5, 1–12. doi: 10.4319/lom.2007.5.1
Schlitzer, R. (2016). Ocean Data View. Available at: http://odv.awi.de
Siegel, D. A., Maritorena, S., Nelson, N. B., Behrenfeld, M. J., and McClain, C. R. (2005). Colored dissolved organic matter and its influence on the satellite-based characterization of the ocean biosphere. Geophys. Res. Lett. 32:L20605. doi: 10.1029/2005GL024310
Spencer, R. G. M., Aiken, G. R., Butler, K. D., Dornblaser, M. M., Striegl, R. G., and Hernes, P. J. (2009). Utilizing chromophoric dissolved organic matter measurements to derive export and reactivity of dissolved organic carbon exported to the Arctic Ocean: a case study of the Yukon River. Alaska. Geophys. Res. Lett. 36:L06401. doi: 10.1029/2008GL036831
Stedmon, C. A., Amon, R. M. W., Rinehart, A. J., and Walker, S. A. (2011). The supply and characteristics of colored dissolved organic matter (CDOM) in the Arctic Ocean: pan arctic trends and differences. Mar. Chem. 124, 108–118. doi: 10.1016/j.marchem.2010.12.007
Stedmon, C. A., and Markager, S. (2001). The optics of chromophoric dissolved organic matter (CDOM) in the Greenland Sea: an algorithm for differentiation between marine and terrestrially derived organic matter. Limnol. Oceanogr. 46, 2087–2093. doi: 10.4319/lo.2001.46.8.2087
Stedmon, C. A., and Markager, S. (2005). Resolving the variability in dissolved organic matter fluorescence in a temperate estuary and its catchment using PARAFAC analysis. Limnol. Oceanogr. 50, 686–697. doi: 10.4319/lo.2005.50.2.0686
Taylor, B. B., Torrecilla, E., Bernhardt, A., Taylor, M. H., Peeken, I., Röttgers, R., et al. (2011). Bio-optical provinces in the eastern Atlantic Ocean and their biogeographical relevance. Biogeosciences 8, 3609–3629. doi: 10.5194/bg-8-3609-2011
Thornton, D. C. O. (2014). Dissolved organic matter (DOM) release by phytoplankton in the contemporary and future ocean. Eur. J. Phycol. 49, 20–46. doi: 10.1080/09670262.2013.875596
Keywords: dissolved organic matter, particulate matter, inherent optical properties, absorption budget, water masses, chlorophyll-a
Citation: Gonçalves-Araujo R, Röttgers R, Haraguchi L and Brandini FP (2019) Hydrography-Driven Variability of Optically Active Constituents of Water in the South Brazilian Bight: Biogeochemical Implications. Front. Mar. Sci. 6:716. doi: 10.3389/fmars.2019.00716
Received: 18 August 2019; Accepted: 06 November 2019;
Published: 19 November 2019.
Edited by:
Carol Robinson, University of East Anglia, United KingdomReviewed by:
X. Antón Álvarez-Salgado, Spanish National Research Council (CSIC), SpainLeanne C. Powers, University of Maryland Center for Environmental Science, United States
Copyright © 2019 Gonçalves-Araujo, Röttgers, Haraguchi and Brandini. This is an open-access article distributed under the terms of the Creative Commons Attribution License (CC BY). The use, distribution or reproduction in other forums is permitted, provided the original author(s) and the copyright owner(s) are credited and that the original publication in this journal is cited, in accordance with accepted academic practice. No use, distribution or reproduction is permitted which does not comply with these terms.
*Correspondence: Rafael Gonçalves-Araujo, cmFmYWVsZ29uY2FsdmVzYXJhdWpvQGdtYWlsLmNvbQ==; cmFmZ29AYXF1YS5kdHUuZGs=