 Eric C. J. Oliver1*
 Michael T. Burrows2
 Markus G. Donat3
 Alex Sen Gupta4,5
 Lisa V. Alexander4,5Sarah E. Perkins-Kirkpatrick4,5
 Jessica A. Benthuysen6
 Alistair J. Hobday7
 Neil J. Holbrook5,8
 Pippa J. Moore9
 Mads S. Thomsen10
 Thomas Wernberg11
 Dan A. Smale12
- 1Department of Oceanography, Dalhousie University, Halifax, NS, Canada
- 2Scottish Association for Marine Science, Oban, United Kingdom
- 3Barcelona Supercomputing Center, Barcelona, Spain
- 4Climate Change Research Centre, University of New South Wales, Sydney, NSW, Australia
- 5Australian Research Council Centre of Excellence for Climate Extremes, Sydney, NSW, Australia
- 6Australian Institute of Marine Science, Crawley, WA, Australia
- 7CSIRO Oceans and Atmosphere, Hobart, TAS, Australia
- 8Institute for Marine and Antarctic Studies, University of Tasmania, Hobart, TAS, Australia
- 9Institute of Biological, Environmental & Rural Studies, Aberystwyth University, Aberystwyth, United Kingdom
- 10Centre for Integrative Ecology and Marine Ecology Research Group, School of Biological Sciences, University of Canterbury, Christchurch, New Zealand
- 11UWA Oceans Institute and School of Biological Sciences, The University of Western Australia, Crawley, WA, Australia
- 12Marine Biological Association of the United Kingdom, Plymouth, United Kingdom
Marine heatwaves (MHWs) are extreme climatic events in oceanic systems that can have devastating impacts on ecosystems, causing abrupt ecological changes and socioeconomic consequences. Several prominent MHWs have attracted scientific and public interest, and recent assessments have documented global and regional increases in their frequency. However, for proactive marine management, it is critical to understand how patterns might change in the future. Here, we estimate future changes in MHWs to the end of the 21st century, as simulated by the CMIP5 global climate model projections. Significant increases in MHW intensity and count of annual MHW days are projected to accelerate, with many parts of the ocean reaching a near-permanent MHW state by the late 21st century. The two greenhouse gas (GHG) emission scenarios considered (Representative Concentration Pathway 4.5 and 8.5) strongly affect the projected intensity of MHW events, the proportion of the globe exposed to permanent MHW states, and the occurrence of the most extreme MHW events. Comparison with simulations of a natural world, without anthropogenic forcing, indicate that these trends have emerged from the expected range of natural variability within the first half of the 21st century. This discrepancy implies a degree of “anthropogenic emergence,” with a departure from the natural MHW conditions that have previously shaped marine ecosystems for centuries or even millennia. Based on these projections we expect impacts on marine ecosystems to be widespread, significant and persistent through the 21st century.
Introduction
Marine heatwaves (MHWs) – prolonged periods of anomalously warm seawater (Hobday et al., 2016) – have increased significantly in frequency and duration since the early twentieth century (Oliver et al., 2018a). Individually, these extreme events can have significant impacts on marine ecosystems, including effects on biodiversity (Cavole et al., 2016; Wernberg et al., 2016; Jones et al., 2018), fisheries (Mills et al., 2012), and aquaculture (Oliver et al., 2017). Ecological responses to prominent MHWs have been observed across a range of processes, scales, taxa and geographic regions (Smale et al., 2019). Collectively, and over time, an increase in the exposure of marine ecosystems to extreme temperatures may lead to irreversible loss of species or foundation habitats, such as seagrass (Thomson et al., 2015), coral reefs (Hughes et al., 2019) and kelp forests (Wernberg et al., 2016; Thomsen et al., 2019). Therefore, estimating how MHWs are projected to change globally is important for understanding their ecological impacts in a warming world.
The count of annual MHW days has increased globally by over 50% from 1925 to 2016 (Oliver et al., 2018a). In addition, MHW intensity – the associated sea surface temperature (SST) anomaly –has increased significantly since the start of the satellite era in 1982 (Oliver et al., 2018a). The physical processes driving MHWs are varied and include air-sea heat fluxes coinciding with atmospheric heat waves and/or horizontal temperature advection due to changes in ocean circulation (Sparnocchia et al., 2006; Chen et al., 2014; Oliver et al., 2017; Holbrook et al., 2019). Regardless of the physical mechanisms driving individual MHWs, consensus is emerging that anthropogenic climate change has significantly increased the likelihood of recent MHWs including the 2015/16 Tasman Sea MHW (Oliver et al., 2017), the 2016 Northern Australia MHW (Lewis and Mallela, 2018; Oliver et al., 2018b), the 2016 Gulf of Alaska and Bering Sea MHW (Oliver et al., 2018b; Walsh et al., 2018), the 2016 California Current MHW (Jacox et al., 2018), and the 2017/18 Tasman Sea MHW (Perkins-Kirkpatrick et al., 2019). Further, Frölicher et al. (2018) suggested that by the year 2100 anthropogenic climate change is projected to increase the probability of MHWs nearly everywhere, regardless of variations in emissions scenarios.
Here we use a suite of global climate models to estimate projected future MHWs to 2100. We focus on two globally projected response metrics, the annual count of MHW days and the annual maximum MHW intensity, that represent the time spent in a MHW state and the magnitude of the temperature anomaly reached, respectively (Hobday et al., 2016), as well as the intensity-based “category” of these events (Hobday et al., 2018a). These metrics are useful as they are proxies for exposure of marine ecosystems to chronic heat stress and acute heat stress, respectively. We consider two greenhouse gas (GHG) emissions scenarios in order to compare the projected futures arising from strong GHG mitigation versus a “business as usual” trajectory. We compare the projected future trajectory of MHWs against the historical trajectory and against bounds of natural variability derived from simulations without anthropogenic forcing. Finally, we discuss the likely implications of the projected changes for marine biodiversity and ecosystem structure and function.
Materials and Methods
CMIP5 Sea Surface Temperatures
We examined outputs from the Coupled Model Intercomparison Project Phase 5 (CMIP5) (Taylor et al., 2012) global climate model simulations of historical and projected future climates. Daily sea surface temperature (SST) outputs were taken from the “historical” simulation, representing historical conditions with anthropogenic influence. Historical simulations were forced using anthropogenic GHG and aerosol forcing in addition to natural forcing and cover the period 1850–2005. In addition we consider two future climate projection experiments that represent the evolution of the climate system subject to two different anthropogenic emissions scenarios covering 2006–2100: “RCP4.5” which assumes anthropogenic GHG emissions peak in the year 2040 and then stabilize at a radiative forcing of 4.5 W m–2, and “RCP8.5” which assumes these emissions continue to rise throughout the 21st century with radiative forcing reaching 8.5 W m–2 by the end of the century. We also used the “historicalNat” simulation, representing historical conditions without anthropogenic influence where models are forced by natural volcanic and solar forcing only, with greenhouse gases and aerosols held at pre-industrial levels, spanning 1850–2005. We obtained data for these experiments from six models, chosen due to the availability of daily SST outputs, each with varying numbers of ensemble members (see Table 1 for details of the models).
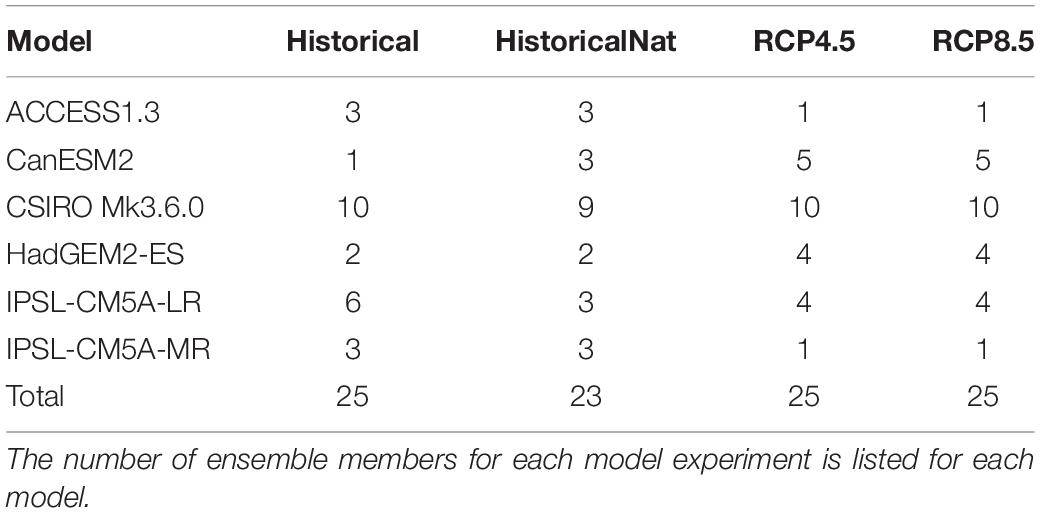
Table 1. CMIP5 models used in the analysis.
Marine Heatwave Definition and Categories
Marine heatwaves were identified from daily SST time series and a set of metrics were calculated to characterize their frequency, intensity and duration. Following (Hobday et al., 2016) a MHW was defined as a discrete prolonged anomalously warm water event. “Discrete” means an identifiable event with recognizable start and end dates, “prolonged” implies a duration of at least 5 days, and “anomalously warm” measures temperatures relative to a baseline climatology and threshold (see below for period used). Periods when daily temperatures were above a threshold based on the seasonally varying 90th percentile for at least five consecutive days were identified as MHW events. Events with a break of less than 3 days were considered a single event. The climatological mean and threshold were calculated for each calendar day from the pool of daily SSTs within an 11-day window centered on the calendar day of interest across all years (within the climatology period). The climatology and threshold were smoothed by applying a 31-day moving average. The 11-day sample window size was chosen to ensure sample sizes were sufficient for the estimation of means and percentiles. Furthermore, by using seasonally varying thresholds, rather than a fixed mean annual threshold, this methodology allows for detection of MHWs at any time of the year, such as distinguishing summer and winter MHWs (with potential ecological implications, as summer MHWs might be expected to have larger ecological effects).
A set of properties was defined for each MHW event. We considered metrics for duration (time between start and end dates) and maximum intensity (maximum temperature anomaly, relative to the seasonally varying climatological mean, over the event duration). Noting that a 90th percentile threshold is relatively easy to exceed, providing a liberal definition for what counts as a MHW, we also examine the intensity-based MHW category. Each event was classified as being a Moderate (category I), Strong (II), Severe (III), or Extreme (IV) MHW. These categories are defined by the maximum intensity of the event scaled by the threshold temperature anomaly exceeding the climatology, defined as a “unit” (Hobday et al., 2018a). For example, events between the threshold and one unit above it are classified as Moderate (I), between one and two units as Strong (II), etc. As detailed in Hobday et al. (2018a) the impacts of relatively common Moderate MHWs are mild (or non-existent) while the impacts of rarer Severe and Extreme MHWs are much greater. Despite initially defining only four categories, this system allows for higher categories according to the recorded temperature anomaly (“extreme extremes” e.g., Category V, VI, etc.).
We calculated time series of the annual average duration and annual maximum intensity across all events in each year. Events which spanned multiple years contributed to the annual time series for each year they spanned. We also calculated the total number of MHW days in a year and the total number of days belonging to each of the four MHW categories in a year. The MHW definition (Hobday et al., 2016, 2018a) is implemented as software modules in Python1, R2, and MATLAB3.
Model Simulated Marine Heatwaves
Marine heatwaves were identified from the daily CMIP5 SSTs as described above. For all model experiments, the climatology used to define anomalies was calculated from the historical experiment, from that model, using a base period of 1982–2005. For each model/experiment and MHW metric, the annual time series’ were re-gridded (spatially averaged) onto a common 2° × 2° grid. Then time-slice averages of the various MHW metrics were calculated over 1961–1990 and 2031–2060, as well as global-mean time series [applying a sea ice mask following (Oliver et al., 2018a)]. Individual model results represent an ensemble mean across all members for that model and experiment. Multi-model mean (MMM) results represent an average across the ensemble means for all seven models. Individual models results, indicative of the inter-model spread, are shown in the Supplementary Material.
We examined the change in probability of occurrence of MHW days globally by calculating the following probability ratio (PR; Allen, 2003; Stott et al., 2013):
where Phist(y) is the probability of a MHW day occurring in a particular year y in the historical experiment, defined as the global mean annual count of MHW days in that year divided by the total number days in that year. PhistNat is the total number of global-mean MHW days across all years divided by the total number of days across all years from the historicalNat experiment. A PR value of >1 or <1 indicates that the probability of a MHW day in that year is greater than or less than that expected in the natural world, respectively. The probability ratio was also calculated for projected future years using the RCP4.5 and RCP8.5 experiments instead of the historical experiment in the numerator of PR. Please note that these calculated PR values are specific to the model ensemble used and may not as such apply to the real-world climate, due to systematic model errors often resulting in overconfident model ensembles (Bellprat et al., 2019) – a characteristic also apparent in the model ensemble used here (Supplementary Figures 1C,F).
Here, we define a “permanent MHW state” to be when SST exceeds the MHW threshold continuously over a full calendar year (365 days). From this definition, we calculated the year when the permanent MHW state occurs for each grid cell, for all the model ensemble members and for the MMM.
An evaluation of the model simulations of MHW intensity and total days was performed by comparing MHW statistics over the 1982–2005 period between the models and observations (Supplementary Figure 1). The observations used were daily SST fields from the 1/4° NOAA OI SST V2 dataset (Reynolds et al., 2007; Banzon et al., 2016). The model bias for MHW intensity was within ±0.5°C over most of the ocean, except in the highly variable western boundary current regions where the models were up to 2°C less intense than the observations. The model bias for MHW days was within ±10 days over most of the ocean except in the tropical parts of the Indian, western Pacific, and Atlantic oceans where the models simulated up to 25 more MHW days than the observations. This type of bias, where the models produce too many MHW days, is consistent with the limitations of coarse resolution models. Specifically, these models underestimate the SST anomaly produced by very small-scale features, simulate SST time series that are too smooth (high serial autocorrelation) and thus produce longer MHWs and too few heat spikes (SSTs exceeding the threshold for less than 5 days duration). Note that in this study we are primarily concerned with the model simulated changes in MHW metrics. Even though the models simulate a mean state in which MHWs are slightly less intense and slightly longer lasting than observed we expect that long-term changes in MHWs should not be affected by such biases in regions where mean temperature warming is the primary driver of MHW changes (Oliver, 2019). However, model-simulated MHW changes may be less realistic in regions where relevant dynamical features (such as western boundary currents) are not sufficiently resolved by the models, and changes in such dynamical features may contribute to changes in MHW properties.
Results
Over the 21st century, projected MHWs show increases in intensity and duration in most regions around the globe. During the 1961–1990 period the time-averaged MHW intensity is relatively high primarily in western boundary current regions and the eastern equatorial Pacific (Figure 1A), consistent with the observed record (Supplementary Figure 1; see also Oliver et al., 2018a). From the RCP8.5 experiment, the pattern of change showed increased MHW intensity nearly everywhere by 2031–2060 (Figure 1B, inter-model robustness of change is indicated by hatching when all models agree on the sign of the change). Increases are particularly high (+2–4°C) in the Mediterranean Sea, the subpolar North Pacific, the Gulf Stream extension region, the East Australian Current Extension, and several disparate small tropical regions. Notably, the higher latitude portions of the North Atlantic and Southern Oceans exhibit no significant projected change in MHW intensity. This pattern is broadly consistent with that of the MMM change in annual mean SST between the same two time periods (not shown). This is also consistent with the historical record which indicates low rates of warming, and even cooling, in parts of the Southern Ocean south of the Antarctic Circumpolar Current (Armour et al., 2016; Sallée, 2018) and in the North Atlantic Subpolar Gyre (Rahmstorf et al., 2015; Menary and Wood, 2018).
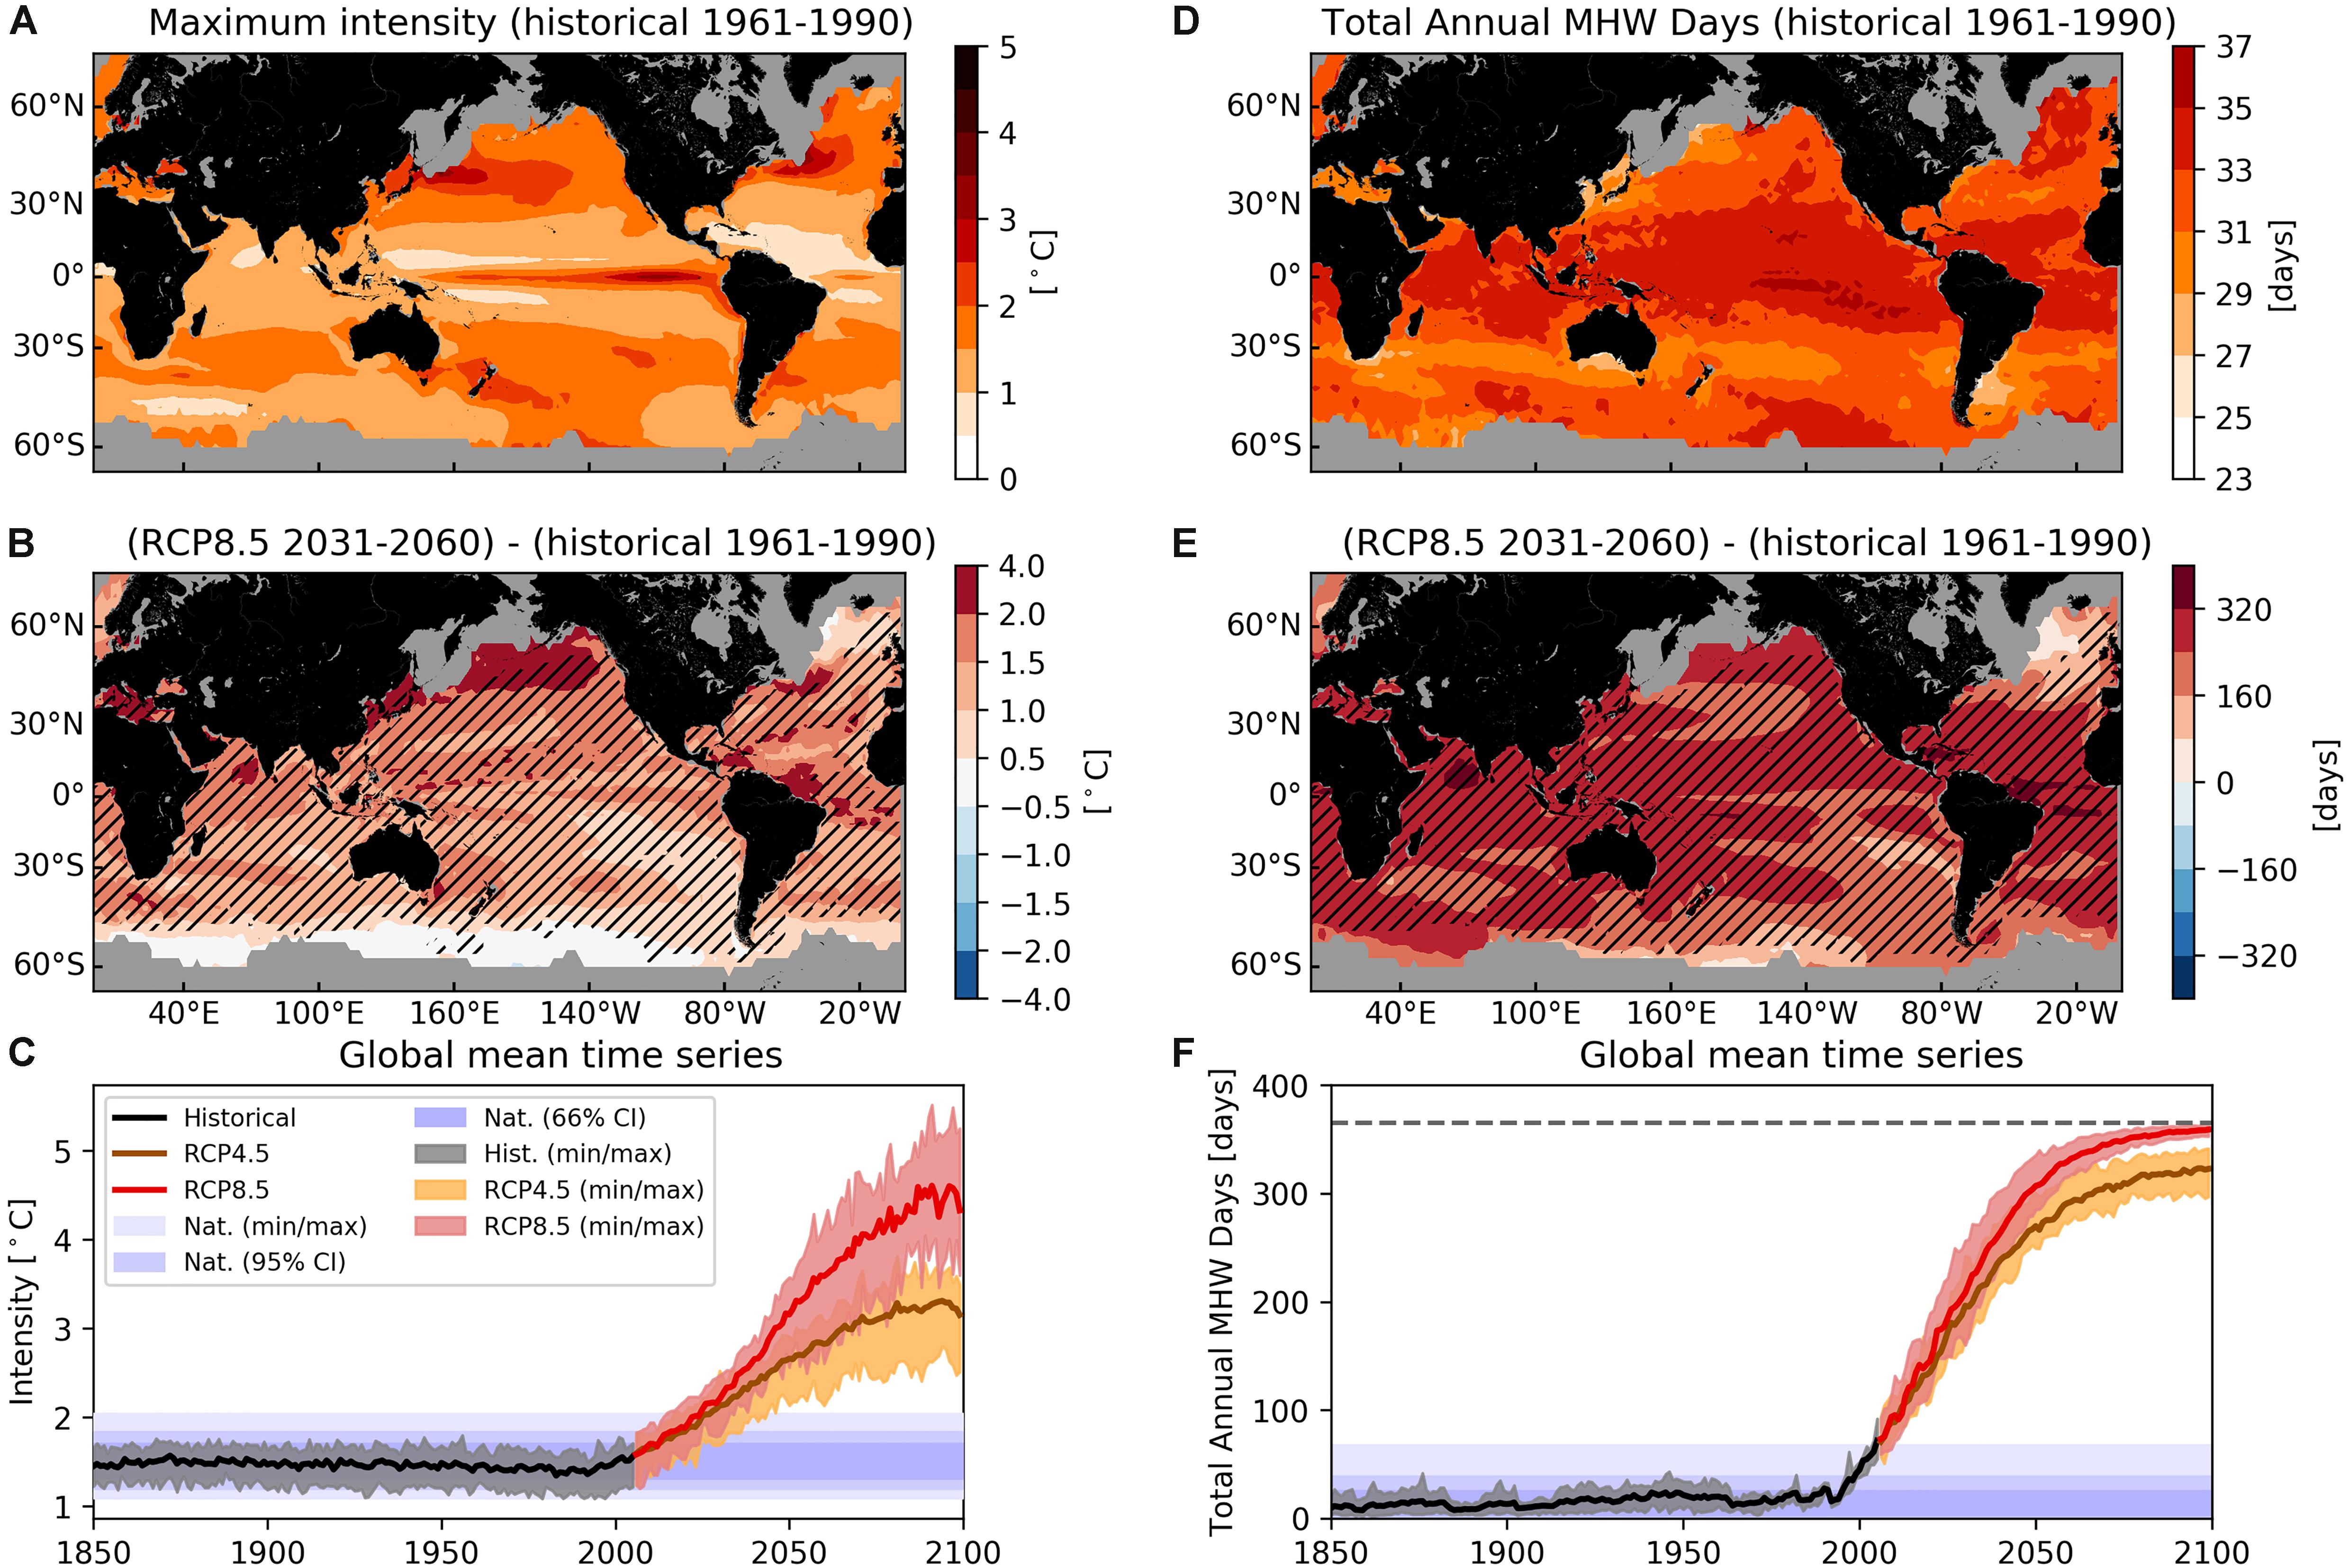
Figure 1. Projected changes to marine heatwaves (MHWs). (A,D) Multi-model mean MHW properties from the historical runs over 1961–1990. (B,E) Change between RCP8.5 run (averaged over 2031–2060) and historical run (averaged over 1961–1990). Hatching indicates that all models agree on the sign of change (corresponding to a 1% significance level based on binomial distribution). (C,D) Annual time series for historical (black), RCP4.5 (brown), and RCP8.5 (red) runs. The gray, red and brown shaded regions show the maximum range between individual model runs. The blue shaded areas show the expected range of natural variability based on a 66% confidence interval (darkest blue), 95% confidence interval (medium blue), and full min-to-max range (lightest blue) of the historicalNat runs (1850–2005). Results for intensity are shown on the left (A,B,C) and for total MHW days on the right (D,E,F). Equivalent figures for each individual model can be found in Supplementary Figures 2–7.
Annual mean time series from the historical experiment (Figure 1C) indicated that, globally, the intensity of MHWs has increased over the historical period (1850–2005; Figure 1C, black line and gray shading) and is projected to increase significantly from 2006 to 2100 for both the RCP4.5 and RCP8.5 experiments (Figure 1C, red and brown lines and shading, respectively). The increase of ca. +1.5°C for RCP4.5 and ca. +3°C for RCP8.5 by 2100 compared with the 1961–1990 historical period, and that the change is largely related to a shift in the mean SST rather than a change in the variability (not shown), indicates that changes in MHW intensity co-vary with changes in mean SST. Importantly, the inter-model range of global mean MHW intensity (Figure 1C, gray shading) exceeds the expected range of natural variability (Figure 1C, blue shading) in the year 2044 for RCP4.5 and by 2033 for RCP8.5.
The mean annual count of MHW days over the 1961–1990 period is relatively uniform across the globe, with most regions experiencing 27.5–35 days (Figure 1D). Exceptions include the eastern tropical Pacific (up to 40 days) and a band along ∼30°S as well as part of the Western Boundary Current regions in the Northern Hemisphere (as low as 25 days). If the MHW definition was narrowed to exceedance of the 90th percentile for a single day, then we expect a climatological count of annual MHW days of 36.5 (10% of the year). However, the criterion of a 5-day minimum duration reduces this frequency and introduces some spatial heterogeneity in the mean fields (see Oliver et al., 2018a for detailed discussion of this point). Sustained warming after the climatological period would then be expected to increase the annual count into the future.
From the RCP8.5 experiment, the pattern of change in MHW days indicates an increased count nearly everywhere by 2031–2060 (Figure 1E). Robust increases across models are ca. +150–300 days over most of the ocean except in the far North Atlantic and the highest latitudes of the Southern Ocean where at least one model simulates changes of opposite sign. Annual mean time series from the historical experiment indicate that, globally, the annual count of MHW days has increased since 1850 (Figure 1F, black line and gray shading), most strong after ca. 1980, and is projected to increase significantly under both future scenarios (RCP4.5 and RCP8.5, 2006–2100; Figure 1F, red and brown lines and shading, respectively). Consequently, in the RCP8.5 experiment, by 2100 the entire globe is projected to approach a permanent MHW state (365 days per year; Figure 1F, dashed line). Importantly, the inter-model range of global mean count of annual MHW days (Figure 1F, gray, red, and brown shading) exceeds the expected range of natural variability (Figure 1F, blue shading) in the year 2009 for RCP4.5 and by 2010 for RCP8.5.
The proportional change in MHW occurrence probability in the historical and RCP simulations can be quantified by comparing outputs to simulations of a historically natural world – that is, a world where the Earth’s atmosphere had not been historically subjected to anthropogenic increases in GHG concentrations (historicalNat, 1850–2005) (Figure 2A). During most of the historical period, the probability of a MHW day occurring was similar to ‘the natural world’ simulation, i.e., the ratio of the former to the latter was close to 1 (Figure 2A). However, by the end of the historical run this probability ratio had increased to 5.4 [inter-model range (Range): 4.1–6.9]. This result implies that globally averaged the probability of a MHW day occurring in the present day simulations is typically five times higher than in simulations with pre-industrial levels of greenhouse gases. For MHWs of at least category “moderate,” this probability ratio increases to 24 for RCP4.5 (Range: 22–26) and 27 for RCP8.5 (Range: 26–28), by the end of the 21st century. This result is not strongly influenced by emissions scenario (RCP4.5 vs. RCP8.5) since MHW days come close to saturation shortly after mid-century in both scenarios (Figure 1F).
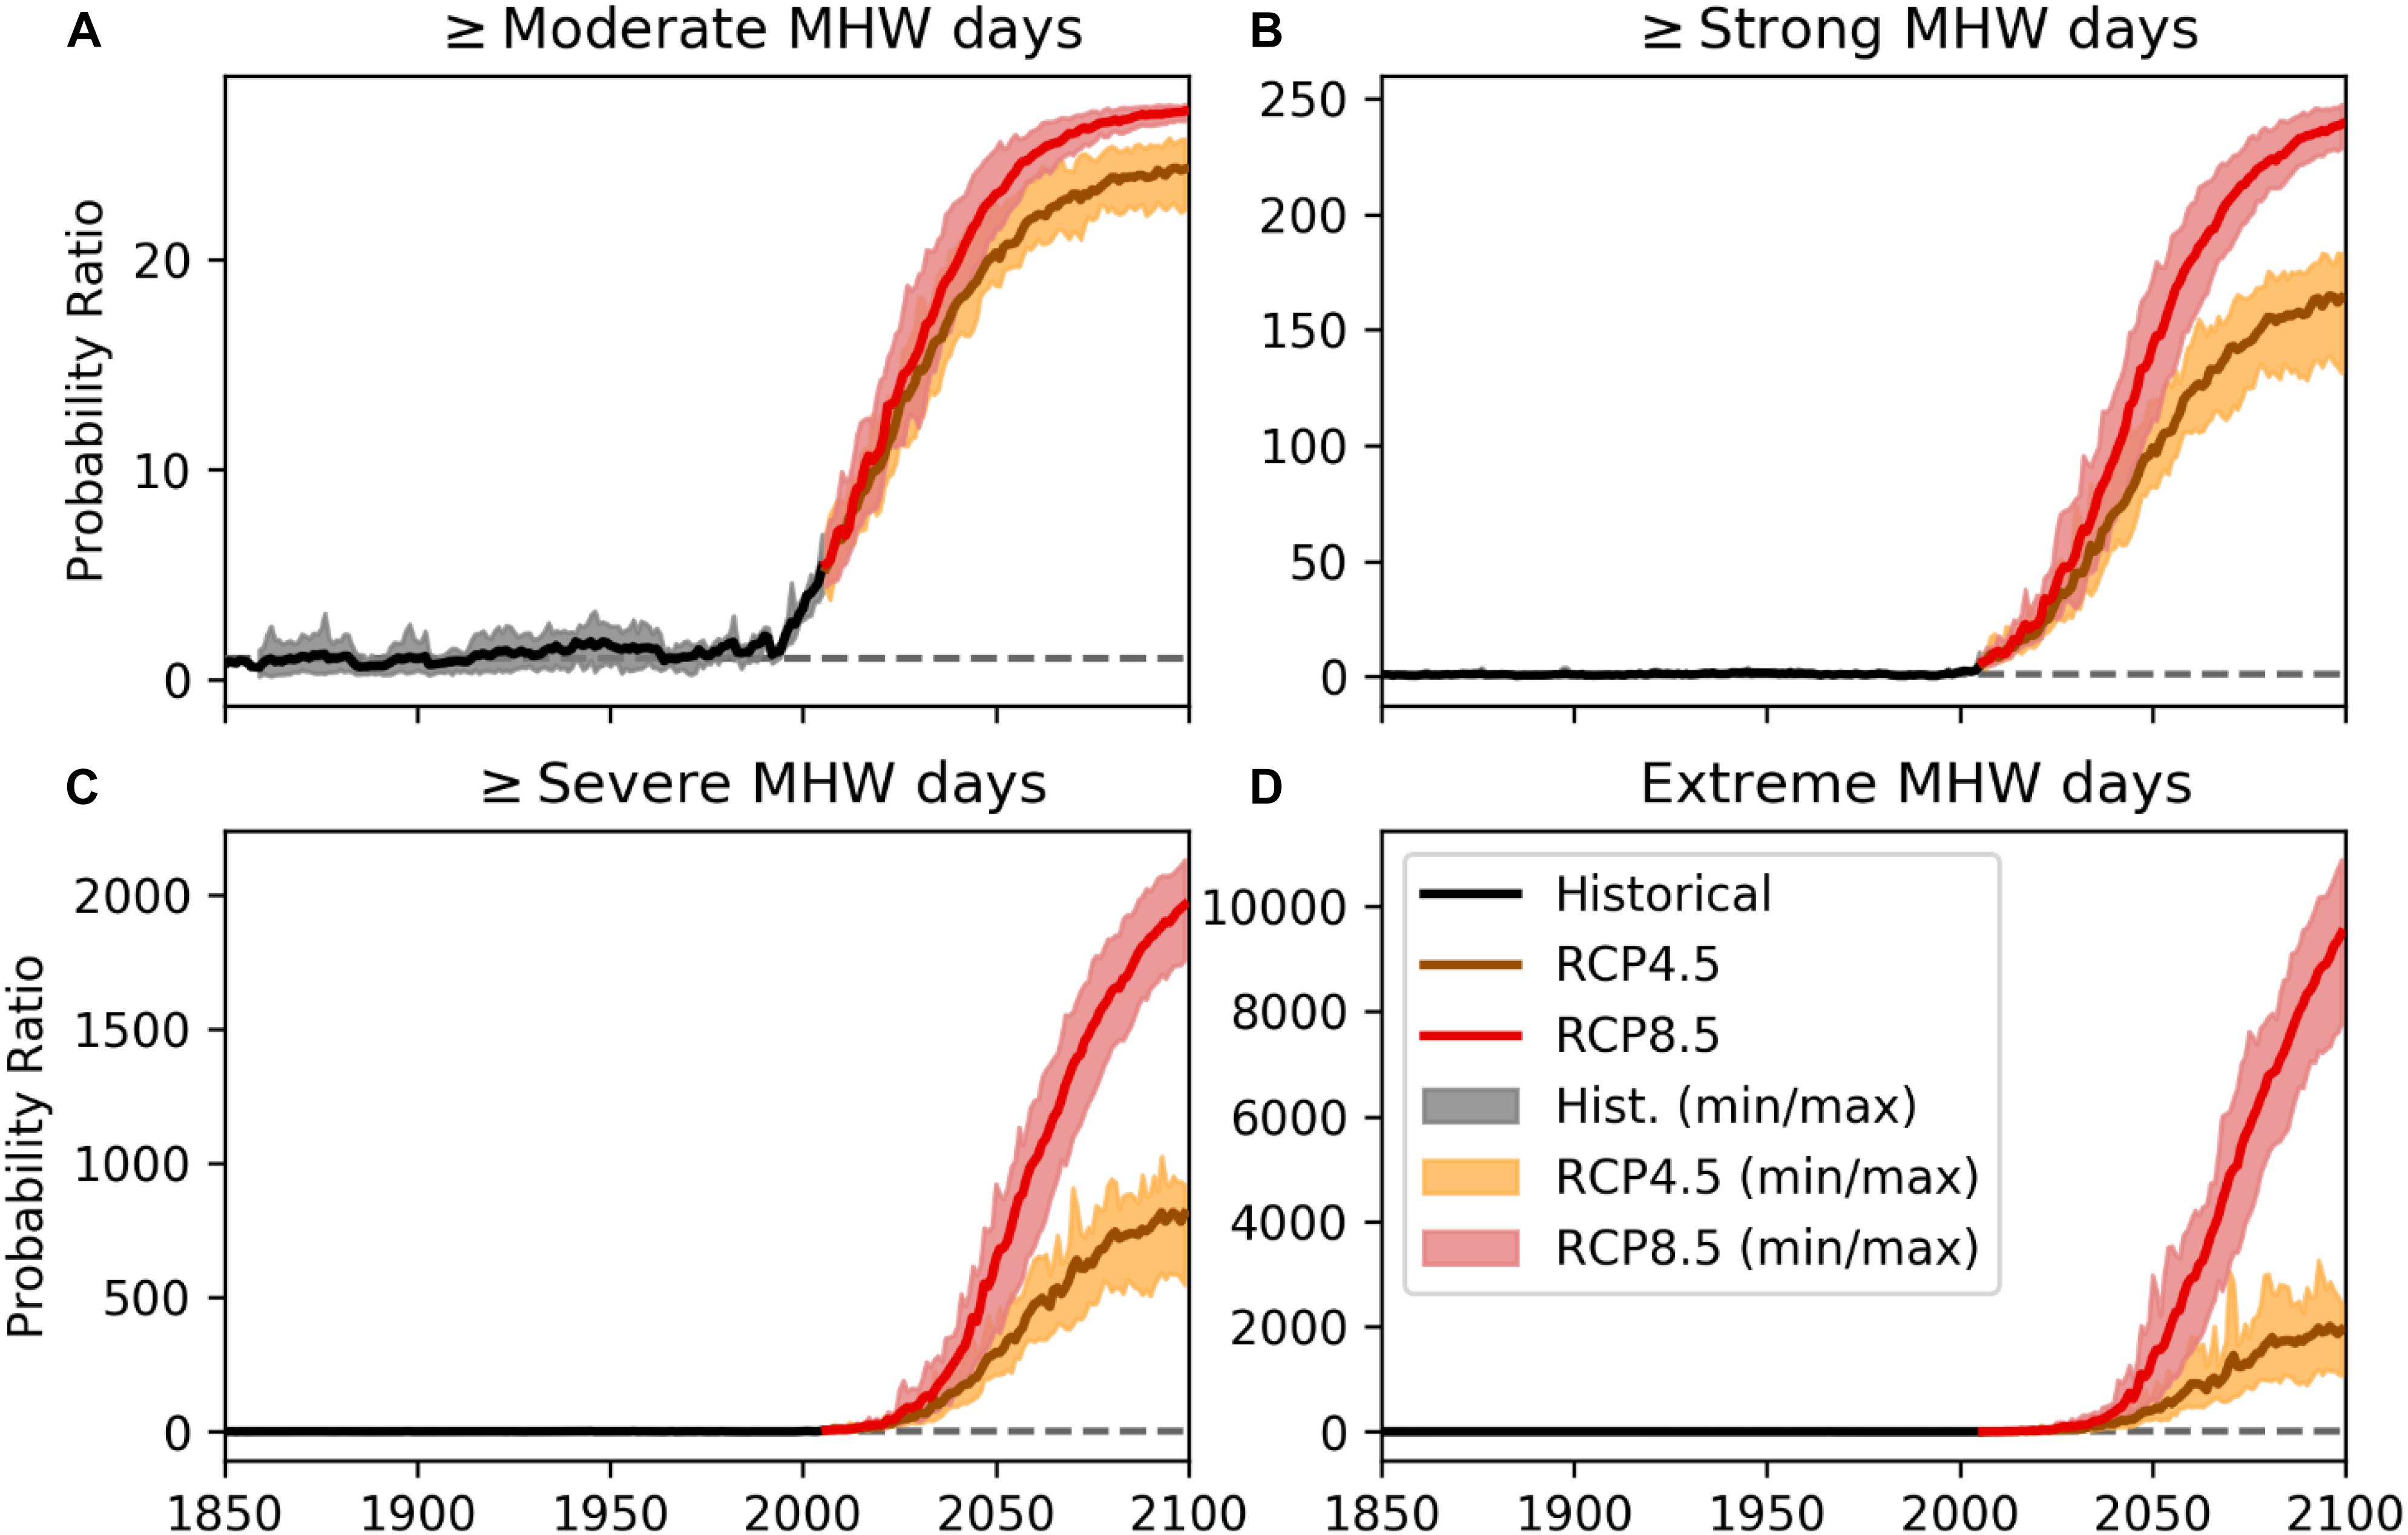
Figure 2. The role of anthropogenic forcing in increasing the probability of MHW days. Each panel shows the globally aggregated probability ratio of a MHW day occurring in a given year from the historical (black), RCP4.5 (brown), and RCP8.5 (red) experiments relative to the probability of a MHW day occurring in the historicalNat experiment (calculated from the full 1850–2005 time series). The panels show the probability ratio but for only MHW days that are (A) at least category moderate, (B) at least category strong, (C) at least category severe, and (D) category extreme. The shaded regions indicate the minimum and maximum values based on individual ensemble members. The dashed line indicates a value of one (i.e., the probability in the historical or projected experiment is the same as in the historicalNat experiment).
However, the emission scenario has a strong effect on the projected intensity of events (Figure 1C) and therefore the exposure to the most extreme events (Figure 3). Historically (1850–2005), the majority of MHW events were categorized (Hobday et al., 2018a) as being moderate (Figure 3, yellow) with relatively few strong events (Figure 3, orange) and very few severe or extreme events (Figure 3, red and brown, respectively). Under the RCP4.5 scenario, future projections suggest that there will be a more even partition between the four categories (ratio of moderate:strong:severe:extreme = 27:33:24:16) by 2100 indicating a dramatic increase in strong, severe and extreme events. By comparison, under the RCP8.5 scenario, extreme MHWs make up the majority of all events (70%) by the end of the 21st century, whereas moderate events are projected to be rare (4%; ratio of moderate:strong:severe:extreme = 4:10:16:70). We also found increasing separation between the two emissions scenarios in raising the occurrence probability of the more intense MHW categories (Figures 2B–D). By 2100, the probability ratio for MHWs of strong (and larger) category is 160 (Range: 130–180; RCP4.5) and 240 (Range: 230–250; RCP8.5); for MHWs of severe (and larger) category is 810 (Range: 550–920; RCP4.5) and 2000 (Range: 1800–2100; RCP8.5); and for extreme MHWs is 1900 (Range: 1100–2400; RCP4.5) and 9500 (Range: 7800–11000; RCP8.5).
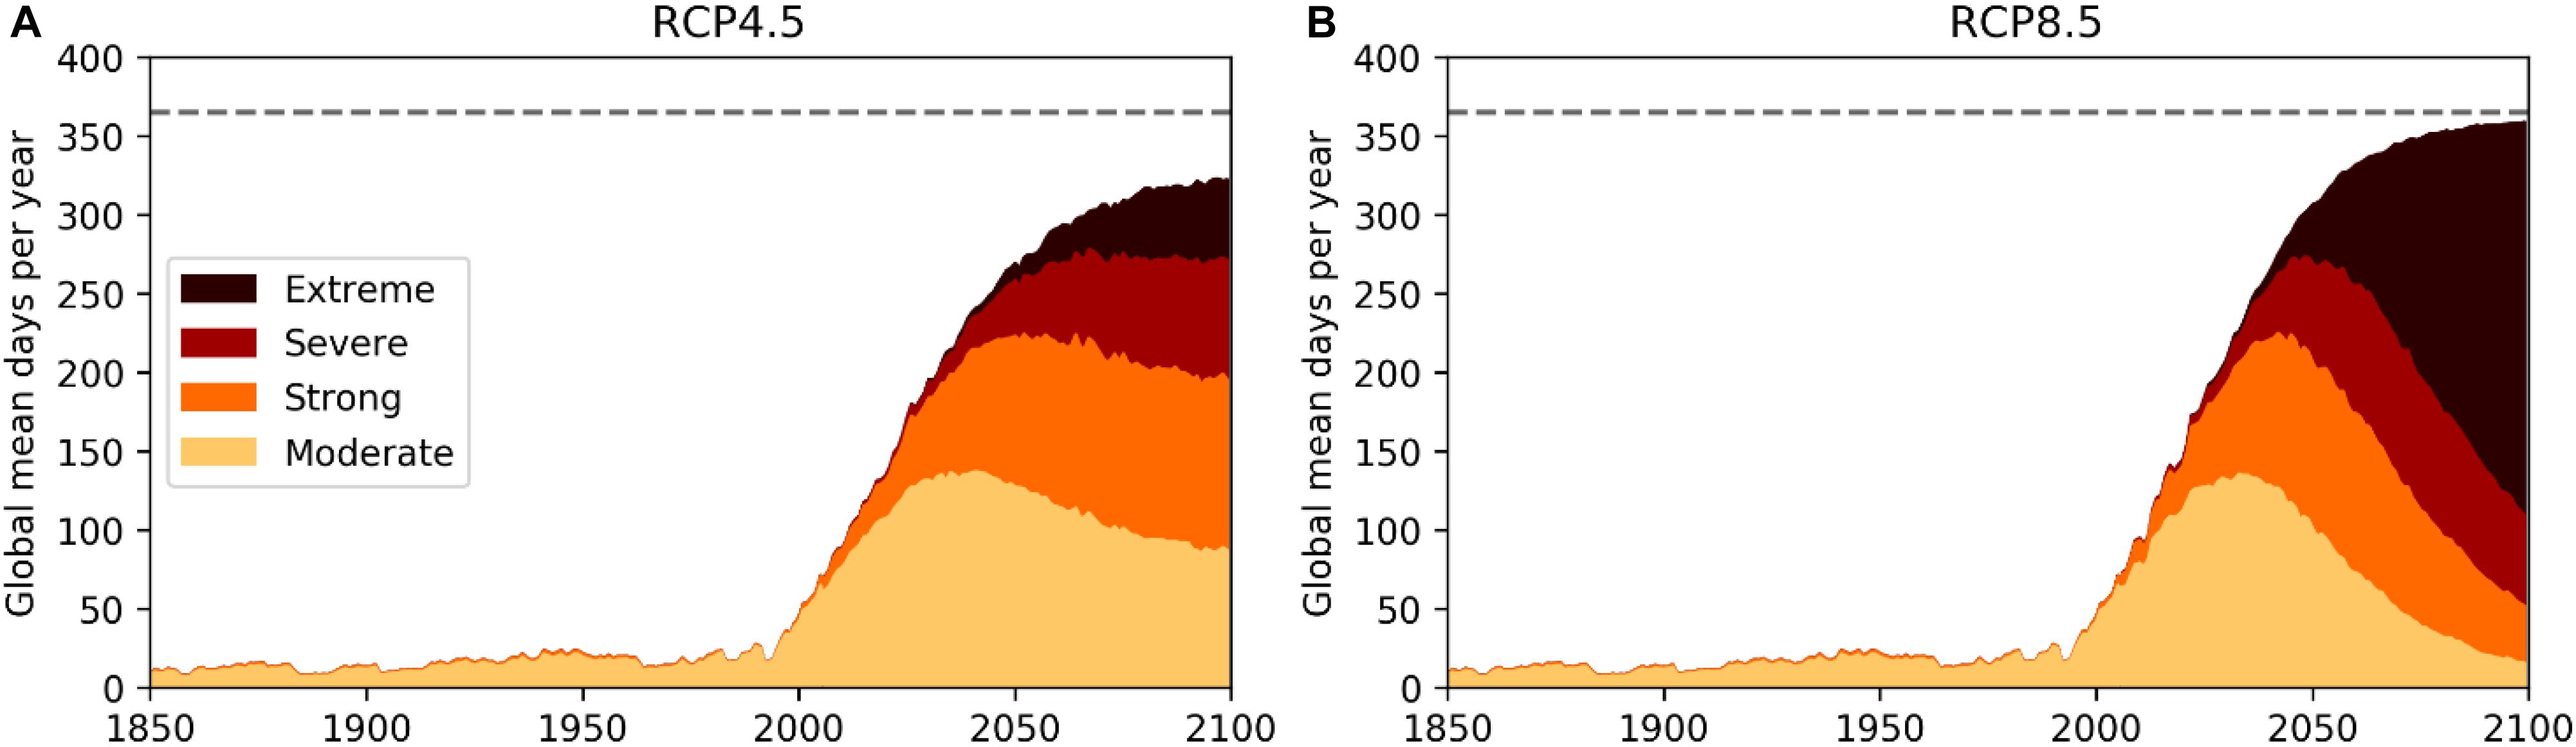
Figure 3. Historical and projected evolution of global mean MHW days, by category. Annual time series of the global mean count of moderate (yellow), strong (orange), severe (red), and extreme (dark brown) MHW days are shown for (A) historical and RCP4.5 experiments and (B) historical and RCP8.5 experiments. Note that the total stacked amount is equivalent to the total MHW days, i.e., the lines shown in Figure 1F. The dashed line indicates a full year (365 days).
Under anthropogenic climate change, we see the emergence of “permanent MHW states” (based on what is considered a MHW in the 1982–2005 base period). The first year of a permanent MHW state occurs at different times over the globe, ranging from 2000 to 2020 in parts of the tropical Atlantic and Pacific, to 2020–2040 over most of the tropical and mid-latitude oceans. At higher latitudes and within some regions (North Atlantic and parts of the Southern Ocean) this state is not reached until the end of the 21st century (Figure 4A). While the proportion of global grid cells experiencing a permanent MHW state increases steadily through the 21st century under both scenarios, the permanent state is approached much faster in RCP8.5 (Figure 4B). More specifically, under the RCP4.5 scenario about 50% of the ocean is in a permanent MHW state by 2100 (Figure 4B, brown line and shading), while >90% is in a permanent MHW state under the RCP8.5 scenario by the end of the century (Figure 4B, red line and shading).
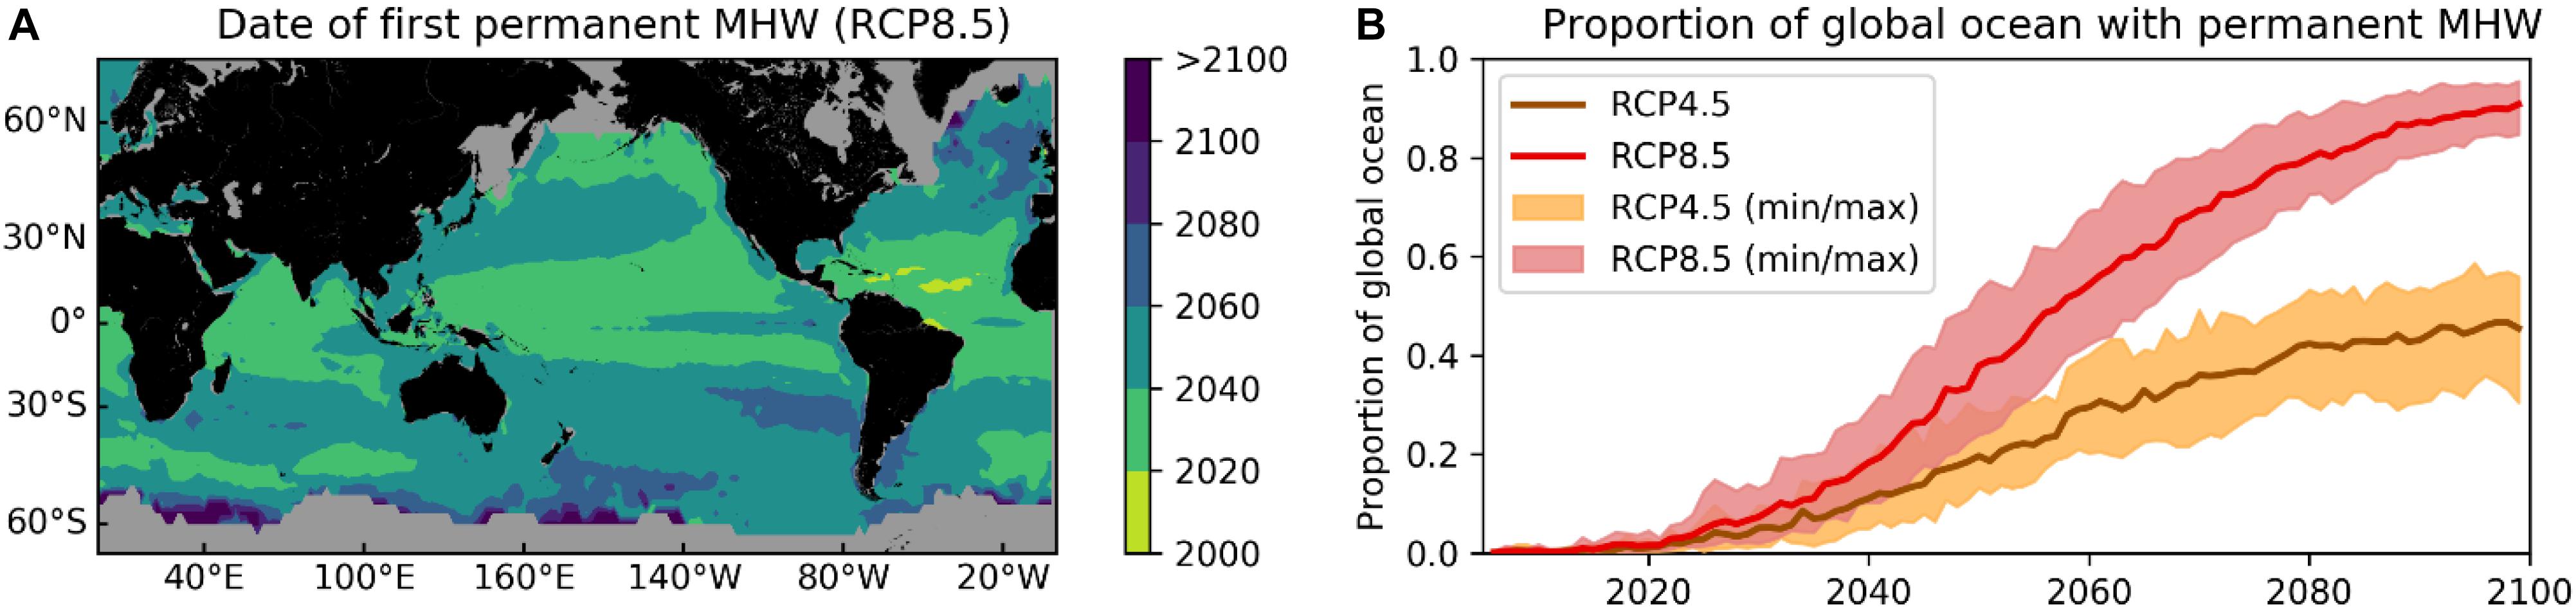
Figure 4. First year of occurrence of permanent MHW states. (A) The year of the first permanent MHW state, i.e., a full year of MHW days, from the RCP8.5 experiment. (B) The proportion of the global ocean grid cells experiencing a permanent MHW state over the 21st century according to the RCP4.5 (brown line) and RCP8.5 (red line) emissions scenarios. The shaded regions indicate the minimum and maximum values based on individual ensemble members.
The emergence of a permanent MHW state implies that “extremes” in the “traditional” sense (i.e., compared to the 1982–2005 climatological baseline) are no longer “extreme,” suggesting that the baseline period to maintain a 90th percentile definition into the future, could perhaps also be shifted or shifting, if understanding the “true extremes” for any time period was the focus of study. Alternatively, the use of ‘new and more extreme’ categories would address this concern, for example, by allowing for identification of increase in “extreme extremes,” as Category V, Category VI, etc. (Hobday et al., 2018a). The choice of baseline depends on the application. For understanding impacts on species that adapt slowly (perhaps on evolutionary timescales) a fixed baseline is appropriate. If a species can adapt over decadal timescales to changing temperatures then a sliding baseline would be more appropriate, although there would presumably be limits to the degree of adaptation that might be possible. Similarly, from a sociological point of view, maintaining a consistent baseline period highlights that the ocean enters an entirely new state, for which we may need to adapt our socio-economic systems (or socio-ecological systems, e.g., Serrao-Neumann et al., 2016). In the next section, we discuss potential ecological implications of future MHWs and cover briefly some potential impacts for marine resource users.
Possible Ecological Impacts
To illustrate ecological impacts, modeled MHW properties were plotted in a “MHW Intensity-Duration phase space” for different time periods and for the RCP8.5 emission scenario (Figure 5A, where lines represent 95% confidence contours of the probability distribution of the sample of all global- and annual-mean MHW intensity and duration for the experiment and time period indicated). These are the same data as shown in Figures 1C,F but plotted against each other. In this representation, the trajectory of anthropogenic climate change can be followed from the first half of the 20th century (1900–1950; Figure 5A, gray line), to the late 20th century (1970–2000; Figure 5A, black line), early 21st century (2005–2035; Figure 5A, red line) and finally to the late 21st century (2050–2080; Figure 5A, purple line). Notably, the overlap with the natural range of MHW metrics (Figure 5A, blue) decreases over time, and by 2050–2080 there is no overlap between the 95% confidence contours from the RCP8.5 experiment and the 20th century conditions. This divergence can be interpreted as the time when the MHW climate has changed completely from the range that species have previously experienced, and represents a qualitatively different climate.
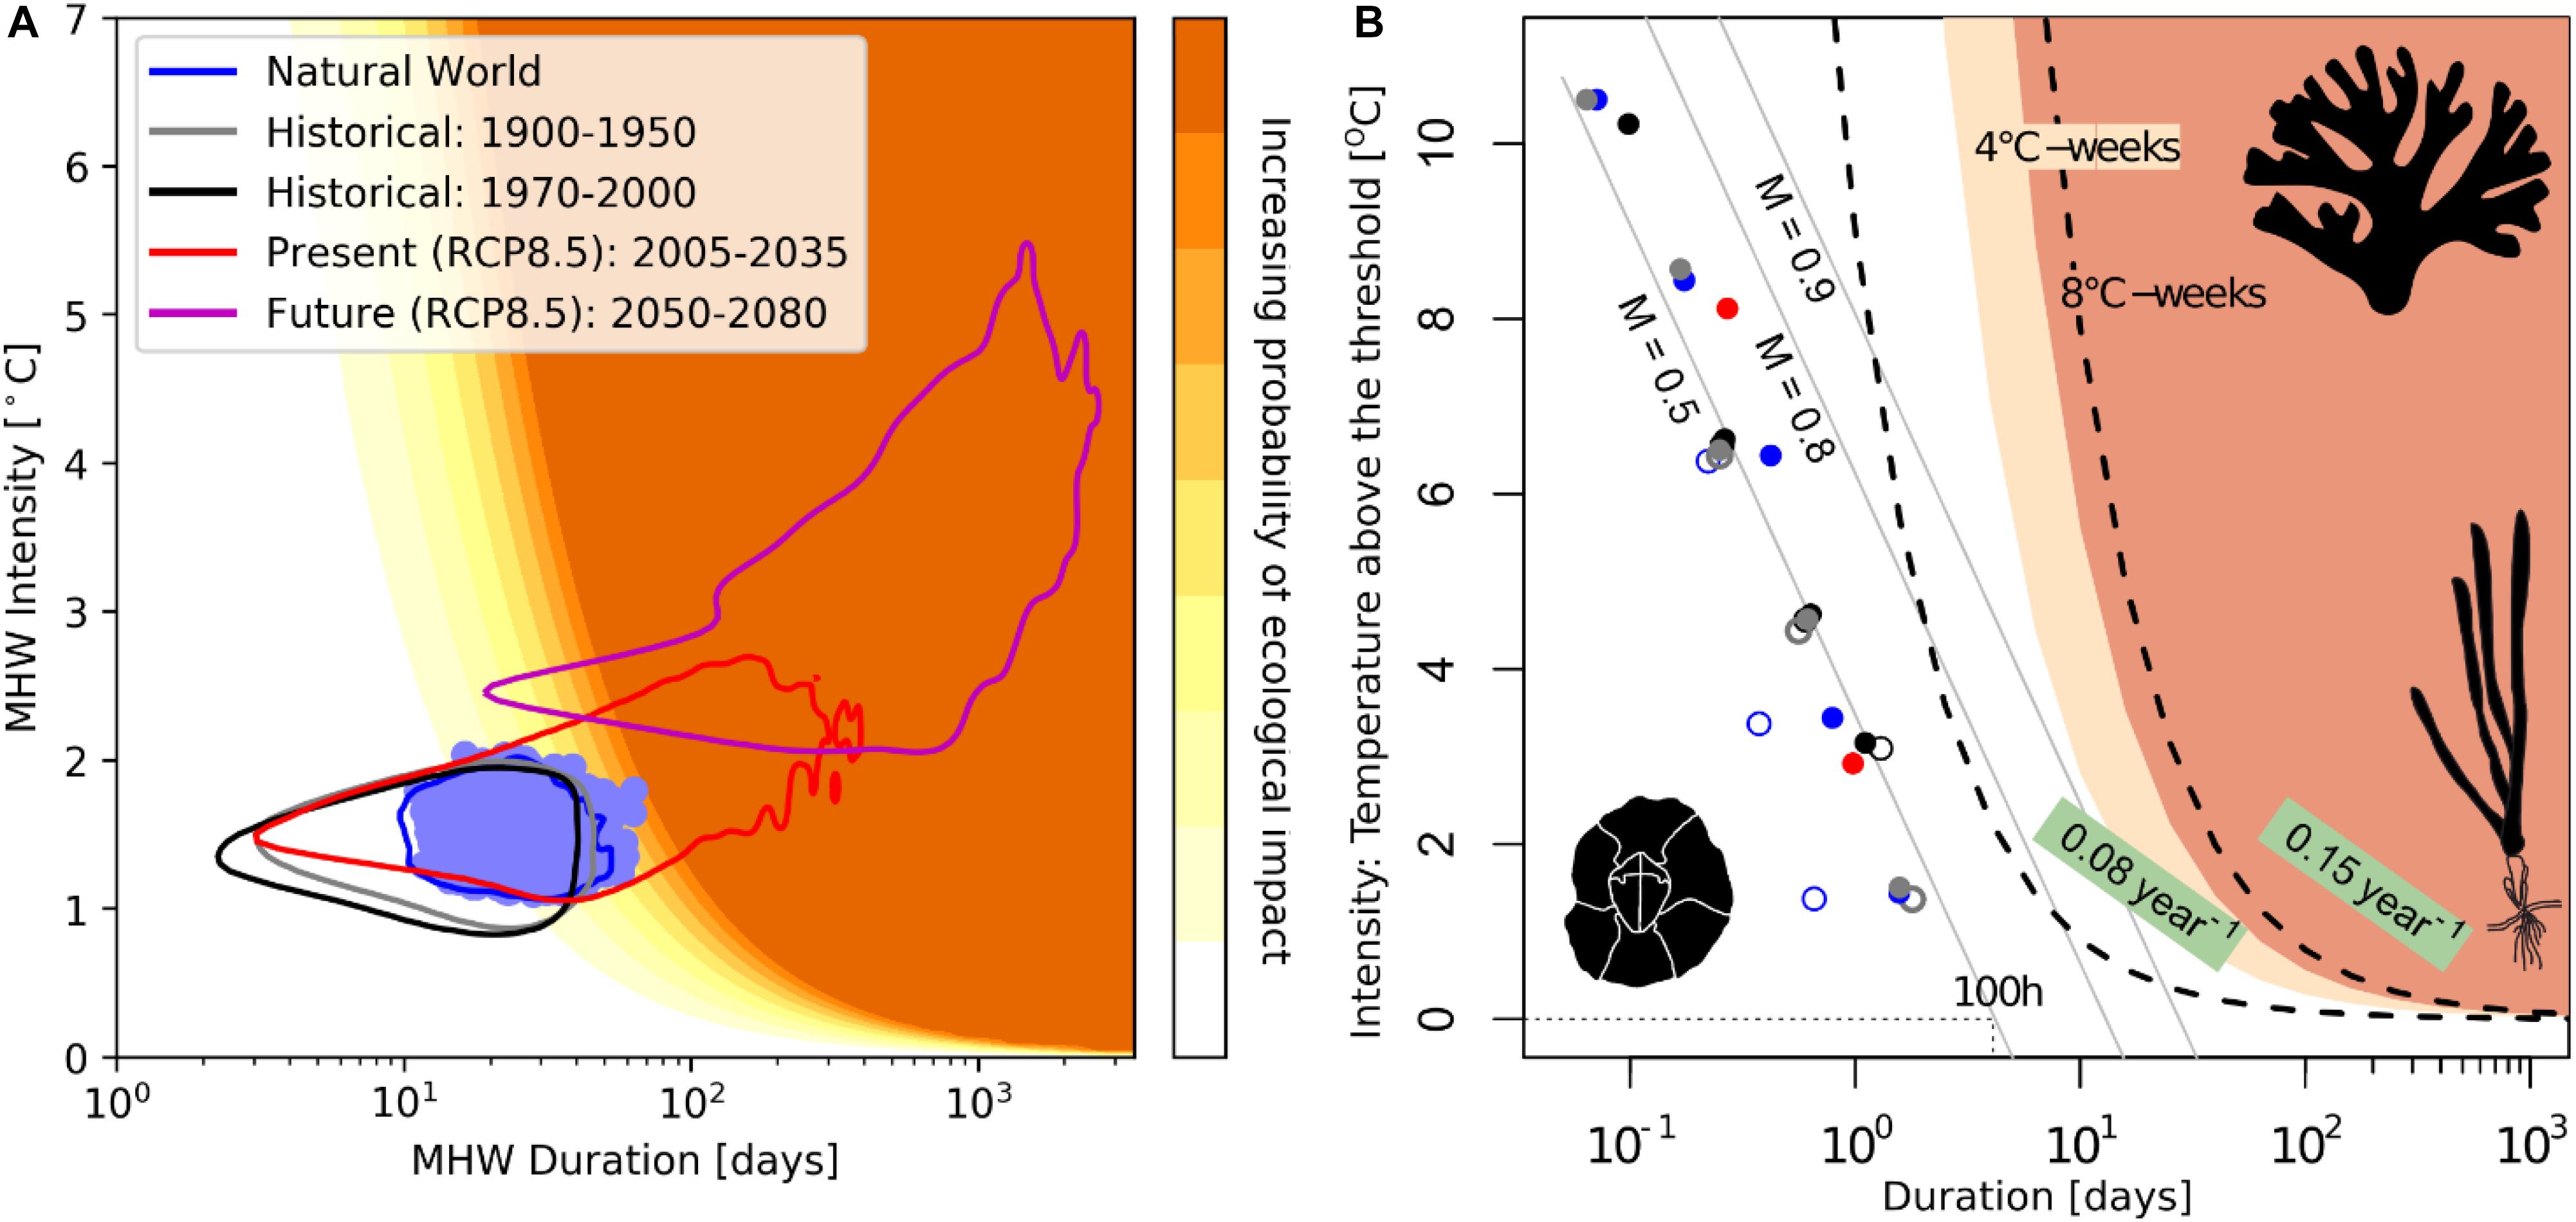
Figure 5. Marine heatwave duration-intensity (x-y) phase space. (A) Solid lines indicate the probability distributions (95% confidence contours) of global annual mean MHW properties from the (blue) historicalNat simulation for 1850–2005, (gray) historical simulation for 1900–1950, (black) historical simulation for 1970–2000, (red) RCP8.5 simulation for 2005–2035 runs and (purple) the RCP8.5 simulation for 2050–2080. Blue overlapping dots indicate annual mean MHW properties from all historicalNat simulations. Orange shading indicates increasing probability of ecological impact (being contours of constant degree-heating-days, i.e., the product of MHW intensity and duration, every 2°C days over the range 4–20°C days). (B) Examples of ecological impacts of an organism’s exposure to extreme temperatures as a function of intensity and duration. For a short-term response, filled circles show time to 50% mortality (M = 0.5, where M is the mortality rate) for intertidal barnacles exposed to temperatures above a threshold defined as that giving 50% mortality after 100 h exposure, with additional fitted lines giving times to expected 80% and 90% mortality (M = 0.8 and M = 0.9, respectively) (Foster, 1969) (see Supplementary Figure 8 for details of symbols and underlying data). For a medium-duration response, filled areas show threshold degree heating weeks for coral bleaching (>4°C-weeks) and mortality (>8°C-weeks) (Liu et al., 2006; Kayanne, 2017). For the effect of MHWs on annual scales, dashed lines show total annual degree days (above 1988–1999 mean maximum temperatures) associated with low and high annual mortality rates of seagrasses (Marba and Duarte, 2010).
The projections indicate that future climate will continue to diverge from historical MHW conditions throughout the 21st century, with MHWs becoming longer and more severe. Based on dramatic ecological effects observed following recent MHWs (Smale et al., 2019), we expect that MHWs will emerge as forceful agents of disturbance to marine ecosystems in the near-future (see also Frölicher and Laufkötter, 2018), as has already occurred on land during terrestrial heatwaves, with reported mass mortality of birds and mammals (Welbergen et al., 2007; Saunders et al., 2011) and signifcant effects on human health (Poumadere et al., 2005; Nairn and Fawcett, 2015; Mitchell et al., 2016). In the most comprehensive synthesis of MHW impacts conducted to date (Smale et al., 2019), MHWs irrespective of their climatological attributes, all exerted negative impacts across taxa (including seaweeds, corals, birds, and mammals) and processes (such as growth, reproduction, and survival). Marine populations are most susceptible to MHWs when they live in regions close to their maximum thermal limit, because temperature anomalies here are more likely to exceed organismal physiological thresholds and hence increase mortality rates (Smale et al., 2019). With increased MHW activity, we predict dramatic losses of marginal populations at equatorward range edges, as documented for seaweeds (Smale and Wernberg, 2013; Wernberg et al., 2016; Thomsen et al., 2019), seagrasses (Thomson et al., 2015) and invertebrates (Garrabou et al., 2009). Where local extinctions and range contractions involve “foundation species,” ecosystem effects are expected to be particularly severe, as habitats are lost, and food web dynamics and species-interactions are altered. Finally, as populations, species and entire communities respond to intensifying MHWs, provision of ecological goods and services to human societies, such as fisheries and aquaculture production, natural carbon storage, nutrient cycling and coastal defense, will likely be severely compromised (Arias-Ortiz et al., 2018; Ruthrof et al., 2018; Smale et al., 2019).
How projected increases in MHW properties will induce specific ecological change will depend, in part, on the physical attributes of the MHWs themselves, as changes in intensity and duration will affect different organisms in different ways. Short, high intensity MHWs are likely to induce acute stress, as physiological tolerances are exceeded, resulting in reduced growth and possible mortality (Garrabou et al., 2009; Smale and Wernberg, 2013). Effects of MHWs on mortality rates can be expressed through the combination of intensity and duration used to define the heatwaves themselves. For extreme short-term effects, inferences can be drawn from laboratory experiments on temperature tolerance. Here increasing mortality rates reduce survival times with increasing temperature. Intertidal barnacles exhibit this, for example see Foster (1969) (Supplementary Figure 8), such that the log of the 50% survival time decreases linearly with temperature (Figure 5B, dots and gray lines), giving a quantitative expectation for survival in short, extreme MHWs. Slightly less intense but longer-lasting events may change reproductive outputs and induce behavioral changes, such as movement toward less stressful conditions (Wismer et al., 2019). Medium intensity and longer lasting events over several months, are more likely to affect organismal performance by altering rates of feeding, growth, reproduction and other key processes (Mills et al., 2012). Over this timescale, effects of MHWs on coral reefs are predicted using degree heating weeks above set thresholds (Liu et al., 2006; Kayanne, 2017), with >4°C-weeks associated with the onset of bleaching and >8°C-weeks with widespread bleaching and some mortality (Figure 5B, shading). Longer-term cumulative effects of MHWs can be seen in interannual changes in mortality rates. For Mediterranean seagrasses, annual mortality correlated strongly with total degree-days above the average maximum yearly temperature in preceding decades (Marba and Duarte, 2010; Figure 5B, dashed lines). The three examples of combined intensity and duration effects on survival show the potential for quantitative prediction of future specific MHW effects where the responses to current extreme events is understood.
Ultimately, long-lasting MHW conditions could lead to changes in population structure (Smale et al., 2017) and the geographic distributions of species (Smale and Wernberg, 2013; Cure et al., 2018). Moreover, higher temperatures experienced during MHWs may increase the prevalence of pathogens and diseases and thereby reduce the health of organisms and populations (Rubio-Portillo et al., 2016). However, not all impacts will be “negative,” as warm-adapted species and organisms living near their colder poleward ranges should experience improved growth conditions under future MHWs and are therefore likely to increase in abundance (Smale and Wernberg, 2013).
Marine heatwave-induced changes at the organism, population and species levels will also result in changes to the structure of communities, ecosystems and food webs. Where populations of foundation species are affected, indirect effects on other dependent species can be expected (Thomson et al., 2015; Wernberg et al., 2016). For example, recent MHWs have disrupted food webs by changing prey availability, resulting in mass mortality at higher trophic levels (Jones et al., 2018). Additionally, MHWs can drive changes in the distribution and activity of key grazers, such as finfish and sea urchins, with indirect consequences for primary producers, such as seaweeds and seagrasses (Bennett et al., 2015). Clearly, rapid reconfiguration of communities, ecosystems and food webs will almost certainly have ramifications for ecological functioning, and the provision of ecosystem goods and services (Smale et al., 2019).
Major knowledge gaps in our current understanding of how intensification of MHWs will affect marine organisms and communities are associated with whether species can acclimatize and adapt to warmer conditions, and if so how (Donelson et al., 2019; Fox et al., 2019). In other words, facing increasing MHWs, species will either “adapt, move or die.” Under the various “adaptation” scenarios, species may (i) change behavior, (ii) acclimatize, (iii) experience epigenetic effects across generations, or (iv) experience “true” adaptations through natural selection. Experimental, observational, and modeling studies are needed to understand the relative contribution of each strategy to persistence, and the likely success of each in the future (Fox et al., 2019). For example, behavioral change, such as fish that move to deeper and colder water, may be a short-term strategy to avoid localized stress from a specific MHW but may thereby reduce growth and reproductive performance. Similarly, epigenetic variation may constrain the coping range of a species, leaving selective adaptation as the only viable long-term strategy for a species to cope with the projected increase in MHWs. The rate of selective adaptation will likely vary widely between different species, complicating ecological predictions across space and time.
For human users of marine resources, such as fishers, aquaculture managers, and tourism operators, species persistence and performance are critical for long-term sustainable usage. For example, users in regions that lose iconic species or habitats as a result of global warming and MHWs, such as on the Great Barrier Reef, will have to accept modified natural systems (Hughes et al., 2018) that are likely to impact our society and economy (Marshall et al., 2019). Fisheries and aquaculture industries will need to take a risk-based approach (Hobday et al., 2018b), as prediction of MHWs will be challenging in some regions. There will continue to be surprises associated with MHWs, such as emergence of new diseases (Oliver et al., 2017) and arrival of new species (Pearce and Feng, 2013). Efforts are therefore underway in several regions to climate-proof fisheries management (Creighton et al., 2016), and the impact of extreme events such as MHWs should be considered in this planning (Hobday and Cvitanovich, 2017).
Summary and Conclusion
In this study, we used a suite of global climate models to examine the projected changes in MHWs globally. We found that both the intensity of MHWs and the annual count of MHW days are projected to increase significantly over the 21st century. The emission scenario strongly affects the projected intensity of events, with MHW increases following the high-emission scenario (RCP8.5) nearly double (by 2100, compared to the 1982–2005 baseline period) those projected under the lower-emission scenario (RCP4.5). The difference between emission scenarios is smaller when considering the total annual MHW days, since both saturate to near-permanent MHW states by 2100. However, the high-emission scenario dramatically increases the frequency of MHW days for the most extreme events. Overall, our analysis suggests that anthropogenic forcing will increase the likelihood of MHW occurrence in comparison to a climate with only natural forcing, especially for the more extreme category events. The models suggest that we have departed from the natural background of MHW occurrence – conditions that over millennia have shaped the distribution of marine species and the structure and function of ecosystems. Given several recently observed rapid impacts on marine ecosystems, additional ecosystem changes are likely to be widespread, significant and persistent throughout the 21st century.
An important point that the research community must consider is how to treat the baseline climatological period when performing MHW analyses for rapidly changing climates. Here we have chosen a fixed baseline, while others have advocated for a moving baseline (Jacox, 2019). In our opinion, there is no certain answer to the question of whether baselines should be fixed in time or if they should be allowed to move in time. The use of fixed versus moving baselines should in fact be dictated by the specific question of the study, and if impacted ecosystems are likely to be able to adapt over time or not. The use here of a fixed baseline implies that the results around ecosystem impacts are of primary relevance for ecosystems with little to no ability to adapt on timescales that are fast relative to the warming rate. However, the occurrence increases strongly with the mean warming rate (Alexander et al., 2018; Oliver, 2019; Pershing et al., 2019) leading to future “permanent MHW states,” exposing to society that the paradigm of MHWs as “transient” extreme events will need re-examination. Of course, the most extreme category events will still be transient – even if new categories need to be defined. Conversely, the advantage of shifting the baseline in time is that one can more clearly partition to what extent MHWs are related to a mean background warming or non-seasonal temperature variance, which may be useful in communicating to the public why an event is occurring. Defining a fixed baseline period for developing climatologies has been questioned by some scientists (e.g., Jacox, 2019) who suggest a moving frame of reference is more appropriate. This issue needs to be guided by ecological adaptation time scales and the nature of the scientific question being asked, but a fixed baseline is currently standard across climate studies.
One limitation of the present study is the use of global models to make inferences about ecological impacts which are likely to be very coastal. These coastal zones may be poorly resolved by the model. In fact, this is one of the biggest issues facing coastal ecologists concerned with temperature-related ecosystem impacts. Here we have considered MHWs occurring at a particular location, i.e., at the pixel level, and we have neglected to acknowledge the spatial coherency of most MHWs. MHWs likely to lead to ecosystem impacts, including past “major events” such as the 2003 Mediterranean event, 2011 Ningaloo Niño and the 2012 NW Atlantic event, span far beyond the closest coastal pixel. Their spatial scale extends over hundreds to thousands of kilometers, which are resolved by global ocean and climate models. A similar correspondence can be seen in coarse resolution satellite SST products where studies have used remotely sensed satellite, surfer-captured and kelp forest temperature logger data showing a good correspondence across the data sources (Brewin et al., 2018), as well as a general consistency between satellite and benthic/coastal temperature loggers (Stobart et al., 2016), and between satellite SSTs and in situ benthic temperatures (Smale and Wernberg, 2009). While there certainly would be many empirical and theoretical exceptions to this correspondence, these studies indicate that there is utility in these global products at inferring coastal temperatures and ecosystem impacts.
Our study contributes to the growing body of literature examining long-term changes in MHWs. Importantly, we build directly on knowledge of changes in observed MHW characteristics over the past century estimated from daily satellite observations, daily in situ measurements, and gridded monthly in situ-based SSTs (Oliver et al., 2018a) – where it was found that global averages of annual MHW days increased by 54% from 1925 to 2016 (Oliver et al., 2018a). Here, we show that this historical trend is projected to continue and accelerate throughout the 21st century. Other studies have also modeled projected changes in MHWs, either globally (Frölicher et al., 2018) or regionally (Alexander et al., 2018; Darmaraki et al., 2019). Here, we have provided additional critical information on the effect of anthropogenic climate change on different categories of MHW events and discussed the potential ecological impacts of changes to MHWs in the future. Specifically extreme temperature events can drive abrupt changes in the structure and functioning of entire ecosystems, with major consequences for marine resource users that depend on the ocean for ecological goods and services (Smale et al., 2019). Given that global mean warming is the principal driver of the projected increase in MHWs (Oliver, 2019), reductions in GHG emissions combined with adaptive management of marine systems is needed to minimize the impacts of MHWs on marine biodiversity and ecosystems.
Data Availability Statement
We have made use of publicly available data only; no new data were generated as a result of this study. NOAA High Resolution SST data provided by the NOAA/OAR/ESRL PSD, Boulder, CO, United States, from their website at https://www.esrl.noaa.gov/psd/. CMIP5 model output data were provided by the ARC Centre of Excellence for Climate Extremes and Australia’s National Computing Infrastructure. These data are available publicly via the Earth System Grid Federation’s CMIP5 project data website https://esgf-node.llnl.gov/projects/cmip5/. The Python code used to perform the analyses is available here: https://github.com/ecjoliver/Global_MHW_Projections.
Author Contributions
EO led and coordinated the various components of the study throughout. EO, MD, AS, LA, and SP-K developed the methodology for analysis of the climate model output. MB led the section on ecological impacts and AH, PM, MT, DS, and TW contributed to its development. All authors discussed the results, aided in their interpretation, and contributed in writing the manuscript.
Conflict of Interest
The authors declare that the research was conducted in the absence of any commercial or financial relationships that could be construed as a potential conflict of interest.
Funding
This research was supported by the Australian Research Council grants CE170100023 and FT170100106, Natural Environment Research Council International Opportunity Fund NE/N00678X/1, National Sciences and Engineering Research Council of Canada Discovery Grant RGPIN-2018-05255, and Brian Mason (Impacts of an unprecedented marine heatwave). This project was partially supported through funding from the Earth Systems and Climate Change Hub of the Australian Government’s National Environmental Science Program.
Acknowledgments
This study is an outcome from an International Marine Heatwaves Working Group workshop (www.marineheatwaves. org). We acknowledge the World Climate Research Program’s Working Group on Coupled Modeling, which is responsible for CMIP, and we thank the climate modeling groups (listed in Table 1 of this paper) for producing and making available their model output. EO would like to acknowledge Coral Oliver, who slept in one of his arms while the other arm wrote most of the computer code underlying the analysis in this study.
Supplementary Material
The Supplementary Material for this article can be found online at: https://www.frontiersin.org/articles/10.3389/fmars.2019.00734/full#supplementary-material
Footnotes
- ^ http://github.com/ecjoliver/marineHeatWaves
- ^ https://robwschlegel.github.io/heatwaveR
- ^ https://github.com/ZijieZhaoMMHW/m_mhw1.0
References
Alexander, M. A., Scott, J. D., Friedland, K. D., Mills, K. E., Nye, J. A., Pershing, A. J., et al. (2018). Projected sea surface temperatures over the 21st century: changes in the mean, variability and extremes for large marine ecosystem regions of Northern Oceans. Elem. Sci. Anth. 6:9. doi: 10.1525/elementa.191
Arias-Ortiz, A., Serrano, O., Masqué, P., Lavery, P. S., Mueller, U., Kendrick, G. A., et al. (2018). A marine heatwave drives massive losses from the world’s largest seagrass carbon stocks. Nat. Clim. Chang. 8, 338–344. doi: 10.1038/s41558-018-0096-y
Armour, K. C., Marshall, J., Scott, J. R., Donohoe, A., and Newsom, E. R. (2016). Southern Ocean warming delayed by circumpolar upwelling and equatorward transport. Nat. Geosci. 9, 549–554. doi: 10.1038/ngeo2731
Banzon, V., Smith, T. M., Chin, T. M., Liu, C., and Hankins, W. (2016). A long-term record of blended satellite and in situ sea-surface temperature for climate monitoring, modeling and environmental studies. Earth Syst. Sci. Data 8, 165–176.
Bellprat, O., Guemas, V., Doblas-Reyes, F., and Donat, M. G. (2019). Towards reliable extreme weather and climate event attribution. Nat. Commun. 10:1732. doi: 10.1038/s41467-019-09729-2
Bennett, S., Wernberg, T., Harvey, E. S., Santana-Garcon, J., and Saunders, B. J. (2015). Tropical herbivores provide resilience to a climate-mediated phase shift on temperate reefs. Ecol. Lett. 18, 714–723. doi: 10.1111/ele.12450
Brewin, R., Smale, D., Moore, P., Dall’Olmo, G., Miller, P., Taylor, B., et al. (2018). Evaluating operational AVHRR sea surface temperature data at the coastline using benthic temperature loggers. Remote Sens. 10:925. doi: 10.3390/rs10060925
Cavole, L. M., Demko, A. M., Diner, R. E., Giddings, A., Koester, I., Pagniello, C. M. L. S., et al. (2016). Biological impacts of the 2013–2015 warm-water anomaly in the Northeast Pacific: winners, losers, and the future. Oceanography 29, 273–285.
Chen, K., Gawarkiewicz, G. G., Lentz, S. J., and Bane, J. M. (2014). Diagnosing the warming of the Northeastern US Coastal Ocean in 2012: a linkage between the atmospheric jet stream variability and ocean response. J. Geophys. Res. 119, 218–227. doi: 10.1002/2013jc009393
Creighton, C. A., Hobday, A. J., Lockwood, M., and Pecl, G. T. (2016). Adapting management of marine environments to a changing climate: a checklist to guide reform and assess progress. Ecosystems 19, 187–219. doi: 10.1007/s10021-015-9925-2
Cure, K., Hobbs, J.-P. A., Langlois, T. J., Abdo, D. A., Bennett, S., and Harvey, E. S. (2018). Distributional responses to marine heat waves: insights from length frequencies across the geographic range of the endemic reef fish Choerodon rubescens. Mar. Biol. 165:1. doi: 10.1155/2016/3251814
Darmaraki, S., Somot, S., Sevault, F., Nabat, P., Cabos, W., Cavicchia, L., et al. (2019). Future evolution of marine heatwaves in the Mediterranean Sea. Clim. Dyn. 53, 1371–1392. doi: 10.1007/s00382-019-04661-z
Donelson, J. M., Sunday, J. M., Figueira, J. F., Gaitan-Espitia, J.-D., Hobday, A. J., Johnson, C. R., et al. (2019). Plasticity, adaptation and range shifts: a model to describe their interactions in response to environmental change for marine ectotherms. Philos. Trans. R. Soc. Lond. B Biol. Sci. 374:20180186. doi: 10.1098/rstb.2018.0186
Foster, B. A. (1969). Tolerance of high temperatures by some intertidal barnacles. Mar. Biol. 4, 326–332.
Fox, R. J., Donelson, J. M., Schunter, C., Ravasi, T., and Gaitán-Espitia, J. D. (2019). Beyond buying time: the role of plasticity in phenotypic adaptation to rapid environmental change. Philos. Trans. R. Soc. Lond. B Biol. Sci. 374:20180174. doi: 10.1098/rstb.2018.0174
Frölicher, T. L., Fischer, E. M., and Gruber, N. (2018). Marine heatwaves under global warming. Nature 560, 360–364. doi: 10.1038/s41586-018-0383-9
Frölicher, T. L., and Laufkötter, C. (2018). Emerging risks from marine heat waves. Nat. Commun. 9:650. doi: 10.1038/s41467-018-03163-6
Garrabou, J., Coma, R., Bensoussan, N., Bally, M., Chevaldonné, P., Cigliano, M., et al. (2009). Mass mortality in Northwestern Mediterranean rocky benthic communities: effects of the 2003 heat wave. Glob. Change Biol. 15, 1090–1103. doi: 10.1111/j.1365-2486.2008.01823.x
Hobday, A. J., Alexander, L. V., Perkins, S. E., Smale, D. A., Straub, S. C., Oliver, E. C. J., et al. (2016). A hierarchical approach to defining marine heatwaves. Prog. Oceanogr. 141, 227–238. doi: 10.1016/j.pocean.2015.12.014
Hobday, A. J., and Cvitanovich, C. (2017). Preparing Australian fisheries for the critical decade: insights from the past 25 years. Mar. Freshw. Res. 68, 1779–1787.
Hobday, A. J., Oliver, E. C. J., Sen Gupta, A., Benthuysen, J. A., Burrows, M. T., Donat, M. G., et al. (2018a). Categorizing and naming marine heatwaves. Oceanography 31, 162–173.
Hobday, A. J., Spillman, C. M., Eveson, P., Hartog, J., Zhang, X., and Brodie, S. (2018b). A framework for combining seasonal forecasts and climate projections to aid risk management for fisheries and aquaculture. Front. Mar. Sci. 5:137. doi: 10.3389/fmars.2018.00137
Holbrook, N. J., Scannell, H. A., Sen Gupta, A., Benthuysen, J. A., Feng, M., Oliver, E. C. J., et al. (2019). A global assessment of marine heatwaves and their drivers. Nat. Commun. 10:2624. doi: 10.1038/s41467-019-10206-z
Hughes, T. P., Kerry, J. T., Baird, A. H., Connolly, S. R., Dietzel, A., Eakin, C. M., et al. (2018). Global warming transforms coral reef assemblages. Nature 556, 492–496. doi: 10.1038/s41586-018-0041-2
Hughes, T. P., Kerry, J. T., Connolly, S. R., Baird, A. H., Eakin, C. M., Heron, S. F., et al. (2019). Ecological memory modifies the cumulative impact of recurrent climate extremes. Nat. Clim. Chang. 9, 40–43. doi: 10.1038/s41558-018-0351-2
Jacox, M. G. (2019). Marine heatwaves in a changing climate. Nature 571, 485–487. doi: 10.1038/d41586-019-02196-1
Jacox, M. G., Alexander, M. A., Mantua, N. J., Scott, J. D., Hervieux, G., Webb, R. S., et al. (2018). Forcing of multiyear extreme ocean temperatures that impacted California current living marine resources in 2016. Bull. Am. Meteorol. Soc. 99, S27—S33.
Jones, T., Parrish, J. K., Peterson, W. T., Bjorkstedt, E. P., Bond, N. A., Ballance, L. T., et al. (2018). Massive mortality of a planktivorous seabird in response to a marine heatwave. Geophys. Res. Lett. 45, 3193–3202. doi: 10.1002/2017gl076164
Kayanne, H. (2017). Validation of degree heating weeks as a coral bleaching index in the northwestern Pacific. Coral Reefs 36, 63–70. doi: 10.1007/s00338-016-1524-y
Lewis, S. C., and Mallela, J. (2018). A multifactor risk analysis of the record 2016 great barrier reef bleaching. Bull. Am. Meteorol. Soc. 99, S144–S149.
Liu, G., Strong, A. E., Skirving, W., and Arzayus, L. F. (2006). “Overview of NOAA coral reef watch program’s near-real time satellite global coral bleaching monitoring activities,” in Proceedings of the 10th International Coral Reef Symposium (Gurugram: Okinawa), 1783–1793.
Marba, N., and Duarte, C. M. (2010). Mediterranean warming triggers seagrass (Posidonia oceanica) shoot mortality. Glob. Chang. Biol. 16, 2366–2375. doi: 10.1111/j.1365-2486.2009.02130.x
Marshall, N., Adger, W. N., Benham, C., Brown, K., Curnock, M. I., Gurney, G. G., et al. (2019). Reef Grief: investigating the relationship between place meanings and place change on the Great Barrier Reef, Australia. Sustain. Sci. 14, 579–587. doi: 10.1007/s11625-019-00666-z
Menary, M. B., and Wood, R. A. (2018). An anatomy of the projected North Atlantic warming hole in CMIP5 models. Clim. Dyn. 50, 3063–3080. doi: 10.1007/s00382-017-3793-8
Mills, K. E., Pershing, A. J., Brown, C. J., Chen, Y., Chiang, F.-S., Holland, D. S., et al. (2012). Lessons from the 2012 ocean heat wave in the Northwest Atlantic. Oceanography 26, 60–64.
Mitchell, D., Heaviside, C., Vardoulakis, S., Huntingford, C., Masato, G., Guillod, B. P., et al. (2016). Attributing human mortality during extreme heat waves to anthropogenic climate change. Environ. Res. Lett. 11:74006.
Nairn, J., and Fawcett, R. (2015). The excess heat factor: a metric for heatwave intensity and its use in classifying heatwave severity. Int. J. Environ. Res. Public Health 12, 227–253. doi: 10.3390/ijerph120100227
Oliver, E. C. J. (2019). Mean warming not variability drives marine heatwave trends. Clim. Dyn. 53, 1653–1659. doi: 10.1007/s00382-019-04707-2
Oliver, E. C. J., Benthuysen, J. A., Bindoff, N. L., Hobday, A. J., Holbrook, N. J., Mundy, C. N., et al. (2017). The unprecedented 2015/16 Tasman Sea marine heatwave. Nat. Commun. 8:16101. doi: 10.1038/ncomms16101
Oliver, E. C. J., Donat, M. G., Burrows, M. T., Moore, P. J., Smale, D. A., Alexander, L. V., et al. (2018a). Longer and more frequent marine heatwaves over the past century. Nat. Commun. 9:1324. doi: 10.1038/s41467-018-03732-9
Oliver, E. C. J., Perkins-Kirkpatrick, S. E., Holbrook, N. J., and Bindoff, N. L. (2018b). Anthropogenic influences on record 2016 marine heatwaves. Bull. Am. Meteorol. Soc. 99, S44–S48.
Pearce, A. F., and Feng, M. (2013). The rise and fall of the “marine heat wave” off Western Australia during the summer of 2010/11. J. Mar. Syst. 111, 139–156. doi: 10.1016/j.jmarsys.2012.10.009
Perkins-Kirkpatrick, S., King, A., Cougnon, E., Grose, M., Oliver, E. C. J., Holbrook, N. J., et al. (2019). The role of natural variability and anthropogenic climate change in the 2017/18 Tasman Sea marine heatwave. Bull. Am. Meteorol. Soc. 100, S105–S110.
Pershing, A. J., Record, N. R., Franklin, B. S., Kennedy, B. T., McClenachan, L., Mills, K. E., et al. (2019). Challenges to natural and human communities from surprising ocean temperatures. Proc. Natl. Acad. Sci. U.S.A. 116, 18378–18383. doi: 10.1073/pnas.1901084116
Poumadere, M., Mays, C., Le Mer, S., and Blong, R. (2005). The 2003 heat wave in France: dangerous climate change here and now. Risk Anal. 25, 1483–1494. doi: 10.1111/j.1539-6924.2005.00694.x
Rahmstorf, S., Box, J. E., Feulner, G., Mann, M. E., Robinson, A., Rutherford, S., et al. (2015). Exceptional twentieth-century slowdown in Atlantic Ocean overturning circulation. Nat. Clim. Chang. 5, 475–480. doi: 10.1038/nclimate2554
Reynolds, R. W., Smith, T. M., Liu, C., Chelton, D. B., Casey, K. S., and Schlax, M. G. (2007). Daily high-resolution-blended analyses for sea surface temperature. J. Clim. 20, 5473–5496. doi: 10.1175/2007jcli1824.1
Rubio-Portillo, E., Izquierdo-Muñoz, A., Gago, J. F., Rosselló-Mora, R., Antón, J., and Ramos-Esplá, A. A. (2016). Effects of the 2015 heat wave on benthic invertebrates in the Tabarca Marine protected area (southeast Spain). Mar. Environ. Res. 122, 135–142. doi: 10.1016/j.marenvres.2016.10.004
Ruthrof, K. X., Breshears, D. D., Fontaine, J. B., Froend, R. H., Matusick, G., Kala, J., et al. (2018). Subcontinental heat wave triggers terrestrial and marine, multi-taxa responses. Sci. Rep. 8:13094. doi: 10.1038/s41598-018-31236-5
Saunders, D. A., Mawson, P., and Dawson, R. (2011). The impact of two extreme weather events and other causes of death on Carnaby’s Black Cockatoo: a promise of things to come for a threatened species? Pac. Conserv. Biol. 17, 141–148.
Serrao-Neumann, S., Davidson, J. L., Baldwin, C. L., Dedekorkut-Howes, A., Ellison, J. C., Holbrook, N. J., et al. (2016). Marine governance to avoid tipping points: can we adapt the adaptability envelope? Mar. Policy 65, 56–67. doi: 10.1016/j.marpol.2015.12.007
Smale, D. A., and Wernberg, T. (2009). Satellite-derived SST data as a proxy for water temperature in nearshore benthic ecology. Mar. Ecol. Prog. Ser. 387, 27–37. doi: 10.3354/meps08132
Smale, D. A., and Wernberg, T. (2013). Extreme climatic event drives range contraction of a habitat-forming species. Proc. R. Soc. B Biol. Sci. 280:20122829. doi: 10.1098/rspb.2012.2829
Smale, D. A., Wernberg, T., Oliver, E. C. J., Thomsen, M., Harvey, B. P., Straub, S. C., et al. (2019). Marine heatwaves threaten global biodiversity and the provision of ecosystem services. Nat. Clim. Chang. 9, 306–312. doi: 10.1038/s41558-019-0412-1
Smale, D. A., Wernberg, T., and Vanderklift, M. A. (2017). Regional-scale variability in the response of benthic macroinvertebrate assemblages to a marine heatwave. Mar. Ecol. Prog. Ser. 568, 17–30. doi: 10.3354/meps12080
Sparnocchia, S., Schiano, M. E., Picco, P., Bozzano, R., and Cappelletti, A. (2006). The anomalous warming of summer 2003 in the surface layer of the Central Ligurian Sea (Western Mediterranean). Ann. Geophys. 24, 443–452. doi: 10.5194/angeo-24-443-2006
Stobart, B., Mayfield, S., Mundy, C., Hobday, A. J., and Hartog, J. R. (2016). Comparison of in situ and satellite sea surface-temperature data from South Australia and Tasmania: how reliable are satellite data as a proxy for coastal temperatures in temperate southern Australia? Mar. Freshw. Res. 67, 612–625.
Stott, P. A., Allen, M., Christidis, N., Dole, R. M., Hoerling, M., Huntingford, C., et al. (2013). Attribution of Weather and Climate-Related Events in Climate Science for Serving Society (Berlin: Springer), 307–337.
Taylor, K. E., Stouffer, R. J., and Meehl, G. A. (2012). An overview of CMIP5 and the experiment design. Bull. Am. Meteorol. Soc. 93, 485–498. doi: 10.1175/bams-d-11-00094.1
Thomsen, M. S., Mondardini, L., Alestra, T., Gerrity, S., Tait, L., South, P., et al. (2019). Local extinction of bull kelp (Durvillaea spp.) due to a marine heatwave. Front. Mar. Sci. 6:84. doi: 10.3389/fmars.2019.00084
Thomson, J. A., Burkholder, D. A., Heithaus, M. R., Fourqurean, J. W., Fraser, M. W., Statton, J., et al. (2015). Extreme temperatures, foundation species, and abrupt ecosystem change: an example from an iconic seagrass ecosystem. Glob. Change Biol. 21, 1463–1474. doi: 10.1111/gcb.12694
Walsh, J. E., Thoman, R. L., Bhatt, U. S., Bieniek, P. A., Brettschneider, B., Brubaker, M., et al. (2018). The high latitude marine heat wave of 2016 and its impacts on Alaska. Bull. Am. Meteorol. Soc. 99, S39–S43.
Welbergen, J. A., Klose, S. M., Markus, N., and Eby, P. (2007). Climate change and the effects of temperature extremes on Australian flying-foxes. Proc. R. Soc. B Biol. Sci. 275, 419–425. doi: 10.1098/rspb.2007.1385
Wernberg, T., Bennett, S., Babcock, R. C., de Bettignies, T., Cure, K., Depczynski, M., et al. (2016). Climate-driven regime shift of a temperate marine ecosystem. Science 353, 169–172. doi: 10.1126/science.aad8745
Keywords: marine heatwave, climate change, extreme events, global climate models, ecosystems
Citation: Oliver ECJ, Burrows MT, Donat MG, Sen Gupta A, Alexander LV, Perkins-Kirkpatrick SE, Benthuysen JA, Hobday AJ, Holbrook NJ, Moore PJ, Thomsen MS, Wernberg T and Smale DA (2019) Projected Marine Heatwaves in the 21st Century and the Potential for Ecological Impact. Front. Mar. Sci. 6:734. doi: 10.3389/fmars.2019.00734
Received: 26 June 2019; Accepted: 11 November 2019;
Published: 04 December 2019.
Edited by:
Rui Rosa, University of Lisbon, PortugalReviewed by:
Marcos Tonelli, University of São Paulo, BrazilMichael Adam Alexander, Earth System Research Laboratory (NOAA), United States
Copyright © 2019 Oliver, Burrows, Donat, Sen Gupta, Alexander, Perkins-Kirkpatrick, Benthuysen, Hobday, Holbrook, Moore, Thomsen, Wernberg and Smale. This is an open-access article distributed under the terms of the Creative Commons Attribution License (CC BY). The use, distribution or reproduction in other forums is permitted, provided the original author(s) and the copyright owner(s) are credited and that the original publication in this journal is cited, in accordance with accepted academic practice. No use, distribution or reproduction is permitted which does not comply with these terms.
*Correspondence: Eric C. J. Oliver, ZXJpYy5vbGl2ZXJAZGFsLmNh