 Keith R. Hayes1*
 Geoffrey R. Hosack1
 Emma Lawrence2
 Paul Hedge3
 Neville S. Barrett3
 Rachel Przeslawski4
 M. Julian Caley5
 Scott D. Foster1
- 1CSIRO Data61, Hobart, TAS, Australia
- 2CSIRO Data61, Brisbane, QLD, Australia
- 3Institute for Marine and Antarctic Studies (IMAS), University of Tasmania, Hobart, TAS, Australia
- 4Geoscience Australia, Canberra, ACT, Australia
- 5ARC Centre of Excellence in Mathematical and Statistical Frontiers, Queensland University of Technology, Brisbane, QLD, Australia
The Evidence Based Decision Making (EBDM) paradigm encourages managers to base their decisions on the strongest available evidence, but it has been criticized for placing too much emphasis on the choice of study design method without considering the types of questions that are being addressed as well as other relevant factors such as how well a study is implemented. Here we review the objectives of Australia’s Marine Park network, and identify the types of questions and data analysis that would address these objectives. Critically, we consider how the design of a monitoring program influences our ability to adequately answer these questions, using the strength of evidence hierarchy from the EBDM paradigm to assess the adequacy of different design strategies and other sources of information. It is important for conservation managers to recognize that the types of questions monitoring programs are able to answer depends on how they are designed and how the collected data are analyzed. The socio-political process that dictates where protected areas are placed typically excludes the strongest types of evidence, Random Controlled Trials (RCTs), for certain questions. Evidence bases that are stronger than ones commonly employed to date, however, could be used to provide a causal inference, including for those questions where RCTs are excluded, but only if appropriate designs such as cohort or case-control studies are used, and supported where relevant by appropriate sample frames. Randomized, spatially balanced sampling, together with careful selection of control sites, and more extensive use of propensity scores and structured elicitation of expert judgment, are also practical ways to improve the evidence base for answering the questions that underlie marine park objectives and motivate long-term monitoring programs.
Introduction
Marine Protected Areas (MPAs) are sometimes located in areas with low resource value (Edgar et al., 2009; Joppa and Pfaff, 2009), and therefore criticized for having little impact on conservation outcomes (Pressey et al., 2015). Attempts to quantify the effect of MPAs and MPA networks, however, are usually hampered by a lack of well-designed monitoring studies (Guidetti, 2002; Sciberras et al., 2013). For example, our understanding of the biodiversity values that the 3.3 million km2 Australian Marine Park (AMP) network protects are only just emerging as the first baseline surveys are completed (Hill et al., 2014; Huang et al., 2014; Lawrence et al., 2015; Przeslawski et al., 2015). Low resource value ecosystems are thought to be over-represented in the AMP, and it may therefore fail to protect biodiverse and vulnerable habitats (Barr and Possingham, 2013; Devillers et al., 2014) but the impact of its exclusion zones on these values is still largely unknown.
Here we review the AMP network’s objectives, and identify the types of questions that these objectives seek to answer. As an aid to the development of a future long-term monitoring program for the network, we examine how survey design influences the quality of information that an MPA monitoring program provides. Our analysis is motivated by the Australian government activating new management plans for Australia’s 44 marine parks in 2017, and the shift in emphasis within the relevant government agencies from drafting these plans to implementing them. The conclusions and recommendations within this analysis, however, have broader application and are relevant to monitoring designs for environmental resources more generally.
Our analysis draws on the basic tenets of the Evidence Based Decision Making (EBDM) paradigm. We chose this paradigm because scientists have criticized the lazy conception that underlie many monitoring programs (Nichols and Williams, 2006), whilst lamenting the predominance of conservation decisions made on the basis of experience and “common sense” (Sutherland et al., 2004), calling instead for an “evidence revolution” analogous to that which occurred in medicine in the 1970s (Pullin and Knight, 2001; Pullin et al., 2004; Fisher et al., 2013). Practical guidance on how to implement this revolution is slowly emerging (see Segan et al., 2011; Pressey et al., 2017; Addison et al., 2018), and conservation scientists have started to adopt EBDM principles when designing protected area monitoring programs (Ferraro and Hanauer, 2014; Ahmadia et al., 2015), but these examples are still rare (Kemp et al., 2012).
We approach our analysis from two perspectives. In section “Objectives, Questions and Data Analysis” we briefly review the AMP network’s objectives and identify three different types of questions that, if we could answer adequately, would determine whether or not the objectives were being met. We approach the problem of defining “adequate” in section “Evidence Hierarchies” by considering the EBDM paradigm’s notion of an evidence hierarchy, and the different types of evidence within this hierarchy. In section “Implementing the EBDM Paradigm” we define an adequate survey design by examining how these two perspectives intersect. Our aim here is to identify the design characteristics of a MPA monitoring program (and associated data analysis) that make it fit for purpose – i.e., generate data that are adequate for answering the questions that motivated the program in the first place. Our analysis focuses on the design of MPA monitoring programs, and the extent to which this influences the quality of data generated by the program.
We note that survey design is only one of several inter-related issues that decision makers must contemplate when evaluating the effectiveness of their management strategies and adapting these to observed outcomes. Nonetheless, two important pre-conditions of any adaptive management regime are: (i) making management objectives explicit, by identifying the types of questions these objectives seek answers to; and, (ii) designing monitoring programs in a way that adequately informs management, by adequately answering these questions (Williams et al., 2007). The objective of this paper is to provide practical guidance on how to meet these pre-conditions.
Objectives, Questions and Data Analysis
The management plans for the AMP network seek to: (i) protect and conserve biodiversity and other natural, cultural and heritage values within marine parks; and (ii) provide for ecologically sustainable use and enjoyment of the natural resources within the network, where this is consistent with the first objective (see for example1). One way to operationalize these objectives is to identify a set of key questions, which if answered adequately, will inform managers where, when and why they are, or are not, meeting them.
There are three types of questions that may be used to operationalize these objectives (Table 1). The first type we label “Knowledge development.” These questions seek to develop a better understanding of the values and pressures that are present within an MPA network. This type of question might, for example, motivate a baseline survey to establish if a valued species was present at the sample locations, and if so, how abundant it was in the park. This type of question can be answered by the summary statistics of a sample – via a descriptive data analysis – and by using the sample to estimate the abundance or distribution of the population from which the sample was drawn via an inferential data analysis (Leek and Peng, 2015).
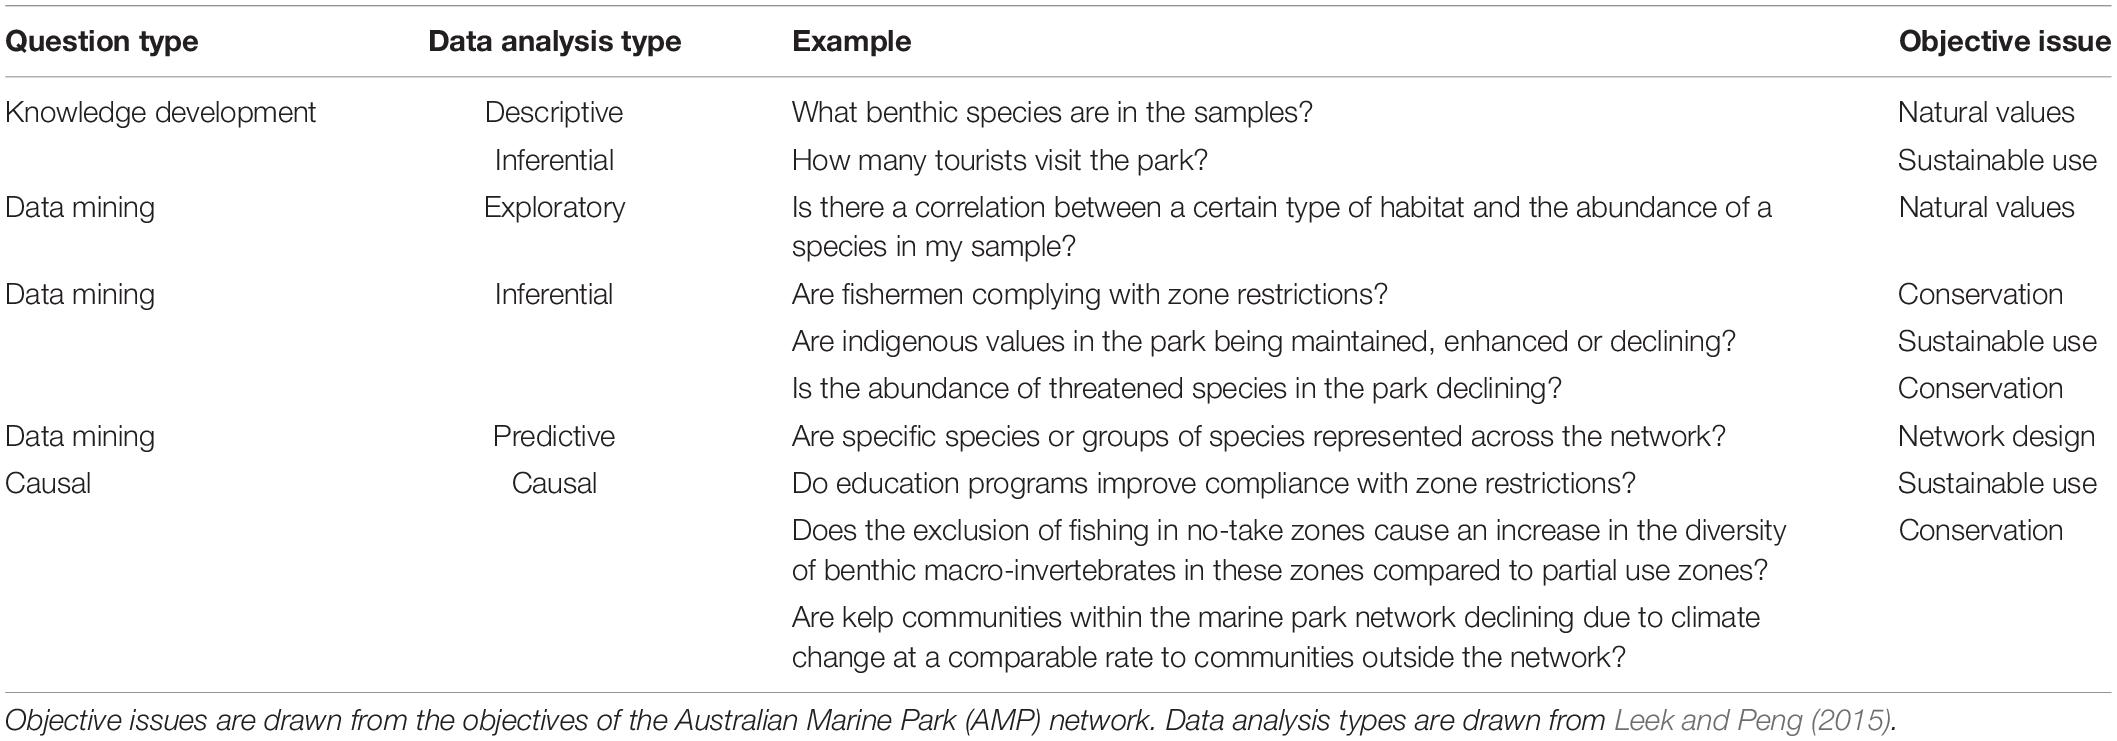
Table 1. Examples of the types of questions, objectives issue and associated data analysis type, that managers might ask of an individual MPA or of a MPA network.
The second type labeled “Data mining,” seek to generate ideas or suggest phenomena that may occur within an MPA by identifying trends or relationships either within the sample data – via an exploratory data analysis – or more generally (and more usefully) for the population from which the sample was drawn – via an inferential data analysis (Leek and Peng, 2015). These types of questions are correlative in that the pattern is discovered within a particular survey, but the reasons for the correlation and the existence of the correlation outside the current data are both unknown. An example of this type of question might be: “Is there a relationship between the average abundance of demersal fish in the MPA and the amount or type of reef habitat?,” or “Is the abundance of demersal fish in the reserve increasing with time?”
We label the third type of questions as “Causal.” These types of question are the most important to management agencies, particularly those seeking to implement adaptive management strategies. They focus on what is causing the relationships or trends observed in a sample or inferred in a population, and in this context often address questions about how management actions influence the direction and magnitude of change of a valued resource. Answering this type of question requires a causal data analysis (Leek and Peng, 2015) to evaluate or test the hypothesized causal effects of proposed management actions.
Guidance on how to clearly specify a causal question is available from several sources. Collaboration for Environmental Evidence (2013), for example, recommend that these questions include four key PICO elements: a target (P)opulation, the (I)ntervention, the (C)omparator, and a measurable (O)utcome. To continue the demersal fish theme, an example might be: “Does a ban on demersal trawls (I) cause the biomass (O) of demersal reef-fish within the MPA (P) to increase, compared to similar reefs outside the MPA (C)?”
We also include in this third category questions about the adequacy of models used by managers to support their decision making. For example, a manager may wish to know how accurately a Species Distribution Model (that quantifies the relationship between habitat variables and demersal fish abundance) predicts the abundance of demersal fish at sites within the reserve that have yet to be sampled (Fulton et al., 2015; Young and Carr, 2015).
Evidence Hierarchies
The EBDM paradigm ranks the quality of scientific evidence using a hierarchy that was originally formulated in the late 1970’s (Canadian Task Force on the Periodic Health Examination, 1979). The hierarchy is based largely on how a study is designed, but it may also be moderated according to how well a study is conducted. It has been reformulated within a medical context (see for example: Hadorn et al., 1996; Davies and Nutley, 1999; Pullin and Knight, 2001; OCEBM Levels of Evidence Working Group, 2011), and epidemiological context (Wilson et al., 2015) resulting in various slightly different forms. Despite being reformulated across these two different domains (medical and epidemiological), the structure of the hierarchies have remained broadly equivalent. The one exception surrounds the strength of evidence provided by non-randomized controlled trials (Figure 1).
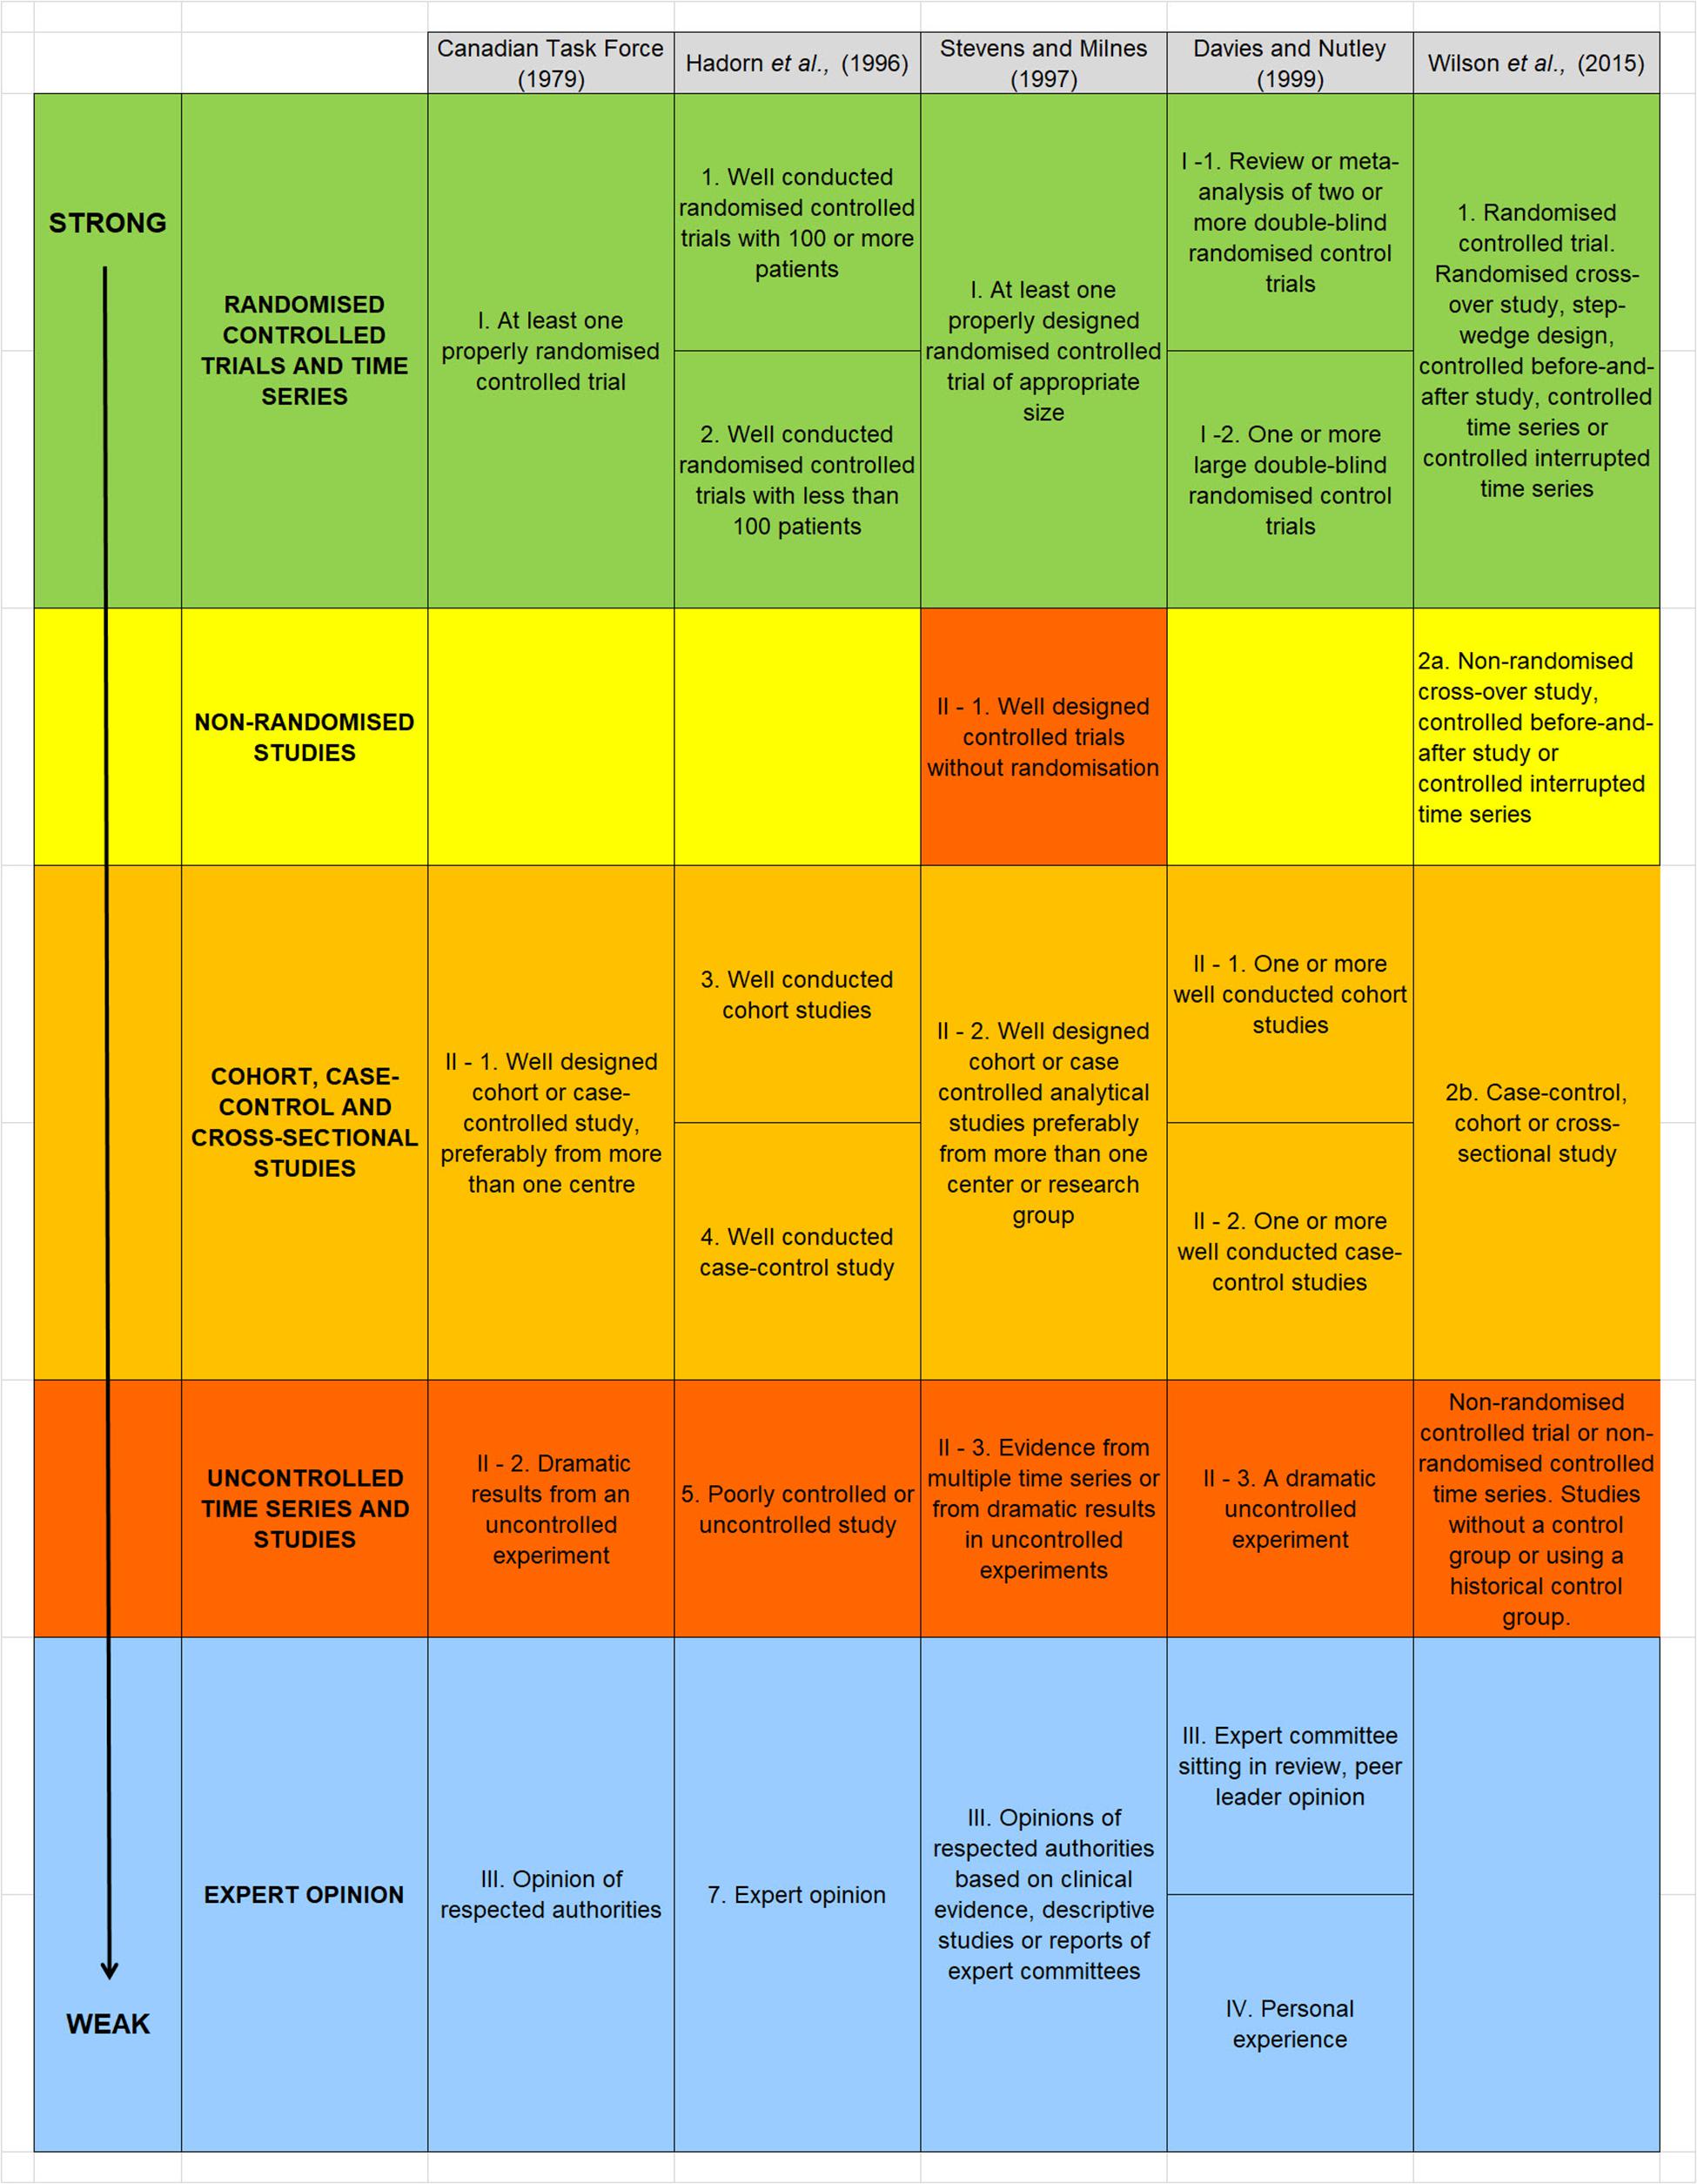
Figure 1. Summary of five hierarchies of evidence drawn from the medical, health care and epidemiological literature. Text and enumeration are taken from the original references. Stevens and Milne (1997) is reproduced from Pullin and Knight (2001). With the exception of non-randomized controlled trials, the structure of each of the five hierarchies is remarkably equivalent allowing studies to be allocated to one of five broadly equivalent groups, ranked from highest (top) to weakest (bottom). We have added a color scheme to help emphasize this similarity and also identify one outlier: Stevens and Milne (1997) rank well designed controlled trials without randomization relatively high, whereas Wilson et al. (2015) rank this type of study design as providing a much weaker type of evidence.
Expert Judgment
Some authors find it confusing to include expert judgment as a separate evidence category because such expertise is necessarily incorporated into the interpretation or synthesis of different types of evidence (Guyatt et al., 2008; Dicks et al., 2014a). Nevertheless, expert judgment is presented as a separate category in almost all hierarchies, and in environmental domains it is sometimes the only source of data. In the absence of any empirical observations, environmental managers must resort to an individual’s or group’s judgments, intuition or ideology when formulating policies and deciding between competing strategies.
In terrestrial settings expert judgment is the most prevalent source of information used to justify environmental management actions (Pullin et al., 2004; Sutherland et al., 2004), and in coastal MPAs it is the most common way to assess the effectiveness of management actions (Addison et al., 2017). It is also used to determine MPA boundaries and networks (Van Haastrecht and Toonen, 2011), although here it is increasingly being supported by systematic analysis of relevant data sets (Airamé et al., 2003; Watts et al., 2009).
Expert judgment also plays a central role in purposive (judgmental) sample designs – where samples sites are chosen by a manager or researcher for a particular value – and convenience sample designs – where sample sites are chosen because they are easy or cheap to access (McDonald, 2012). MPA monitoring designs are often dictated by ease of accessibility or a researcher’s desire to target particular sites, and this can cause sample sites to cluster around particular parts of a reserve (Willis et al., 2003). This approach limits the analyst’s ability to generalize the information gained from the sample to a population of interest – i.e., to move from a descriptive to an inferential analysis of the data.
Expert judgment is ranked as the weakest type of evidence because it is subject to various forms of bias, including confirmation and motivation bias, and heuristics that humans use to simplify complex situations and thereby enable quick decisions (Tversky and Kahneman, 1974; Kahneman, 2011). Under certain circumstances these heuristics are useful, but they can also lead to predictable, systematic errors, for example, being over-confident about the effectiveness of a reserve based on a small number of observed outcomes. Furthermore, experts may be unaware of these heuristics when providing their opinion (Kruger and Dunning, 1999). Consequently, the facilitator should follow best practices for diminishing the influence of cognitive biases as much as possible when eliciting subjective beliefs from an expert (O’Hagan et al., 2006). Moreover, it should be remembered that expert opinion is often required in complex situations where relevant empirical data are sparse or absent. In an EBDM framework, the expert opinion should improve over time as the evidence base develops to fill these gaps in empirical data.
Uncontrolled Time Series and Studies
Management interventions that restrict anthropogenic activity within an MPA, for example prohibiting all or some types of commercial fishing activity, represent a “treatment” in statistical parlance. Other forms of treatment in this context could include implementing a new educational or pest control program, changing a compliance regime or rehabilitating a damaged habitat. Typically a treatment aims to change what is thought to be a causal factor and thereby improve environmental outcomes in the reserve. In this context a simple uncontrolled study would be to observe some metric (e.g., biomass of demersal fish), but only from within an area where a treatment has been applied (e.g., where demersal trawling had been banned). Uncontrolled studies, however, can take other recognized forms, such as an uncontrolled before-and-after study, an uncontrolled time series study and an uncontrolled interrupted time series (Figure 2).
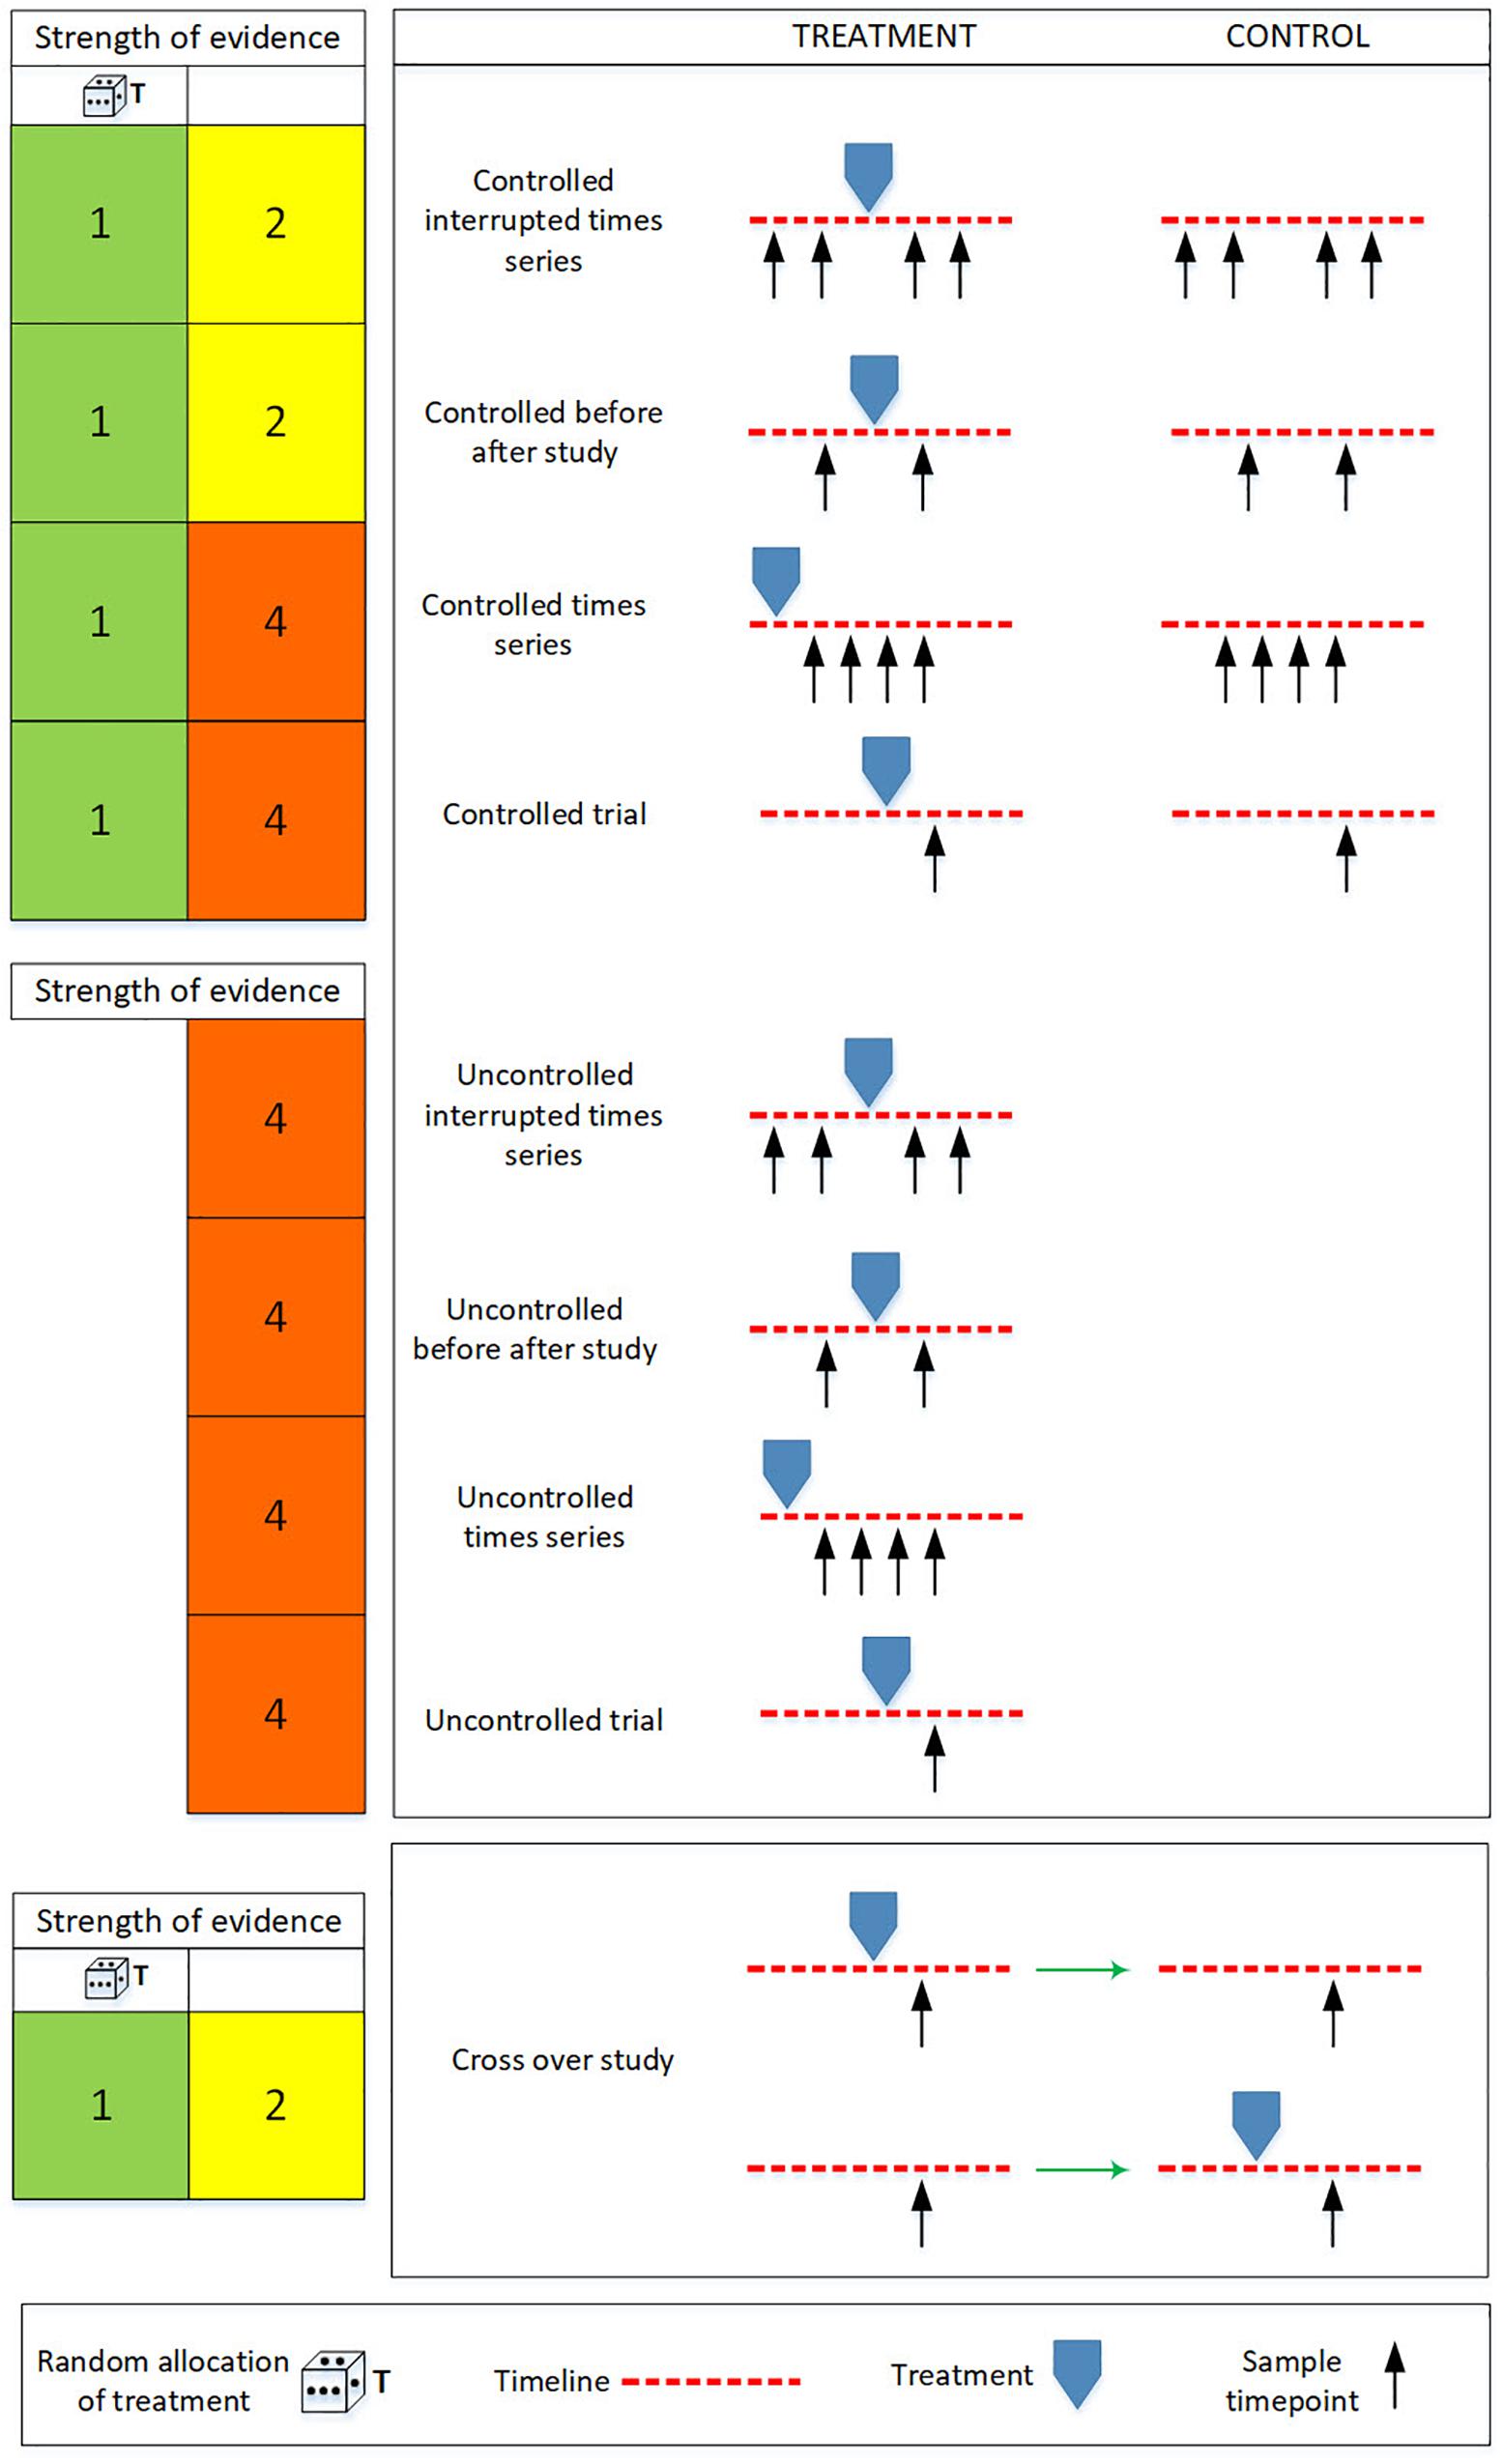
Figure 2. Schematic illustration of the evidence hierarchy for randomized controlled trials, non-randomized controlled trials and cross over studies. The die represents randomization at the level of treatment. The strength of evidence is always stronger with treatment randomization (first column on the left) than without it (second column on the left). The colors in the columns to the left reflect the evidence hierarchies presented in Figure 1. The strength of evidence is ranked from highest (1) to lowest (5). The “treatment” in this context could be the designation of a new MPA, a change in zonation status, or the implementation of new education or compliance regime (Table 1). The figure is adapted from Wilson et al. (2015) who adapted Walshe et al. (2013).
Most hierarchies rank uncontrolled time series and studies as relatively poor sources of evidence (Figure 1) because they do not compare outcomes in a group exposed to a treatment to the outcomes in a control group that do not receive the treatment. Without this type of comparison, it is impossible to declare the treatment as the causative factor because the outcome may simply have occurred by chance, or for reasons that are unrelated to the treatment.
Uncontrolled observations can provide an adequate evidence base if the questions posed by MPA managers can be answered by the summary statistics of a sample or by the trends and relationships observed within the sample – i.e., if the questions are of the knowledge development or data mining types, and the data are analyzed with a descriptive or exploratory analysis (Table 1). The questions raised by MPA managers, however, are often of the causal type, requiring a causal data analysis – i.e., they often wish to know about the effects of management within a zone, reserve or reserve-network (Vanhatalo et al., 2017). The data provided by uncontrolled studies are usually inadequate for this type of analysis.
Inferential and predictive types of analysis are most easily applied to data from uncontrolled observations if the sample is representative of the population of interest. The objective of obtaining a representative sample is usually achieved through some form of randomized design from a clearly defined sampling frame. Randomized designs, however, are only evident in about 12% of ecological field studies, either through neglect, logistical constraints or because sample locations (preferential or judgmental sampling) are targeted for specific reasons (Smith et al., 2017).
If the analyst applies an inferential or predictive data analysis to non-randomized samples, then they should try to account (through some form of covariate model) for the bias that occurs if there is a relationship between how sample sites are selected and the variable(s) that are measured at those sites (Diggle et al., 2010; Conn et al., 2017). For example, preferentially sampling sites with a high biomass of demersal fish, or restricting samples to particular habitats because of the limitations imposed by available sampling gears, will create bias that should be accounted for in the analysis.
Cohort, Case-Control and Cross-Sectional Studies
Studies that observe the effect of a treatment without playing any role in how the treatment is assigned to sample units are known as “observational studies” and come in three recognized forms: (i) cross-sectional study, (ii) cohort study; and, (iii) case-control study (Figure 3). A cross-sectional study takes a sample at one point in time from a well-defined population, for example rocky reefs in the mesophotic zone (30–90 m depth), and infers a treatment effect by comparing outcomes between sites with and without the treatment.
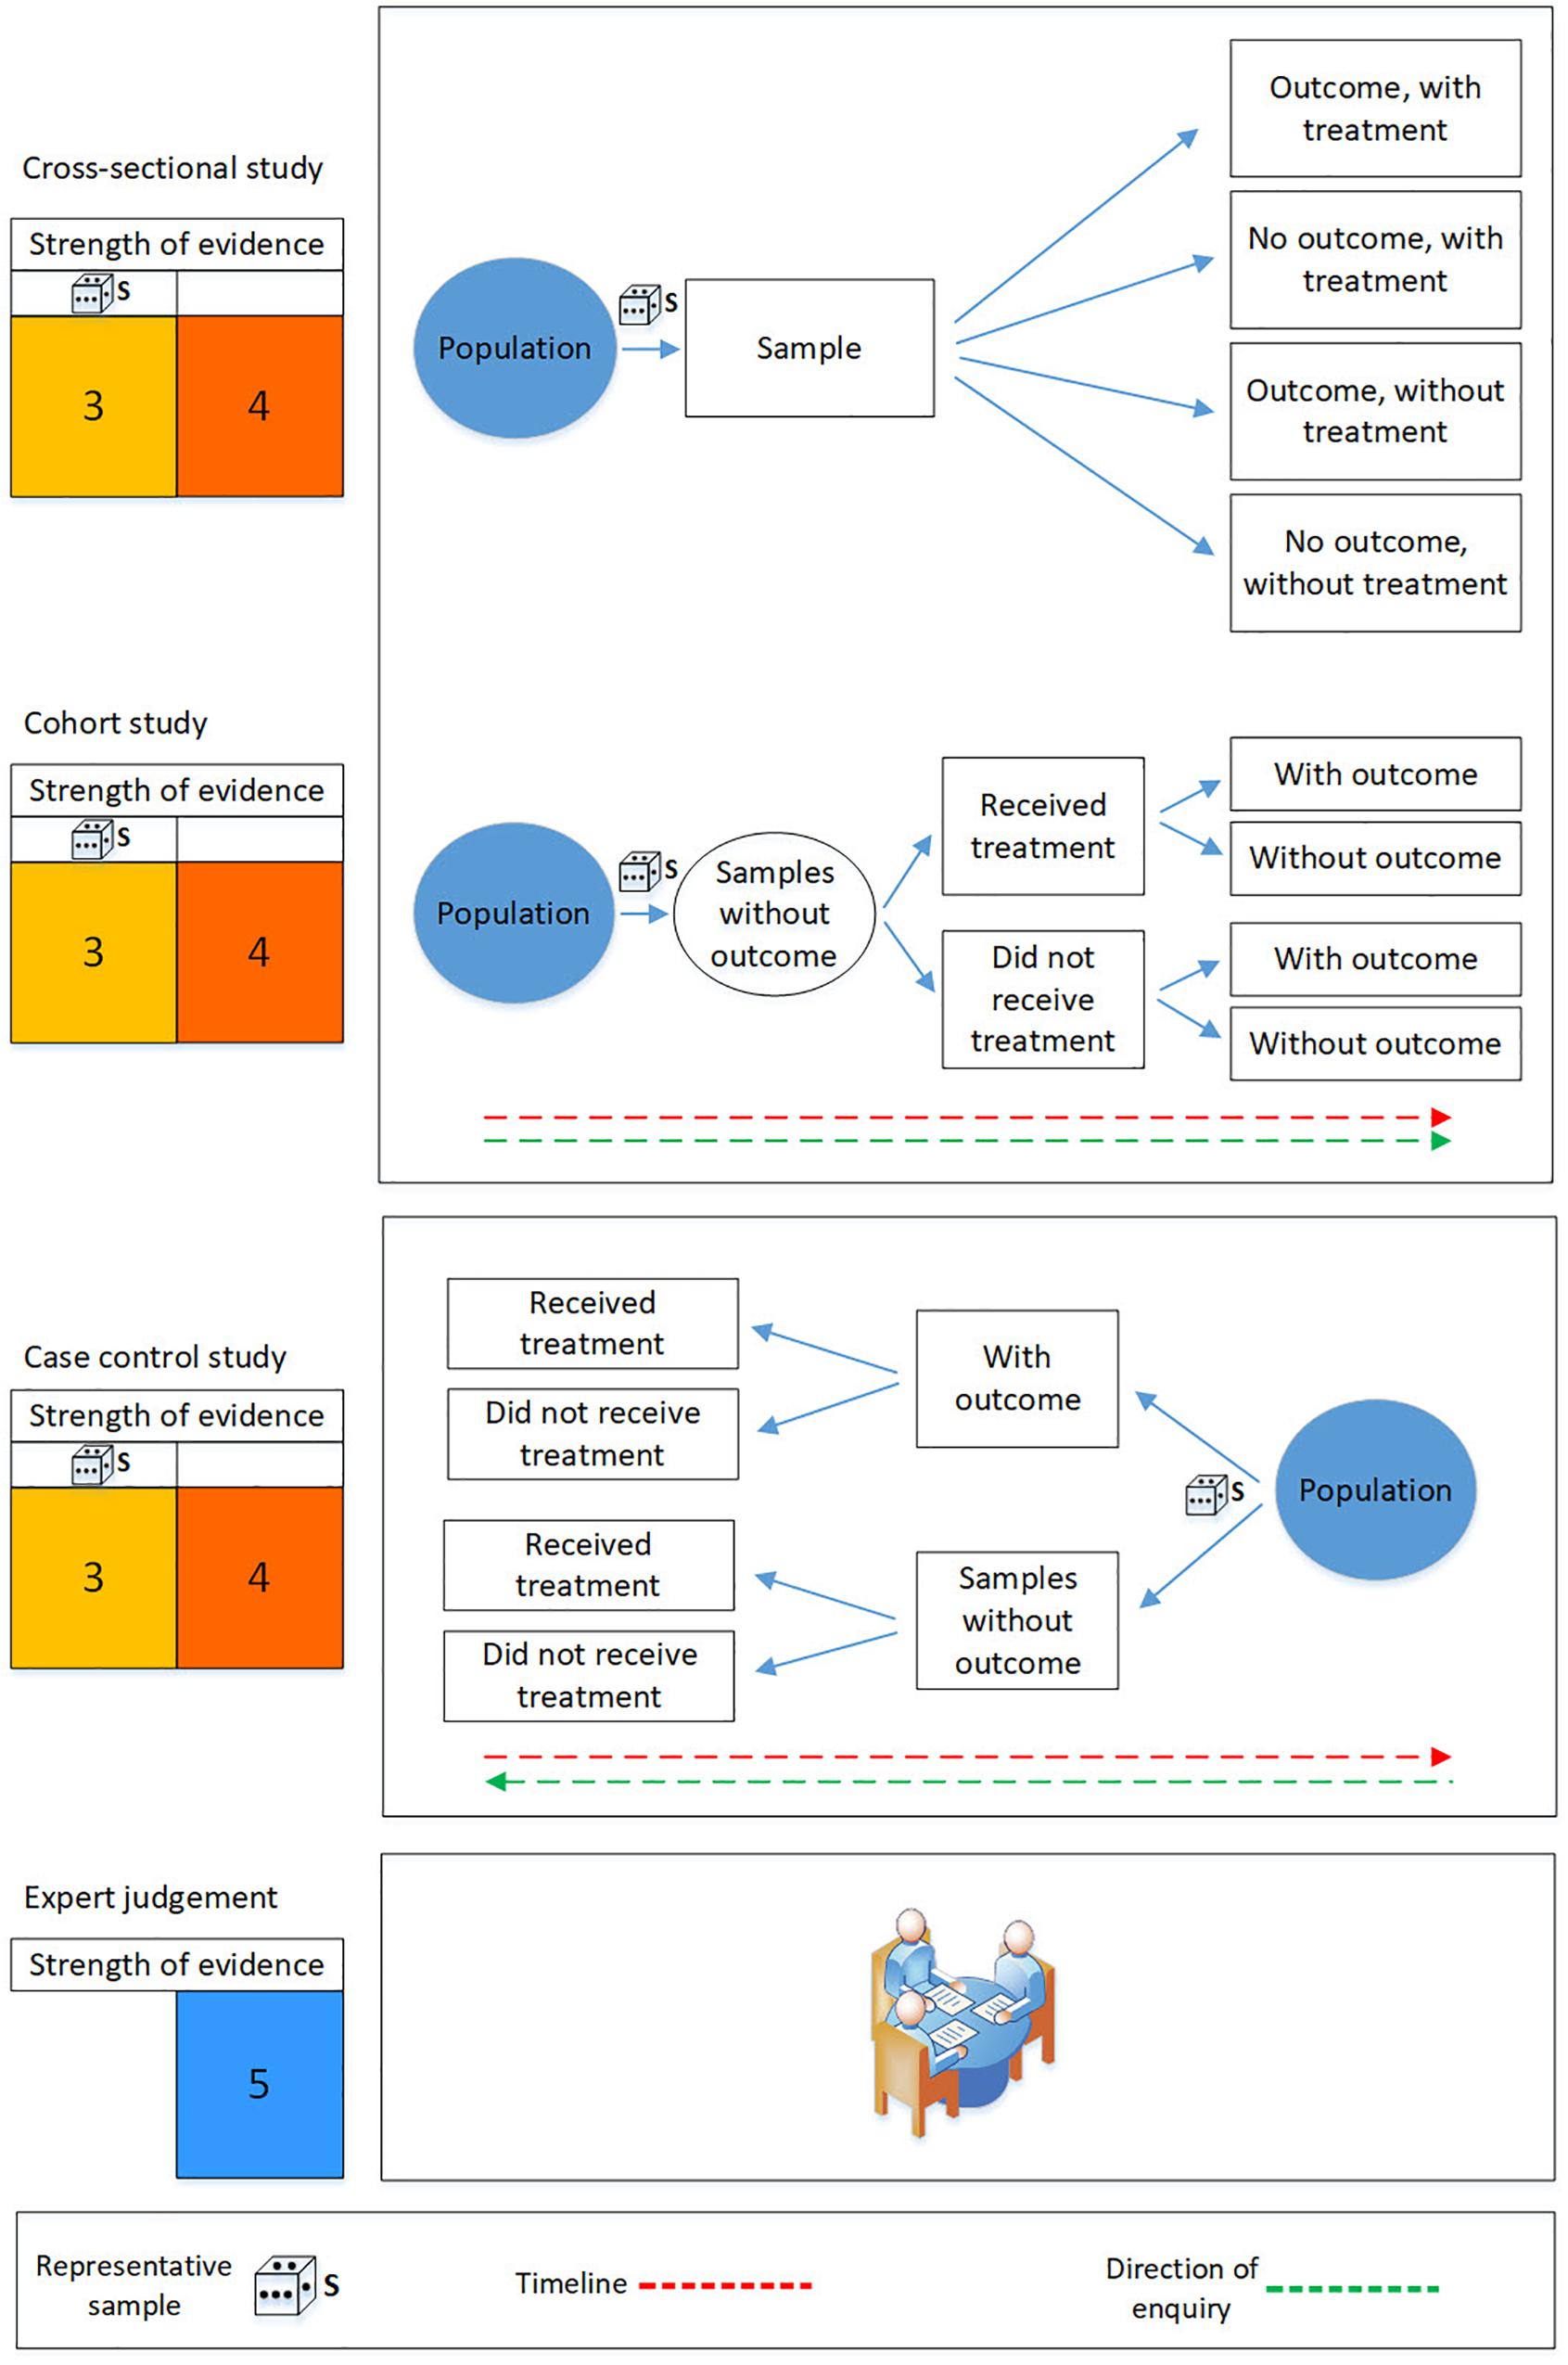
Figure 3. Schematic illustration of the evidence hierarchy for observational studies and expert judgment. The die represents selection of a representative sample by, for example, a randomized sampling scheme. The strength of evidence is diminished if the sample is not representative of the target population (second column on the left). The colors in the columns to the left reflect the evidence hierarchies presented in Figure 1. The strength of evidence is ranked from highest (1) to lowest (5). This figure is adapted from Wilson et al. (2015).
Cohort and case-control studies aim to establish an association between exposure to a treatment and an outcome, but are distinguished by the way in which sample units are included within the study. In a cohort study, two or more study groups are selected according to exposure to a treatment of interest and outcomes within the groups are then studied through time (Grimes and Schulz, 2002; Schulz and Grimes, 2002). In a case-control study the researcher allocates sample units to one of two comparison groups according to outcomes – i.e., according to whether they do (the cases) or do not (the control) exhibit an outcome of interest (Figure 3).
In the context of an MPA monitoring strategy, a cohort study might be designed by identifying a random sample of rocky reefs on the continental shelf, and then grouping them according to different levels of protection, for example by the types of demersal fishing gear that are excluded. All reefs within the cohort are monitored and, after a pre-specified time, biodiversity outcomes such as the biomass of demersal fish are compared across the groups.
In a case-control study reefs that exhibit an adverse outcome, for example demersal fish biomass below a specified level, and those that do not, would be selected by the researcher, who would then quantify the amount of treatment each reef had received. Another analogous case-control example would be to score sample sites based on the presence or absence of a particular species, and then estimate a treatment effect on the occurrence of the species.
The quality of information provided by case-control and cohort studies depends on how sample units within treatment and control groups are selected. This is because the treatment effect depends not only on the treatment but also on confounding and non-confounding variables (Figure 4). For example, motivational bias often occurs in the socio-political processes that determines the location and size of a reserve, the types of habitat within it or amount of fishing effort in the area before the reserve is declared; all of these factors confound treatment effects (Edgar et al., 2004; Mora and Sale, 2011; Ferraro and Hanauer, 2014; Dawid, 2015).
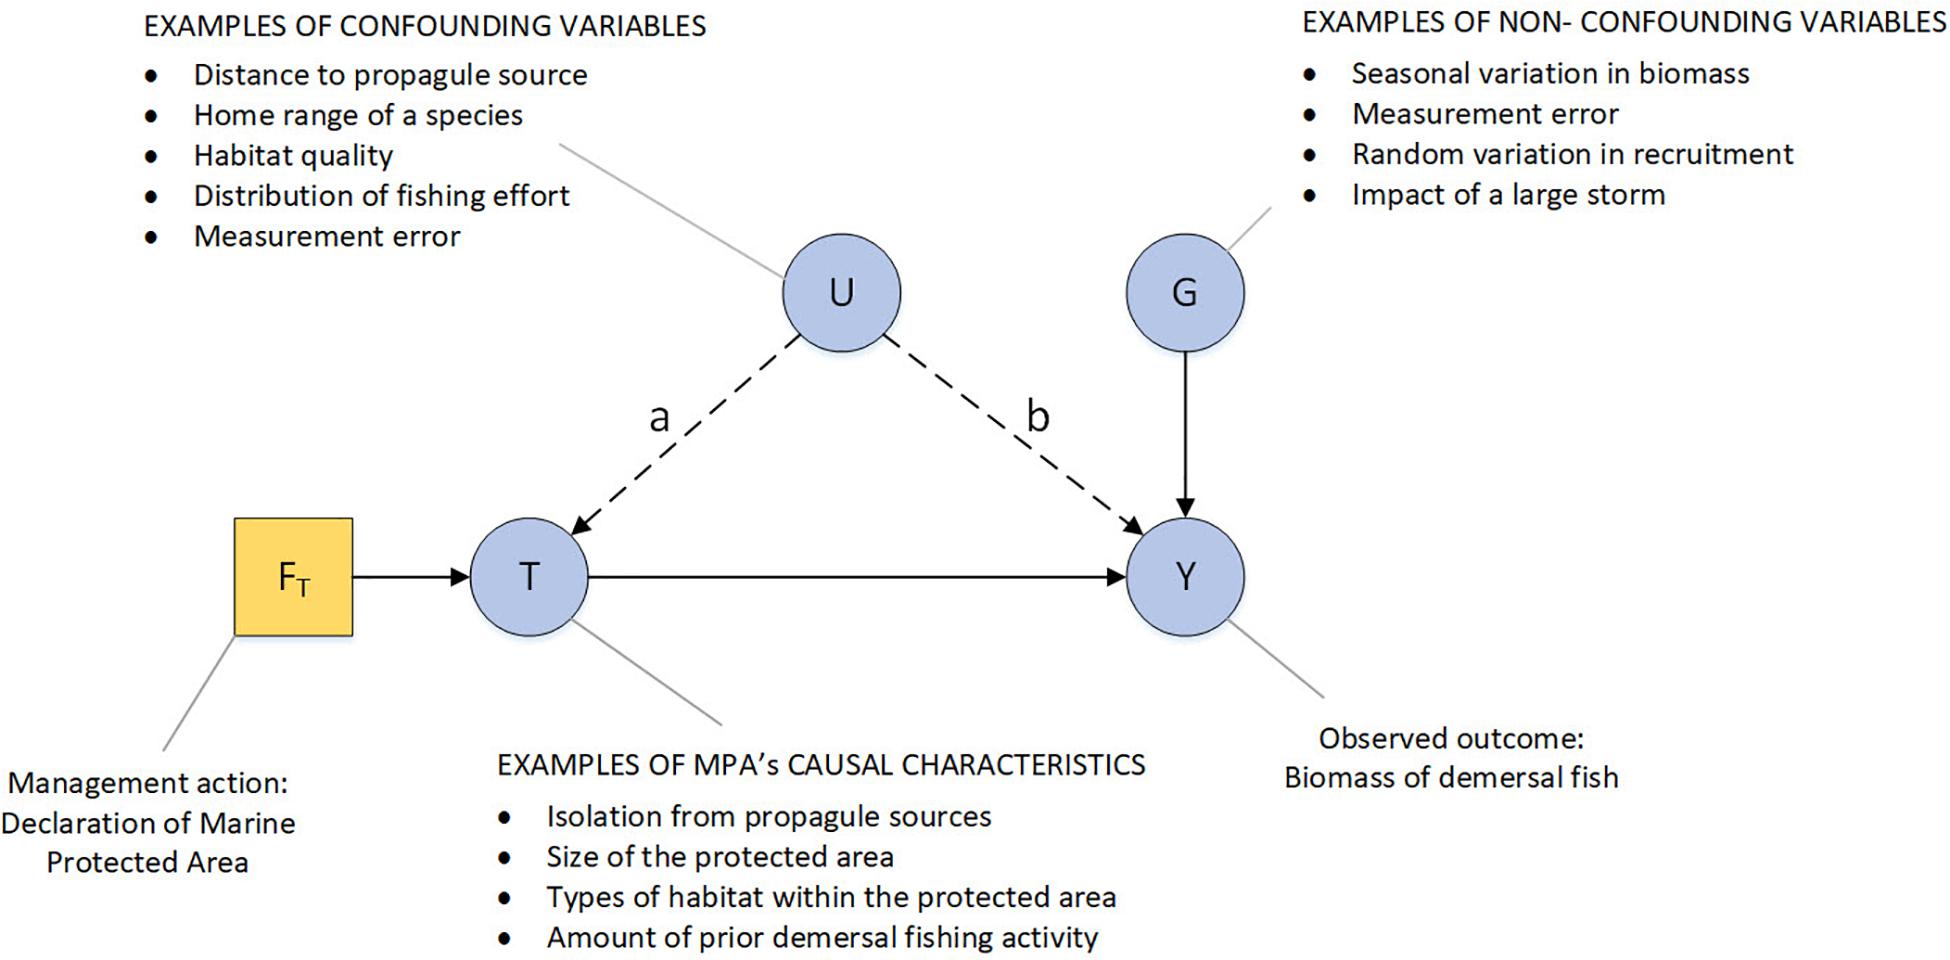
Figure 4. Directed acyclic graph highlighting the effects of confounding variables on the observed effect of declaring a MPA. Single-headed arrows represent causal links. Stochastic nodes (variables) are represented by filled circles, deterministic nodes by filled squares. The node FT is the deterministic management action of declaring a no-take MPA. The resulting MPA (node T) is defined by characteristics (such as fishing effort, meta-population effects) that determine the probability of observed outcomes such as the biomass of demersal fish (node Y). A confounding variable is anything that affects both the probability of treatment (the link marked “a”) and the outcomes that the treatment is designed to alter (the link marked “b”). The effect of treatment T on outcome Y could be confounded by U if (for example) the management action is more likely to declare small MPAs, in a region isolated from propagules sources, with relatively poor habitat or in regions that have different levels of localized fishing effort inside versus outside of the proposed MPA boundaries. Monitoring programs that do not control for these variables could over- or under-estimate the effect of management. Non-confounding variables (node G), such as long term climatic shifts, are things that influence the treatment outcomes but do not influence the probability of treatment. They cause conditions inside and outside reserve boundaries to vary independently of the reserve treatment and thereby tend to reduce the power of statistical tests to detect a reserve effect. Measurement error is typically considered to be a non-confounding variable, but it can act as a confounding variable if it interacts with the treatment effect. For example, fish in a no-take zone of an MPA may be less disturbed by SCUBA observers and so more likely to be counted when compared to (spear)fished individuals outside the no-take zone.
Randomized Controlled Trials and Time Series
Controlled studies come in several forms, including controlled before and after study, controlled time series, controlled interrupted times series and cross-over studies. The best evidence base is achieved, however, when sample units are randomly allocated to control and treatment groups (Figure 2). All of the hierarchies reviewed acknowledge that the results of a properly planned and implemented Randomized Controlled Trial (RCT) is the most powerful form of scientific evidence for an individual study.
The random allocation of sample units to treatments has two important effects: (i) it will (on average) minimize the probability of treatment being correlated with the presence/absence or value of a confounding variable (Hurlbert, 1984; Deaton and Cartwright, 2018) – i.e., it helps to sever the link marked “a” in Figure 4, forcing the confounding variables U into the class of non-confounding variables G (Eberhardt and Thomas, 1991); (ii) as sample size increases, the probability that the treatment and control groups have similar properties (covariate values) before treatment increases (Rosenbaum, 2002).
If the process of assigning sites to control and impact groups within a Before-After-Control-Impact (BACI) (Stewart-Oaten et al., 1986), or in the various “beyond-BACI” designs described by Underwood (1992), could be randomized then these studies would qualify as a randomized, controlled, interrupted time series (Figure 2) and would provide the best possible design for estimating the effects of some types of MPA-relevant treatments, such as the exclusion of fishing effort. If randomization is not available, and the representativeness of the sample cannot be adequately defended, then the evidence-base of the study is adversely affected and the study may not provide the desired basis for certain types of data analysis.
The consultative process between industry, government and other stakeholders that determines the boundaries of marine reserves, and the different activities permitted in the different zones2 within those boundaries, almost always excludes the possibility of randomly allocating treatments and controls. This is a feature of a recognized trade-off between the internal and external validity of RCTs, where internal validity refers to the ability of a study to attribute difference in outcomes to the treatment, and external validity refers to the generalizability of the study (Rothwell, 2005; Nutley et al., 2013; Mupepele et al., 2015). The lack of randomized allocation of treatment precludes the consideration of the MPA’s zones within an RCT study and thus limits the generality of such studies to the “real world” of MPA implementation. Other MPA-relevant treatments, however, such as the implementation of an education program (Table 1) are more amenable to randomization.
Davies and Nutley (1999) distinguish reviews or meta-analysis of two or more trials from individual trials, and the pre-eminence of systematic reviews have since been emphasized (Mupepele et al., 2015) and formulated into an overall framework for making environmental decisions (Dicks et al., 2014b). Guidance on how to conduct systematic reviews exist for environmental evidence (Collaboration for Environmental Evidence, 2013), but we are not aware of any calculus for comparing the strength of a systematic review of many individually low strength sources of evidence with an individual study of much higher strength. So, whilst a meta-analysis or systematic review of many RCT’s is unequivocally the best source of evidence, so long as all the individual studies are equally well conducted, the status of systematic reviews of other sources of evidence is less clear unless there are no other competing, higher strength, sources.
Non-randomized Controlled Trials and Time Series
If treatment randomization is not possible, it may nevertheless still be deliberative, and if treatment and control allocation is well designed then non-randomized before-after studies and interrupted time series rank highly in the evidence hierarchy (Figure 1). Non-randomized BACI designs, for example, offer several theoretical advantages to assessing the effects of MPA treatments (Fraschetti et al., 2002; Beliaeff and Pelletier, 2011). These types of studies are rarely applied to MPAs (Willis et al., 2003; Kemp et al., 2012) because monitoring typically only occurs after MPAs are designated, which excludes the possibility of obtaining the “before” samples. Opportunities to apply this type of design can occur, however, if there is a delay between MPA declaration and enforcement (Barrett et al., 2007), or if a MPA network is enlarged, re-zoned or only partially exposed to a disturbance (Emslie et al., 2015).
All types of cross-over studies (randomized and non-randomized, Figure 2), on the other hand, are impractical because they require a deliberate, experimental re-zoning. We are unaware of any examples of this type of design in an MPA context. The response time following a switch in zone status may also be too long in marine ecosystems for this to be useful.
Non-randomized controlled trials and time series go by various other names, including “Single- or Multiple-time” designs (Wiens and Parker, 1995), “After Control Impact (ACI)” or “post-impact” studies (Glasby, 1997). These types of studies are more common but also more controversial. Stevens and Milne (1997) rank these types of studies highly but Wilson et al. (2015) recommends they should not be used in epidemiological contexts because in the absence of pre-treatment data there is no way to test for selection bias; that is test for systematic differences between control and treatment groups (prior to treatment) that might influence treatment outcomes. A similar form of selection bias can also occur if non-representative samples are used in observational studies and for this reason we consider designs with these characteristics to be of an equivalent evidential standard (Figures 2, 3).
Implementing the Ebdm Paradigm
The EBDM paradigm has been criticized for placing too much emphasis on study design and RCTs, undervaluing the evidence provided by large-scale observational studies, and ignoring other factors that moderate the strength of evidence, such as how well a given design is implemented, consistency across studies and hypothesis plausibility (Nutley et al., 2013; Mupepele et al., 2015). This criticism is relevant to marine environmental sciences because randomization, control and replication can be harder to achieve than in medical trials or epidemiological field studies. Focus has subsequently shifted to frameworks that more closely tie the survey design and data analysis to the types of questions that are being addressed, whilst also accounting for how well a study is conducted. Here we follow this focus and offer some recommendations to help ensure monitoring strategies are implemented in ways that will generate data that is adequate for answering the various types of questions that are relevant to MPA managers. Throughout this section we draw upon our experiences with monitoring activities in AMPs to highlight examples of good practice and identify opportunities for future improvements.
Seek Opportunities for a Best Practise Design
Randomization might be possible for some types of MPA-relevant treatments, but not others. Where it is possible any of the RCTs highlighted in Figure 2 will provide good sources of data if implemented carefully. If researchers or managers are able to influence the choice of MPA-relevant treatments, but cannot randomize them, then non-randomized, controlled, interrupted time series designs are best practice.
If, as is the case for most of the AMP network, monitoring begins only after an MPA is declared then randomized controlled, before-after studies and interrupted time series will not be not attainable for some types of MPA-relevant treatments, but their non-randomized, uninterrupted counterparts may still be. These designs have an equivalent standard to uncontrolled before after studies and uncontrolled interrupted time series, but they are of a lower evidential standard than cross-sectional studies, cohort studies or case-control studies with representative samples (compare Figures 2, 3). These types of design and data analysis, however, appear to be rare in marine ecology (but see for example Hall et al., 2006) and to date have not been used in Australia’s marine parks. This review suggests a better evidence base is available through greater use of these approaches.
One practical impediment to all types of controlled studies, cross-sectional studies, cohort studies or case-control studies based on representative samples is well defined sample frames from which to randomly select representative samples, but this situation is changing. Australian researchers, for example, recently collated all the existing Australian continental shelf mapping data together with documentation of reef spatial data products (Lucieer et al., 2016). This synthesis has helped to provide a shelf-reef sampling frame, enabling researchers to identify random reef sites and thereby provide the basis for a well-designed controlled, cross-sectional study or case-control study. Fine-scale multi-beam sonar mapping, for example, successfully mapped an isolated reef in the Tasman Fracture no-take zone, that was randomly sampled along with equivalent control sites outside the no-take zone to quantify the effect of the no-take zone on the abundance of rock lobster (Monk et al., 2016).
Choose Adequate Design/Analysis Combinations
A descriptive or exploratory data analysis can be applied to observations gathered with any type of survey design, assuming samples are collected with reasonable care (Figure 5). As the manager’s interest extends to questions about the population from which the sample was drawn, and the data analysis becomes inferential, predictive or causal, it is important that the sample is representative of the population of interest (Figure 2). Study designs that take random samples from a well defined population frame will meet this requirement, and thereby provide an adequate basis for design-based or model-based inference (see Gregoire, 1998). With model-based inference it is possible to obtain better (more precise) unbiased estimates of population parameters with judgmental (purposive) sample designs (Särndal et al., 1978). This remains, however, a risky proposition as it presumes a realistic statistical model that may or may not have the necessary information available (e.g., environmental variables).
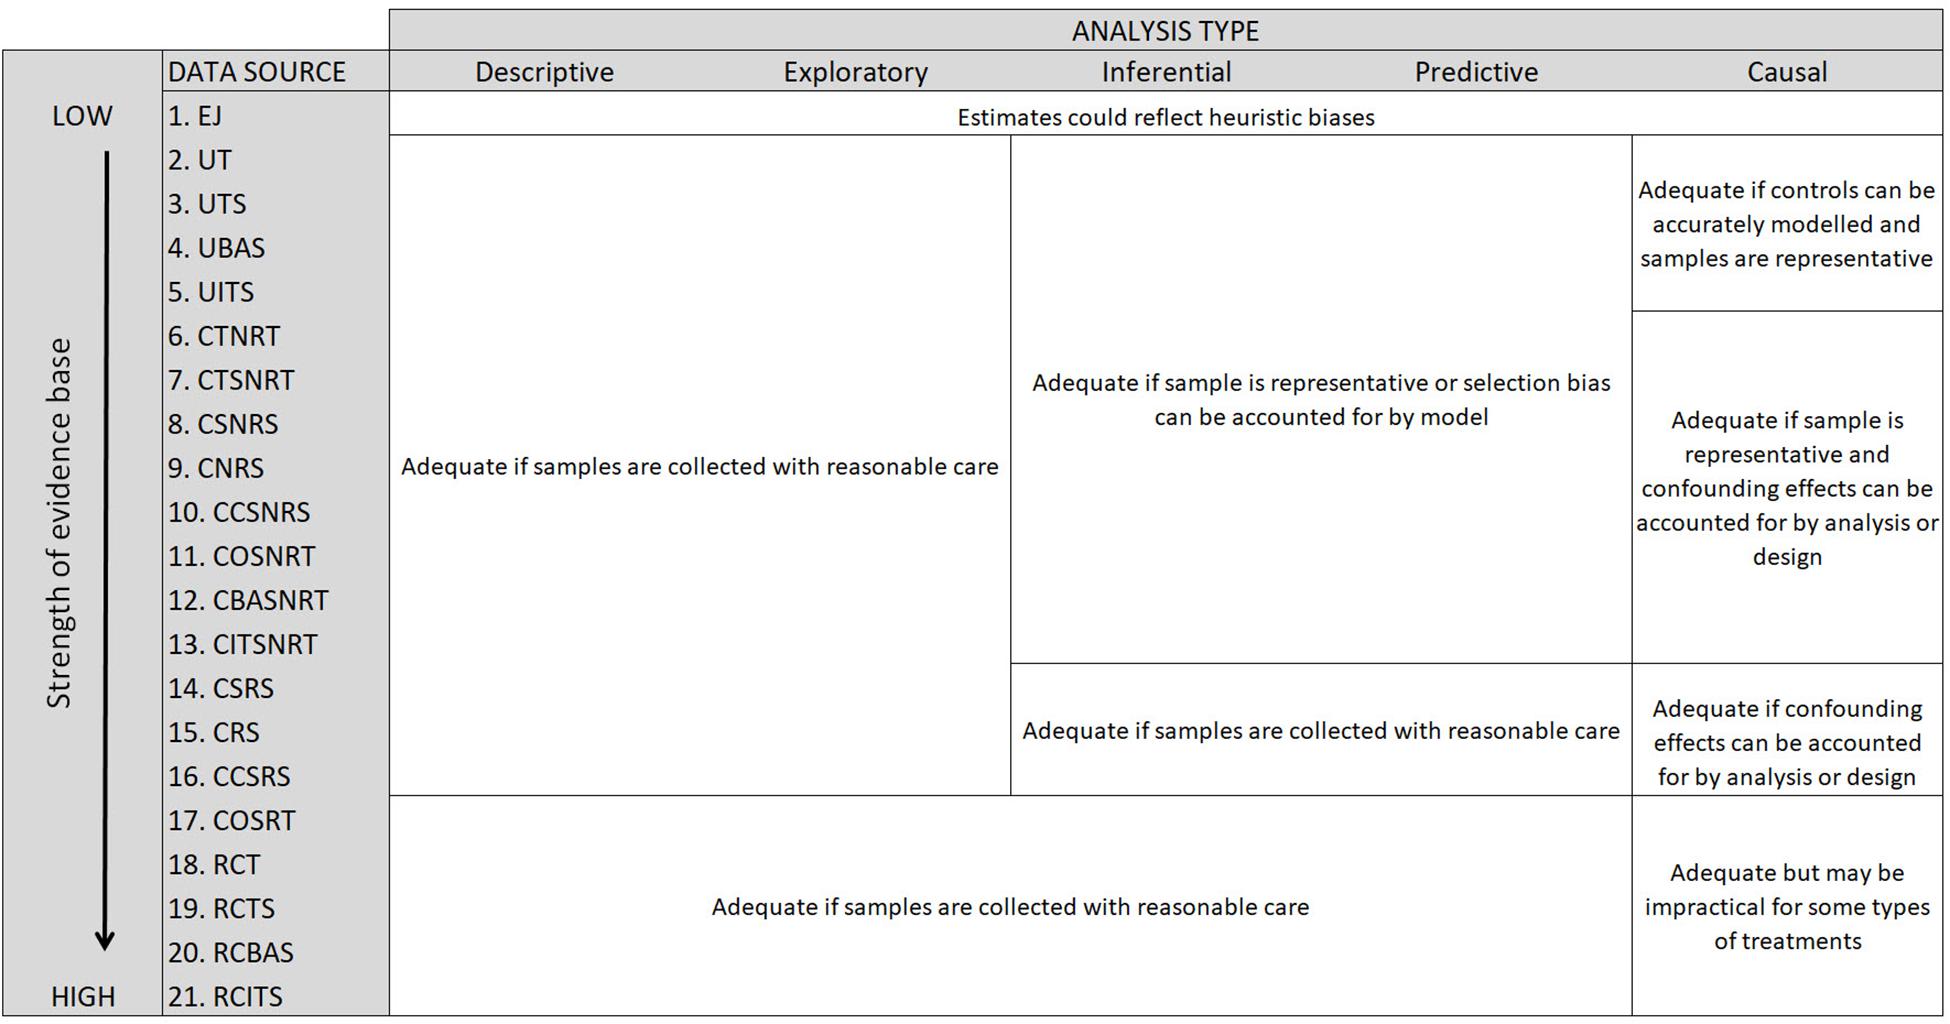
Figure 5. Summary of the adequacy of the evidence base, and associated key issues, when considering the types of questions that marine reserve managers might try to answer with data obtained from different levels of the evidence hierarchy. Study design codes are as follows: (1) Expert judgment (EJ), (2) Uncontrolled trial (UT), (3) Uncontrolled time series (UTS), (4) Uncontrolled before after study (UBAS), (5) Uncontrolled interrupted time series (UITS), (6) Controlled trial with non-randomized treatment (CTNRT), (7) Controlled time series with non-randomised treatment (CTNRT), (8) Cross sectional analysis with non-representative sample (CSNRS), (9) Cohort study with non-randomised sample (CNRS), (10) Case control study with non-representative sample (CCSNRS), (11) Cross over study with non-randomised treatment (COSNRT), (12) Controlled before after study with non-randomised treatment (CBASNRT), (13) Controlled interrupted time series with non-randomised treatment (CITSNRT), (14) Cross sectional analysis with representative sample (CSRS), (15) Cohort study with representative sample (CRS), (16) Case control study with representative sample (CCSRS), (17) Cross over study with randomised treatment (COSRT), (18) Randomised controlled trial (RCT), (19) Randomised controlled time series (RCTS), (20) Randomised controlled before-after study (RCBAS), and (21) Randomised controlled interrupted time series (RCITS).
We recommend that, wherever possible, the process of choosing sample sites within control and treatment sites be randomized. Random sample selection is the accepted standard for obtaining a representative sample in most scientific disciplines. Random selection also helps to future-proof the data, enabling them to be used in later inferential, predictive or causal data analysis [as defined by Leek and Peng (2015)]. For example, observations within an MPA will still serve as an adequate (but perhaps not optimal) basis for an inferential analysis as understanding improves and models change. It is important to recognize that the benefits of randomization accrue on average, meaning that any single random sample may not be representative of the target population, and in particular may not reflect the many factors that influence a population. The probability of this outcome, however, diminishes as the sample size increases, and the likelihood of capturing influencing factors within the sample can be improved by taking randomized, spatially balanced, samples (Olsen et al., 2012; Grafström and Lundström, 2013).
The precision of population-level estimates can also be improved if samples are spatially balanced, and we therefore encourage the use of spatially balanced designs, noting that there are several software packages that will assist in this process (e.g., Foster et al., 2019b). Randomization is sometimes criticized as being inefficient, where for example sites are randomly selected from inaccessible locations or habitats not utilized by the study organism(s). It should be noted, however, that randomization can occur within a sample frame restricted to accessible locations or relevant habitats, or perhaps more usefully the probability of including a site may vary by habitat, distance to previously sampled locations or other covariates (Foster et al., 2017). In this way, the sets of locations that are likely to contribute more uncertainty to the population estimates are more likely to be sampled (e.g., Thompson, 2012). We also note that designs can be constructed for continuous transects (Foster et al., 2019a) and for clustered point-in-space observations (Lawrence et al., 2016).
Spatially balanced designs were first employed in the AMP network during the baseline surveys for the Flinders (Lawrence et al., 2015) and Geographe Bay (Lawrence et al., 2016) marine parks. Some researchers were initially skeptical about the practicality of conducting spatially balanced surveys in these areas, but this design was a significant factor in the subsequent discovery of new (sponge gardens) and much more extensive (seagrass) habitats, respectively. Spatially balanced designs have since been used in baseline surveys of the Tasman Fracture AMP (Monk et al., 2016), the Hunter and the Beagle AMPs, a recent survey of the Ningaloo AMP’s IUCN II and IUCN IV zones, and in a survey of the seamounts south of Tasmania (including the Huon and Tasman Fracture AMPs). As a set the surveys highlight the flexibility of spatially balanced designs for continuous transects and point-in-space observations over a range of spatial scales.
Control for Confounding Variables
Descriptive, exploratory, inferential and predictive types of analysis are relatively easy to conduct compared to a causal analysis (Figure 5). Typically, however, managers want to test the hypothesis that their interventions have been effective (Table 1), and this requires a causal data analysis. This type of analysis raises additional challenges – samples must not only be representative of the target population, but in all other practical options, the analysis must either control for confounding variables through the survey design, or by analysis, and in the case of uncontrolled studies model the outcomes (known as the “counter-factual outcomes”) that would have occurred in the absence of the MPA treatment (Figure 5).
There are a number of different ways to control for the potential effects of confounding variables with these types of observational studies. Within ecological domains, however, the main approaches are manually matching (also known as “pairing”), matching or weighting sites using propensity scores and the use of a statistical model (Stuart, 2010; Ferraro and Hanauer, 2014).
Using a statistical model to describe the outcomes that would have occurred in the absence of an MPA treatment is a relatively common technique. For example, to estimate the effect of MPAs on fish metrics, Edgar et al. (2014) compared observed outcomes within MPAs to predicted values at the same locations using a statistical model of the relationship between these metrics and covariates developed from observations of the metrics in fished locations outside MPAs. These models where used to predict the counter-factual situation that would have occurred within the MPAs had they been fished. A more direct analysis, with fewer assumptions, would compare the values of these metrics within treated (MPA) and carefully selected control (non-MPA) sites, as exemplified by Strain et al. (2019), who selected sites within 10 kms of MPAs boundaries as control sites in their global analysis.
Australia’s long-term MPA monitoring programs typically control for confounding variables by manually selecting control and treatment sites with similar background characteristics. Closed (to fishing) and open reef pairs in the Great Barrier Reef Long Term Monitoring Program, for example, were manually matched by reef size, distance from shore, wave exposure and underwater topography (Emslie et al., 2015). Similarly, Edgar and Barrett (1999)’s control sites were manually matched on the basis of wave exposure and macrolagal community type.
Manual matching is a simple way to control confounding variables but it has a number of limitations. If control and treatment sites are deliberately chosen to be similar, for example, both have high wave exposure, then the effect of wave exposure on the outcome of interest cannot be investigated because it will not vary in the sample data. This can be overcome by matching sites with covariate attributes, for example, choosing control and treatment sites that have high, medium and low wave exposure. It becomes increasingly difficult to do this, however, as the number of potentially confounding variables increases. The sample sizes necessary to match all combinations of covariate attributes may become prohibitive, or suitable sites may simply be unavailable. Moreover it is difficult for a researcher to prove that all confounding variables have been properly accounted for in this process. The researcher’s decision process may also be called into question as perhaps influenced by unintended or unconscious biases realized in the site selection process.
Propensity score analysis overcomes some of these limitations by using regression to collapse the problem of multi-dimensional comparisons into a single number – the propensity score, which is subsequently used to guide the calculation of the treatment effect (Rosenbaum and Donald, 1983; Stuart, 2010; Ramsey et al., 2019). The method aims to balance the values of potentially confounding variables between control and treatment sites, and is gaining traction in terrestrial and marine settings (Andam et al., 2008; Ahmadia et al., 2015) but it is still relatively under-utilized in ecology compared to other domains, and as far as we are aware has not been used to quantify the effects of management in any of Australia’s marine parks.
A propensity score is the probability of treatment given (potentially confounding) covariates. For a simple binary treatment, such as inside or outside an MPA, it is calculated using logistic regression, with the treatment status of a site set as the response variable and the potential confounders the explanatory variables. Propensity score methods require that all potentially confounding covariates (variables marked U in Figure 4) are identified and measured in the treatment and control sites. Some variants of the method are wasteful in that only a subset of control sites (those with propensity scores similar to treatment sites) are subsequently used to calculate the effect size. Other variants, however, use the propensity score to weight control sites in these calculations according to how similar they are to treated sites (Ramsey et al., 2019). In both cases, the effect size is typically calculated using a regression model that conditions on the explanatory variables because the covariates contain information that may be particularly important for prediction (e.g., Gelman et al., 2013, Chap. 8).
A potential challenge in this context is the lack of appropriate control sites (Willis et al., 2003), perhaps because the MPA designation process and/or a lack of habitat information, eliminates or restricts the extent of suitable controls. For example, the absence of mapped reef below 120 m outside the Tasman Fracture marine park was a complicating factor when estimating protection-related differences between control and references sites (Monk et al., 2016). Furthermore, neither manual matching or propensity score methods can guarantee that all confounding variables have been properly accounted for. A treatment effect may also be difficult to detect if the management treatment displaces little or no activity, or is intermittent, as in the case of migratory pelagic fish that are only occasionally exposed to MPA protection, or in the case of poorly enforced restrictions on anthropogenic activity. In any event, if control sites are not carefully selected, systematic differences with the treatment sites will likely serve as a source of contention (Hughes et al., 2016).
Formally Elicit Expert Judgment
All of the evidence hierarchies reviewed here (Figure 1) place expert judgment at the bottom of the hierarchy without reservation. Some hierarchies suggest that group (committee) judgments are better than individual ones but none distinguish between the types of experts involved, or make any allowance for the depth of an expert’s experience. To some extent this is consistent with widely agreed theories of judgment under uncertainty that suggest groups make better judgments than individuals, experts make better predictions than laypeople (but only within their domain), and that an expert’s ability to make accurate predictions does not improve with experience unless he or she receives accurate, timely feedback (Burgman, 2005; Hogarth, 2005).
Nonetheless, the evidence hierarchies are silent on several relevant issues such as the use of Traditional Ecological Knowledge (TEK), and the importance of expert judgment when resources are constrained, for example in least developed countries where the designation of MPAs lags behind that of nations with advanced economies (Marinesque et al., 2012).
Many of the disadvantages of expert knowledge can be ameliorated, through formal elicitation (O’Hagan et al., 2006; Speirs-Bridge et al., 2010; Martin et al., 2012; Hemming et al., 2017). Elicitation can help advise (for example) the design of data collection strategies (Chaloner and Verdinelli, 1995) or provide estimates of abundance and trends with associated uncertainty (Fisher et al., 2012; Adams-Hosking et al., 2016). Moreover, expert opinion can be used to construct statistical models to support inferential, predictive and causal data analysis (Bedrick et al., 1996; Denham and Mengersen, 2007; James et al., 2010; Hosack et al., 2017).
We recommend that wherever possible expert judgments are elicited in ways that seek to expose uncertainty, control bias, and ultimately enable learning by comparison to empirical observations (Kadane, 2011). Elicitation methods may need to be amended to include culturally appropriate language and approaches when eliciting TEK, depending on the types of questions and judgments involved (e.g., Robinson et al., 2016).
Integration of TEK in Australian natural resource management has accelerated during the last decade by formally involving Indigenous Australians in environmental management processes (Bohensky et al., 2013). Notable examples in the AMP network include collaborations between The Australian Institute of Marine Science and the Bardi Jawi people of the Southern Kimberley region of northwest Australia where participatory mapping was used to document spatial ecological knowledge of Bardi Jawi Sea Country (Depczynski et al., 2019). Similar participatory methodologies are currently being applied in Australia’s north and south-west marine parks.
Clearly Specify an Ambitious Question
Modern interpretations of the EBDM paradigm assume that managers are able to clearly define the questions that they seek answers to. Good survey design is fundamental to a strong evidence base, but good survey design begins with a clearly defined hypothesis. To operationalize the paradigm it is therefore essential that environmental managers clearly define their objectives, articulate the questions that they seek answers to, and understand the type of analysis necessary to answer questions that they pose.
It is important to note that the data analysis types described by Leek and Peng (2015) are nested. This means that if data are collected in a way that is adequate for a causal analysis, then they will be adequate for all of the preceding types of analysis. Hence if managers demand designs that produce data that is sufficient to answer a (more ambitious) hypothesis testing type of question, then this data will automatically be sufficient for the simpler types of question. The implications of this clear: if the ecological theory and management context are adequate for identifying ambitious questions that require a causal analysis then we should immediately proceed to these types of questions. There is no need to delay asking these tougher questions while gathering data to answer simpler ones.
By using the EBDM paradigm to consider how question type (and associated data analysis) intersects with monitoring program design, it becomes clear that not all data are created equal, and in particular how some types of questions cannot be adequately answered unless data are collected in a particular fashion. In the context of MPAs, practical design approaches to the hardest types of questions are available by combining techniques such as spatially balanced sampling with regression-based calculations that incorporate propensity score weights. It is our opinion that the amount of rigor and evidence gained from adopting these designs and methods will outweigh the extra effort need when performing the surveys and associated analysis.
A significant challenge in this context is the continued shift in the distribution and phenology of marine species due to climate change (Poloczanska et al., 2013), set against a background of static marine park boundaries (Hobday, 2011). Answering ambitious causal questions about, for example, the effects of management activities that target pressures such as fishing or shipping, will need to disentangle the potentially complex interactions between these activities and climate induced changes to the values within MPAs. This will require temporally and spatially extensive observations both inside and outside MPA boundaries (Teck et al., 2017).
In Australia, the federal government is currently finalizing a Monitoring, Evaluation, Reporting and Improvement (MERI) framework for the AMP network, which is designed to answer 15 questions about the values within the AMP and the effectiveness of management, including ambitious questions that require a causal data analysis. We hope that this review will help AMP managers, and MPA managers more generally, meet the pre-conditions of adaptive management by: (i) identifying the types of questions and data analysis that are needed to make their objectives explicit; and (ii) judging the limitations of different monitoring designs based on the strength of the subsequent evidence base, and thereby choose a design that best meets their objectives and constraints.
Author Contributions
KH conceived and planned the manuscript. All authors contributed to the manuscript.
Funding
This work was supported by the Marine Biodiversity Hub, a collaborative partnership supported through funding from the Australian Government’s National Environmental Science Program (NESP). NESP Marine Biodiversity Hub partners include the Institute for Marine and Antarctic Studies, University of Tasmania; CSIRO, Geoscience Australia, Australian Institute of Marine Science, Museum Victoria, Charles Darwin University, and the University of Western Australia.
Conflict of Interest
The authors declare that the research was conducted in the absence of any commercial or financial relationships that could be construed as a potential conflict of interest.
Footnotes
- ^ https://parksaustralia.gov.au/marine/pub/plans/temperate-east-management-plan-2018.pdf
- ^ https://www.iucn.org/theme/marine-and-polar/our-work/marine-protected-areas
References
Adams-Hosking, C., McBride, M. F., Baxter, G., Burgman, M. A., Villiers, D., Kavanagh, R., et al. (2016). Use of expert knowledge to elicit population trends for the Koala (Phascolarctos Cinereus). Divers. Distrib. 22, 249–262. doi: 10.1111/ddi.12400
Addison, P. F., Collins, D. J., Trebilco, R., Howe, S., Bax, N. J., Hedge, P., et al. (2018). A new wave of marine evidence-based management: emerging challenges and solutions to transform monitoring, evaluating, and reporting. ICES J. Mar. Sci. 75, 941–952. doi: 10.1093/icesjms/fsx216
Addison, P. F., Flander, L. B., and Cook, C. N. (2017). Towards quantitative condition assessment of biodiversity outcomes: insights from australian marine protected areas. J. Environ. Manag. 198, 183–191. doi: 10.1016/j.jenvman.2017.04.054
Ahmadia, G. N., Glew, L., Provost, M., Gill, D., Hidayat, N. I., Mangubhai, S., et al. (2015). Integrating impact evaluation in the design and implementation of monitoring marine protected areas. Philos. Trans. R. Soc. Lond. B Biol. Sci. 370:1681. doi: 10.1098/rstb.2014.0275
Airamé, S., Dugan, J. E., Lafferty, K. D., Leslie, H., McArdle, D. A., Warner, R. R., et al. (2003). Applying ecological criteria to marine reserve design: a case study from the California Channel Islands. Ecol. Appl. 13, 170–184. doi: 10.1890/1051-0761(2003)013
Andam, K. S., Ferraro, P. J., Pfaff, A., Sanchez-Azofeifa, G. A., and Robalino, J. A. (2008). Measuring the effectiveness of protected area networks in reducing deforestation. Proc. Natl. Acad. Sci. U.S.A. 105, 16089–16094. doi: 10.1073/pnas.0800437105
Barr, L. M., and Possingham, H. P. (2013). Are outcomes matching policy commitments in australian marine conservation planning? Mar. Policy 42, 39–48. doi: 10.1016/j.marpol.2013.01.012
Barrett, N. S., Edgar, G. J., Buxton, C. D., and Haddon, M. (2007). Changes in fish assemblages following 10 years of protection in tasmanian marine protected areas. J. Exp. Mar. Biol. Ecol. 345, 141–157. doi: 10.1016/j.jembe.2007.02.007
Bedrick, E. J., Christensen, R., and Johnson, W. (1996). A new perspective on priors for generalized linear models. J. Am. Stat. Assoc. 91, 1450–1460. doi: 10.2307/2291571
Beliaeff, B., and Pelletier, D. (2011). A general framework for indicator design and use with application to the assessment of coastal water quality and marine protected area management. Ocean Coast. Manag. 54, 84–92. doi: 10.1016/j.ocecoaman.2010.10.037
Bohensky, E. L., Butler, J. R. A., and Davies, J. (2013). Integrating indigenous ecological knowledge and science in natural resource management: perspectives from Australia. Ecol. Soc. 18:20. doi: 10.5751/ES-05846-180320
Burgman, M. A. (2005). Risks and Decisions for Conservation and Environmental Management. Cambridge: Cambridge University Press.
Canadian Task Force on the Periodic Health Examination, (1979). The periodic health examination. Can. Med. Assoc. J. 121, 1193–1254.
Chaloner, K., and Verdinelli, I. (1995). Bayesian experimental design: a review. Stat. Sci. 10, 273–304. doi: 10.1214/ss/1177009939
Collaboration for Environmental Evidence, (2013). Guidelines for Systematic Review and Evidence Synthesis in Environmental Management Version 4.2. Environmental Evidence. Bangor: Bangor University.
Conn, P. B., Thorson, J. T., and Johnson, D. S. (2017). Confronting preferential sampling when analysing population distributions: diagnosis and model-based triage. Methods Ecol. Evol. 8, 1535–1546. doi: 10.1111/2041-210X.12803
Davies, H. T. O., and Nutley, S. M. (1999). The rise and rise of evidence in health care. Public Money Manag. 19, 9–16. doi: 10.1111/1467-9302.00147
Dawid, A. P. (2015). Statistical causality from a decision-theoretic perspective. Annu. Rev. Stat. Appl. 2, 273–303. doi: 10.1146/annurev-statistics-010814-020105
Deaton, A., and Cartwright, N. (2018). Understanding and misunderstanding randomized controlled trials. Soc. Sci. Med. 210, 2–21. doi: 10.1016/j.socscimed.2017.12.005
Denham, R., and Mengersen, K. (2007). Geographically assisted elicitation of expert opinion for regression models. Bayesian Anal. 2, 99–135. doi: 10.1214/07-BA205
Depczynski, M., Cook, K., Cure, K., Davies, H., Evans-Illidge, L., Forester, T., et al. (2019). Marine monitoring of Australia’s indigenous sea country using remote technologies. J. Ocean Technol. 14, 60–75.
Devillers, R., Pressey, R. L., Grech, A., Kittinger, J. N., Edgar, G. J., Ward, T., et al. (2014). Reinventing residual reserves in the sea: are we favouring ease of establishment over need for protection? Aquat. Conserv. Mar. Freshw. Ecosyst. 25, 480–504. doi: 10.1002/aqc.2445
Dicks, L. V., Hodge, I., Randall, N. P., Scharlemann, J. P. W., Siriwardena, G. M., Smith, H. G., et al. (2014a). A transparent process for ‘evidence-informed’. Policy Making Conserv. Lett. 7, 119–125. doi: 10.1111/conl.12046
Dicks, L. V., Walsh, J. C., and Sutherland, W. J. (2014b). Organising evidence for environmental management decisions: a ‘4S’ hierarchy. Trends Ecol. Evol. 29, 607–613. doi: 10.1016/j.tree.2014.09.004
Diggle, P. J., Menezes, R., and Su, T. (2010). Geostatistical inference under preferential sampling. J. R. Stat. Soc. Series C 59, 191–232. doi: 10.1111/j.1467-9876.2009.00701.x
Eberhardt, L. L., and Thomas, J. M. (1991). Designing environmental field studies. Ecol. Monogr. 61, 53–73. doi: 10.2307/1942999
Edgar, G. J., and Barrett, N. S. (1999). Effects of the declaration of marine reserves on Tasmanian reef fishes, invertebrates and plants. J. Exp. Mar. Biol. Ecol. 242, 107–144. doi: 10.1016/S0022-0981(99)00098-2
Edgar, G. J., Barrett, N. S., and Stuart-Smith, R. D. (2009). Exploited reefs protected from fishing transform over decades into conservation features otherwise absent from seascapes. Ecol. Appl. 19, 1967–1974. doi: 10.1890/09-0610.1
Edgar, G. J., Bustamante, R., Fariña, J., Calvopiña, M., Martínez, C., and Toral-granda, M. (2004). Bias in evaluating the effects of marine protected areas: the importance of baseline data for the galapagos marine reserve. Environ. Conserv. 31, 212–218. doi: 10.1017/S0376892904001584
Edgar, G. J., Stuart-Smith, R. D., Willis, T. J., Kininmonth, S., Baker, S. C., Banks, S., et al. (2014). Global conservation outcomes depend on marine protected areas with five key features. Nature 506, 216–220. doi: 10.1038/nature13022
Emslie, M. J., Logan, M., Williamson, D. H., Ayling, A. A., MacNeil, M. A., Ceccarelli, D., et al. (2015). Expectations and outcomes of reserve network performance following re-zoning of the great barrier reef marine park. Curr. Biol. 25, 983–992. doi: 10.1016/j.cub.2015.01.073
Ferraro, P. J., and Hanauer, M. M. (2014). Advances in measuring the environmental and social impacts of environmental programs. Annu. Rev. Environ. Resour. 39, 495–517. doi: 10.1146/annurev-environ-101813-013230
Fisher, B., Balmford, A., Ferraro, P. J., Louise, G., Mascia, M., Naidoo, R., et al. (2013). Moving Rio forward and avoiding 10 more years with little evidence for effective conservation policy. Conserv. Biol. 28, 880–882. doi: 10.1111/cobi.12221
Fisher, R., O’Leary, R. A., Low-Choy, S., Mengersen, K., and Caley, M. J. (2012). A software tool for elicitation of expert knowledge about species richness or similar counts. Environ. Model. Softw. 30, 1–14. doi: 10.1016/j.envsoft.2011.11.011
Foster, S. D., Hosack, G. R., Lawrence, E., Przeslawski, R., Hedge, P., Caley, M. J., et al. (2017). Spatially balanced designs that incorporate legacy sites. Methods Ecol. Evol. 8, 1433–1442. doi: 10.1111/2041-210X.12782
Foster, S. D., Hosack, G. R., Monk, J., Lawrence, E., Barrett, N. S., Williams, A., et al. (2019a). Spatially balanced designs for transect-based surveys. Methods Ecol. Evol. 1–11. doi: 10.1111/2041-210X.13321
Foster, S. D., Monk, J., Lawrence, E., Hayes, K. R., Hosack, G. R., Hooper, G., et al. (2019b). “Statistical considerations for monitoring and sampling,” in Field Manuals for Marine Sampling to Monitor Australian Waters, eds R. Przeslawski, and S. D. Foster, (Hobart: National Environmental Science Programme), 23–41.
Fraschetti, S., Terlizzi, A., Micheli, F., Benedetti-Cecchi, L., and Boero, F. (2002). Marine protected areas in the mediterranean sea: objectives, effectiveness and monitoring. Mar. Ecol. 23, 190–200. doi: 10.1111/j.1439-0485.2002.tb00018.x
Fulton, E. A., Bax, N. J., Bustamante, R. H., Dambacher, J. M., Dichmont, C., Dunstan, P. K., et al. (2015). Modelling marine protected areas: insights and hurdles. Philos. Trans. R. Soc. Ser. B 370:1681. doi: 10.1098/rstb.2014.0278
Gelman, A., Stern, H. S., Carlin, J. B., Dunson, D. B., Vehtari, A., and Rubin, D. B. (2013). Bayesian Data Analysis. Boca Raton, FL: Chapman Hall.
Glasby, T. M. (1997). Analysing data from post-impact studies using asymmetrical analyses of variance: a case study of epibiota on marinas. Austr. J. Ecol. 22, 448–459. doi: 10.1111/j.1442-9993.1997.tb00696.x
Grafström, A., and Lundström, N. (2013). Why well spread probability samples are balanced. Open J. Stat. 3, 36–41. doi: 10.4236/ojs.2013.31005
Gregoire, T. G. (1998). Design-based and model-based inference in survey sampling: appreciating the difference. Can. J. Forest Res. 28, 1429–1447. doi: 10.1139/x98-166
Grimes, D. A., and Schulz, K. F. (2002). Cohort studies: marching towards outcomes. Lancet 359, 341–345. doi: 10.1016/S0140-6736(02)07500-1
Guidetti, P. (2002). The importance of experimental design in detecting the effects of protection measures on fish in mediterranean mpas. Aquat. Conserv. Mar. Freshw. Ecosyst. 12, 619–634. doi: 10.1002/aqc.514
Guyatt, G. H., Oxman, G. E., Vist, A. D., Kunz, R., Falck-Ytter, Y., Alonso-Coello, P., et al. (2008). GRADE: an emerging consensus on rating quality of evidence and strength of recommendations. BMJ 336, 924–926. doi: 10.1136/bmj.39489.470347.AD
Hadorn, D. C., Baker, D., Hodges, J. S., and Hicks, N. (1996). Rating the quality of evidence for clinical practice guidelines. J. Clin. Epidemiol. 49, 749–754. doi: 10.1016/0895-4356(96)00019-4
Hall, A. J., Hugunin, K., Deaville, R., Law, R. J., Allchin, C. R., and Jepson, P. D. (2006). The risk of infection from polychlorinated biphenyl exposure in the harbor porpoise (Phocoena phocoena): a case-control approach. Environ. Health Perspect. 114, 704–711. doi: 10.1289/ehp.8222
Hemming, V., Burgman, M. A., Hanea, A. M., McBride, M. F., and Wintle, B. C. (2017). A practical guide to structured expert elicitation using the idea protocol. Methods Ecol. Evol. 9, 169–180. doi: 10.1111/2041-210X.12857
Hill, N. A., Barrett, N. S., Lawrence, E., Hulls, J., Dambacher, J. M., Nichol, S., et al. (2014). Quantifying fish assemblages in large, offshore marine protected areas: an Australian case study. PLoS One 9:e110831. doi: 10.1371/journal.pone.0110831
Hobday, A. J. (2011). Sliding baselines and shuffling species: implications of climate change for marine conservation. Mar. Ecol. 32, 392–403. doi: 10.1111/j.1439-0485.2011.00459.x
Hogarth, R. (2005). “Deciding analytically or trusting your intuition? The advantages and disadvantages of analytic and intuitive thought,” in The Routines of Decision Making, eds T. Betsch, and S. Haberstroh, (Mahwah, NJ: Lawrence Erlbaum Associates, Inc.), 67–82.
Hosack, G. R., Hayes, K. R., and Barry, S. C. (2017). Prior elicitation for Bayesian generalised linear models with application to risk control option assessment. Reliabil. Eng. Syst. Saf. 167, 351–361. doi: 10.1016/j.ress.2017.06.011
Huang, Z., Nichol, S. L., Harris, P. T., and Caley, M. J. (2014). Classification of submarine Canyons of the Australian continental margin. Mar. Geol. 357, 362–383. doi: 10.1016/j.margeo.2014.07.007
Hughes, T. P., Cameron, D. S., Chin, A., Connolly, S. R., Day, J. C., Jones, G. P., et al. (2016). A critique of claims for negative impacts of marine protected areas on fisheries. Ecol. Appl. 26, 637–641. doi: 10.1890/15-0457
Hurlbert, S. H. (1984). Pseudoreplication and the design of ecological field experiments. Ecol. Monogr. 54, 187–211. doi: 10.2307/1942661
James, A., Low-Choy, S., and Mengersen, K. (2010). Elicitator: an expert elicitation tool for regression in ecology. Environ. Model. Softw. 25, 129–145. doi: 10.1016/j.envsoft.2009.07.003
Joppa, L. N., and Pfaff, A. (2009). High and far: biases in the location of protected areas. PLoS One 4:e8273. doi: 10.1371/journal.pone.0008273
Kemp, J., Jenkins, G. P., Smith, D. C., and Fulton, E. A. (2012). Measuring the performance of spatial management in marine protected areas. Oceanogr. Mar. Biol. Annu. Rev. 50, 287–314.
Kruger, J., and Dunning, D. (1999). Unskilled and unaware of it: how difficulties in recognizing one’s own incompetence lead to inflated self-assessments. J. Pers. Soc. Psychol. 77, 1121–1134. doi: 10.1037/0022-3514.77.6.1121
Lawrence, E., Hayes, K. R., Lucieer, V. L., Nichol, S. L., Dambacher, J. M., Hill, N. A., et al. (2015). Mapping habitats and developing baselines in offshore marine reserves with little prior knowledge: a critical evaluation of a new approach. PLoS One 10:e0141051. doi: 10.1371/journal.pone.0141051
Lawrence, E., Hovey, R., Harvey, E., Kendrick, G., Hayes, K. R., and Williams, S. (2016). Application of NERP Biodiversity Hub Survey Methodology to Geographe Bay Commonwealth Marine Reserve. Report to the National Environmental Science Programme. Hobart, TAS: University of Tasmania.
Leek, J. T., and Peng, R. D. (2015). What is the question? Science 347, 1314–1315. doi: 10.1126/science.aaa6146
Lucieer, V., Porter-Smith, R., Nichol, S., Monk, J., and Barrett, N. S. (2016). Collation of Existing Shelf Reef Mapping Data and Gap Identification. Phase 1 Final Report - Shelf Reef Key Ecological Features. Report to the National Environmental Science Programme. Hobart, TAS: University of Tasmania.
Marinesque, S., Kaplan, D. M., and Rodwell, L. D. (2012). Global implementation of marine protected areas: is the developing world being left behind? Mar. Policy 36, 727–737. doi: 10.1016/j.marpol.2011.10.010
Martin, T. G., Burgman, M. A., Fidler, F., Kuhnert, P. M., Low-Choy, S., Mcbride, M., et al. (2012). Eliciting expert knowledge in conservation science. Conserv. Biol. 26, 29–38. doi: 10.1111/j.1523-1739.2011.01806.x
McDonald, T. (2012). “Spatial sampling designs for long-term ecological monitoring,” in Design and Analysis of Long-term Ecological Monitoring Studies, eds R. A. Gitzen, J. J. Millspaugh, A. B. Cooper, and D. S. Licht, (Cambridge: Cambridge University Press), 101–125. doi: 10.1017/cbo9781139022422.009
Monk, J., Barrett, N. S., Hulls, J., James, L., Hosack, G. R., Oh, E., et al. (2016). Seafloor Biota, Rock Lobster and Demersal Fish Assemblages of the Tasman Fracture Commonwealth Marine Reserve Region: Determining the Influence of the Shelf Sanctuary Zone on Population Demographics”. A Report to the National Environmental Research Program. Hobart, TAS: University of Tasmania.
Mora, C., and Sale, P. F. (2011). Ongoing global biodiversity loss and the need to move beyond protected areas: a review of the technical and practical shortcomings of protected areas on land and sea. Mar. Ecol. 434, 251–266. doi: 10.3354/meps09214
Mupepele, A. C., Walsh, J. C., Sutherland, W., and Dormann, C. F. (2015). An evidence assessment tool for ecosystem services and conservation studies. Ecol. Appl. 26, 1295–1301. doi: 10.1890/15-0595
Nichols, J. D., and Williams, B. K. (2006). Monitoring for conservation. Trends Ecol. Evol. 21, 668–673. doi: 10.1016/j.tree.2006.08.007
Nutley, S., Powell, A., and Davies, H. (2013). What Counts as Good Evidence? Provocation Paper for the Alliance for Useful Evidence. St Andrews: St. Andrews University.
OCEBM Levels of Evidence Working Group (2011). The Oxford 2011 Levels of Evidence. Oxford: Oxford University.
O’Hagan, A., Buck, C. E., Daneshkhah, A., Eiser, J. R., Garthwaite, P. H., Jenkinson, D. J., et al. (2006). Uncertain Judgements: Eliciting Experts’ Probabilities. Chichester: John Wiley & Sons Ltd.
Olsen, A. R., Kincaid, T. M., and Payton, Q. (2012). “Spatially balanced survey designs for natural resources,” in Design and Analysis of Long-term Ecological Monitoring Studies, eds R. A. Gitzen, J. J. Millspaugh, A. B. Cooper, and D. S. Licht, (Cambridge: Cambridge University Press), 126–150. doi: 10.1017/cbo9781139022422.010
Poloczanska, E. S., Brown, C. J., Sydeman, W. J., Wolfgang, K., Schoeman, D. S., Moore, P. J., et al. (2013). Global imprint of climate change on marine life. Nat. Clim. Change 3, 919–925. doi: 10.1038/nclimate1958
Pressey, R. L., Visconti, P., and Ferraro, P. J. (2015). Making parks make a difference: poor alignment of policy, planning and management with protected-area impact, and ways forward. Philos. Trans. R. Soc. Lond. B Biol. Sci. 370:1681. doi: 10.1098/rstb.2014.0280
Pressey, R. L., Weeks, R., and Gurney, G. G. (2017). From displacement activities to evidence-informed decisions in conservation. Biol. Conserv. 212, 337–348. doi: 10.1016/j.biocon.2017.06.009
Przeslawski, R., Alvarez, B., Kool, J., Bridge, T., Caley, M. J., and Nichol, S. L. (2015). Implications of sponge biodiversity patterns for the management of a marine reserve in Northern Australia. PLoS One 10:e0141813. doi: 10.1371/journal.pone.0141813
Pullin, A. S., and Knight, T. M. (2001). Effectiveness in conservation practice: pointers from medicine and public health. Conserv. Biol. 15, 50–54. doi: 10.1111/j.1523-1739.2001.99499.x
Pullin, A. S., Knight, T. M., Stone, D. A., and Charman, K. (2004). Do conservation managers use scientific evidence to support their decision-making? Biol. Conserv. 119, 245–252. doi: 10.1016/j.biocon.2003.11.007
Ramsey, D. S. L., Forsyth, D. M., Wright, E., McKay, M., and Westbrooke, I. (2019). Using propensity scores for causal inference in ecology: options, considerations, and a case study. Methods Ecol. Evol. 10, 320–331. doi: 10.1111/2041-210X.13111
Robinson, C. J., Maclean, K., Hill, R., Bock, E., and Rist, P. (2016). Participatory mapping to negotiate indigenous knowledge used to assess environmental risk. Sustainab. Sci. 11, 115–126. doi: 10.1007/s11625-015-0292-x
Rosenbaum, P. R., and Donald, B. R. (1983). The central role of the propensity score in observational studies for causal effects. Biometrika 70, 41–55. doi: 10.2307/2335942
Rothwell, P. M. (2005). External validity of randomised controlled trials: to whom do the results of this trial apply? Lancet 365, 82–93. doi: 10.1016/S0140-6736(04)17670-
Särndal, C. E., Thomsen, I., Hoem, J. M., Lindley, D. V., Barndorff-Nielsen, O., and Dalenius, T. (1978). Design-based and model-based inference in survey sampling [with Discussion and Reply]. Scand. J. Stat. 5, 27–52.
Schulz, K. F., and Grimes, D. A. (2002). Case-control studies: research in reverse. Lancet 359, 431–434. doi: 10.1016/S0140-6736(02)07605-5
Sciberras, M., Jenkins, S. R., Kaiser, M. J., Hawkins, S. J., and Pullin, A. S. (2013). Evaluating the biological effectiveness of fully and partially protected marine areas. Environ. Evid. 2:4. doi: 10.1186/2047-2382-2-4
Segan, D. B., Bottrill, M. C., Baxter, P. W. J., and Possingham, H. P. (2011). Using conservation evidence to guide management. Conserv. Biol. 25, 200–202. doi: 10.1111/j.1523-1739.2010.01582.x
Smith, A. N. H., Anderson, M. J., and Pawley, M. D. M. (2017). Could ecologists be more random? Straightforward alternatives to haphazard spatial sampling. Ecography 40, 1251–1255. doi: 10.1111/ecog.02821
Speirs-Bridge, A., Fidler, F., McBride, M., Flander, L., Cumming, G., and Burgman, M. A. (2010). Reducing overconfidence in the interval judgments of experts. Risk Anal. 30, 512–523. doi: 10.1111/j.1539-6924.2009.01337.x
Stevens, A., and Milne, R. (1997). “The effectiveness revolution and public health,” in Progress in Public Health, ed. G. Scally, (London: Royal Society of Medicine Press), 197–225.
Stewart-Oaten, A., Murdoch, W. W., and Parker, K. R. (1986). Environmental impact assessment: pseudoreplication in time? Ecology 67, 929–940. doi: 10.2307/1939815
Strain, E. M., Edgar, G. J., Ceccarelli, D., Stuart-Smith, R. D., Hosack, G. R., and Thomson, R. J. (2019). A global assessment of the direct and indirect benefits of marine protected areas for coral reef conservation. Divers. Distrib. 25, 9–20. doi: 10.1111/ddi.12838
Stuart, E. A. (2010). Matching methods for causal inference: a review and a look forward. Stat. Sci. 25, 1–21. doi: 10.1214/09-STS313
Sutherland, W. J., Pullin, A. S., Dolman, P. M., and Knight, T. M. (2004). The need for evidence-based conservation. Trends Ecol. Evol. 19, 305–308. doi: 10.1016/j.tree.2004.03.018
Teck, S. J., Lorda, J., Shears, N. T., Bell, T. W., Cornejo-Donoso, J., Caselle, J. E., et al. (2017). Disentangling the effects of fishing and environmental forcing on demographic variation in an exploited species. Biol. Conserv. 209, 488–498. doi: 10.1016/j.biocon.2017.03.014
Tversky, A., and Kahneman, D. (1974). Judgment under uncertainty: heuristics and biases. Science 185, 1124–1131.
Underwood, A. J. (1992). Beyond Baci: the detection of environmental impacts on population in the real but variable world. J. Exp. Mar. Biol. Ecol. 161, 145–178. doi: 10.1016/0022-0981(92)90094-Q
Vanhatalo, J., Hosack, G. R., and Sweatman, H. (2017). Spatiotemporal modelling of crown-of-thorns starfish outbreaks on the Great Barrier Reef to inform control strategies. J. Appl. Ecol. 54, 188–197. doi: 10.1111/1365-2664.12710
Van Haastrecht, E. K., and Toonen, H. M. (2011). Science-policy Interactions in MPA site selection in the Dutch part of the North Sea. Environ. Manag. 47, 656–670. doi: 10.1007/s00267-010-9546-7
Walshe, D. P., Garner, P., Adeel, A. A., Pyke, G. H., and Burkot, T. R. (2013). Larvivorous fish for preventing malaria transmission. Cochrane Datab. Syst. Rev. 12:CD008090. doi: 10.1002/14651858.CD008090.pub3
Watts, M. E., Ball, I. R., Stewart, R. S., Klein, C. J., Wilson, K., Steinback, C., et al. (2009). Marxan with Zones: software for optimal conservation based land- and sea-use zoning. Environ. Model. Softw. 24, 1513–1521. doi: 10.1016/j.envsoft.2009.06.005
Wiens, J. A., and Parker, K. R. (1995). Analyzing the effects of accidental environmental impacts: approaches and assumptions. Ecol. Appl. 5, 1069–1083. doi: 10.2307/2269355
Williams, B. K., Szaro, R. C., and Shapiro, C. D. (2007). Adaptive Management: The U.S. Department of the Interior Technical Guide. Washington, DC: U.S. Department of the Interior.
Willis, T. J., Millar, R. B., Babcock, R. C., and Tolimieri, N. (2003). Burdens of evidence and the benefits of marine reserves: putting descartes before des horse? Environ. Conserv. 30, 97–103. doi: 10.1017/s0376892903000092
Wilson, A. L., Boelaert, M., Kleinschmidt, I., Pinder, M., Scott, T. W., Tusting, L. S., et al. (2015). Evidence-based vector control? improving the quality of vector control trials. Trends Parasitol. 31, 380–390. doi: 10.1016/j.pt.2015.04.015
Keywords: monitoring, marine protected area, design methodology, EBDM, causality
Citation: Hayes KR, Hosack GR, Lawrence E, Hedge P, Barrett NS, Przeslawski R, Caley MJ and Foster SD (2019) Designing Monitoring Programs for Marine Protected Areas Within an Evidence Based Decision Making Paradigm. Front. Mar. Sci. 6:746. doi: 10.3389/fmars.2019.00746
Received: 16 June 2019; Accepted: 14 November 2019;
Published: 29 November 2019.
Edited by:
Trevor John Willis, Stazione Zoologica Anton Dohrn, ItalyReviewed by:
Jake Kritzer, Environmental Defense Fund, United StatesEdward Jeremy Hind-Ozan, Department for Environment, Food and Rural Affairs, United Kingdom
Copyright © 2019 Hayes, Hosack, Lawrence, Hedge, Barrett, Przeslawski, Caley and Foster. This is an open-access article distributed under the terms of the Creative Commons Attribution License (CC BY). The use, distribution or reproduction in other forums is permitted, provided the original author(s) and the copyright owner(s) are credited and that the original publication in this journal is cited, in accordance with accepted academic practice. No use, distribution or reproduction is permitted which does not comply with these terms.
*Correspondence: Keith R. Hayes, a2VpdGguaGF5ZXNAY3Npcm8uYXU=