 Gabriel Gorsky1,2*†
 Guillaume Bourdin3*†
 Fabien Lombard1,2*†‡
 Maria Luiza Pedrotti1*†
 Samuel Audrain4
 Nicolas Bin4
 Emmanuel Boss3‡
 Chris Bowler2,5‡Nicolas Cassar6,7Loic Caudan4Genevieve Chabot8
 Natalie R. Cohen9Daniel Cron4Colomban De Vargas2,10‡
 John R. Dolan1
 Eric Douville11‡Amanda Elineau1J. Michel Flores12‡
 Jean Francois Ghiglione2,13‡
 Nils Haëntjens3Martin Hertau4Seth G. John14Rachel L. Kelly14
 Ilan Koren12Yajuan Lin6,7Dominique Marie10Clémentine Moulin4Yohann Moucherie4
 Stéphane Pesant15,16‡Marc Picheral1Julie Poulain17
 Mireille Pujo-Pay15
 Gilles Reverdin18
 Sarah Romac2,10Mathew B. Sullivan19‡Miri Trainic12Marc Tressol8Romain Troublé2,4‡
 Assaf Vardi20
 Christian R. Voolstra21‡Patrick Wincker17‡
 Sylvain Agostini22‡Bernard Banaigs23‡Emilie Boissin23‡Didier Forcioli24,25‡
 Paola Furla24,25‡
 Pierre E. Galand2,26‡
 Eric Gilson24,25‡Stéphanie Reynaud27‡
 Shinichi Sunagawa28‡
 Olivier P. Thomas29‡
 Rebecca Lisette Vega Thurber30‡
 Didier Zoccola27‡, on behalf of Tara Pacific Consortium,
  Serge Planes2,23‡,
  Denis Allemand27‡ and
  Eric Karsenti31
- 1Sorbonne Université, CNRS, Laboratoire d’Océanographie de Villefranche, UMR 7093 LOV, Villefranche-sur-Mer, France
- 2Research Federation for the study of Global Ocean Systems Ecology and Evolution, FR2022/Tara Oceans-GOSEE, Paris, France
- 3School of Marine Sciences, University of Maine, Orono, ME, United States
- 4Tara Ocean Foundation, Paris, France
- 5Institut de Biologie de l’Ecole Normale Supérieure, Ecole Normale Supérieure, CNRS, INSERM, Université PSL, Paris, France
- 6Nicholas School of the Environment, Duke University, Durham, NC, United States
- 7Laboratoire des Sciences de l’Environnement Marin, UMR 6539 UBO/CNRS/IRD/IFREMER, Institut Universitaire Européen de la Mer, Brest, France
- 8Mercator Ocean, Ramonville-Saint-Agne, France
- 9Department of Marine Chemistry and Geochemistry, Woods Hole Oceanographic Institution, Woods Hole, MA, United States
- 10Sorbonne Université, CNRS, Station Biologique de Roscoff, UMR 7144, AD2M, Roscoff, France
- 11Laboratoire des Sciences du Climat et de l’Environnement, LSCE/IPSL, CEA-CNRS-UVSQ, Université Paris-Saclay, Gif-sur-Yvette, France
- 12Department of Earth and Planetary Science, Weizmann Institute of Science, Rehovot, Israel
- 13Sorbonne Université, CNRS, Laboratoire d’Océanographie Microbienne, UMR 7621 LOMIC, Banyuls-sur-Mer, France
- 14Department of Earth Science, University of Southern California, Los Angeles, CA, United States
- 15MARUM – Center for Marine Environmental Sciences, University of Bremen, Bremen, Germany
- 16PANGAEA, Data Publisher for Earth & Environmental Science, Bremen, Germany
- 17Génomique Métabolique, Genoscope, Institut François Jacob, CEA, CNRS, Univ Evry, Université Paris-Saclay, Evry, France
- 18Sorbonne Université CNRS/IRD/MNHN (LOCEAN/IPSL UMR 7159), Paris, France
- 19Department of Microbiology and Department of Civil, Environmental and Geodetic Engineering, The Ohio State University, Columbus, OH, United States
- 20Department of Plant and Environmental Sciences, Weizmann Institute of Science, Rehovot, Israel
- 21Department of Biology, University of Konstanz, Konstanz, Germany
- 22Shimoda Marine Research Center, University of Tsukuba, Shimoda, Japan
- 23Laboratoire d’Excellence CORAIL, PSL Research University: EPHE-UPVD-CNRS, USR 3278 CRIOBE, Université de Perpignan, Perpignan, France
- 24CNRS, INSERM, IRCAN, Medical School, Université Côte d’Azur, Nice, France
- 25Department of Medical Genetics, CHU of Nice, Nice, France
- 26Sorbonne Université, CNRS, Laboratoire d’Ecogéochimie des Environnements Benthiques, UMR 8222, LECOB, Banyuls-sur-Mer, France
- 27Centre Scientifique de Monaco, Monaco, Monaco
- 28Department of Biology, Institute of Microbiology and Swiss Institute of Bioinformatics, ETH Zürich, Zurich, Switzerland
- 29Marine Biodiscovery Laboratory, School of Chemistry and Ryan Institute, National University of Ireland, Galway, Galway, Ireland
- 30Department of Microbiology, Oregon State University, Corvallis, OR, United States
- 31European Molecular Biology Laboratory, Heidelberg, Germany
Interactions between the ocean and the atmosphere occur at the air-sea interface through the transfer of momentum, heat, gases and particulate matter, and through the impact of the upper-ocean biology on the composition and radiative properties of this boundary layer. The Tara Pacific expedition, launched in May 2016 aboard the schooner Tara, was a 29-month exploration with the dual goals to study the ecology of reef ecosystems along ecological gradients in the Pacific Ocean and to assess inter-island and open ocean surface plankton and neuston community structures. In addition, key atmospheric properties were measured to study links between the two boundary layer properties. A major challenge for the open ocean sampling was the lack of ship-time available for work at “stations”. The time constraint led us to develop new underway sampling approaches to optimize physical, chemical, optical, and genomic methods to capture the entire community structure of the surface layers, from viruses to metazoans in their oceanographic and atmospheric physicochemical context. An international scientific consortium was put together to analyze the samples, generate data, and develop datasets in coherence with the existing Tara Oceans database. Beyond adapting the extensive Tara Oceans sampling protocols for high-resolution underway sampling, the key novelties compared to Tara Oceans’ global assessment of plankton include the measurement of (i) surface plankton and neuston biogeography and functional diversity; (ii) bioactive trace metals distribution at the ocean surface and metal-dependent ecosystem structures; (iii) marine aerosols, including biological entities; (iv) geography, nature and colonization of microplastic; and (v) high-resolution underway assessment of net community production via equilibrator inlet mass spectrometry. We are committed to share the data collected during this expedition, making it an important resource important resource to address a variety of scientific questions.
Introduction
Humans have accelerated the input of carbon dioxide into the atmosphere at unprecedented rates, and modern policy and governance in key countries suggests that there will be little effort to curb this tendency (Masson-Delmotte et al., 2018). About one-third of the anthropogenic carbon emissions is absorbed by the oceans which currently serve as a CO2 sink, but this process is taking place at the cost of acidifying the oceans and further stressing its inhabitants (Gattuso et al., 2015). The ocean-atmosphere interface and its properties are undoubtedly critical to these processes and yet they remain understudied over scales as vast as the global oceans due to methodological and logistical challenges.
Ecosystems of the sea surface layers play an important role in the exchanges between oceans and the atmosphere (Cunliffe and Murrell, 2009; Wurl et al., 2017), impacting not only CO2 fluxes via biologically derived surfactants (Pereira et al., 2018), but also the fluxes of aerosol particulates which are transported and deposited by winds. The ocean and the atmospheric boundary layers define an important coupled system that determines fluxes of gases, and acts as a key component of the climate system (Neukermans et al., 2018).
The uppermost layer of the ocean is the habitat of a specific community of organisms called neuston (Sieburth, 1983; Liss et al., 2005; Zaitsev and Liss, 2005). Neuston is closely connected to plankton communities and similarly comprises all domains of life, including prokaryotes (bacteria and archaea), unicellular eukaryotes (protists), fungi, metazoans as well as viruses. Interestingly, it also includes enhanced abundances of eggs and larvae of organisms living in the water column and on the seafloor (Zaitsev, 1971; Sundby, 1991; Wurl and Obbard, 2004), as well as insects, and floating organic and inorganic debris. This marine litter, including plastic, can be rapidly colonized by microbial and macrobial communities (Dussud et al., 2018a) and will then act as dispersive vectors for a variety of organisms (Barnes, 2002; Zettler et al., 2013; Viršek et al., 2017).
Aerosols are key players in the atmospheric radiation balance by absorbing and reflecting part of the incoming radiations back to space and by modulating cloud properties (Charlson et al., 1987; Boucher et al., 2013). Aerosolization can be a common mechanism for various elements aerial dispersal including iron (Duce and Tindale, 1991) or epidemics of marine pathogens (Aller et al., 2005; Sharoni et al., 2015) and influences the primary production in the open ocean (Jickells et al., 2005).
Here we present the sampling strategy adopted during the Tara Pacific expedition (Planes et al., 2019) to study open water ecosystems at the ocean-atmosphere interface across the North Atlantic and tropical Pacific Ocean, and in the wake of several tropical coral islands. A consistent set of protocols was used throughout the expedition to sample aerosols, neuston and plankton at the ocean surface, as well as essential environmental variables. Provenance metadata, including sample unique identifiers, were curated with care to ensure the traceability and future-use of sample collections, and to facilitate access and benefit sharing. Climatologies and ocean models will further enrich the environmental context of all samples and data sets. We anticipate that this data set will complement the growing knowledge base of other global and multidisciplinary expeditions such as the Atlantic Meridional Transect (AMT), Global Ocean Sampling (GOS), Tara Oceans, and Malaspina (Aiken and Bale, 2000; Rusch et al., 2007; Karsenti et al., 2011; Duarte, 2015), and will become an important resource to address a large spectrum of scientific questions.
Sampling Strategy
The Tara Pacific expedition was based on the same multi-disciplinary, systems ecology approach that was pioneered during the Tara Oceans expedition (Karsenti et al., 2011; Pesant et al., 2015). The first distinctive feature of our approach was to combine state-of-the-art biogeochemical, imaging and genetic methods to assess the structure and functions of an ecological system. The second was to apply these multi-disciplinary methods across the full spectrum of system components. The third distinctive feature was to characterize this spectrum according to the size and classification of chemical and biological entities. Our approach provides both a conceptual framework that helps formulation of scientific questions, and a practical framework that helps making well-informed compromises toward a coherent set of protocols and a realistic sampling strategy. This blueprint ensured that in the present study, the entire spectrum of physical, chemical and biological entities was considered to characterize the atmosphere, the ocean surface and their interface, using both continuous and discrete measurements.
During the Tara Pacific expedition, instruments were deployed and recovered from the water at cruising speed (up to 9 knots), so that each sampling site represents a stretch of ocean of 5–20 nautical miles. The expedition completed a longitudinal sampling of the surface community and genomic compositions of the north Atlantic and of the southern and northern Pacific (Figures 1, 2). The western Pacific was also sampled latitudinally and a special focus was given to the north-eastern Pacific “Great Pacific Garbage Patch (GPGP).” Several coral islands in the equatorial Pacific were sampled up- and downstream to study their island mass effect.
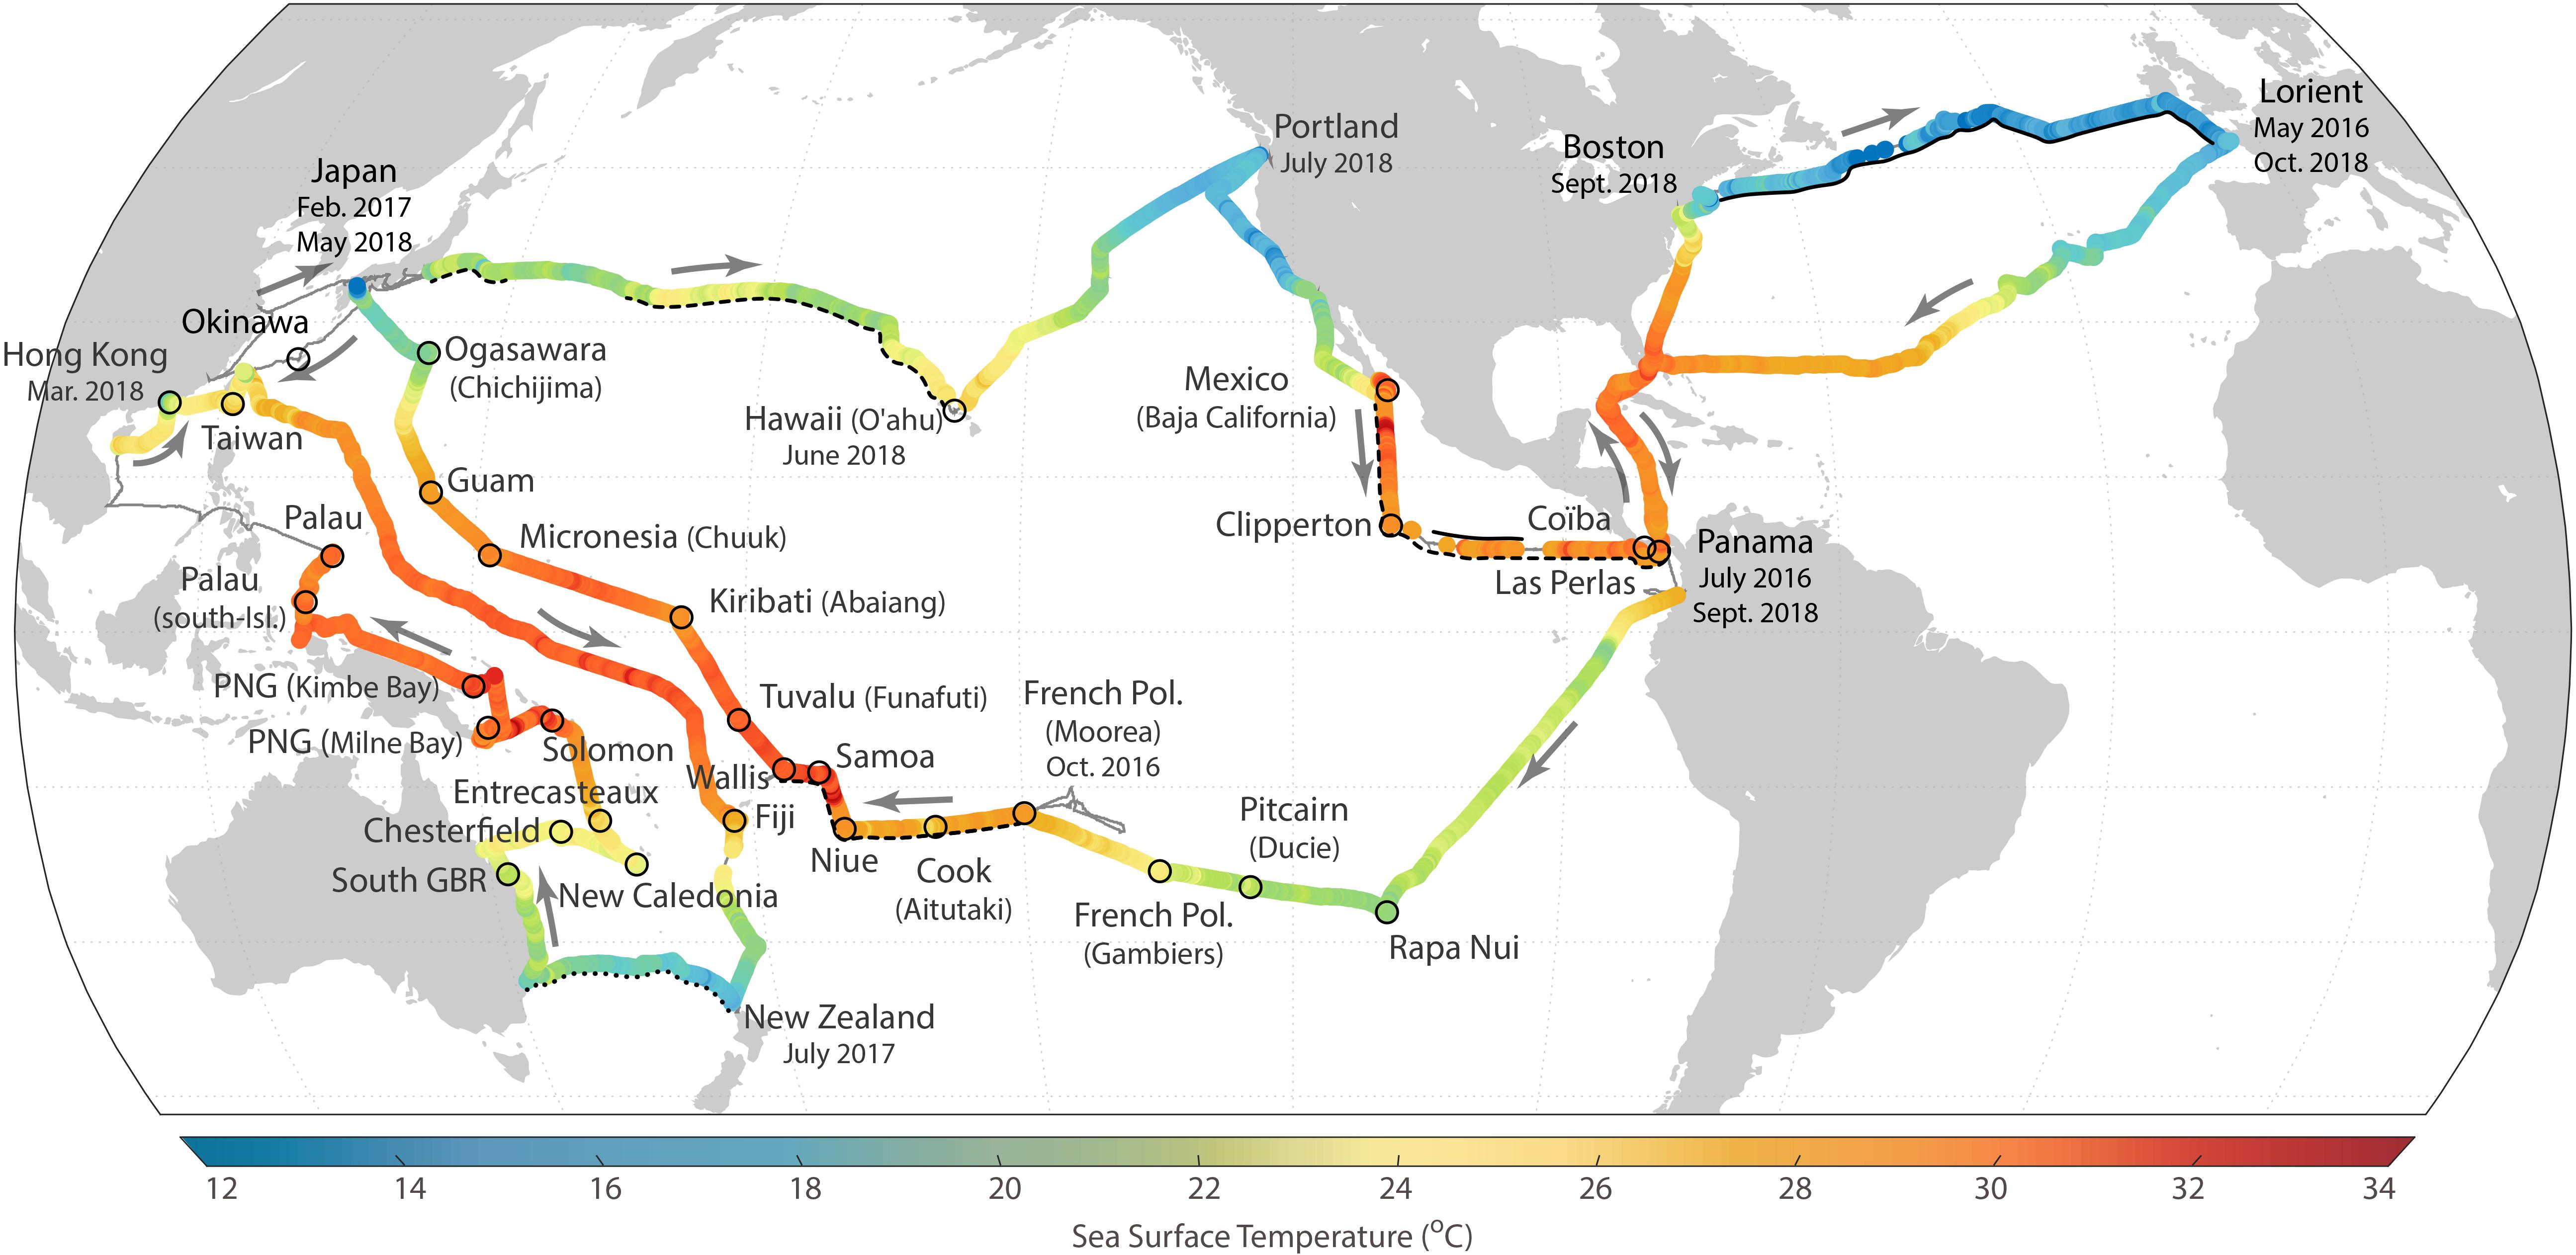
Figure 1. Sailing track of the Tara Pacific expedition showing seawater temperature measured by the thermosalinograph, and the 32 coral islands studied as part of the expedition (Planes et al., 2019). Sections of the expedition where some of the instruments were not functioning are underlined as follows: continuous black line – hyperspectral absorption and attenuation sensor, discontinuous line – Equilibrator Inlet Mass Spectrometer and dotted line– CDOM fluorometer.
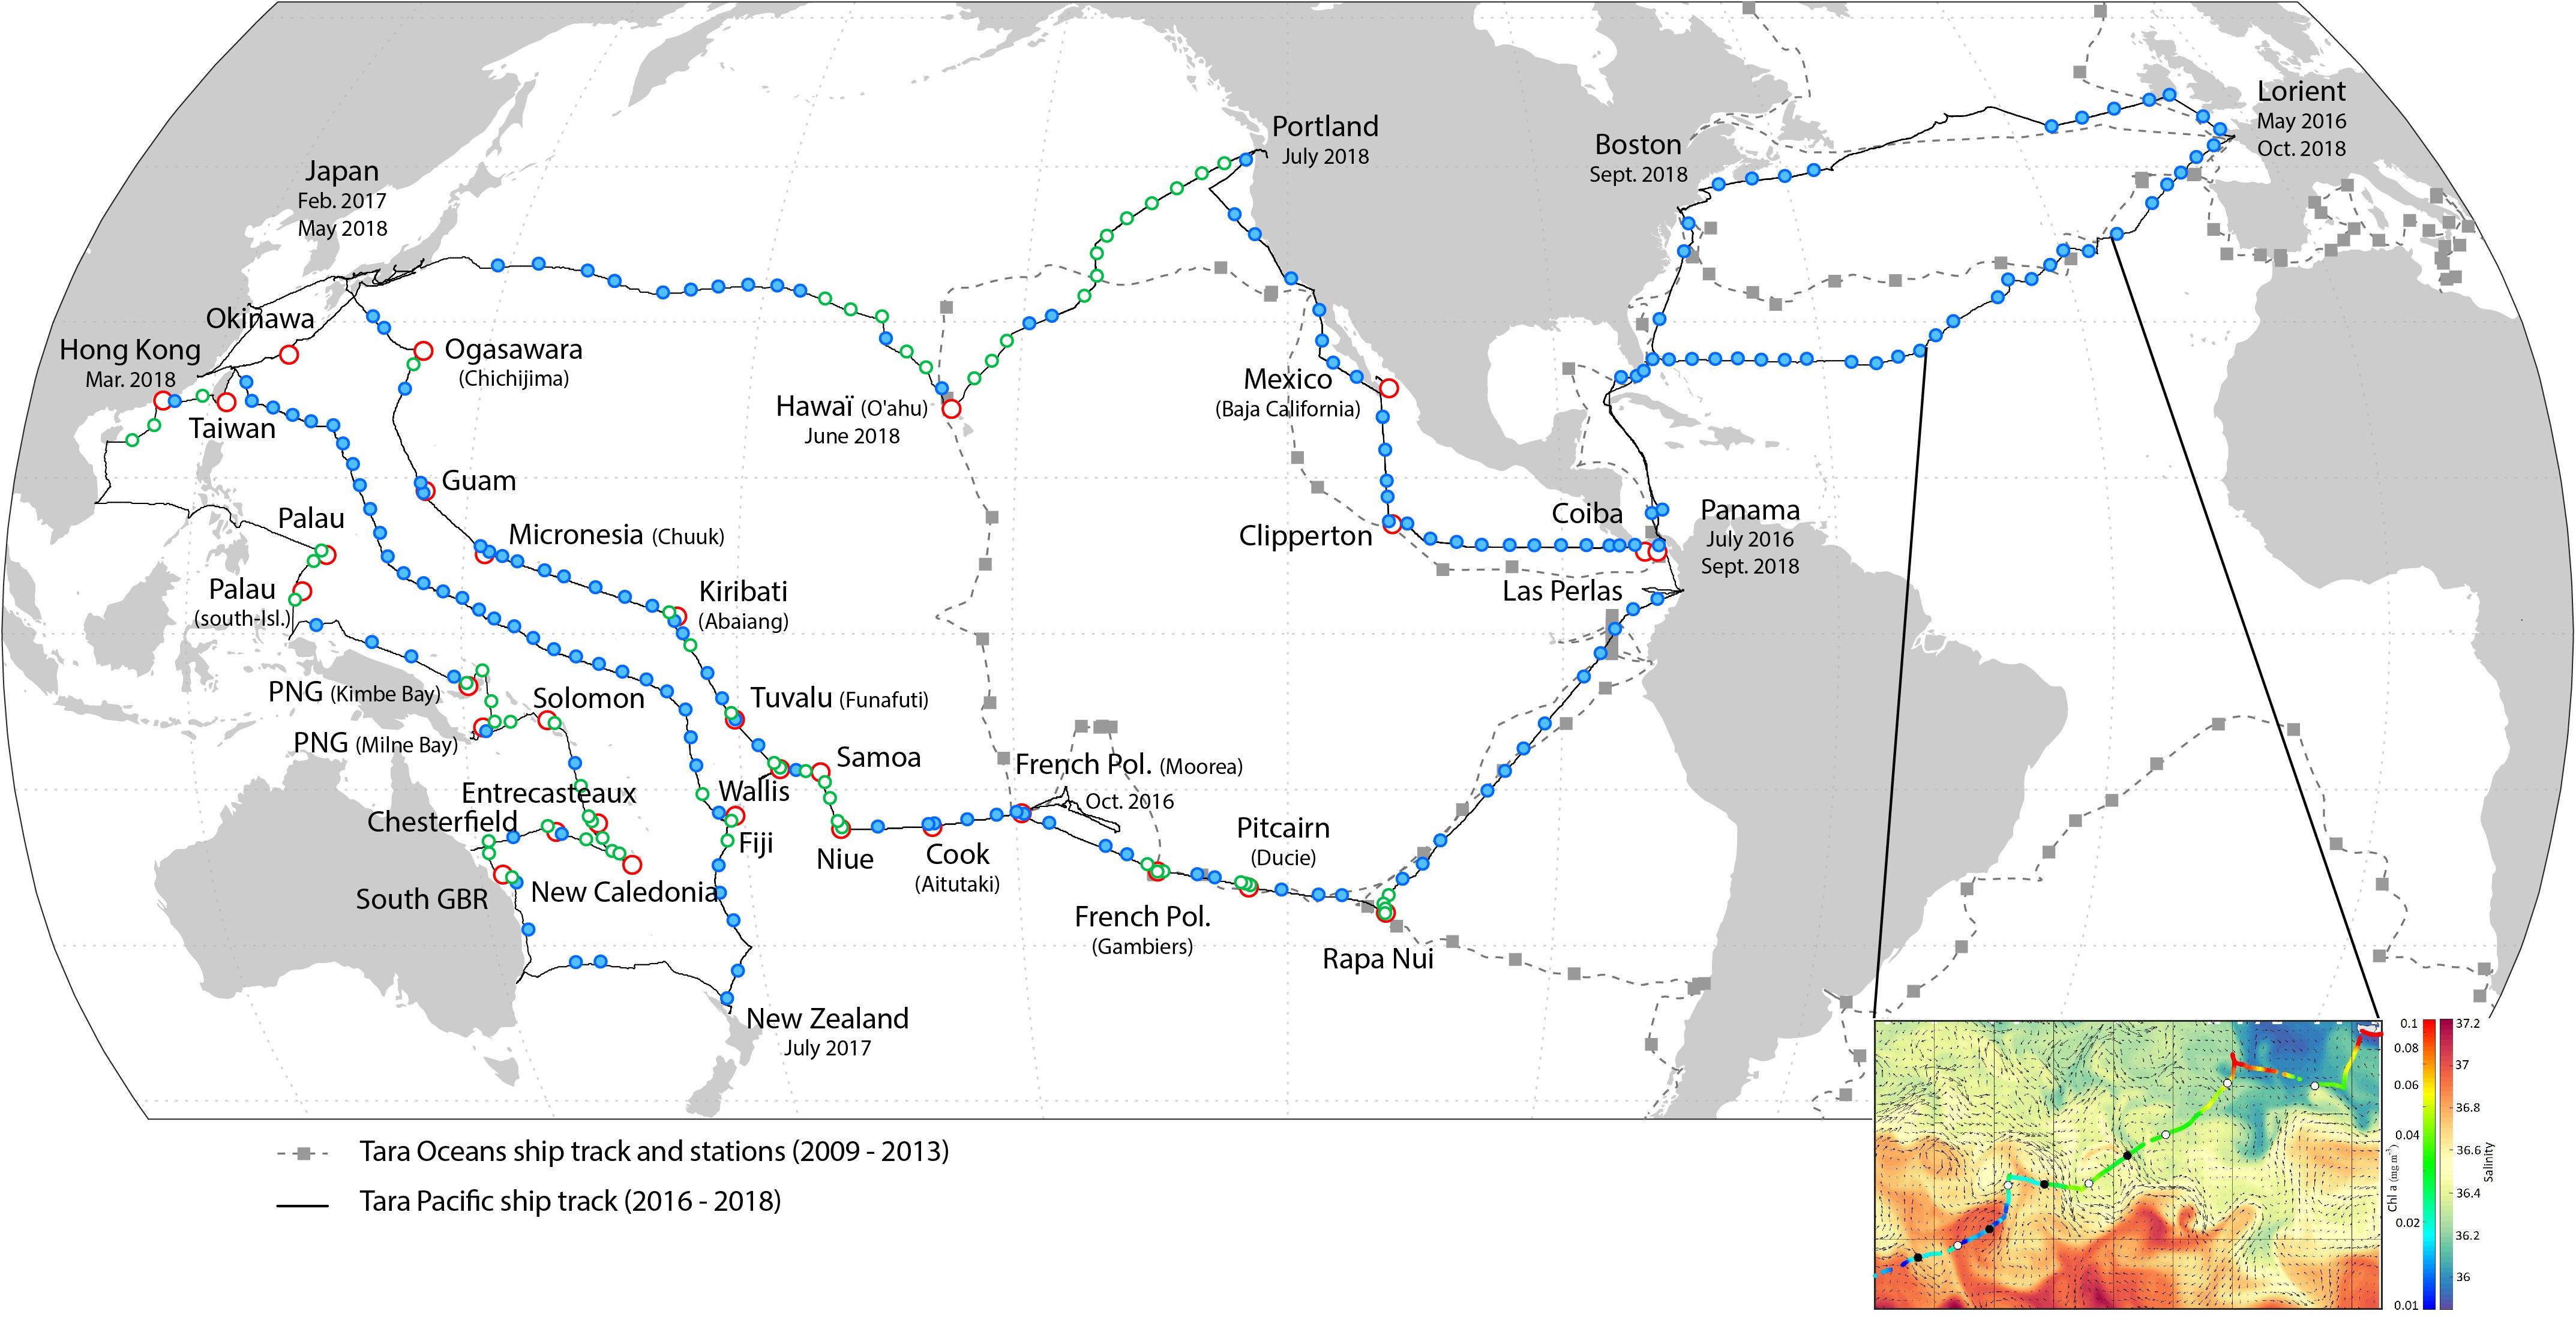
Figure 2. Geographic location of daytime discrete sampling sites (blue symbols). Green symbols indicate sites where the Manta net was also deployed. Red symbols represent the coral islands. For visual clarity, only the daytime sampling sites are shown. In grey: the Tara Oceans expedition’s (2009–2013) sailing track and sampling stations (gray square symbols). Insert: example of mesoscale daytime (white symbols) and nighttime (black symbols) sampling sites. Chlorophyll a concentration (from ACs continuous measurements) is shown along the ship’s track. Salinity and current velocity fields obtained from Copernicus Marine Service prediction models are shown in the background.
The Route
The Tara Pacific expedition began on May 28, 2016 and ended on October 27, 2018 in Lorient, France. The surface plankton and water sampling were conducted along the approximately 110,000 km long track every day and every night when the wind force did not exceed Beaufort scale 5 (Figures 1, 2).
Although the geographic location of sampling stations was predominantly set by the ship’s speed and destination, we sampled several mesoscale features such as ocean currents, gyres and upwellings. We adapted the route to cross and sample the Great Pacific Garbage Patch following the model proposed by Lebreton et al. (2018) and centered on 140W/35N. The geographic extent and the time span of the expedition with often difficult conditions including heat, humidity and sea state exposed the instruments to great constraints. In a few cases we had to temporarily halt the data acquisition of some instruments for repair or replacement (Figure 1).
The sampling was done both day and night. During the day the two surface samplers (see section: “Discrete Sampling of the Ocean-Atmosphere Interface”) were deployed at the same time, thus most of the biotic and abiotic parameters including the different size classes of plankton and neuston were acquired simultaneously. At nighttime only plankton and neuston > 300 μm was sampled and starting in Taiwan together with bioluminescence measurements.
The geographic locations of daytime net and water sampling sites are shown in Figure 2. The gaps between sampling sites were mostly due to rough sea conditions or lack of appropriate permits.
To determine the optimal sampling locations real time sea state forecasts of Mercator Ocean and Copernicus Marine Service were provided daily by Mercator Ocean at regional scale (Figure 2): the domains were updated according to the Tara Pacific itinerary. The environmental context was determined by:
(a) outputs of a global ocean circulation model assimilating satellite data and in situ profiles issued from Copernicus Marine Service (Lellouche et al., 2018) and a global ocean biogeochemical model provided by Mercator Ocean (Perruche et al., 2016),
(b) continuous data acquisition from the flow-through sensors and
(c) underway water, aerosol and net sampling.
The crew was composed of 6 sailors and 2 to 7 scientists including two resident engineers. The oceanography engineer was in charge of underway data acquisition, deck operations, and imaging of live samples, and the biology engineer was in charge of the wet lab work including sequential filtrations and sample preservation for later morphological and genetic analyses.
Sampling of the Atmosphere
Marine aerosols, defined as the aerosols present in the marine atmospheric boundary layer, consist of a mixture of natural and anthropogenic components. Processes governing marine aerosols production and deposition are still not well understood, and can vary spatially and temporally depending on environmental forcing. Therefore, we used a methodology that couple continuous measurements with interval sampling to identify patterns, diversity and possible physical and biological drivers.
Continuous Atmospheric Measurements
A meteorological station (BATOS-II, Météo France) measured air temperature, relative humidity, and atmospheric pressure at ∼7 m above sea level. Wind speed and direction was measured at ∼27 m above sea level. In October 2016 a Photosynthetically Active Radiation (PAR) sensor (Biospherical Instruments Inc. QCR-2150) was mounted at the stern of the boat (∼7 m altitude). Data were recorded continuously and binned by minute.
Continuous Sampling of Aerosol Particles
Two instruments were installed aboard Tara to measure the size distribution and abundance of atmospheric aerosol particles. A scanning mobility particle sizer (SMPS, SMPS-C GRIMM Aerosol Technik Ainring GmbH & Co. KG, Ainring, Germany) measuring particles in the size range 0.025 – 0.70 μm, and an optical particle counter (OPC; EDM180 GRIMM Aerosol Technik Ainring GmbH & Co. KG, Ainring, Germany) measuring particles in the size range 0.25 – 32 μm. Aerosols were pumped through an inlet mounted on the rear backstay of Tara. During the initial crossing of the Atlantic Ocean in May-June 2016, the inlets extended half way up the backstay (∼15 m altitude) and were relocated to the top of the backstay, near the mast (∼27 m altitude) for the remainder of the expedition. The SMPS was set to perform a full scan of particle distribution every 5 min and the OPC produced a particle size distribution every 60 s; both instruments were set to measure continuously throughout the expedition. The analysis of the size distributions will help us to identify areas of interest that will be studied thoroughly using satellite measurements, reanalysis of meteorological data and other on-board oceanic measurements.
Interval Sampling of Aerosol Particles
A separate inlet was mounted on the rear backstay of Tara, next to the one used for continuous measurements (previous paragraph). Aerosols collected from this second tubing were vacuum-pumped (Diaphragm pump ME 16 NT, VACUUBRAND BmbH & Co KG, Wertheim, Germany) through four 47 mm filter holders mounted in parallel. Three filter holders contained 0.45 μm pore size PVDF membrane filters, and the fourth filter holder contained a 0.8 μm pore size polycarbonate filter. Filters were generally changed twice a day, collecting aerosols for a period of at least 12 h at flow rates of 20–30 Lpm through each filter holder. PVDF filters were packaged in cryotubes and immediately stored into liquid nitrogen, whereas polycarbonate filters were packaged in sterile PetriSlide preloaded with absorbent pads and stored dry at room temperature. Particles from the PVDF filters will be extracted to assess microbial diversity using metagenomics and 16S and 18S rDNA amplicon sequencing. A scanning electron microscope Energy disperse X-ray analyzer (SEM-EDX) will be used to quantify the size, shape, quantity and elemental composition of all aerosols greater than 0.8 μm from the polycarbonate filters. Additionally, time-lapse cameras were installed to record the state of the ocean and clouds. See Flores et al. (accepted) for a detailed description of the aerosol measurements.
The aerosol inlet funnels were directed downward to prevent rain from entering the inlets and to not bias the sampling to one direction. To clean the data from possible contamination from the engines exhaust, the periods when the engines were turned on were recorded and the possible contamination periods detected. If increases in total aerosol concentration were identified in the transitions from sailing to engines on, the data was excluded. Additionally, contamination periods were also identified in the SMPS-OPC system as a single mode size distribution with a mode diameter of less than 0.04 μm and total particle concentrations of 105cm–3. Contamination periods were identified only for the first Atlantic crossing and were excluded from the analysis. The particle loss through the inlets was calculated using the Particle Loss Calculator (Von der Weiden et al., 2009) to assess the collection errors. Due to the differences in height of the inlet for the first Atlantic crossing (the inlet height was ∼15 m) and the rest of the expedition (the inlet height was ∼27 m), two separate calculations were done. All size distribution measurements were corrected accordingly.
Discrete Sampling of Aerosol Optical Thickness
Additionally, daily measurements of atmospheric transmittance were performed using a five channel Microtops II Sunphotometer loaned from NASA (Smirnov et al., 2006) and a radiometer system called SIMBADA (Deschamps et al., 2004) when the sun disk was clear from any cloud. These parameters are all useful to link the in situ inherent optical proprieties to satellite-based measurements, in order to validate and improve the space-based algorithms for ocean and atmospheric products.
Model and Satellite Derived Data
Mercator Ocean expertise and daily operational service provided a complete set of environmental parameters in the form of oceanographic maps and data from Copernicus Marine Service and Mercator Ocean prediction models including various physical parameters, from the surface to 50 m depth with a spatial resolution of 1/12° (Lellouche et al., 2018), and chemical and biogeochemical parameters, from the surface to 100 meters deep, with a 1/4° spatial resolution (Perruche et al., 2016). Reanalyses products from those models will be updated at latter stage.
Various satellites derived environmental parameters (e.g., SST, SSS, Chl a, productivity and other) will also be retrieved from NASA and Copernicus Marine Service databases.
Underway, Continuous Sampling of Surface Water
Surface seawater was pumped continuously through a hull inlet located 1.5 m under the waterline using a membrane pump (Shurflo), circulated through a vortex debubbler, and distributed to a number of flow-through instruments (Figure 3). The instruments comprise a thermosalinograph (TSG, SeaBird Electronics SBE45/SBE38), a spectrophotometer (WETLabs ACS), a CDOM fluorometer (WETLabs WSCD), a backscattering sensor (WETLabs ECO-BB3), and an Equilibrator Inlet Mass Spectrometer [EIMS] (Pfeiffer Vacuum Quadrupole 1–100 amu). The TSG was set to log time in coordinated universal time (UTC) synchronized with the ship’s GPS. All instruments were then synchronized to the TSG.
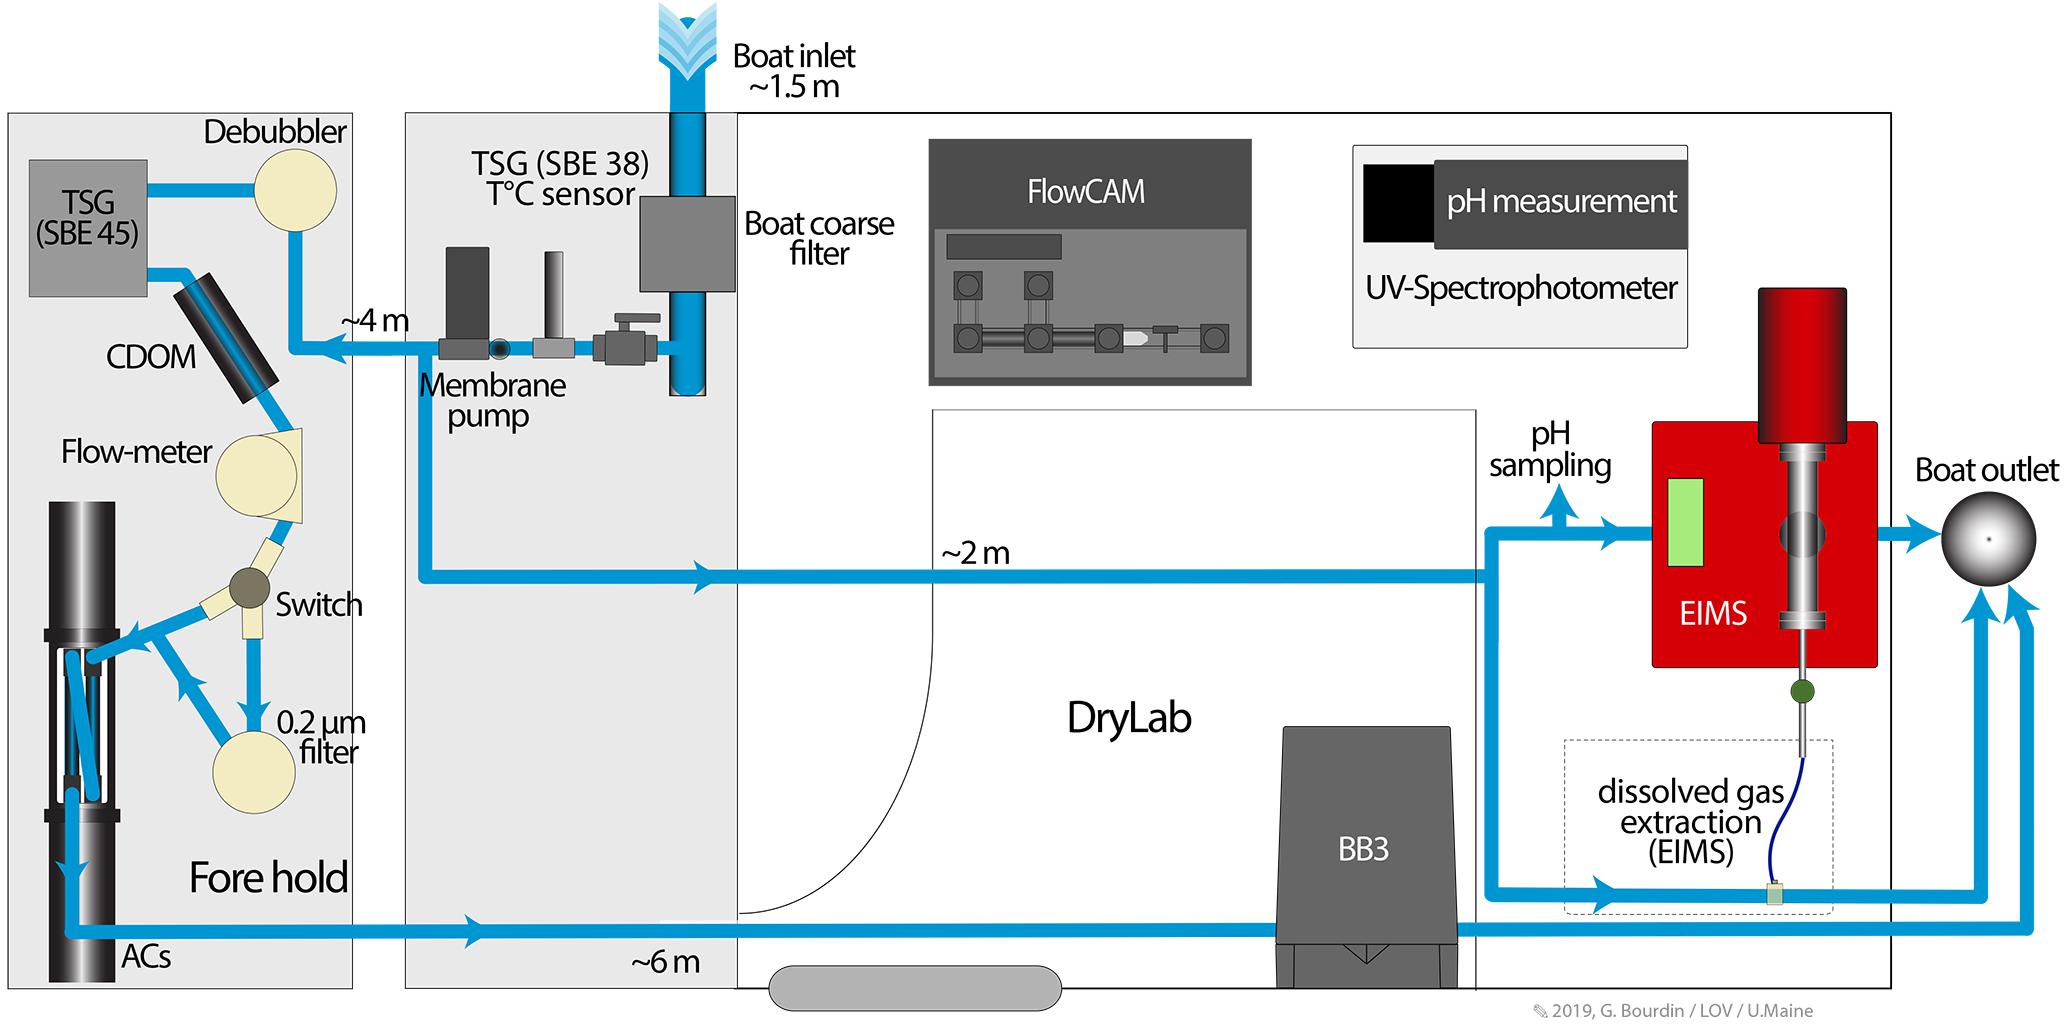
Figure 3. Schematic diagram of the underway, continuous sampling system, showing the setup of the various flow-through instruments and the distance between the water intake and each instrument. The water flow is shown in blue. The FlowCam and the UV-spectrophotometer were installed in the drylab for live imaging of microplankton and pH measurements.
Temperature and Salinity
The thermosalinograph (TSG, Seabird SBE45) was mounted 5.5 m downstream from the intake and measured sea surface temperature and conductivity at a sampling frequency of 0.1 Hz. A second temperature sensor (SBE38) was mounted 1.5 m downstream from the intake, upstream of the pump and the debubbler. Temperature and salinity measurements were quality checked throughout the expedition. The measurement errors of temperature are on the order of 0.01°C, whereas salinity records usually had uncertainties between 0.01 and 0.05. Salinity measurements were corrected after the analysis of unfiltered seawater samples and validated against Argo floats data in the vicinity of Tara. A systematic collocation of close Argo profiles in distance/time (±100 km and ±5 days) allowed a point-by-point comparison. The Argo data used were from 5 m depth while Tara data were from 1 m but excluding regions of strong vertical stratification (not sampled during Tara Pacific) the difference was negligible. The sensors were recalibrated by SeaBird at the end of the expedition. Their drifts were negligible.
Net Community Production
The Equilibrator Inlet Mass Spectrometer (EIMS, Cassar et al., 2009) was mounted 3.5 m downstream from the intake and provided high-resolution measurements of the ratio of dissolved oxygen and argon (i.e., O2/Ar). While oxygen and argon have a similar solubility in seawater, argon is biologically inert, whereas oxygen is involved in biological processes such as photosynthesis and respiration. The O2/Ar ratio is therefore a measure of oxygen saturation associated with biological processes (i.e., biological O2 saturation), providing an estimate of net community production (NCP) (Cassar et al., 2009). As described in Cassar et al. (2009), errors in the biological oxygen anomaly as measured with the EIMS are on the order of ±0.3%. The uncertainty in NCP calculations, c. 30%, is mostly associated with the wind speed parameterization of the gas exchange velocity. However, additional biases may be associated with effects of a lack of steady state and vertical mixing on the biological oxygen anomaly at the ocean surface (see Cassar et al., 2014).
Inherent Optical Properties (IOPs)
High frequency (1–4 Hz) measurements of IOPs were performed to derive numerous biogeochemical parameters. A WetLabs ACS (Figure 3) measured hyperspectral (∼4 nm resolution) attenuation and absorption in the visible and near infrared; a WetLabs BB3 mounted in a ∼4.5 L BB-box measured the volume scattering function (VSF) at 3 wavelengths (470, 532, 650 nm) and a WetLabs WSCD measured fluorescent colored dissolved organic matter (CDOM). We used a calibration independent technique (Slade et al., 2010) to obtain particulate absorption (ap), attenuation (cp), and particulate backscattering (bbp) by subtracting measurements made without filter by measurements with a 0.2 μm filtered seawater, switching between those periods was done every 60 min (50 min total water, 10 min filtered). Instruments were cleaned and filters were changed weekly or before starting a new leg. The datasets were manually checked, periods removed were mainly associated with saturated sensors, accumulation of particles in the BB-box, extended periods without filtered times (failure of switching), and strong changes in flow rate. The quality-checked IOPs can be used to retrieve proxies of phytoplankton biomass (chlorophyll a, with a detection limit of 0.03 mg m3 and a maximum relative error of 38%, see Boss et al., 2013) and phytoplankton carbon (Graff et al., 2015) concentrations, particulate organic carbon (with about 20% of variability due partly to the phytoplankton community composition; see Cetinić et al., 2012), relative FDOM (fluorescent dissolved organic matter), with a relative error ranging between 4 and 40% depending on CDOM concentration as a proxy for dissolved organic matter concentrations (Belzile et al., 2006), particle size index (γ, 11% of variability as given in and Slade and Boss, 2015), and major phytoplankton pigments (30–50% of variability; Chase et al., 2013, 2017). These parameters provide key information about ecosystem structure, function (Falkowski et al., 1998, 2003; Le Quéré et al., 2005; Hood et al., 2006), and carbon export (e.g., McCave, 1975; Eppley and Peterson, 1979; Falkowski et al., 1998; Buesseler et al., 2007).
pH
Seawater was collected once a week from the outlet of flow-through to determine pH. Surface seawater pH on total scale was determined using meta-Cresol Purple, a precise pH indicator dye (Clayton and Byrne, 1993; Dickson et al., 2007). Surface seawater samples were acclimated to 25°C for 2–3 h in closed, 5-ml polypropylene tubes. Absorbance at specific wavelengths was read, before and after of 40 μL meta-Cresol Purple dye addition using an Agilent Technologies Cary 60 UV-Vis Spectrophotometer equipped with an optical fiber. TRIS buffer solutions (Nemzer and Dickson, 2005) were measured regularly along the cruise to validate the method. This spectrophotometric pH measurement is about ±0.001 pH units precise (Dickson et al., 2007). However, a bias of pH measurements can occur if the temperature is not well controlled during the spectrophotometric pH reading. For the Tara Pacific expedition, due to often-difficult conditions, analytical uncertainty on pH values have been reassessed to ±0.01 pH units.
Discrete Sampling of the Ocean-Atmosphere Interface
Two sampling devices were developed to collect seawater and organisms from the ocean-atmosphere interface while sailing at a maximum speed of 9 knots. The “Dolphin” sampler was designed to collect seawater and neuston of size < 2000 μm (Figure 4), whereas the “High Speed Net” (HSN) was designed to collect plankton and neuston of size > 300 μm (Figure 4). The two devices are made of stainless steel and have the same front aperture (4 cm wide and 40 cm high). The back end of Dolphin is fitted with a 4 cm diameter reinforced tubing connected to a large volume industrial peristaltic pump (max flow rate = 3 m3 h–1) on the deck, whereas the HSN is 200 cm long, equipped with a nytrel net of 300 μm mesh size and with a cod-end collector. A mechanical flowmeter is mounted in the inlet opening of the HSN net. The two sampling devices were deployed simultaneously, the Dolphin near the deck for ∼ 120 min and the HSN for 60–90 min, 50 – 60 m behind the ship on starboard, to avoid the wake (Figure 4). Their detailed description will be given elsewhere.
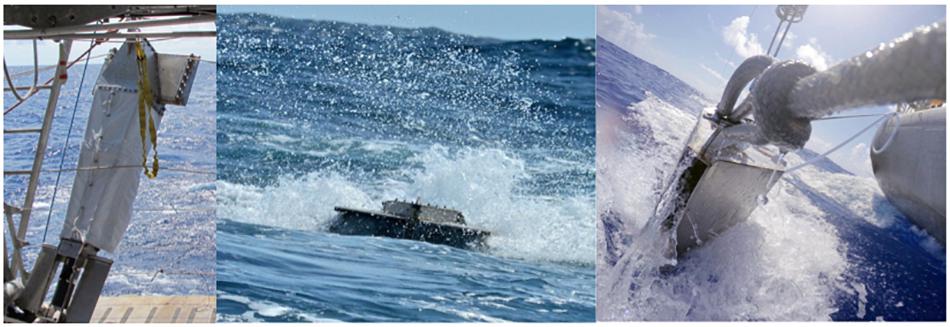
Figure 4. Surface net and water samplers. The High Speed Net on board and in work (left and middle), and the “Dolphin” (right) deployed simultaneously. The Dolphin is connected to a large volume peristaltic pump installed on the deck for surface water sampling (Photos from left to right F. Lombard, F. Aurat, J.M. Flores.)
In addition to the high-speed sampling devices, near the islands and in the Great Pacific Garbage Patch a Manta net was used for surface sampling of neuston, plankton and microplastics (Figure 5). The Manta net used during Tara Pacific expedition had a 16 × 60 cm opening and a 400 cm long nytrel net of 330 μm mesh size. A Mechanical Flow Meter was mounted in the inlet opening. The maximum towing speed of the Manta net is rated to 3 knots, speed which allows for a wider mouth opening, six times that of the HSN.
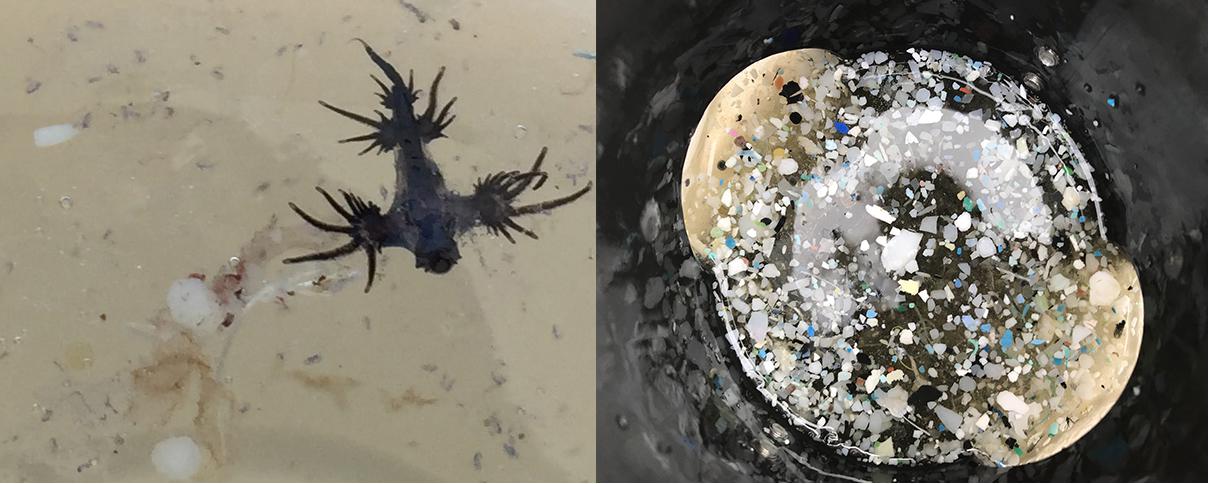
Figure 5. Example of freshly collected neuston, plankton and plastic by the HSN and Manta net. (Left) Half of a daytime HSN collector content diluted in 1 L of seawater during the Japan – Hawaii leg. The pictured organism is a mollusk Glaucus sp., the blue dots are Pontelidae copepods and the white particles are microplastic. (Right) Microplastics in the collector of a Manta net deployed in the Great Pacific Garbage Patch. (Photos F. Lombard and M. L. Pedrotti).
The water inlet design of the HSN decreases the pressure of the entering water flux. Soft-bodied plankton species are more damaged when sampled by the HSN at 5 to 9 knots speed than crustaceans, but are still identifiable (Figures 5, 8). When comparing samples from the two nets, community composition and normalized biovolume size spectra are similar.
Chemical preservation of samples was done outside the wetlab (Figure 6, left side, facing the stern) and seawater pumped from the Dolphin was collected and pre-filtered on the outer wall of the wetlab as shown in Figures 6, 7 (right side, facing the bow). Chemical preservation of samples was done outside the wetlab (Figure 6, left side, facing the stern). Inside the wetlab, two filtration systems were used, one for 142-mm-diameter filters, and the second for 25- and 47-mm-diameter filters. The first system was used for the serial filtrations of small size fractions (<0.22, 0.22–3, and 3–20 μm) for genomic analyses. The second system was used to concentrate particulate matter in the large size fractions (20–2000 and 300–2000 μm) for genomic analyses, and to collect material on glass fiber filters (0.7 μm) for pigment analyses.
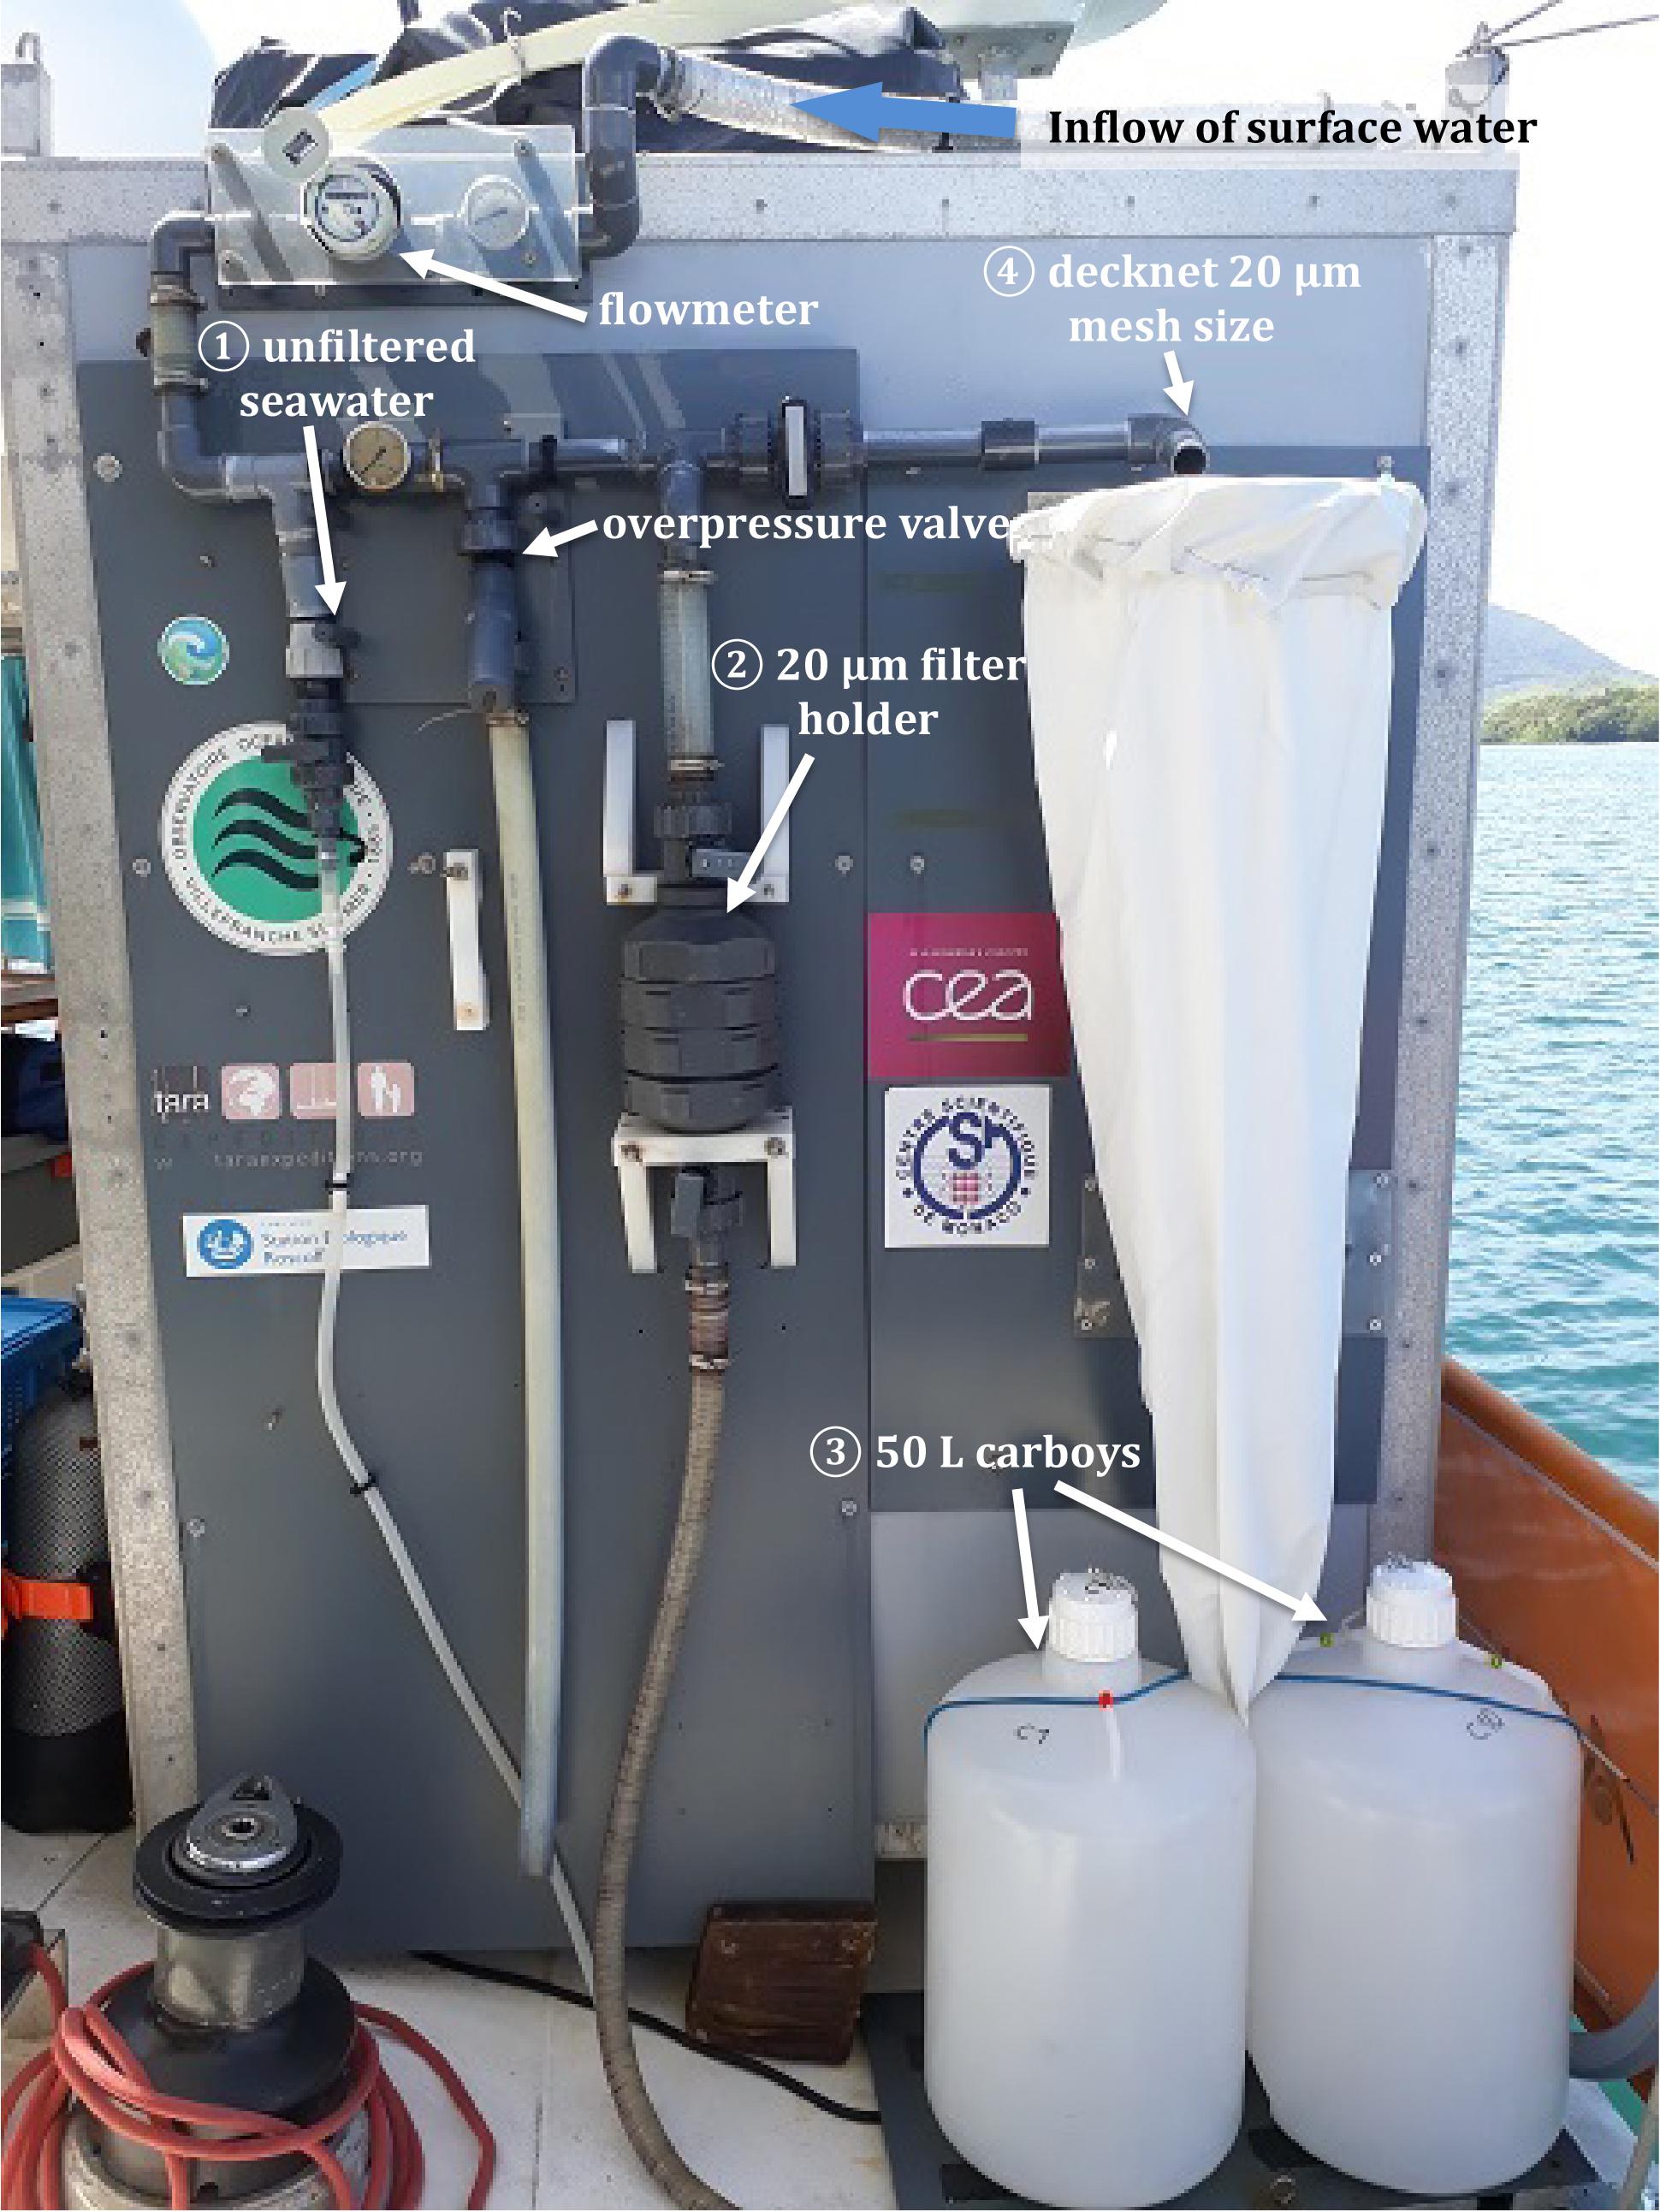
Figure 6. Surface water from the Dolphin was distributed to different outlets installed on the external wall of the wetlab. (1) Unfiltered sea water, used mainly for biogeochemical sampling; (2) pre-filtered seawater on a 20-μm-pore-size filter mounted inside a 142 mm diameter filter holder; (3) 50 L carboys for the collection of 20 μm prefiltered seawater; (4) 20-μm-mesh-size decknet. Water was collected from one outlet at a time and the volume of water was measured using a flowmeter; in the case of excess pressure, water was evacuated through an overpressure valve.
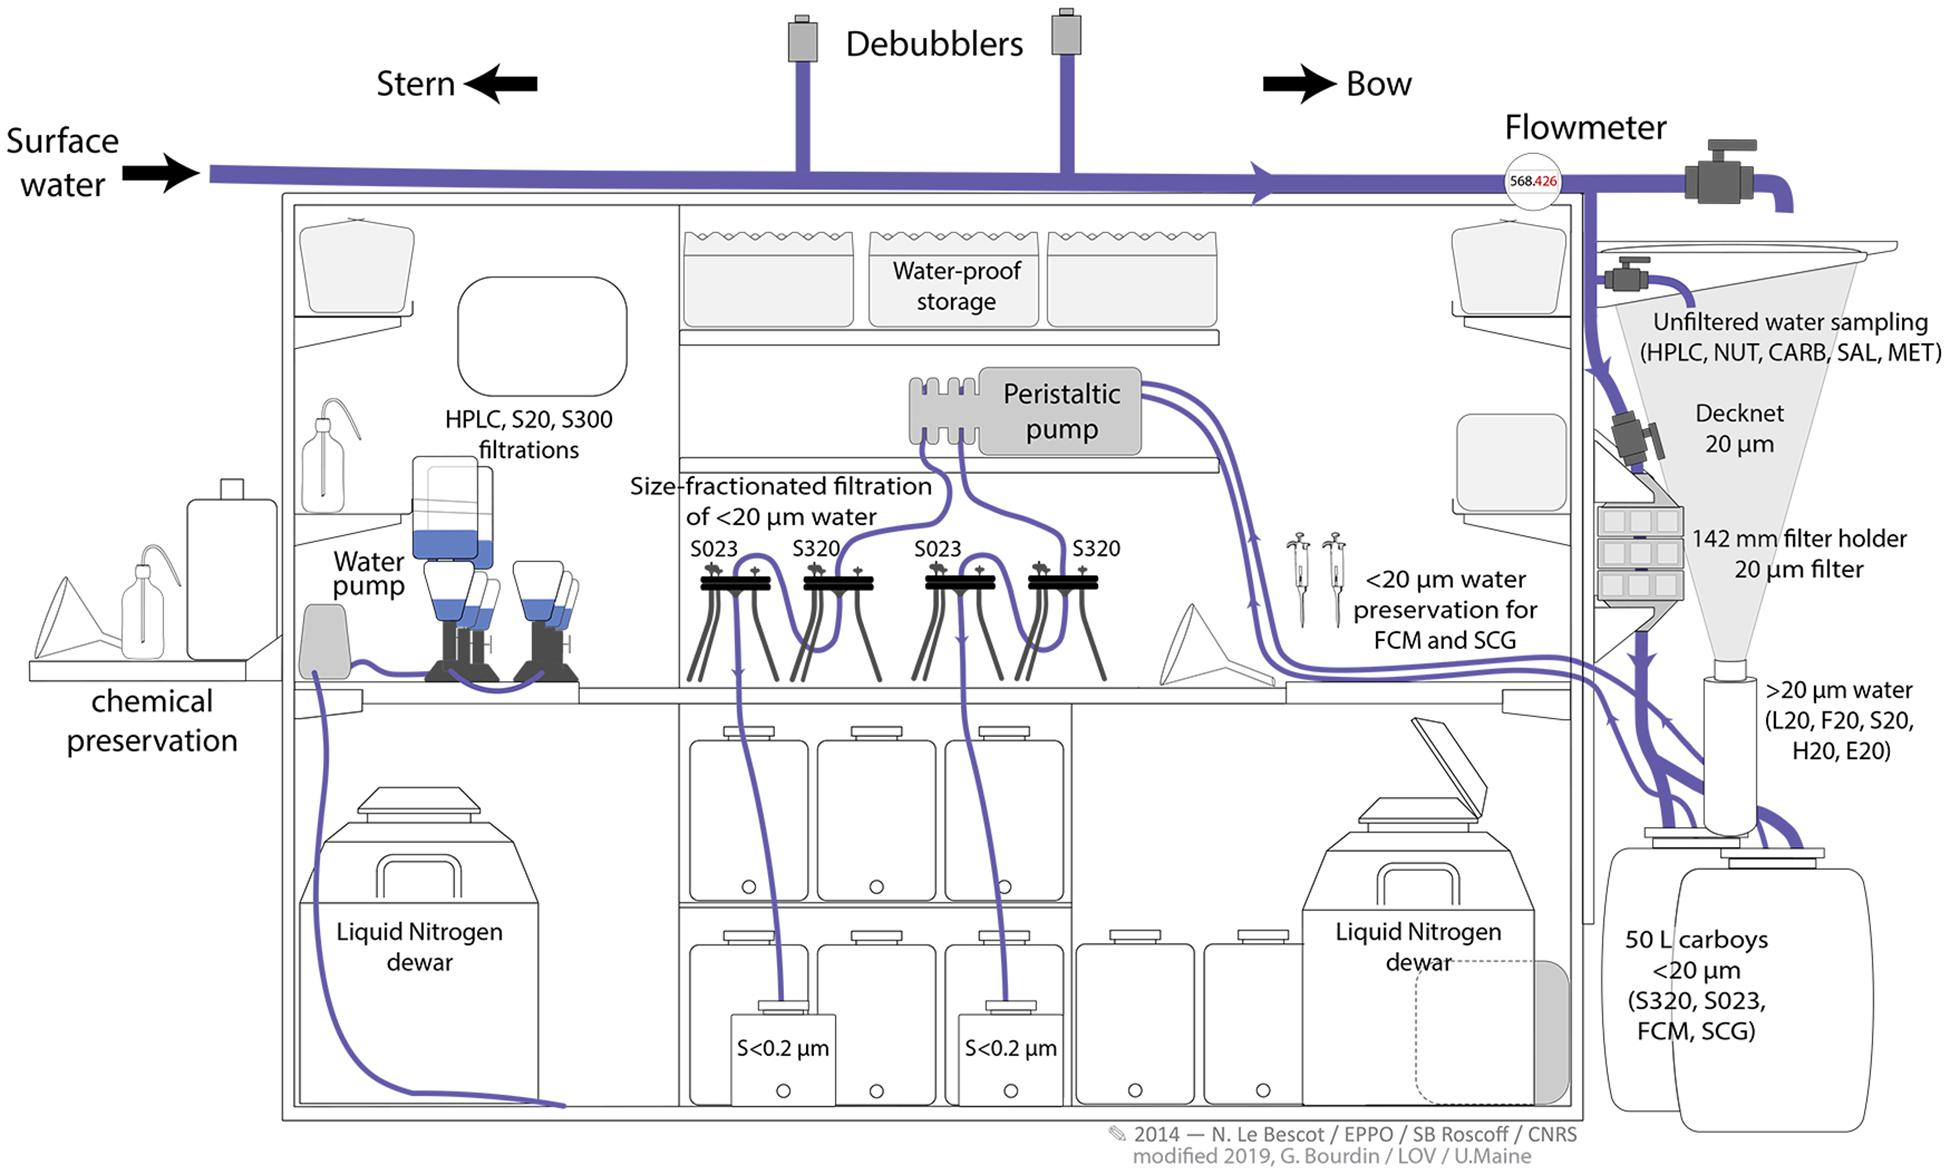
Figure 7. Schematic diagram of the wetlab on board Tara, modified from Pesant et al. (2015). Note the optimization of the inner space and outer surfaces of the wetlab. Two filtration systems, one for filters of 142 mm, the second for filters of 25 and 47 mm diameters were installed inside the wetlab. The outer wall facing the bow was adapted for the distribution of the surface pumped water into the circuitry as described in Figure 6. The wetlab wall oriented toward the stern was used for chemical preservation of samples.
Finally, an extendable carbon-fiber pole equipped with a sturdy PVC bottle holder was used to sample surface seawater uncontaminated by the ship. The pole was hand-held off the bow of the ship while sailing at up to 9 knots. The uncapped bottle attached at the end of the pole was rinsed 4–5 times with surface seawater, then filled, and re-capped using polyethylene gloves.
Macronutrients
Seawater was collected from the unfiltered seawater circuitry [Figure 6(1)] connected to the Dolphin at each sampling site to determine the nitrate (NO3), nitrite (NO2), phosphate (PO4) and silicate (Si(OH)4) concentrations. Seawater was immediately filtered through a 0.45 μm pore size cellulose acetate membrane with a syringe, dispensed into duplicate sterile 20 mL polyethylene vials, and stored at −20°C until analysis at the Laboratory of Microbial Oceanography (LOMIC-UMR 7621) in Banyuls-sur-Mer, France. The precision of the measurements and the detection limits respectively were ±0.02 and 0.02 μM for nitrate (NO3), ±0.005 μM and 0.01 μM for nitrite (NO2), ±0.005 and 0.01 μM for phosphate (PO4), and ±0.01 μM and 0.03 μM for silicate (Si(OH)4). The concentrations were measured by colorimetry on a continuous flow Seal-Bran Luebbe® AutoAnalyzer III (Aminot and Kérouel, 2007).
Carbonate Chemistry
Unfiltered seawater was collected once a week from the seawater circuitry [Figure 6(1)]. Glass bottles (500 mL) were filled with unfiltered seawater, poisoned with Hg2Cl2, and stored on board at room temperature until later analysis at the SNAPOCO2 facility at Sorbonne University in Paris, France. Total Alkalinity (TA) and Total Inorganic Carbon (TC) were measured, and all carbonate chemistry parameters were computed following the SNAPOCO2 protocol (Edmond, 1970; DOE, 1994). External reproducibility obtained for standards solutions for both parameters, TA and TC, is about 3 μmol/kg (0.15%). Deduced seawater pH values will be compared to the underway surface seawater pH measurements previously described.
Trace Metals
The task of quantifying extremely low levels of trace metals in seawater is complicated by sea vessels being a source of metal contamination, and therefore specialized oceanographic equipment and sampling procedures have been developed for collection in the water column (Measures et al., 2008). However, these procedures are typically specific to crane vessels, and sampling onboard the Tara schooner therefore required a basic surface-sampling protocol with similar metal-free handling precautions. Unfiltered seawater was collected using a custom-made hand-held bow-pole at each sampling site to determine total dissolvable iron (Fe), zinc (Zn), cobalt (Co), copper (Cu), manganese (Mn), nickel (Ni), and lead (Pb). Samples were collected off the bow of the boat while oriented toward the wind to minimize contamination, and polyethylene gloves were used during bottle handling. Low-density polyethylene (LDPE) bottles (125 mL) were cleaned on land by soaking overnight in 1% Citranox detergent, rinsed thoroughly, then soaked for at least 1 week in 10% HCl, followed by at least 8 rinses in ultrapure water, and individually enclosed in plastic bags to reduce contamination during transport and storage. Samples were stored in separate plastic Ziploc bags on-board at ambient temperature in the dark. At the University of Southern California (USC), samples were stored and processed in a class −100 clean room. Seawater was acidified with 0.1% 12 N HCl for 4–6 months to liberate the ‘total dissolvable’ metals (Sedwick et al., 2011). This approach captures total dissolved metals which might have precipitated during storage, in addition to acid labile particulate metals. However, this method does not dissolve or include metals from refractory particles (Sedwick et al., 2011). 15 mL subsamples were then analyzed. Samples were amended with a mixture of isotope spikes to facilitate analysis by isotope dilution, concentrated and purified from major seawater salts using a seaFAST system, and analyzed for elemental concentrations using an Element2 ICPMS. Samples were run alongside GEOTRACES standards to confirm accuracy, with concentrations within the community consensus range. The trace metal concentrations were found to have an average error of 5% (Supplementary Figure 1).
Pigments
Unfiltered seawater was collected with the Dolphin for the determination of pigment concentrations. Two liters of seawater were filtered on a 25-mm-diameter, 0.7-μm-pore-size glass fiber filter (Whatman GF/F). Filters were immediately stored in liquid nitrogen until later analysis by High Performance Liquid Chromatography for pigment analysis (Ras et al., 2008) at the Laboratoire Oceanographique in Villefranche-sur-Mer, France.
Bioluminescence
Stimulated bioluminescence was measured at night, starting in Taiwan (2017/04/30), using an Underwater Bioluminescence Assessment Tool, UBAT (WETLabs). The surface water was pumped from the Dolphin at a rate of ∼50 L/min into a 5 L open reservoir that was continuously overflowing. The U-BAT was pumping water from this reservoir at a flow rate of ∼20 L/min and measured the bioluminescence for ∼50 min while the HSN net was deployed at the stern.
Neuston and Plankton in the <20 μm Size Fraction
Seawater was collected at each sampling site from the Dolphin and prefiltered through a 20 μm-pore-size nylon membrane mounted in a 142-diameter filter holder installed on the wetlab’s outer wall [Figures 6(2), 7]. The filtrate was used to prepare the samples of the 3–20, 0.22–3, and <0.22 μm size fractions. Two replicates of this filtrate (1.5 mL) were fixed with Glutaraldehyde (0.25% final volume) and Poloxamer (0.1% final volume) for 15 min at 4°C and then flash-frozen for later analyses using a FACS Canto II Flow Cytometer equipped with a 488 nm laser (Marie et al., 1999) at the Station Biologique in Roscoff, France. Two replicates of 4 mL filtrate were mixed with 600 μL of 48% betaine aliquot and preserved in liquid nitrogen for later single cell genomics.
Two 50 L replicates of 20 μm prefiltered seawater were size fractionated in the wetlab into the 0.22–3 μm and 3–20 μm fractions using 142-mm-diameter, stainless-steel filter holder “tripods” (Millipore) and a peristaltic pump (Masterflex). Each replicate was filtered through a 142-mm-diameter, 0.22-μm-pore-size polyethersulfone Express Plus membrane filter and a 142-mm-diameter, 3-μm-pore-size polycarbonate membrane filter placed on top of a woven mesh spacer Dacron 124 mm (Millipore). The two filters were mounted in series to collect neuston and plankton in the 0.22–3 and 3–20 μm size fractions. To ensure that at least one of the two replicates yielded high quality RNA for transcriptomics analysis, the filtration of the first replicate was stopped after 15 min, whereas the second was allowed to go on for up to 60 min. Filters were packaged into 5 mL cryovials and preserved in liquid nitrogen immediately after filtration, until later sequencing at Genoscope, CEA, France.
Two 10 L replicates of the previously 0.22 μm filtered seawater were flocculated using iron chloride solution at room temperature for 1–12 h. The flocculated particulate matter containing viruses (John et al., 2011) was concentrated onto a 142-mm-diameter, 1-μm-pore-size polycarbonate membrane filter placed on top of a woven mesh spacer Dacron 124 mm (Millipore). Filters were packaged in 5-mL cryotubes and stored at +4°C for later sequencing analysis at Ohio State University in Sullivan lab.
Neuston and Plankton in the 20–2000 μm Size Fraction
The seawater pumped from the Dolphin was prefiltered through a 2000 μm metal sieve and concentrated with 20 μm decknet suspended on the outside wall of the wetlab [Figures 6(4), 7]. The volume of water concentrated in the net was measured using a flowmeter and, after 60–120 min of continuous pumping, the net was rinsed thoroughly from the outside with filtered seawater (<0.22 μm). The sample concentrated in the cod end was diluted to 2 L and divided into 6 subsamples. (1) 4 × 250 mL were filtered onto a 47 mm diameter, 10-μm-pore-size polycarbonate membrane filter, packaged in 5 mL cryotube and stored in liquid nitrogen for later sequencing analysis, (2) 250 mL volume concentrated on a 20 μm mesh was preserved with acidic lugol in a 50 mL Falcon tube and stored at 4°C for enumeration and identification of microplankton using traditional inverted microscopy as detailed in Villar et al. (2015), (3) 45 mL was preserved with 5 mL of buffered formaldehyde (4% v/v) in a 50 mL Falcon tube and stored at room temperature for enumeration and identification of microplankton using traditional inverted microscopy as detailed in Malviya et al. (2016), (4) 250 mL concentrated on a 20 μm mesh was resuspended in a 50 mL Falcon tube with pure ethanol. After 24 h the sample was concentrated again and preserved in a 15 mL Falcon tube with pure ethanol for genomic and morphological analyses, (5) 45 mL from the 2 L cod-end content was transferred to a 50 mL Falcon tube and preserved with 5 mL aliquot of buffered 1% monomeric formaldehyde and 0.25% EM grade glutaraldehyde (Marie et al., 1999) for later environmental High-Content Fluorescent Microscopy analysis (eHCFM; Colin et al., 2017), (6) 250 mL was sieved through a 200 μm filter and the size fraction between 20 and 200 μm was analyzed live on-board using the FlowCam imaging system (Fluid Imaging Inc.; Sieracki et al., 1998).
In the Great Pacific Garbage Patch, two decknet (20–500 μm size fraction) samples were collected and preserved in buffered formaldehyde (4%v/v) and stored at room temperature for later analysis of plastic fragments.
Neuston, Plankton and Microplastics in the >300 μm Size Fraction
Organisms and floating debris of size >300 μm were collected using the HSN and additionally in the vicinity of Pacific islands and in the Great Pacific Garbage Patch (GPGP) using the Manta net.
The daytime HSN cod-end was resuspended in 2 L of filtered seawater and split into two equal subsamples. The first was concentrated and preserved in a 250-mL plastic bottle with 25 mL tetraborax buffered formaldehyde (4%v/v) and stored at room temperature for later analysis with the ZooScan imaging system (Figure 8, Gorsky et al., 2010). The second subsample was sieved through a 2000 μm metal sieve and the filtrate, 300–2000 μm size fraction, was concentrated on four 47 mm diameter, 10 μm pore size polycarbonate membrane filters, packaged in a 5-mL cryotube and stored in liquid nitrogen for later sequencing analysis.
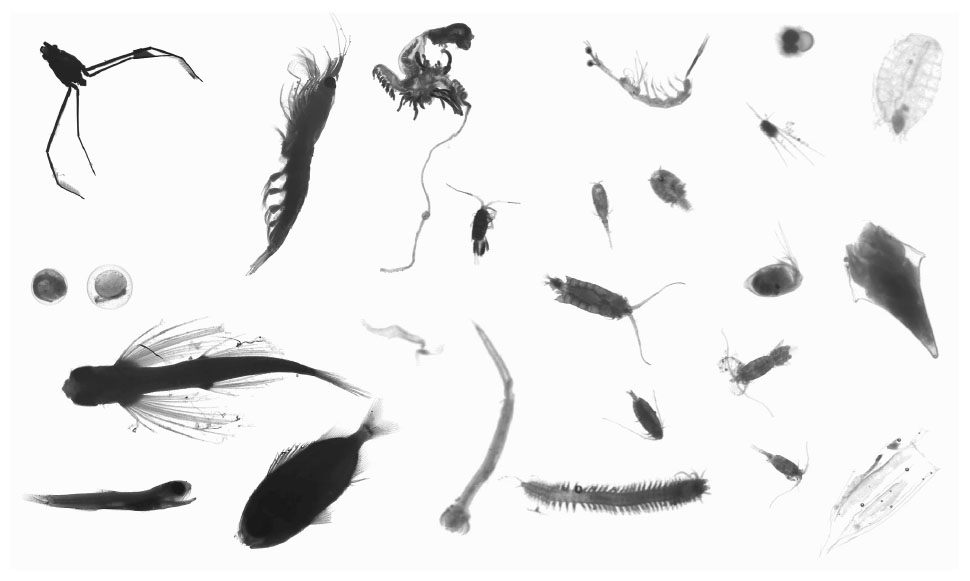
Figure 8. Zooscan vignettes of organisms from HSN tows, including fish, fish eggs, insect, crustaceans, larvacean, chaetognath, siphonophore, salp, mollusc, worm, echinoderm larvae and protists.
Fragments of plastic collected on the metal sieve (>2000-μm size fraction) were packaged individually in cryovials and stored in liquid nitrogen for genomic analysis of organisms attached to the fragments.
The night-time HSN cod-end was not split but entirely preserved with tetra borax buffered formaldehyde (4%v/v) for imaging and taxonomic analyses. The ZooScan analysis is not destructive (Figure 8), the samples remain entire and are stored in the Collection Center for Plankton in Villefranche-sur-Mer, France.
Genomic Protocols
Genomic analyses from all size fractions are conducted at the Genoscope, CEA, France. The protocol applied for nucleic acid extractions from the size fractions < 0.22, 0.22–3 μm, 3–20 μm, 20–2000 μm, and 300–2000 μm is based on simultaneous extraction of DNA and RNA as previously described (Alberti et al., 2017).
DNA extracts are sequenced to analyze metagenomes and amplicons for eukaryotic (18SV9) and prokaryotic (16SV4V5) metabarcoding. The already analyzed DNA data show that 99% of the extracts are above the 500 ng threshold that allowed library construction with the standardized procedures used in the Tara Oceans project (Supplementary Figure 2). Symbiodiniaceae diversity (ITS2) (LaJeunesse et al., 2018) will be analyzed for the 3–20 μm size fraction only according to Hume et al. (2018, 2019).
RNAs extracts will be sequenced to analyze metatranscriptomes using different cDNA synthesis protocols depending on the size fractions (Alberti et al., 2014; Carradec et al., 2018).
Imaging Methods
The imaging methods used to study the entire size range of the surface community structure include standard inverted microscopy, high-throughput confocal imaging, FlowCam and ZooScan imaging for quantitative sorting and classification of respectively micro- and zooplankton, and flow-cytometry to monitor bacteria and small protists (Figure 9). The FlowCam and ZooScan methods allow a rapid classification of organisms to order, family or functional type levels, and sometimes to the species level. Validation by experts allows a finer taxonomic tuning. Preserved samples of micro- and zooplankton including the neuston are stored at the CCPV (Collection Center of Plankton at Villefranche-sur-Mer, France1) managed by the Laboratoire d’Oceanographie de Villefranche (LOV), France and EMBRC-France (European Marine Biological Resources Center), and are available for detailed taxonomic work to the scientific community.
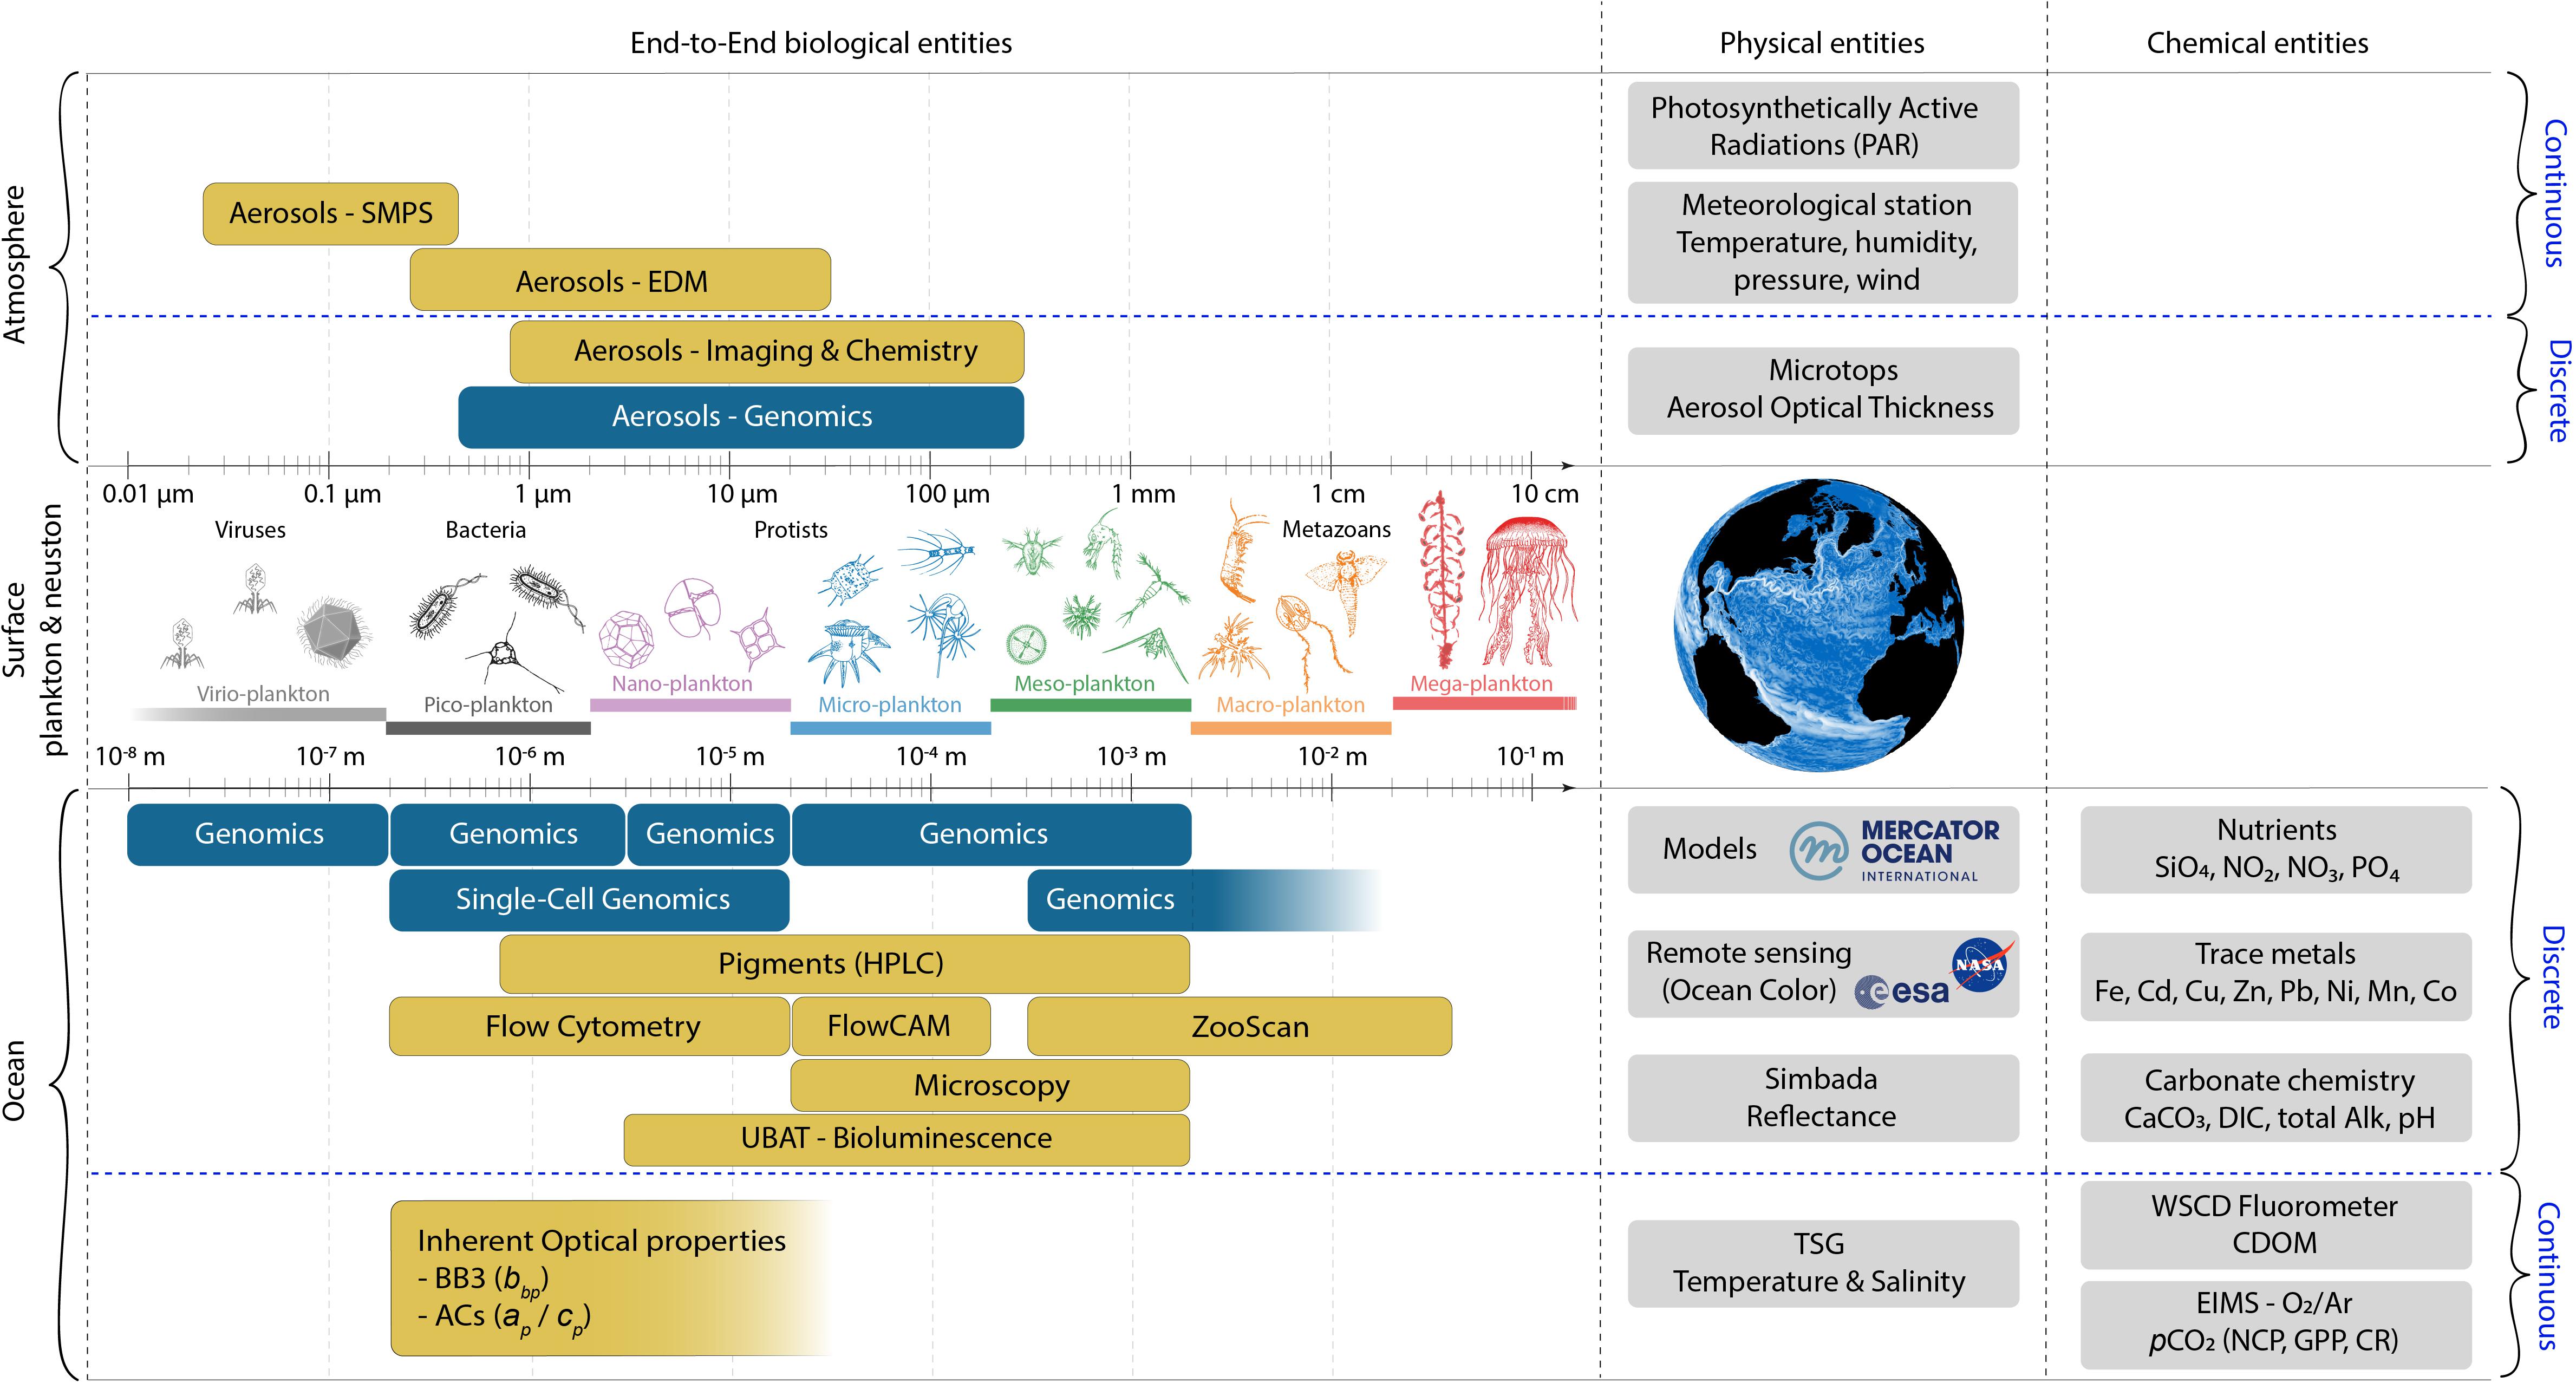
Figure 9. Schematic summary of the systems approach and “end-to-end” plankton sampling adopted during the Tara Pacific expedition. The size spectrum and classification of entities that characterize the ocean-atmosphere interface are depicted in the left section. The various devices and protocols used to sample the atmosphere (top section) and the ocean surface (bottom section) are shown, indicating which, biological physical or chemical entities are targeted by each protocol.
Images generated by the Flowcam and the ZooScan are processed using the same Zooprocess software and the classification of each object is predicted automatically by the Quantitative Imagery Platform and validated with taxonomy experts using the web-based Ecotaxa Application (Picheral et al., 2017), a tool for the taxonomic classification of images which offers the world’s largest database of classified planktonic images2 following the UniEuk taxonomic tree3.
Data Management
Tara Pacific endorses the FAIR principles for scientific data management (Wilkinson et al., 2016) as well as ethical and responsible use of data. With a few exceptions, all physical samples were preserved on board Tara and sent back to partner laboratories for subsequent analysis. Controlled vocabularies describing sampling devices and sample preparation protocols were used throughout the expedition to capture provenance metadata on customized log sheets, and samples were assigned unique identifiers to facilitate their traceability (Table 1). Rich environmental context will be generated for each sample, using in situ measurements as well as climatology and remote sensing data obtained from NASA Ocean Color, the European Copernicus Marine Service and Mercator Ocean products. Legal documents regulating the collection, export and import of samples, as well as links to the CBD’s access and benefit-sharing clearinghouse4 will be provided for each sample as a first step toward ethical and responsible use of the Tara Pacific data. The detailed registry of all samples, including their provenance, environmental and legal context, is curated manually using simple semantics that enables machine and human-readable data discovery services. The structure of all data sets and metadata will be consistent and interoperable with that of the Tara Oceans expedition, with improvements when needed. Genomics data will be deposited in free, open access at the European Nucleotides Archive5, and environmental data will be deposited in free, open access at PANGAEA6. The two archives will be interlinked via sample provenance metadata registered at BioSamples7.
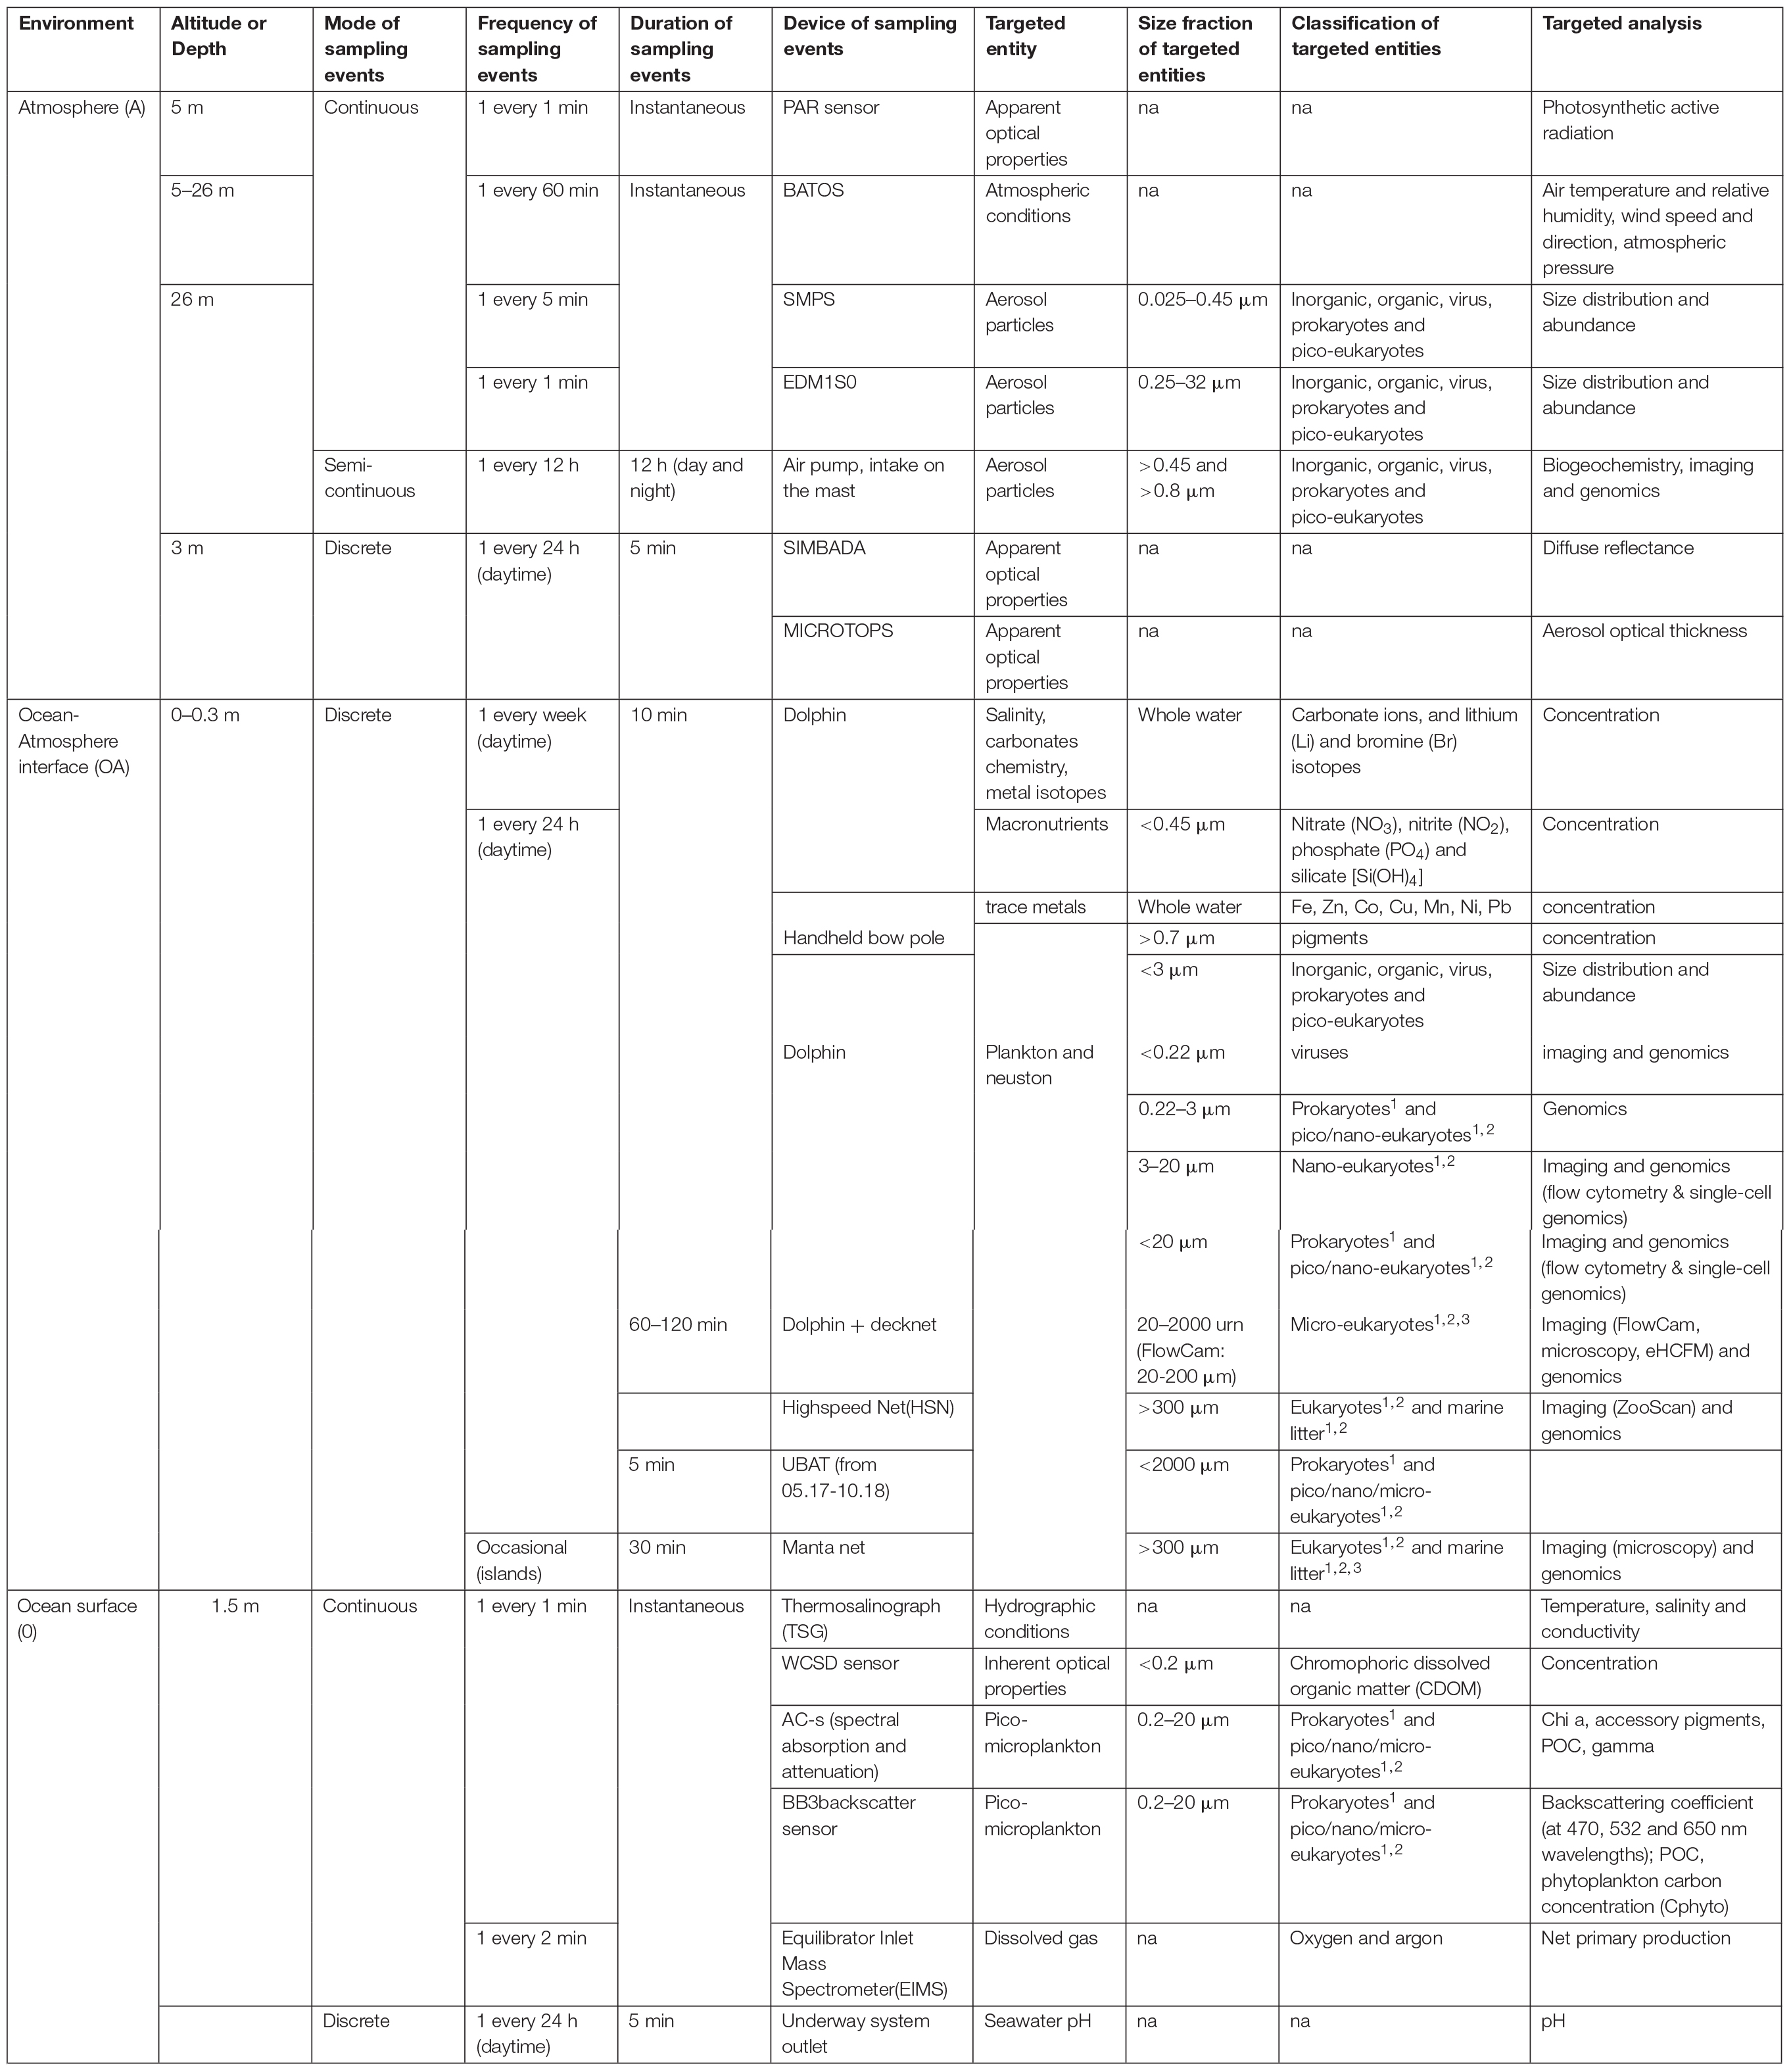
Table 1. Summary of the Tara Pacific “ecosystemic sampling of the ocean-atmosphere interface” protocols, targeted entities and analyses of samples from above, below and the sea-surface.
Anticipated Results and Discussion
Wide-scale integrated studies such as the Tara Pacific expedition are rare. In order to allow for cross-comparison of diverse environments, the protocols have to be consistent. The major constrain we encountered during Tara Pacific was the lack of ship-time available for work at “stations”. This constraint forced us to develop two high-speed sampling devices. The High Speed Net for the sampling of plankton and neuston > 300 μm and the “Dolphin” for surface water pumping.
The first high-speed zooplankton samplers were developed in the early 1900s, and the best known is the Hardy continuous plankton recorder (see the review in Wiebe and Benfield, 2003), the latest is the AVANI trawl (Eriksen et al., 2018). However, the constraint of deployment and retrieval of the instruments at cruising speed forced us to design a robust, relatively small and user-friendly instrumentation. Hull and deck pumping were also used in the past (Harris et al., 2000), mainly for chemistry and phytoplankton studies. Here we present the first system, to our knowledge, adapted for discrete sampling of the whole, end-to-end, planktonic ecosystem, from viruses to metazoa, deployed and recovered at cruising speed (5–9 knots). This system can be easily adapted to ships of different size and propulsion.
The combined deployment of the High-Speed Net (HSN) and the Dolphin allowed us without major modifications of the cruise timing to reach a reasonable sampling density and collect the full set of parameters (Figure 2) nearly every cruising day and almost every night (Figure 10). Several large-scale hydrological features were sampled, including currents (Kuroshio, East Australian current, California and Equatorial currents, Gulf-Stream, North Atlantic drift, Labrador current), gyres (North and South Pacific, North Atlantic) and upwellings (equatorial, California). Moreover, the study of Pacific coral reef ecosystems during the Tara Pacific expedition (Planes et al., 2019) provided a rare opportunity to study small-scales hydrologic features such as the wake of Pacific islands.
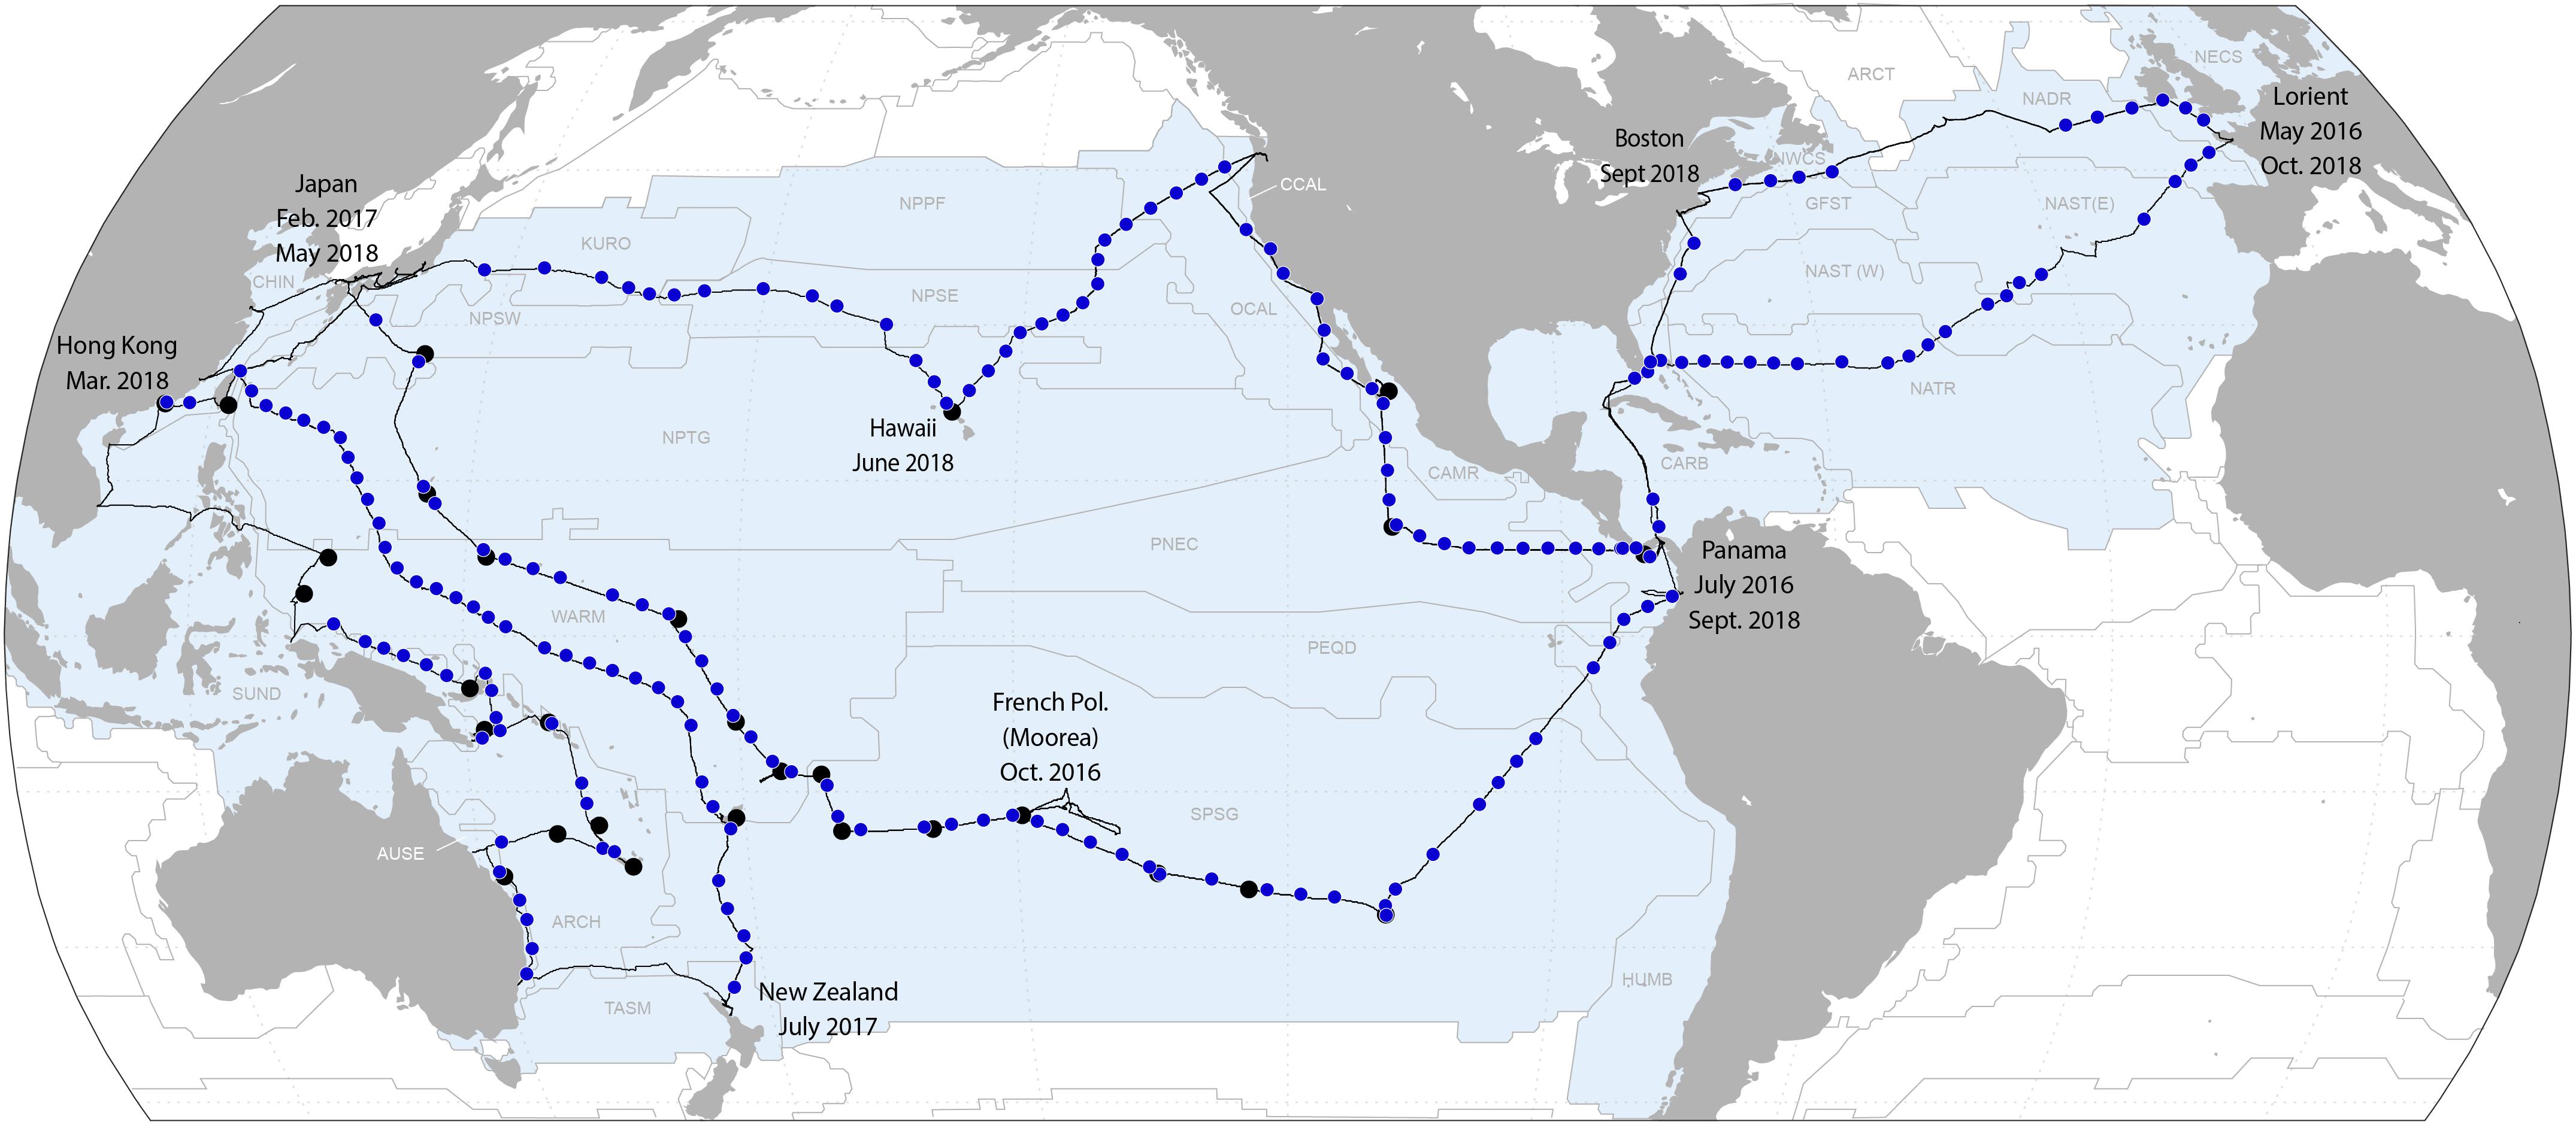
Figure 10. Geographic locations of night-time HSN tows overlaying the oceanic biogeographical provinces as defined by Longhurst (1998).
The Tara Oceans expedition was set up for the generation of open science resources linking plankton diversity, genomics and the environmental context in the subsurface, deep chlorophyll and mesopelagic layers. The surface ocean study undertaken in the framework of the Tara Pacific expedition followed the same cross-disciplinary approach that was used during Tara Oceans.
Our set of multi-disciplinary (physical, chemical, biogeochemical, morphological, and genomic) and end-to-end (from viruses to metazoan eukaryotes) protocols (Figure 9 and Table 1) were realized at 249 sampling stations during daytime (Figure 2), whereas only the morphology of organisms > 300 μm was assessed during nighttime at 185 stations (Figure 10). A total of 89 Manta net tows and 13 Decknet samples were dedicated to sample microplastics at specific locations close to South Pacific islands and in the North Pacific (Figure 2). More than 20 ocean biogeographical provinces (Longhurst, 1998) were sampled day and night during the Tara Pacific expedition (Figure 10).
Key novelties of our sampling protocols compared to Tara Oceans’ global assessment of plankton include the measurement of (i) neuston vs. plankton biogeography and functional diversity; (ii) bioactive trace metals distribution at the ocean surface to explore metal-dependent ecosystem structures and metabolism; (iii) marine aerosols, including biological entities and plastic, to model their biogeography, (iv) high-resolution underway assessment of NCP via equilibrator inlet mass spectrometry and (v) the characterization of surface microplastic and attached communities.
The resulting datasets will complement and extend the Tara Oceans database, and constitute a new data collection for surface Atlantic and Pacific. Furthermore, they will add an oceanic context to the coral studies conducted during the Tara Pacific expedition. We outline here a few scientific questions that can be addressed using data collected during this expedition.
Bioavailability of Micro- and Macronutrients
Life in the sunlit ocean depends not only on the macronutrients nitrogen, phosphorus and silicon, but also on several trace elements needed to carry out biochemical processes including iron (Fe), zinc (Zn), manganese (Mn), nickel (Ni), copper (Cu), cadmium (Cd), and cobalt (Co). The distribution of these metals in the ocean is controlled by various biological, geochemical and physical processes influencing their chemical state and bioavailability (Bruland and Lohan, 2004). Iron is a key micronutrient required for photosynthesis, cellular respiration and nitrogen assimilation, and is therefore a major micronutrient influencing the biological cycling of carbon. However, iron is directly limiting to phytoplankton growth in approximately one-third of the ocean (Moore et al., 2001); it is generally low in concentrations in the South Pacific and Northeast Pacific Oceans (Behrenfeld et al., 2006; Sunda, 2012) while being relatively high in the North Atlantic due to aerosol input from the African continent (Jickells et al., 2005). Other trace metals similarly play critical roles in cellular functions, such as manganese and copper being utilized in the photosynthetic electron transport chain, zinc and nickel required for the assimilation of macronutrients such as phosphorus and nitrogen, and cobalt serving as the central coordinating ion of the micronutrient vitamin B12 (Twining and Baines, 2013). The regional biogeochemical processes controlling the bioavailability of these metals and their role in regulating plankton community composition, metabolic functionality and ecological interactions has not yet been fully explored across large surface gradients of the North Atlantic, North Pacific, and South Pacific Oceans.
During the Tara Pacific expedition, samples were collected from low iron, phosphorus, and nitrogen regions where primary growth limitation and/or co-limitation due to these elements is expected (Moore et al., 2013). Locations were targeted where locally sourced additions of nutrients and metals could influence microbial ecology and metabolic processes, such as in the vicinity of islands (Doty and Oguri, 1956; Caputi et al., 2019) or along upwelling zones. Combining trace metal data along with “omic” information, including microbial community composition and inferred functionality, will ideally provide high resolution insights into the strategies adopted by plankton when responding to various growth limiting factors, at multiple spatial scales and ecosystem levels.
Ecosystem Connectivity
Wind, waves and surface currents are known to accelerate biological dispersion to new locations (Zaitsev, 1971; Fraser et al., 2018; Onink et al., 2019). However, we do not know to what extent these processes may impact the survival and dispersion of organisms such as coral larvae or enhance basin scale productivity across the tropical Pacific Ocean. The sampling design of the Tara Pacific expedition will help address the connectivity (a) between islands, looking for example at the distribution of coral and other larval stages; (b) between coastal and open ocean communities; (c) between coral holobiomes and pelagic microbiomes; (d) between atmosphere, land and sea surface, zooming on the role of sea spray aerosols as vectors of biotic and abiotic dispersion; and (e) between the ocean-atmosphere interface and the deeper ocean by comparing daytime and night-time community composition and the intrusion of vertically migrating plankton into the surface layer.
Diurnal Cycles
Diel vertical migration of plankton is one of the key features to understand the fate of the primary production (Steinberg et al., 2008). Zooplankton transfers matter and energy from primary production to large predators, including fisheries (Mackas and Beaugrand, 2010). The diel vertical migration contributes significantly to the biological pump by transporting carbon to depth (Giering et al., 2014) but also to the sequestration of CO2 (Boyd et al., 2019). At the level of the ecosystem, this daily cycle is generally governed by the photosynthetic biomass production during the daylight and the nighttime respiration and biomass use through grazing. NCP reflects the balance between photosynthesis and respiration in the mixed layer. An excess of photosynthesis over respiration leads to a net production of organic matter available for export. The NCP therefore reflects the potential organic carbon export of the ecosystem (Li and Cassar, 2017). It may be expected that the community composition and interactions autotrophs vs. heterotrophs, the processes influencing carbon and energy fluxes in metabolic pathways in particular photosynthesis and respiration, and the balance between them should drive the spatial variability in NCP along Tara’s route. The systematic day and night net sampling carried out during the Tara Pacific expedition combined with the continuous acquisition of physical, chemical and biological parameters should stimulate studies on surface ocean and water column interactions on a variety of scales.
Microplastic
Surface microplastics represent a novel ecological habitat with a clear niche partitioning among bacteria living on plastics, organic particles and surrounding seawater (Dussud et al., 2018b). The sampling realized during Tara Pacific will complete the existing databases of surface microplastics spatial distribution and contribute to evaluate the interaction between the microplastics, neuston and plankton from individuals to communities. The geography of plastic fragments is not well understood, and ocean scale datasets like those assembled during the Tara Pacific expedition are important for realistic modeling of the fate of plastic pollution (Van Sebille et al., 2015; Onink et al., 2019). Plastic fragments are rapidly colonized and become a new artificial habitat for pelagic and benthic communities. Among other topics, the identification of species associated with plastics will help to establish colonization zones and spatial distribution of exotic, invasive and pathogenic organisms (De Tender et al., 2017; Jacquin et al., 2019).
Conclusion
We have entered a period of time where humans have greater impact on the Earth System than any geochemical cycles. The ocean-atmosphere interface represents a critical chokepoint for gas and nutrient exchange between these global engines of geochemistry. These surface boundary layer ecosystems are subject to myriad stressors in an already intense and strained environment. Such added stressors will undoubtedly alter the physico-chemistry of the ocean-atmosphere interface in ways that will impact the ocean’s ability to absorb the atmosphere’s (elevated) CO2 levels. These responses will be complex, and their study requires cross-disciplinary and large-scale surveys to begin to map the community changes and possible mechanisms underpinning ocean-atmospheric processes. The underway sampling protocols presented here offer a first step toward these goals, and the coming data will be invaluable for catapulting the ocean-atmosphere science into the modern ‘big data’ era.
Members of Tara Pacific Consortium
PSL Research University: EPHE-UPVD-CNRS, USR 3278 CRIOBE, Université de Perpignan, France: Planes S., Banaig B., Boissin E., and Iwankow G. Centre Scientifique de Monaco, Principality of Monaco: Allemand D., Zoccola D., Reynaud S., and Beraud E. Université Côte d’Azur, CNRS, Inserm – IRCAN: Djerbi N., Forcioli D., Furla P., Gilson E., McMind R., Ottaviani A., Rottinger E., Rouan A., and Zamoum T. Department of Biology, University of Konstanz, Konstanz, Germany: Hume B.C.C., Pogoreutz C., Voolstra C. R. Aquatic Research Facility, Environmental Sustainability Research Centre, University of Derby, Derby, United Kingdom: Röthig T. Department of Animal Ecology & Systematics, Justus Liebig University Giessen, Giessen, Germany: Ziegler M. Department of Biology, Institute of Microbiology and Swiss Institute of Bioinformatics, ETH Zürich, Zürich, Switzerland: Paoli L., Ruscheweyh H.-J., Salazar G., Sunagawa S. Weizmann Institute of Science, Department Earth and Planetary Science, Israel: Flores J. M., Koren I., and Trainic M. Weizmann Institute of Science, Department Plant and Environmental Science, Israel: Lang-Yona N. and Vardi A. Sorbonne Université, CNRS, LOMIC, Observatoire Océanologique de Banyuls: Conan P., Ghiglione J.-F., and Pujo-Pay M. Sorbonne Université, CNRS, LECOB, Observatoire Océanologique de Banyuls: Galand P. E. and Hochart C. Tara Ocean Foundation, Paris, France: Audrain S., Bourgois E., Hertau M., Lancelot J., Monmarche D., Moulin C., Moucherie Y., and Troublé R. School of Marine Sciences, University of Maine, United States: Boss E., Bourdin G., Haëntjens N., and Karp-Boss L. Laboratoire des Sciences du Climat et de l’Environnement, LSCE/IPSL, CEA-CNRS-UVSQ, Université Paris-Saclay, France: Douville E. Shimoda Marine Research Center, University of Tsukuba, Shizuoka, Japan: Agostini S. and Mitsuhashi G. National Institute of Environmental Science, Japan: Kitano Y. Sorbonne Université, CNRS, Laboratoire d’Océanographie de Villefranche, UMR 7093 LOV, Villefranche-sur-Mer, France: da Silva O., Dolan J. R., Gorsky G., Lemee R., Lombard F., and Pedrotti M.-L. The Ohio State University, Departments of Microbiology and Civil, Environmental and Geodetic Engineering, Columbus, United States: Cronin D. and Sullivan M. Génomique Métabolique, Genoscope, Institut François Jacob, CEA, CNRS, Univ Evry, Université Paris-Saclay, Evry, France: Armstrong E., Aury J.-M., Barbe V., Belser C., Carradec Q., Labadie K., Lê-Hoang J., Noel B., Poulain J., and Wincker P. Oregon State University, Department of Microbiology, OR, United States: Klinges G. and Vega-Thunder R. Station Biologique de Roscoff, CNRS, AD2M, UMR 7144, Sorbonne Université, Roscoff, France: Bonnival E., de Vargas C., Henry N., Marie D., and Romac S. PANGAEA, Data Publisher for Earth and Environment Science, Bremen, Germany & MARUM - Center for Marine Environmental Sciences, Universität Bremen, Bremen, Germany: Pesant S. Marine Biodiscovery Laboratory, School of Chemistry and Ryan Institute, National University of Ireland, Galway, (NUI Galway), University Road H91TK33 Galway, Ireland: Miguel-Gorda M. and Thomas O. P. Institut de Biologie de l’Ecole Normale Supérieure (IBENS), Ecole normale supérieure, CNRS, INSERM, Université PSL, Paris, France: Bowler C. World Courier, an Amerisource Bergen Company, Russelsheim, Germany: Friedrich R. Division of Earth and Ocean Sciences, Duke University, Durham, United States: Cassar N. and Lin Y. Laboratoire des Sciences de l’Environnement Marin (LEMAR), UMR 6539 UBO/CNRS/IRD/IFREMER, Institut Universitaire Européen de la Mer (IUEM), Brest, France: Cassar N. Department of Earth Sciences, University of Southern California, Los Angeles, CA, United States: John S. G. and Kelly R. L. Marine Chemistry and Geochemistry Department, Woods Hole Oceanographic Institution: Cohen N. R. Institut Pierre Simon Laplace, CNRS/IRD/MNHN (LOCEAN)Sorbonne-UniversitéParis Cedex 05 France: Reverdin G. Laboratoire Evolution, Génomes, Comportement et Ecologie, CNRS/Université Paris-Saclay, Avenue de la Terrasse, 91190 Gif sur Yvette, France: Filée J.
Data Availability Statement
The datasets generated for this study are available upon request to the corresponding author.
Author Contributions
GG, FL, MLP, EBos, NCo, JF, and RT designed the study with input from SPe, DA, and EK. GG and FL directed the project. GB, FL, MLP, RT, and GG directed the field work. SPe, GB, and FL directed the data management and organized the field protocols. SPe, NCa, and EBoi managed the samples. GB, SRo, SA, NB, LC, DC, AE, JF, JG, NH, MH, YL, YM, MP, and MTra collected samples at sea. GC and MTre supplied the satellite data. GB, FL, MLP, EBos, NCa, NCo, JD, ED, AE, JF, JG, NH, SJ, RK, YL, DM, JP, MP-P, GR, SRo, MS, MTra, and PW are involved in samples and data treatments. GG organized the manuscript with substantial input from GB, FL, MLP, CB, JD, and SPe. All the authors contributed significantly to the manuscript and Tara Pacific coordinators provided constructive criticism throughout the study and discussed the results and commented on the manuscript.
Conflict of Interest
The authors declare that the research was conducted in the absence of any commercial or financial relationships that could be construed as a potential conflict of interest.
The handling Editor declared a shared affiliation, though no other collaboration, with one of the authors SPe at time of review.
Funding
We are thankful for the commitment of the people and the following institutions, for their financial and scientific support that made this singular expedition possible: CNRS, PSL, CSM, EPHE, Genoscope/CEA, Inserm, Université Cote d’Azur, ANR, the Tara Ocean Foundation and its partners agnès b., UNESCO-IOC, the Veolia Environment Foundation, Région Bretagne, Serge Ferrari, Billerudkorsnas, Amerisource Bergen Company, Altran, Lorient Agglomeration, Oceans by Disney, the Prince Albert II de Monaco Foundation, L’Oréal, Biotherm, France Collectivités, Kankyo Station, Fonds Français pour l’Environnement Mondial (FFEM), Etienne Bourgois, the Tara Ocean Foundation teams and crew. Tara Pacific would not exist without the continuous support of the participating institutes. This study has been conducted using E.U. Copernicus Marine Service Information and Mercator Ocean products. We acknowledge funding from the Investissement d’avenir project France Génomique (ANR-10-INBS-09). FL is supported by Sorbonne Université, Institut Universitaire de France and the Fondation CA-PCA. The in-line and atmospheric optics dataset was collected and analyzed with support from NASA Ocean Biology and Biogeochemistry program under grants NNX13AE58G and NNX15AC08G to University of Maine. MF, IK, and AV are supported by a research grant from Scott Jordan and Gina Valdez, the De Botton for Marine Science, the Yeda-Sela center for Basic research, and the Sustainability and Energy Research Initiative (SAERI). NCo was supported by a grant from the Simons Foundation/SFARI (544236). NCa and YL were supported by the “Laboratoire d’Excellence” LabexMER (ANR-10-LABX-19) and co-funded by a grant from the French government under the program “Investissements d’Avenir.” The support of Pr. Alan Fuchs, President of CNRS, was crucial for the success of the surface sampling undertaken during the Tara Pacific expedition. We thank A. Gavilli from TECA Inc. France, and E. Tanguy and D. Delhommeau from the Institut de la Mer, Villefranche-sur-Mer for the helpful collaboration in the conception of the High Speed Net and the Dolphin systems. This publication is number 2 of the Tara Pacific Consortium.
Supplementary Material
The Supplementary Material for this article can be found online at: https://www.frontiersin.org/articles/10.3389/fmars.2019.00750/full#supplementary-material
Footnotes
- ^ https://sites.google.com/view/ccpv/home
- ^ https://ecotaxa.obs-vlfr.fr/
- ^ https://unieuk.org/
- ^ https://absch.cbd.int/
- ^ https://www.ebi.ac.uk/ena
- ^ https://www.pangaea.de/
- ^ https://www.ebi.ac.uk/biosamples/
References
Aiken, J., and Bale, A. J. (2000). An introduction to the atlantic meridional transect (AMT) Programme. Prog. Oceanogr. 45, 251–256. doi: 10.1016/s0079-6611(00)00004-5
Alberti, A., Belser, C., Engelen, S., Bertrand, L., Orvain, C., Brinas, L., et al. (2014). Comparison of library preparation methods reveals their impact on interpretation of metatranscriptomic data. BMC Geno. 15:912. doi: 10.1186/1471-2164-15-912
Alberti, A., Poulain, J., Engelen, S., Labadie, K., Romac, S., Ferrera, I., et al. (2017). Viral to metazoan marine plankton nucleotide sequences from the Tara Oceans expedition. Sci. Data 4:170093. doi: 10.1038/sdata.2017.93
Aller, J. Y., Kuznetsova, M. R., Jahns, C. J., and Kemp, P. F. (2005). The sea surface microlayer as a source of viral and bacterial enrichment in marine aerosols. J. Aerosol. Sci. 36, 801–812. doi: 10.1016/j.jaerosci.2004.10.012
Aminot, A., and Kérouel, R. (2007). Dosage Automatique des Nutriments Dans les Eaux Marines Méthodes en Flux Continu. Pairs: Ifremer.
Behrenfeld, M. J., Worthington, K., Sherrell, R. M., Chavez, F. P., Strutton, P., McPhaden, M., et al. (2006). Controls on tropical Pacific Ocean productivity revealed through nutrient stress diagnostics. Nature 442, 1025–1028. doi: 10.1038/nature05083
Belzile, C., Roesler, C. S., Christensen, J. P., Shakhova, N., and Semiletov, I. (2006). Fluorescence measured using the WETStar DOM fluorometer as a proxy for dissolved matter absorption, Estuar. Coast. Shelf. 67, 441–449. doi: 10.1016/j.ecss.2005.11.032
Boss, E., Picheral, M., Leeuw, T., Chase, A., Karsenti, E., Gorsky, G., et al. (2013). The characteristics of particulate absorption, scattering and attenuation coefficients in the surface ocean; Contribution of the Tara Oceans expedition. Methods Oceanogr. 7, 52–62. doi: 10.1016/j.mio.2013.11.002
Boucher, O., Randall, D., Artaxo, P., Bretherton, C., Feingold, G., Forster, P., et al. (2013). “Clouds and aerosols,” in Climate Change 2013: the Physical Science Basis. Contribution of Working Group I to the Fifth Assessment Report of the Intergovernmental Panel on Climate Change, eds T. F. Stocker, D. Qin, G. K. Plattner, M. Tignor, S. K. Allen, J. Boschung, et al. (Cambridge: Cambridge University Press), 571–657.
Boyd, P. W., Claustre, H., Levy, M., Siegel, D. A., and Weber, T. (2019). Multi-faceted particle pumps drive carbon sequestration in the ocean. Nature 568, 327–335. doi: 10.1038/s41586-019-1098-2
Bruland, K. W., and Lohan, M. C. (2004). “Controls of trace metals in seawater,” in Treatise on Geochemistry, eds K. Turekian, and H. Holland (Amsterdam: Elsevier), 32–47.
Buesseler, K. O., Lamborg, C. H., Boyd, P. W., Lam, P. J., Trull, T. W., Bidigare, R. R., et al. (2007). Revisiting carbon flux through the ocean’s twilight zone. Science 316, 567–570. doi: 10.1126/science.1137959
Caputi, L., Carradec, Q., Eveillard, D., Kirilovsky, A., Pelletier, E., Pierella Karlusich, J. J., et al. (2019). Community-level responses to iron availability in open ocean plankton ecosystems. Global Biogeochem. Cycles 33, 391–419. doi: 10.1029/2018GB006022
Carradec, Q., Pelletier, E., Da Silva, C., Alberti, A., Seeleuthner, Y., Blanc-Mathieu, R., et al. (2018). A global ocean atlas of eukaryotic genes. Nat. Commun. 9:373. doi: 10.1038/s41467-017-02342-1
Cassar, N., Barnett, B. A., Bender, M. L., Kaiser, J., Hamme, R. C., and Tilbrook, B. (2009). Continuous high-frequency dissolved O2/Ar measurements by equilibrator inlet mass spectrometry. Anal. Chem. 81, 1855–1864. doi: 10.1021/ac802300u
Cassar, N., Nevison, C. D., and Manizza, M. (2014). Correcting oceanic O2/Ar-net community production estimates for vertical mixing using N2O observations. Geophys. Res. Lett. 41, 8961–8970. doi: 10.1002/2014GL062040
Cetinić, I., Perry, M. J., Briggs, N. T., Kallin, E., D’Asaro, E. A., and Lee, C. M. (2012). Particulate organic carbon and inherent optical properties during 2008 North Atlantic Bloom Experiment. J. Geophys. Res. 117, 1–18. doi: 10.1029/2011JC007771
Charlson, R. J., Lovelock, J. E., Andreae, M. O., and Warren, S. G. (1987). Oceanic phytoplankton, atmospheric sulphur, cloud albedo and climate. Nature 326:655. doi: 10.1038/326655a0
Chase, A., Boss, E., Zaneveld, R., Bricaud, A., Claustre, H., Ras, J., et al. (2013). Decomposition of in situ particulate absorption spectra. Methods Oceanogr. 7, 110–124. doi: 10.1016/j.mio.2014.02.002
Chase, A. P., Boss, E., Cetinić, I., and Slade, W. (2017). Estimation of phytoplankton accessory pigments from hyperspectral reflectance spectra: toward a global algorithm. J. Geophys. Res. 122, 9725–9743. doi: 10.1002/2017JC012859
Clayton, T., and Byrne, R. (1993). Spectrophotometric seawater ph measurements - total hydrogen-ion concentration scale calibration of m-cresol purple and at-sea results. Deep Sea Res. Part I Oceanogr. Res. Pap. 40, 2115–2129. doi: 10.1016/0967-0637(93)90048-90048
Colin, S., Coelho, L. P., Sunagawa, S., Bowler, C., Karsenti, E., Bork, P., et al. (2017). Quantitative 3D-imaging for cell biology and ecology of environmental microbial eukaryotes. eLife 6:e26066. doi: 10.7554/elife.26066
Cunliffe, M., and Murrell, J. C. (2009). The sea-surface microlayer is a gelatinous biofilm. ISME J. 3:1001. doi: 10.1038/ismej.2009.69
De Tender, C., Schlundt, C., Devriese, L., Mincer, T., Zettler, E., and Amaral-Zettler, L. (2017). A review of microscopy and comparative molecular-based methods to characterize “Plastisphere” communities. Anal. Methods 9, 2132–2143. doi: 10.1039/c7ay00260b
Deschamps, P. -Y., Fougnie, B., Frouin, R., Lecomte, P., and Verwaerde, C. (2004). SIMBAD: a field radiometer for satellite ocean-color validation. Appl. Opt. 43, 4055–4069. doi: 10.1364/ao.43.004055
Dickson, A. G., Sabine, C. L., Christian, J. R., Bargeron, C. P., and North Pacific, Marine Science, Organization, (eds). (2007). Guide to Best Practices for Ocean CO2 Measurements. Sidney, BC: North Pacific Marine Science Organization.
DOE (1994). Handbook of Methods for the Analysis of the Various Parameters of the Carbon Dioxide System in Sea Water; Version 2.
Doty, M. S., and Oguri, M. (1956). The island mass effect. ICES J. Mar. Sci. 22, 33–37. doi: 10.1093/icesjms/22.1.33
Duarte, C. M. (2015). Seafaring in the 21st century: the Malaspina 2010 circumnavigation expedition. Limnol. Oceanogr. Bull. 24, 11–14. doi: 10.1002/lob.10008
Duce, R. A., and Tindale, N. W. (1991). Atmospheric transport of iron and its deposition in the ocean. Limnol. Oceanogr. 36, 1715–1726. doi: 10.4319/lo.1991.36.8.1715
Dussud, C., Hudec, C., George, M., Fabre, P., Higgs, P., Bruzaud, S., et al. (2018a). Colonization of non-biodegradable and biodegradable plastics by marine microorganisms. Front. Microbiol. 9:1571. doi: 10.3389/fmicb.2018.01571
Dussud, C., Meistertzheim, A., Conan, P., Pujo-Pay, M., George, M., Fabre, P., et al. (2018b). Evidence of niche partitioning among bacteria living on plastics, organic particles and surrounding seawaters. Environ. Poll. 236, 807–816. doi: 10.1016/j.envpol.2017.12.027
Edmond, J. M. (1970). High Precision Determination of Titration Alkalinity and Total Carbon Dioxide Content of Sea Water by Potentiometric Titration. Amsterdam: Elsevier.
Eppley, R., and Peterson, B. (1979). Particulate organic-matter flux and planktonic new production in the deep ocean. Nature 282, 677–680. doi: 10.1038/282677a0
Eriksen, M., Liboiron, M., Kiessling, T., Charron, L., Alling, A., Lebreton, L., et al. (2018). Microplastic sampling with the AVANI trawl compared to two neuston trawls in the Bay of Bengal and South Pacific. Environ. Poll. 232, 430–439. doi: 10.1016/j.envpol.2017.09.058
Falkowski, P., Barber, R., and Smetacek, V. (1998). Biogeochemical controls and feedbacks on ocean primary production. Science 281, 200–206. doi: 10.1126/science.281.5374.200
Falkowski, P. G., Laws, E. A., Barber, R. T., and Murray, J. W. (2003). “Phytoplankton and their role in primary, new, and export production,” in Ocean Biogeochemistry, ed. M. J. R. Fasham (Berlin: Springer), 99–121. doi: 10.1007/978-3-642-55844-3_5
Flores, M. J., Bourdin, G., Altaratz, O., Trainic, M., Audrain, S., Hertau, M., et al. (accepted). Tara Pacific expedition’s atmospheric measurements. marine aerosols across the Atlantic and Pacific Oceans. Overview and preliminary results. Bull. Am. Meteorol. Soc.
Fraser, C. I., Morrison, A. K., Hogg, A. M., Macaya, E. C., van Sebille, E., Ryan, P. G., et al. (2018). Antarctica’s ecological isolation will be broken by storm-driven dispersal and warming. Nat. Clim. Change 8:704. doi: 10.1038/s41558-018-0209-207
Gattuso, J. -P., Magnan, A., Billé, R., Cheung, W. W., Howes, E. L., Joos, F., et al. (2015). Contrasting futures for ocean and society from different anthropogenic CO2 emissions scenarios. Science 349:aac4722. doi: 10.1126/science.aac4722
Giering, S. L., Sanders, R., Lampitt, R. S., Anderson, T. R., Tamburini, C., Boutrif, M., et al. (2014). Reconciliation of the carbon budget in the ocean’s twilight zone. Nature 507:480. doi: 10.1038/nature13123
Gorsky, G., Ohman, M. D., Picheral, M., Gasparini, S., Stemmann, L., Romagnan, J. -B., et al. (2010). Digital zooplankton image analysis using the ZooScan integrated system. J. Plankton Res. 32, 285–303. doi: 10.1093/plankt/fbp124
Graff, J. R., Westberry, T. K., Milligan, A. J., Brown, M. B., Dall’Olmo, G., van Dongen-Vogels, V., et al. (2015). Analytical phytoplankton carbon measurements spanning diverse ecosystems. Deep Sea Res. Part I Oceanogr. Res. Pap. 102, 16–25. doi: 10.1016/j.dsr.2015.04.006
Harris, R., Wiebe, P., Lenz, J., Skjoldal, H. -R., and Huntley, M. (2000). ICES Zooplankton Methodology Manual. Cambridge, MA: Academic Press.
Hood, R. R., Laws, E. A., Armstrong, R. A., Bates, N. R., Brown, C. W., Carlson, C. A., et al. (2006). Pelagic functional group modeling: progress, challenges and prospects. Deep Sea Res. Part I Top. Stud. Oceanogr. 53, 459–512. doi: 10.1016/j.dsr2.2006.01.025
Hume, B. C. C., Smith, E. G., Ziegler, M., Warrington, H. J. M., Burt, J. A., LaJeunesse, T. C., et al. (2019). SymPortal: a novel analytical framework and platform for coral algal symbiont next-generation sequencing ITS2 profiling. Mol. Ecol. Resour. 19, 1063–1080. doi: 10.1111/1755-0998.13004
Hume, B. C., Ziegler, M., Poulain, J., Pochon, X., Romac, S., Boissin, E., et al. (2018). An improved primer set and amplification protocol with increased specificity and sensitivity targeting the Symbiodinium ITS2 region. PeerJ 6:e4816. doi: 10.7717/peerj.4816
Jacquin, J., Cheng, J., Odobel, C., Conan, P., Pujo-pay, M., and Jean-Francois, G. (2019). Microbial ecotoxicology of marine plastic debris: a review on colonization and biodegradation by the ‘plastisphere.’ Front. Microbiol. 10:865. doi: 10.3389/fmicb.2019.00865
Jickells, T. D., An, Z. S., Andersen, K. K., Baker, A. R., Bergametti, C., Brooks, N., et al. (2005). Global iron connections between desert dust, ocean biogeochemistry, and climate. Science 308, 67–71. doi: 10.1126/science.1105959
John, S. G., Mendez, C. B., Deng, L., Poulos, B., Kauffman, A. K. M., Kern, S., et al. (2011). A simple and efficient method for concentration of ocean viruses by chemical flocculation. Environ. Microbiol. Rep. 3, 195–202. doi: 10.1111/j.1758-2229.2010.00208.x
Karsenti, E., Acinas, S. G., Bork, P., Bowler, C., De Vargas, C., Raes, J., et al. (2011). A holistic approach to marine eco-systems biology. PLoS Biol. 9, 1–5. doi: 10.1371/journal.pbio.1001177
LaJeunesse, T. C., Parkinson, J. E., Gabrielson, P. W., Jeong, H. J., Reimer, J. D., Voolstra, C. R., et al. (2018). Systematic revision of Symbiodiniaceae highlights the antiquity and diversity of coral endosymbionts. Curr. Biol. 28, 2570–2580. doi: 10.1016/j.cub.2018.07.008
Le Quéré, C., Harrison, S. P., Prentice, I. C., Buitenhuis, E. T., Aumont, O., Bopp, L., et al. (2005). Ecosystem dynamics based on plankton functional types for global ocean biogeochemistry models. Glob. Change Biol. 11, 2016–2040.
Lebreton, L., Slat, B., Ferrari, F., Sainte-Rose, B., Aitken, J., Marthouse, R., et al. (2018). Evidence that the Great pacific garbage patch is rapidly accumulating plastic. Sci. Rep. 8:4666. doi: 10.1038/s41598-018-22939-w
Lellouche, J. -M., Greiner, E., Le Galloudec, O., Garric, G., Regnier, C., Drevillon, M., et al. (2018). Recent updates to the copernicus marine service global ocean monitoring and forecasting real-time 1/12° high-resolution system. Ocean Sci. 14, 1093–1126. doi: 10.5194/os-14-1093-2018
Li, Z., and Cassar, N. (2017). A mechanistic model of an upper bound on oceanic carbon export as a function of mixed layer depth and temperature. Biogeosciences 14, 5015–5027 doi: 10.5194/bg-14-5015-2017
Liss, P. S., Liss, P. S., and Duce, R. A. (2005). The Sea Surface and global Change. Cambridge: Cambridge University Press.
Mackas, D. L., and Beaugrand, G. (2010). Comparisons of zooplankton time series. J. Mar. Syst. 79, 286–304. doi: 10.1016/j.jmarsys.2008.11.030
Malviya, S., Scalco, E., Audic, S., Vincent, F., Veluchamy, A., Poulain, J., et al. (2016). Insights into global diatom distribution and diversity in the world’s ocean. Proc. Natl. Acad. Sci. U.S.A. 113, E1516–E1525. doi: 10.1073/pnas.1509523113
Marie, D., Brussaard, C., Partensky, F., Vaulot, D., and Wiley, J. (1999). Flow cytometric analysis of phytoplankton, bacteria and viruses. Curr. Prot. Cytometry 11, 1–11.
Masson-Delmotte, V., Zhai, P., Pörtner, H. O., Roberts, D., Skea, J., Shukla, P. R., et al. (eds). (2018). Global Warming of 1.5 C. An IPCC Special Report on the Impacts of Global Warming of 1.5°C. an IPCC Special Report on the Impacts of Global Warming of 1.5°C Above Pre-industrial Levels and Related Global Greenhouse gas Emission Pathways, in the Context of Strengthening the Global Response to the Threat of climate Change, sustainable Development, and Efforts to Eradicate Poverty. Geneva: IPCC
McCave, I. (1975). Vertical flux of particles in the ocean. Deep Sea Res. 7, 491–502. doi: 10.1016/0011-7471(75)90022-90024
Measures, C. I., Landing, W. M., Brown, M. T., and Buck, C. S. (2008). A commercially available rosette system for trace metal–clean sampling. Limnol. Oceanogr. 6, 384–394. doi: 10.4319/lom.2008.6.384
Moore, J. K., Doney, S. C., Glover, D. M., and Fung, I. Y. (2001). Iron cycling and nutrient-limitation patterns in surface waters of the World Ocean. Deep Sea Res. Part II Top. Stud. Oceanogr. 49, 463–507. doi: 10.1016/S0967-0645(01)00109-106
Moore, C., Mills, M., Arrigo, K., Berman-Frank, I., Bopp, L., Boyd, P., et al. (2013). Processes and patterns of oceanic nutrient limitation. Nat. Geosci. 6:701. doi: 10.1038/ngeo1765
Nemzer, B., and Dickson, A. (2005). The stability and reproducibility of Tris buffers in synthetic seawater. Mar. Chem. 96, 237–242. doi: 10.1016/j.marchem.2005.01.004
Neukermans, G., Harmel, T., Galí, M., Rudorff, N., Chowdhary, J., Dubovik, O., et al. (2018). Harnessing remote sensing to address critical science questions on ocean-atmosphere interactions. Elem. Sci. Anth. 6, 1–46. doi: 10.1525/elementa.331
Onink, V., Wichmann, D., Delandmeter, P., and Van Sebille, E. (2019). The role of Ekman currents, geostrophy, and stokes drift in the accumulation of floating microplastic. J. Geophys. Res. 124, 1474–1490. doi: 10.1029/2018jc014547
Pereira, R., Ashton, I., Sabbaghzadeh, B., Shutler, J. D., and Upstill-Goddard, R. C. (2018). Reduced air–sea CO2 exchange in the Atlantic Ocean due to biological surfactants. Nat. Geosci. 11, 492–496. doi: 10.1038/s41561-018-0136-132
Perruche, C., Hameau, A., Paul, J., Régnier, C., and Drévillon, M. (2016). Quality Information Document (CMEMS-GLO-QUID-001-014). Available at: http://marine.copernicus.eu/documents/QUID/CMEMS-GLO-QUID-001-014.pdf (accessed September, 2016).
Pesant, S., Not, F., Picheral, M., Kandels-Lewis, S., Le Bescot, N., Gorsky, G., et al. (2015). Open science resources for the discovery and analysis of Tara Oceans data. Sci. Data 2:150023. doi: 10.1038/sdata.2015.23
Picheral, M., Colin, S., and Irisson, J.-O. (2017). EcoTaxa, a Tool for the Taxonomic Classification of Images. Available at: http://ecotaxa.obs-vlfr.fr (accessed June, 2018).
Planes, S., Allemand, D., Agostini, S., Banaigs, B., Boissin, E., Boss, E., et al. (2019). A pan-ecosystemic approach of the “-omics” complexity of coral reef holobionts across the Pacific Ocean. PLoS Biol. 17:e3000483. doi: 10.1371/journal.pbio.3000483
Ras, J., Claustre, H., and Uitz, J. (2008). Spatial variability of phytoplankton pigment distributions in the Subtropical South Pacific Ocean: comparison between in situ and predicted data. Biogeosciences 5, 353–369. doi: 10.5194/bg-5-353-2008
Rusch, D. B., Halpern, A. L., Sutton, G., Heidelberg, K. B., Williamson, S., Yooseph, S., et al. (2007). The Sorcerer II global ocean sampling expedition: northwest Atlantic through eastern tropical Pacific. PLoS Biol. 5:e77. doi: 10.1371/journal.pbio.0050077
Sedwick, P. N., Marsay, C. M., Sohst, B. M., Aguilar-Islas, A. M., Lohan, M. C., Long, M. C., et al. (2011). Early season depletion of dissolved iron in the Ross Sea polynya: implications for iron dynamics on the Antarctic continental shelf. J. Geophys. Res. 116, 1–19. doi: 10.1029/2010JC006553
Sharoni, S., Trainic, M., Schatz, D., Lehahn, Y., Flores, M. J., Bidle, K. D., et al. (2015). Infection of phytoplankton by aerosolized marine viruses. Proc. Natl. Acad. Sci. U.S.A. 112, 6643–6647. doi: 10.1073/pnas.1423667112
Sieburth, J. M. (1983). “Microbiological and organic-chemical processes in the surface and mixed layers,” in Air-Sea Exchange of Gases and Particles, eds P. S. Liss, and W. G. N. Slinn (Springer: Berlin), 121–172. doi: 10.1007/978-94-009-7169-1_3
Sieracki, C. K., Sieracki, M. E., and Yentsch, C. S. (1998). An imaging-in-flow system for automated analysis of marine microplankton. Mar. Ecol. Prog. Ser. 168, 285–296. doi: 10.3354/meps168285
Slade, W. H., and Boss, E. (2015). Spectral attenuation and backscattering as indicators of average particle size. Appl. Opt. 54, 7264–7277. doi: 10.1364/AO.54.007264
Slade, W. H., Boss, E., Dall’Olmo, G., Langner, M. R., Loftin, J., Behrenfeld, M. J., et al. (2010). Underway and moored methods for improving accuracy in measurement of spectral particulate absorption and attenuation. J. Atmosph. Ocean. Technol. 27, 1733–1746. doi: 10.1175/2010jtecho755.1
Smirnov, A., Holben, B., Sakerin, S., Kabanov, D., Slutsker, I., Chin, M., et al. (2006). Ship-based aerosol optical depth measurements in the Atlantic Ocean: comparison with satellite retrievals and GOCART model. Geophys. Res. Lett. 33, 1–4. doi: 10.1029/2006gl026051
Steinberg, D. K., Van Mooy, B. A. S., Buesseler, K. O., Boyd, P. W., Kobari, T., and Karl, D. M. (2008). Bacterial vs. zooplankton control of sinking particle flux in the ocean’s twilight zone. Limnol. Oceanogr. 53, 1327–1338. doi: 10.4319/lo.2008.53.4.1327
Sunda, W. G. (2012). Feedback interactions between trace metal nutrients and phytoplankton in the Ocean. Front. Microbiol. 3:204. doi: 10.3389/fmicb.2012.00204
Sundby, S. (1991). Factors affecting the vertical distribution of eggs. ICES Marine Science Symposia. 192, 33–38.
Twining, B. S., and Baines, S. B. (2013). The trace metal composition of marine phytoplankton. Ann. Rev. Mar. Sci. 5, 191–215. doi: 10.1146/annurev-marine-121211-172322
Van Sebille, E., Wilcox, C., Lebreton, L., Maximenko, N., Hardesty, B. D., Van Franeker, J. A., et al. (2015). A global inventory of small floating plastic debris. Environ. Res. Lett. 10:124006. doi: 10.1088/1748-9326/10/12/124006
Villar, E., Farrant, G. K., Follows, M., Garczarek, L., Speich, S., Audic, S., et al. (2015). Environmental characteristics of Agulhas rings affect interocean plankton transport. Science 348:1261447. doi: 10.1126/science.1261447
Viršek, M. K., Lovšin, M. N., Koren, Š., Kržan, A., and Peterlin, M. (2017). Microplastics as a vector for the transport of the bacterial fish pathogen species Aeromonas salmonicida. Mar. Pollut. Bull. 125, 301–309. doi: 10.1016/j.marpolbul.2017.08.024
Von der Weiden, S. -L., Drewnick, F., and Borrmann, S. (2009). Particle loss calculator – a new software tool for the assessment of the performance of aerosol inlet systems. Atmosph. Measure. Tech. 2, 479–494. doi: 10.5194/amt-2-479-2009
Wiebe, P. H., and Benfield, M. C. (2003). From the Hensen net toward four-dimensional biological oceanography. Prog. Oceanogr. 56, 7–136. doi: 10.1016/s0079-6611(02)00140-4
Wilkinson, M. D., Dumontier, M., Aalbersberg, I. J. J., Appleton, G., Axton, M., Baak, A., et al. (2016). The FAIR guiding principles for scientific data management and stewardship. Sci. Data 3:160018. doi: 10.1038/sdata.2016.18
Wurl, O., Ekau, W., Landing, W. M., and Zappa, C. J. (2017). Sea surface microlayer in a changing ocean–A perspective. Elem. Sci. Anth. 5:31. doi: 10.1525/elementa.228
Wurl, O., and Obbard, J. P. (2004). A review of pollutants in the sea-surface microlayer (SML): a unique habitat for marine organisms. Mar. Poll. Bull. 48, 1016–1030. doi: 10.1016/j.marpolbul.2004.03.016
Zaitsev, Y., and Liss, P. (2005). “Neuston of seas and oceans,” Duce, the Sea Surface and Global Change, eds S. Peter, and R. A. Liss (Cambridge: Cambridge University Press), 371–382. doi: 10.1017/cbo9780511525025.013
Keywords: neuston/plankton genomics/taxonomy/imaging, aerosols, NCP, IOP, trace metals, microplastic
Citation: Gorsky G, Bourdin G, Lombard F, Pedrotti ML, Audrain S, Bin N, Boss E, Bowler C, Cassar N, Caudan L, Chabot G, Cohen NR, Cron D, De Vargas C, Dolan JR, Douville E, Elineau A, Flores JM, Ghiglione JF, Haëntjens N, Hertau M, John SG, Kelly RL, Koren I, Lin Y, Marie D, Moulin C, Moucherie Y, Pesant S, Picheral M, Poulain J, Pujo-Pay M, Reverdin G, Romac S, Sullivan MB, Trainic M, Tressol M, Troublé R, Vardi A, Voolstra CR, Wincker P, Agostini S, Banaigs B, Boissin E, Forcioli D, Furla P, Galand PE, Gilson E, Reynaud S, Sunagawa S, Thomas OP, Vega Thurber RL, Zoccola D, Planes S, Allemand D and Karsenti E (2019) Expanding Tara Oceans Protocols for Underway, Ecosystemic Sampling of the Ocean-Atmosphere Interface During Tara Pacific Expedition (2016–2018). Front. Mar. Sci. 6:750. doi: 10.3389/fmars.2019.00750
Received: 10 August 2019; Accepted: 18 November 2019;
Published: 11 December 2019.
Edited by:
Tilmann Harder, University of Bremen, GermanyReviewed by:
James Potemra, University of Hawai‘i at Mānoa, United StatesMarsh J. Youngbluth, Florida Atlantic University, United States
Copyright © 2019 Gorsky, Bourdin, Lombard, Pedrotti, Audrain, Bin, Boss, Bowler, Cassar, Caudan, Chabot, Cohen, Cron, De Vargas, Dolan, Douville, Elineau, Flores, Ghiglione, Haëntjens, Hertau, John, Kelly, Koren, Lin, Marie, Moulin, Moucherie, Pesant, Picheral, Poulain, Pujo-Pay, Reverdin, Romac, Sullivan, Trainic, Tressol, Troublé, Vardi, Voolstra, Wincker, Agostini, Banaigs, Boissin, Forcioli, Furla, Galand, Gilson, Reynaud, Sunagawa, Thomas, Vega Thurber, Zoccola, Planes, Allemand and Karsenti. This is an open-access article distributed under the terms of the Creative Commons Attribution License (CC BY). The use, distribution or reproduction in other forums is permitted, provided the original author(s) and the copyright owner(s) are credited and that the original publication in this journal is cited, in accordance with accepted academic practice. No use, distribution or reproduction is permitted which does not comply with these terms.
*Correspondence: Gabriel Gorsky, Z29yc2t5QG9icy12bGZyLmZy; Guillaume Bourdin, Z3VpbGxhdW1lLmJvdXJkaW5AbWFpbmUuZWR1; Fabien Lombard, bG9tYmFyZEBvYnMtdmxmci5mcg==; Maria Luiza Pedrotti, cGVkcm90dGlAb2JzLXZsZnIuZnI=
†These authors have contributed equally to this work
‡Tara Pacific Coordinators