 Christopher J. Zappa1*
 Scott M. Brown1
 Nathan J. M. Laxague1
 Tejendra Dhakal1
 Ryan A. Harris1
 Aaron M. Farber2
 Ajit Subramaniam1
- 1Lamont-Doherty Earth Observatory, Columbia University, Palisades, NY, United States
- 2L3 Latitude, Tucson, AZ, United States
Unmanned aerial vehicles (UAVs) are proving to be an important modern sensing platform that supplement the sensing capabilities from platforms such as satellites, aircraft, research vessels, moorings, and gliders. UAVs, like satellites and aircraft can provide a synoptic view of a relatively large area. However, the coarse resolution provided by satellites and the operational limitations of manned aircraft has motivated the development of unmanned systems. UAVs offer unparalleled flexibility of tasking; for example, low altitude flight and slow airspeed allow for the characterization of a wide variety of geophysical phenomena at the ocean surface and in the marine atmospheric boundary layer. Here, we present the development of cutting-edge payload instrumentation for UAVs that provides a new capability for ship-deployed operations to capture a unique, high resolution spatial and temporal variability of the changing air-sea interaction processes than was previously possible. The modular design of the base payload means that new instruments can be incorporated into new research proposals that may include new instruments for expanded use of the payloads as a long-term research facility. Additionally, we implement a novel capability for vertical take-off and landing (VTOL) from research vessels. This VTOL capability is safer and requires less logistical support than previous ship-deployed systems. The payloads developed include thermal infrared, visible broadband and hyperspectral, and near-infrared hyperspectral high-resolution imaging. Additional capabilities include quantification of the longwave and shortwave hemispheric radiation budget (up- and down-welling) as well as direct air-sea turbulent fluxes. Finally, a UAV-deployed dropsonde-microbuoy was developed in order to profile the temperature, pressure and humidity of the atmosphere and the temperature and salinity of the near-surface ocean. These technological advancements provide the next generation of instrumentation capability for UAVs. When deployed from research vessels, UAVs will provide a transformational science prism unequaled using 1-D data snapshots from ships or moorings alone.
Introduction
The unmanned aerial vehicle (UAV) is proving to be an important modern sensing platform (Elston et al., 2014). It supplements the sensing capabilities from traditional platforms such as satellites, aircraft, research vessels, moorings, and gliders. In the single previous decade, there have been significant reductions in volume, weight, and power requirements from commercial, high-accuracy and high-sensitivity ocean and atmospheric sensors used on traditional platforms. Additionally, the resources required to operate and maintain UAVs represent significantly lower impact than those of traditional platforms. These reductions in high-accuracy sensor operating requirements and of the resources required to maintain and operate UAVs (relative to larger platforms) are tipping the scale toward ubiquitous UAV operations (Johnston, 2019).
Some clear advantages of the UAV platform are lower manufacturing and maintenance costs; fewer personnel and less environmental impact; lower fuel and power requirements while preserving operational longevity. UAVs, like satellites and aircraft, can provide a synoptic view of a relatively large area, but can additionally provide several orders of magnitude increase in spatio-temporal resolution. While they are like some aircraft that are able to fly under cloud decks to observe the ocean surface in regions that are perennially cloud covered such as the Arctic (Cassano et al., 2010; Williams et al., 2016) or the Inter Tropical Convergence Zone (Chen et al., 2015), they can additionally fly much slower to provide unprecedented ground resolutions as fine as 1 cm. Further, UAVs can be tightly coordinated with other, non-UAV field ops in ways that an aircraft mission staged from a far-off airfield cannot. UAVs can be flown in conditions that may be deemed too dangerous for manned flight, such as over areas with unsafe terrain like melting sea ice. More extreme uses include low altitude flights of UAVs launched from manned aircraft into hurricanes (Cione et al., 2016, 2019), and flight near and through dangerous thunderstorms and tornadoes (Elston et al., 2011). Additionally, the simultaneous deployment of dual or more UAVs have the potential to provide unprecedented spatio-temporal mapping with multiple types of sensors (atmospheric, imaging, radiation, etc.). Some challenges of the UAV platform are the size, weight, and power limitations for instrument hardware, along with flight endurance, and the ability to obtain flight permissions for UAV operations in areas of scientific interest. However, there are some observations afforded only to the UAV platform that are not possible from any other platform.
Satellites are often brought to bear in order to study spatially varying physical characteristics of the Earth’s oceans. However, they are limited by their spatial resolution of order 0.01 km to 1 km and by interference due to clouds. Some parts of the world are almost never “seen” by satellites during certain times of the year due to pervasive cloud cover. Many land and ocean processes occur at scales smaller than 1 km and therefore are not resolved by satellites. Specifically, coastal regions, lakes, rivers, coral reefs are examples of locations are not well observed by the coarse resolution satellite data. In addition, effects of anthropogenic impact of coastal urban areas are also not amenable to observation by coarse satellite data.
Given that UAVs are able to be deployed from research vessels, there is a fantastic opportunity to expand the physical descriptions of ocean surface processes that would come from 1-dimensional data snapshots from ships or moorings alone. Applications for UAVs in air-sea interaction span from the polar regions to study polynya (Cassano et al., 2010; Knuth and Cassano, 2014) and the marginal ice zones, to the tropics to study ocean waves, turbulent air-sea fluxes and mixed-layer dynamics (Reineman et al., 2013, 2016). Furthermore, unmanned aircraft have been used to make measurements of the vertical profiles of atmospheric aerosols in polar regions (Bates et al., 2013). UAVs are also useful platforms for rapid assessment of phytoplankton blooms in oceans, bays and estuaries using hyperspectral measurements (Shang et al., 2017), as well as imaging spectroscopy of quantitative biochemical and biophysical characteristics of terrestrial environments (Lucieer et al., 2014). Exploration of upper ocean physical processes is necessary to advance our understanding of the fluxes into and across the ocean mixed layer. These dynamics in the upper ocean boundary layer (OBL) are critical to the coupling between the atmosphere, the wave surface and the deeper ocean, linking the atmosphere to the deep ocean and determining the vertical profiles of essentially all physical, chemical, biological, optical and acoustic variables in the upper ocean.
Regional variability of ocean surface thermal properties is known to be important to air-sea fluxes; by using UAV-equipped imaging systems, one is able to observe small-scale structures (on the scale of kilometers or smaller) within the IR imagery that may drive or enhance exchange under low wind speed conditions (Zappa and Jessup, 2004, 2005; Farrar et al., 2007). The diurnal surface heat budget, air-sea fluxes, upper-ocean heating/cooling, and mixed-layer processes have been studied through traditional ship-based means as coupled boundary layer systems in low winds (Zappa and Jessup, 2005; Edson et al., 2007; Farrar et al., 2007) and in the context of the Madden-Julian Oscillation (Moum et al., 2014; Chen et al., 2015). Furthermore, UAV-based observations offer the ability to study phenomena which are small enough in scale (hundreds of meters and smaller) to be “sub-pixel” of satellite ocean color and SST products. These types of measurements will transform our understanding of biogenic slicks and their impact on surface ocean physics, chemistry, and biology.
For the work that follows, our specific charge was to improve overall UAV air-sea and atmosphere-ice-ocean observational capabilities, particularly by increasing the spatio-temporal resolution of physical and biogeochemical measurements. The final design specifications clearly demonstrate the unprecedented spatial (10 cm sampling at 1000 m altitude) and temporal (10–100 Hz sampling) resolution attained for these UAV payloads. Here, we describe the development and application of sensor payloads for flight on ship-deployed UAVs. First, we will present the observational campaigns. Next, we will describe the UAVs and the technical details of the instrument payloads (see Table 1). The nominal payloads are: (a) VIS-TIR/HI-TIR: Thermal Infrared and Visible Imagery with LiDAR, (b) HYP-VNIR/HYP-NIR: Visible Near-Infrared and Near-Infrared Hyperspectral Imaging Systems, (c) RAD: Longwave and Shortwave Irradiance, (d) DDμD: Drone-Deployed micro-Drifter, and (e) MET: Meteorological Measurements with LiDAR. Finally, we present some examples of data from each payload and discuss the results.
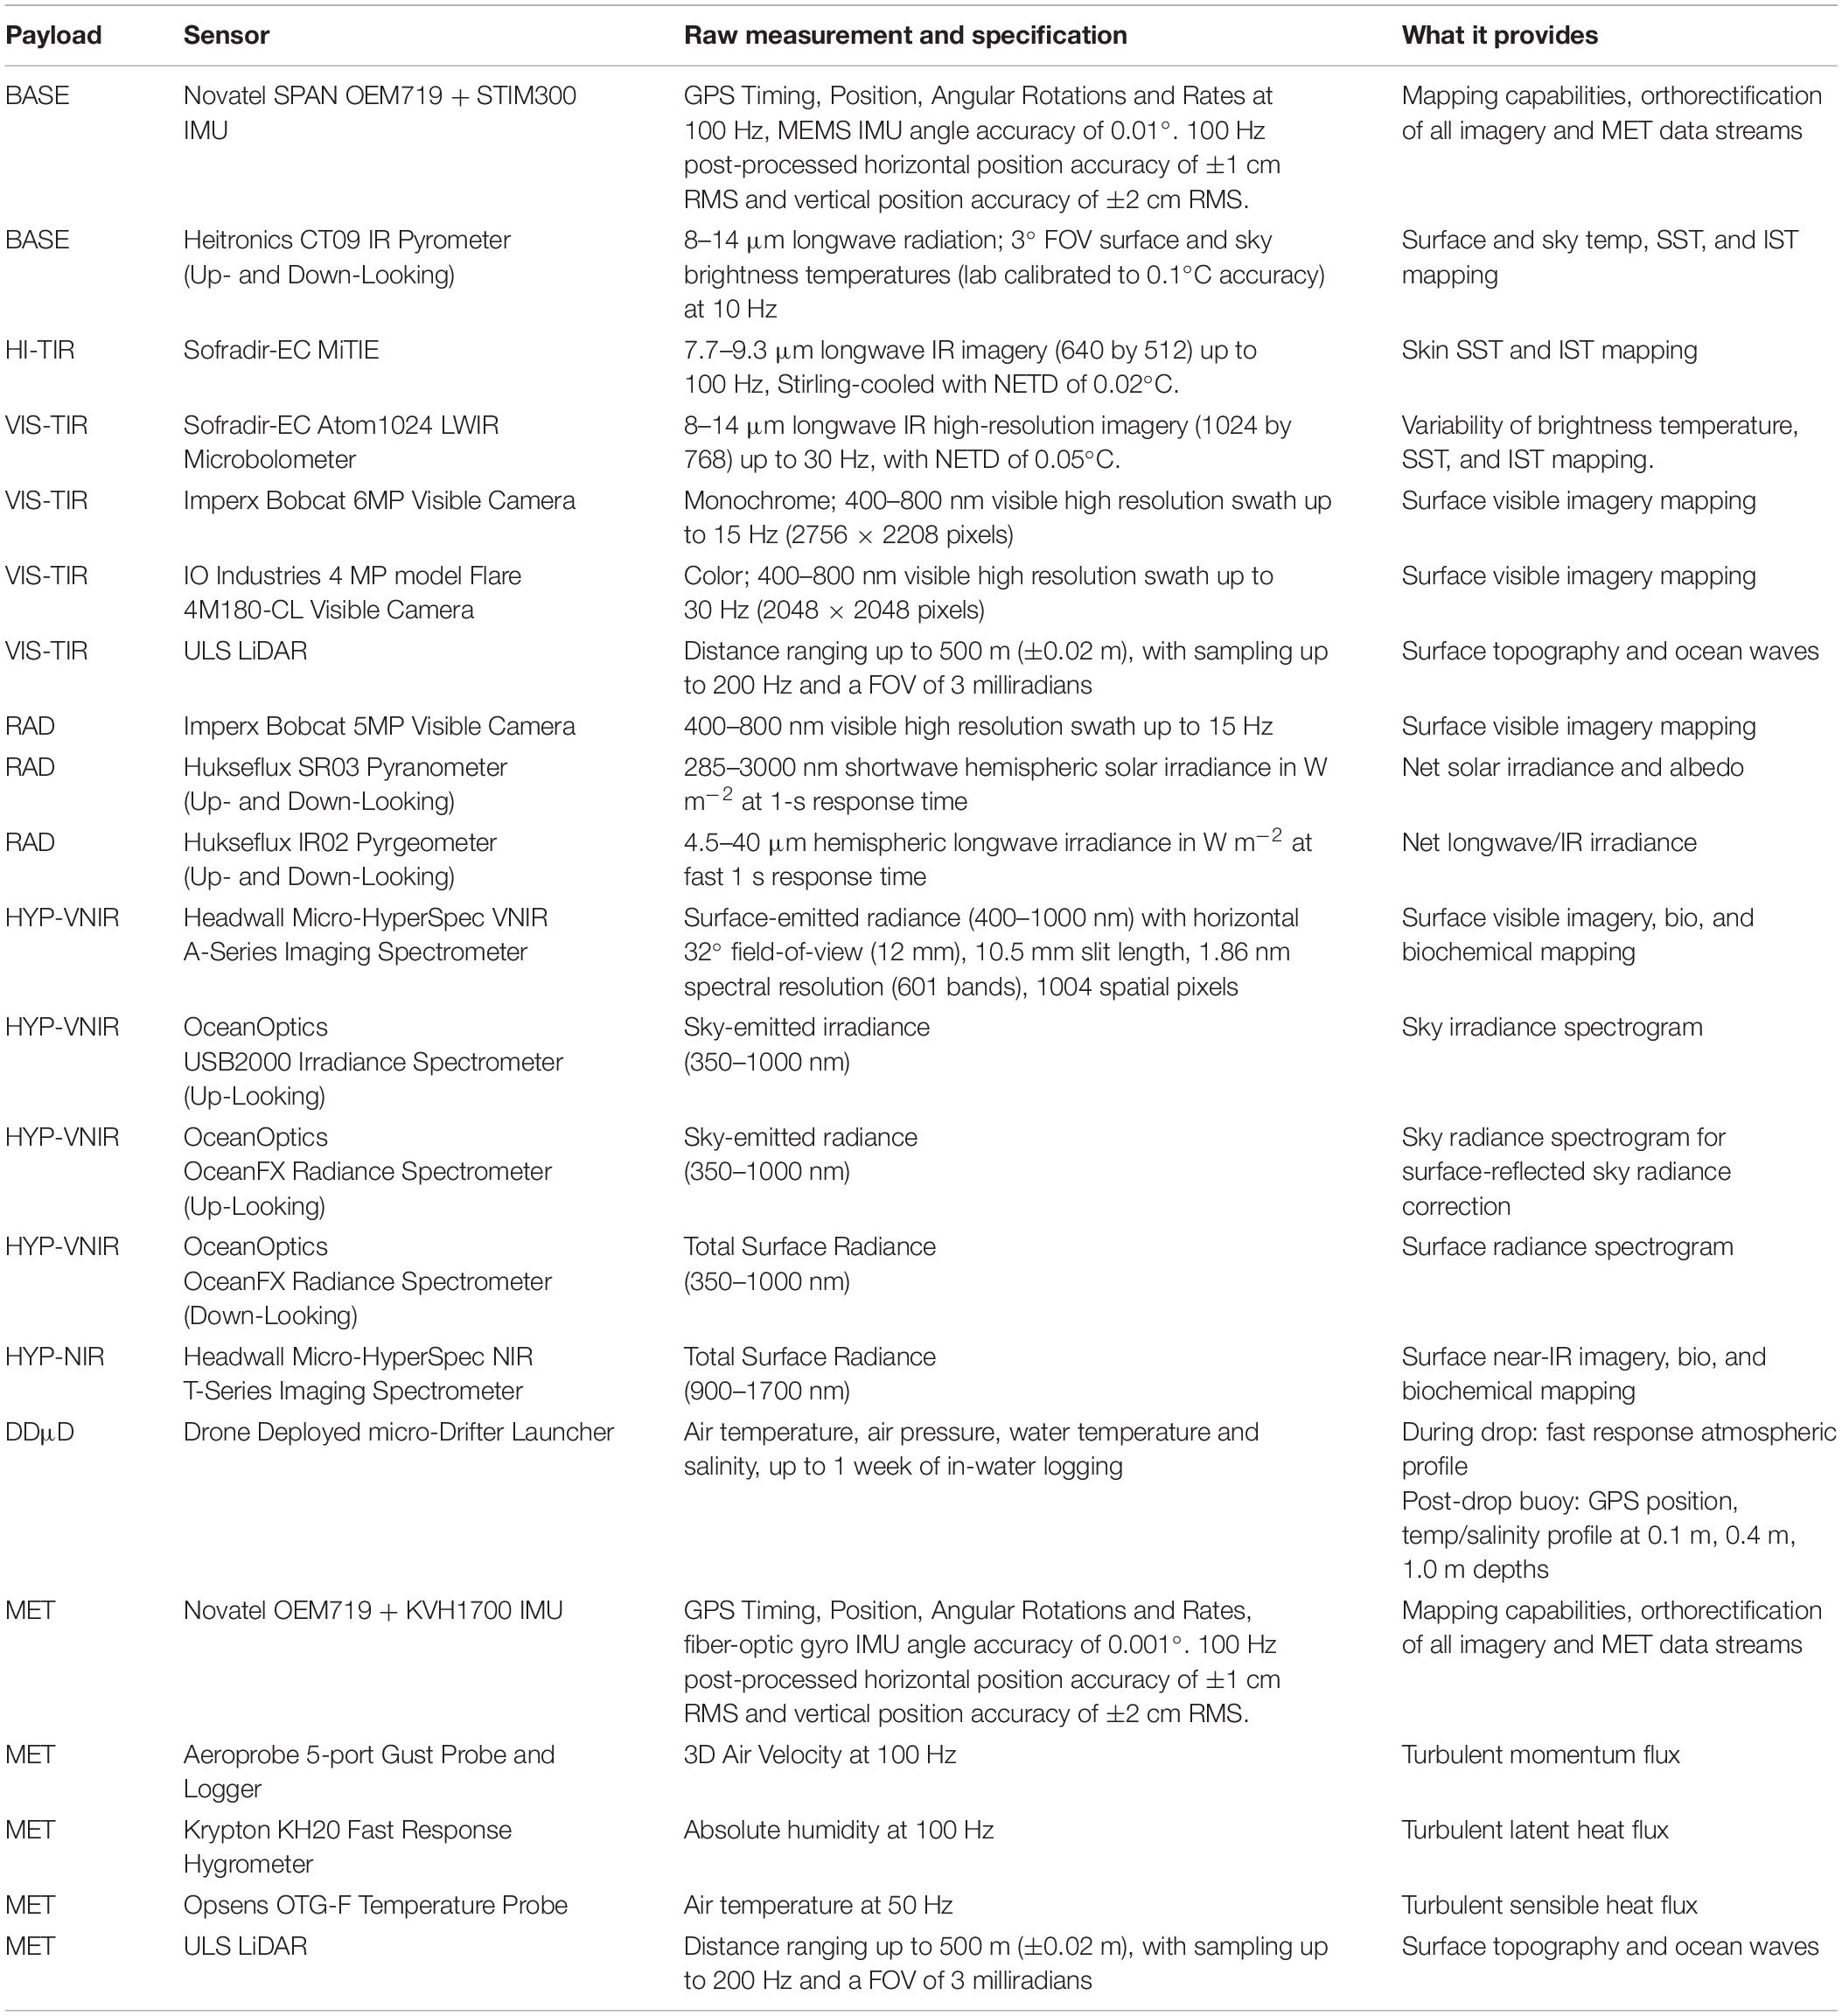
Table 1. Description of each instrument payload, including sensor components, measurement outputs and performance specifications.
Observational Campaigns
In 2013, we launched an ambitious program to develop scientific instrument payloads for moderate-size UAVs. The payloads were first integrated into the Sensintel Manta UAV (Figures 1a,b) and operated in April 2015 at the Ny-Ålesund Research Village (79° N) on the island of Spitsbergen in the Svalbard archipelago, Norway (Figure 2). The chosen UAV platform was the Manta, produced by BAE Systems and owned and operated by the NOAA Pacific Marine Environmental Laboratory. The Manta can support up to 4.5 kg of payload mass, a volume of 28 cm × 18 cm × 23 cm (D × W × H), and 40 W of steady power. We successfully acquired eight flights of atmosphere-ice-ocean data during the Ny-Ålesund deployment, which represented the third UAV deployment since 2013 with science payloads designed and built at Lamont-Doherty Earth Observatory (LDEO). In all, we implemented seven different science payloads (described below), each designed for different sensing applications.
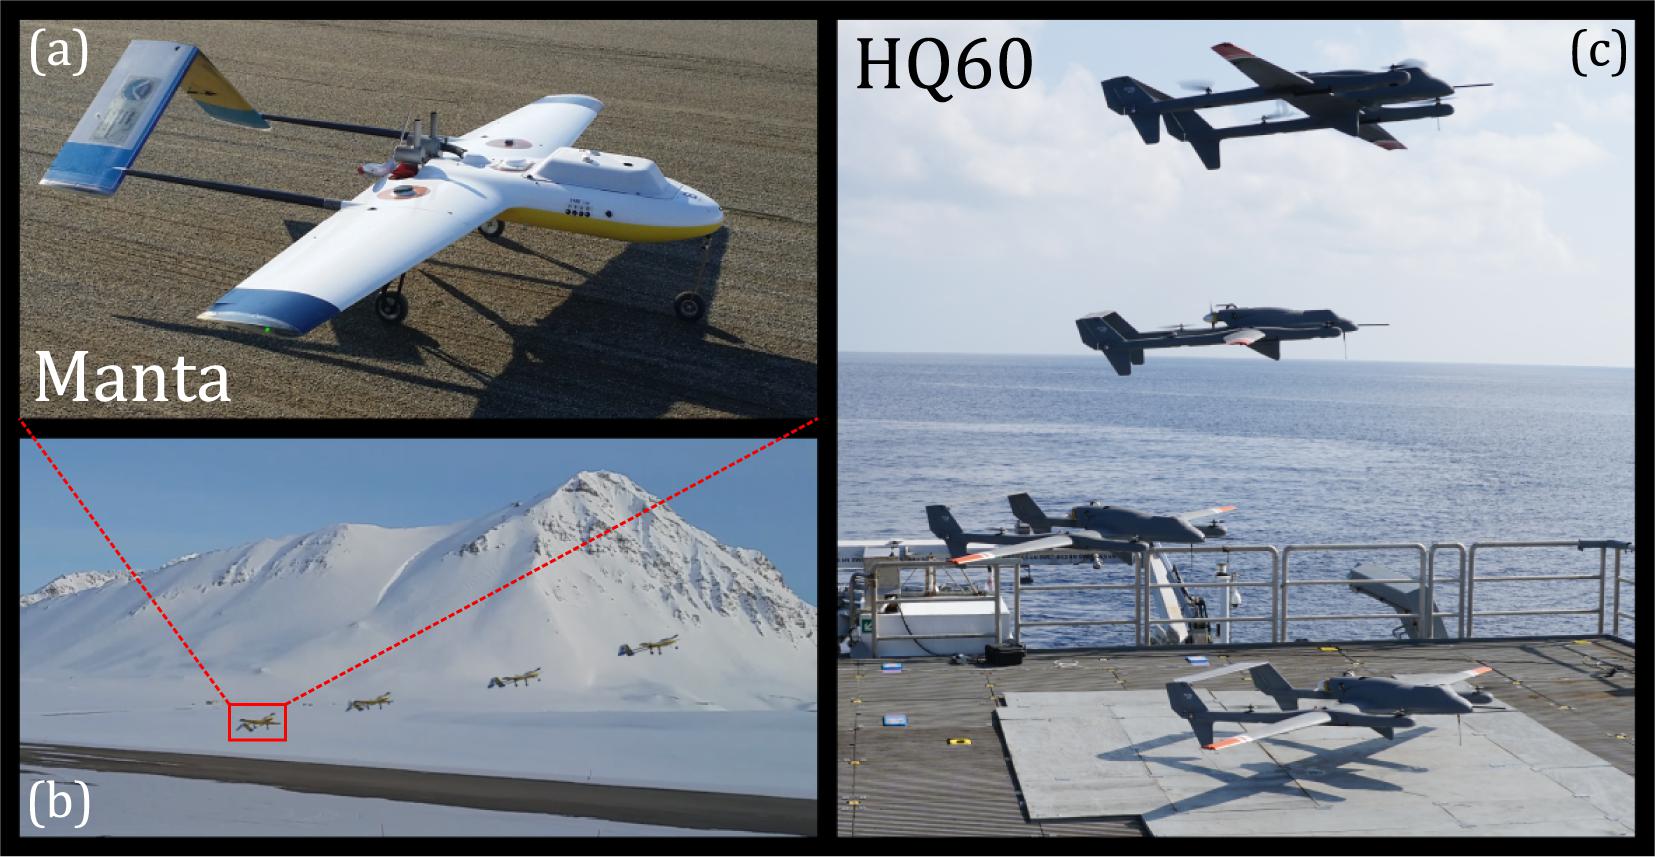
Figure 1. (a) Manta UAV with the LDEO RAD Payload (b) performing a wheel-takeoff in Ny-Ålesund, Svalbard in May 2015. (c) Latitude Engineering HQ-60 performing a vertical takeoff from the deck of the SOI R/V Falkor in the South Pacific Ocean in November 2016. The photographs in (b) and (c) are composites built from multiple video stills.
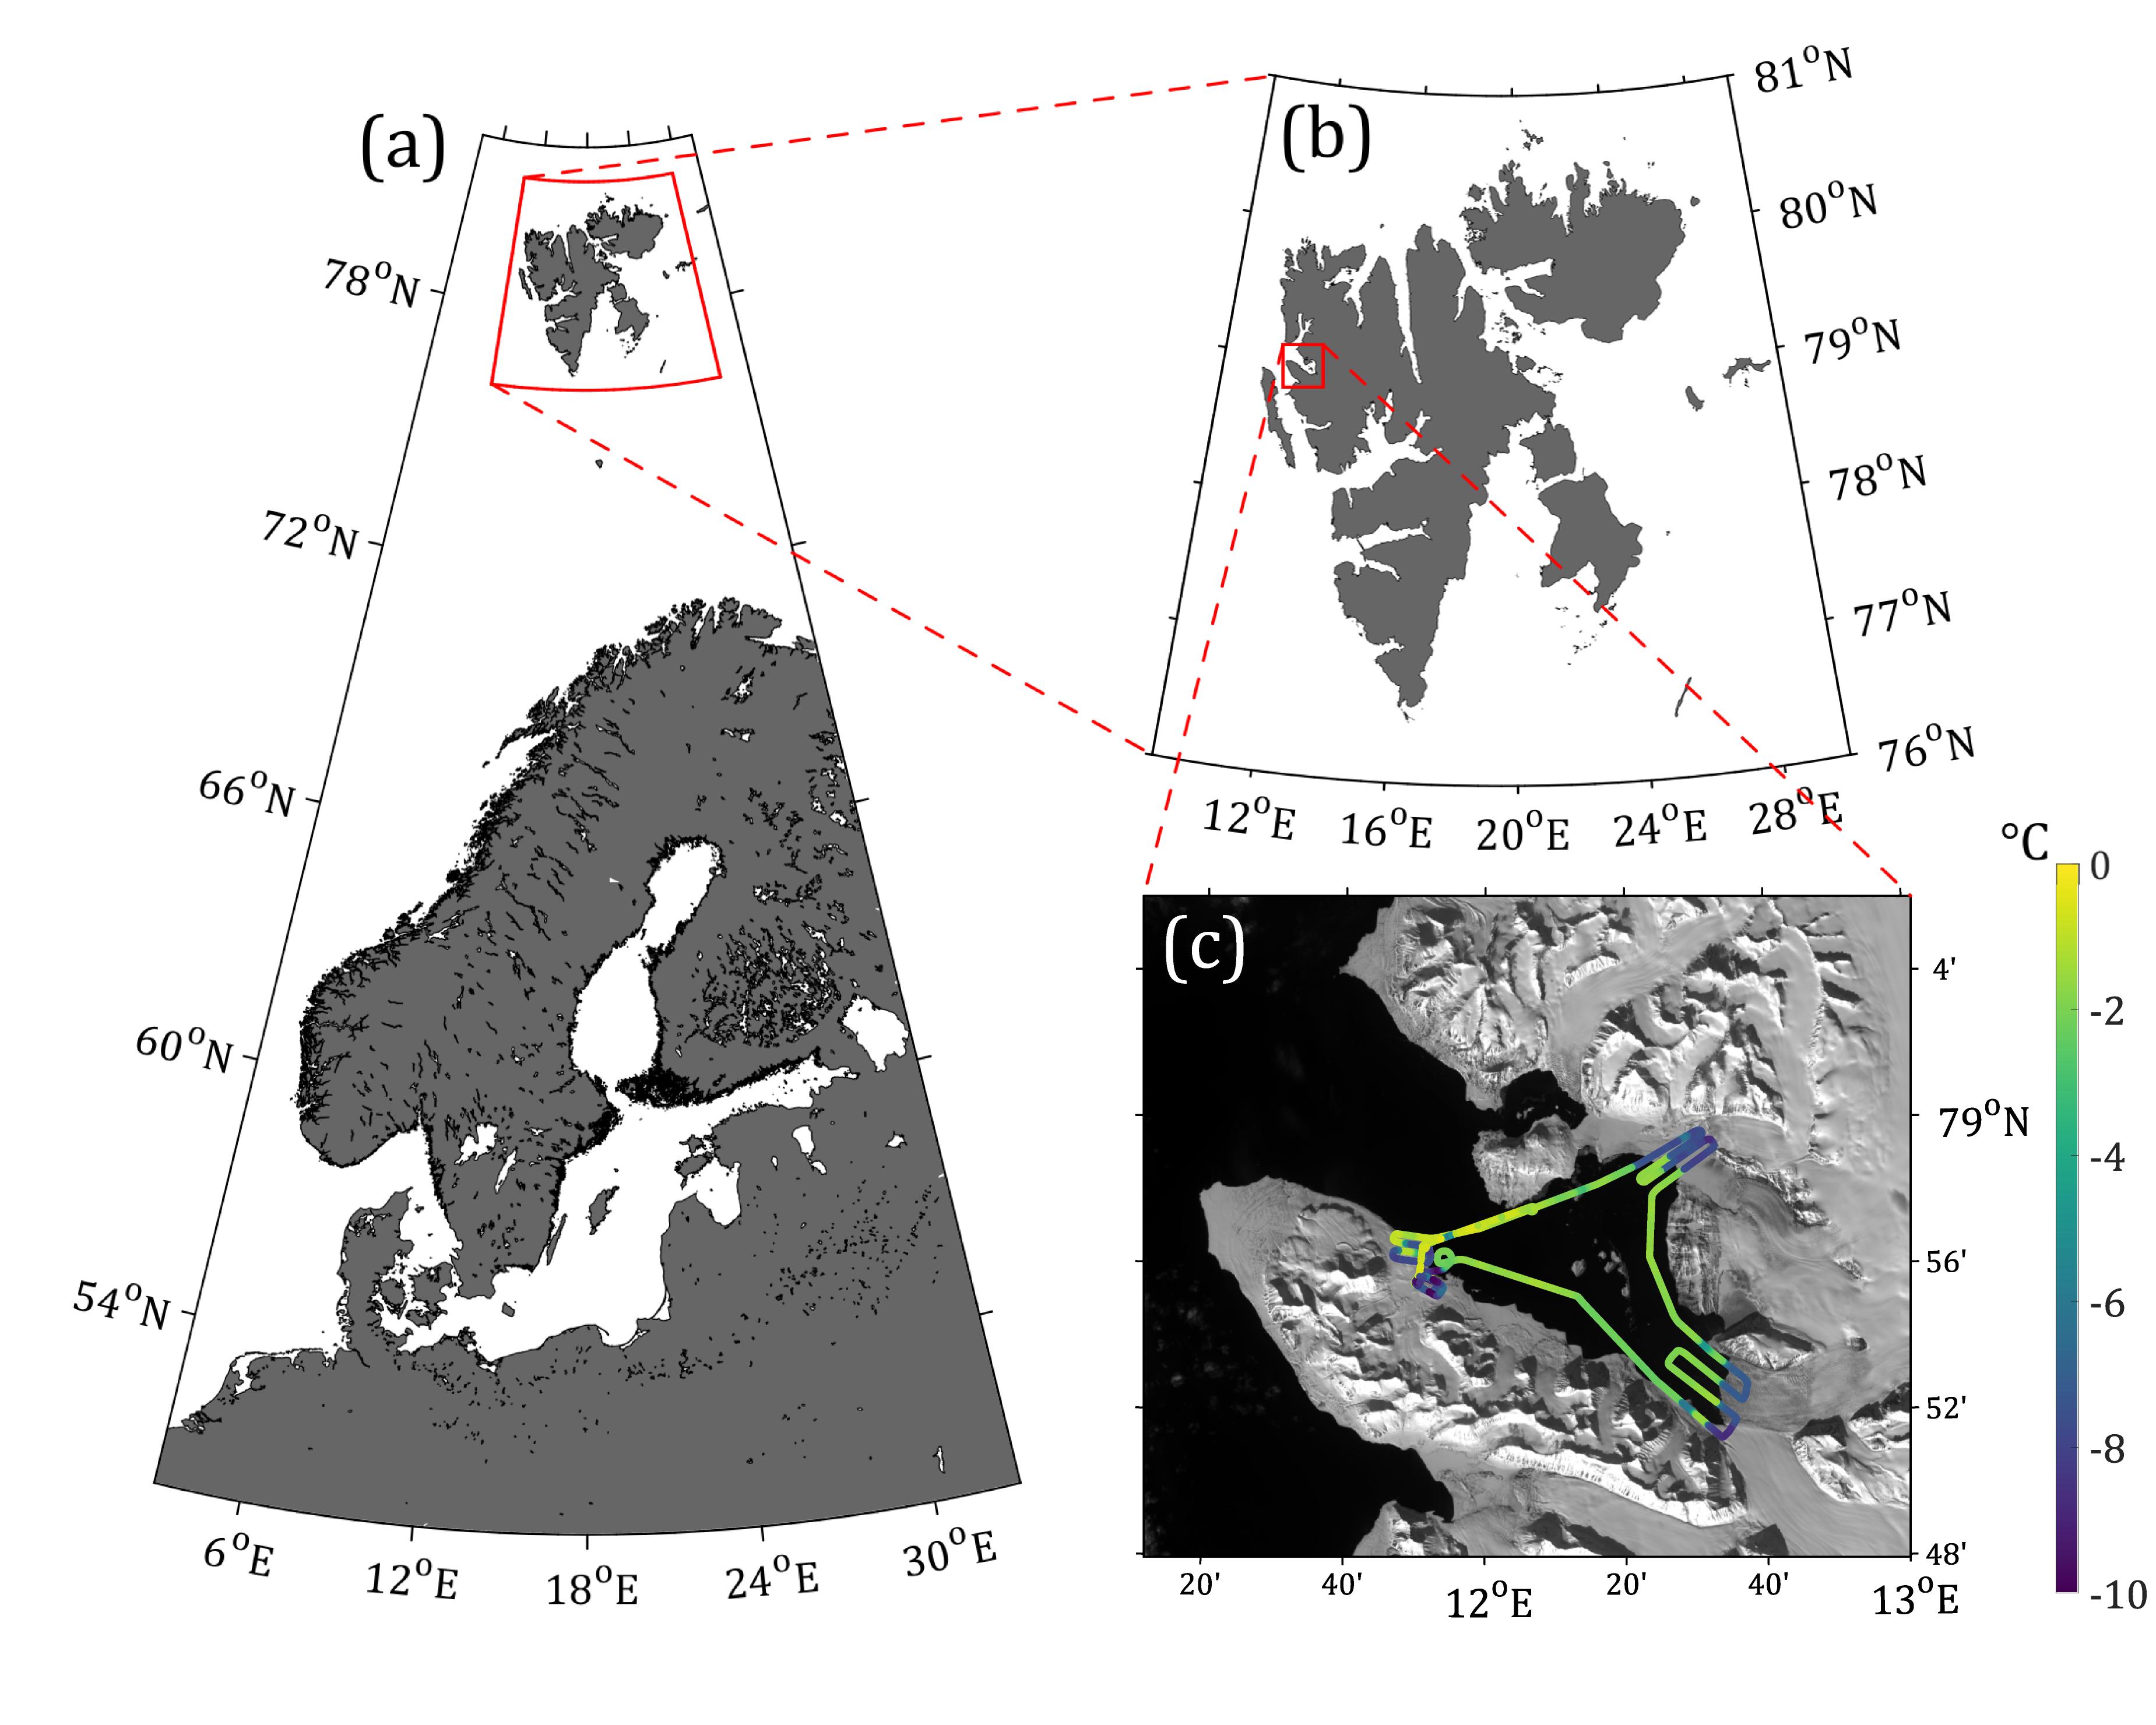
Figure 2. (a) Norway, Sweden, Finland, and Eastern Europe, with Svalbard boxed in red (North up); (b) zoom of red box in (a) highlights Svalbard as a whole; (c) zoom of red box in (b) showing a single fjord where the Ny-Ålesund base is located, with a map of payload-recorded surface brightness temperature on 29 April 2015 overlaid onto a 60 km × 60 km Landsat image from the same day. The surface temperature standard deviation of the fjord water): 0.332°C.
We determined that fixed-wing flight with vertical take-off and landing capability (VTOL) would be essential for ship deployments that allow for high endurance. In 2016, we integrated all our payloads on the Latitude model HQ-60 fixed wing UAV with VTOL capability. Observations were made in the Western Pacific 400 nautical miles south of Guam during cruise FK161010 (11 October to 10 November 2016; R/V Falkor). Figure 3 shows a map of the focus region north of Papua New Guinea and several UAV flight missions, including one flight track coded with surface brightness temperature. These operations demonstrated the utility of the ship-deployed UAVs using the HQ-60 from the R/V Falkor (Rahlff et al., 2018; Wurl et al., 2018). We demonstrated the impact of scientific UAV usage extends into the realm of upper-ocean biological processes. The sea surface microlayer (SML; the upper 40–100 μm of the ocean surface) is a region of dynamic biological, chemical and physical activity, is a challenging environment to observe (Kurata et al., 2016; Engel et al., 2017; Ribas-Ribas et al., 2017). Through high resolution thermal and hyperspectral imaging of the sea surface, one is able to investigate the idea that biogenic slicks, of Phytoplankton and other sea surface microlayer constituents will affect the transfer of heat into the water column and thereby significantly alter the surface heat budget and the response of the mixed layer (Wurl et al., 2018).
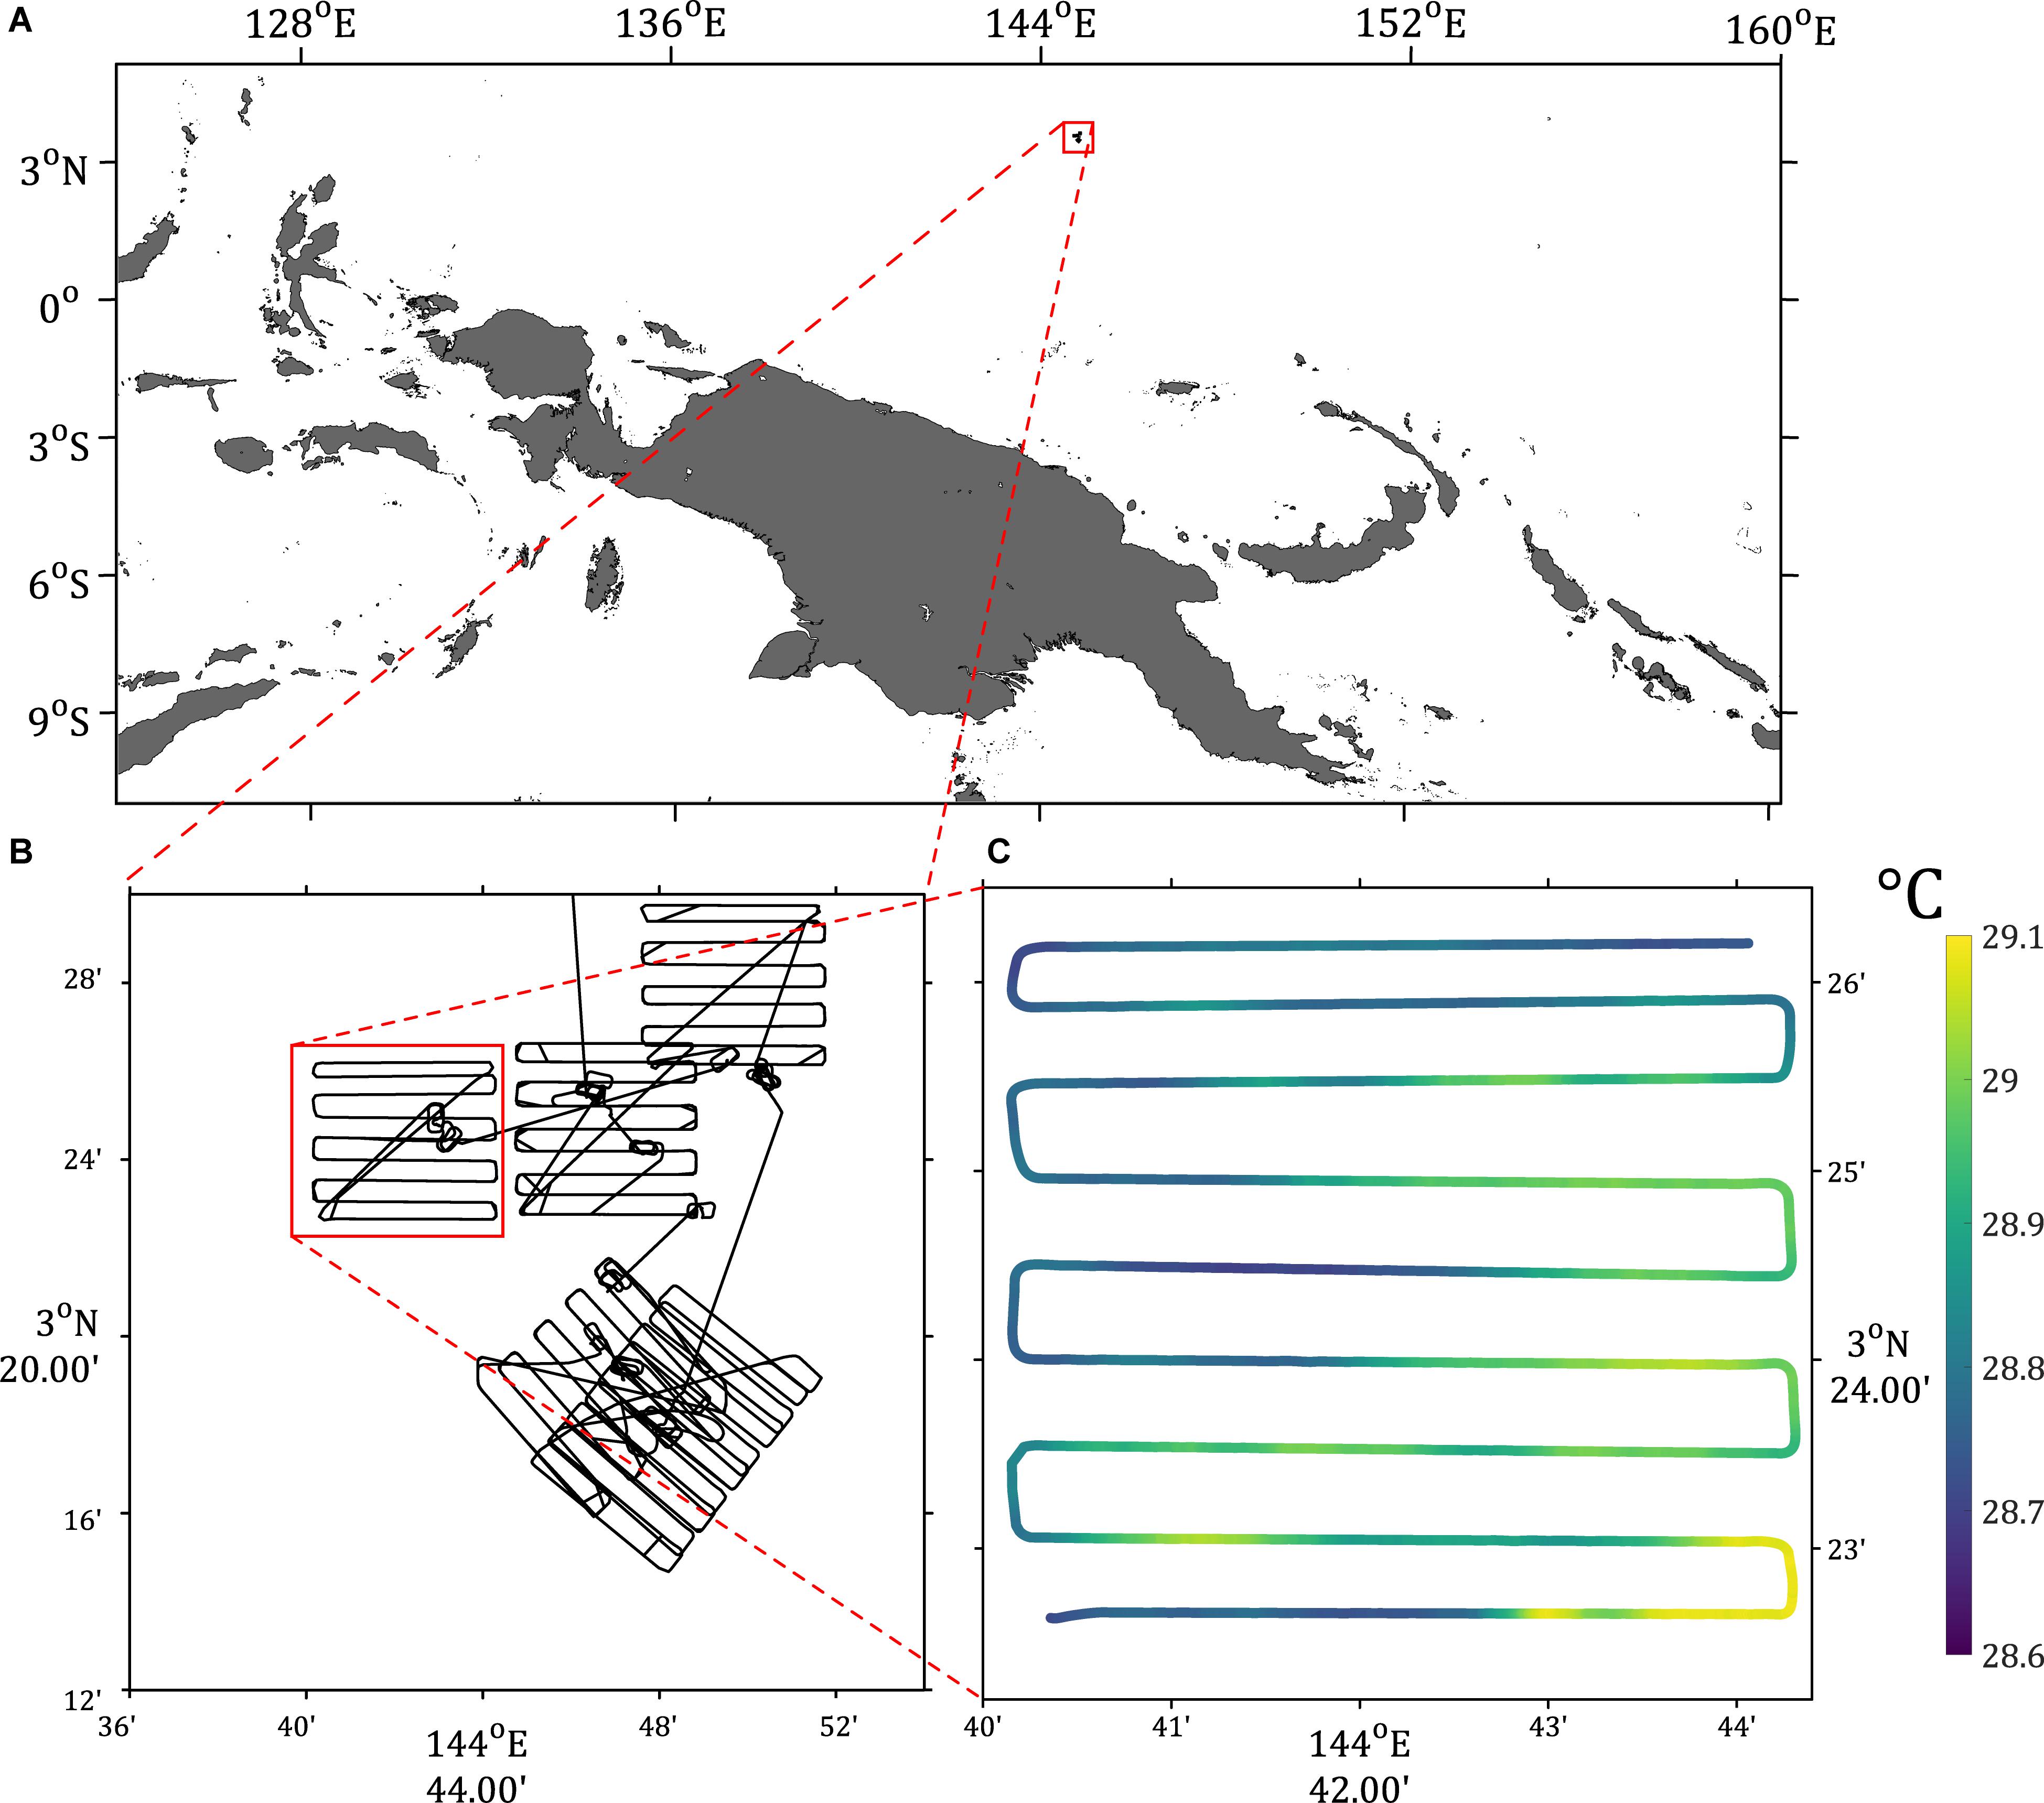
Figure 3. (A) Map of the Western Equatorial Pacific Ocean. Red boxes represent progressive zooms showing several example flight tracks (B) and a single track (C), colored by the sea surface brightness temperature in ° Celsius. The flight in the final panel occurred on November 2nd, 2016 at 0500 UTC. Surface temperature standard deviations: 0.282°C (CT09 on UAV), 0.157°C (MODIS on Aqua).
Technical Details
Unmanned Aerial Vehicle Characteristics
The term Unmanned Aircraft System (UAS) is used to describe the entire suite of technology used for UAV flight. This includes the ground control station, antennas, communication devices, operator, and the UAV itself. Because the developments relevant to the present work are focused around the aircraft and its payloads, the term UAV will be used exclusively throughout the rest of the paper.
For any ocean experiment aboard a research vessel, UAV takeoff and landing are critical to the success of the flight missions. Many land-based UAVs take off using a catapult system; nearly all do when deployed from research vessels. Their recovery is typically made using a net or some wing capture mechanism, like the SkyHook for the Boeing in situ Scan Eagle [e.g., (Reineman et al., 2016)]. Both the catapult and recovery mechanisms, while viable, are cumbersome to deploy during ship operations requiring considerable personnel and deck space. These violent, high-load recoveries have proven more difficult as payloads have become more sophisticated.
We have determined that, in order to alleviate these difficulties, the vertical takeoff and landing (VTOL) capability is ideal for ship-based UAV deployments. There are a number of possible aircraft options. We have focused in on the HQ-60B (see Figure 1c), a new concept for long endurance VTOL that integrates the Piccolo autopilot from Cloud Cap Technology. Hybrid Quadrotor (HQ) technology offers an innovative and logistically simple solution to the problem of VTOL: it combines the VTOL capabilities of a quadrotor and the efficiency, speed, and range of a normal fixed-wing aircraft. Some of the advantages afforded by HQ technology include:
• Reduced operational footprint – no runway requirement, no approach obstacle issues, no launch/recovery infrastructure required.
• Portability – by eliminating launch and recovery equipment, there are significantly fewer items to transport and ship.
• Lower initial system cost – no launch and recovery infrastructure or expensive aircraft sensors required for VTOL capability.
• Reduced ongoing operational costs – fewer complex and cumbersome system elements to maintain, fewer people required to operate the system.
The HQ-60B cruises at an airspeed of 23 m s–1, with an endurance of 15 h at a nominal 4.5 kg payload. The HQ-60B can reach altitudes of 4,200 m above mean sea level, has a wingspan of 381 cm and a mass of 43 kg. The flexible payload capacity using swappable instrument mounting brackets combined with HQ-60B’s large amount of available onboard power (250 W at 24 VDC) allows deployment of extensive sensor suites. Compared with helicopters, HQ technology is less complex, more cost effective, more reliable, and has better endurance. Compared with pure multi-rotors, HQ technology has higher top speed, greater endurance, improved wind tolerance, and can cover more ground. Compared with fixed wing aircraft, HQ technology may be deployed from more locations, a greater variety of terrain, and from more types of platforms, all for less cost. Recently, we have upgraded to the HQ-90B with increased payload of 6.8 kg and swappable nose cones and fuselage mounting, all with similar endurance to the HQ-60B. It has a wingspan of 470 cm a mass of 52 kg. L3 Latitude’s HQ line of aircraft represents a giant leap in UAV capability, enabling long-endurance missions with VTOL and optimized to perform in remote locations such as Alaska’s Arctic coastal communities.
These systems have been well tested by LDEO with over 50 total flights and over 150 total flight hours. We have demonstrated the utility of the HQ systems as ship-deployed platforms on the R/V Falkor in October-November 2016 between Australia and Guam (Rahlff et al., 2018; Wurl et al., 2018) and have recently deployed them in the field in Kotzebue Alaska in April-May 2018 and 2019.
Instrument Payloads for UAVs
In order to facilitate multiple types of scientific observations from a single platform, a modular payload style was developed (Figures 4, 5; Table 1). The imaging sensors chosen for this project have increased spatio-temporal resolutions and sensitivities for visible, thermal infrared, and imaging spectrometer sensors relative to the bulk of previous UAV work. These advancements are principally due to hardware miniaturization of newly developed R&D sensors with specifications that maintain or build upon the more widely available technology. Solar and longwave hemispheric radiometers and the corresponding acquisition hardware have also been downsized while maintaining comparable response times and overall measuring capabilities with their larger analogs. A new kind of launchable drone-deployed drifter was engineered in-house which combines the abilities of a temperature-salinity buoy and an atmospheric profiling dropsonde. The module has been termed the Drone- Deployed Micro Drifter (DDμD). The DDμD is designed to telemeter temperature, pressure, and relative humidity data while it falls through the atmosphere and, with its integrated GPS antenna, to map water temperature and water conductivity data while it drifts in open water. A meteorological payload which incorporates a suite of instruments enables the calculation of eddy-covariance flux. The required measurements for this calculation are fast-response temperature, relative humidity, and 3-D wind velocities sampled simultaneously. Traditional eddy-covariance flux systems have a large volume and weight, and so miniaturization represented the biggest obstacle for these instruments to be viable for a UAV platform. With a desire to build payloads with both efficiency and redundancy, the imaging equipment, the drifter launcher, and the broadband radiation packages were designed to occupy the same volume and utilize the same acquisition hardware. This modular design allowed for the various science instruments to be swapped, while leaving the acquisition, GPS-IMU, and power systems relatively permanently mounted. This feature reduced wear maintenance inherent with changing instruments, and enhanced flexibility for weather-dependent science flight planning, which can change on the order of hours before deployment.
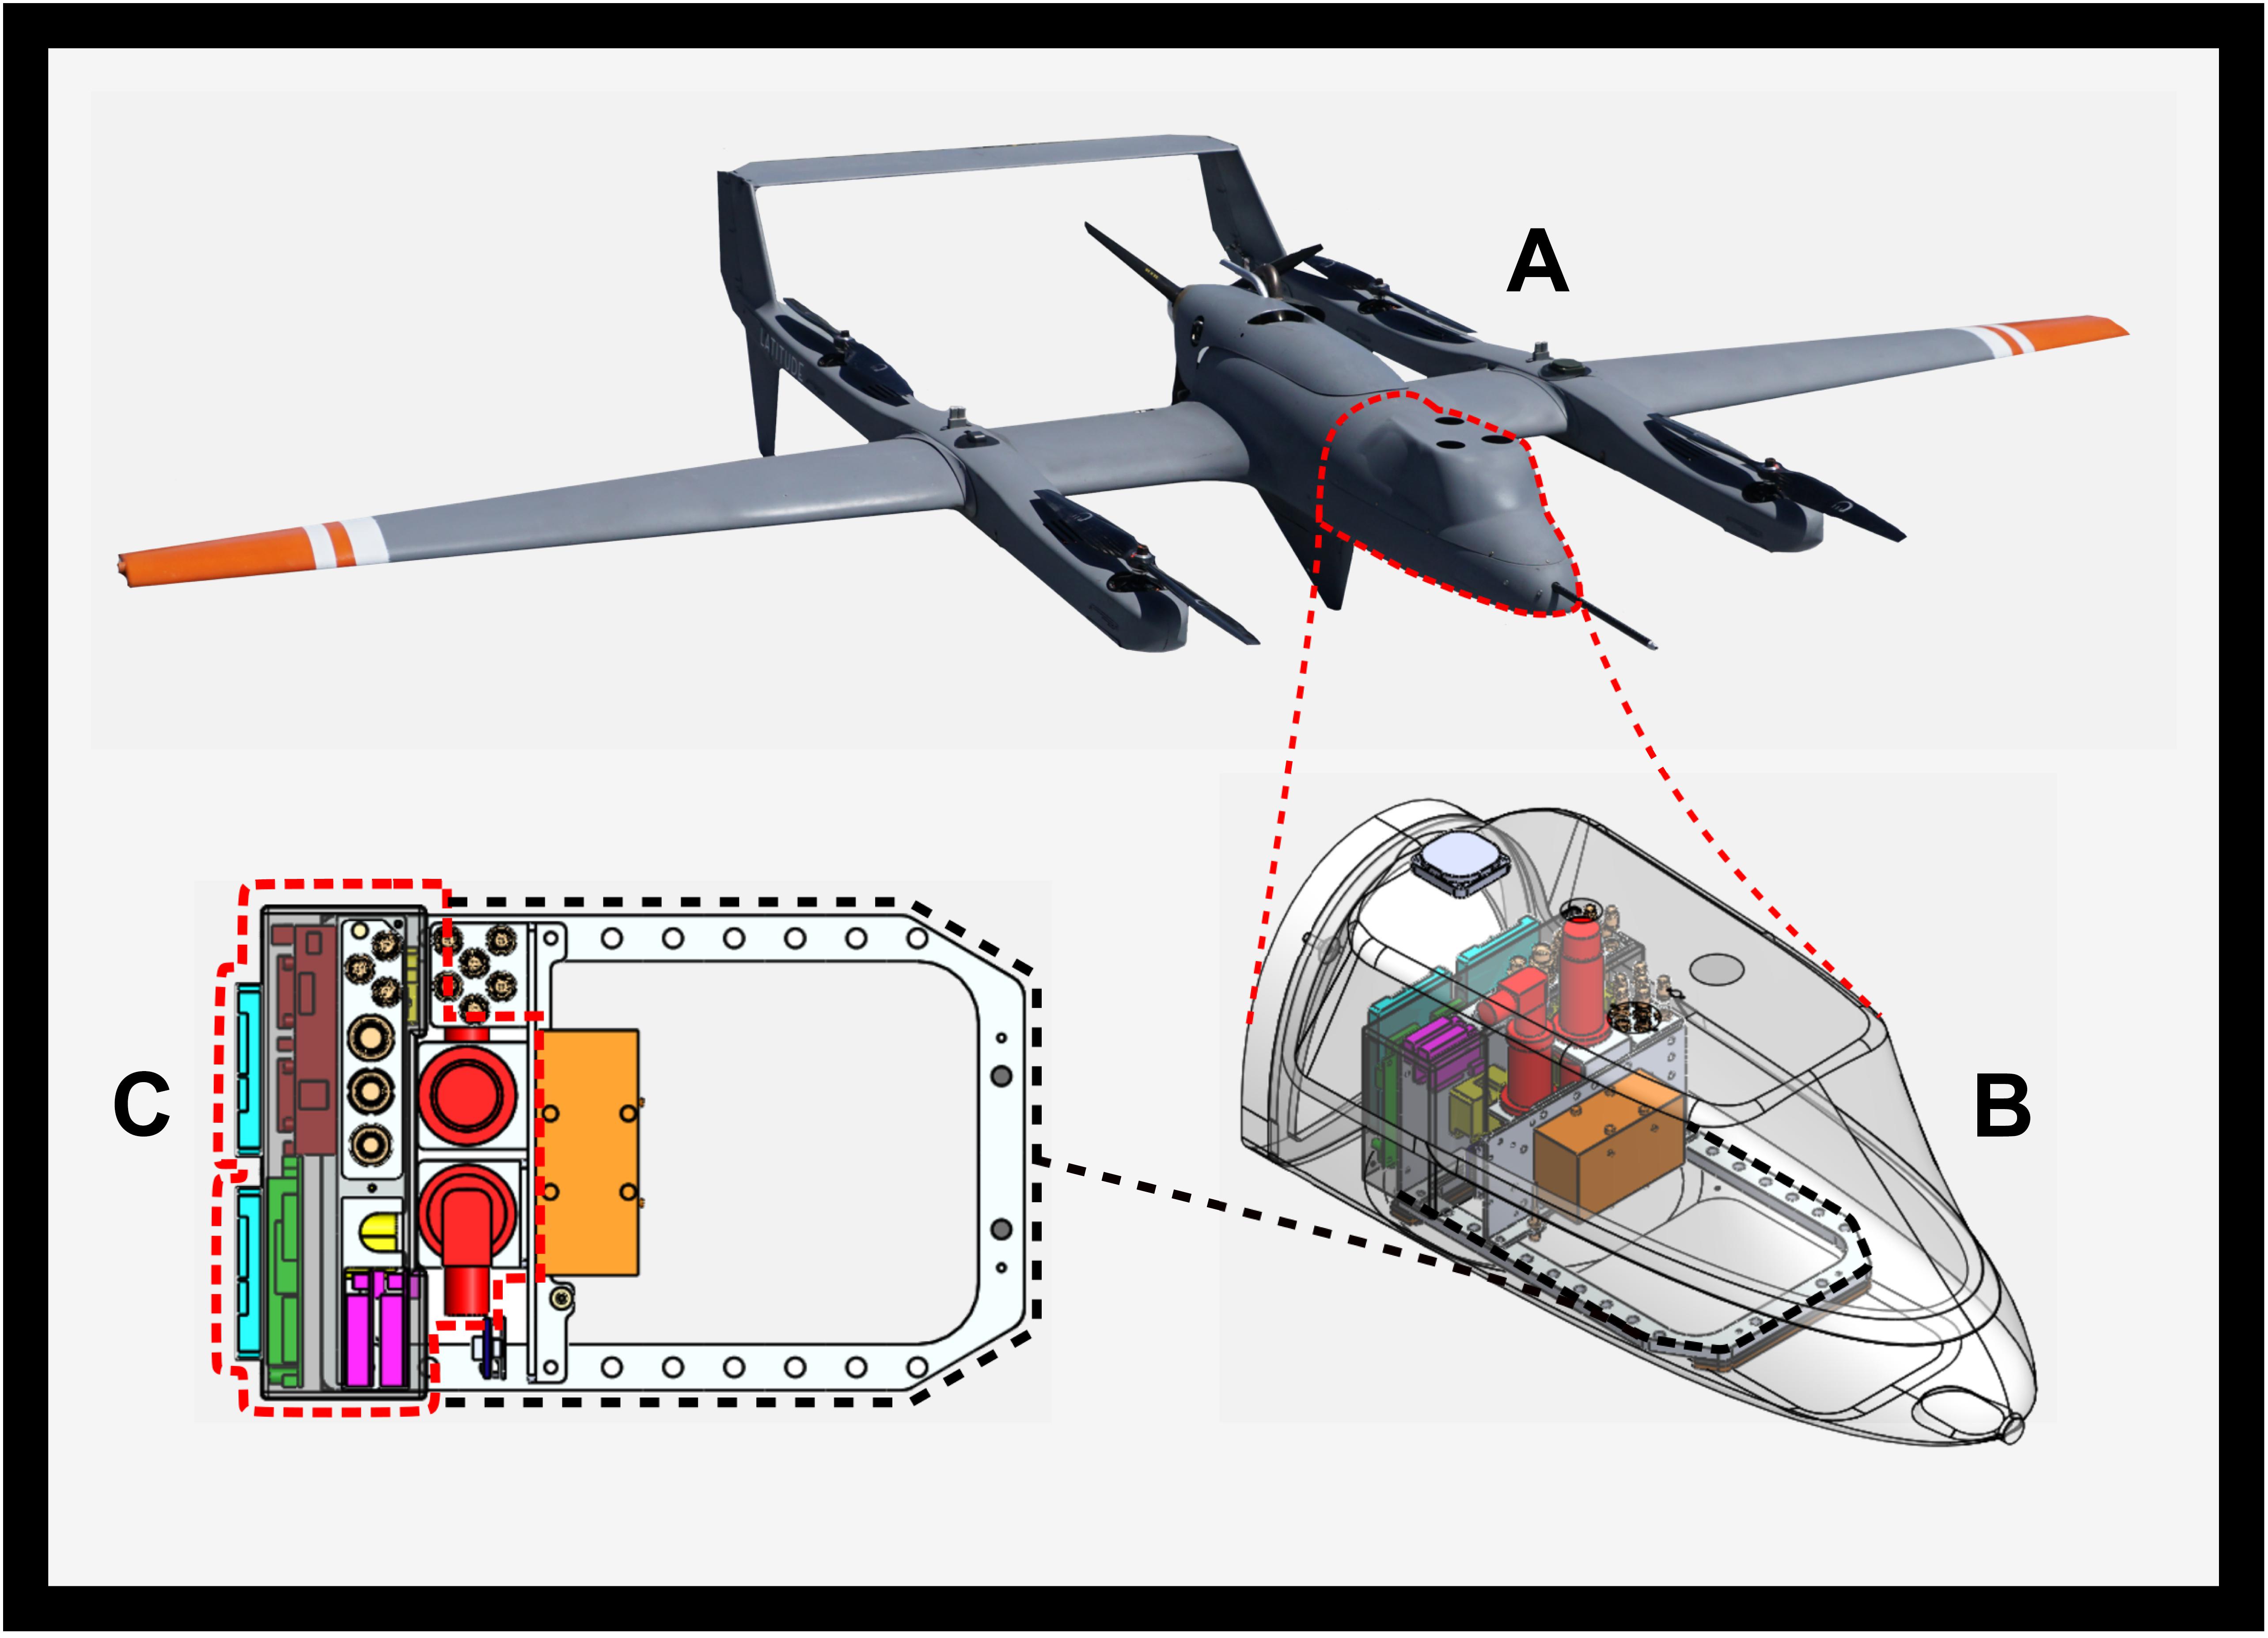
Figure 4. (A) Image of the Latitude Engineering HQ-60 UAV with propellers for both flying and for vertical take-off and landing (VTOL). (B) Profile view of the HQ-60 modular nose cone and lid, with the skin transparent to reveal the Base payload acquisition system mounted inside. (C) Top view of the Base payload within the red-dash line and its square bracket within the black-dash line indicating available mounting holes for the modular ATOM, VNIR, RAD, and DDμD payloads (the Base payload consists of the power supply, imagery DVR, GPS, IMU, and up-and-down looking IR pyrometers).
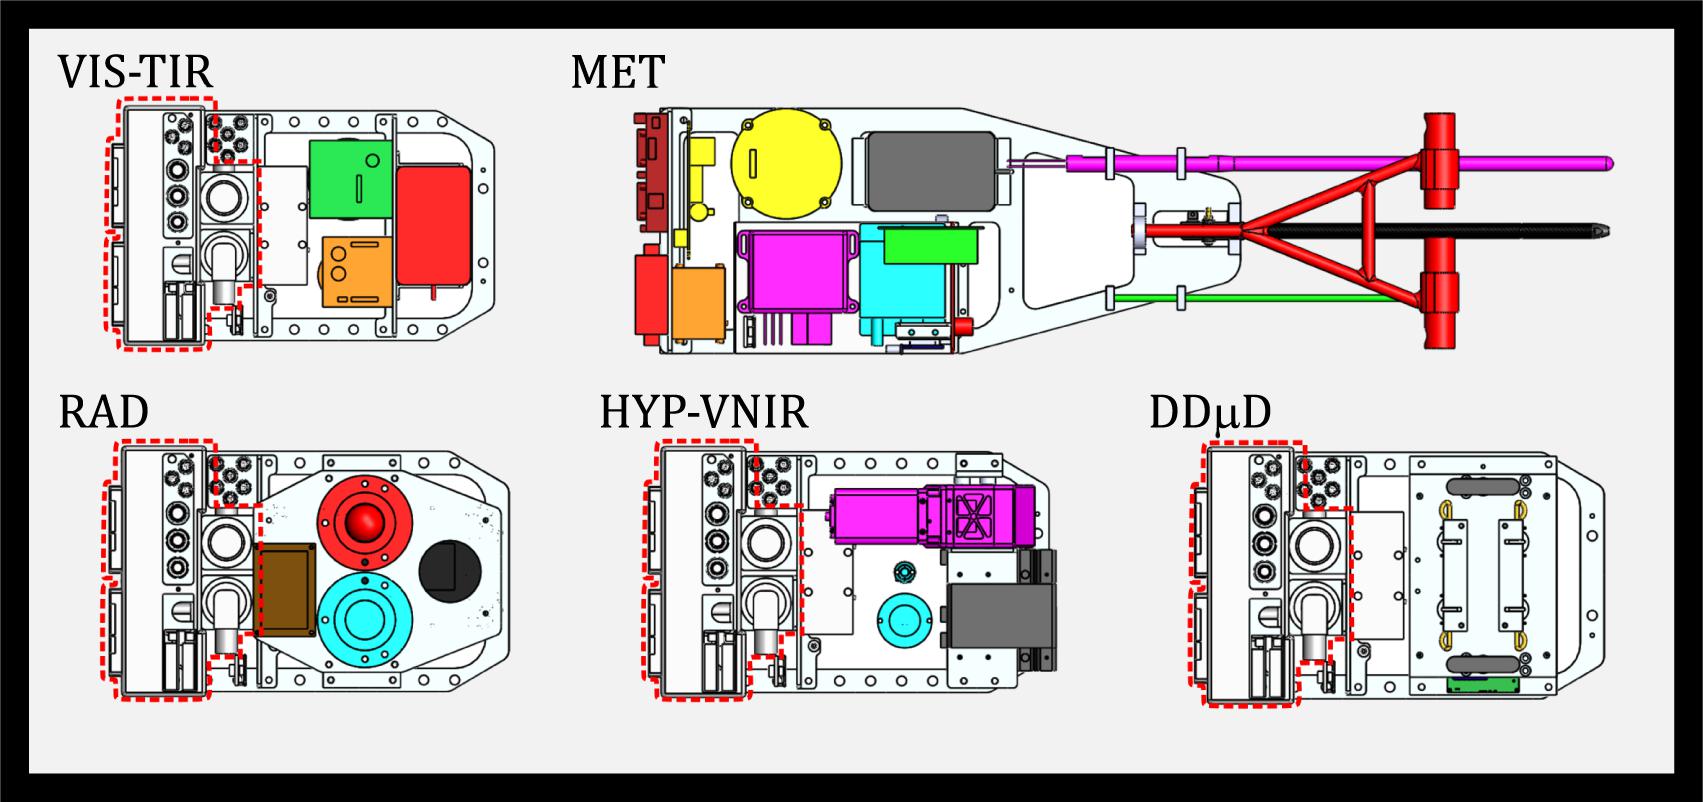
Figure 5. Mechanical drawings of ATOM, RAD, VNIR, and DDμD payload sensors. The Base payload acquisition system (also shown in Figure 4) are indicated by the red dashed line. The MET payload is completely different from the other payloads, which primarily has a completely different acquisition system, with nose-exiting probes and stingers to measure fast-response 3D wind, temperature, and humidity, and an industry-leading GPS and fiber-optic gyro IMU to correct for in-flight UAV motion to the highest possible accuracies.
Base Payload
Overview
All science payloads utilize a common system referred to as the “Base” payload (see Figure 4 and Table 1). The Base payload provides power distribution, computing, a GPS receiver, an Inertial Measurement Unit, and the acquisition and storage hardware for the science instruments, allowing it to remain mounted while the science instruments were interchanged. Custom device drivers were developed to acquire each of the varying sensors with a common hardware. The resulting modular, “hot-swap” feature between the sensors and the Base payload allowed quick determination and modification of science flight planning, which can be dependent on rapidly changing weather conditions. The Base payload also includes permanent upward- and downward-looking pyrometers to measure surface temperature on all flights, a radio transmitter for telemetering data from any drifting DDμDs within range, and an internal relative humidity/temperature probe for monitoring the payload environment. We note that, except for its power distribution system, the Meteorological (MET) payload utilizes different base hardware due to the nature and synchronization requirements of its sensors. Additionally, we have outfitted the Base payload with custom telemetry software to transmit sensor status messages to the UAV ground control station.
Power Supply and Conditioning
Sensor and acquisition hardware require both 12-volt and 5-volt rails to supply the required 45 watts of steady power while recording. Vicor 5V output and 12V output DC-DC switching power converters were connected in parallel to the UAV supply battery. The Vicor supplies were chosen for their robust industrial operation, low noise and ripple, fault, surge, and regulation features, and low weight and size.
The electromagnetic interference (EMI) shielding of power distribution was a top priority. An active EMI filter was installed between the UAV batteries and the Vicor input terminals to address input line voltage ripple. A grounded aluminum enclosure housed the EMI filter and the two Vicor supplies, and through-capacitors were used as the terminals to further isolate the power components inside the aluminum enclosure. The output wiring exiting the housing terminals was twisted/shielded pair terminated into six positive-lock connectors for each of the 5-volt and 12-volt rails. The six terminators on each rail allowed for quick connect/disconnect of hardware.
GPS and IMU for Aircraft Motion
The inertial navigation system in the Base payload consists of a Novatel SPAN GNSS with an OEM719 receiver and a STIM300 MEMS IMU. The GPS updates at 5 Hz, while the IMU updates at 125 Hz. The receiver provides NMEA and PPS signals to synchronize acquisition hardware to <20 us RMS. The receiver also has access to multiple GPS frequencies to accommodate all latitudes between the equator and both poles, including L1/L2, GLONASS, SBAS, and QZSS. The fixed GPS reference/master station is a Leica GX1220 Triple Frequency receiver recording at 10 Hz with a Leica AX1202GG choke ring antenna. Using the Novatel Waypoint Inertial Explorer software, a tightly coupled, post-processed TSPI solution of the raw GPS + IMU data is generated to achieve horizontal position accuracy of ±1 cm RMS and vertical position accuracy of ±2 cm RMS. The post-processed IMU roll/pitch accuracy is 0.006° RMS and 0.019° RMS in heading. We used the long record from the GPS base station as our ground control point validation for the Waypoint solution to be within the calculated accuracy.
Imagery acquired from aboard the UAV during flight was orthorectified according to the algorithm described in Zhou (2009). In summary, the UAV’s instantaneous position and attitude derived from the combined GPS/IMU solution provided the three-dimensional rotation geometry for each camera image. Rectification and geolocation were validated by comparison of rectified imagery, showing overlap within a single pixel over successive UAV sea-ice edge passes.
Embedded Computer
A Versalogic Raven (VL-EPU-3312) embedded computer was used as the host for non-imagery sensor data logging, for bi-directional, in-flight communications between the UAV and the ground station operators, and for in-flight payload sensor status. The Raven is small (3.74″ × 3.74″ × 1.08″), light (0.2 kg), powerful, and offers several features that are well suited for simultaneous acquisition and control of multiple digital sensors. It can operate in ambient temperatures of −40 to +80°C, is rated MIL-STD-202G for vibration and shock, and accepts a wide input voltage of 8–30 VDC. All Base payload and non-imagery sensor payloads are configured and logged locally by the Raven, running 32-bit Windows7 with many background services and security features disabled. The imagery sensors are logged on the IO Industries Core CameraLink Base Framegrabber.
Frame Grabber for Digital Video Recording
The IO Industries, Inc., CoreTM DVR and the Windows-based IO Industries, Inc., Streams7TM software are used for device acquisition of all measurements except the hemispheric radiometers in the RAD payload. With NMEA and PPS inputs, the Core and Streams7 software synchronize multiple devices to within 1 millisecond of GPS time, even when devices are sampling at different rates. Streams7 device drivers can be written to enable acquisition of USB devices. Not only do the synchronization and timing specifications of the IO Industries system make it favorable for a UAV application, it also presents a solution for centralized acquisition of multiple devices with low development time and cost.
Infrared Radiometers
The Base payload also had amenable space for the two narrow field-of-view (FOV; 3°) pyrometers chosen to provide skin temperature measurements. The Heitronics CT09 models were selected for their small size and relative performance, able to sample brightness temperature at 10 Hz. Both up- and down-looking sensors are required to correct for the reflected atmospheric signal. The CT09 spectral response is 8–14 μm; they are accurate within 0.1°C of target temperature.
Science Payloads
VIS-TIR/HI-TIR: Thermal Infrared and Visible Imagery With LiDAR
High-resolution thermal infrared (IR) imagery measured from the HQ-60B are used to remotely sense the characteristics of ocean skin temperature, or SSTskin, at the air-sea interface. With the instruments in this payload one is able to characterize the properties of the surface associated with time varying atmospheric conditions and the ocean surface processes that are relevant to atmosphere-ocean interaction. One is also enabled to provide surface information at higher spatial resolution and with better temporal sampling than is available from ship data, moorings, gliders, etc.
This payload is used in two configurations. The first incorporates a small sensitive Stirling-cycle cooled IR camera to map the temperature structure of the ocean’s surface. The Sofradir-EC model MiTIE Stirling-cooled Mercury-Cadmium-Telluride (MCT) focal plane array of 640 × 480 elements is sensitive to 7.7–9.3 μm radiation and has an FOV of 21.7° × 16.4°. The MCT focal plane array performance will allow for the determination of temperature variability of less than 0.02°C NETD and with spatial resolution 1.5 m at 1000 m altitude at a frame rate of 100 Hz. The second configuration includes a Sofradir model ATOM microbolometer with resolution of 1024 × 728 elements (FOV 38.4° × 28.8°) that are sensitive to 8–14 μm sensitive to temperature variability of less than 0.05°C NETD with spatial resolution of less than 1 m at 1000 m altitude at a frame rate of 30 Hz. Both NETDs were confirmed prior to and during all field operations using the SBIR model EX-04-B-L-25-FS/ES blackbodies with accuracy to ±0.001°C. The additional space afforded by this smaller sensor allows for the inclusion of a downward-looking high-resolution broadband visible (400–800 nm) imager, either IO Industries’ 4 MP Flare 4M180-CL color (2048 × 2048 pixels at a frame rate of 30 Hz) or Imperx Bobcat 6MP monochrome (2756 × 2208 pixels at a frame rate of 15 Hz). These provide imagery at 1000 m altitude with spatial resolutions of 0.3 and 0.1 m, respectively. This combination of cameras allows us to capture surface feature variability over a multitude of scales of order 0.1–1000 m. A LiDAR model ULS-1000 measures the surface elevation/displacement at 200 Hz accurate to ±2.0 cm with a maximum range of 500 m and with a FOV of 3 milliradians. Figure 6 shows the thermal infrared and visible imagery of sea ice drifting on the ocean surface within the fjord near Ny-Ålesund. The temperature of the sea ice is colder than the surrounding ocean surface with significant variability between −4.4 and −1.5°C. Note that the colder pieces of sea ice in the infrared are related to the brighter sea ice in the visible. The ocean surface surrounding the sea ice varies in brightness temperature significantly less, roughly −1.0 to −2.0°C. Furthermore, the structure of the ocean surface temperature suggests that the variability is due to near surface turbulence generated by the sea ice itself, simultaneously mixing up the cooler sea ice melt water.
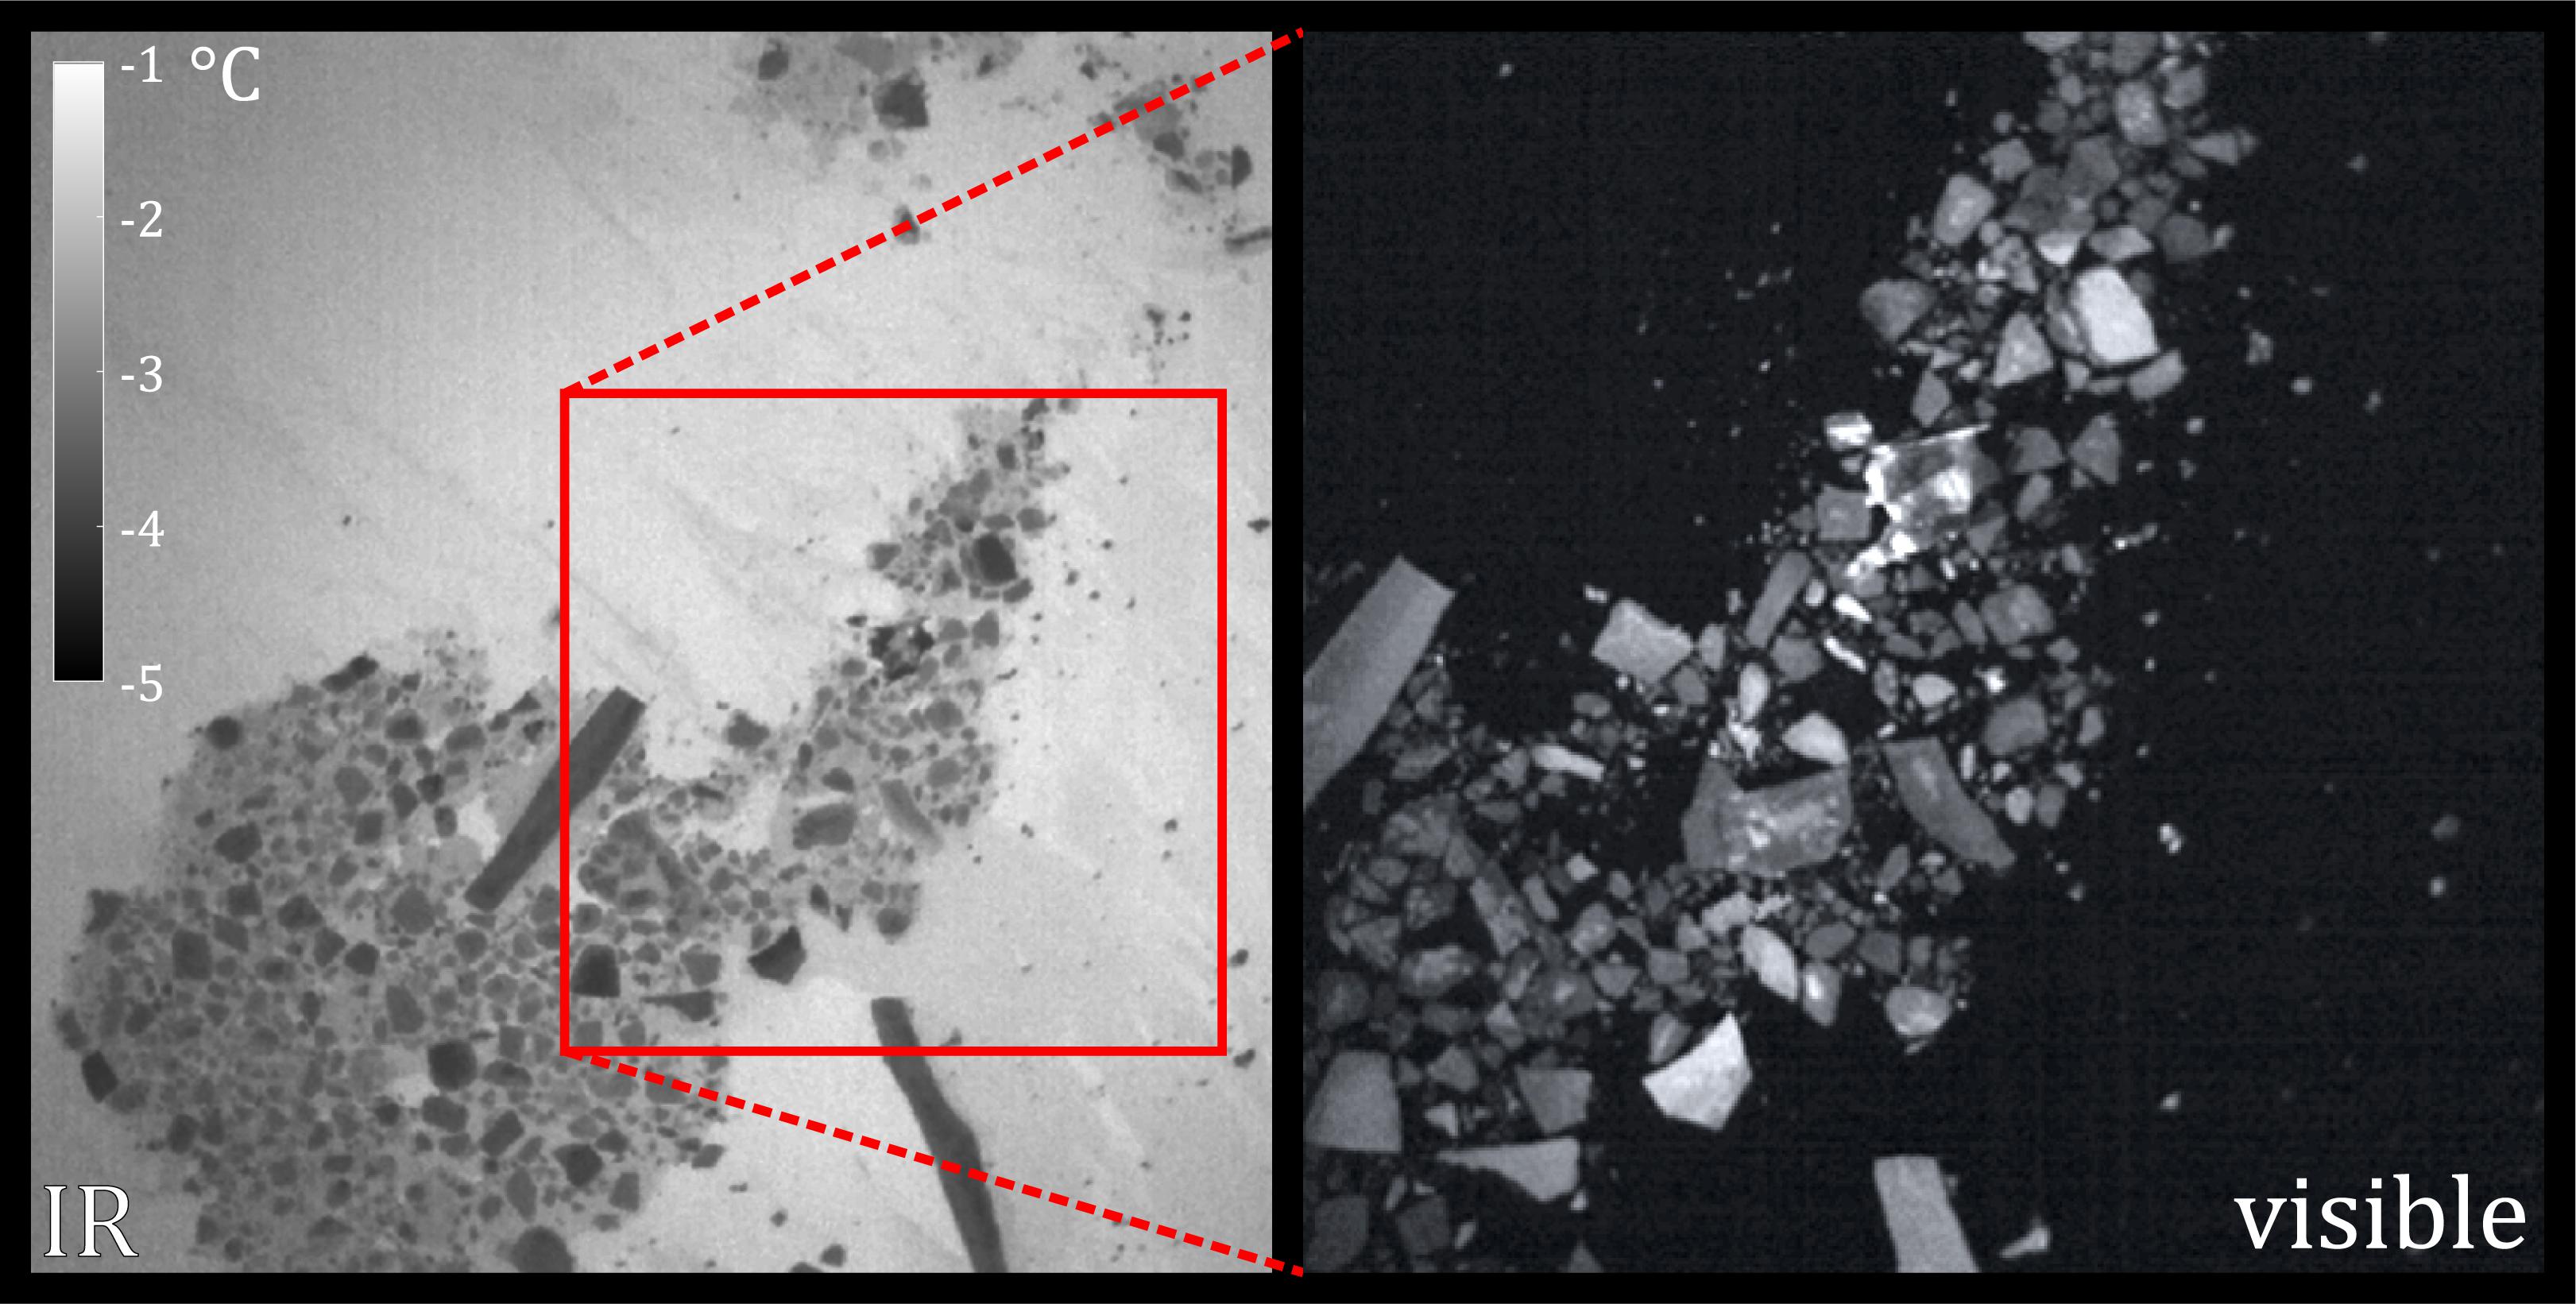
Figure 6. Imagery of fjord water with loose sea ice obtained from Manta equipped with the ATOM payload. The thermal image in the left panel was obtained from the Atom microbolometer and the visible image in the right panel was obtained from the Flare camera.
HYP-VNIR/HYP-NIR: Hyperspectral Imaging Systems
In the HYP-VNIR/HYP-NIR payloads, the Visible/Near-Infrared (VNIR/NIR) signature of the sea surface is sensed via Headwall Photonics model Micro-Hyperspec® VNIR airborne hyperspectral aberration-corrected imaging spectrometers to measure VNIR (400–1000 nm) and model Micro-Hyperspec® for NIR (900–1700 nm) spectral radiance of the upper-ocean to determine ocean color. The A-Series model VNIR silicon CCD sensor has a spectral resolution of 1.86 nm with 323 spectral bands and 1004 spatial pixels (spatial resolutions of 0.6 m at 1000 m altitude) and a sampling rate of 30 Hz (integration time of 10–40 ms, depending on light conditions). The T-Series model NIR InGaAs array has a spectral resolution of 9.97 nm with 82 spectral bands and 640 spatial bands (spatial resolutions of 1.5 m at 1000 m altitude) and a sampling rate of 60 Hz (integration time nominally 5.3 ms). Both the NVIR and NIR sensors have been laboratory calibrated to within NIST standards by Headwall Photonics. Additionally, an Ocean Optics USB2000+ measures down-welling hemispheric irradiance signal (FOV is 180°) in the 210–1050 nm range (signal-to-noise, SNR is 250:1) and two Ocean Optics model FX Spectrometer to measure the up- and down-welling radiance in the 350–1000 nm range (SNR = 290:1) with a FOV of 3° (1°–14° possible).
RAD: Longwave and Shortwave Irradiance
We utilize up- and down-looking Hukseflux model IR-02 pyrgeometers to measure the net longwave radiation (4.5–40 μm) and up- and down-looking Hukseflux model SR-03 pyranometers to measure the net shortwave (solar) radiation (285–3000 nm). The pyrgeometers feature 150° fields of view and a response time of less than 1 s (custom reduced from 18 s) with a calibration uncertainty of 3.69 W m–2 and a sensitivity of 0.06 W m–2. The pyrgeometer sensor directly measures net irradiance. Through the inclusion of a 10 k thermistor and the Stefan-Boltzmann law, the sensor’s own irradiance is estimated and the irradiance incoming to the sensor is isolated. The pyranometers feature 180° fields of view and a response time of less than 1 s with a calibration uncertainty of 1.31 W m–2 and a sensitivity of 0.07 W m–2. The pyranometer has a platinum resistance thermometer (PT-100) to provide temperature compensated calibration. Rooftop comparisons were performed against industry standard Kipp and Zonen model CGR4 pyrgeometer and model CMP22 pyranometer. These are paired with an onboard high-resolution broadband visible (400–800 nm) imager. The downward-looking Imperx model 2520 Bobcat digital monochrome visible camera has a sensing array of 2500 × 2000 elements, providing imagery with a spatial resolution of 0.3 m at 1000 m altitude in order to characterize the ocean wave state.
DDμD: Drone-Deployed Micro-Drifter
The DDμD consists of a small suite of sensors enclosed in a durable polyurethane body. Up to four DDμD packages are loaded in the launcher for in-flight ejection. Once ejected from the UAV during flight, the DDμD behaves as a profiler as it descends through the atmosphere, measuring air temperature (accurate to 0.1°C with a sensitivity of 0.0045°C and a response time of 1.2 s), pressure (accurate to 1.5 mbar with a sensitivity of 0.065 mbar and a response time of 8.2 ms), and relative humidity (accurate to 1.8% with a precision of 0.2%, a sensitivity of 0.03% and a response time of less than 4 s). The humidity sensor has an additional temperature sensor accurate to 0.2°C with a precision of 0.1°C, a sensitivity of 0.015°C and a response time of less than 5 s. The data is telemetered to the Raven PC on the UAV throughout the descent. Once it falls and lands on the sea surface, the DDμD behaves as a surface-drifting ocean buoy, deploying a string of sensors that measure temperature and conductivity of the upper 2–3 m of the ocean at fifteen min intervals for up to 2 weeks. The ocean sensors on the DDμD collect and store data that is then transmitted back to the UAV as it flies overhead up to 16 km away, even if on subsequent flights. The temperature measurement is accurate to 0.1°C with a sensitivity of 0.0045°C and a response time of 0.3 s, while the conductivity measurement is sensitive to 9e–4 mS cm–1 with a response time of 1 s. In order to ensure validity of these observations, the DDμD’s temperature and salinity sensors were calibrated against a Seabird SBE-37.
The DDμD has a number of innovative features that allows it to make measurements with high accuracy while keeping the total power consumption low. It implements a custom designed precision current source required for measuring air and water temperatures with platinum resistance temperature detectors (RTD). The salinity sensor subsystem implements a novel alternating current activation source to limit electrode erosion that maintains the sensor accuracy throughout the deployment period. The microprocessor switches on one sensor at a time to make a measurement, keeping others powered off while not in use. This not only reduces the overall power consumption but also improves the measurement accuracy by limiting self-heating and eliminating interference between the sensors. As an atmospheric profiler, the DDμD samples all the sensors at 10 Hz. After landing, it samples all the sensors at 1 Hz. Between data collection cycles, the microprocessor powers off all components and enters a sleep state itself, reducing the current consumption to less than 1 mA. While in the sleep state, an ultra-low power real-time clock (RTC) keeps time and wakes the microcontroller into low-power data collection mode every 15 min. The microcontroller then wakes up the GPS to get a position fix. As soon as the GPS gets a valid fix, all other sensors are turned on and ten sets of measurements are taken at 1 Hz. The UAV will continuously transmit a “wakeup pulse” during flight, so the UAV finds the buoy simply by coming within the 16 km radio range. When the UAV flies in range of the DDμD and a ping is received, the DDμD reliably transmits the data it has collected on its flash storage to the aircraft using RDP protocol. If the flash storage is not acknowledged as received by the UAV, the buoy continues collecting data until the next successful connection and successful data transmission occurs. If no valid fix is acquired by GPS within 3 min of waking up, the microcontroller switches the GPS off and initiates the data collection. All the sensors are then turned off and the microcontroller goes into sleep state waiting for a wakeup call from RTC for next data collection period. The DDμDs are supported by an intelligent and interactive software onboard the UAV that allows the receiver onboard to simultaneously communicate with multiple DDμDs in the area and download data from the DDμDs automatically or under direction of a user from the UAV base. In order to reduce the environmental impact, the DDμD uses all RoHS compliant components, lead-free solder, NiMH batteries and streamers made out of an eco-friendly water-soluble material.
MET: Meteorological Measurements With LiDAR
The final suite of instruments – the suite incorporated into the MET payload – enables the direct calculation of turbulent flux via eddy-covariance‘. The required measurements for this calculation are fast-response temperature, specific humidity, and 3-D wind velocities sampled simultaneously. Traditional eddy-covariance flux systems are large in volume and weight, so miniaturization represented the biggest obstacle for these instruments to be viable for a UAV platform. The wind velocities are measured from a self-logging 5-port gust probe [e.g., Hacker and Crawford (1999)] designed and built by Aeroprobe Corporation based on our design requirements. Because this was a custom-build, Aeroprobe performed a noise characterization to determine total system accuracy. Aeroprobe provided additional assessment and validation in their wind flume to ensure the instrument performed according to our specifications. The high sensitivity pressure transducers give a system accuracy of 0.03 m s–1 at up to 100 Hz. Fast response temperature is measured by the Opsens Fiber Optic GaAs tip measuring probe and is captured digitally by the Opsens signal conditioner at 50 Hz. It is accurate to ±0.15°C or better, with a resolution of ±0.01°C and operates with a 5.0 ms response time. Fast response specific humidity is measured by the modified Krypton KH-20 Hygrometer (accurate to ±0.17 g m–3, sensitive between 1.7 and 19.5 g m–3) at 100 Hz. The OPSENS temperature sensor and Krypton KH-20 hygrometer showed frequency response through the wind velocity spectra inertial subrange, allowing for estimation of sensible and latent heat fluxes. The LiDAR model ULS-1000 measures the surface elevation/displacement at 200 Hz accurate to ±2.0 cm with a maximum range of 500 m and with a FOV of 3 milliradians. The Geodetics iNAV was outfitted with the KVH-1700 Fiber-Optic Gyroscope IMU (accurate to 0.001° in pitch/roll) to increase inertial velocity measurements by an order of magnitude over the STIM300 MEMS IMU used in the Base Payload. The same Novatel OEM-719 GPS receiver was used to maintain high-precision positioning.
Both the Opsens and LiDAR provide digital RS-232 data. The various MET-flux sensors providing temperature (Opsens), humidity (KH20 Hygrometer), and 3-component turbulent wind velocity (Aeroprobe) must be sampled at the exact same moment in time to provide a true flux measurement. Because of that requirement and the fast sampling rates (50 Hz for the Opsens and 200 Hz for the LiDAR), the OS latencies on the Raven PC do not allow for required synchronization of Opsens temperature data. To avoid OS latencies and achieve the required timing accuracy, a Sparkfun Electronics Logomatic V2 serial data logger was chosen to log both Opsens and LiDAR. LDEO developed custom firmware to implement logging of Opsens and LiDAR serial data synchronized to PPS timing (i.e., accurate to better than 10 μs). To address the different latencies of data queries between LiDAR and Opsens, the firmware was programmed to adjust the start time of the logging based on the sensor-specific latency (difference between when the logger queries data and when it receives it). This allows the measurement to be time stamped and synchronized to the PPS trigger.
The Omega OM-USB-1608FS analog-to-digital converter (ADC) in triggered mode is used for acquiring the KH20 analog hygrometer data. This digital logging created challenges to timing synchronization, since the logger depends on the system time and is subject to OS latencies. To address this, custom software was implemented to trigger the ADC using the PPS and to update the OSNetwork Time Protocol (NTP) software running on the Raven PC using the incoming GPS and PPS signals. The NTP software timing accuracy is as accurate as the sampling clock of the ADC, which is of order 10 μs, as opposed to milliseconds for the computer.
Results and Discussion
Here, we provide a number of scientific applications for the combined UAV-sensor payload system. In Figure 7, identical Landsat images of the Conwaybreen glacier are shown side by side, one featuring the overlay of a georectified swath created from the red, green, and blue channels of the VNIR pushbroom imager. As described in the Technical Details, recording of the aircraft’s instantaneous position and attitude in three dimensions allows for the geolocation of each pixel. Each Landsat pixel is 30 m by 30 m, while the each VNIR pixel is approximately 50 cm wide in the cross-look direction. This combination of data and processing yields more than simple RGB imagery of the surface; full spectral radiance is obtained at each point along the UAV flight track. Figure 8 shows the normalized spectral radiance (including the effects of reflected sky radiance and sun glint) observed to be emitted from a variety of surfaces across the two field campaigns: glacial ice, solid sea ice, snow, fjord water, and tropical water. A faded rainbow is set behind the spectra to show the color for each wavelength band. Note the spectral peak in the blue and the small emitted spectral radiance in the red.
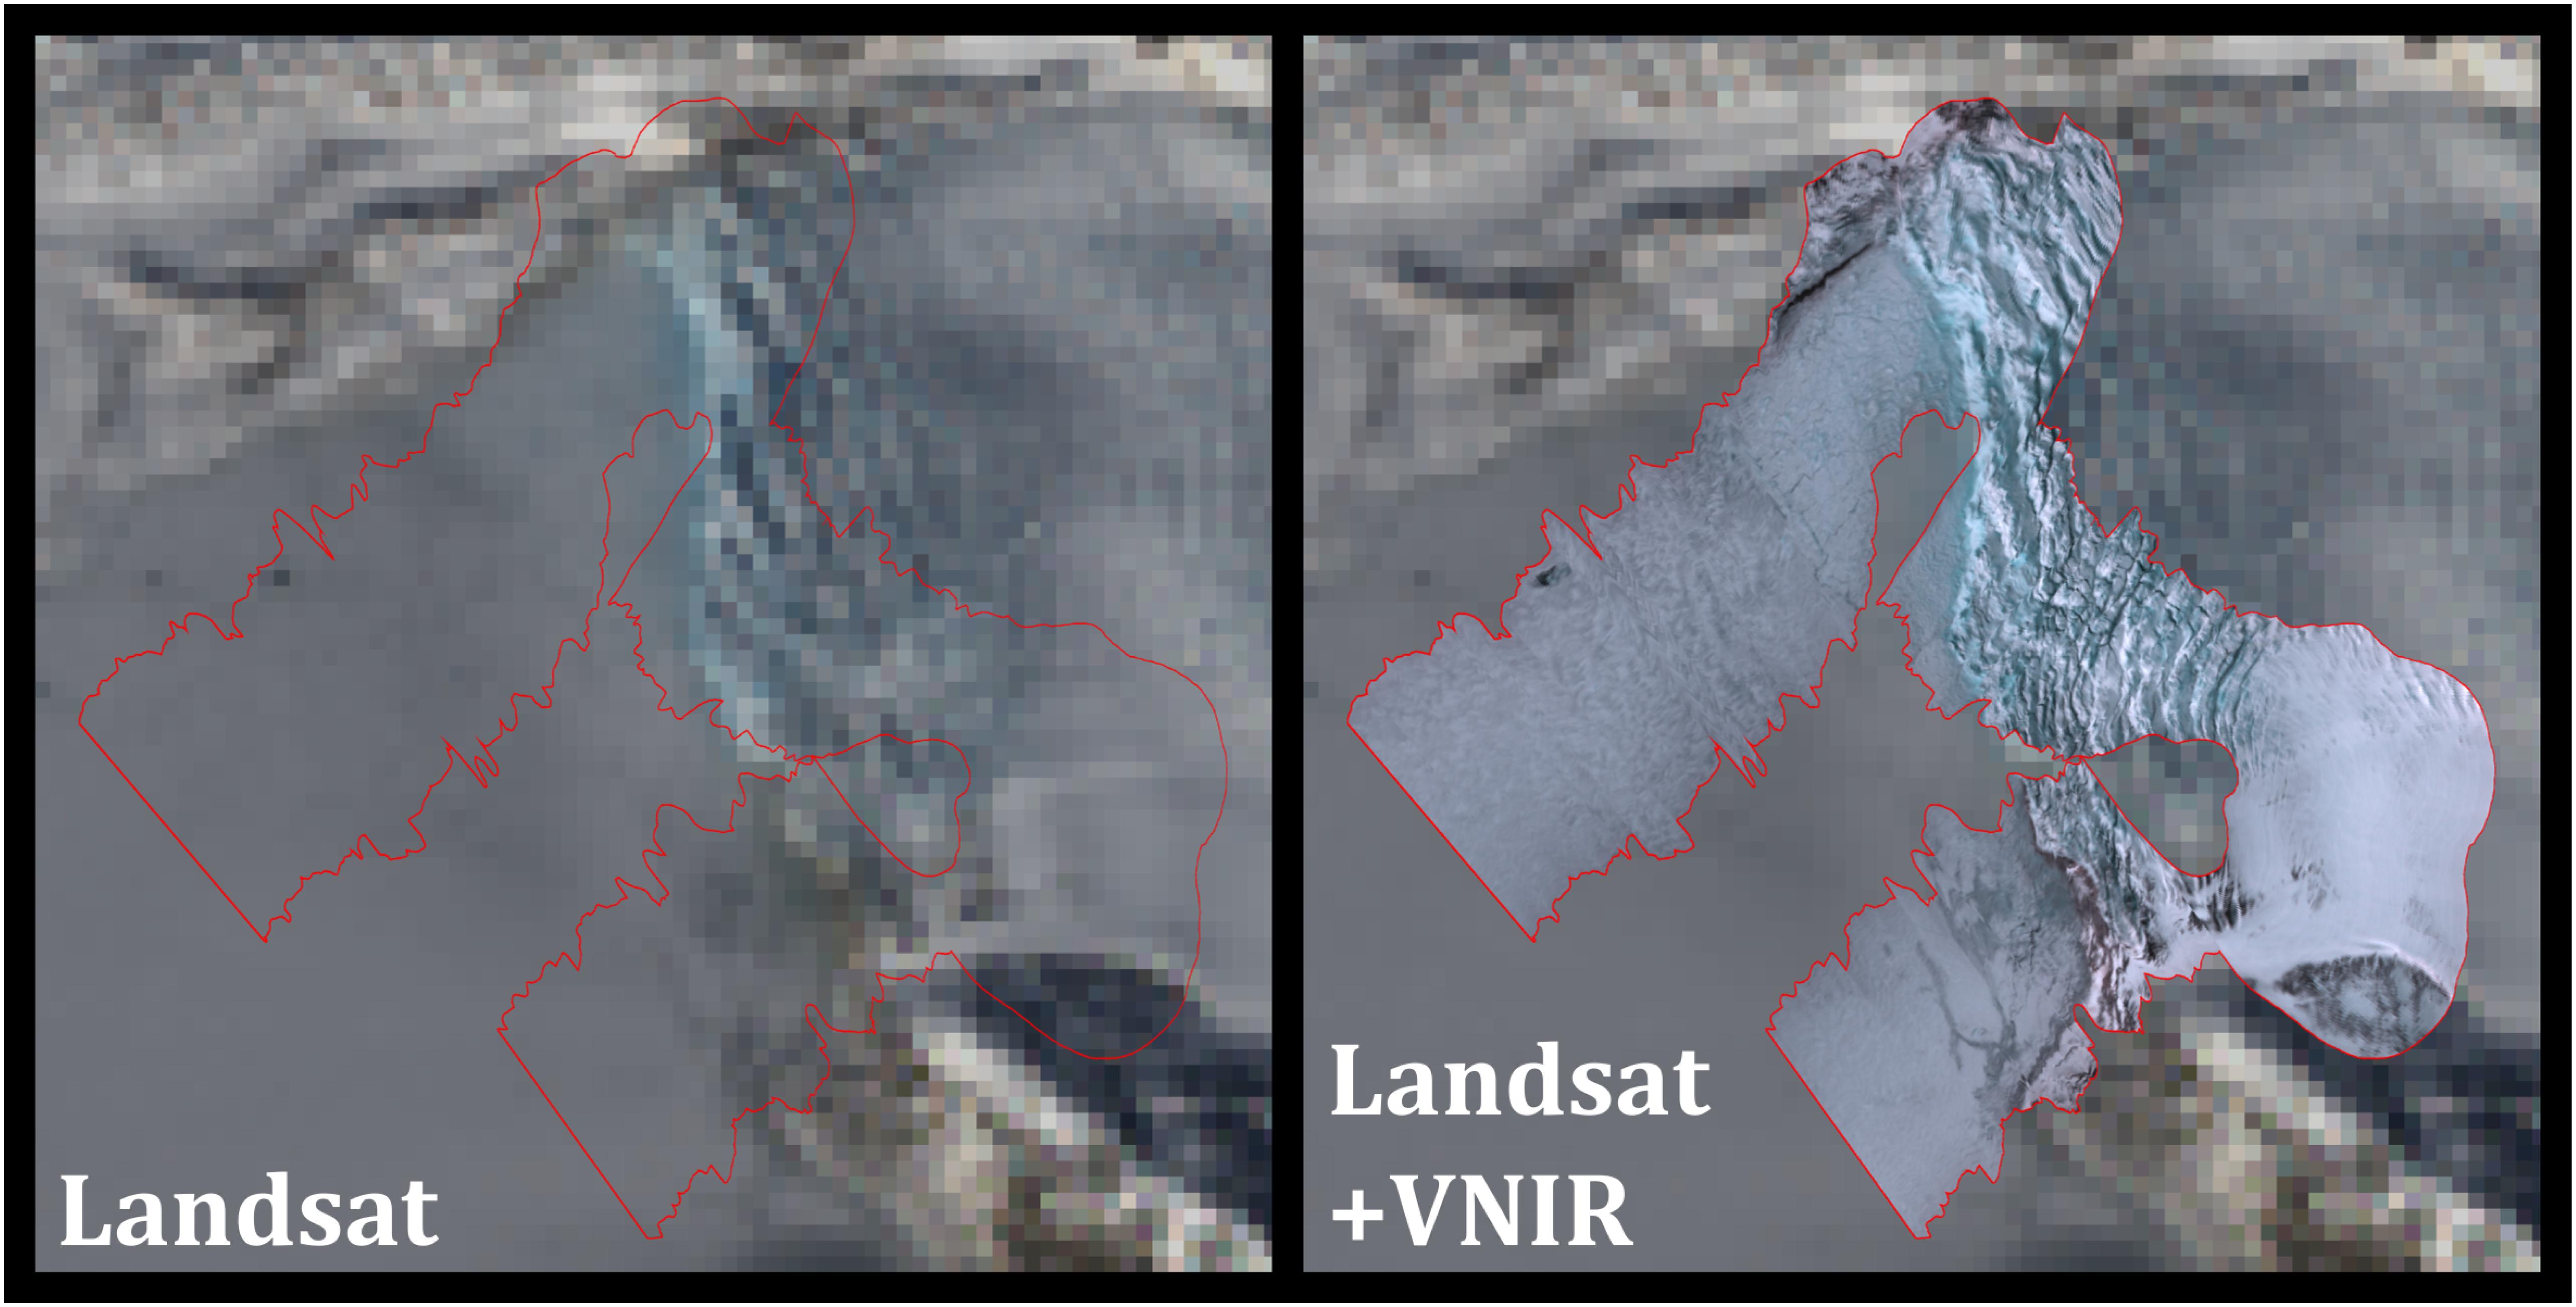
Figure 7. Satellite (Landsat) imagery of the Conwaybreen glacier in Svalbard, acquired on April 27th, 2015. A pushbroom image created from the VNIR imager’s RGB channels is overlaid on the right panel and is outlined in red on both. The satellite image has been slightly darkened to emphasize the VNIR image.
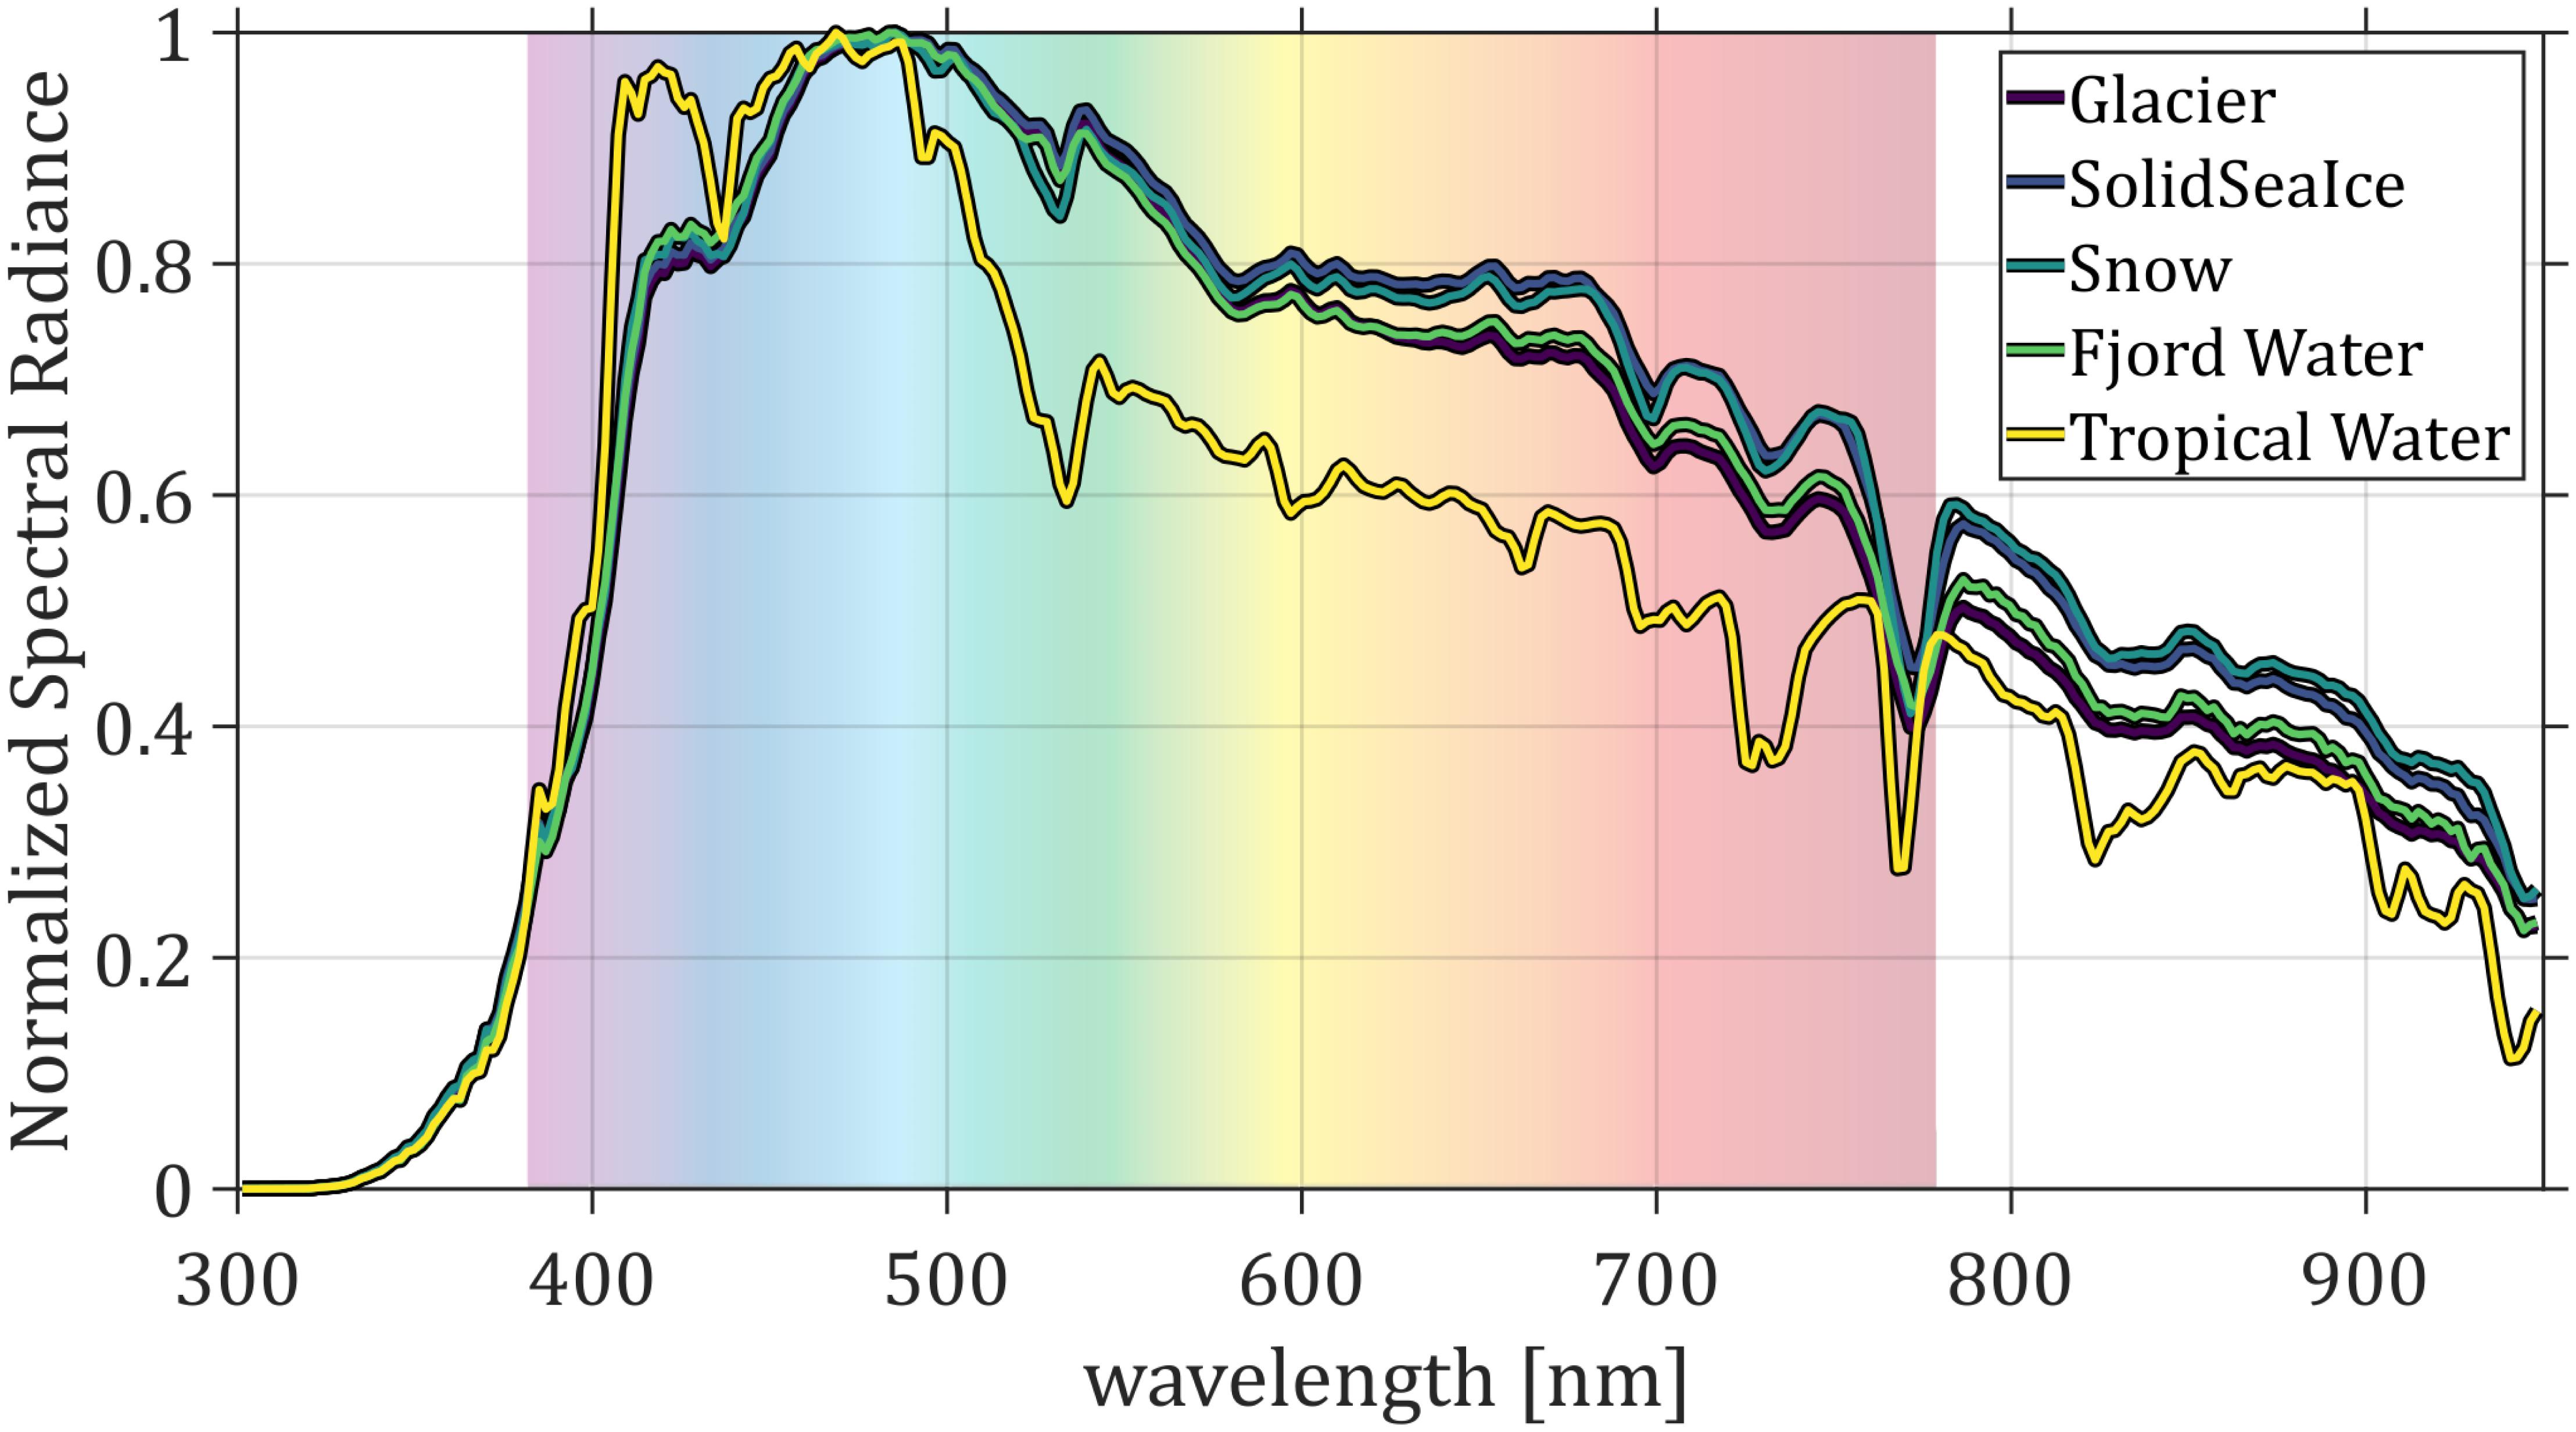
Figure 8. Surface-leaving spectral radiance, normalized by peak radiance, including the effects of reflected sky radiance and anomalous sun glint. The ‘Tropical Water’ trace represents a measurement made in the equatorial Pacific Ocean while the others represent measurements made from a flight over Svalbard, Ny-Ålesund. The faded rainbow in the background indicates the color of visible light for each wavelength.
In addition to comparing mean spectral radiances between different surfaces, one may investigate the small-scale spatial variability of radiance at given wavelength bands. A comparison of spectral radiance obtained from MODIS on Aqua and the VNIR imager on the HQ60 is shown in Figure 9. Values are given relative to the mean MODIS spectral radiance (as anomalies) and represented along the track of the UAV. The size of the large square markers on Figure 9 represents the approximate area on the ocean surface over which each data point was produced. In this way, measurements made using the VNIR imager reveal the variability at scales smaller than the MODIS Level 2 pixel size of 1 km by 1 km.
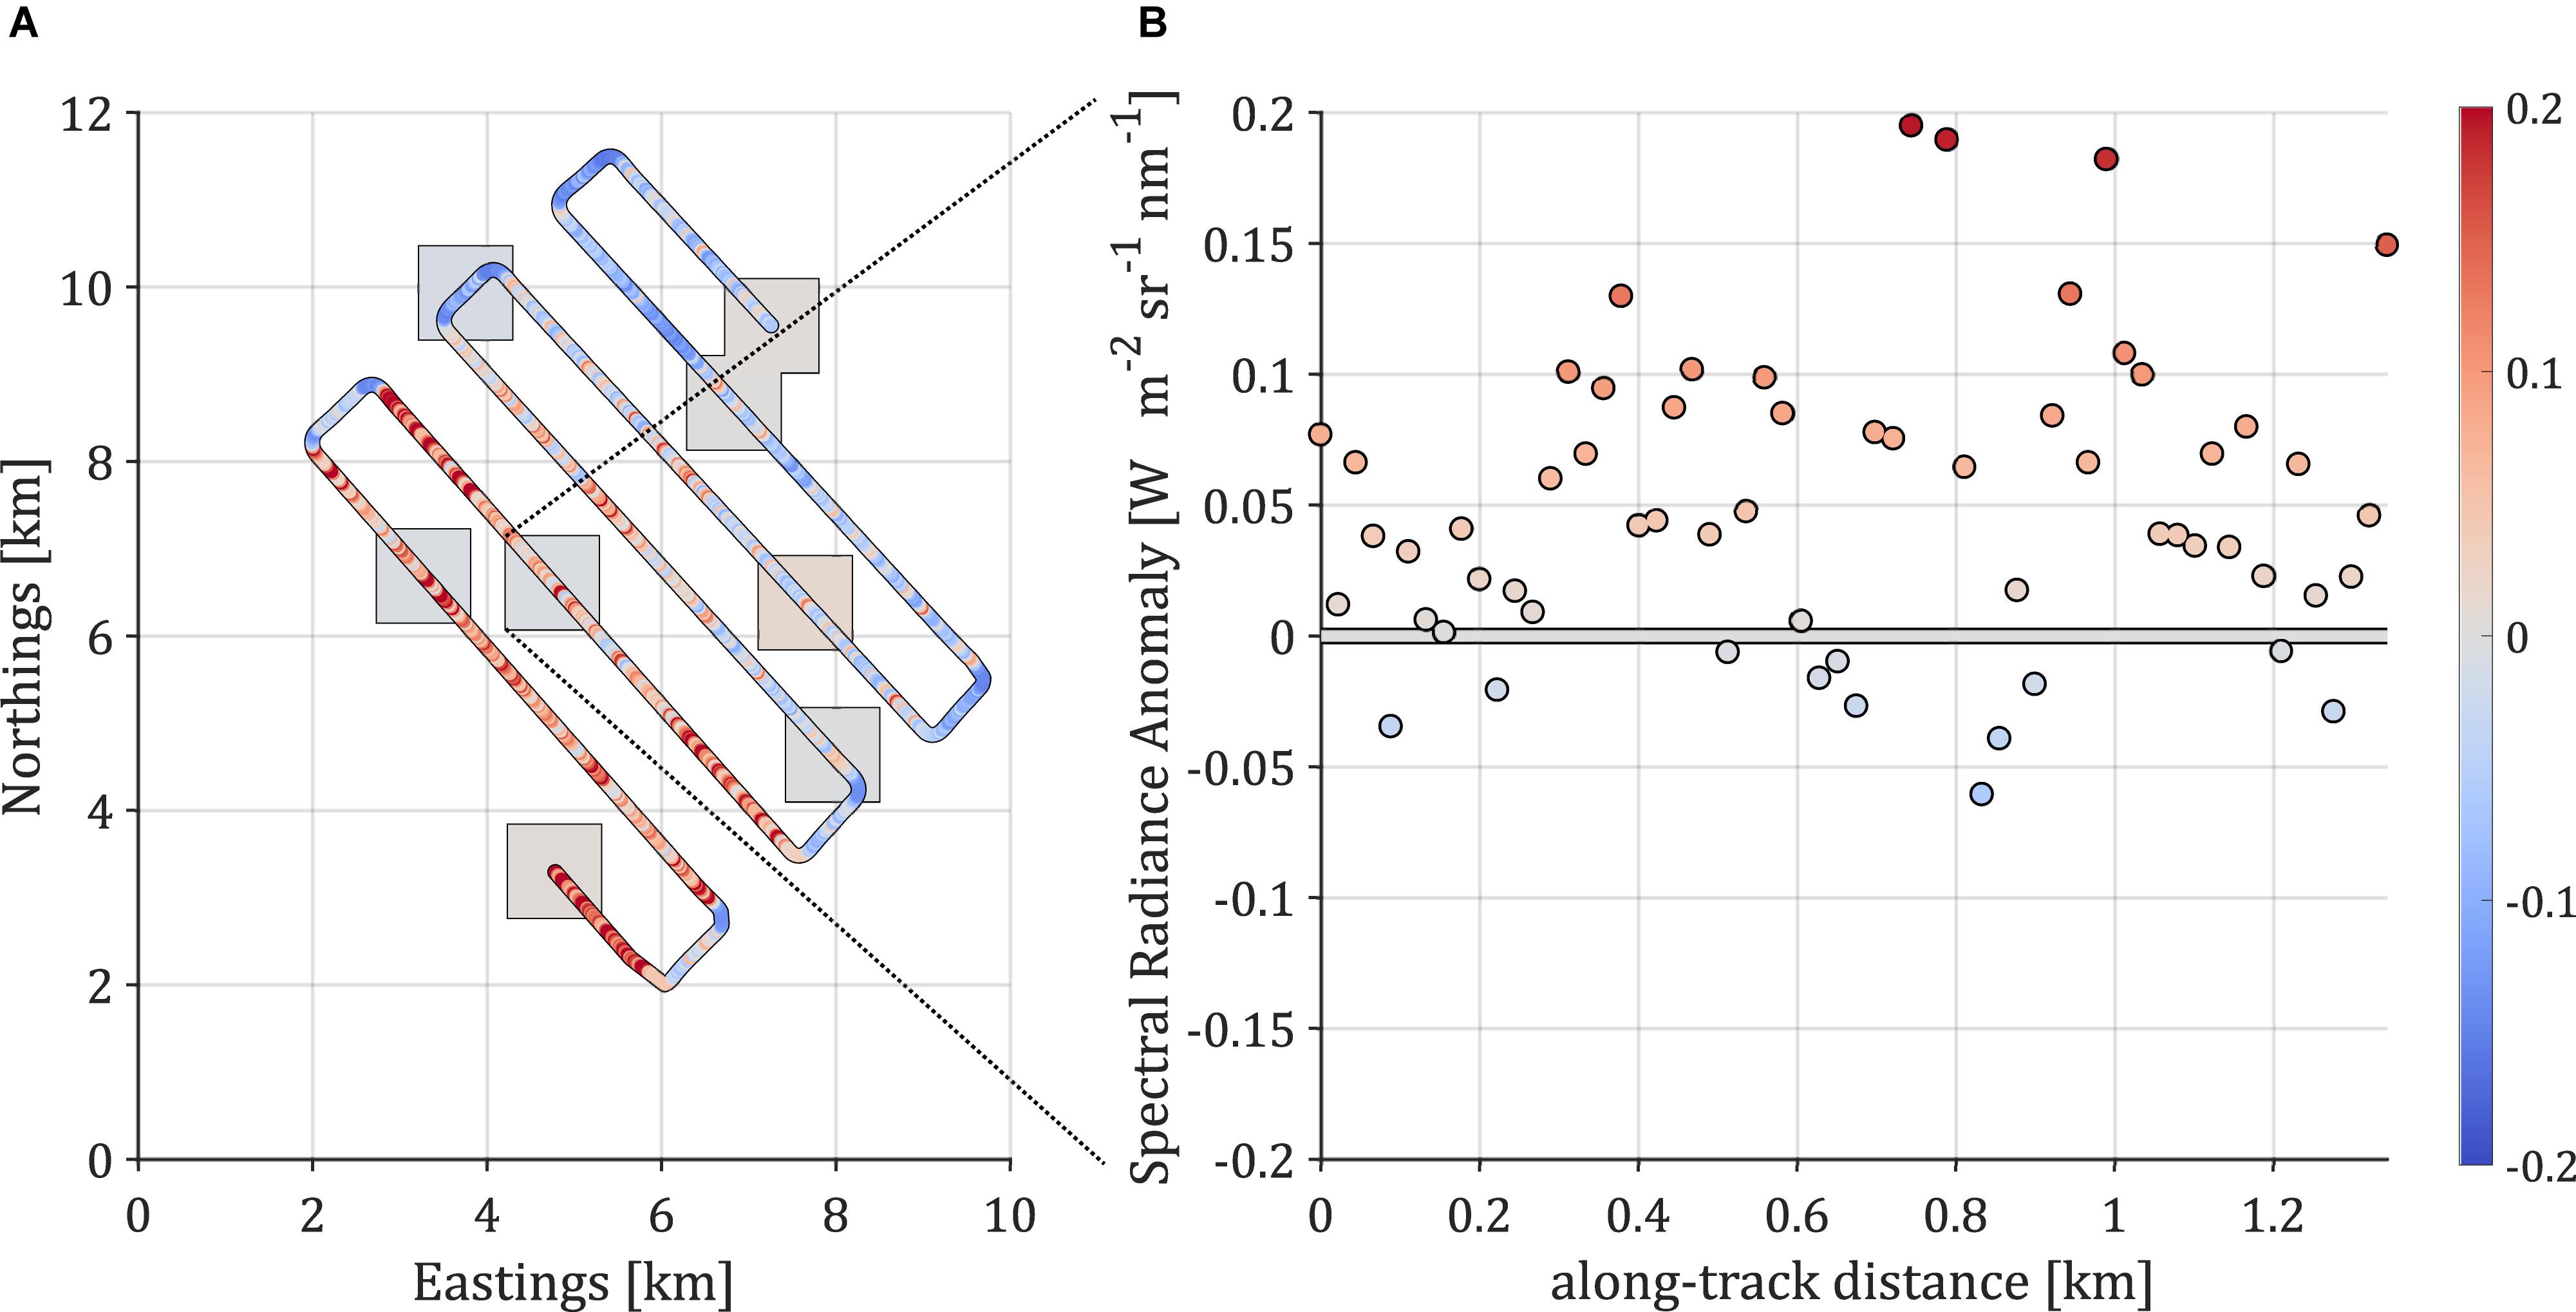
Figure 9. Spectral radiance anomaly in W m–2 sr–1 nm–1 at 488 nm wavelength, VNIR and MODIS, represented relative to the mean value of the latter over the entire UAV Flight001 area of operation. (A) UAV track overlaid on sample MODIS acquisition points (gray squares). Marker sizes are approximately equal to the size of each data point: 1 km by 1 km for MODIS and 175 m in the cross-track for the VNIR imager. (B) Snippet from track (as indicated by dotted lines), highlighting variability of spectral radiance within a single MODIS pixel (standard deviation: 0.0651 W m–2 sr–1 nm–1). Colorbar represents the spectral radiance anomaly shown as the vertical axis in (B).
The RAD payload offers a complementary mode of describing the radiative properties of the ocean surface and sky. UAV observations have a distinct advantage over ship-based observations because they are capable of making observations of upwelling irradiance measurements which are unobstructed by any superstructure such as the ship or tower. Observations made from the UAV and ship-based hemispheric pyrgeometers and pyranometers are shown in Figure 10. The upper portion (a–c) describes measurements of broadband infrared irradiance while the lower portion (d–f) describes measurements of solar irradiance. Portions during which the UAV was in the process of making a turn were excluded from the record shown here. The gray shaded regions indicate UAV ascent and descent, respectively, between 240–66 m altitude above local mean sea level. The downwelling longwave from the UAV and from the Falkor are in close agreement at lower altitude. However, at higher altitude the downwelling irradiance from the UAV sensor is 40 W m–2 less due to the colder atmosphere at higher altitude. In addition to its measurement from the downward-looking pyrgeometer aboard the UAV, the irradiance from the ocean was estimated from sea surface temperature using the Stefan-Boltzmann law and an assumed spectrally integrated emissivity of 0.96. During the UAV’s lower level of flight, this computed value agrees well with direct observations of upwelling. At the higher level of flight, the computed value is approximately 15 W m–2 higher than observed; this is to be expected for the cooler atmosphere at higher altitude. Downwelling solar irradiance observed from the UAV-based and shipboard sensors agree well toward the beginning and end of the flight, when the aircraft was nearly collocated with the ship. During the flight, short-period variability is observed by the UAV-based sensor, likely the result of spatial inhomogeneity in cloud conditions. Measurements of broadband albedo of the ocean surface computed from the downwelling and upwelling solar irradiance show variability throughout the flight about the classical values of Payne (1972), very nearly 4%, a value which is typical for clear skies and high solar angle.
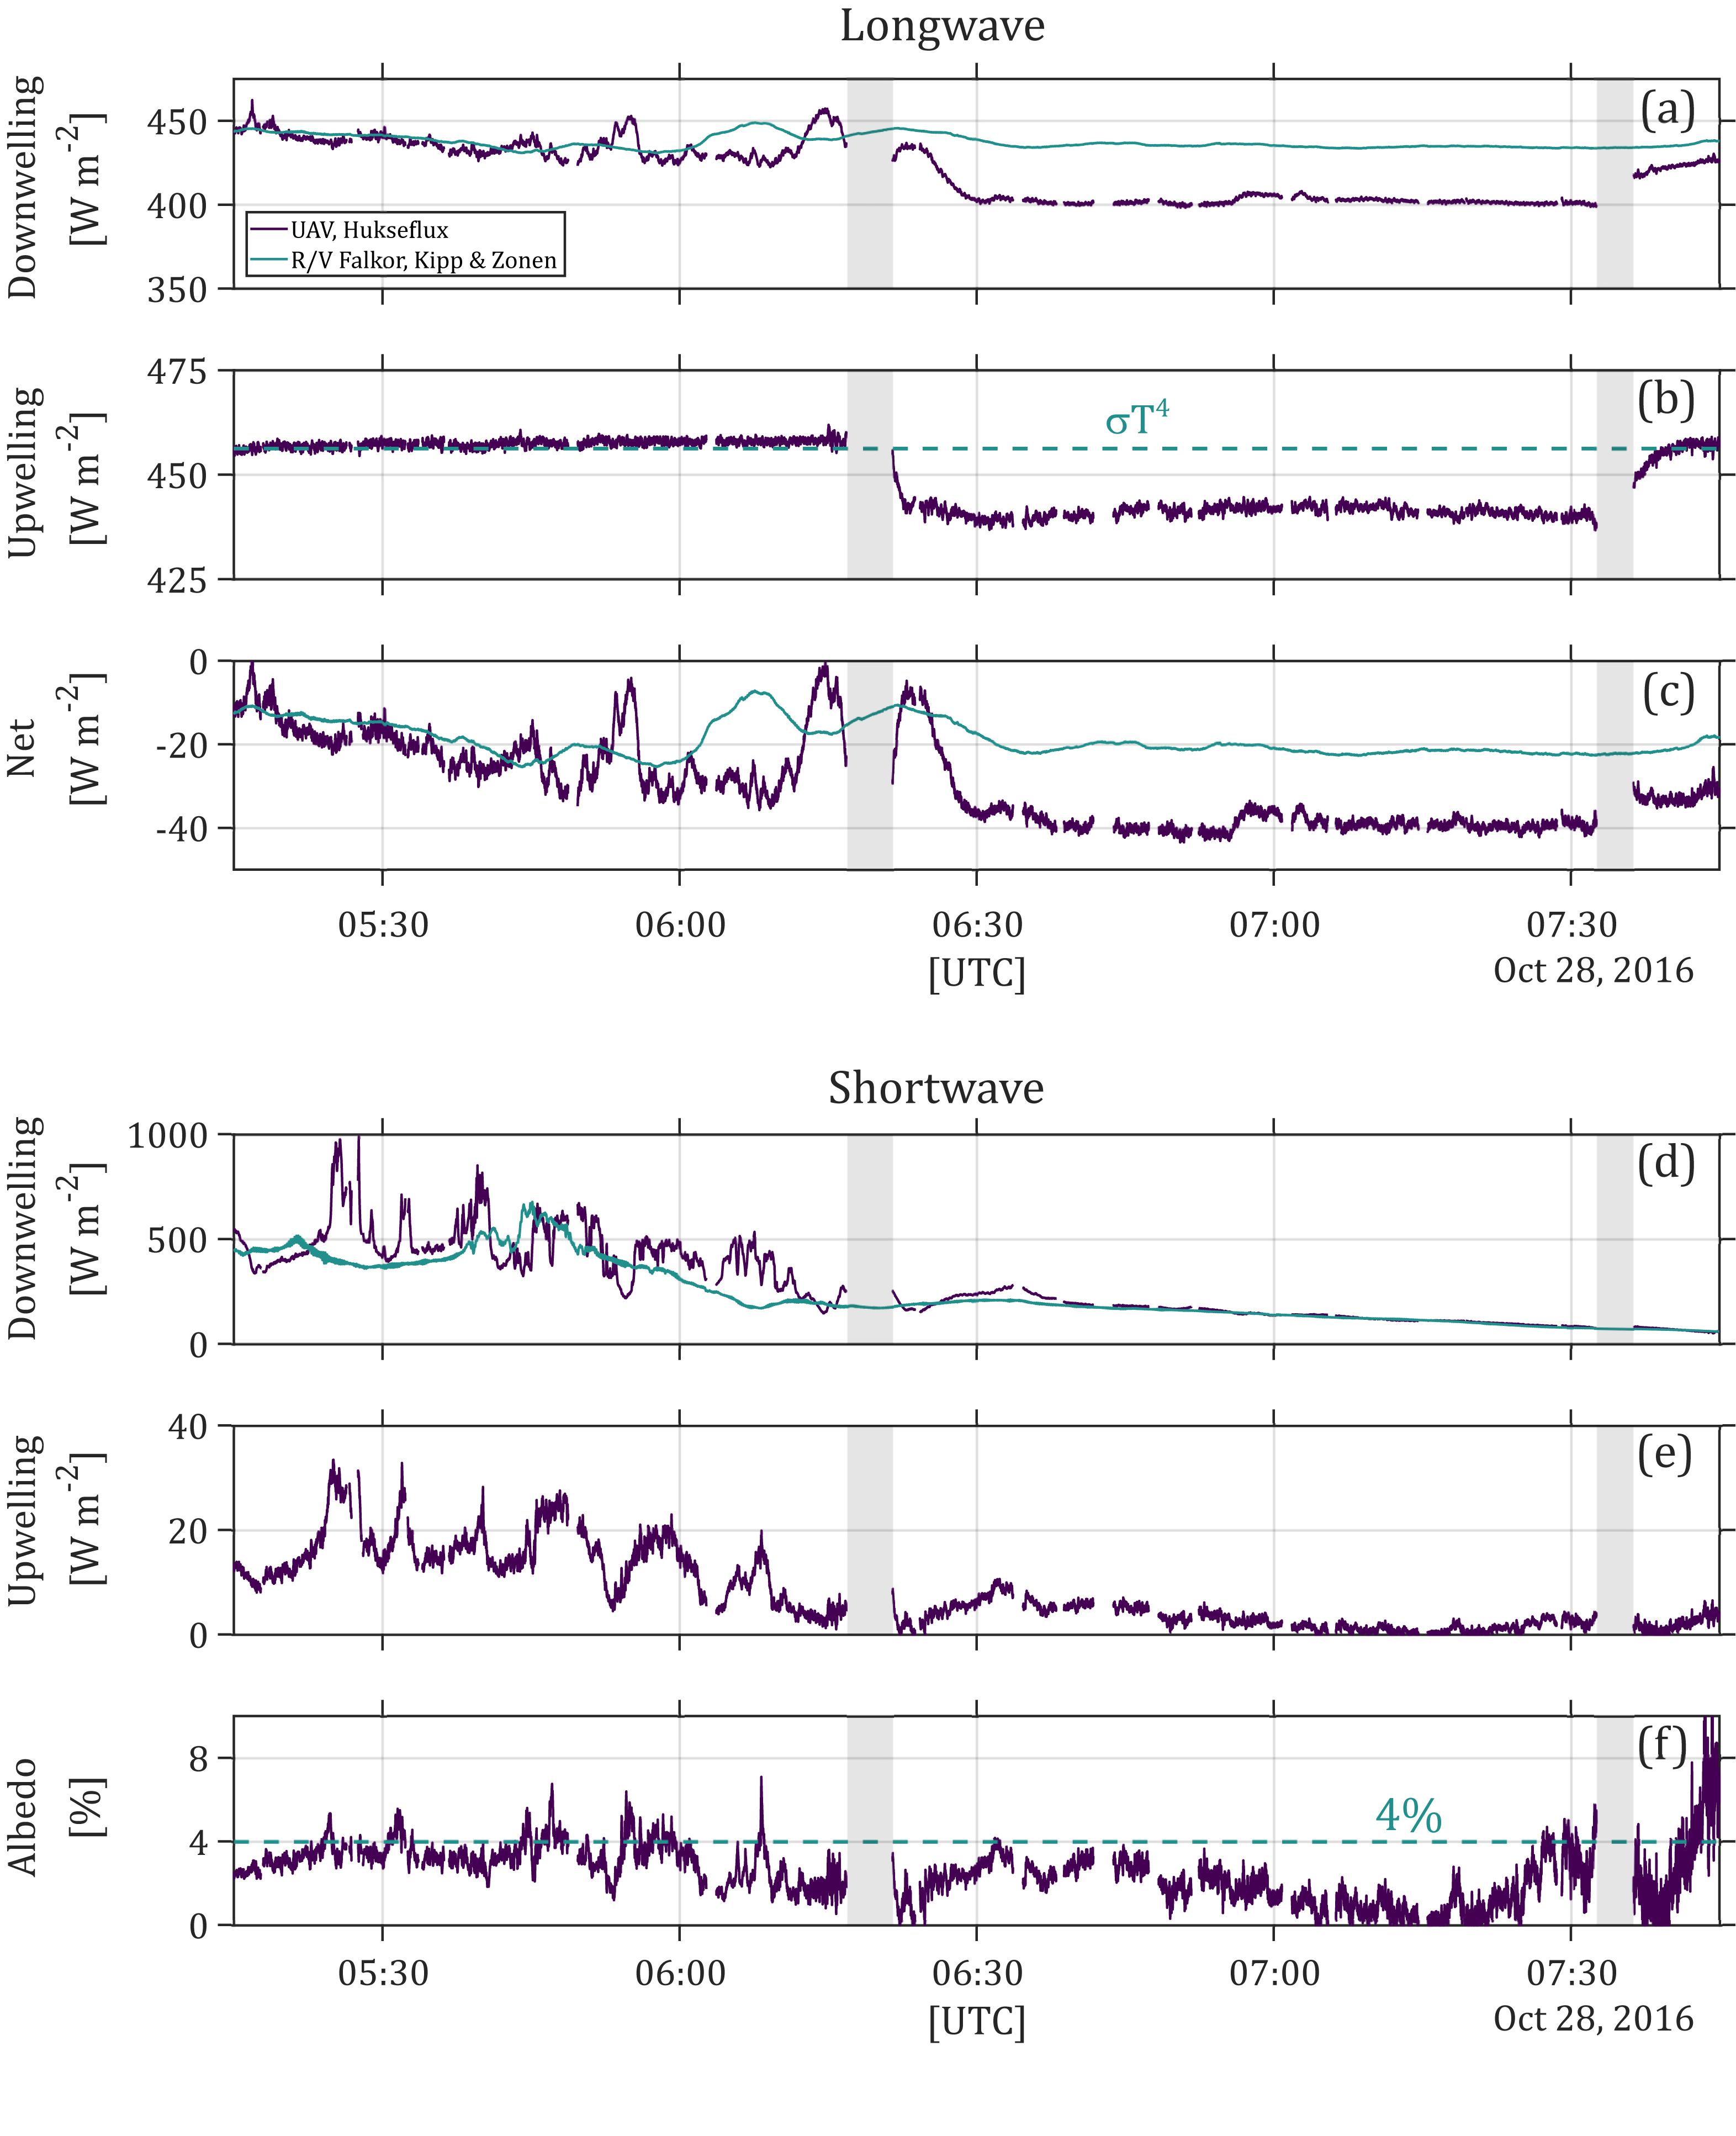
Figure 10. Radiant flux sensed via the pyrgeometers (longwave, a–c) and pyranometers (shortwave, d–f) from UAV Flight 001. The pyrgeometers are sensitive to electromagnetic radiation in the wavelength range of 4.5–40 μm, while the pyranometers are sensitive to electromagnetic radiation in the wavelength range of 285–3000 nm. The violet and teal traces always represent measurements made via UAV and ship, respectively. The gray shaded regions indicate the times of ascent and descent of the UAV. The dashed line in (b) represents theoretical radiation computed using the sea surface temperature and an assumed emissivity of 0.96. The dashed line at 4% in (f) represents the classical value of Payne (1972) which is typical for clear skies and high solar angle.
Representations of the DDμD in action are shown in Figures 11, 12. For the first stage of deployment (Figure 11), the DDμD is ejected and falls from the UAV (a), providing an atmospheric sounding as it passes through the air (b). The example shown in Figure 11B demonstrates the ability of the DDμD to make measurements of fundamental quantities in the atmospheric boundary layer, here air temperature, pressure, and absolute humidity. These measurements can be used to quantify the sensible and latent heat fluxes (Edson et al., 2004; Knuth and Cassano, 2014). In the second stage of deployment (Figure 12), the DDμD hits the ocean surface, deploys its thermistor chain, and records physical properties of the water. In this case (b), it is shown that the DDμD records a time series of water temperature and salinity. This is done at multiple depths (100 and 40 cm), allowing for reconstruction of the temperature-salinity profile of the water body. The wide space of conditions in which the DDμD was tested are shown in Figure 13, ranging from warmer and fresher (the Hudson river) to colder and saltier (the fjord in Svalbard).
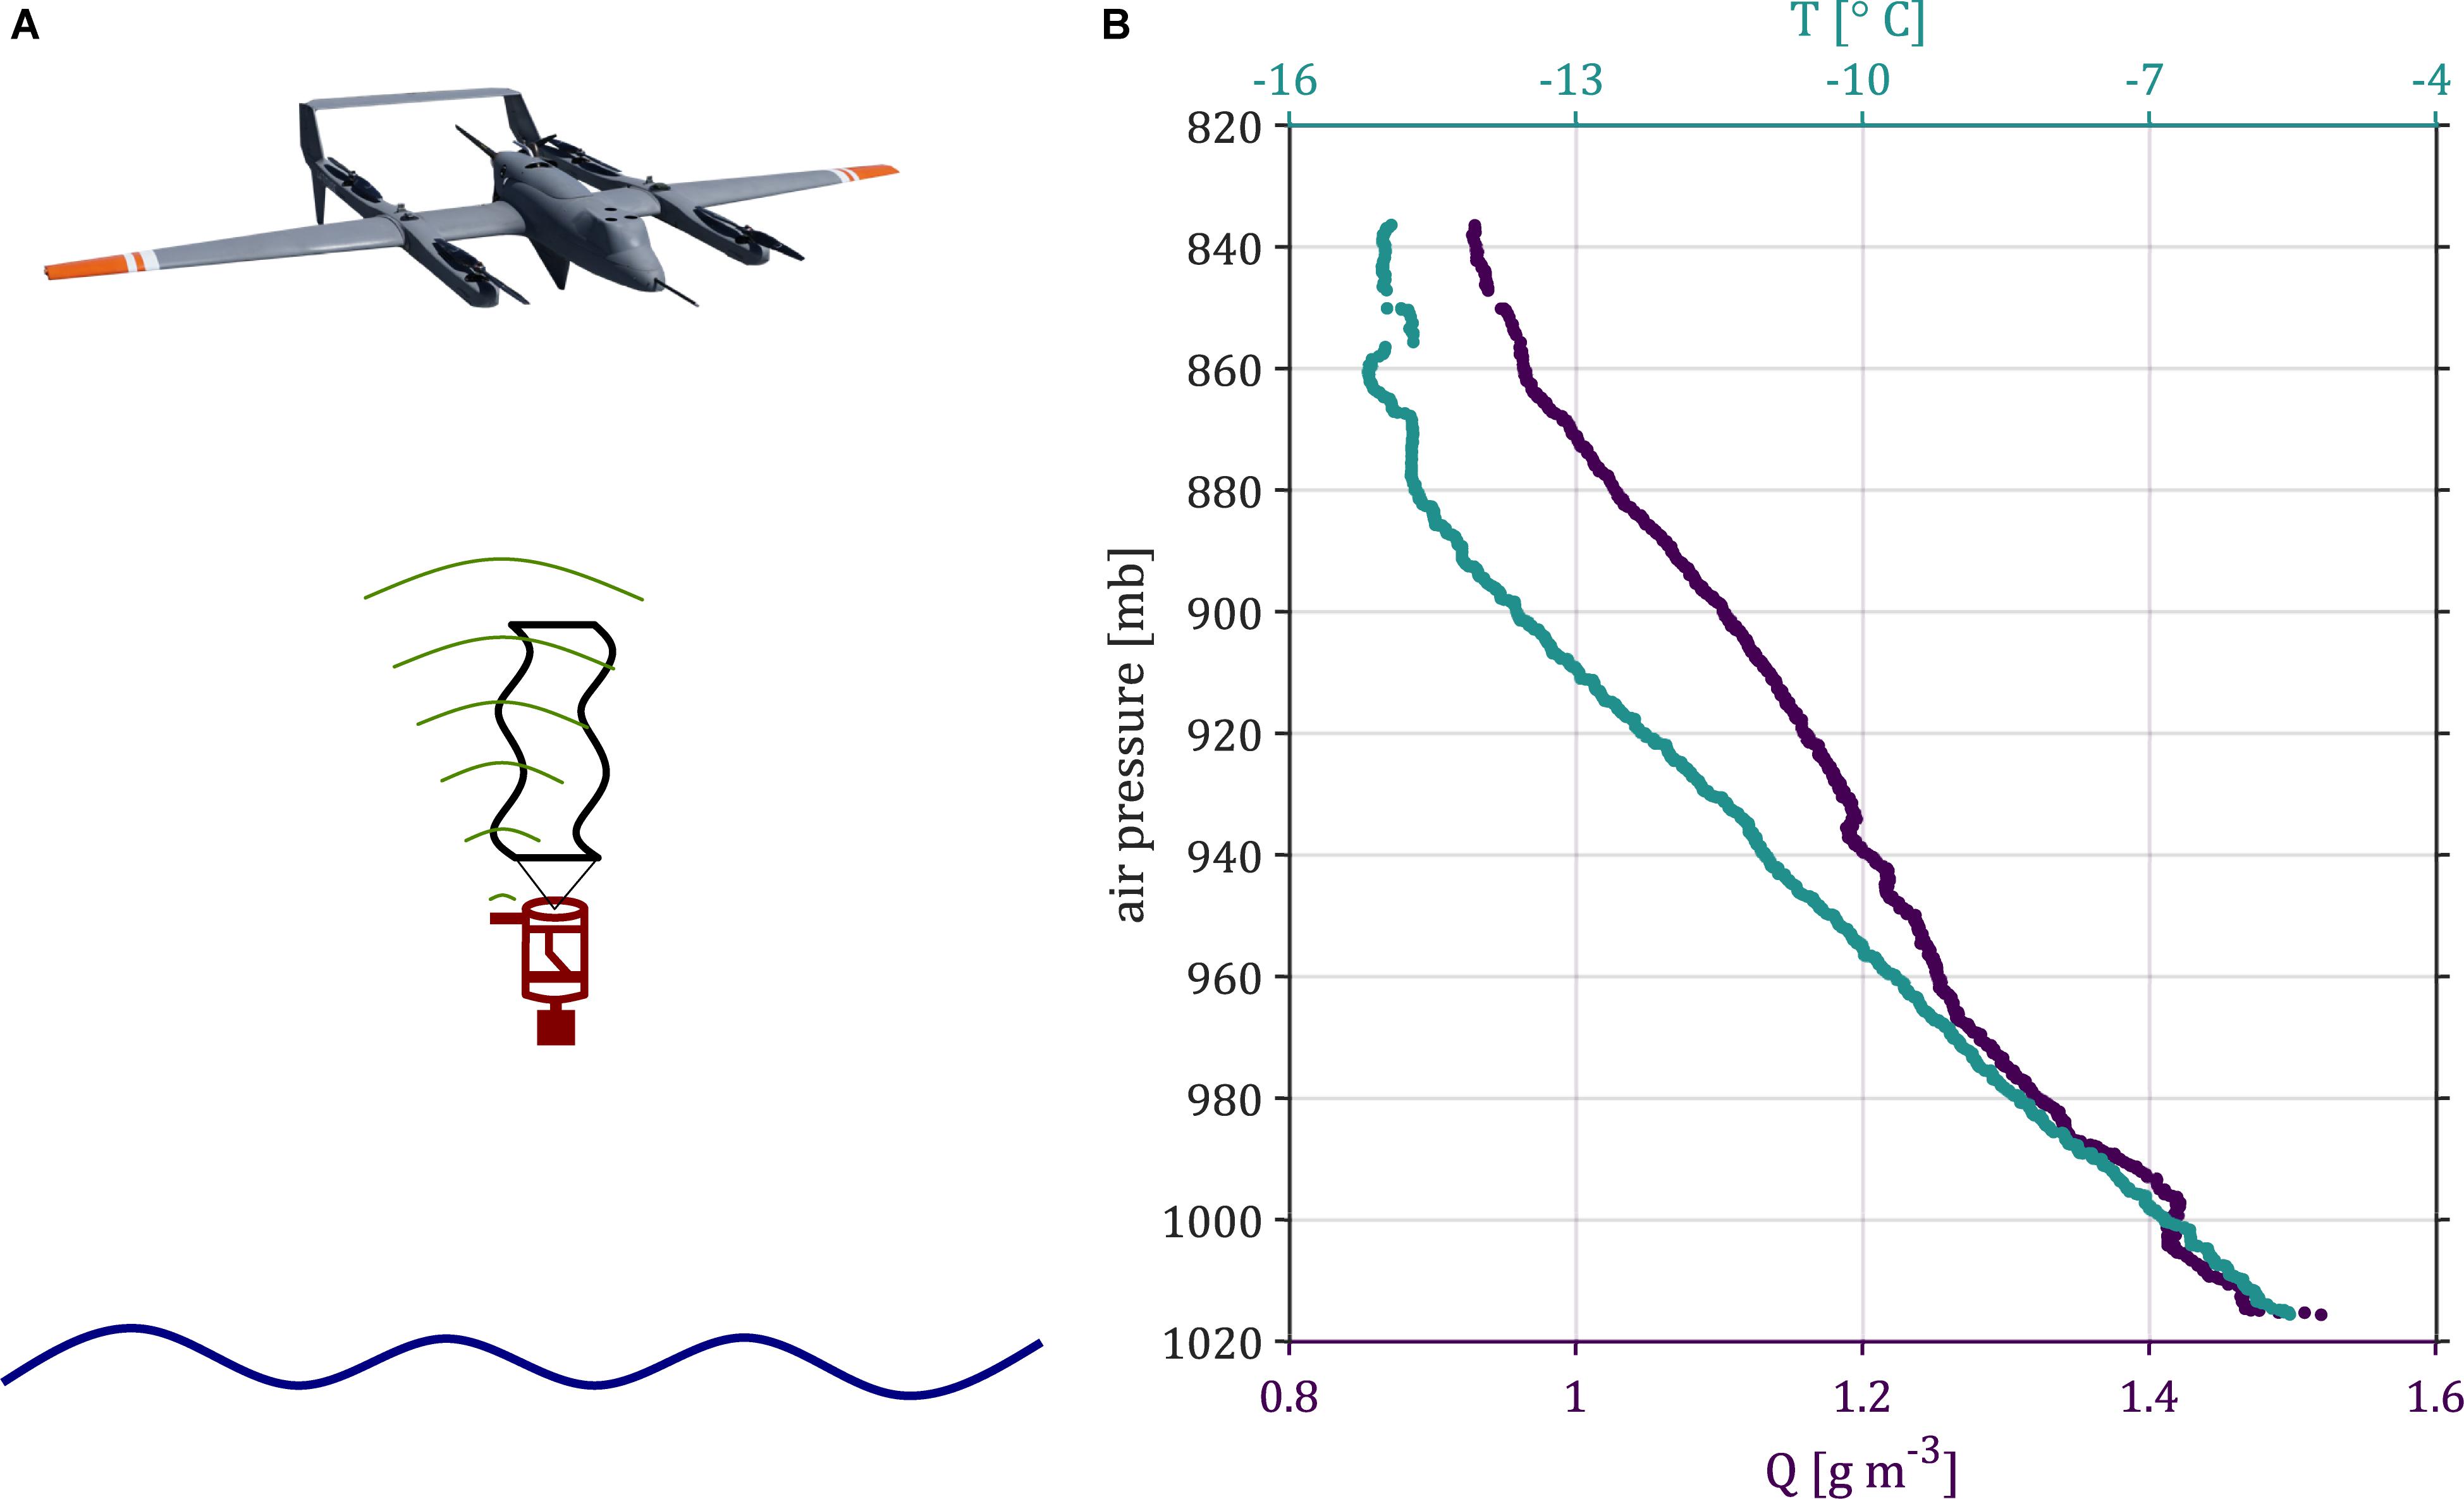
Figure 11. (A) Representation of the DDμD being ejected from the UAV and collecting data while falling through the atmosphere. (B) Air temperature (teal) and absolute humidity (violet).
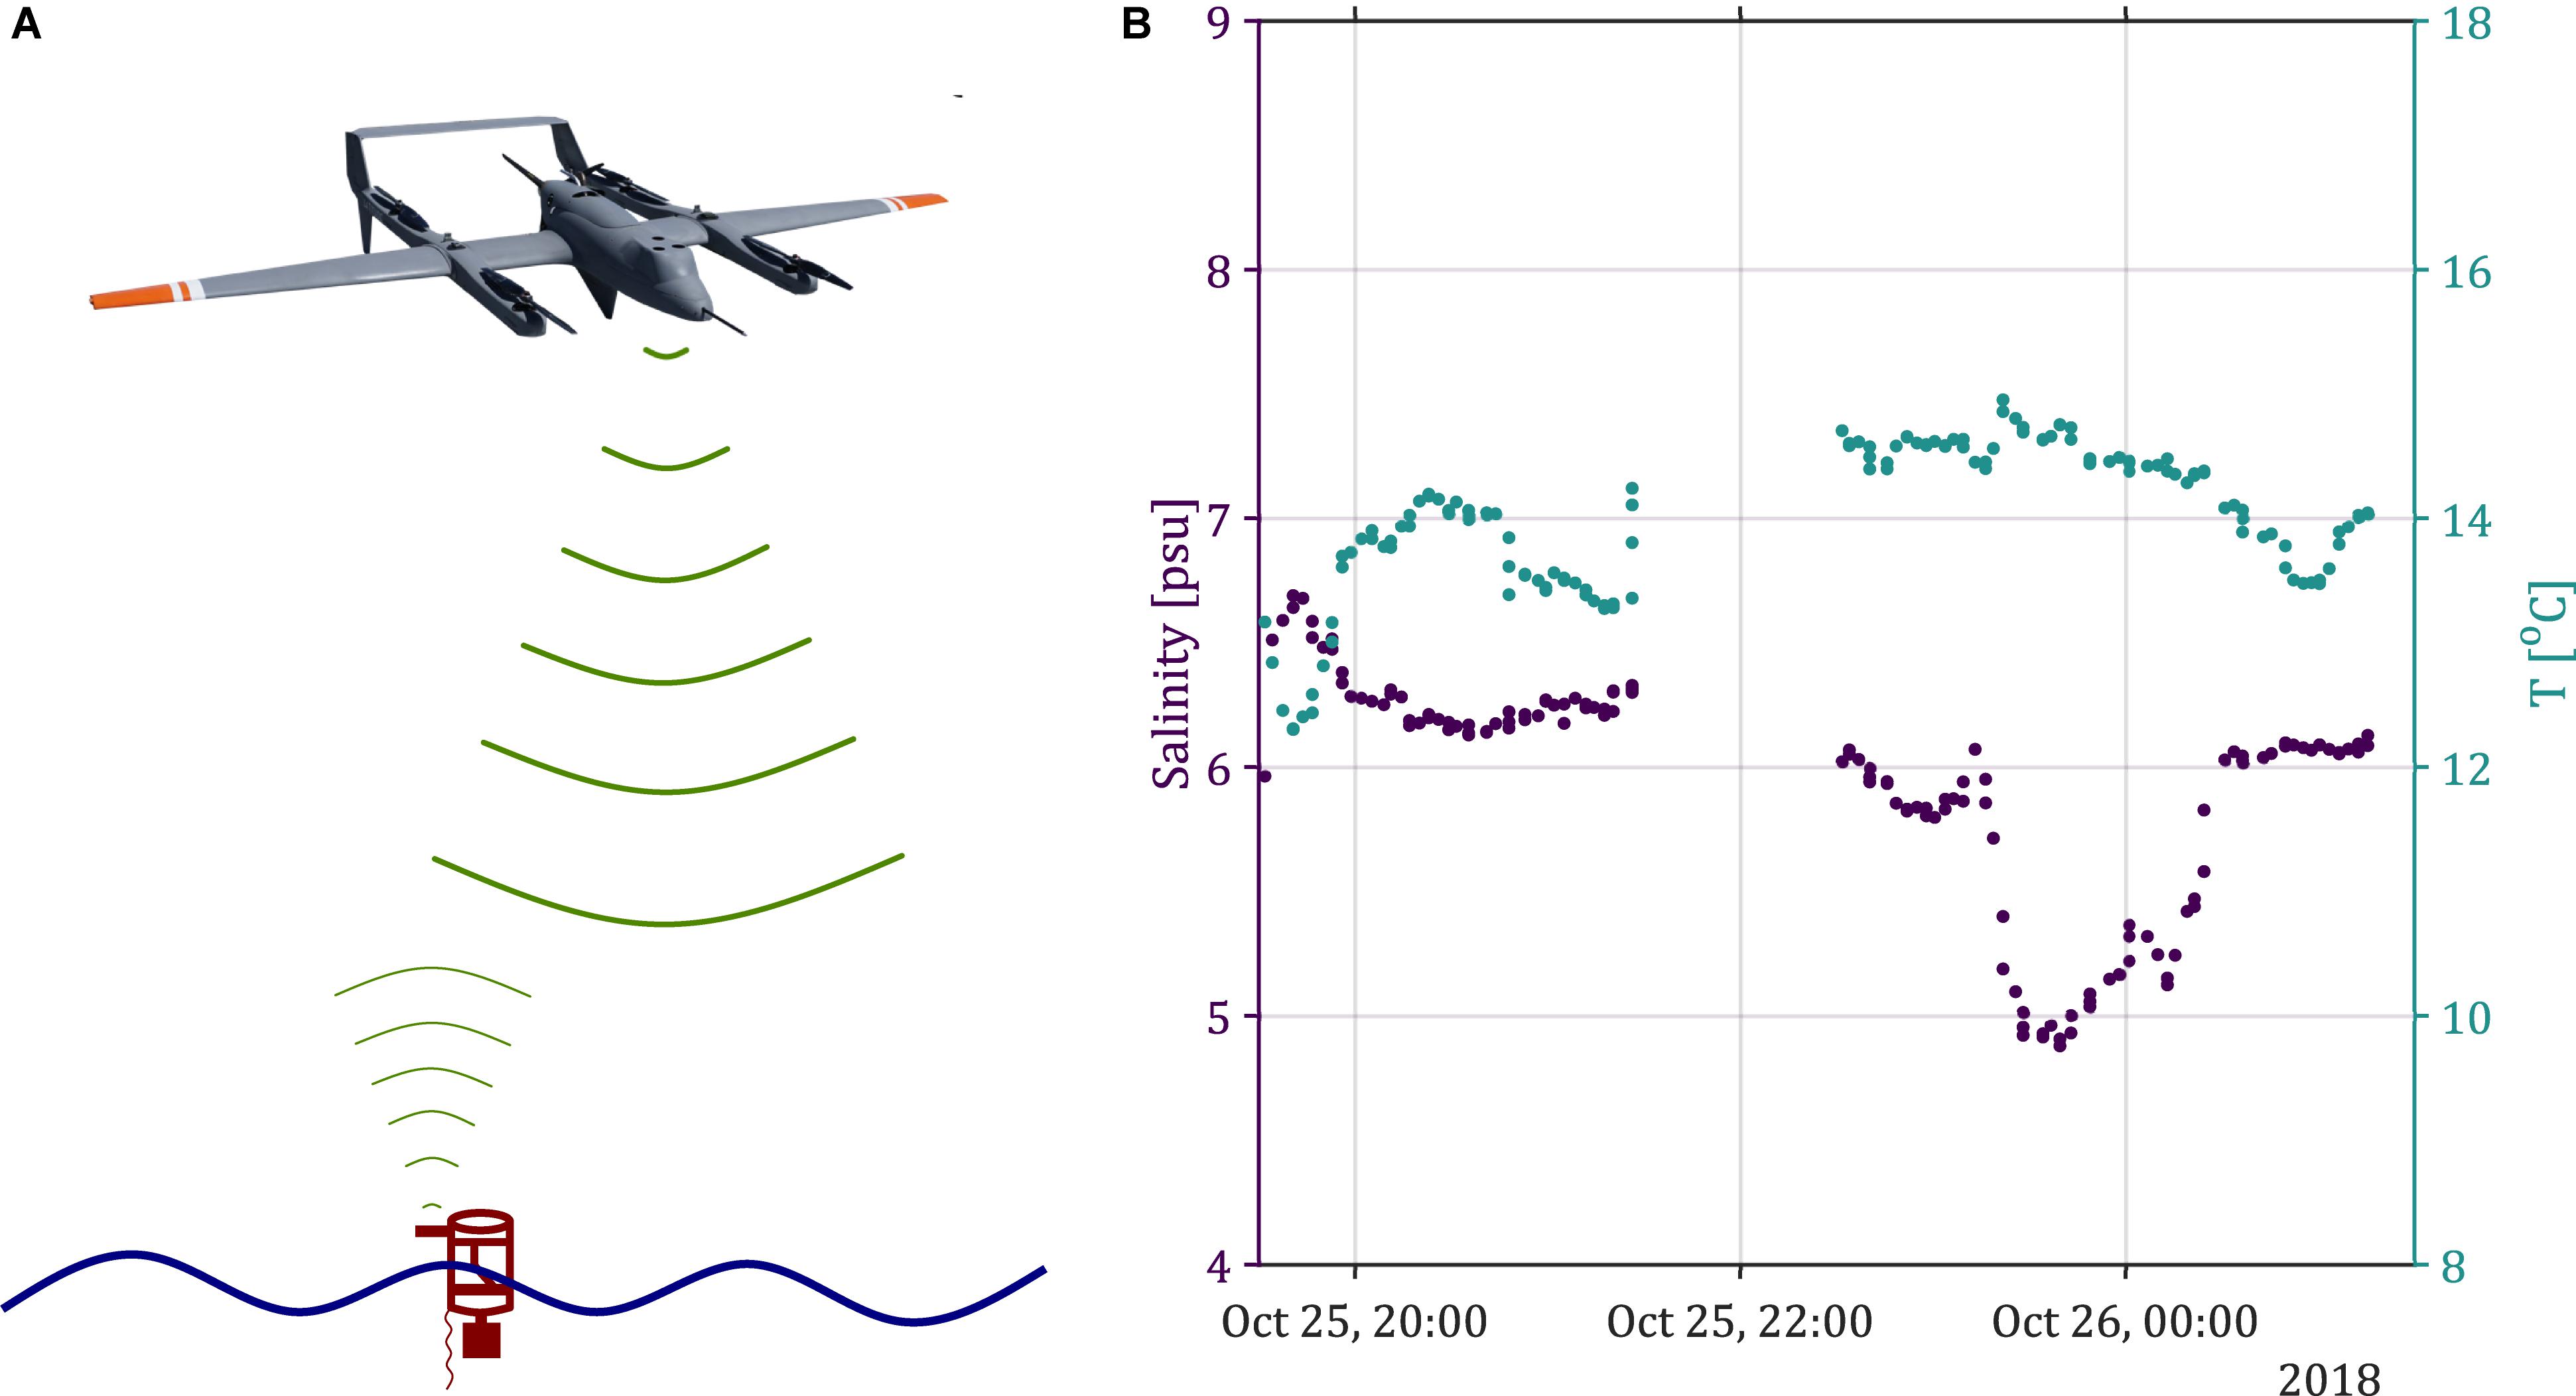
Figure 12. (A) Representation of the DDμD in the water with its thermistor chain unfurled. (B) Time series of nearest-surface water temperature (teal) and salinity (violet) from an example deployment. Data were not recorded during the short gap in the time series.
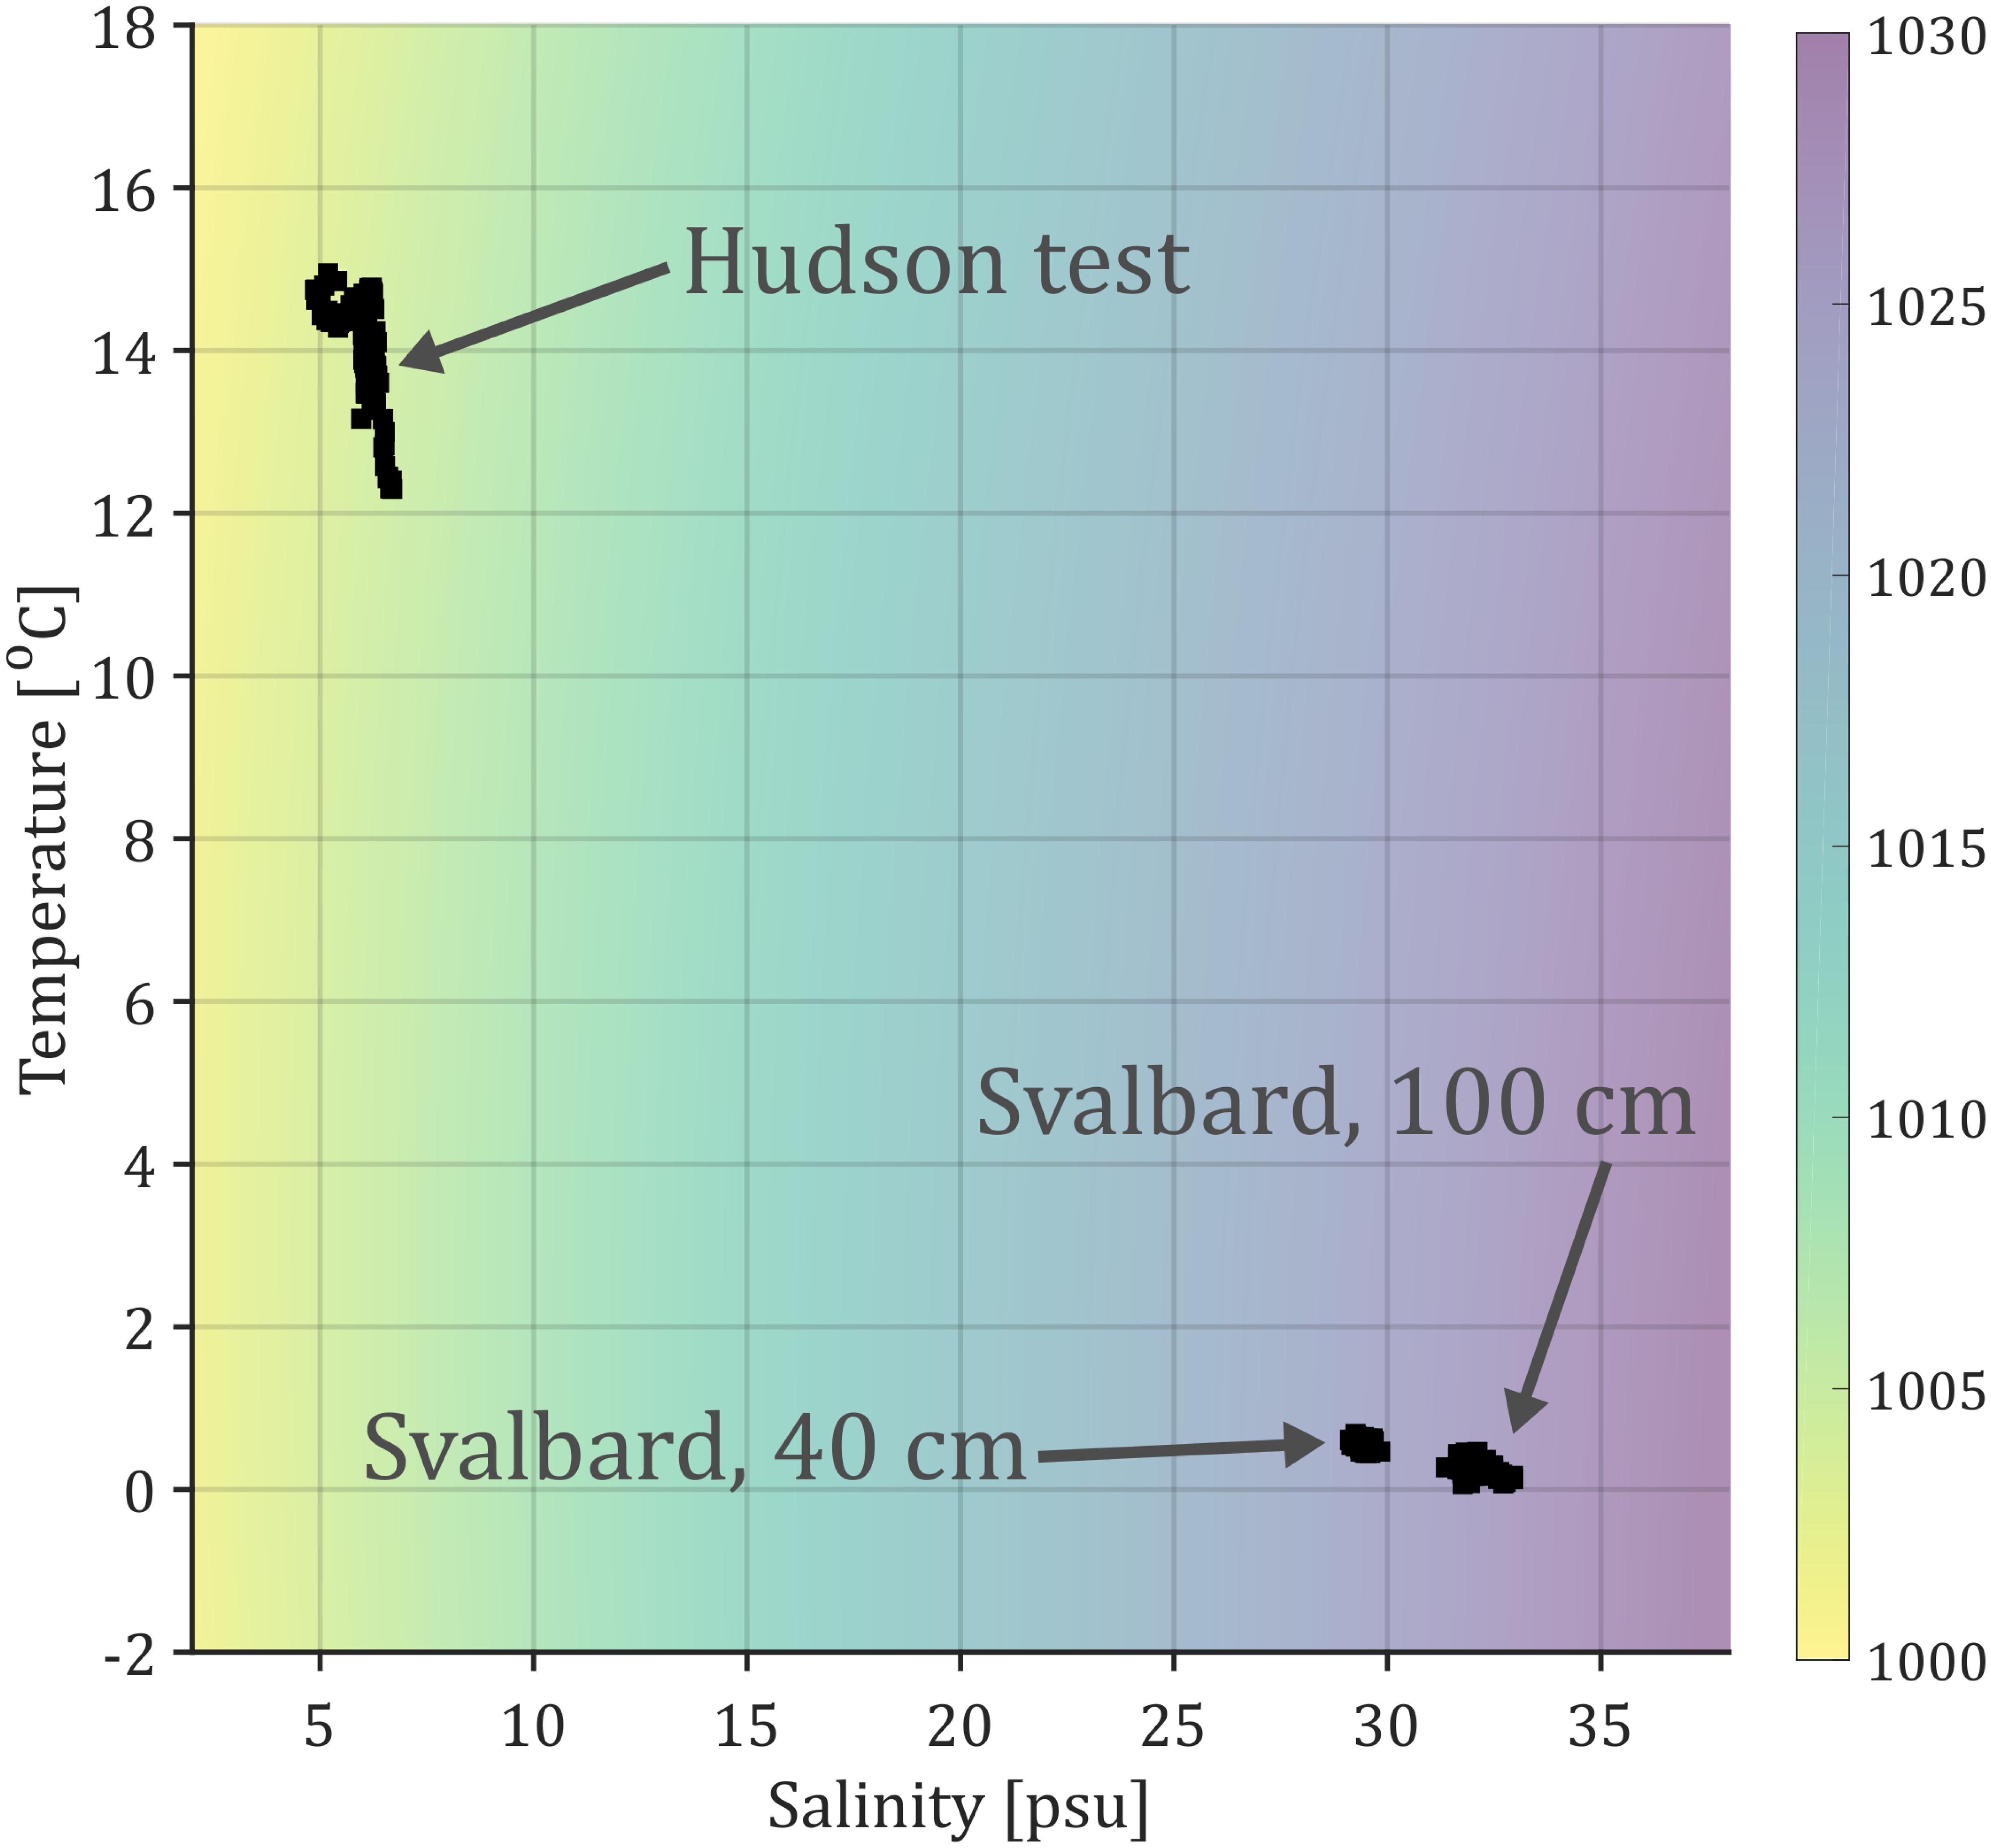
Figure 13. T-S (temperature-salinity) plot showing data from three separate DDμD-obtained sources: a test in the Hudson River and two in Svalbard at 40 cm and 100 cm depth. The background is colored according to water density in kg m–3.
The high-frequency data streams provided by the MET payload require a particular type of processing in order to yield meaningful products, rendering fluxes of momentum and heat from basic measurements of the physical characteristics of fluids through eddy covariance (Edson et al., 1998; Sun et al., 2001; Reineman et al., 2013; Elston et al., 2014). When describing atmospheric boundary layer turbulent fluxes, it is useful to make use of Fourier analysis in order to determine the scales of fluid velocity fluctuations relevant to physical transfer processes. As an example, the cospectra shown in Figure 14 were computed using turbulent vertical wind velocities in addition to along-stream wind velocity (a) and air temperature (c). Notice that the application of motion correction changes the direction of the flux in (a); the earth-referenced fluid velocity here indicates the downward exchange of forward momentum. The ogives shown in (b,d) represent the cumulative flux density of the cospectra as integrated from the high frequencies to the low frequencies (French et al., 2007). They are normalized by the total integrated covariances and show the dominant frequency scales of flux.
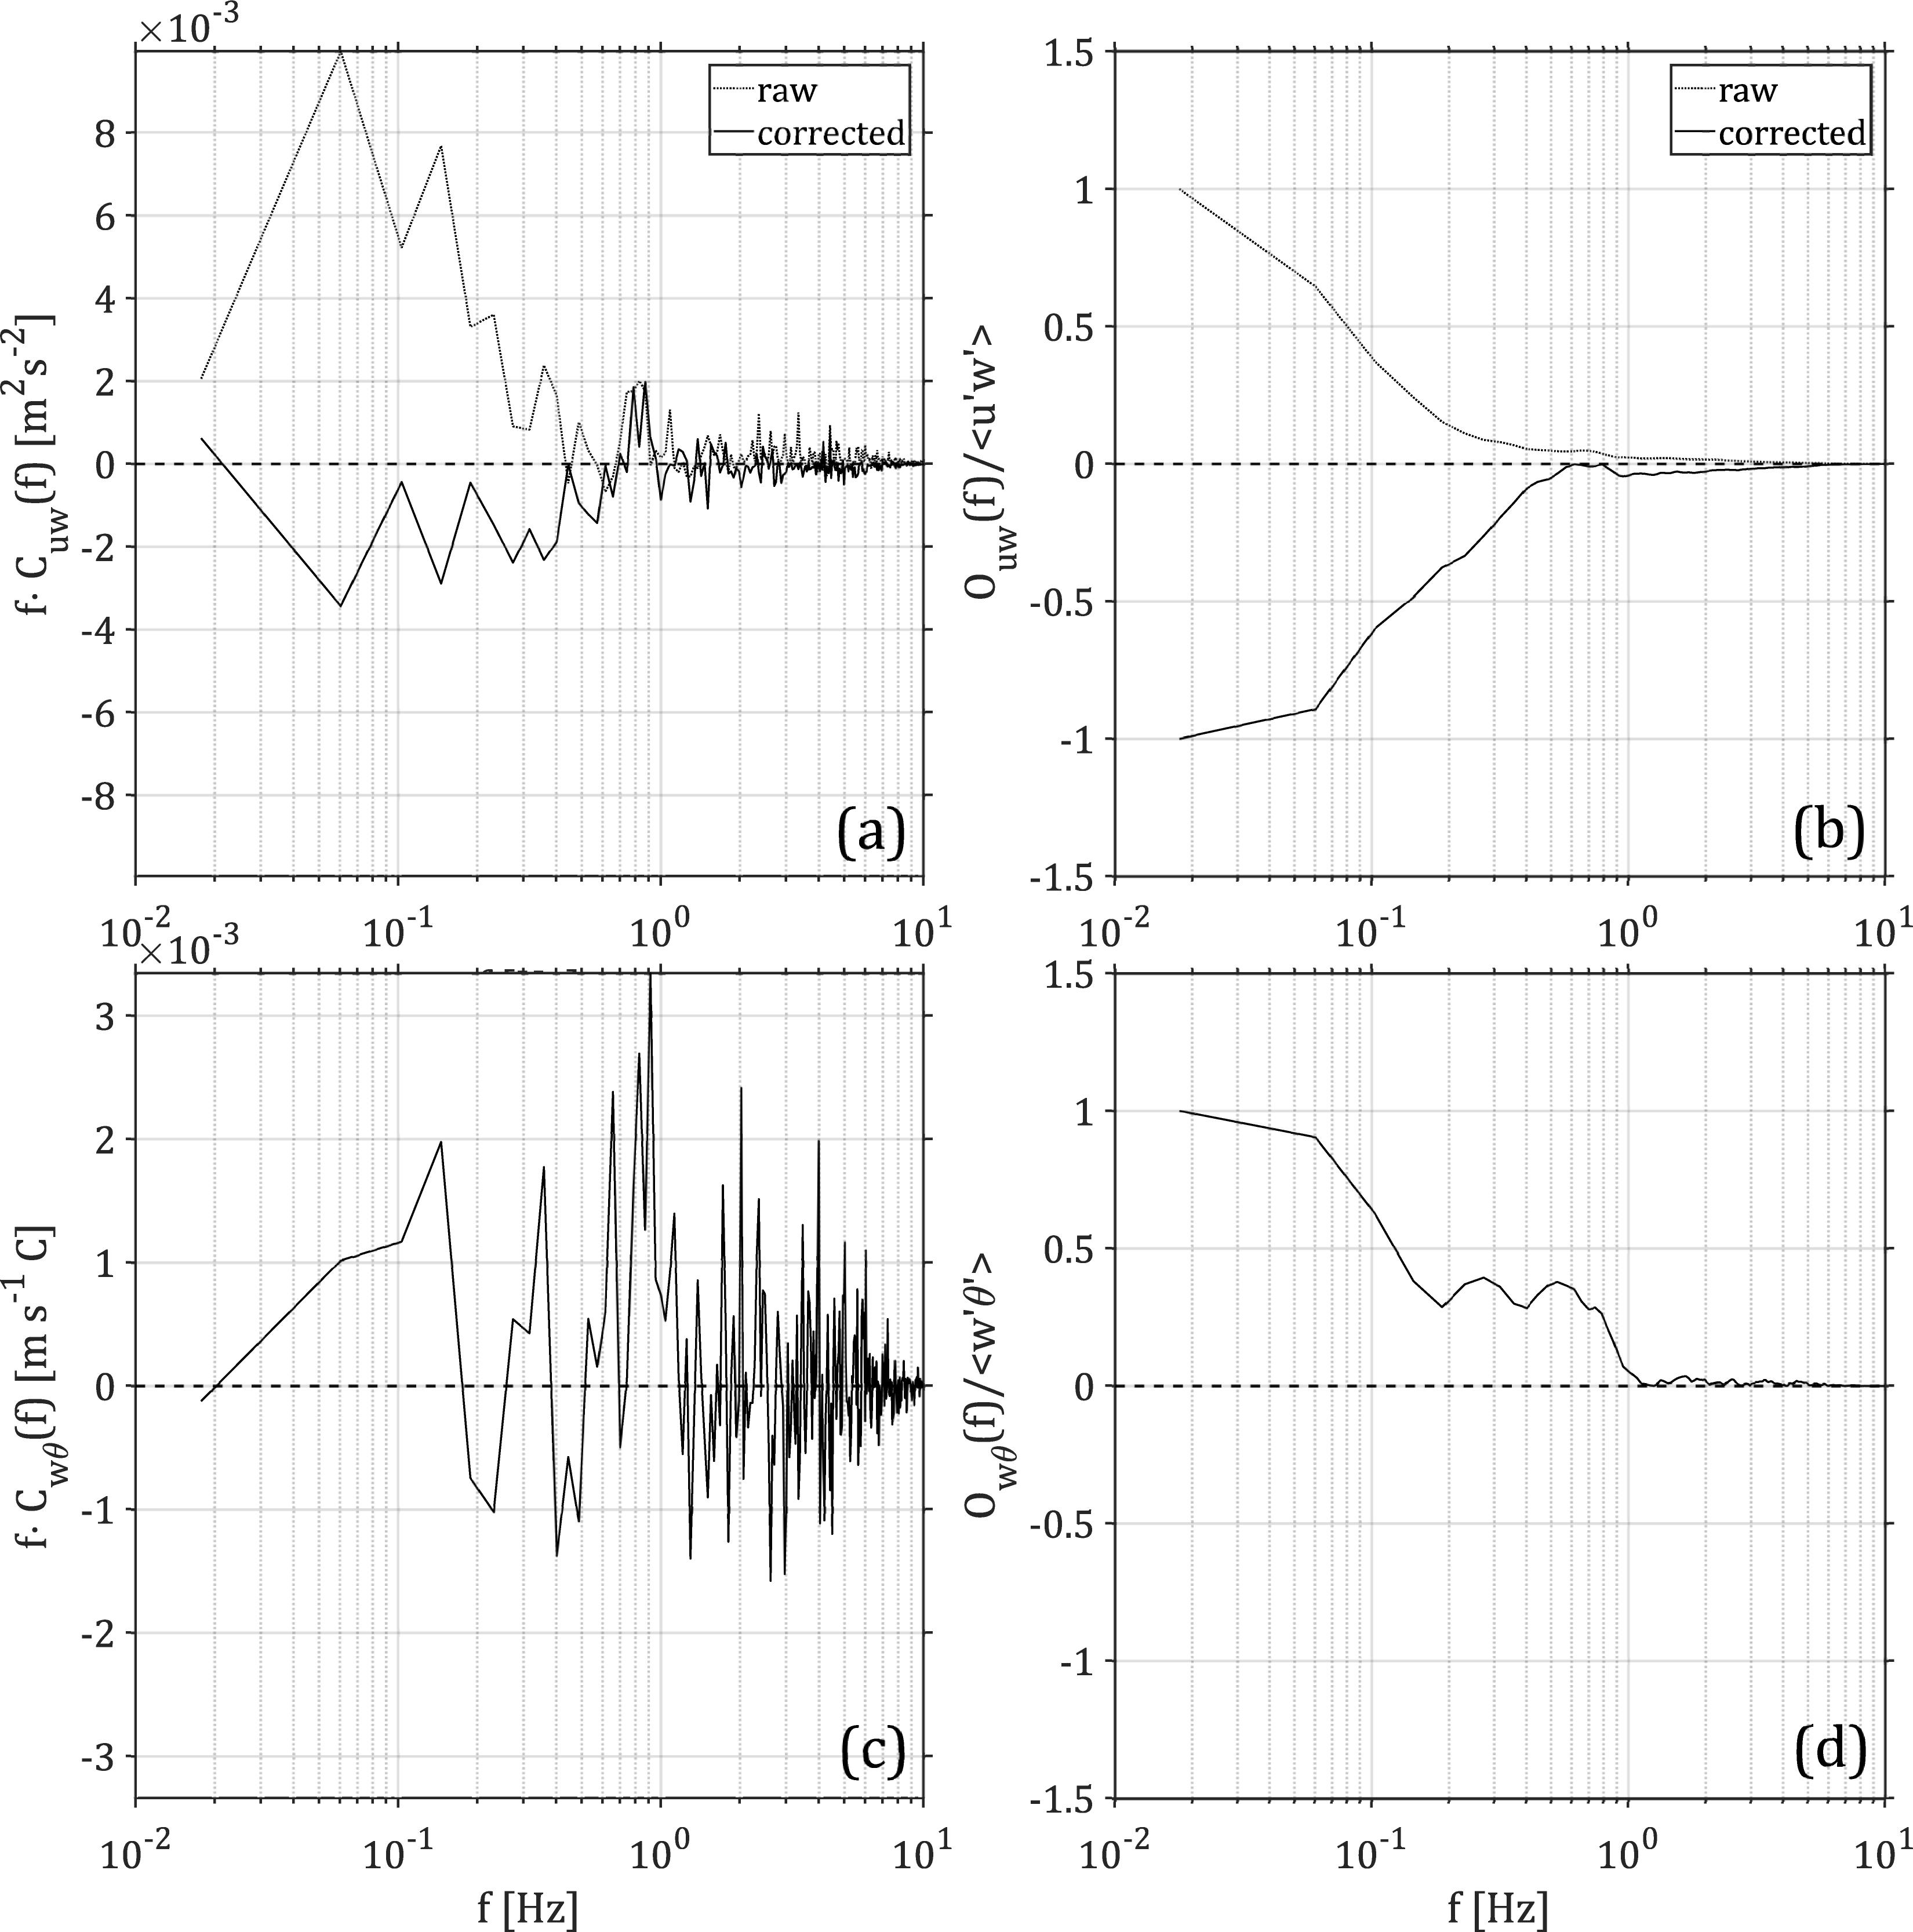
Figure 14. Cospectra (a,c) and ogives (b,d). Computed using the vertical velocity time series and the alongstream velocity (a,b) or the air temperature (c,d). Ogives represent the cumulative flux density, with the lower limit of integration moving from right (high frequency) to left (low frequency). Integrating the cospectra yields wind stress τ = 0.0053 N m–2 and sensible heat flux Hs = −2.6 W m–2. In both cases, positive is downward (into the ice/ocean), a negation of the values of the cospectra.
Measurements from UAVs will fill a fundamental gap in our understanding of ocean surface and marine atmospheric boundary layer physical processes. For example, point measurements have provided evidence that air-sea fluxes are affected by sea surface temperature fronts (Friehe et al., 1991), while satellite observations have revealed that such fronts impact the wind field over the ocean (Chelton et al., 2004). However, further study is needed of processes which exist over areas large enough to require synoptic observations yet vary on scales small enough to be obscured by satellite-based measurements. These include submesoscale (0.1–10 km) variations in sea surface temperature and sea surface microlayer biochemical properties near frontal regions. Although substantial subsurface turbulent kinetic energy dissipation has been observed near these fronts (D’Asaro et al., 2011), the connection between these types of properties and air-sea heat, momentum, and gas fluxes is not fully understood. Proper description of the nature of these processes will improve our understanding of the ocean surface heat budget and mixed layer dynamics. Furthermore, submesoscale ocean surface motions are known to strongly impact buoyant material transport (D’Asaro et al., 2018).
Conclusion
We have described systems that combine the best of modern developments in UAV operation with advanced sensor technologies. High-endurance (15 h) UAV flight missions allow for extensive coverage of large-scale geophysical phenomena. The VTOL capability afforded by the HQ series of UAVs allows for ship-based deployment that is safer and requires less logistical support than previous modes of launch and recovery. The sensor suites used in the payloads described here represent the cutting edge of ocean surface and marine atmospheric boundary layer observational technology. Together, these enable the study of multiscale physical and biogeochemical processes which are at the heart of topics with broad environmental and human impact. For example, submesoscale currents and the effects of oceanic fronts on transport and surface biochemical properties elude many traditional observational techniques. These processes exist near the operational boundaries of modern sensing capabilities – too large in scale to be adequately sampled by ship or mooring, too finely varying to be properly characterized via satellite. The UAV sensing systems described here offer a strong mode for filling this observational need. Ultimately, improvements to measurements like the ones described here will lead to advances in the forecasting of weather and climate systems.
Data Availability Statement
The datasets generated during the current study are available in a public repository at Columbia Academic Commons (doi: 10.7916/d8-mh4p-zp21).
Author Contributions
CZ was responsible for the overall development project, including concept and design, guided the data analysis, and led the writing. SB, TD, and RH developed the payloads. SB, NL, and TD contributed to the manuscript discussion and writing. SB and NL completed the data processing and analysis, as well as figure preparation. AF provided technical expertise regarding the UAV systems. AS provided the satellite data products and ocean color expertise.
Funding
This work was supported by the Gordon & Betty Moore Foundation (Grant #3596: “Payloads for Investigations of Spatial and Temporal Variability of Ocean and Ice Conditions In and Near the Marginal Ice Zone”, Grant #5448: “Bridging the Scientific and Indigenous Communities to Study Sea Ice Change in Arctic Alaska”, and Grant #4886), the Schmidt Ocean Institute (Award Number: SOI CU16-2285), and NASA (Grant NNX16AJ08G).
Conflict of Interest
AF is employed by L3 Latitude, the company hired by Lamont-Doherty Earth Observatory of Columbia University to operate the UAVs, and he contributed general technical expertise about UAV systems.
The remaining authors declare that the research was conducted in the absence of any commercial or financial relationships that could be construed as a potential conflict of interest.
Acknowledgments
We thank R. Storvold of Norut for the invitation to participate in CICCI3 in Ny-Ålesund, Svalbard, Norway in 2015; T. Bates, S. Stalin, and N. Delich of NOAA-PMEL for operating the Mantas in Ny-Ålesund; the cruise chief scientist O. Wurl of the University of Oldenburg, the captain and crew members of the R/V Falkor (cruise FK161010); and J. Armer, S. Bowers, and J. McDaniel of the Latitude Engineering flight crew for piloting the HQ-60s aboard the R/V Falkor. This is LDEO contribution number 8367.
References
Bates, T. S., Quinn, P. K., Johnson, J. E., Corless, A., Brechtel, F. J., Stalin, S. E., et al. (2013). Measurements of atmospheric aerosol vertical distributions above Svalbard, Norway, using unmanned aerial systems (UAS). Atmos. Meas. Tech. 6, 2115–2120. doi: 10.5194/amt-6-2115-2013
Cassano, J. J., Maslanik, J. A., Zappa, C. J., Gordon, A. L., Cullather, R. I., and Knuth, S. L. (2010). Observations of antarctic polynya with unmanned aircraft systems. EOS Trans. Am. Geophys. Union 91, 245–246. doi: 10.1029/2010EO280001
Chelton, D. B., Schlax, M. G., Freilich, M. H., and Milliff, R. F. (2004). Satellite measurements reveal persistent small-scale features in ocean winds. Science 303, 978–983. doi: 10.1126/science.1091901
Chen, S. S., Kerns, B. W., Guy, N., Jorgensen, D. P., Delanoë, J., Viltard, N., et al. (2015). Aircraft observations of dry air, ITCZ, convective cloud systems and cold pools in MJO during DYNAMO. Bull. Am. Meteorol. Soc. 91, 245–246. doi: 10.1175/BAMS-D-13-00196.1
Cione, J. J., Bryan, G. H., Dobosy, R., Zhang, J. A., de Boer, G., Aksoy, A., et al. (2019). Eye of the storm: observing hurricanes with a small unmanned aircraft system. Bull. Am. Meteorol. Soc. doi: 10.1175/BAMS-D-19-0169.1
Cione, J. J., Kalina, E. A., Uhlhorn, E. W., Farber, A. M., and Damiano, B. (2016). Coyote unmanned aircraft system observations in Hurricane Edouard (2014). Earth Space Sci. 3, 370–380. doi: 10.1002/2016EA000187
D’Asaro, E., Lee, C., Rainville, L., Thomas, L., and Harcourt, R. (2011). Enhanced turbulence and energy dissipation at ocean fronts. Science 332:1201515. doi: 10.1126/science.1201515
D’Asaro, E. A., Shcherbina, A. Y., Klymak, J. M., Molemaker, J., Novelli, G., Guigand, C. M., et al. (2018). Ocean convergence and the dispersion of flotsam. Proc. Natl. Acad. Sci. U.S.A. 115:1162. doi: 10.1073/pnas.1718453115
Edson, J. B., Crawford, T., Crescenti, J., Farrar, J. T., Frew, N., Gerbi, G., et al. (2007). The coupled boundary layers and air-sea transfer experiment in low winds (CBLAST-LOW). Bull. Am. Meteorol. Soc. 88, 341–356.
Edson, J. B., Hinton, A. A., Prada, K. E., Hare, J. E., and Fairall, C. W. (1998). Direct covariance flux estimates from mobile platforms at sea. J. Atmos. Ocean. Technol. 15, 547–562. doi: 10.1175/1520-0426(1998)015<0547:dcfefm>2.0.co;2
Edson, J. B., Zappa, C. J., Ware, J., McGillis, W. R., and Hare, J. E. (2004). Scalar flux profile relationships over the open ocean. J. Geophys. Res. 109:C08S09. doi: 10.1029/2003JC001960
Elston, J., Argrow, B., Stachura, M., Weibel, D., Lawrence, D., and Pope, D. (2014). Overview of small fixed-wing unmanned aircraft for meteorological sampling. J. Atmos. Ocean. Technol. 32, 97–115. doi: 10.1175/JTECH-D-13-00236.1
Elston, J. S., Roadman, J., Stachura, M., Argrow, B., Houston, A., and Frew, E. (2011). The tempest unmanned aircraft system for in situ observations of tornadic supercells: design and VORTEX2 flight results. J. Field Robot. 28, 461–483. doi: 10.1002/rob.20394
Engel, A., Bange, H. W., Cunliffe, M., Burrows, S. M., Friedrichs, G., Galgani, L., et al. (2017). The ocean’s vital skin: toward an integrated understanding of the sea surface microlayer. Front. Mar. Sci. 4:165. doi: 10.3389/fmars.2017.00165
Farrar, J. T., Zappa, C. J., Weller, R. A., and Jessup, A. T. (2007). Sea surface temperature signatures of oceanic internal waves in low winds. J. Geophys. Res. Oceans 112:C06014. doi: 10.1029/2006JC003947
French, J. R., Drennan, W. M., Zhang, J. A., and Black, P. G. (2007). Turbulent fluxes in the hurricane boundary layer. Part I: momentum flux. J. Atmos. Sci. 64, 1089–1102. doi: 10.1175/JAS3887.1
Friehe, C. A., Shaw, W. J., Rogers, D. P., Davidson, K. L., Large, W. G., Stage, S. A., et al. (1991). Air-sea fluxes and surface layer turbulence around a sea surface temperature front. J. Geophys. Res. 96, 8593–8609. doi: 10.1029/90JC02062
Hacker, J. M., and Crawford, T. L. (1999). The BAT-probe: the ultimate tool to measure turbulence from any kind of aircraft (or sailplane). J. Techn. Soar. 23, 43–46.
Johnston, D. W. (2019). Unoccupied aircraft systems in marine science and conservation. Ann. Rev. Mar. Sci. 11, 439–463. doi: 10.1146/annurev-marine-010318-095323
Knuth, S. L., and Cassano, J. J. (2014). Estimating sensible and latent heat fluxes using the integral method from in situ aircraft measurements. J. Atmos. Ocean. Technol. 31, 1964–1981. doi: 10.1175/JTECH-D-14-00008.1
Kurata, N., Vella, K., Hamilton, B., Shivji, M., Soloviev, A., Matt, S., et al. (2016). Surfactant-associated bacteria in the near-surface layer of the ocean. Sci. Rep. 6:19123. doi: 10.1038/srep19123
Lucieer, A., Malenovský, Z., Veness, T., and Wallace, L. (2014). HyperUAS–Imaging spectroscopy from a multirotor unmanned aircraft system. J. Field Robot. 31, 571–590. doi: 10.1002/rob.21508
Moum, J. N., Szoeke, S. P. D., Smyth, W. D., Edson, J. B., DeWitt, H. L., Moulin, A. J., et al. (2014). Air-sea interactions from the westerly wind bursts during the November 2011 MJO in the Indian Ocean. Bull. Amer. Meteor. Soc. 95, 1185–1199. doi: 10.1175/BAMS-D-1112-00225.00221
Payne, R. E. (1972). Albedo of the sea surface. J. Atmos. Sci. 29, 959–970. doi: 10.1175/1520-0469(1972)029<0959:aotss>2.0.co;2
Rahlff, J., Ribas-Ribas, M., Brown, S. M., Mustaffa, N. I. H., Renz, J., Peck, M. A., et al. (2018). Blue pigmentation of neustonic copepods benefits exploitation of a prey-rich niche at the air-sea boundary. Sci. Rep. 8:11510. doi: 10.1038/s41598-018-29869-7
Reineman, B. D., Lenain, L., and Melville, W. K. (2016). The use of ship-launched fixed-wing UAVs for measuring the marine atmospheric boundary layer and ocean surface processes. J. Atmos. Ocean. Technol. 33, 2029–2052. doi: 10.1175/JTECH-D-15-0019.1
Reineman, B. D., Lenain, L., Statom, N. M., and Melville, W. K. (2013). Development and testing of instrumentation for UAV-based flux measurements within terrestrial and marine atmospheric boundary layers. J. Atmos. Ocean. Technol. 30, 1295–1319. doi: 10.1175/jtech-d-12-00176.1
Ribas-Ribas, M., Mustaffa, N. I. H., Rahlff, J., Stolle, C., and Wurl, O. (2017). Sea Surface scanner (S3): a catamaran for high-resolution measurements of biogeochemical properties of the sea surface microlayer. J. Atmos. Ocean. Technol. 34, 1433–1448. doi: 10.1175/jtech-d-17-0017.1
Shang, S., Lee, Z., Lin, G., Hu, C., Shi, L., Zhang, Y., et al. (2017). Sensing an intense phytoplankton bloom in the western Taiwan Strait from radiometric measurements on a UAV. Remote Sens. Environ. 198, 85–94. doi: 10.1016/j.rse.2017.05.036
Sun, J., Vandemark, D., Mahrt, L., Vickers, D., Crawford, T. L., and Vogel, C. (2001). Momentum transfer over the coastal zone. J. Geophys. Res. Atmos. 106, 437–412.
Williams, G. D., Fraser, A. D., Lucieer, A., Turner, D., Cougnon, E., Kimball, P., et al. (2016). Drones in a cold climate. EOS Trans. Am. Geophys. Union 97, 245–246. doi: 10.1029/2016EO043673
Wurl, O., Bird, K., Cunliffe, M., Landing, W. M., Miller, U., Mustaffa, N. I. H., et al. (2018). Warming and inhibition of Salinization at the Ocean’s surface by cyanobacteria. Geophys. Res. Lett. 45, 4230–4237. doi: 10.1029/2018GL077946
Zappa, C. J., and Jessup, A. T. (2004). “Variability of ocean skin temperature from airborne infrared imagery during CBLAST-Low,” in Proceedings of the 16th Symposium on Boundary Layers and Turbulence, Portland, MA.
Zappa, C. J., and Jessup, A. T. (2005). High resolution airborne infrared measurements of ocean skin temperature. Geosci. Remote Sens. Lett. 2, 146–150. doi: 10.1109/LGRS.2004.841629
Keywords: unmanned aerial vehicle (UAV), unmanned aircraft system (UAS), infrared (IR) imaging, air-sea interaction, turbulent fluxes of momentum heat and water vapor, longwave and shortwave irradiance, vertical take-off and landing (VTOL)
Citation: Zappa CJ, Brown SM, Laxague NJM, Dhakal T, Harris RA, Farber AM and Subramaniam A (2020) Using Ship-Deployed High-Endurance Unmanned Aerial Vehicles for the Study of Ocean Surface and Atmospheric Boundary Layer Processes. Front. Mar. Sci. 6:777. doi: 10.3389/fmars.2019.00777
Received: 15 December 2018; Accepted: 03 December 2019;
Published: 21 January 2020.
Edited by:
Leonard Pace, Schmidt Ocean Institute, United StatesReviewed by:
Zhongping Lee, University of Massachusetts Boston, United StatesJoão Tasso Sousa, University of Porto, Portugal
Copyright © 2020 Zappa, Brown, Laxague, Dhakal, Harris, Farber and Subramaniam. This is an open-access article distributed under the terms of the Creative Commons Attribution License (CC BY). The use, distribution or reproduction in other forums is permitted, provided the original author(s) and the copyright owner(s) are credited and that the original publication in this journal is cited, in accordance with accepted academic practice. No use, distribution or reproduction is permitted which does not comply with these terms.
*Correspondence: Christopher J. Zappa, emFwcGFAbGRlby5jb2x1bWJpYS5lZHU=