 Laurent M. Chérubin1*
 Fraser Dalgleish1,2
 Ali Khaleel Ibrahim3
 Michelle Schärer-Umpierre4
 Richard S. Nemeth5
 Anthony Matthews6
 Richard Appeldoorn7
- 1Harbor Branch Oceanographic Institute, Florida Atlantic University, Boca Raton, FL, United States
- 2Harris Corporation, Melbourne, FL, United States
- 3Department Computer & Electrical Engineering and Computer Science, Florida Atlantic University, Boca Raton, FL, United States
- 4HJR Reefscaping, Boquerón, PR, United States
- 5Center for Marine and Environmental Studies, University of the Virgin Islands, St. Thomas, US Virgin Islands
- 6EPS Corporation, Panama City Beach, FL, United States
- 7Caribbean Coral Reef Institute, University of Puerto Rico, Mayaguez, PR, United States
Fish spawning aggregations (FSAs) consist of the temporary gathering of a large number of fishes at a specific location to spawn. Monitoring of FSA is typically conducted by divers, but surveys are often restricted to a limited area and dependent upon sea conditions, thus our knowledge of FSA dynamics is extremely limited. Fisheries independent research strives for new technology that can help remotely and unobtrusively quantify fish biomass and abundance. Since some fish species, such as groupers, produce sounds during reproductive behaviors, Eulerian passive acoustic monitoring provides information when divers cannot access the FSA site. Fish sounds provide an innovative approach to assess fish presence and potentially their numbers during reproductive events. However, this technology is limited by the sound propagation range, hence the distance between the fish emitting sounds and the hydrophone location. As such, this Eulerian monitoring approach implicitly creates a knowledge gap about what happens beyond the range of the recorders. Furthermore, the large datasets make the detection process by human ears and eyes very tedious and inconsistent. This paper reports on two innovative approaches to overcome these limitations. To facilitate fish call detections, we have developed an algorithm based on machine learning and voice recognition methods to identify and classify the sounds known to be produced by certain species during FSA. This algorithm currently operates on a SV3 Liquid Robotics wave glider, an autonomous surface vehicle which has been fitted to accommodate a passive acoustic listening device and can cover large areas under a wide range of sea conditions. Fish sounds detections, classification results, and locations along with environmental data are transmitted in real-time enabling verification of the sites with high detections by divers or other in situ methods. Recent surveys in the US Virgin Islands with the SV3 Wave Glider are revealing for the first time the spatial and temporal distribution of fish calls surrounding known FSA sites. These findings are critical to understanding the dynamics of fish populations because calling fish were detected several kilometers away from the known FSAs. These courtship associated sounds from surrounding areas suggest that other FSAs may exist in the region.
Introduction
Fisheries sustainability and ecosystem health not only rely on habitat quality and biodiversity but also on reproductive success (Mumby et al., 2006). In coral reef ecosystems, some large predatory species such as groupers, aggregate to spawn in large numbers at specific locations and times (Domeier and Colin, 1997). These fish spawning aggregation (FSA) sites are shared by multiple species that may overlap in time (Heyman and Kjerfve, 2008) and as such, constitute breeding hotspots requiring some form of protection (Erisman et al., 2017). Because FSAs are temporally predictable and are characterized by strong site fidelity, once located, they become vulnerable to overfishing if not properly managed (Sadovy, 1997; Sala et al., 2001). Numerous historical FSAs in the Caribbean and the Bahamas have been reported (Smith, 1972; Eklund et al., 2000), but only a few are documented to date while many remain unprotected (Sadovy De Mitcheson et al., 2008).
During the winter and spring months (December to May) in the northern hemisphere soniferous grouper species such as the red hind (Epinephelus guttatus), Nassau (Epinephelus striatus), yellowfin (Mycteroperca venenosa), and black grouper (Mycteroperca bonaci) (Nemeth, 2005, 2012a; Schärer et al., 2014; Rowell et al., 2015) aggregate to spawn at existing FSAs in the Intra-America Seas (i.e., the Caribbean Sea, Gulf of Mexico, and the Bahamas region). Spawning time is usually associated with the lunar and diurnal cycles, but also with water temperatures and local current conditions (Nemeth, 2009). FSAs are challenging to observe and monitor because they are mostly found at remote locations near the shelf break (Claro and Lindeman, 2003; Kobara and Heyman, 2010; Kobara et al., 2013), in water depths between 30 and 80 m while spawning activities occur mostly at dusk. While many of these sites are known to fishers and represent areas of intensive harvest, not all FSA locations have been documented. As such, there may be a significant number of unreported FSAs, which, if located, could provide a better estimate of the status of certain populations of grouper species such as Nassau, Warsaw (Hyporthodus nigritus), black, red hind, goliath (Epinephelus itajara) and their critical habitats used for spawning.
Data on the FSA dynamics of these species is critical to the study and management of these stocks in several countries whose local populations might be connected through larval dispersal (Cowen et al., 2006). Such countries include the Bahamas, Belize, Cuba, Mexico, Eastern Caribbean island nations and the United States (U.S.) whether in the Gulf of Mexico or in the northeastern Caribbean Sea. Determination of the timing, duration and intensity of spawning will be of direct utility for the design and evaluation of management actions, stock assessment, and effective conservation measures.
Passive acoustic monitoring (PAM) is a fisheries-independent approach that can provide in situ observations of soniferous fishes, such as groupers (Mann et al., 2010; Rowell et al., 2011, 2015; Schärer et al., 2012a, b, 2014; Wall et al., 2014, 2017). Additionally, PAM can be relatively non-intrusive and provides data on timing and duration of grouper activity and distribution. In particular, PAM can be used to monitor courtship associated sounds (CASs) at FSA sites to assess grouper reproductive behaviors. As grouper populations begin to recover from overfishing, new or previously extirpated aggregations may reform, also making this technology particularly relevant for surveying and evaluating the recovery of groupers and critical for understanding their biology and ecology. To date, fisheries monitoring efforts using PAMs have primarily used an Eulerian approach; recordings are made from fixed stations at known FSAs (Rowell et al., 2012). However, these FSAs are spatially dynamic and can shift outside the range of fixed stations in a relatively short period. As such, more mobile approaches with PAMs are required to best encapsulate FSA dynamics. For example, the use of autonomous platforms such as buoyancy-driven gliders or wave-gliders that are equipped with PAM systems can be programed more accurately to encompass FSA spatial extents as well as scout regions of the shelf edge in the exploration of unknown FSAs. Wall et al. (2014) used a Slocum glider, a buoyancy driven autonomous underwater glider (AUG), to conduct a large-scale spatial mapping across the West Florida shelf of red grouper (E. Morio) sound production. A similar survey was conducted with the same technology along the southeast U.S. (Wall et al., 2017). This survey was conducted during winter when fishery-independent survey data were lacking from traditional ship-based approaches (due to prolonged periods of inclement weather) and covered the winter-spawning dynamics of multiple managed species.
The Slocum glider surveys were conducted with low power acoustic recorders (DSG – Loggerhead Instruments1), which are self-contained acquisition-only devices that are not integrated to their host, and do not allow for onboard processing and analysis. Therefore, AUG surveys are not capable of characterizing FSAs in real-time, nor can they provide information such as the species composition of FSA aggregates, precise location and timing, population size and the fish behavior or distance from the glider. But automated data collection means that surveys can take place at times and in places where it would be too expensive or dangerous to send human observers (Marques et al., 2013). These early attempts to survey fish sound production from spawning aggregations as a new technique for stock assessment led us to conceive a real-time detection and classification PAM system that can be integrated on any glider. Our glider of choice was the SV3 wave glider (WG) because of its continuous real-time transmission and positioning capabilities, which are crucial to the localization of FSAs that are typically transient events.
The main objective of this paper is to present a new persistent robotic approach to conduct PAM surveys and its application to the study of grouper FSA dynamics. The robotic platform was deployed in the U.S. Caribbean near known FSAs and was used to explore the shelf edge up to 20 km away surrounding these known sites. Its findings reveal the presence of CAS of the same aggregating species both scattered and aggregated at other locations along the shelf break. In Section “The Persistent Robotic Approach” we describe the autonomous platform and the PAM system. In Section “Fish Sound and Detectability” we present the acoustic characteristics of CAS and a red hind CAS detection threshold analysis. The fish sounds detection and classification algorithms are described in Section “Grouper Calls Detections Algorithms.” Results and interpretation of the wave glider survey in the U.S. Virgin Islands are presented in Section “Red Hind Spawning Aggregation Dynamics.” Results from the Wave Glider survey are presented in Section “Wave Glider Survey During the Red Hind Peak Calling Week.” A discussion follows in Section “Discussion” and conclusions are drawn in Section “Conclusion.”
The Persistent Robotic Approach
Marine Autonomous Systems
Underwater autonomous systems, including subsea gliders and AUVs, are revolutionizing our ability to map and monitor the marine environment (Yoerger et al., 1998, 2007; Rudnick et al., 2004; German et al., 2008; Caress et al., 2008). Such autonomous systems, although deployed from a research vessel, are not tethered to the vessel and operate without direct human control while collecting data (Yoerger et al., 1998, 2007; Griffiths, 2003). Therefore, they enable data acquisition in parts of the ocean such as beneath ice sheets in polar regions previously inaccessible to vessel-based sampling methods (Bellingham et al., 2000; Brierley et al., 2002; Nicholls et al., 2006; Wadhams et al., 2006; Dowdeswell et al., 2008; Jenkins et al., 2010; Graham et al., 2013), and are improving spatial and temporal resolution of undersea measurements (Niewiadomska et al., 2008; Caldeira et al., 2014). They also provide transformative opportunities to fisheries scientists and oceanographers to study marine population and ecosystem dynamics (Fernandes et al., 2003; Ohman et al., 2013).
Autonomous underwater gliders, such as the Spray glider (Rudnick et al., 2004), the Slocum gliders (Teledyne Webb Research) and the Seaglider (Eriksen et al., 2001) are all capable of sampling continuously throughout the water column as deep as 6,000-m depth for the latter by adjusting their buoyancy and attitude to glide on wings (Rudnick et al., 2004). Slocum and Spray gliders can also be configured to operate in shallow shelf environments (<200 m). Their deployments can last over 1 month and their range can expand over 100 km, with periodic surfacing for data offload and GPS positioning. In recent years AUGs have been used in ocean soundscape mapping (Matsumoto et al., 2011; Bingham et al., 2012; Wall et al., 2012; Baumgartner et al., 2013) and more recently in fisheries independent surveys (Wall et al., 2014, 2017) on the shelf of the continental U.S. AUGs surveys are less contingent upon large amount of funding being available for ship and personnel time and therefore have the potential to provide long time series at a relatively lower cost. Data collected through passive acoustic surveys are used to assess the presence of soniferous fish with the ultimate goal of assessing biomass and supporting stock assessment activities, while studying the ecological importance of many important commercial species in the U.S.
Autonomous surface vehicles (ASVs) such as Wave-Gliders (WG) have the advantage of continuous GPS positioning, data access and extraction over AUGs. Therefore, WG equipped with PAM systems can be programed more accurately to encompass FSA spatial extents as well as scout regions of the shelf edge in the exploration of unknown FSAs. The SV3 WG is a self-propelled, unmanned persistent mobile data-gathering platform that harvests both solar and wave energy for propulsion and power (Figure 1). It can be used as station keeping or mobile data collection platform for up to 12 months powered by the sun only. It provides a real-time communication gateway and has the modularity and capacity to accommodate new prototype sensors and software interfaces that can eventually be integrated and operated with other systems (Manley et al., 2009; Willcox et al., 2009). The WG consists of a surface float tethered with an umbilical cable to a submersible glider (Figure 1). The surface float houses the command and control unit, which is used for communications, navigation, and powering of the WG systems, and a user-specified modular payload unit. The submersible glider has a series of paired wings that generate gliding lift, a rudder to provide steering and a thruster for emergency maneuvers and adverse current. The WG harnesses wave energy for propulsion. The heave of the wave forces the submersible forward ahead of the float, which is then pulled forward over the submersible, and so on. A lithium ion battery pack in the WG hold, charged by solar panels on the deck of the surface float, supplies power to systems inside the WG’s command and control unit and modular payload unit. During mission, control system and sensor data are sent through a Web-based interface, called WGMS from the WG to the pilot and commands back from the pilot to the WG. It also provides a precise and intelligent navigation web interface. Cellular network or Iridium satellite provides two-way transmission and real-time navigational, operational, and sensor control as well as real- or near-real-time data reporting (Greene et al., 2014). Our submersible glider is connected to a custom-built two-body designed to carry a variety of off-the-shelf acoustic systems. The neutrally buoyant tow-body trails directly behind the submersible glider to which it is connected with a sinusoidal-shaped tow cable, 4 to 10-m below the ocean surface. Slack-tensioning elements, which cause the sinusoidal shape, significantly reduce pitch, roll, and yaw of the tow body in comparison to a conventional tow cable (Figure 1). Greene et al. (2014) thus used, instead of manned vessels, WGs equipped with multifrequency, split-beam acoustic sonar to conduct fisheries surveys and we used in this study a similar strategy to conduct fishery independent surveys of FSAs in the United States Caribbean islands.
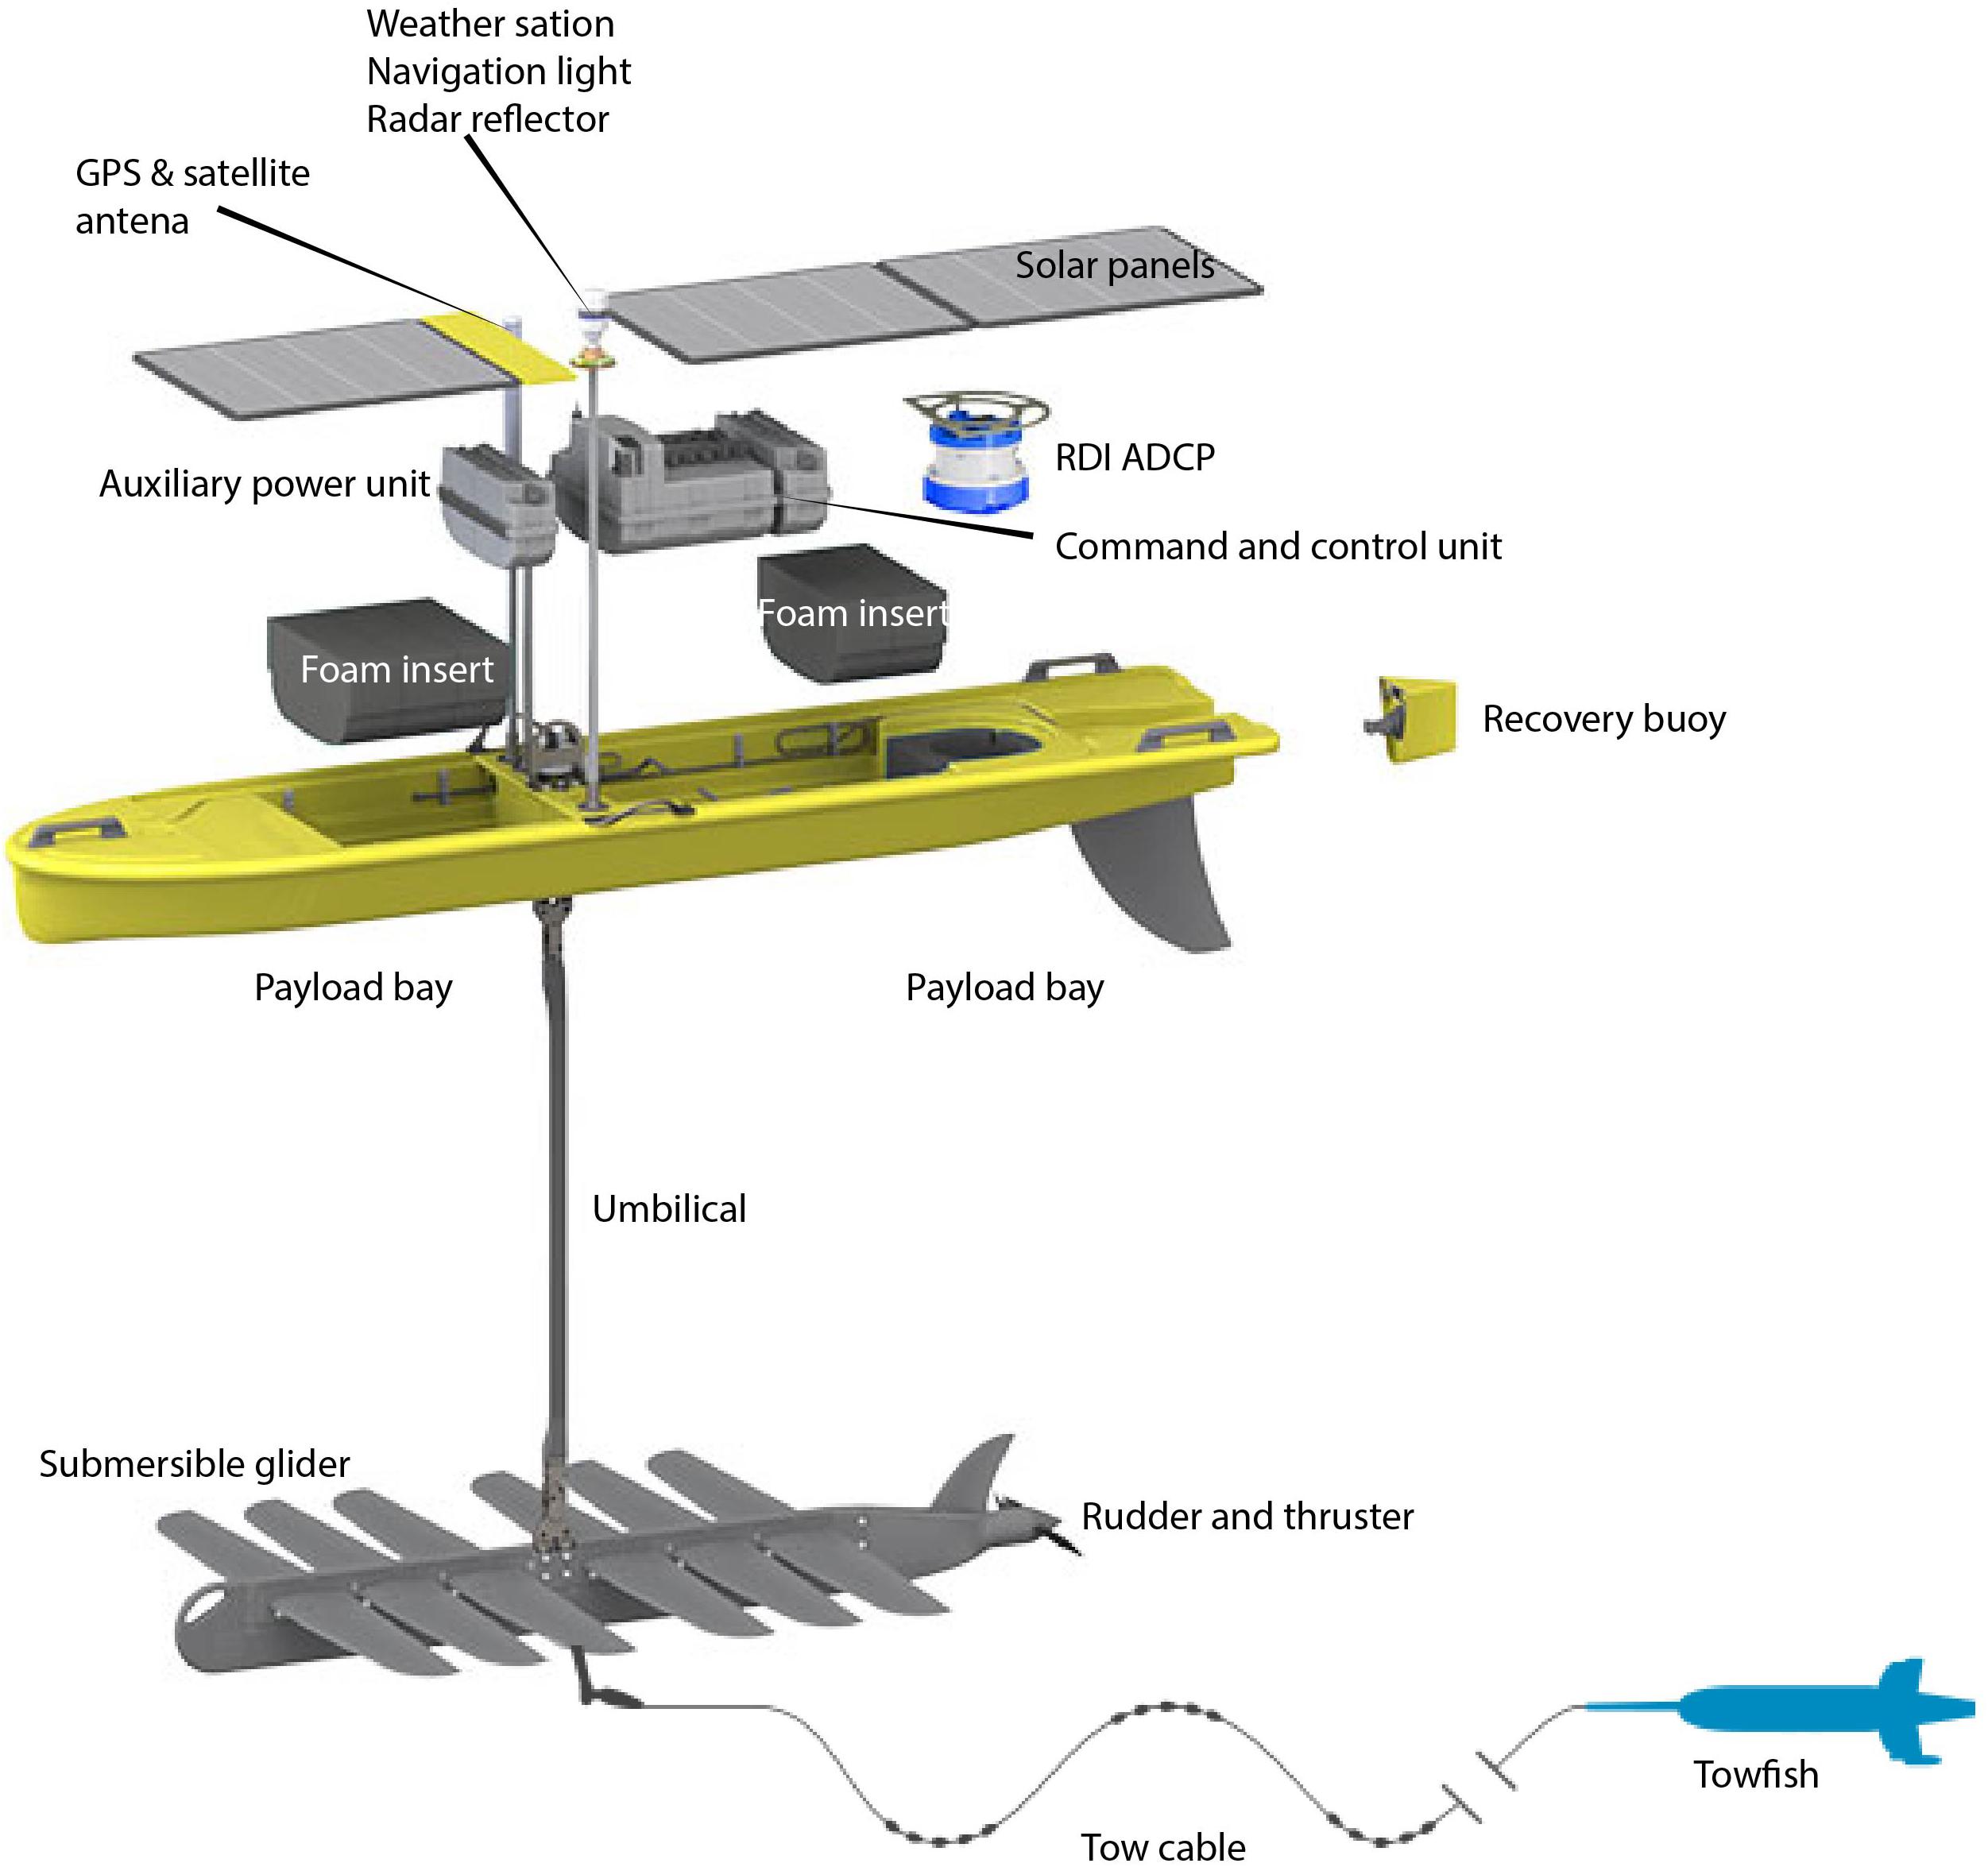
Figure 1. Blow-out showing the components of the Liquid Robotics SV3 wave glider. Image courtesy of Liquid Robotics, Inc., a Boeing company.
SV3 Wave Glider Instrumentation
SV3-WG Instruments and Payload
The WG operating system collects navigational and environmental data that are directly available to the operator in real-time. As such, a water velocity sensor informs the operator of the surface current speed and direction. The wind speed and direction are also recorded by the wave glider. In addition, our SV3-WG is equipped with a 600 kHz Workhorse ADCP, which measures current profiles down to 50-m in real-time. The data is readily available through WGMS.
Passive Acoustic Monitoring System
The PAM system consists of two distinct sub systems: one located on the tow-body below the sea surface and the other, located in the surface float section of the SV3-WG. In particular, the sub-surface section of the system hosts two ultra-low frequency hydrophones (HTI-96-Min Hydrophones) and an embedded data processing module optimized in design for such application. The hydrophone frequency response is 2 Hz to 30 kHz with a sensitivity of −201 dB re: 1 V/μPa without pre-amp. The system is connected to the host vehicle through the tow-body electrical tow cable. The hydrophone housing is a tubular, oil-filled sealed enclosure that can accommodate up to three hydrophones (Figure 2), rated for 100 m depth. The forward side of the tube ends with a fairing that mitigates unnecessary, disruptive noise caused by flow around the tow cable, eddies induced by edges on the tow-body, or any other features that would cause low frequency acoustic vibrations due to turbulent flow. The tube is made of clear polyvinyl chloride (PVC) material, making the housing acoustically transparent. It is oil-filled to couple the hydrophones to the vibrations at wall of the tube. The hydrophone housing is rigidly fixed to the tow-body using internal bolts and a machined plastic spacer. Located inside of the hydrophone housing, is a data acquisition card that contains a high-speed digital-analog converter (ADC), band-pass filter and embedded processor used to continuously collect and buffer data, which is then streamed for signal detection and classification.
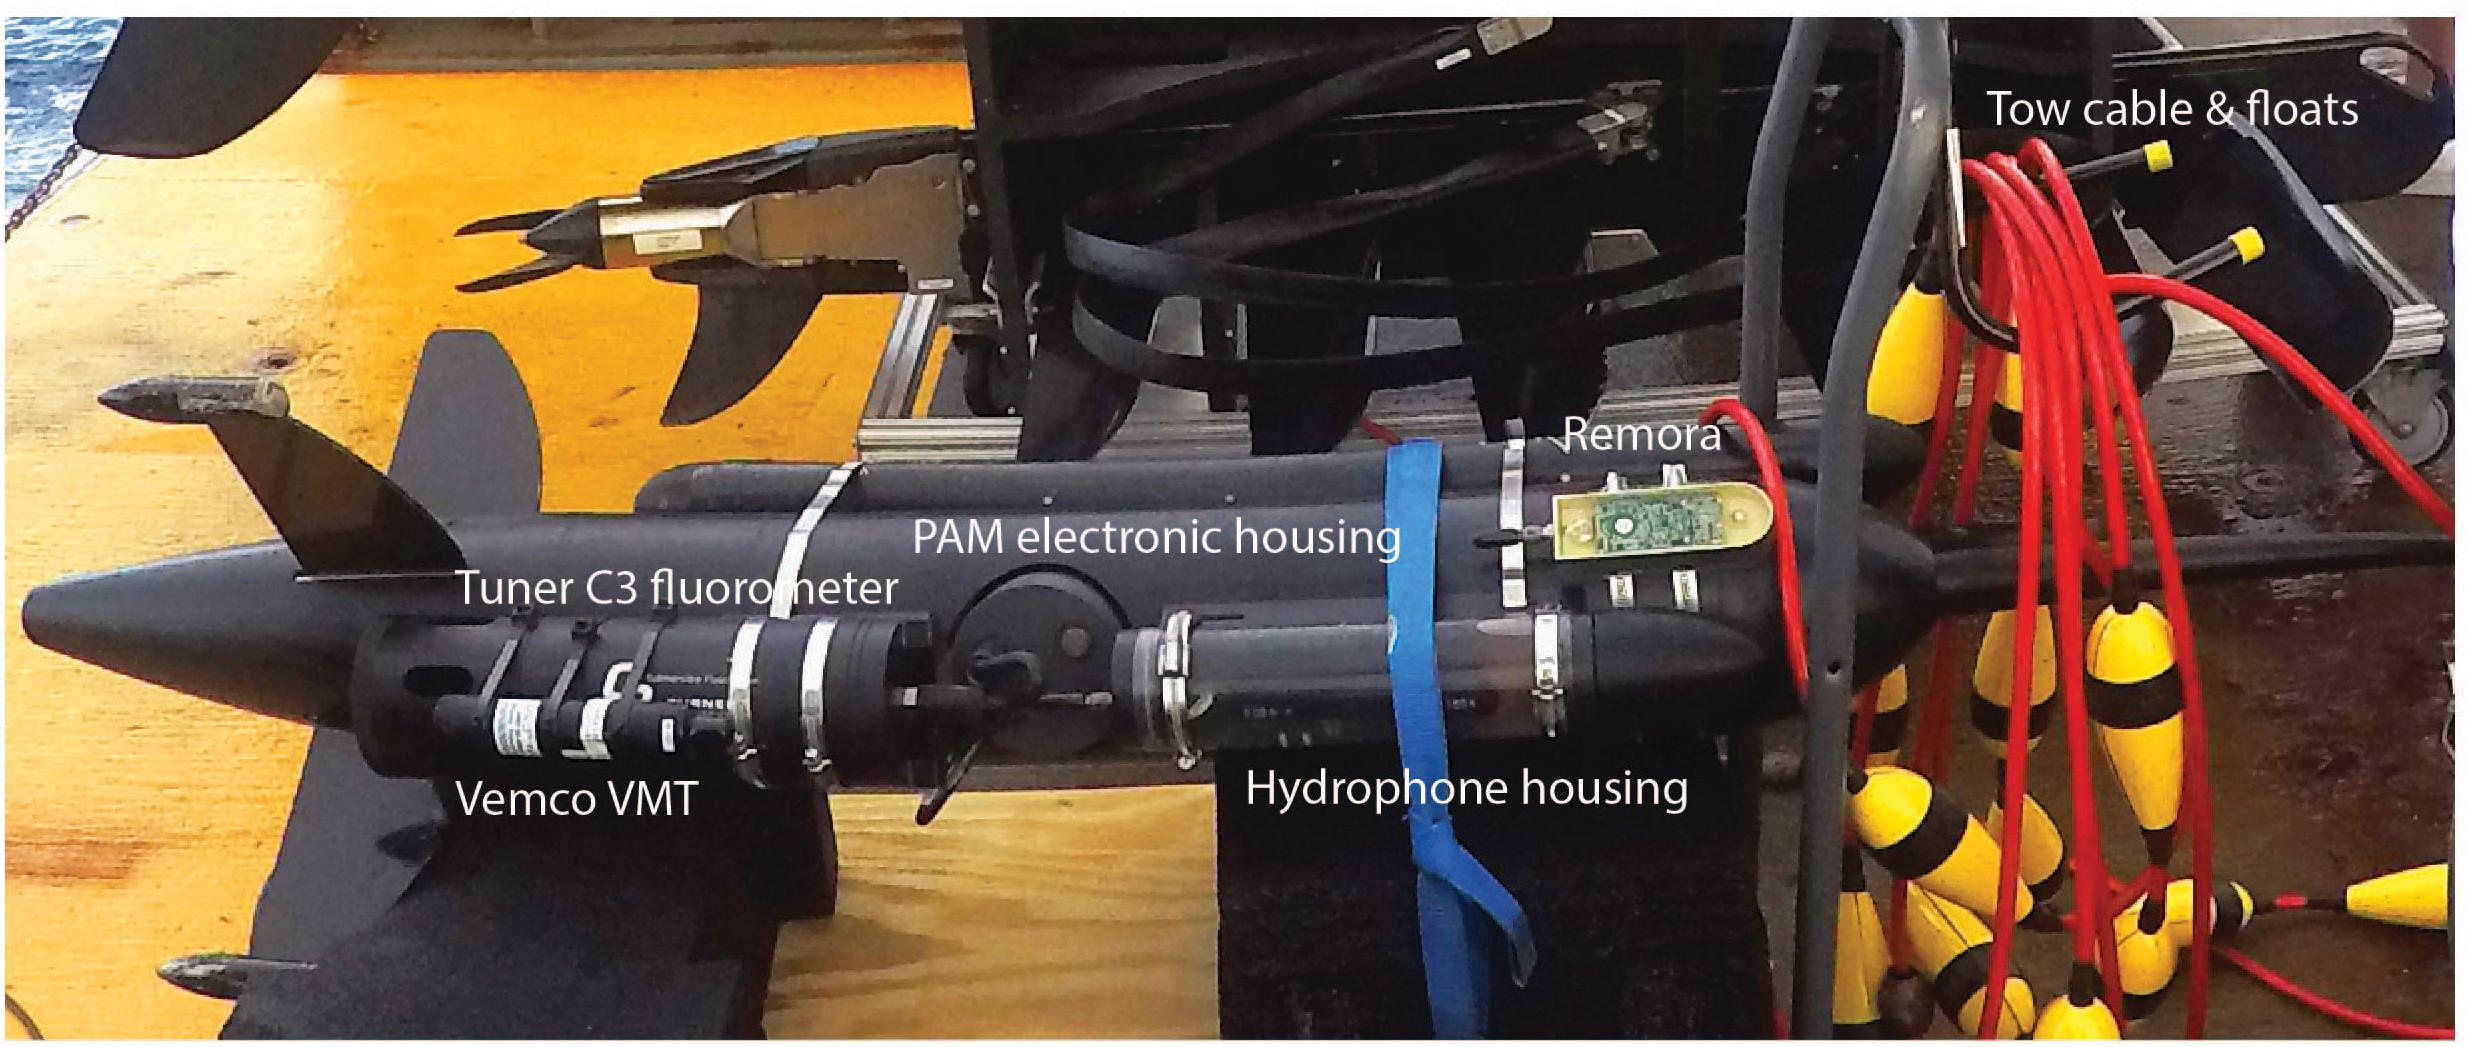
Figure 2. Components and payload of the wave glider’s tow-body.
The PAM electronic housing, which is located inside the tow-body holds the main processing computer that runs the detection and classification algorithm. The electronic package consists of an off-the-shelf Texas Instrument Beaglebone Black single board computer (SBC). The SBC connects to a stack of breakout daughter boards. The PAM’s BeagleBone Black computer runs on Debian, an open-source variation of the Linux operating system maintained by the Debian Project. The software architecture employs the publisher-subscriber model in order to push data to multiple applications at the same time. Seven “port” modules publish data acquired from various sources (sensors, devices, algorithms). Consumer modules subscribe to receive only the data they need and at the rate at which it becomes available. The open-source Lightweight Communication and Marshalling (LCM) middleware library uses the User Datagram Protocol (UDP) to provide the needed publish-subscribe mechanisms.
Seven port modules interact with the payload or other data sources. Five of these ports are respectively connected to (1) a SIMRAD NSS7 Evo2 echosounder with structurescan sonar and with frequency modulation (CHIRP) sonarhub. Sonar screen movies are recorded for sound detection validation. The sonarhub is mounted on the aft of the WG. (2) An onboard AST4000 pressure sensor. (3) A Turner C3 Fluorometer, which measures CDOM, Chlorophyll-a, and backscattering fluorescence (Figure 2). (4) Hydrophones. (5) A fish sounds detection and classification algorithm. The PAM records 10 s audio files every 30 s. This cycle allows enough time for data buffering and processing by the machine learning algorithm while optimizing data storage. The duty cycle can be modified to meet the mission requirements. Each audio file is analyzed by the detection algorithm and if there is a detection, a 3 s snippet that contains the sound detected is produced by the software. However, only one hydrophone channel is currently used for the detection analysis and the data is written in ASCII. The data is stored locally on the PAM on a microSD card and then copied to the vehicle payload computer for real-time access and transmission via GSM network or satellite (RUDICS). Finally, a self-powered, self-logging EXO1 YSI multiparameter sonde is attached to the tow-body and collects, pressure, pH, temperature, salinity, and dissolved oxygen (DO). Other sensors such as external Remora hydrophone from Loggerhead Instruments, or VEMCO VMT receiver/transmitter for underwater acoustic telemetry have also been used on the tow-body (Figure 2).
Fish Sound and Detectability
Grouper Courtship Associated Sounds
For many species of fish, including Epinephelidae, sound plays a critical role in reproduction and therefore the survival and success of the species (Mann and Lobel, 1995; Bass and Mckibben, 2003; Luczkovich et al., 2008; Walters et al., 2009; Mann et al., 2010; Montie et al., 2016, 2017). Effective communication requires both species and mate recognition for reproduction (Myrberg and Lugli, 2006; Amorim et al., 2015). In known sound-producing groupers, acoustic signals are used by different taxa for recognition, attracting mates, defending territories, agonism and as an alarm system against predators (Mann et al., 2010; Schärer et al., 2012a, b, 2013, 2014; Rowell et al., 2018). The different call types of a species may consist of multiple different sounds or sections produced in series to create a species-specific acoustic call structure (Zayas, 2019). Grouper species that co-occur at FSA sites in the U.S. Caribbean (Nemeth et al., 2006; Heyman and Kjerfve, 2008) and have documented CAS are described in Table 1. CAS are consistent with reproductive behaviors and can provide an estimation of relative reproductive behavior activity and relative abundance through the spawning period (Rowell et al., 2012). Therefore, PAMs can be used to locate spawning aggregations (Luczkovich et al., 1999, 2008; Walters et al., 2009; Rowell et al., 2011) and determine temporal patterns in reproductive behavior and habitat use by different species during FSAs (Locascio and Mann, 2008; Mann et al., 2009, 2010; Nelson et al., 2011; Schärer et al., 2012a, b).
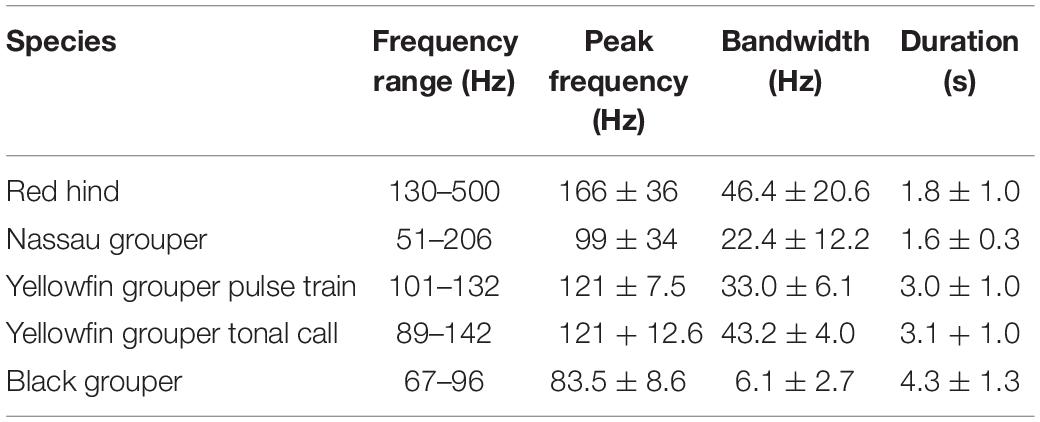
Table 1. Grouper sound characteristics from the published literature.
The species-specific sounds produced by grouper during reproductive behaviors are somewhat stereotyped and can be audibly and visually (in spectrograms) distinguished from each other due to unique duration, peak frequency, call structure and tonal characteristics (Table 1). The call structure and tonal characteristics make spectrogram distinguishable as shown in Figure 3 from sounds recorded by the WG. The Nassau grouper (E. striatus) CAS consist of a combination of pulse and tonal sounds with a mean peak frequency of 99 Hz and average duration of 1.6 s (Schärer et al., 2012a) (Figure 3A). The yellowfin grouper (M. venenosa) CAS consist of two parts (one pulse train and one tonal) that are usually combined with mean peak frequency of 121 Hz and approximately 3 s duration (Figure 3B – tonal call) (Schärer et al., 2012b). The red hind (E. guttatus) produce at least two main types of CAS with mean peak frequency between 166 Hz (Mann et al., 2010) and for each type of CAS 173 and 201 Hz (Zayas, 2019). Red hind CAS usually consists of a single or variable number of pulses, with a second tonal portion mean duration between 1 and 2.4 s (Figures 3C,D). Black grouper (M. bonaci) produces a CAS consisting of two parts, one a low frequency pulse train usually combined with a modular tonal call, of mean peak frequency 83.5 Hz and a duration between 2.4 and 7.9 s (Schärer et al., 2014). The black grouper CAS was not identified in the recordings during the WG survey. Because red hind is the dominant spawning species during the time of survey, red hind CAS rate patterns during the main spawning week will be used to interpret the PAM detections and evaluate the usefulness of WG CAS surveys for monitoring reproductive activity at FSAs.
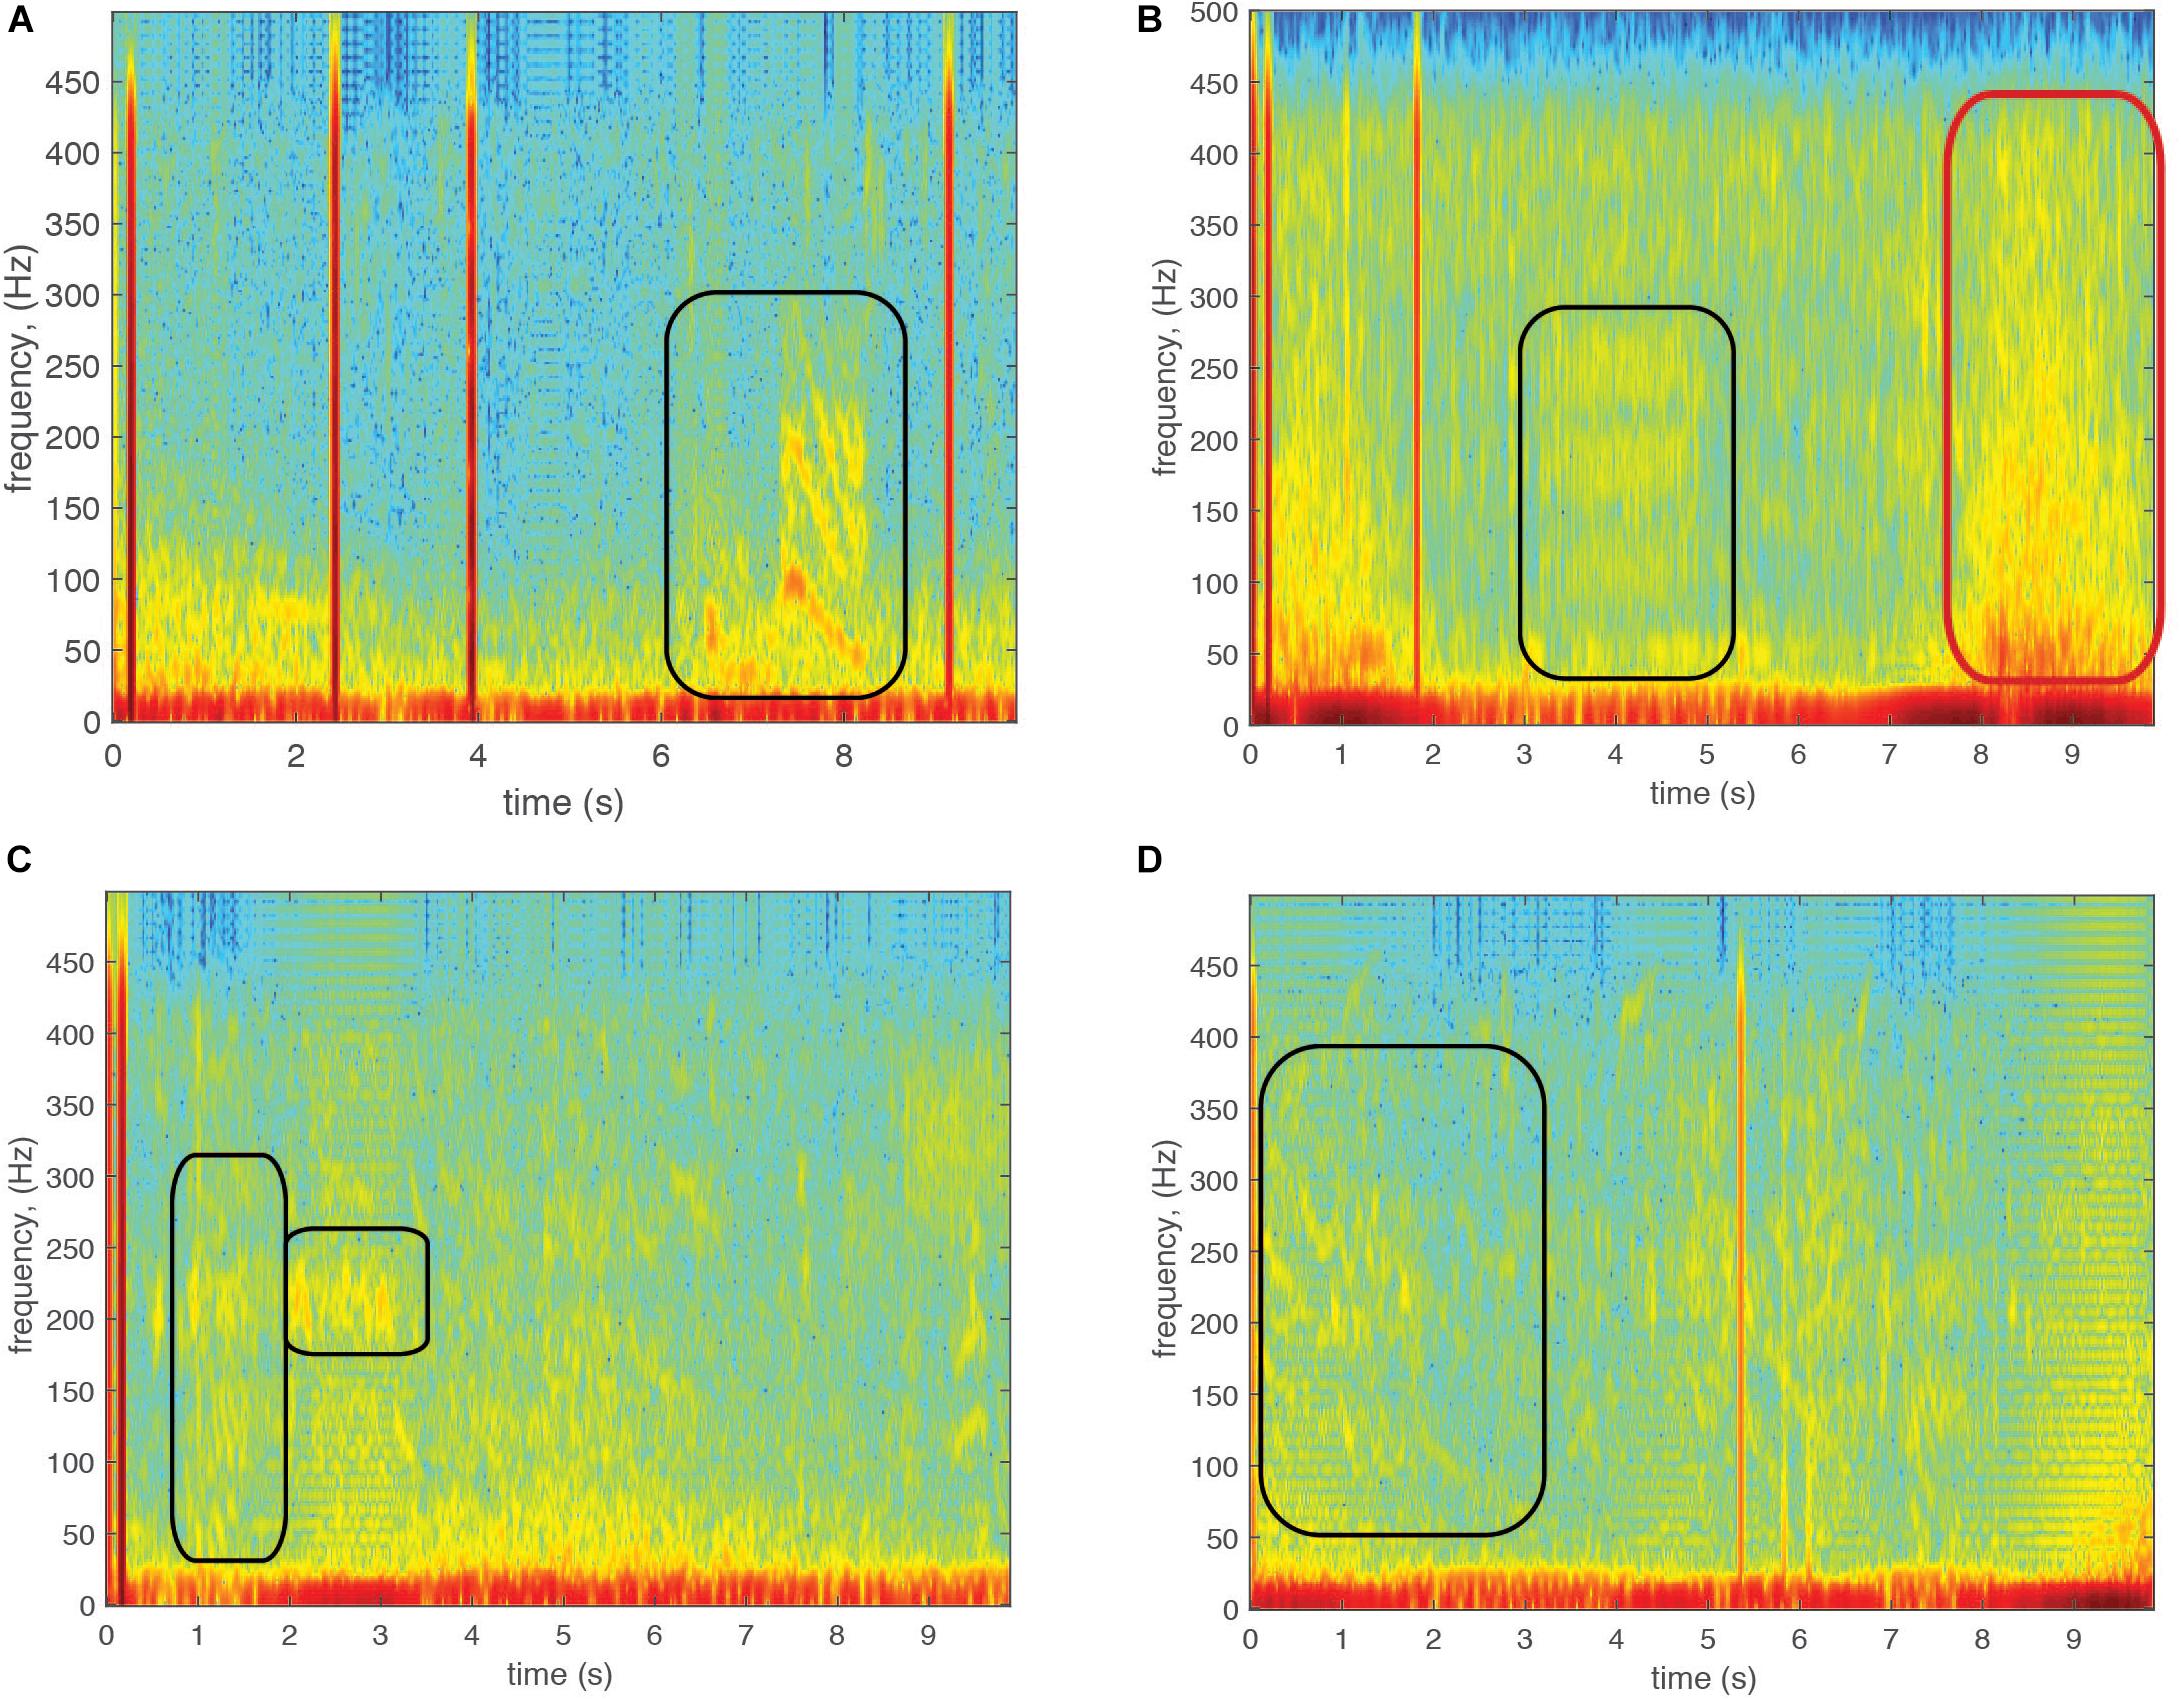
Figure 3. Fish call spectrograms recorded with the Wave Glider PAM in the Virgin Islands. (A) Nassau grouper. (B) Yellowfin grouper. (C) Red hind grouper tonal and chorus call. (D) Red hind grouper tonal call. The black rectangles identify the calls. The red rectangle shows the wave noise.
The call structures previously described and shown in Figure 3 may not reflect the full variation of acoustic repertoire for each species as has been recently discovered in the data presented in this paper as well as in the most recent literature. For example, an agonistic call type produced by Nassau grouper was identified from a spawning aggregation in Puerto-Rico by Bingham et al. (2012). For red hind the acoustic repertoire has recently been characterized by Zayas (2019) from animals held in captive conditions, increasing to five types of sounds with their associated behaviors.
PAM Detection Threshold and Grouper Sound Detectability
The average source level (SL) of the grouper species targeted in this study is between 100 and 150 dB re 1 μPa, with a mean that varies between 90 and 150 Hz and a bandwidth between 20 and 45 Hz (Mann et al., 2009; Schärer et al., 2012a, b, 2014) (Table 1). The PAM system was designed to detect sound specifically in a frequency band that encompasses all the grouper species in Table 1, and with detection threshold above the ambient noise in that frequency range. Following Brunoldi et al. (2016), we used the passive sonar equation, Eq. (1), with the intent to set a lower limit to the signal-to-noise ratio at the hydrophones in order to permit detection of grouper CAS with various ambient noise levels.
where the signal-to-noise ratio (SNR) at the receiver for a fixed range (r) is given by the difference between the source level (SL) and the sum of the transmission loss (TL) of the grouper sound and of ocean-noise (NL) within the spectral bandwidth (BW) of the source signal. For the direct detection scheme used for the work described in this paper, the SNR should exceed the detection threshold (DT), for a valid signal to be extracted from ambient noise, Eq. (2).
The sound emitted by the grouper species identified in this study has been chosen as the source signal for target detection by the acoustic system. The PAM sampling frequency is fs = 10kHz thus oversampling in the time domain to further improve SNR by signal integration. To calculate of the detection threshold (DT), we first set the detection P(D) and false alarm P(FA) probabilities of the passive sonar to be P(D) = 0.9 and P(FA) = 0.05. Then we estimated the detection index (d) from the Receiving Operating characteristic Curves (ROC) provided by Urick (1983) from which we obtained d = 9. The detection index d represents the difference between the mean values of the sum of the signal and noise, and the noise-only probability density functions (PDF). The greater the d-value, the greater the likelihood of detecting an event, here a grouper call is.
Let S be the signal power in the receiver bandwidth measured at the hydrophones. Let N be the noise power in the receiver bandwidth also measured at the hydrophones. The detection threshold is given by:
The detection index d is proportional to the signal-to-noise ratio and as shown in Brierley et al. (2002) it can be written as
where m, is the number of samples within the integration period of the signal considered, which by definition is the ratio between the sampling frequency (fs = 10kHz) and the maximum frequency of the source signal to be detected (fmax = 350Hz). From Eq. (4) we have
Therefore, the detection threshold is
The DT found with the above analysis was then verified with red hind grouper CAS recorded by the PAM system. We use a random selection of CAS utterances that were denoised before being superimposed on a simulated noise with the same frequency band as the CAS signal in order to generate a controllable SNR (Figure 4A). We varied the SNR of the input signal and used a matched filter kernel derived from a high SNR recorded CAS to build a detector based on local temporal carrier frequency and local temporal modulation frequency. The detector results were analyzed and are shown in Figure 4B for four CAS detections. Using a threshold where the false alarm P(FA) is 0.05, the data indicates detection thresholds between −6 and 2 dB, which encompasses the value previously estimated. Therefore, the DT of the PAM was set to −3 dB for grouper CAS.
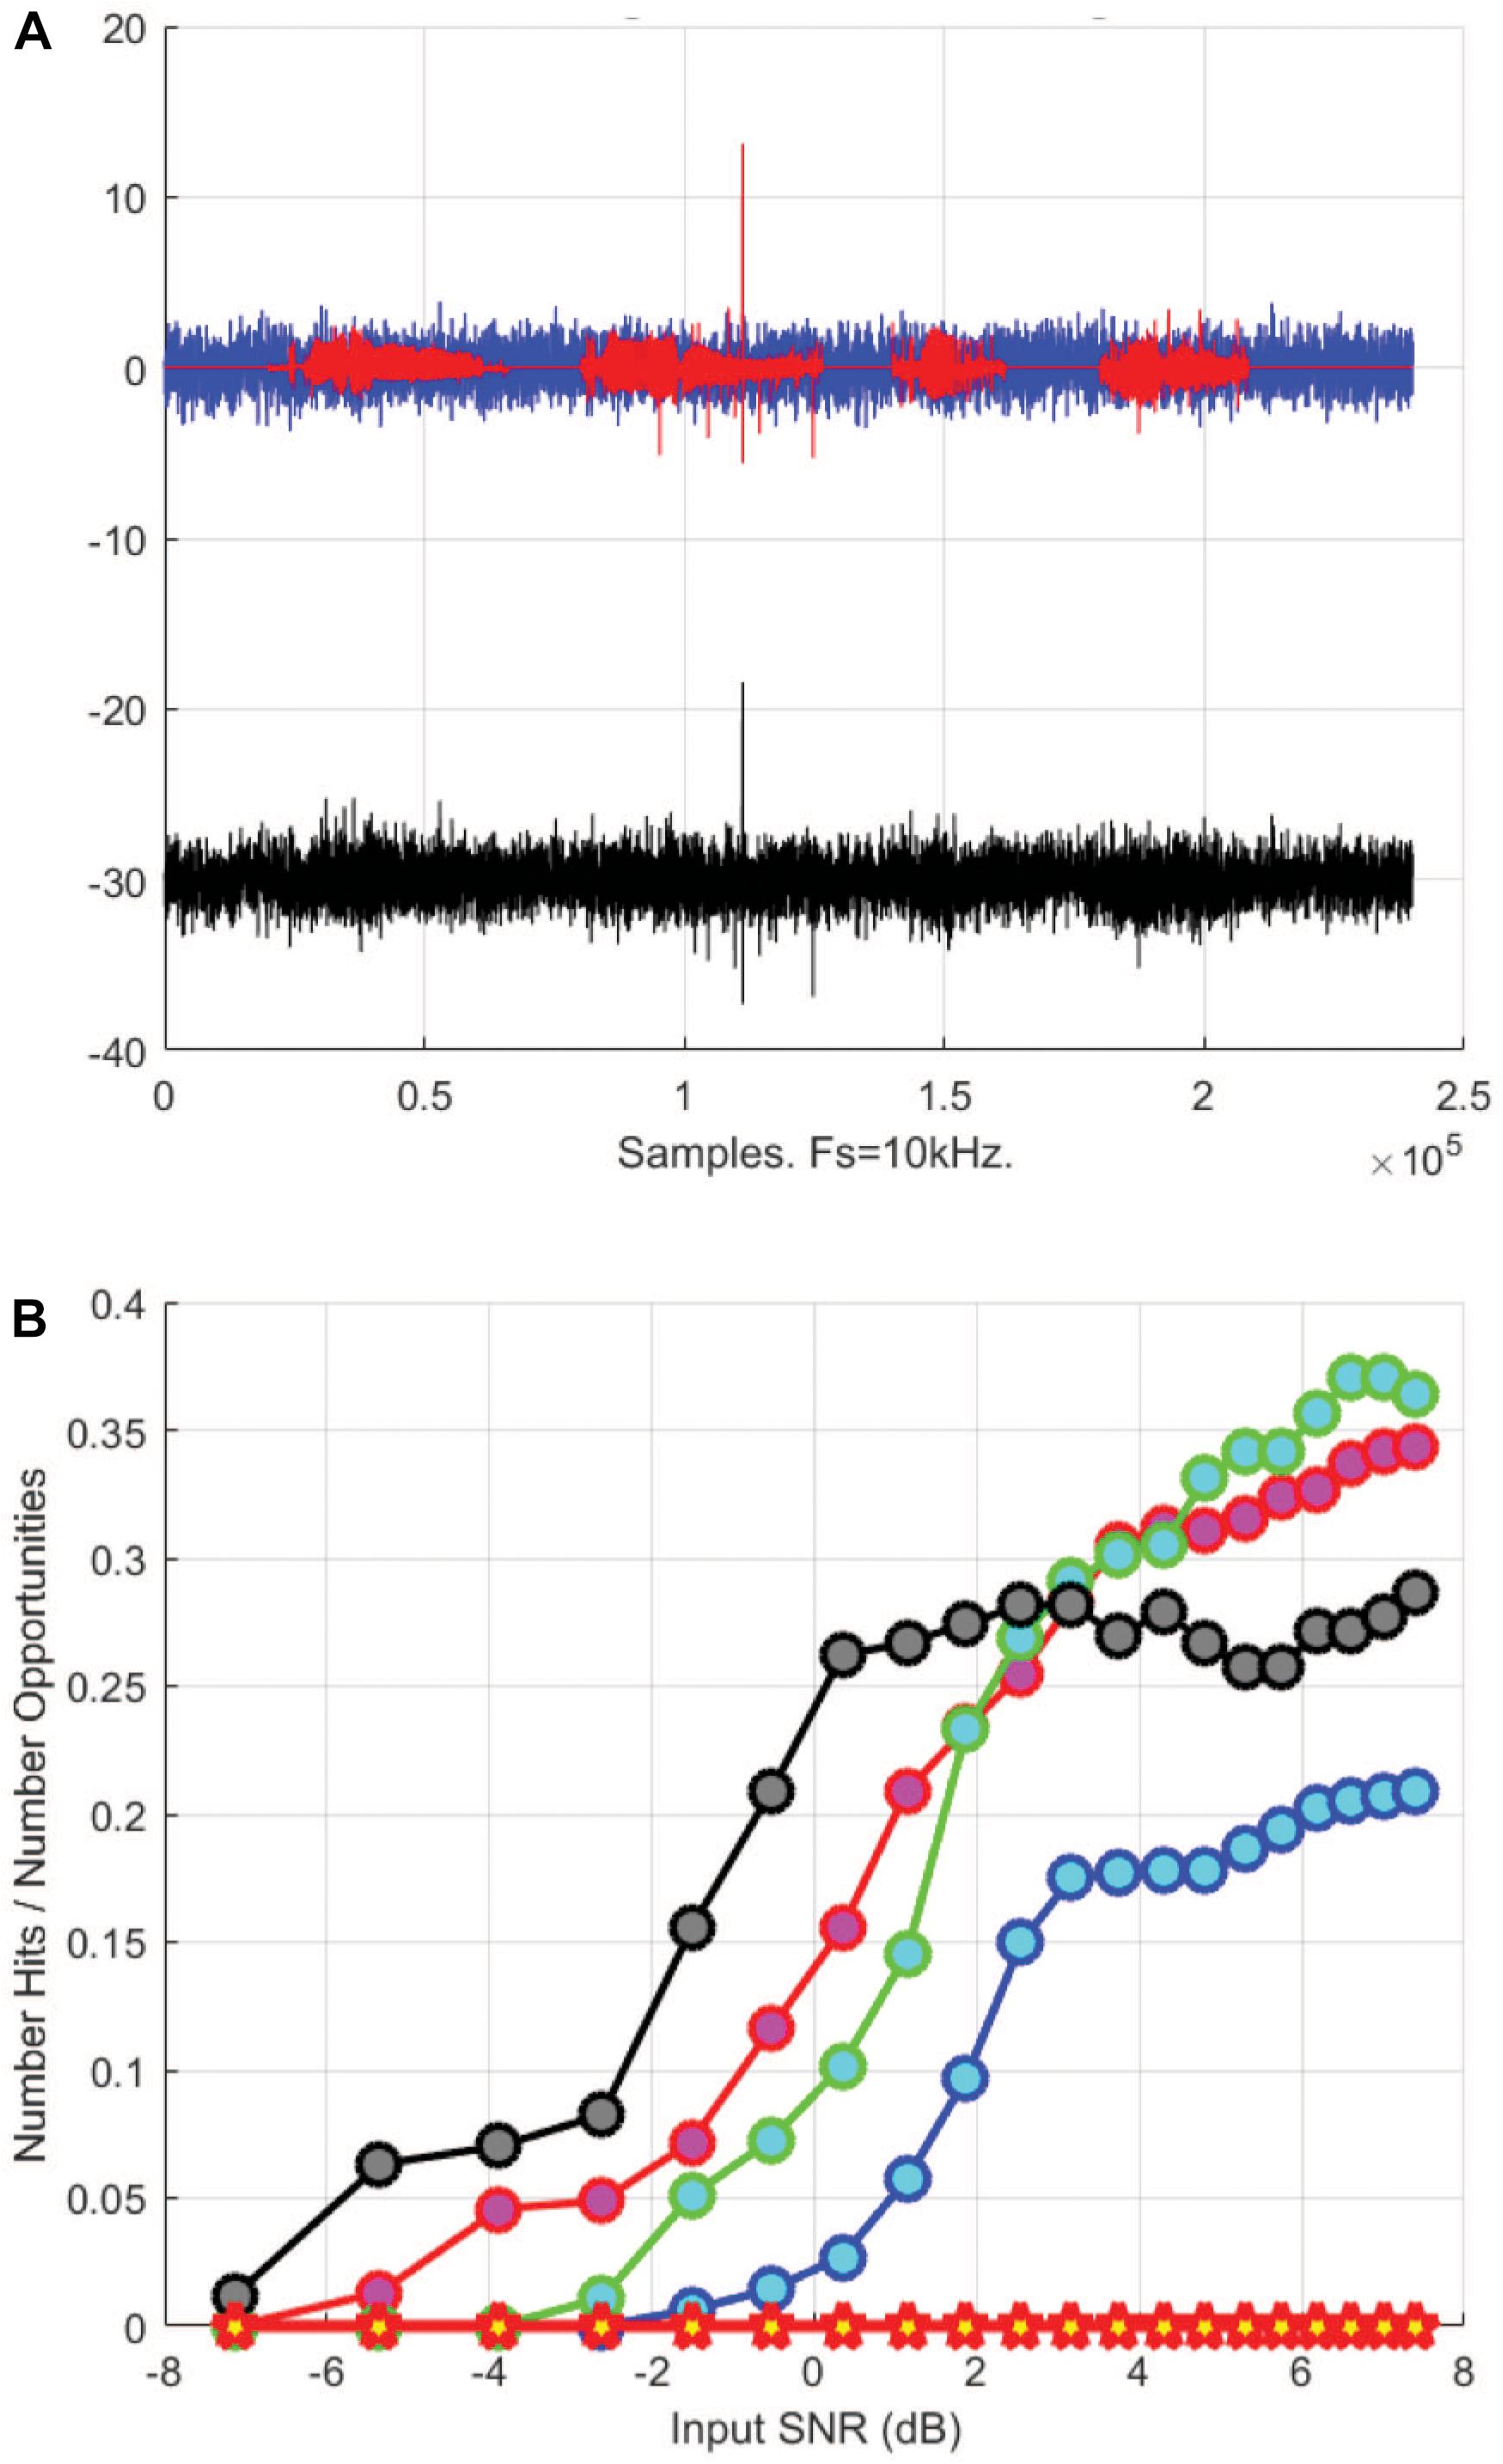
Figure 4. (A) Normalized signals of red hind grouper courtship associated sounds (CAS) received at one of the PAM hydrophones (red) overlaid on normalized noise (blue) corresponding to a signal to noise ratio of –7 dB. Black signal shows the sum of both. Fs stand for sampling frequency. (B) Detection probability (P(D) for each of the four red hind CAS signals shown in (A). Each colored line corresponds to one of the CAS signals. The red stars indicate a 0 false alarm probability (P(FA) = 0).
In order to estimate grouper sound detectability on the southern shelf of the U.S. Virgin Islands, we simulated the red-hind call sound propagation using the Personal Computer Shallow Water Acoustic Tool-Set (PC-SWAT) (Sammelmann, 2002), which is a user-friendly sonar model that simulates low frequency propagation and scattering in shallow water environment. The model was implemented with several sound velocity profiles characteristic of the region of interest in the winter months that ranged from 30 to about 80 m of water (Figure 5A) in the vicinity of the red hind known spawning aggregation site at Red Hind Bank (Figure 6). The virtual hydrophone was set to be at 10-m depth and the sources (groupers) 2-m above the bottom. The bottom was assumed to be flat and made of sand. Simulations were made for source levels ranging from 150 and 110 dB re 1 μPa. Using ocean noise budget from Miller et al. (2008), noise levels of 90, 85, and 80 dB re. 1 μPa were added and the TL for each SL with either NL was simulated. A detection threshold at both −3 and +2 dB was used to estimate the maximum range of the grouper sounds as shown in Figure 5B. The results are presented in Tables 2, 3, which show the ranges at which the prescribed DT is met as a function of NL and SL. For depths at which the groupers FSA are located, namely between 35 and 60 m, the detection range peaked mostly at 100 (1000) m for a 140 (150) dB SL with DT = −3 dB. The detections ranges were less than 100-m for SLs less than 130 dB (not shown). The detection ranges were relatively variable between SVPs although they exhibit relatively small variations between them, which suggests that detection range can vary throughout the day due to small changes in density due to surface wind cooling, diurnal cycle, depth of thermocline or tide induced upwelling and downwelling (Cherubin et al., 2011; Jossart et al., 2017).
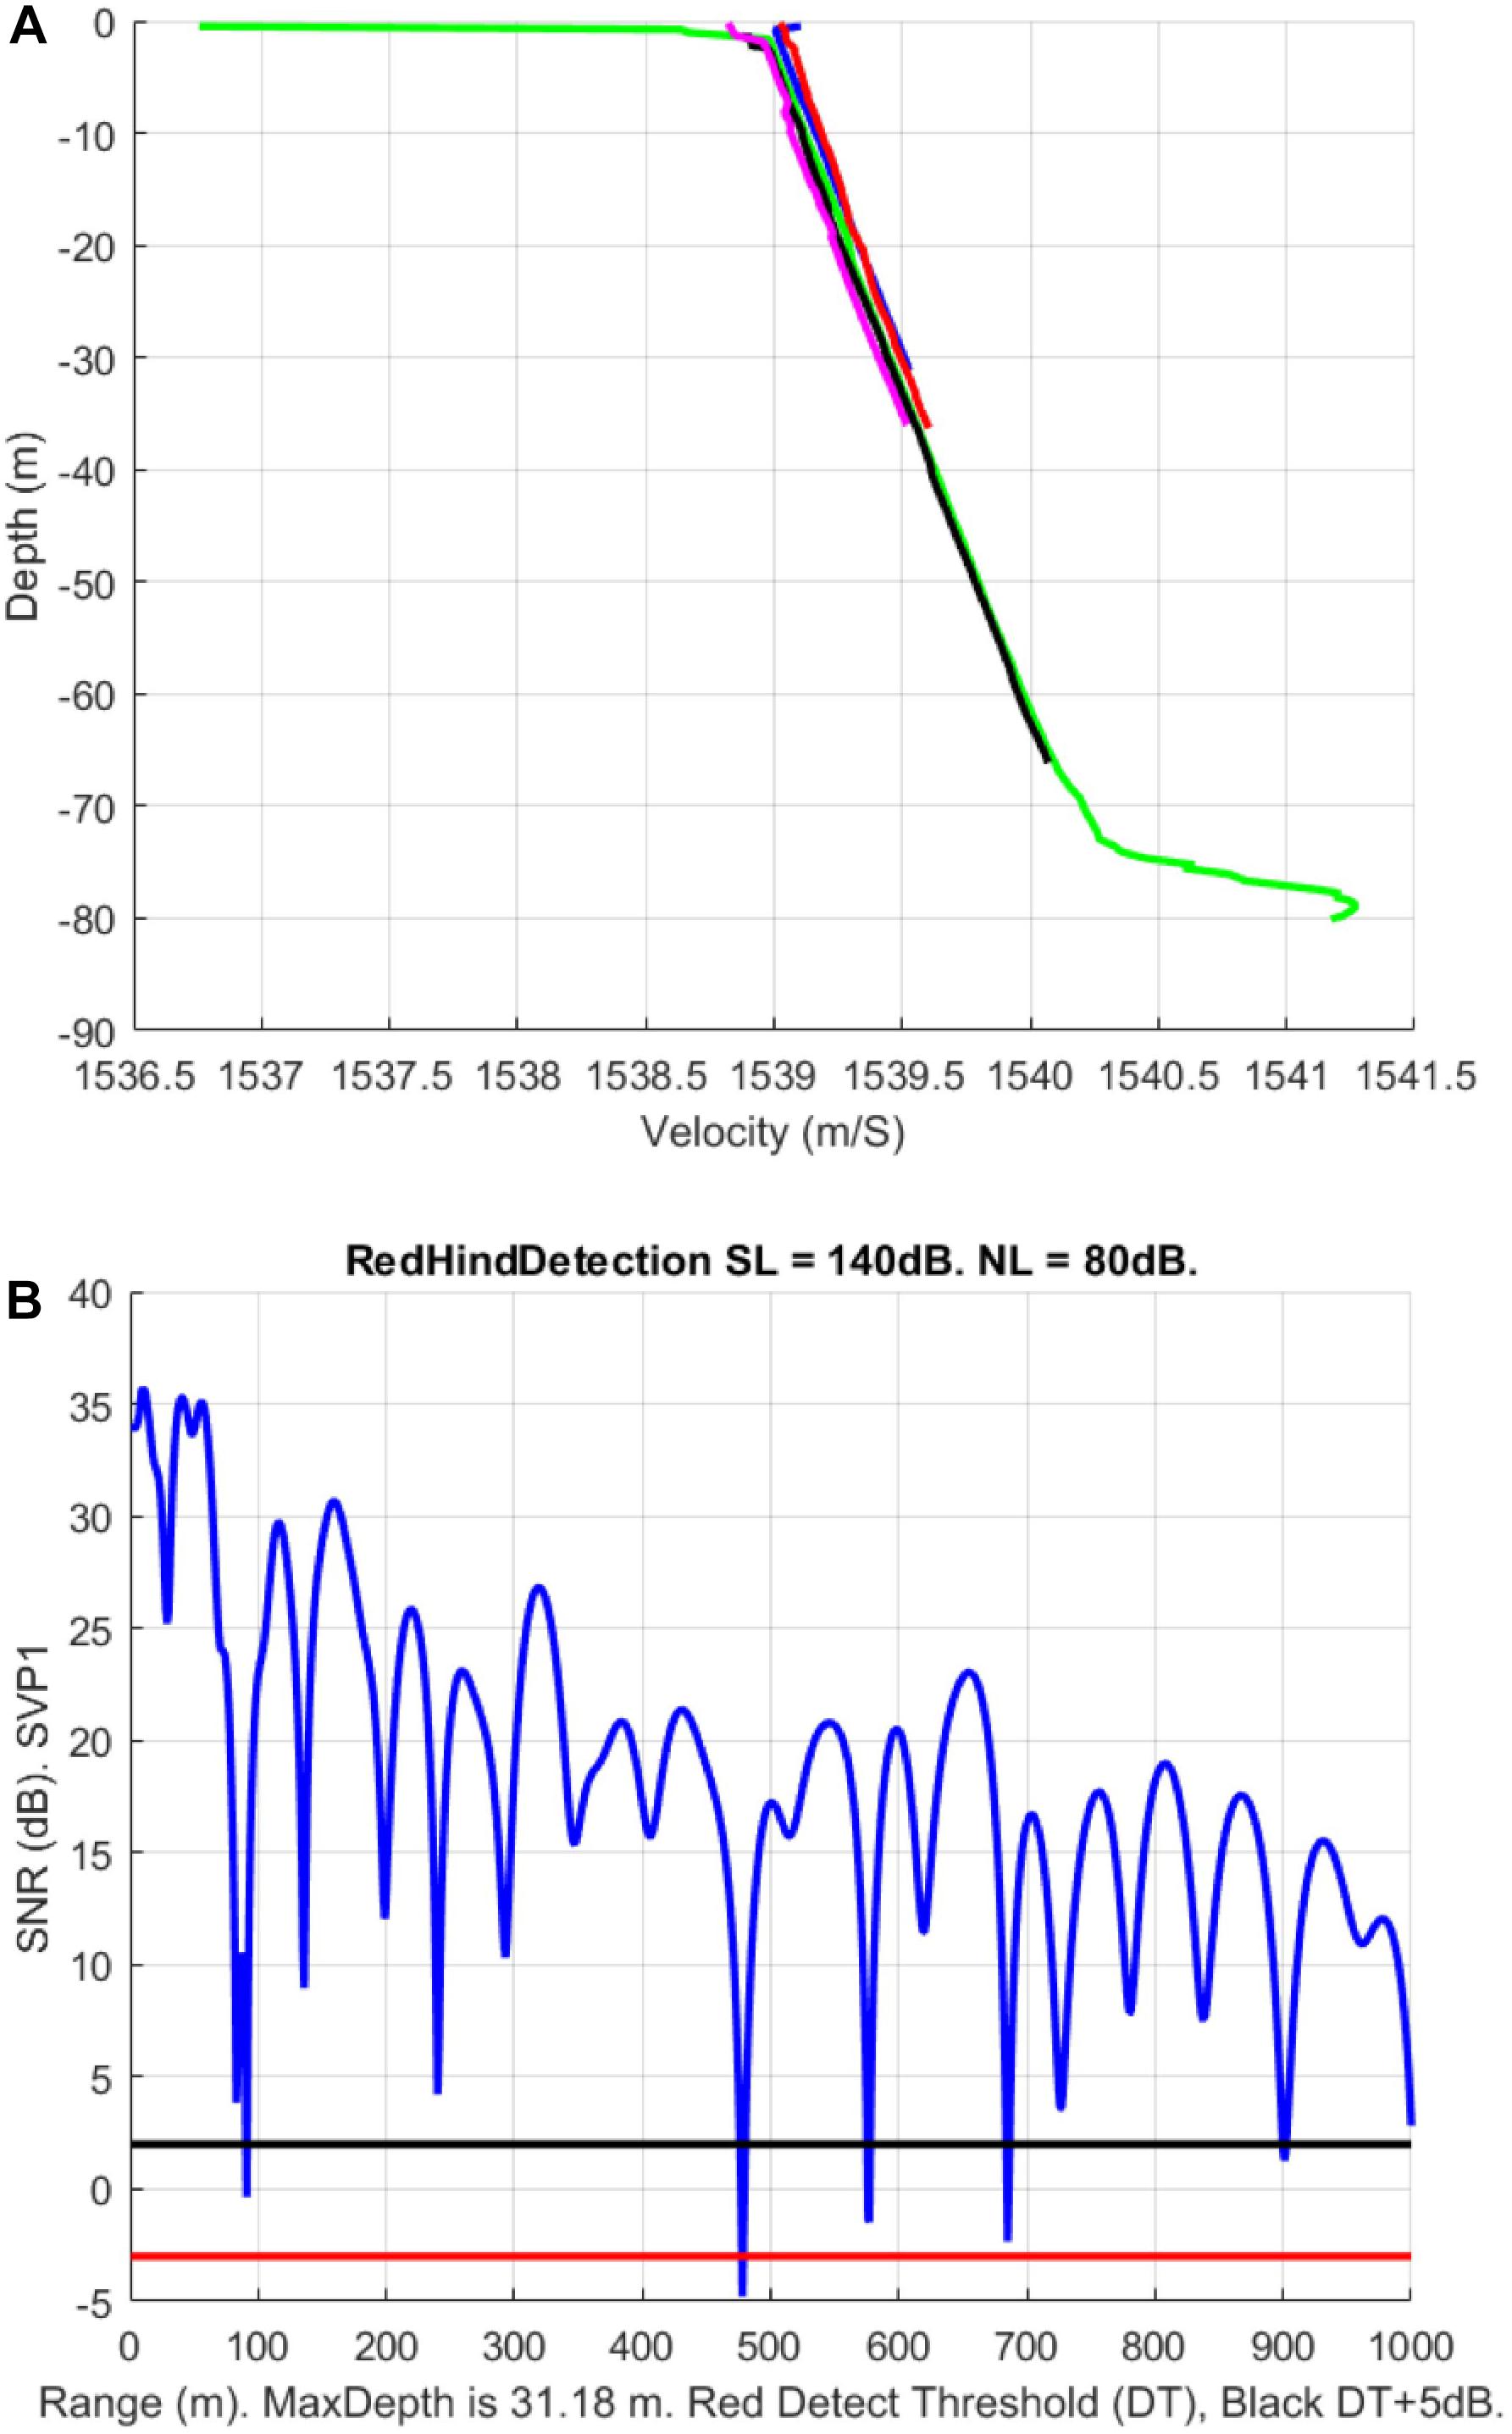
Figure 5. (A) Five sound velocity profiles (SVPs) near Red Hind Bank spawning aggregation site that were used to estimate transmission loss of red hind grouper sounds. (B) Signal to noise ratio (SNR) (dB) variation with distance (meters) from a source at 2 m above bottom. The red line shows the –3-dB detection threshold (DT) estimated for the PAM and the black line the 2-dB SNR. This 5-dB detection margin is representing variations in the false alarm rate probability.
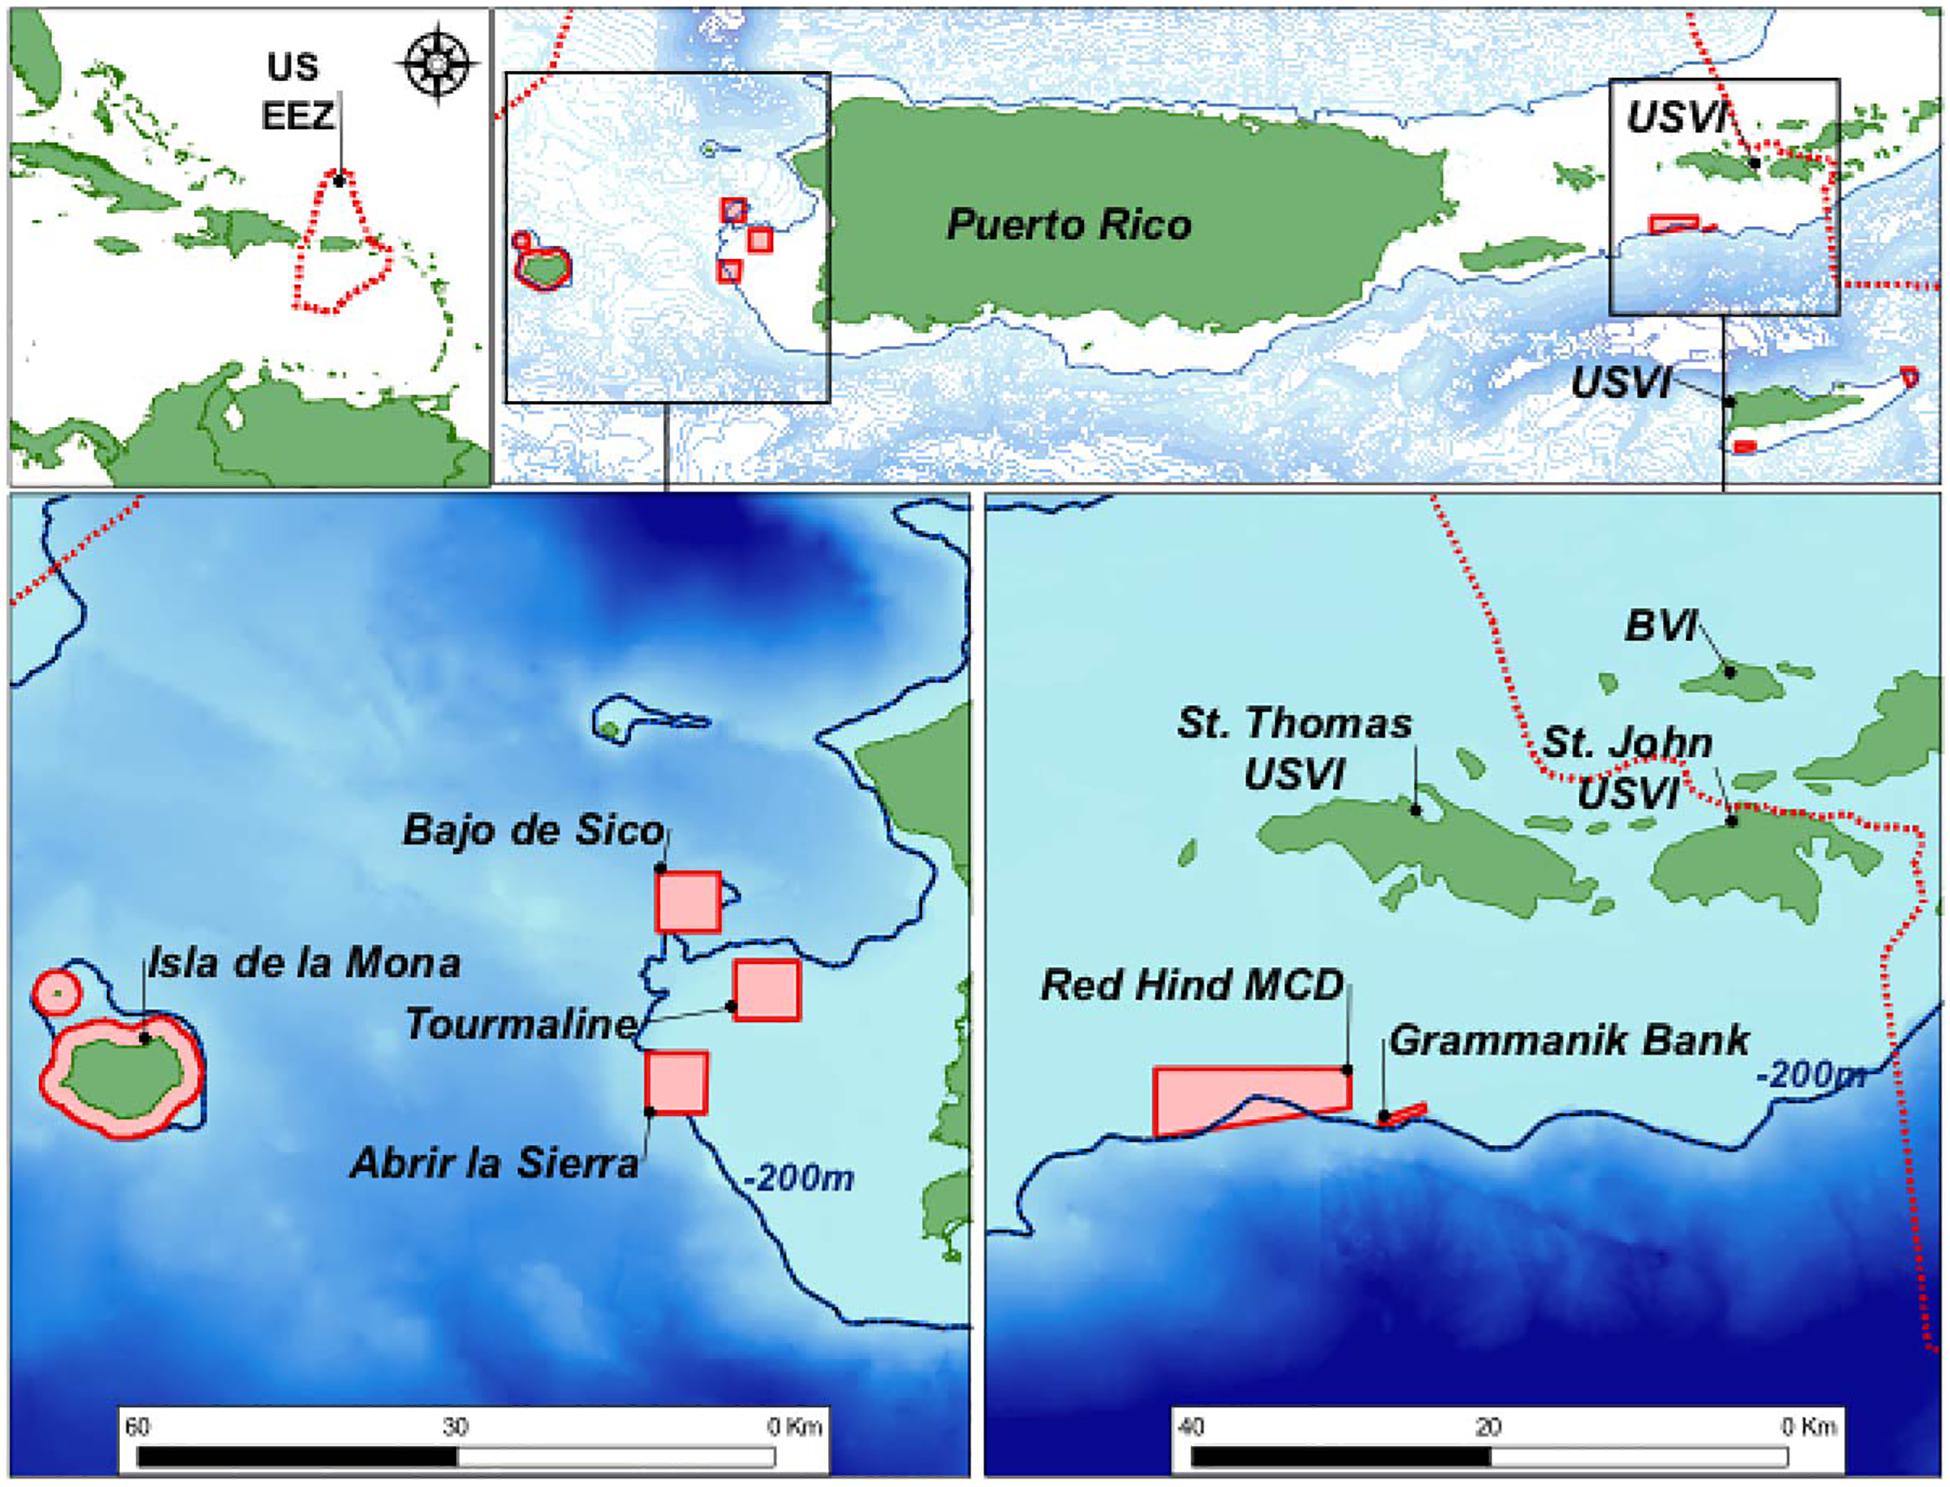
Figure 6. Fish spawning aggregation (FSA) sites on the western shelf of Puerto-Rico, including Abrir La Sierra (ALS) and on the southern shelf of St. Thomas in the U.S. Virgin Islands, namely the Red Hind Marine Conservation District (MCD) where the Red Hind Bank (RHB) is located and the Grammanik Bank (GB).
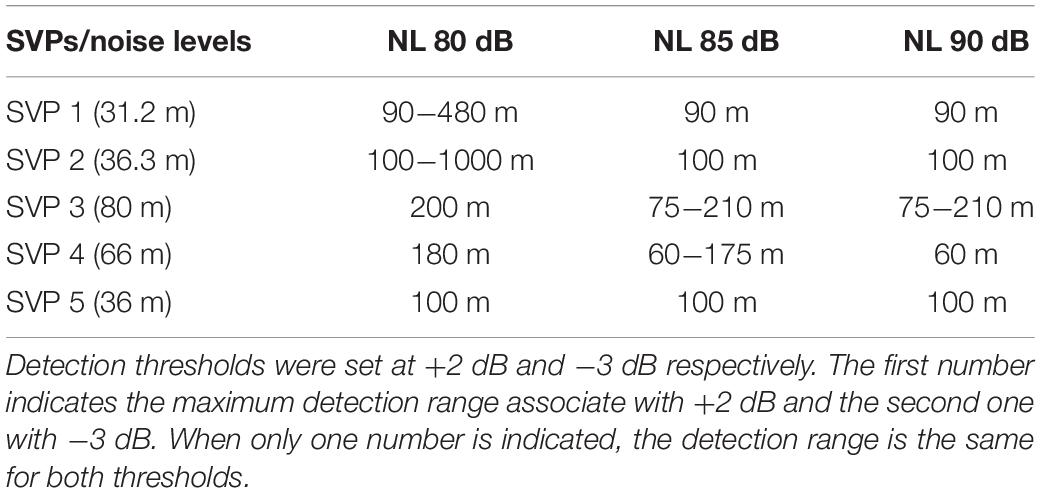
Table 2. Maximum detection ranges in meters of grouper calls simulated by the Personal Computer Shallow Water Acoustic Tool-set for a source level of 140 dB for five sound velocity profiles (SVP) measured on the southern shelf of St. Thomas, US Virgin Islands.
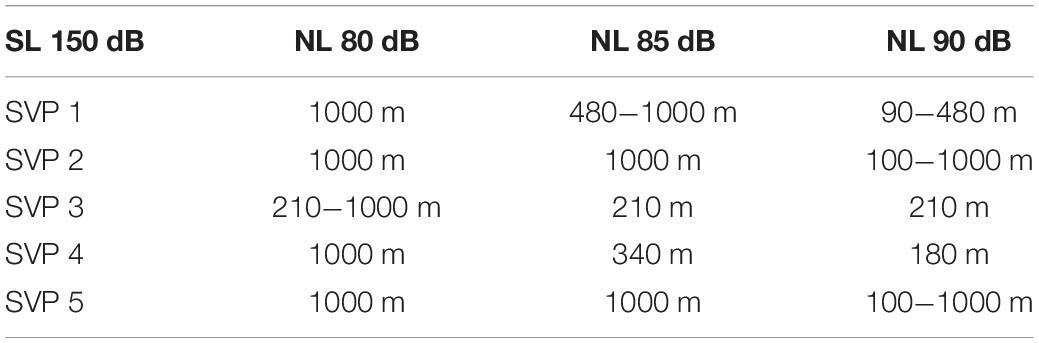
Table 3. Same as Table 2 for 150 dB source level (SL).
Grouper Calls Detections Algorithms
The PAM computer on the tow-body operates in real-time the fish acoustic detection algorithm research (FADAR) program. It is an automated identification tool for fish sounds based on acoustic feature extraction used by a machine-learning algorithm for classification (Ibrahim et al., 2018b). FADAR was designed to detect four grouper species (Table 1). Grouper sounds were first labeled by humans and used for training and testing of various feature extraction and classification methods. Grouper sound data collected from bottom moored hydrophones at known FSAs were used for training. They provided the advantage of higher SNR for fish sounds than on the SV3-WG, which improves acoustic feature extraction and algorithm positive detection rate for data collected in similar conditions. However, the algorithm showed poor performance for the SV3-WG data, which have lower SNR. Therefore, the algorithm was specifically trained with low SNR fish calls from the WG, which improved its accuracy in the field. In the feature extraction phase, a mel frequency cepstral coefficients (MFCC) feature extraction method was used. The MFCCs are short-term spectral based features, which provide a powerful representation of sound structures. They can also be improved to include the dynamic characteristics of the sound as shown in Ibrahim et al. (2018b). The overall percentage of identification reached 82.7% accuracy although the accuracy varied per species. E. gutattus and M. venenosa presented the highest accuracy, slightly higher than E. striatus detection accuracy. M. bonaci accuracy rate was the lowest of all. The algorithm was initially developed in MATLAB and was then converted into a C executable, which is embedded on the PAM computer of the tow-body package.
Although FADAR is an automated algorithm, it relies heavily on a carefully designed preprocessing and feature extraction method and it is likely to underperform in low SNR environments. In a recent study, we showed that deep learning-based detectors and classifiers such as autoencoders, convolutional neural networks (CNNs), and recurrent neural networks (RNNs), can be used as both feature extractors and classifiers (Zhang et al., 2017). While CNNs are suited for identifying spatial patterns from images, RNNs are capable of extracting discriminative patterns from time signals. However, the vanishing gradients feature prevents a standard RNN from memorizing long-term dependency of an input time sequence. Long short-term memory (LSTM) networks instead, cope with this problem by using parameters that selectively memorize or forget certain attributes of an input sequence (Hochreiter and Huber, 1997; Gers et al., 2003; Graves, 2012; Sak et al., 2014). In Ibrahim et al. (2018a), we revealed the effectiveness of using CNNs and LSTM networks for classifying fish calls and we evaluated the performance of such methods against the MFCC approach. Ibrahim et al. (2018a) showed that a data-driven feature extractor can substantially outperform a hand-crafted one, like the one used in Ibrahim et al. (2018b). The LTSM networks achieved 93.5% accuracy, a significant improvement over the former FADAR algorithm. This latest version of FADAR will now be installed on the SV3-WG for future missions with the addition of random ensemble of stacked encoders that enable the distinction between call types within individual species as shown by Ibrahim et al. (2019).
Red Hind Spawning Aggregation Dynamics
Declining regional abundances of Nassau and red hind grouper due to overfishing of their spawning aggregations prompted permanent and seasonal fisheries closures in the US Virgin Islands (USVI; Olsen and LaPlace, 1979; Beets and Friedlander, 1992, 1999; Nemeth, 2005). As these species produce sounds associated with reproductive behaviors (Mann et al., 2010; Schärer et al., 2012b), PAM was used to determine the species present, the temporal patterns of reproductive activity, site usage, and fish movements at grouper FSAs within the two marine protected areas (MPAs) in the USVI: Red Hind Bank Marine Conservation District (RHB) and the Grammanik Bank (GB) (Figure 6). The spawning aggregation site within the RHB is located 12 km south of St. Thomas, along the shelf edge and is made of well-developed linear reef 35–45 m deep of high topographic complexity (Nemeth et al., 2007). The GB is a reef system that lays at the same depth range as RHB and is also located on the southern shelf edge of St. Thomas, about 3 km east of RHB and known for its multi-species FSA for several commercially important groupers and snapper species (Kadison et al., 2006; Nemeth et al., 2006). Yellowfin and Nassau groupers aggregate to spawn in larger numbers at GB, with peak spawning around the full moon (FM) between February and May (Nemeth et al., 2006, 2020; Rowell et al., 2015).
In the eastern Caribbean, red hind form annual spawning aggregations around the FM from December through March (Sadovy et al., 1994; Nemeth, 2005; Schärer et al., unpublished). During the weeks ahead of the spawning season, red hind migrate to spawning areas and remain aggregated up to 7 days before the FM (Nemeth, 2012a). Since the year 2000, the RHB FSA site has been monitored by drift-fishing, setting fish traps, diving around the aggregation and recording GPS coordinates (Nemeth, 2005; Nemeth et al., 2007). The area used by red hind within the RHB during this time was calculated to be 0.24 km2 in both 2000 and 2001 and 0.35 km2 in 2003 and the spawning population size was estimated to be 80,000 fish (Nemeth, 2005). Changes in population density among years were assessed using visual SCUBA surveys and catch per unit effort, i.e., per trap haul (Nemeth, 2005). Most visual surveys were conducted around the FM period and encompassed their spawning peaks, which could occur up to 4 days before the FM (Beets and Friedlander, 1999; Nemeth et al., 2007). Visual surveys were used to measure both the average and peak spawning densities and revealed that the aggregation usually peaks in January and that spawning can occur from 0 to 4 days before the FM (Shapiro et al., 1993; Beets and Friedlander, 1999; Nemeth, 2005; Nemeth et al., 2007). During this study, visual surveys at RHB continued annually during January and February spawning periods (Nemeth et al. unpublished).
Red hind males produce low frequency mixed tonal-pulse sounds associated with courtship and territorial behaviors at spawning aggregations (Mann and Locascio, 2008; Mann et al., 2010; Zayas, 2019). Two main types of CAS are common during the spawning aggregation and daily sound production levels recorded at fixed stations within the FSA show trends similar to the density increase leading to spawning and sharp decrease associated to post-spawning departure described by Nemeth et al. (2007). Maximum sound production was observed around sunset (Mann et al., 2010) prior to when red hind spawn (Colin et al., 1987). Using acoustic recording data and visual surveys, Rowell et al. (2012) showed a significant correlation between red hind CAS production and fish density at a spawning site in Puerto Rico. This passive acoustic approach has been used at multiple red hind and other grouper FSA sites and allows for the continuous monitoring of the red hind spawning aggregations at both RHB and GB.
However, to date a consistent relation between spawning and sound production for the groupers listed in Table 1 has not been established, although a correlation between reproductive behaviors that precede spawning and grouper sounds during the aggregation has (Mann et al., 2010; Schärer et al., 2012a, b, 2013, 2014; Bingham et al., 2012; Zayas, 2019). Nemeth et al. (2007) estimated that peak spawning of red hind typically occurred within 2 days of the FM at RHB, along with the highest density. At another FSA on the western Puerto-Rican shelf (Figure 6) Rowell et al. (2012) showed that peak density of red hind occurred 8 days after the full moon (DAFM), sound levels and vocalizations peaked 7 DAFM and dropped to almost zero immediately after that, suggesting that peak spawning occurred and fish departed soon after. Fixed digital spectrogram recorders (DSG – Ocean, Loggerhead Instruments) were deployed at RHB and GB, at the yellowfin grouper main aggregation area during the 2016–2017 spawning season. They were duty cycled and recorded 20-s files every 5 min. Therefore, 4 min of ocean sounds were recorded every hour. The number of calls over 4 min was then converted to number of calls over an hour with the assumption that the call rate would remain the same over an hour. The daily CAS rate was calculated as the sum of the number of hourly calls over 24 h and is shown in Figure 7.
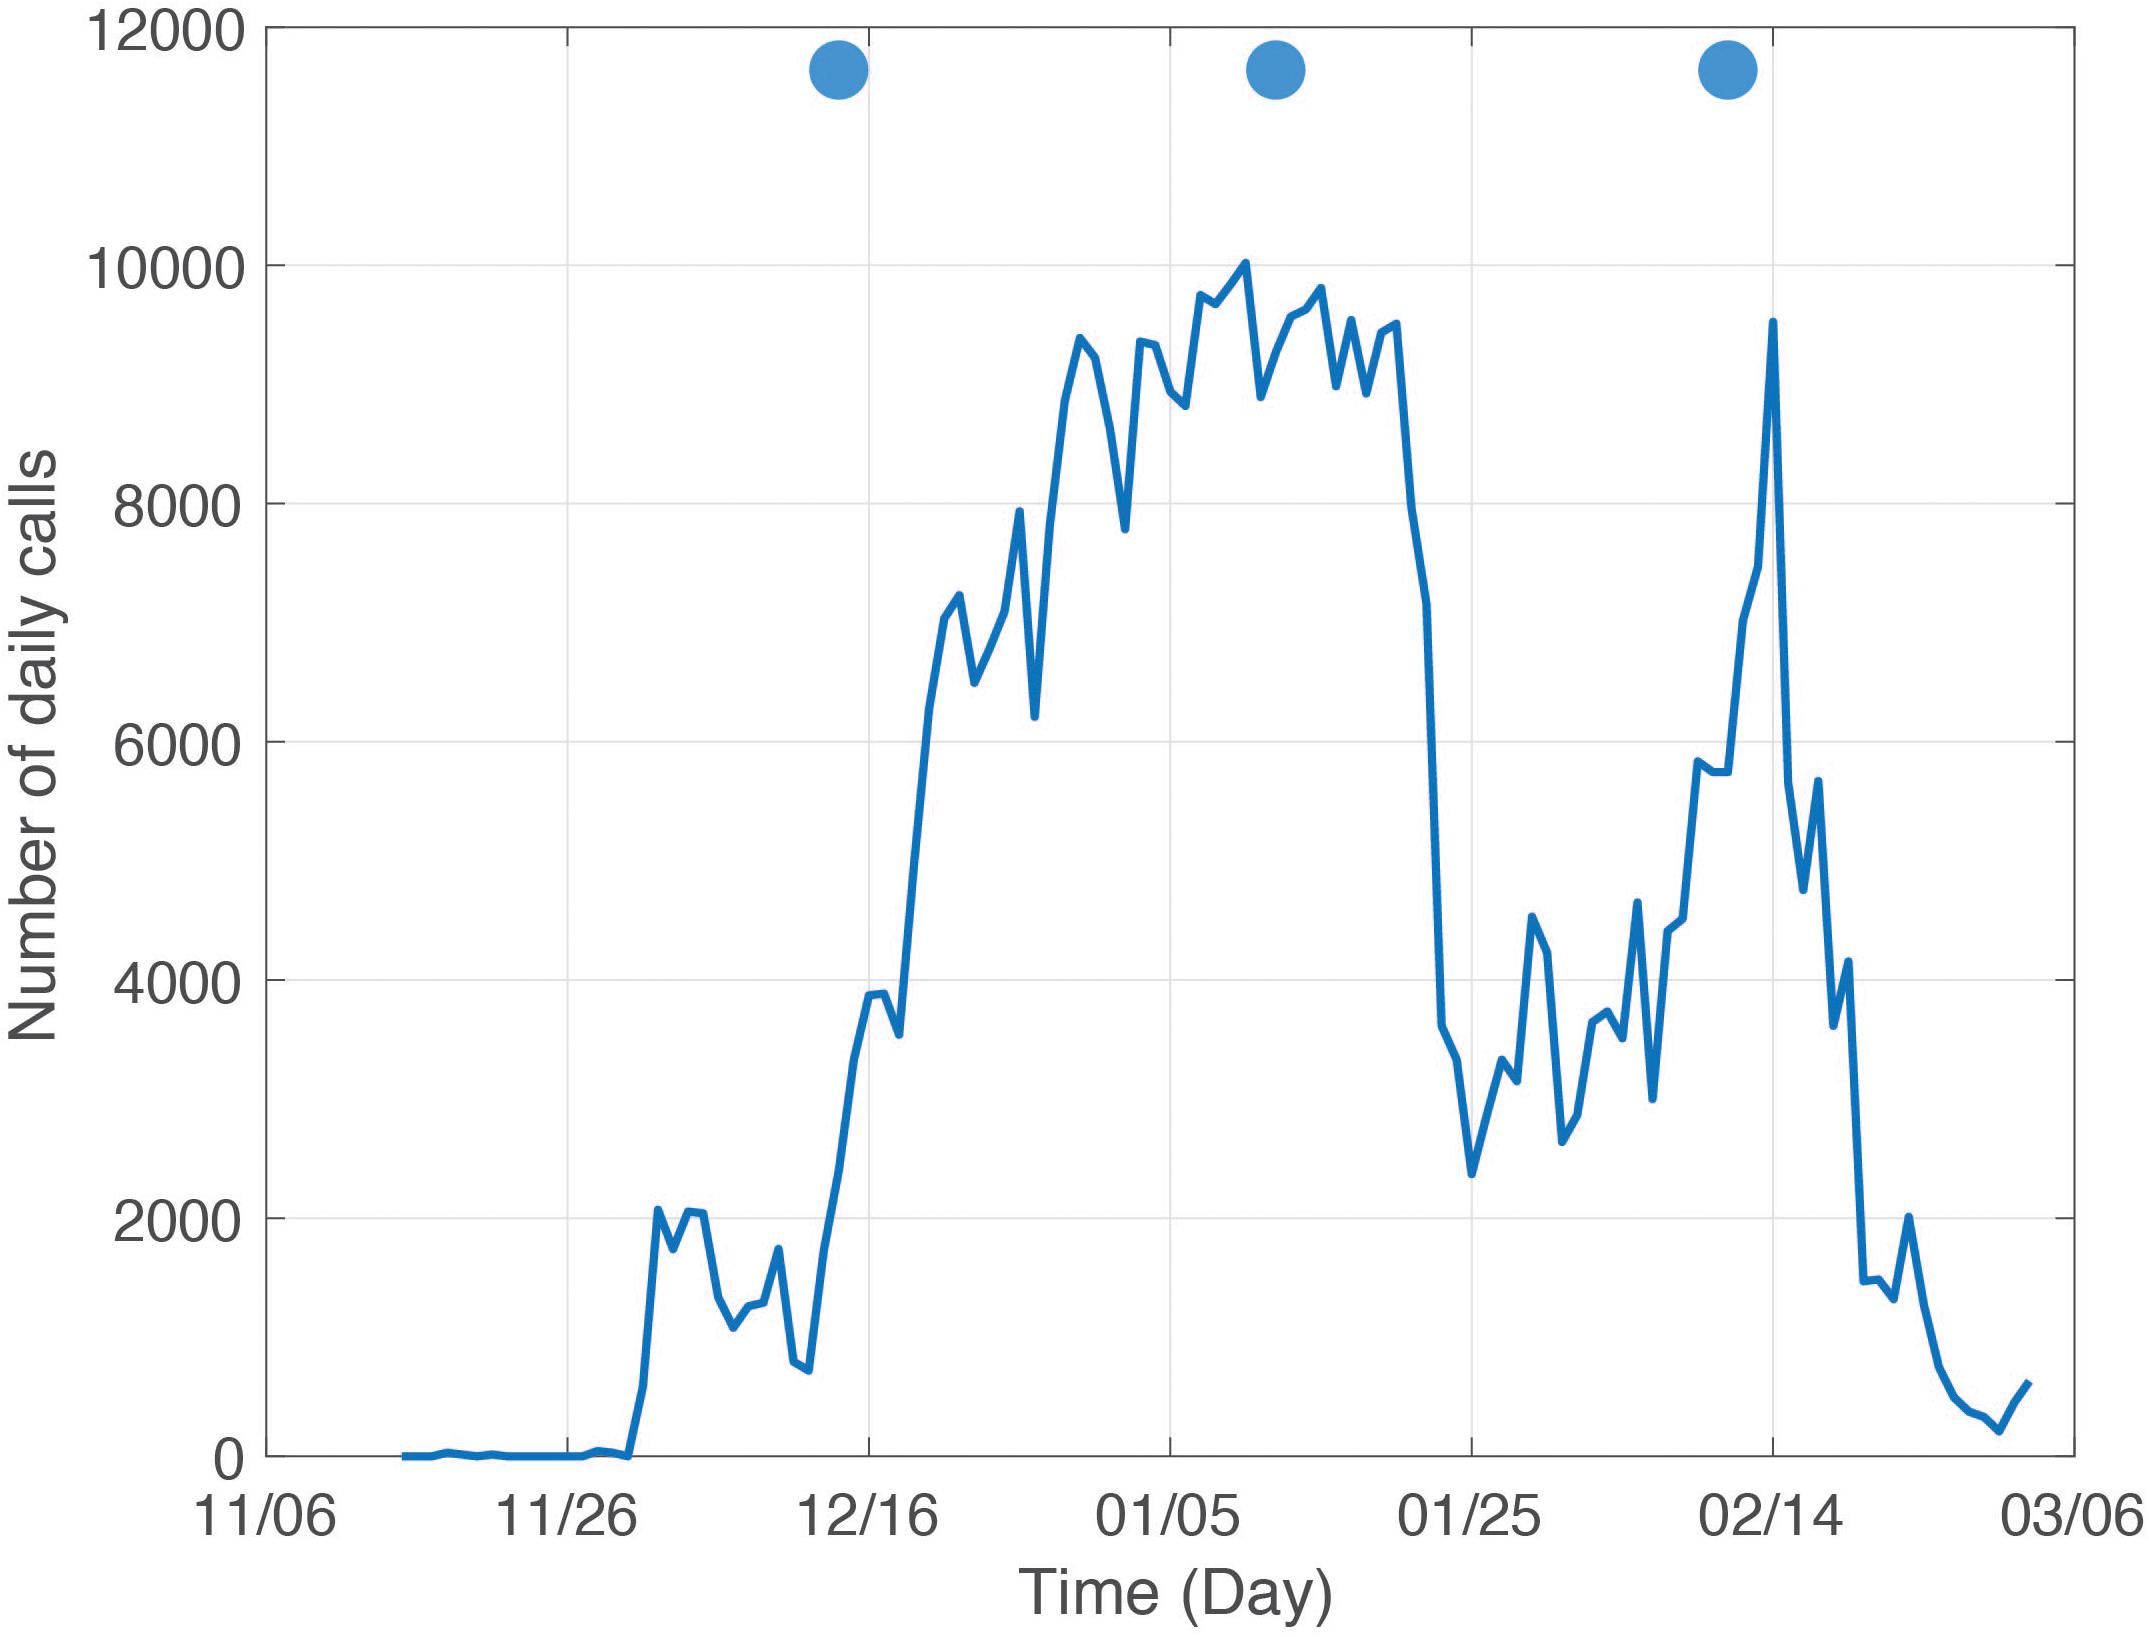
Figure 7. Daily calls at Red Hind Bank fish spawning aggregation from November 2016 to March 2017. The blue disks indicate the day of full moon.
The red hind daily CAS production at RHB exhibited two peaks of similar magnitude but different duration. The first was an extended peak observed from December 30th to January 20th, which spans from 14 days before the January FM to 8 DAFM. This peak was followed by a period of lesser CAS production attesting to the presence of fish that remained at the aggregation site, and supports visual surveys at this site by Nemeth et al. (2007). The second peak, in February lasted for about 1 day on the night of February 14th, 3 DAFM. Red hind CASs were recorded at both sites and followed similar daily patterns on 08–14 February, 2017 as shown in Section “Wave Glider Survey During the Red Hind Peak Calling Week,” suggesting that another red hind FSA exists at GB yellowfin grouper main aggregation area. The CAS rate however at GB site was lower than at RHB.
Wave Glider Survey During the Red Hind Peak Calling Week
As part of a study on the effect of management on red hind stock enhancement in the U.S. Caribbean Islands, and based on the knowledge of the timing of red hind FSA at RHB, four wave glider surveys were initially scheduled over two spawning seasons. Two in January and February 2016 and 2017 respectively. Our first goal was to show the usefulness of the wave glider platform at mapping reproductive activity by detecting CAS rate patterns beyond the known FSAs. Our second goal was to identify other potential FSA sites. And our third goal was to demonstrate that our system could provide repeated CAS rate distribution patterns that could be used to assess the interannual variability of reproductive activity based on environmental conditions, such as current and water temperature. In 2016, because of delay in the readiness of the PAM system, only one survey occurred in March–April 2016. Noise associated with the tow-body cable and persistent high sea states (four to five on the Beaufort scale) contributed to poor acoustic data quality with few fishes (mostly yellow fin groupers) heard. The next survey scheduled during the week of the FM in January 2017 was canceled because of equipment failure and the second survey ultimately occurred during the week of the FM in February 2017. The survey took place between 07 and 15 February, 2017 along the southern shelf of the Island of St. Thomas, in the U.S. Virgin Islands as shown in Figure 8. Although environmental data were collected, the ADCP was not functional and no current data were collected, except for surface currents. The analysis of environmental data did not reveal any significant correlation between the call rate patterns and temperature, or salinity, or Chl-a, or turbidity. Temperature and salinity were relatively uniform during the survey, confirming a well-mixed environment observed during winter months (Corredor and Morell, 2001).
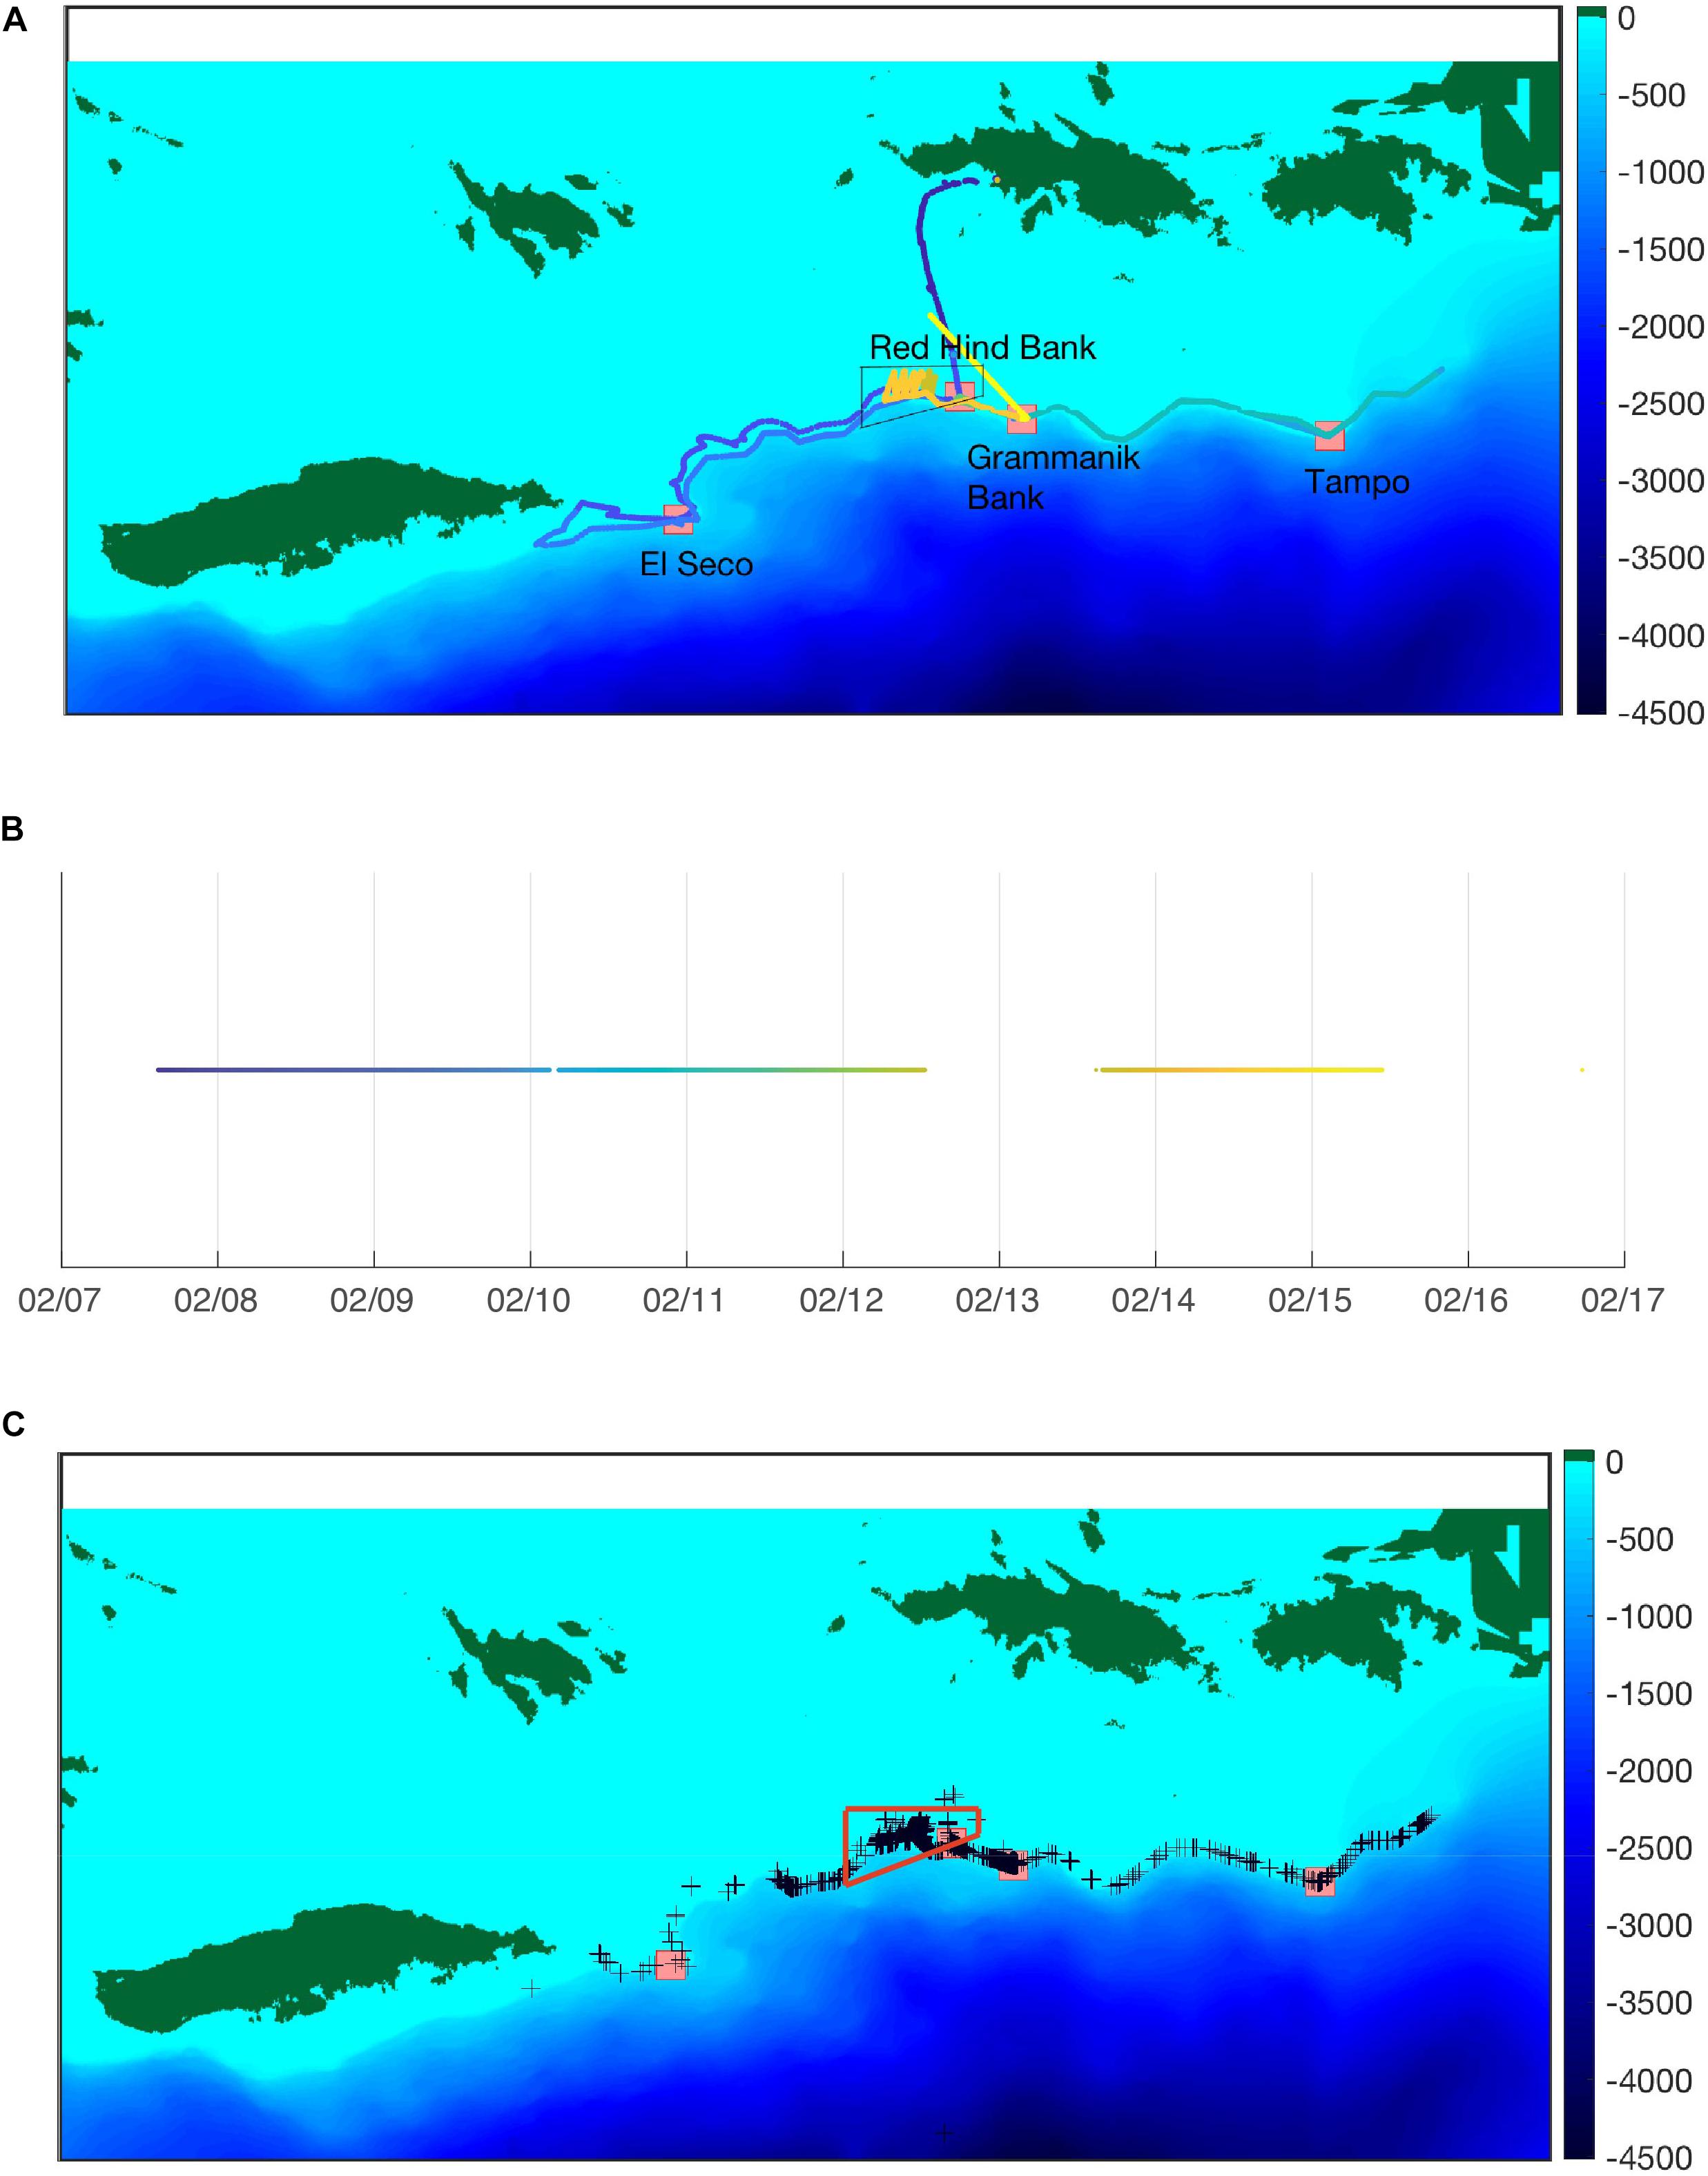
Figure 8. (A) Global (top) and daily maps of the glider path along the southern U.S. Virgin Islands shelf edge from 7 to 15 February, 2017. Background colors indicate depths. Colors along the track indicate time shown in (B). The wave glider track east of Tampo ends at the British Virgin Islands Border. The boundaries of the MCD are indicated by the black quadrilateral. (C) Red hind CAS indicated by black crosses as detected by the wave glider. The boundaries of the MCD are indicated by the red quadrilateral. Red squares also indicate known multi species fish spawning aggregations as labeled in (A).
Mapping Reproductive Activity Based on CAS
The analysis of the PAM system detections confirmed the efficacy of our system at detecting CAS not only at knowns FSAs such as RHB and GB but also at many other locations beyond those two sites. As shown in Figure 8C, CAS were recorded all along the shelf edge. This information provides an indication of the spatial extent of the fish distribution as revealed by the wave glider survey. It confirms that red hinds are located in more areas than the points monitoring has been focused on. In addition, the real-time detection enables researchers or managers to potentially verify the fish presence and assess the potential of an FSA by sending a team of divers when possible. It could also inform of the presence of vessels in the vicinity of the CAS locations, which could help authorities and managers deal with illegal fishing activities.
An Opportunity for Repeated Surveys at Multiple Locations
Although the results presented here are limited to one survey of the southern shelf edge between Vieques and the British Virgin Islands border over 7 days, red hind CAS rates were measured at least twice at the same locations at a different time as shown for example on Figure 9 when the wave glider surveyed the shelf edge west of RHB. The glider surveyed the same area over two consecutive days and at different times allowing the identification of CAS rate changes over the same locations. Figure 9 also shows that over two consecutive days, CAS were not always heard at the same locations. Changes in CAS rates at the same location or changes in CAS locations taken alone are impossible to interpret unless the call type could be identified as it can be related to territorial or courtship behaviors during encounters between fish as shown by Zayas (2019). However, the presence of CAS alone would inform of the location of potential spawning habitat, which is a useful information in itself. Ultimately, repeating this survey over multiple years and comparing the locations of CAS detected as well as the CAS rates at the same time along with environmental data would provide valuable information on changes in reproductive behavior and spawning habitat. Such information would not be possible to acquire without the use of an autonomous platform and would be cost efficient in comparison to manned vessel or diver surveys.
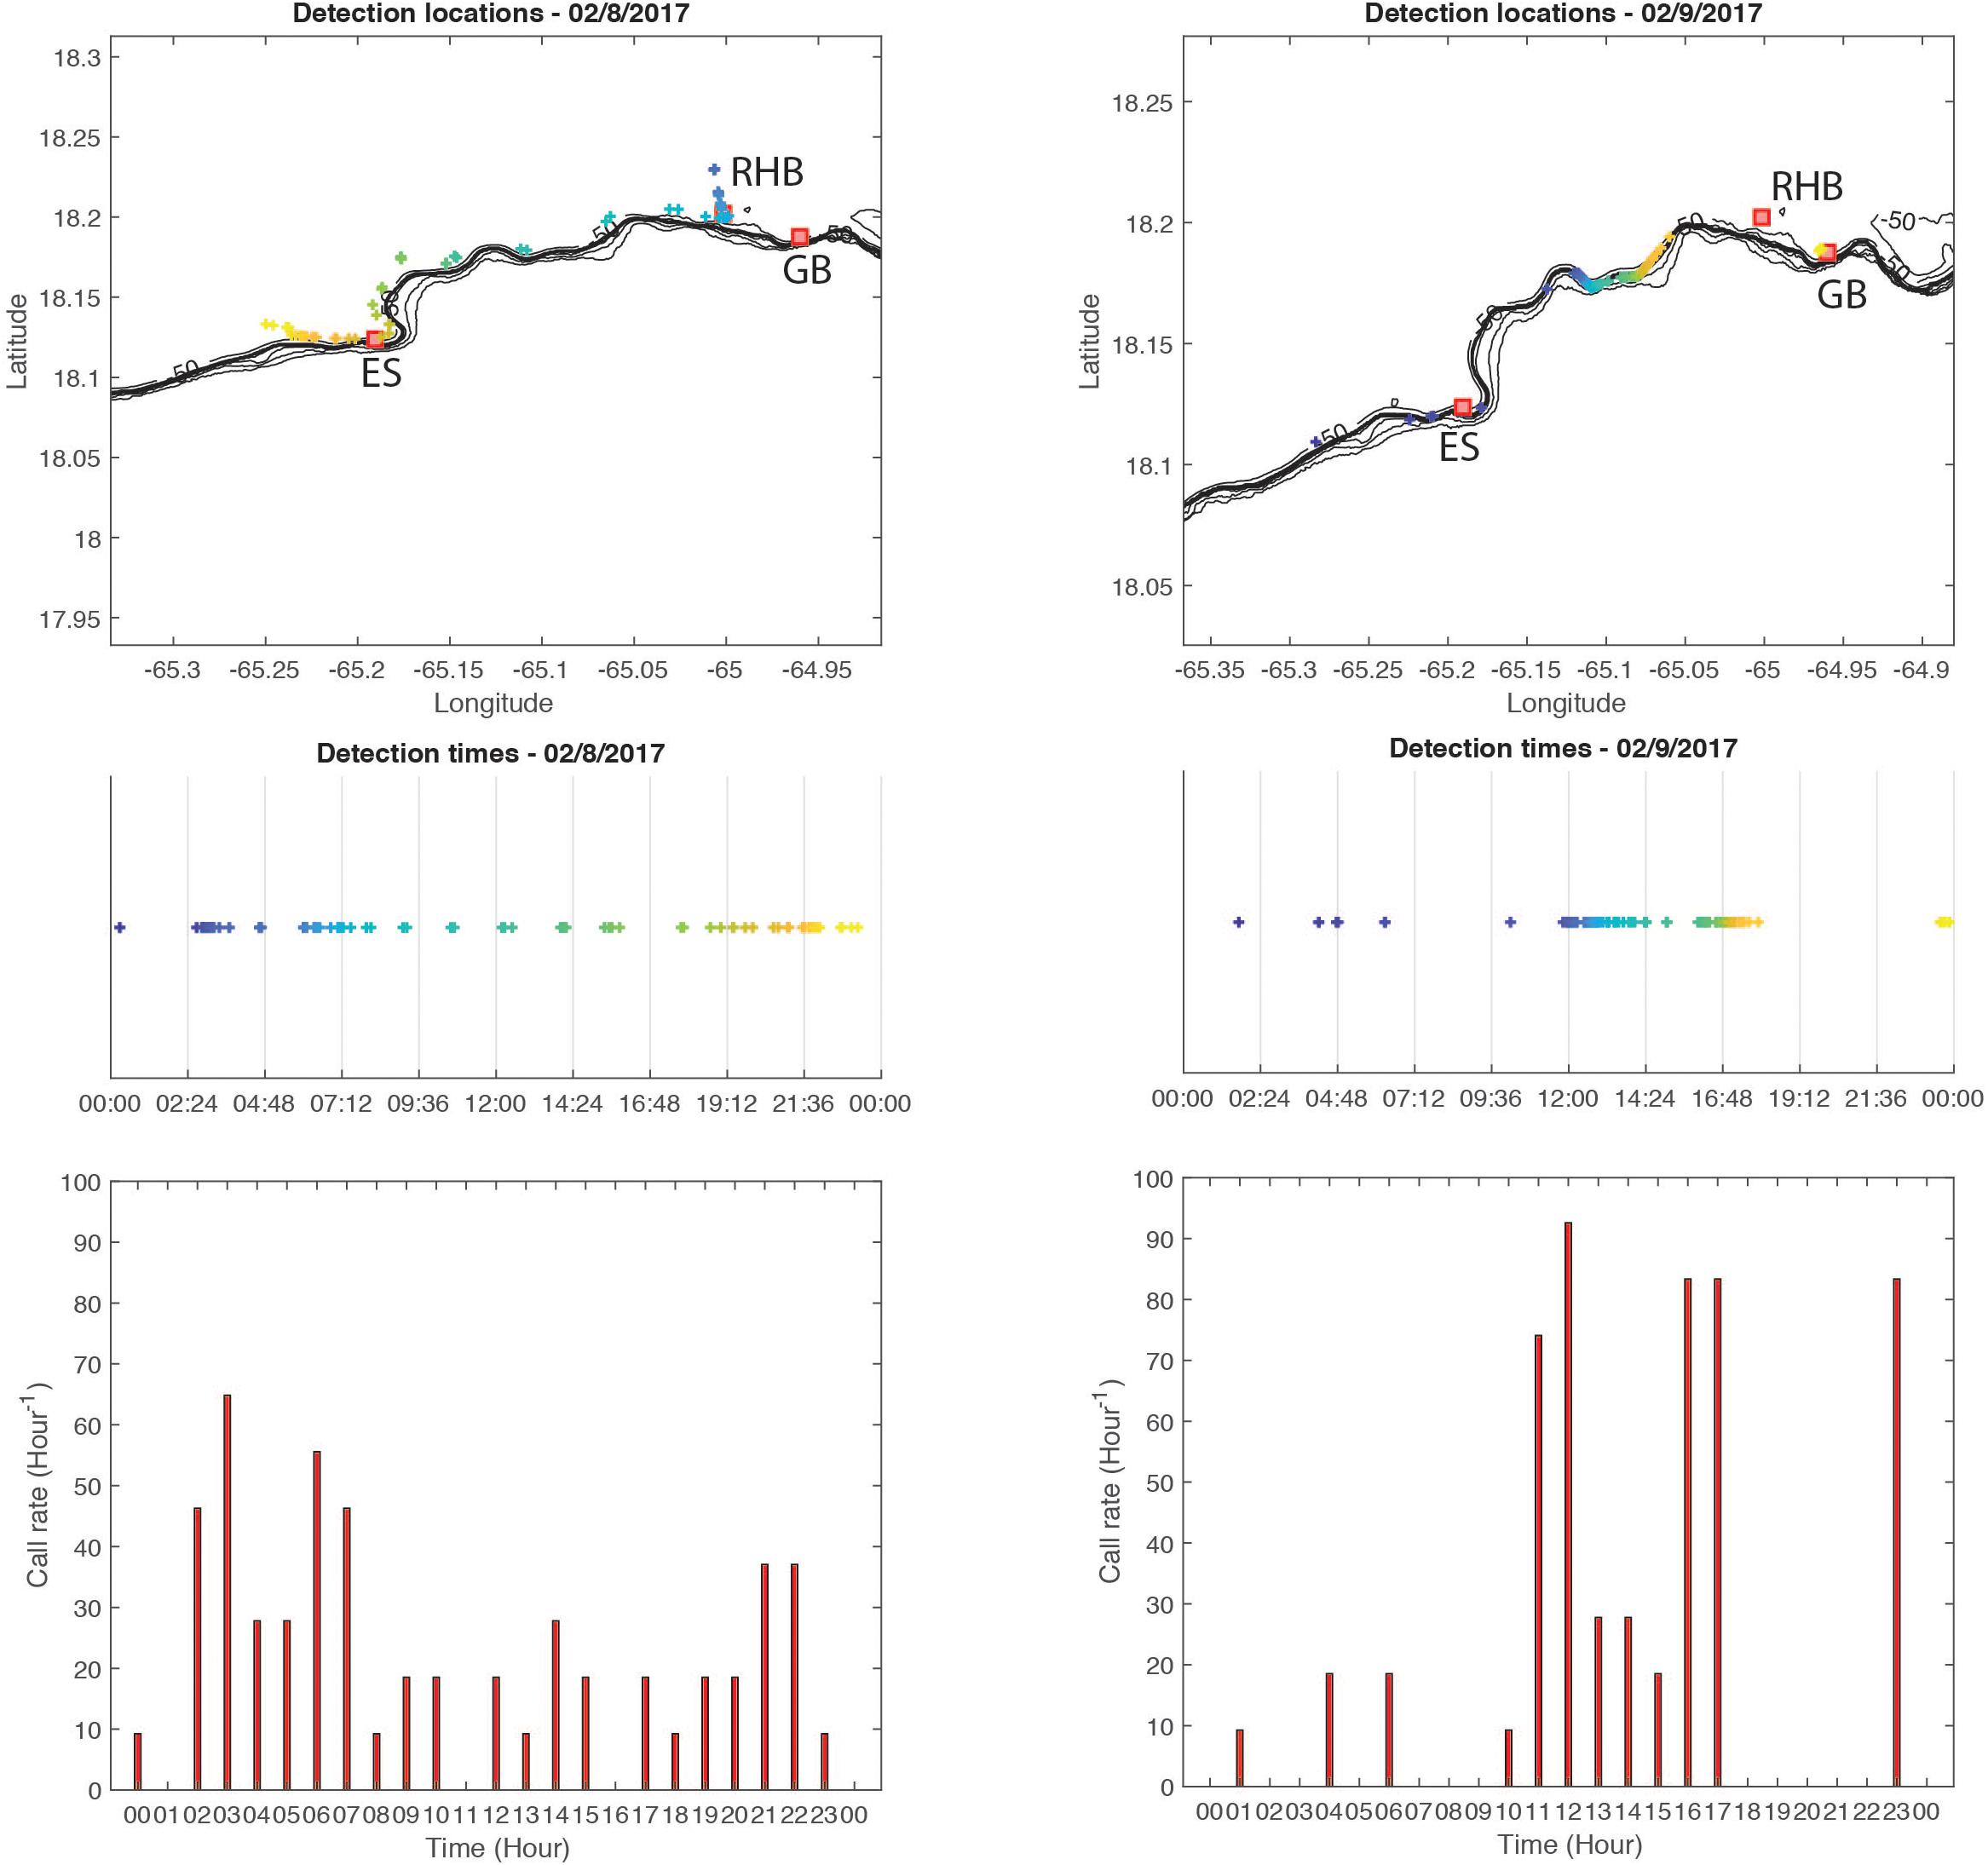
Figure 9. Example of variations in red hind CAS location distribution over two consecutive surveys of the same area. Left column show detection location (top), local time of detection (middle), and hourly call rate (bottom) for 08 February, 2017 and right column shows the same variables for 09 February, 2017. The detection locations are colored by time shown in the middle graph.
Identifying Potential Spawning Aggregations Sites
As mentioned in Section “Red Hind Spawning Aggregation Dynamics,” DSGs were deployed at both RHB red hind FSA and GB Yellowfin FSA, and recorded red hind CAS during the week of the wave glider survey. In order to interpret the wave glider CAS rate patterns, we propose to use the CAS rate patterns observed at both RHB and GB FSAs as reference patterns associated with red hind reproductive behavior. We assume in this approach, that CAS reproductive behavior that will lead to spawning follows the temporal patterns on an hourly basis observed at both RHB and GB FSAs during the peak calling week. Therefore, we assume that any locations surveyed by the wave glider that exhibited an equal or higher CAS rate than at RHB or GB FSAs could be indicative of a potential FSA habitat. In order to conduct the analysis, we interpolated the glider recording cycle to an hourly cycle and we accounted for the motion of the glider. Because the glider command system provides real-time speed over ground data, we estimated the averaged ground speed of the glider to be 0.5 ms–1. At such speed the glider was traveling over 100 m in about 6.48 min. As shown in Section “PAM Detection Threshold and Grouper Sound Detectability,” the average distance over which grouper sound SL is less than the DT is about 100 m, meaning that in a 100-m segment centered around the glider, the PAM could record CAS from both preceding and succeeding adjacent segments. Therefore, the CAS rate in each individual 100 m was calculated as an average over three consecutive segments and the daily rate for each segment was extrapolated from the PAM recording cycle.
The results from this analysis are shown in Figure 10 where the resampled hourly CAS rate are shown simultaneously for RHB, GB and the WG. The daily CAS rate pattern at RHB and GB exhibits on most days a bi-modal structure with equally high CAS rates between the period 03:00–06:00 and the period 15:00–19:00 from 07 to 10 February, 2017. On 11 February, 2017, the morning CAS rate was even higher than the afternoon one. That tendency shifted to an evening CAS rate higher than in the morning as peak calling was approached on the night of 14 February, 2017. In addition, the mean hourly CAS rate doubles at both sites with the days approaching 14 February as shown in Table 4. The daily variation cycles were the most in phase on 11 and 12 February and the least on 10 February. The standard deviation ratio in Table 4 shows that the difference in CAS rate between RHB and GB increased most significantly from 8 to 9 February but remained relatively constant after that.
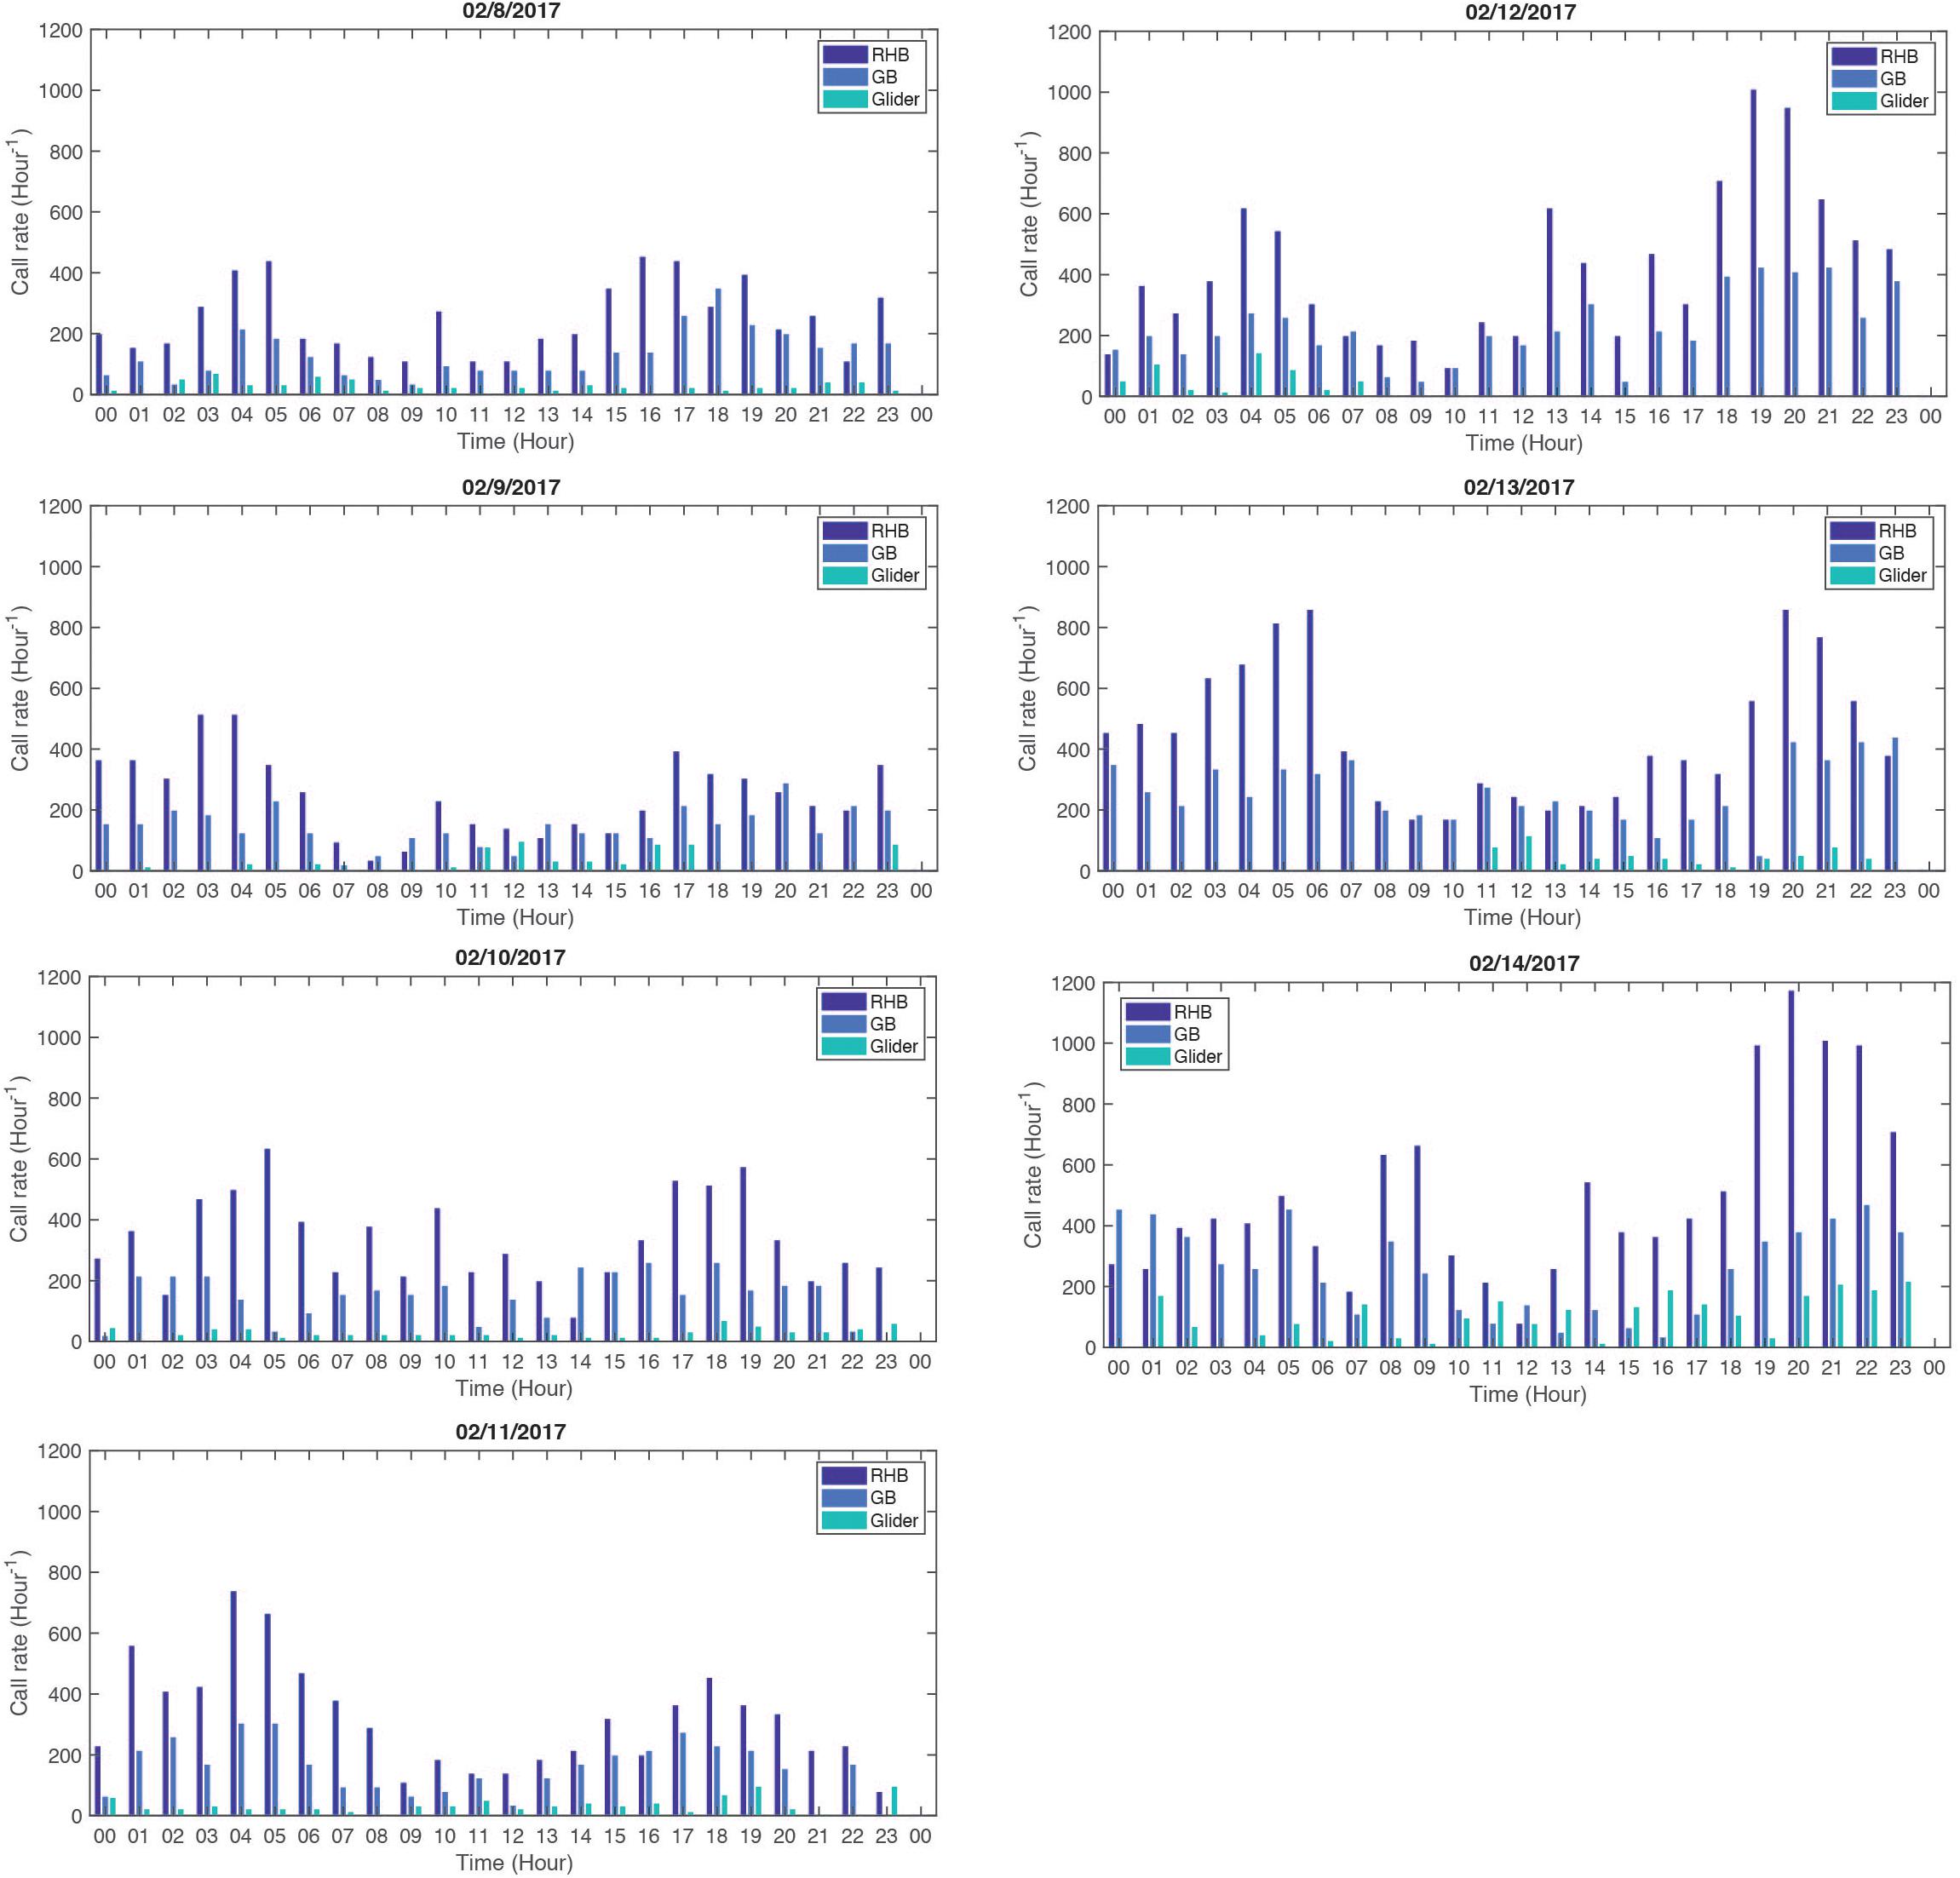
Figure 10. Hourly CAS rate for each day of the wave glider survey, from 8 to 14 February, 2017 (full moon was on 11 February). Each daily graph shows the hourly CAS rate at RHB (dark blue), GB (light blue) and at the wave glider (green).
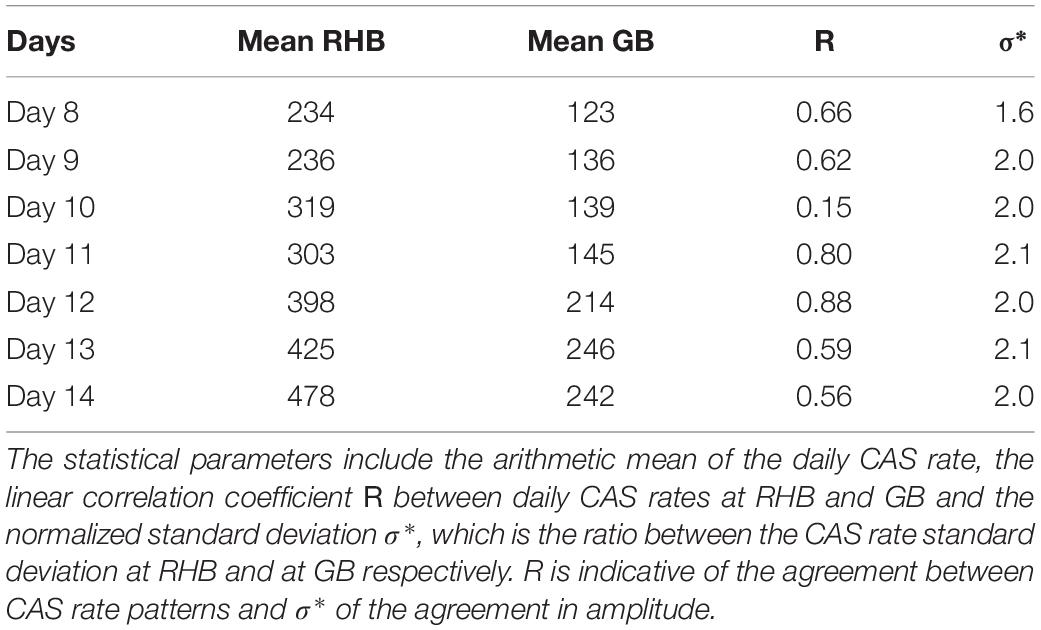
Table 4. Pattern statistics of the courtship associated sounds at RHB and GB.
The CAS rates collected by the wave glider are not in phase with RHB or GB, however on some days and at certain times the wave glider CAS were higher, equal, or slightly less than at RHB and GB. For example, on 9 February, 2017, at 12:00, local time, the CAS rate was higher at the wave glider location than at GB and higher than at RHB on 11 February, 2017 at 23:00. Based on these criteria, we identified several locations that could be spawning habitat for red hind as shown in Figure 11. The majority of these location are within the MCD area; however, it appears that some specific spawning habitat could be located just west of the MCD, near RHB main spawning site, between RHB and GB, near GB Yellowfin grouper FSA site, west of Tampo and near the BVI border.
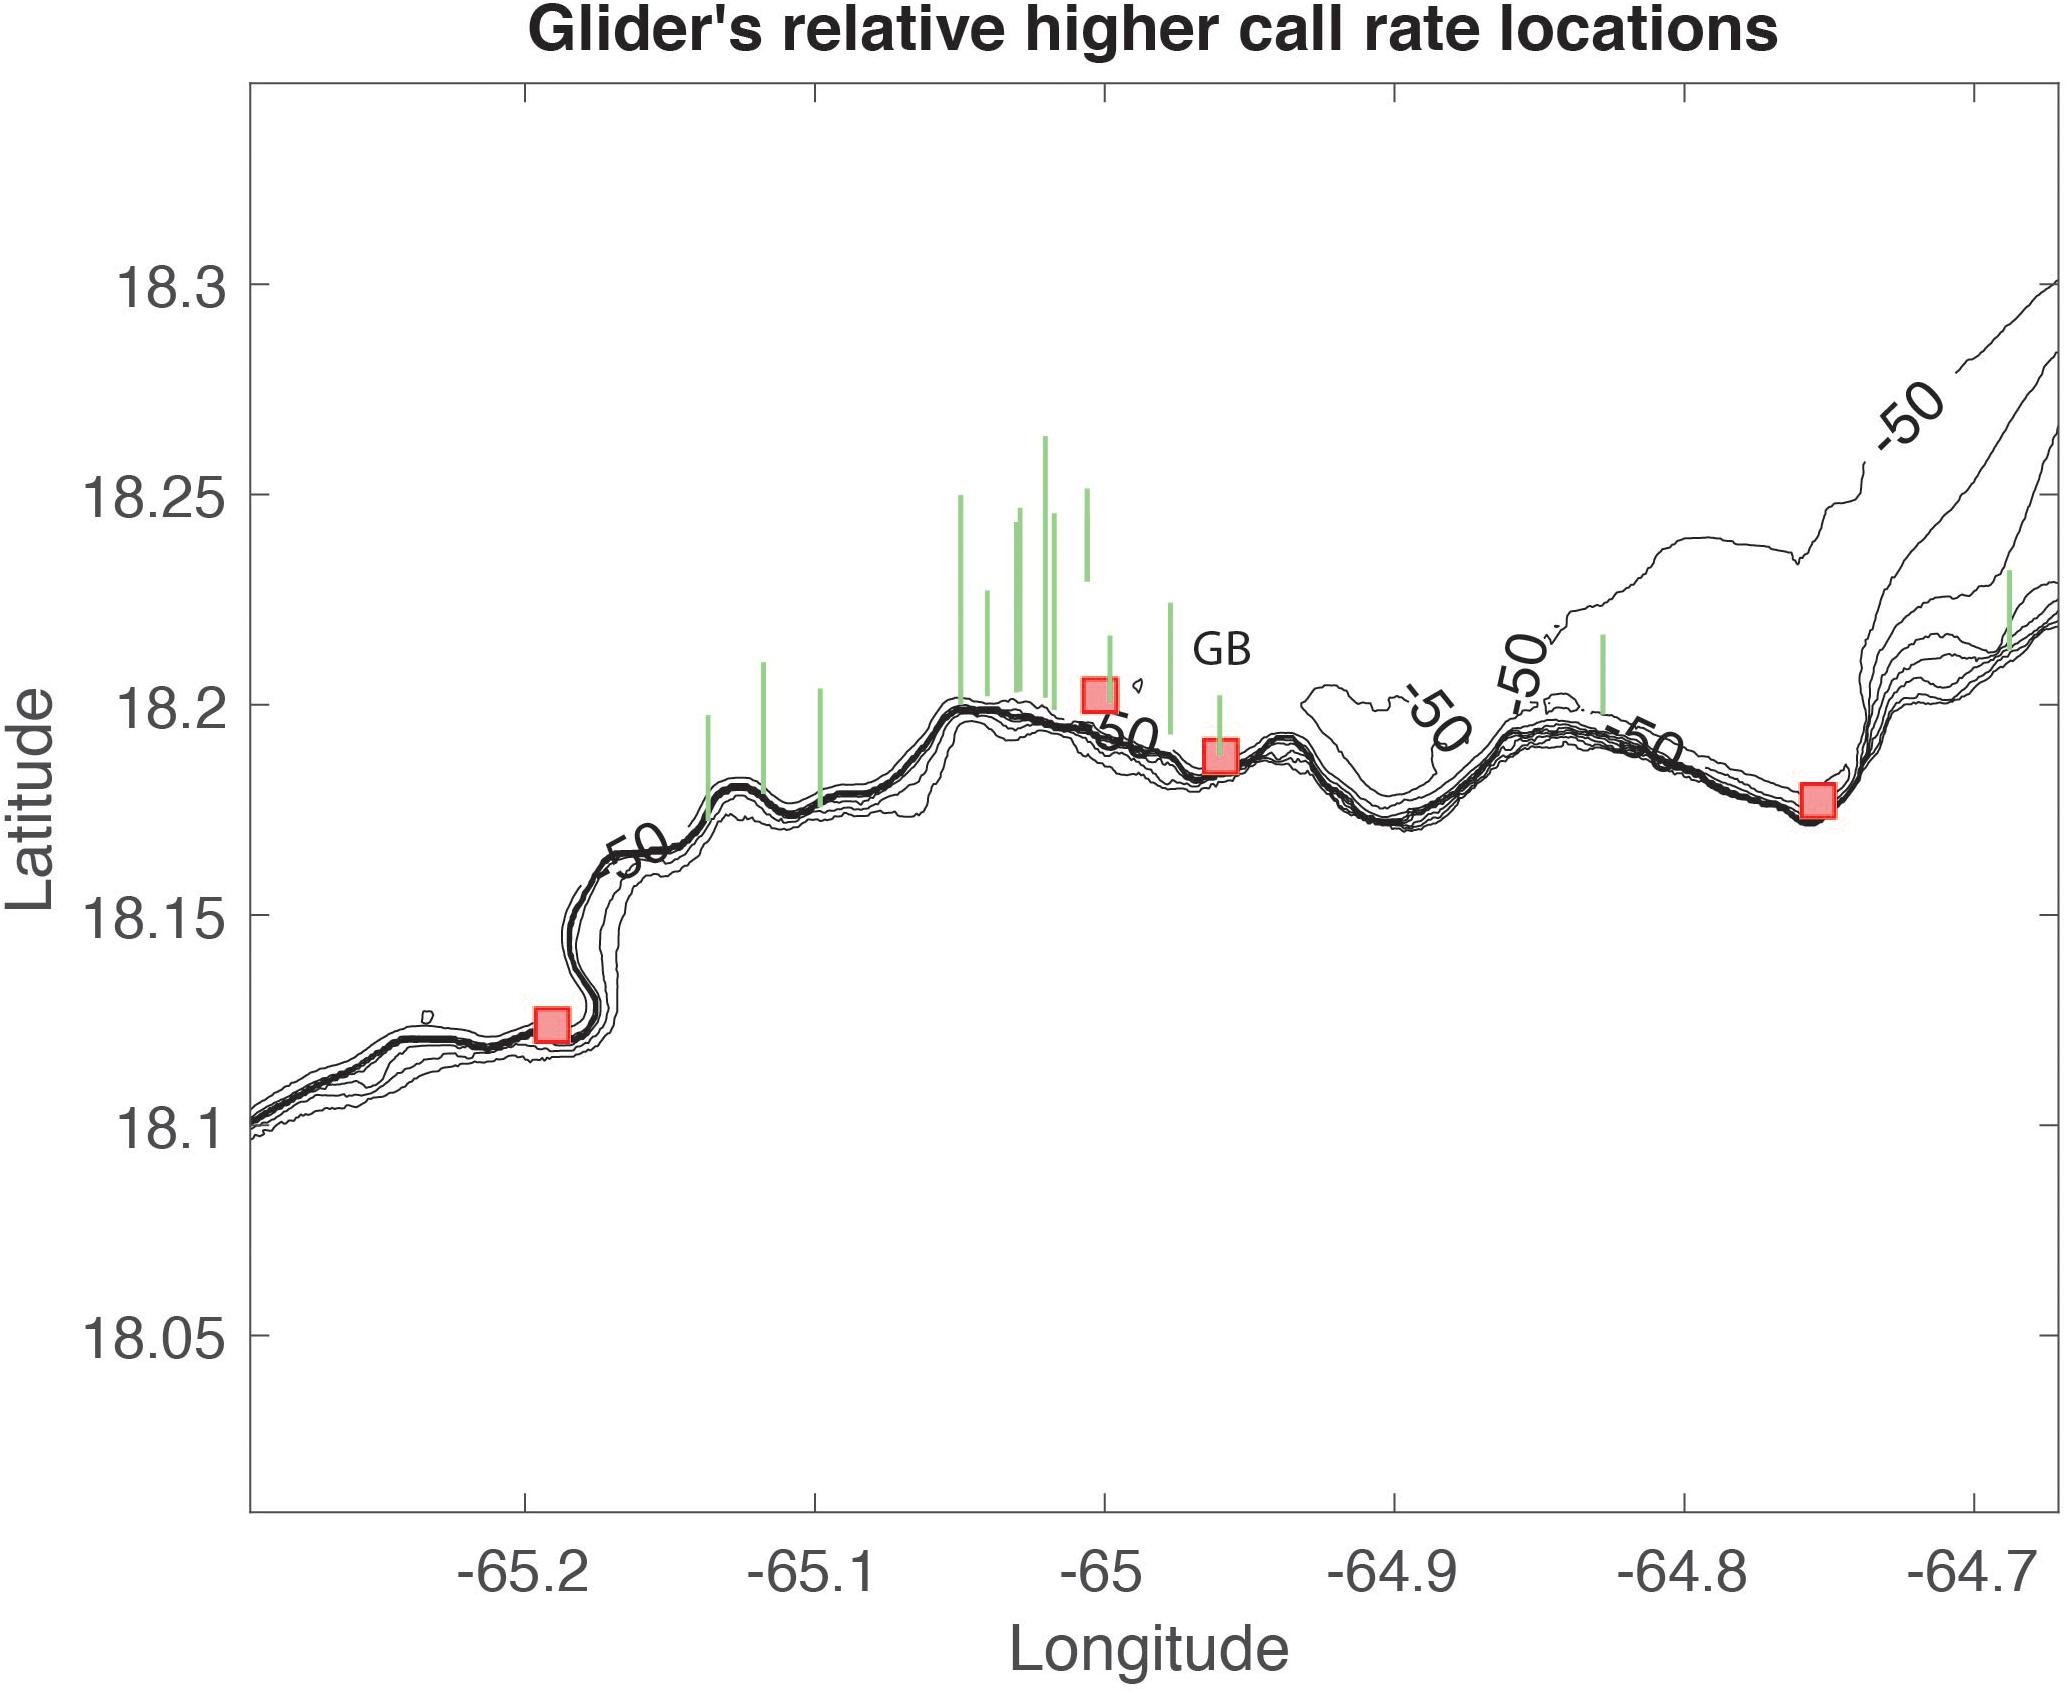
Figure 11. Potential spawning habitat locations derived from the wave glider data as indicated by the green vertical bars. The length of each bar is relatively proportional to the CAS rate at each location.
Follow-up surveys were conducted on January 18, 2019 (3 days before full moon) by a team of technical divers using closed circuit rebreathers and underwater scooters at three potential red hind spawning aggregation sites identified by the wave glider. Two of these sites had 20 to 40 red hind on well-developed mesophotic coral reef at 40 to 50 m depth where males exhibited signs of territorial defense and coloration patterns similar to those that occur on spawning grounds (Nemeth, 2012b). These two nearby site were located on the northern boundary of the Grammanik Bank seasonal closed area and about 150–300 m northeast and 600–1100 m northwest of the GB yellowfin grouper main aggregation area (Nemeth et al., 2006, in press), which is the site identified on Figure 11 by the wave glider near GB and revealed by our analysis.
Discussion
Findings from the wave glider survey provide for the first time an extensive spatial and temporal view of the distribution of grouper spawning habitat along the extent of the southern shelf of the U.S. Virgin Islands during the main calling week in February 2017. These findings suggest that the reproductively active red hind groupers are widely distributed warranting directed diver observations at specific sites and a fine-scale analysis of the CAS types produced by grouper. Indeed, evidence is emerging that within a species, CAS types can be associated with particular behaviors (Bingham et al., 2012; Zayas, 2019). Therefore, such analysis would provide a better understanding of the reproductive strategies of grouper, migrations for spawning and the reproductive behavior dynamics prior to and after spawning. However, our observations are limited to 1 week but could be easily repeated over multiple spawning seasons with the wave glider platform. Yearly surveys could provide insightful information on the spatiotemporal dynamics of groupers reproductive behaviors in correlations with oceanographic interannual variability but also long-term changes and fishing pressure. In addition, with the recent development in fish call types detections and classification, future surveys could provide a refined call type spatial and temporal distribution, hence a habitat related call type. Such information would be conducive to understanding the role of specific habitat in reproductive behaviors.
Nonetheless, despite the lack of repeated surveys over multiple spawning events, a few realizations can be made. Grouper calling rates appeared to follow the same patterns across a wider extent of habitat compared with the known FSA sites monitored with fixed hydrophones. The corollary is that CAS rates collectively increased as the date of full moon got closer and up to 3 days after. The wave glider survey also revealed the existence of multiple potential spawning aggregation sites for red hind and their relative distribution throughout habitats on the southern shelf. It confirmed that the red hind tends to occupy habitats on the shelf rather than the shelf break (Colin et al., 1987; Beets and Friedlander, 1992; Nemeth, 2005), unlike larger grouper species (Kobara and Heyman, 2010; Nemeth et al., 2020). It also revealed the existence of habitats that support a relatively wide distribution of potential red hind aggregations west of RHB, within the MCD, near the GB yellowfin grouper spawning aggregation site, and also further east near the BVI border.
Because a red hind FSA at RHB had been visually confirmed (Nemeth, 2005; Nemeth et al., 2007), and because CAS rate patterns at GB showed similar daily patterns and similar increase in CAS rates, we used changes in the CAS rates throughout the spawning week at RHB and GB recorded with fixed hydrophone as controls to assess the changes in CAS rates collected during the WG survey. To calculate the hourly call rate from the wave glider data, we assumed that CAS could be beard no further than 100-m. As shown by the TL analysis, the detections range can be up to 1000-m due to changes in environmental conditions, meaning that fish sounds heard at any location could be located much further than 100 m away. But this is the case for both the wave glider hydrophones and the fixed hydrophones. Therefore, the daily call rate estimate, whether in a 100-m segment or at fixed hydrophones are both equally biased by calls outside the surrounding 100-m radius area, and therefore consistent with each other.
In addition to the U.S. Caribbean wave glider surveys, we have conducted surveys in the Florida Keys National Marine Sanctuary and on the East Florida shelf at two occasions. Each mission’s problems helped us streamlined the PAM system on the wave glider, by reducing instrument and system noise, by improving PAM payload efficiency and management and by improving some other aspects of our custom payload such as the echosounder screen movie streaming and recording, and lastly the ADCP data acquisition. We now consider that we have a robust system than can collect fish sound in a wide range of oceanographic conditions. However, our ocean sound detection probability can be affected by ocean state, when wave crashing noise becomes too loud. Such noise is shown on Figure 3B. In other instances, the fish sounds that we seek to detect, which are in the lowest frequencies, could be masked by ship noise in the same frequency band.
Conclusion
We presented in this study a new PAM autonomous surface platform for the study of FSAs of soniferous species. This platform can carry a payload that includes environmental sensors, a current profiler, and a PAM system that can record and classify (in real-time) at least four species-specific grouper CAS based on the automated detection algorithm by Ibrahim et al. (2018b). Although, we focused this study on red-hind grouper, other species’ CAS from Nassau and yellowfin grouper were also identified. Environmental data and ocean sounds were collected from the sensors on the tow-body located 8 to 15 m below the surface and about 10 m behind the wave glider in depths ranging from 30 to 80 m and in various sea states.
In this study we demonstrated the usefulness of such platform for monitoring grouper reproductive behaviors and identifying their reproductive habitat. It enables scientists and resource managers to conduct low cost repeated surveys at any frequency in order to capture the variability of the reproductive dynamics that they intend to study. It also provides an oceanographic context to the CAS temporal patterns and spatial distribution, which can be used to assess long term anthropogenic effects including climate change and warming ocean temperatures. This platform can also be used for an initial assessment of the presence of FSAs, anywhere and constitute in itself an efficient tool for analyzing acoustic data. One of the products of the PAM system is an analyzed acoustic dataset, which would take months to process by a human. In addition, boat traffic, currently classified as noise could be added as a product of the detection algorithm. More sophisticated algorithms will support a larger number of soniferous species including both fish, crustaceans and marine mammals that can be accurately identified, which would increase the range of passive acoustic fisheries application and ecosystem studies of the wave glider platform. However, in regards to FSA, parallel monitoring from fixed hydrophones and diver observations is paramount to the interpretation of any moving platform data.
Data Availability Statement
The datasets generated for this study are available on request to the corresponding author.
Author Contributions
LC, RN, MS-U, and RA designed the study. FD and LC designed the PAM system on the wave glider. RN participated technical diver surveys. LC, AI, MS-U, and AM conducted data analysis. LC wrote the manuscript with contributions from all co-authors.
Funding
The authors acknowledge the Harbor Branch Oceanographic Institute Foundation and the National Science Foundation’s Virgin Islands Established Program to Stimulate Competitive Research (VI-EPSCoR, #1355437) for supporting part of this research. LC, AI, RN, and MS-U were also supported in part by NOAA Saltonstall-Kennedy grant NA15NMF4270329.
Conflict of Interest
MS-U was employed by company HJR Reefscaping. AM was employed by company EPS Corporation.
The remaining authors declare that the research was conducted in the absence of any commercial or financial relationships that could be construed as a potential conflict of interest.
Acknowledgments
The authors are grateful for the help provided on shore and in the field by University of the Virgin Islands and for letting us use the campus facilities. The authors are particularly thankful to the staff and students of the Center for Marine and Environmental Studies at University of the Virgin Islands and commercial fishers R. Silva and E. Font for assistance in transporting the WG equipment to St. Thomas. This is contribution # 203 to the University of the Virgin Islands’ Center for Marine and Environmental Studies.
Footnotes
References
Amorim, M. C. P., Conti, C., Modesto, T., Gonçalves, A., and Fonseca, P. J. (2015). Agonistic sounds signal male quality in the Lusitanian toadfish. Physiol Behav. 149, 192–198. doi: 10.1016/j.physbeh.2015.06.002
Bass, A. H., and Mckibben, J. R. (2003). Neural mechanisms and behaviors for acoustic communication in teleost fish. Prog. Neurobiol. 69, 1–26. doi: 10.1016/s0301-0082(03)00004-2
Baumgartner, M. F., Fratantoni, D. M., Hurst, T. P., Brown, M. W., Cole, T. V., Van Parijs, S. M., et al. (2013). Real-time reporting of baleen whale passive acoustic detections from ocean gliders. J. Acoust. Soc. Am. 134, 1814–1823. doi: 10.1121/1.4816406
Beets, J., and Friedlander, A. (1992). Stock analysis and management strategies for red hind, Epinephelus guttatus, in the U.S. Virgin Islands. Proc. Gulf Caribb. Fish. Inst. 42, 66–79.
Beets, J., and Friedlander, A. (1999). Evaluation of a conservation strategy: a spawning aggregation closure for red hind, Epinephelus guttatus, in the US Virgin Islands. Environ. Biol. Fish. 55, 91–98.
Bellingham, J. G., Streitlien, K., Overland, J., Rajah, S., Stein, P., Stannard, J., et al. (2000). An Arctic Basin observational capability using AUVs. Oceanography 13, 64–70. doi: 10.5670/oceanog.2000.36
Bingham, B., Kraus, N., Howe, B., Freitag, L., Ball, K., Koski, P., et al. (2012). Passive and active acoustics using an autonomous wave glider. J. Field Robot. 29, 911–923. doi: 10.1002/rob.21424
Brierley, A. S., Fernandes, P. G., Brandon, M. A., Armstrong, F., Millard, N. W., McPhail, S. D., et al. (2002). Antarctic krill under sea ice: elevated abundance in a narrow band just south of ice edge. Science 295, 1890–1892.
Brunoldi, M., Bozzini, G., Casale, A., Corvisiero, P., Grosso, D., Magnoli, N., et al. (2016). A permanent automated real-time passive acoustic monitoring system for bottlenose dolphin conservation in the Mediterranean Sea. PLoS One 11:e0145362. doi: 10.1371/journal.pone.0145362
Caldeira, R. M. A., Stegner, A., Couvelard, X., Araújo, I. B., Testor, P., and Lorenzo, A. (2014). Evolution of an oceanic anticyclone in the lee of Madeira Island: in situ and remote sensing survey. J. Geophys. Res. Oceans 119. doi: 10.1002/2013JC009493
Caress, D. W., Thomas, H., Kirkwood, W. J., McEwen, R., Henthorn, R., Clague, D. A., et al. (2008). “High-resolution multibeam, sidescan and subbottom surveys using the MBARI AUV D. Allan B.,” in Marine Habitat Mapping Technology for Alaska, Alaska Sea Grant College Program. eds H. G. Greene and J. R. Reynolds (Fairbanks: University of Alaska), 47–69.
Cherubin, L. M., Nemeth, R. S., and Idrisi, N. (2011). Flow and transport characteristics at an Epinephelus guttatus (red hind grouper) spawning aggregation site in St. Thomas (US Virgin Islands). Ecol. Model. 222, 3132–3148. doi: 10.1016/j.ecolmodel.2011.05.031
Claro, R., and Lindeman, K. C. (2003). Spawning aggregation sites of snapper and grouper species (Lutjanidae and Serranidae) on the insular shelf of Cuba. Gulf Caribb. Res. 14, 91–106.
Colin, P. L., Shapiro, D. Y., and Weiler, D. (1987). Aspects of the repro- duction of two groupers, Epinephelus guttatus and E. striatus, in the West Indies. Bull. Mar. Sci. 40, 220–230.
Corredor, J. E., and Morell, J. M. (2001). Seasonal variation of physical and biogeochemical features in eastern Caribbean surface water. J. Geophys. Res. 106, 4517–4525. doi: 10.1029/2000jc000291
Cowen, R. K., Paris, C. B., and Srinivasan, A. (2006). Scaling connectivity in marine populations. Science 311, 522–527. doi: 10.1126/science.1122039
Domeier, M. L., and Colin, P. L. (1997). Tropical reef fish spawning aggregations: defined and reviewed. Bul. Mar. Sci. 60, 698–726.
Dowdeswell, J. A., Evans, J., Mugford, R., Griffiths, G., McPhail, S., and Millard, N. (2008). Autonomous underwater vehicles (AUVs) and investigations of the ice–ocean interface in Antarctic and Arctic waters. J. Glaciol. 54, 661–672. doi: 10.3189/002214308786570773
Eklund, A. M., McClennal, D. B., and Harper, D. E. (2000). Black grouper aggregations in relation to protected areas within the Florida Keys National Marine Sanctuary. Bull. Mar. Sci. 66, 721–728.
Eriksen, C. C., Osse, T. J., Light, R. D., Wen, T., Lehman, T. W., Sabinet, P. L., et al. (2001). Seaglider: a long- range autonomous underwater vehicle for oceanographic research. IEEE J. Ocean. Eng. 26, 424–436. doi: 10.1109/48.972073
Erisman, B., Heyman, W., Kobara, S., Ezer, T., Pittman, S., Aburto-Oropeza, O., et al. (2017). Fish spawning aggregations: where well-placed management actions can yield big benefits for fisheries and conservation. Fish Fish. 18, 128–144. doi: 10.1111/faf.12132
Fernandes, P. G., Stevenson, P., Brierley, A. S., Armstrong, F., and Simmonds, E. J. (2003). Autonomous underwater vehicles: future platforms for fisheries acoustics. ICES J. Mar. Sci. 60, 684–691. doi: 10.1016/s1054-3139(03)00038-9
German, C. R., Yoerger, D. R., Jakuba, M., Shank, T. M., Langmuir, C. H., and Nakamura, K. (2008). Hydrothermal exploration with the autonomous benthic explorer. Deep Sea Res. I 55, 203–219. doi: 10.1016/j.dsr.2007.11.004
Gers, F. A., Schraudolph, N. N., and Schmidhuber, J. (2003). Learning precise timing with LSTM recurrent networks. J. Mach. Learn. Res. 3, 115–143.
Graham, A. G. C., Dutrieux, P., Vaughan, D. G., Nitsche, F. O., Gyllencreutz, R., Greenwood, S. L., et al. (2013). Seabed corrugations beneath an Antarctic ice shelf revealed by autonomous underwater vehicle survey: origin and implications for the history of pine island glacier. J. Geophys. Res. 118, 1356–1366. doi: 10.1002/jgrf.20087
Graves, A. (2012). Supervised Sequence Labelling with Recurrent Neural Networks. Berlin: Springer, 385.
Greene, C. H., Meyer-Gutbrod, E. L., McGarry, L. P., Hufnagle, L. C. Jr., Chu, D., McClatchie, S., et al. (2014). A wave glider approach to fisheries acoustics: transforming how we monitor the nation’s commercial fisheries in the 21st century. Oceanography 27, 168–174.
Griffiths, G. (2003). Technologies and Applications of Autonomous Underwater Vehicles. London: Taylor and Francis, 360.
Heyman, W. D., and Kjerfve, B. (2008). Characterization of transient multi-species reef fish spawning aggregations at Gladden Spit, Belize. Bull. Mar. Sci. 83, 531–551.
Ibrahim, A. K., Zhuang, H., Chérubin, L. M., Schärer Umpierre, M. T., Ali, A. M., Nemeth, R. S., et al. (2019). Classification of red hind grouper call types using random ensemble of stacked autoencoders. J. Acoust. Soc. Am. 146, 2155–2162. doi: 10.1121/1.5126861
Ibrahim, A. K., Chérubin, L. M., Zhuang, H., Schärer Umpierre, M. T., and Erdol, N. (2018a). Automatic classification of grouper species by their sounds using deep neural networks. J. Acoust. Soc. Am. 144:EL196. doi: 10.1121/1.5054911
Ibrahim, A. K., Zhuang, H., Chérubin, L. M., Schärer Umpierre, M. T., Dalgleish, F., Erdol, N., et al. (2018b). An approach for automatic classification of grouper vocalizations with passive acoustic monitoring. J. Acous. Soc. Am. 143, 666–676. doi: 10.1121/1.5022281
Jenkins, A., Dutrieux, P., Jacobs, S. S., McPhail, S. D., Perrett, J. R., Webb, A. T., et al. (2010). Observations beneath Pine Island Glacier in West Antarctica and implications for its retreat. Nat. Geosci. 3, 468–472. doi: 10.1038/ngeo890
Jossart, J., Nemeth, R. S., Primack, A., and Stolz, R. (2017). Extreme passive acoustic telemetry detection variability on a mesophotic coral reef, United States Virgin Islands. Mar. Biol. 164:180. doi: 10.1007/s00227-017-3213-y
Kadison, E., Nemeth, R. S., Herzlieb, S., and Blondeau, J. (2006). Temporal and spatial dynamics of Lutjanus cyanopterus and L. jocu (Pisces: Lutjanidae) spawning aggregations on a multi-species spawning site in the USVI. Rev. Biol. Trop. 54(Suppl. 3), 69–78.
Kobara, S., and Heyman, W. D. (2010). Sea bottom geomorphology of multi-species spawning aggregation sites in Belize. Mar. Ecol. Prog. Ser. 405, 231–242.
Kobara, S., Heyman, W. D., Pittman, S. J., and Nemeth, R. S. (2013). Biogeography of transient reef fish spawning aggregations in the Caribbean: a synthesis for future research and Management. Ocean. Mar. Biol. Ann. Rev. 51, 281–326.
Locascio, J. V., and Mann, D. A. (2008). Diel patterns of fish sound production in Charlotte Harbor, FL. Trans. Am. Fish Soc. 137, 606–615. doi: 10.1577/t06-069.1
Luczkovich, J. J., Mann, D. A., and Rountree, R. A. (2008). Passive acoustics as a tool in fisheries science. Trans. Am. Fish Soc. 137, 533–541. doi: 10.1577/t06-258.1
Luczkovich, J. J., Sprague, M. W., Johnson, S. E., and Pullinger, R. C. (1999). Delimiting spawning areas of weakfish Cynoscion regalis (Family Sciaenidae) in Pamlico Sound, North Carolina using passive acoustic surveys. Bioacoustics 10, 143–160. doi: 10.1080/09524622.1999.9753427
Manley, J., Willcox, S., and Westwood, R. (2009). The Wave Glider: an energy harvesting unmanned surface vehicle. Mar. Technol. Rep. 27–31.
Mann, D. A., and Locascio, J. V. (2008). Acoustic communication in fishes. Bioacoustics 17, 43–45. doi: 10.1080/09524622.2008.9753758
Mann, D. A., Locascio, J. V., Coleman, F. C., and Koenig, C. C. (2009). Goliath grouper Epinephelus itajara sound production and movement patterns on aggregation sites. Endang. Spec. Res. 7, 229–236. doi: 10.3354/esr00109
Mann, D. A., Locascio, J. V., Scharer, M. T., Nemeth, M. I., and Appeldoorn, R. S. (2010). Sound production by red hind (Epinephelus guttatus) in spatially segregated spawning aggregations. Aquat. Biol. 10, 149–154. doi: 10.3354/ab00272
Mann, D. A., and Lobel, P. S. (1995). Passive acoustic detection of sounds produced by the damselfish, Dascyllus albisella (Pomacentridae). Bioacoustics 6, 199–213. doi: 10.1080/09524622.1995.9753290
Marques, T. A., Thomas, L., Martin, S. W., Mellinger, D. K., Ward, J. A., Moretti, D. J., et al. (2013). Estimating animal population density using passive acoustics. Biol. Rev. 88, 287–309. doi: 10.1111/brv.12001
Matsumoto, H., Haxel, J. H., Dziak, R. P., Bohnenstiehl, D. R., and Embley, R. W. (2011). Mapping the sound field of an erupting submarine volcano using an acoustic glider. J. Acoust. Soc. Am. 129, EL94–EL99. doi: 10.1121/1.3547720
Miller, J. H., Nystuen, J. A., and Bradley, D. L. (2008). Ocean noise budgets. Bioacoustics 17, 133–136. doi: 10.1021/acs.accounts.5b00282
Montie, E. W., Kehrer, C., Yost, J., Brenkert, K., O’Donnell, T., and Denson, M. R. (2016). Long-term monitoring of captive red drum Sciaenops ocellatus reveals that calling incidence and structure correlate with egg deposition. J. Fish. Biol. 88, 1776–1795. doi: 10.1111/jfb.12938
Montie, E. W., Hoover, M., Kehrer, C., Yost, J., Brenkert, K., O’Donnell, T., et al. (2017). Acoustic monitoring indicates a correlation between calling and spawning in captive spotted seatrout (Cynoscion nebulosus). PeerJ 5:e2944. doi: 10.7717/peerj.2944
Mumby, P. J., Dahlgren, C. P., Harborne, A. R., Kappe, C. V., Micheli, F., Brumbaugh, D. R., et al. (2006). Fishing, trophic cascades, and the process of grazing on coral reefs. Science 311, 98–101. doi: 10.1126/science.1121129
Myrberg, A. A. Jr., and Lugli, M. (2006). “Reproductive behavior and acoustical interactions,” in Communication in Fishes, Vol. I, eds F. Ladich, S. P. Colin, P. Moller, and B. G. Kapoor (Enfield: Science Publishers), 149–1176.
Nelson, M. D., Koenig, C. C., Coleman, F. C., and Mann, D. A. (2011). Sound production of red grouper Epinephelus morio on the West Florida Shelf. Aquat. Biol. 12, 97–108. doi: 10.1111/jfb.12500
Nemeth, R. S. (2005). Population characteristics of a recovering US Virgin Islands red hind spawning aggregation following protection. Mar. Ecol. Prog. Ser. 286, 81–97. doi: 10.3354/meps286081
Nemeth, R. S. (2009). “Chapter 4: Dynamics of reef fish and decapod crustacean spawning aggregations: underlying mechanisms, habitat linkages and trophic interactions,” in Ecological Connectivity Among Tropical Coastal Ecosystems, ed. I. Nagelkerken (Berlin: Springer), 73–134. doi: 10.1007/978-90-481-2406-0_4
Nemeth, R. S. (2012a). “Ecosystem aspects of spawning aggregations. Chapter 2,” in Reef Fish Spawning Aggregations: Biology, Research and Management, eds Y. Sadovy de Mitcheson and P. Colin (Berlin: Springer), 21–56.
Nemeth, R. S. (2012b). “Species Case studies: red hind – Epinephelus guttatus. Chapter 12.3,” in Reef Fish Spawning Aggregations: Biology, Research and Management, eds Y. Sadovy and P. Colin (Berlin: Springer), 412–417.
Nemeth, R. S., Blondeau, J., Herzlieb, S., and Kadison, E. (2007). Spatial and temporal patterns of movement and migration at spawning aggregations of red hind, Epinephelus guttatus, in the U.S. Virgin Islands. Environ. Biol. Fish. 78, 365–381. doi: 10.1007/s10641-006-9161-x
Nemeth, R. S., Kadison, E., Blondeau, J., and Brown Peterson, N. J. (2020). Reproductive biology and behavior associated with a spawning aggregation of the yellowfin grouper Mycteroperca venenosa in the US Virgin Islands. Bull. Mar. Sci. 96. doi: 10.5543/bms.2019.0028
Nemeth, R. S., Kadison, E., Herzlieb, S., Blondeau, J., and Whiteman, E. (2006). “Status of a yellowfin grouper (Mycteroperca venenosa) spawning aggregation in the US Virgin Islands with notes on other species,” in Proceedings of the 57th Gulf Caribbean Fish Institute, Vol. 57(St. Petersburg, FL), 543–558.
Nicholls, K. W., Abrahamsen, E. P., Buck, J. J. H., Dodd, P. A., Goldblatt, C., Griffiths, G., et al. (2006). Measurements beneath an Antarctic ice shelf using an autonomous underwater vehicle. Geophys. Res. Lett. 33:L08612.
Niewiadomska, K., Claustre, H., Prieur, L., and d’Ortenzio, F. (2008). Submesoscale physical- biogeochemical coupling across the Ligurian current (northwestern Mediterranean) using a bio-optical glider. Limnol. Oceanogr. 53, 2210–2225. doi: 10.4319/lo.2008.53.5_part_2.2210
Ohman, M. D., Rudnick, D. L., Chekalyuk, A., Davis, R. E., Feely, R. A., Kahru, M., et al. (2013). Autonomous ocean measurements in the California current ecosystem. Oceanography 26, 18–25. doi: 10.1371/journal.pone.0101268
Olsen, D. A., and LaPlace, J. A. (1979). A study of a Virgin Islands grouper fishery based on a breeding aggregation. Gulf Caribb. Fish. Inst. Proc. 31, 130–144.
Rowell, T., Nemeth, R., Schärer, M., and Appeldoorn, R. (2015). Fish sound production and acoustic telemetry reveal behaviors and spatial patterns associated with spawning aggregations of two Caribbean groupers. Mar. Ecol. Prog. Ser. 518, 239–254. doi: 10.3354/meps11060
Rowell, T. J., Appeldoorn, R. S., Rivera, J. A., Mann, D. A., Kellison, T., Nemeth, M., et al. (2011). Use of passive acoustics to map grouper spawning aggregations, with emphasis on red hind, Epinephelus guttatus, off western Puerto Rico. Proc. Gulf. Caribb. Fish Inst. 63, 139–142.
Rowell, T. J., Schärer, M. T., and Appeldoorn, R. S. (2018). Description of a new sound produced by nassau grouper at spawning aggregation sites. Gulf Caribb. Res. 29, GCFI22–GCFI26. doi: 10.18785/gcr.2901.12
Rowell, T. J., Schärer, M. T., Appeldoorn, R. S., Nemeth, M. I., Mann, D. A., and Rivera, J. A. (2012). Sound production as an indicator of red hind density at a spawning aggregation. Mar. Ecol. Prog. Ser. 462, 241–250. doi: 10.3354/meps09839
Rudnick, D. L., Davis, R. E., Eriksen, C. C., Fratantoni, D. M., and Perry, M. J. (2004). Underwater gliders for ocean research. Mar. Technol. Soc. J. 38, 73–84.
Sadovy, Y. (1997). The case of the disappearing grouper: Epinephelus striatus (Pisces: Serranidae). J. Fish Biol. 46, 961–976.
Sadovy, Y., Rosario, A., and Roman, A. (1994). Reproduction in an aggregating grouper, the red hind, Epinephelus guttatus. Environ. Biol. Fish 41, 269–286. doi: 10.1111/jfb.12555
Sadovy De Mitcheson, Y., Cornish, A., Domeier, M., Colin, P., Russel, M., and Lindeman, K. C. (2008). A global baseline for spawning aggregations of reef fishes. Conserv. Biol. 22, 1233–1244. doi: 10.1111/j.1523-1739.2008.01020.x
Sak, H., Senior, A., and Beaufays, F. (2014). “Long short-term memory recurrent neural network architectures for large scale acoustic modeling,” in Proceedings of the 15th Annual Conference of the International Speech Communication, Singapore, 1–5.
Sala, E., Ballesteros, E., and Starr, R. M. (2001). Rapid decline of nassau grouper spawning aggregations in belize: fishery management and conservation needs. Fisheries 26, 23–30. doi: 10.1577/1548-8446(2001)026<0023:rdongs>2.0.co;2
Sammelmann, G. S. (2002). Personal Computer Shallow Water Acoustic Tool-Set (PC SWAT) 7.0: Low Frequency Propagation and Scattering. Technical Report. Panama: FL: Naval Surface Warfare Center.
Schärer, M. T., Nemeth, M. I., Mann, D. A., Locascio, J. V., Appeldoorn, R. S., and Rowell, T. J. (2012a). Sound production and reproductive behavior of yellowfin grouper (Mycteroperca venenosa) (Serranidae), at a spawning aggregation. Copeia 1, 136–145.
Schärer, M. T., Rowell, T. J., Nemeth, M. I., and Appeldoorn, R. S. (2012b). Sound production associated with reproductive behavior of Nassau grouper Epinephelus striatus at spawning aggregations. Endanger. Spec. Res. 19, 29–38.
Schärer, M. T., Nemeth, M. I., Rowell, T. J., and Appeldoorn, R. S. (2014). Sounds associated with the re-productive behavior of the black grouper (Mycteroperca bonaci). Mar. Biol. 161, 141–147. doi: 10.1007/s00227-013-2324-3
Schaärer, M. T., Rowell, T. J., Nemeth, M. I., and Appeldoorn, R. S. (2013). Sound production associated with reproductive behavior of Nassau grouper Epinephelus striatus at spawning aggregations. Endanger. Species Res. 19, 29–38. doi: 10.3354/esr00457
Shapiro, D. Y., Sadovy, Y., and McGehee, M. A. (1993). Size, composition, and spatial structure of the annual spawning aggregation of the red hind. Epinepehlus guttatus (Pisces: Serranidae). Copeia 1993, 399–406. doi: 10.2307/1447138
Smith, C. L. (1972). A spawning aggregation of Nassau grouper, Epinephelus striatus (Block). Trans. Am. Fish. Soc. 101, 225–261. doi: 10.1111/j.1523-1739.2008.01020.x
Wadhams, P., Wilkinson, J. P., and McPhail, S. D. (2006). A new view of the underside of Arctic sea ice. Geophys. Res. Lett. 33:L04501.
Wall, C. C., Lembke, C., and Mann, D. A. (2012). Shelf-scale mapping of sound production by fishes in the eastern Gulf of Mexico using autonomous glider technology. Mar. Ecol. Prog. Ser. 449, 55–64. doi: 10.3354/meps09549
Wall, C. C., Mann, D. A., Lembke, C., Taylor, C., He, R., and Kellison, T. (2017). Mapping the soundscape off the Southeastern USA by using passive acoustic glider technology. Mar. Coast. Fish. 9, 23–37. doi: 10.1080/19425120.2016.1255685
Wall, C. C., Simard, P., Lindemuth, M., Lembke, C., Naar, D. F., Hu, C., et al. (2014). Temporal and spatial mapping of Red Grouper Epinephelus morio sound production. J. Fish Biol. 85, 1469–1487. doi: 10.1111/jfb.12500
Walters, S., Lowerre-Barbieri, S., Bickford, J., and Mann, D. (2009). Using a passive acoustic survey to identify spotted seatrout spawning sites and associated habitat in Tampa Bay, Florida. Trans. Am. Fish Soc. 138, 88–98. doi: 10.1577/t07-106.1
Willcox, S., Manley, J., and Wiggins, S. (2009). The Wave Glider, an energy harvesting autonomous surface vessel. Sea Technol. 2009, 29–31.
Yoerger, D. R., Bradley, A. M., Jakuba, M., German, C. R., Shank, T., and Tivey, M. (2007). Autonomous and remotely operated vehicle technology for hydrothermal vent discovery, exploration, and sampling. Oceanography 20, 152–161. doi: 10.5670/oceanog.2007.89
Yoerger, D. R., Bradley, A. M., Walden, B. B., Singh, H., and Bachmayer, R. (1998). Surveying a subsea lava flow using the Autonomous Benthic Explorer (ABE). Int. J. Syst. Sci. 10, 1031–1044. doi: 10.1080/00207729808929596
Zayas, C. (2019). Red hind Epinephelus guttatus Vocal Repertoire Characterization, Temporal Patterns and Call Detection With Micro Accelerometers. MS Thesis. University of Puerto Rico: Mayagüez, PR, 68.
Keywords: spawning aggregation, grouper, wave glider, machine learning, fish sounds
Citation: Chérubin LM, Dalgleish F, Ibrahim AK, Schärer-Umpierre MT, Nemeth RS, Matthews A and Appeldoorn R (2020) Fish Spawning Aggregations Dynamics as Inferred From a Novel, Persistent Presence Robotic Approach. Front. Mar. Sci. 6:779. doi: 10.3389/fmars.2019.00779
Received: 14 December 2018; Accepted: 03 December 2019;
Published: 10 January 2020.
Edited by:
Leonard Pace, Schmidt Ocean Institute, United StatesReviewed by:
William David Heyman, LGL (United States), United StatesChristoph Waldmann, University of Bremen, Germany
Copyright © 2020 Chérubin, Dalgleish, Ibrahim, Schärer-Umpierre, Nemeth, Matthews and Appeldoorn. This is an open-access article distributed under the terms of the Creative Commons Attribution License (CC BY). The use, distribution or reproduction in other forums is permitted, provided the original author(s) and the copyright owner(s) are credited and that the original publication in this journal is cited, in accordance with accepted academic practice. No use, distribution or reproduction is permitted which does not comply with these terms.
*Correspondence: Laurent M. Chérubin, bGNoZXJ1YmluQGZhdS5lZHU=