 Jessica V. Redfern
 Elizabeth A. Becker
 Thomas J. Moore
- 1Marine Mammal and Turtle Division, Southwest Fisheries Science Center, National Marine Fisheries Service, National Oceanic and Atmospheric Administration, La Jolla, CA, United States
- 2Anderson Cabot Center for Ocean Life, New England Aquarium, Boston, MA, United States
Assessments of ship-strike risk for large whales typically use a single year of ship traffic data and averaged predictions of species distributions. Consequently, they do not account for variability in ship traffic or species distributions. Variability could reduce the effectiveness of static management measures designed to mitigate ship-strike risk. We explore the consequences of interannual variability on ship-strike risk using multiple years of both ship traffic data and predicted fin, humpback, and blue whale distributions off California. Specifically, risk was estimated in four regions that are important for ship-strike risk management. We estimated risk by multiplying the predicted number of whales by the distance traveled by ships. To overcome the temporal mismatch between the available ship traffic and whale data, we classified the ship traffic data into nearshore and offshore traffic scenarios using the percentage of ship traffic traveling more than 24 nmi from the mainland coast, which was the boundary of a clean fuel rule implemented in 2009 that altered ship traffic patterns. We found that risk for fin and humpback whale populations off California increased as these species recovered from whaling. We also found that broad-scale, northward shifts in blue whale distributions throughout the North Pacific, likely in response to changes in oceanographic conditions, were associated with increased ship-strike risk off northern California. The magnitude of ship-strike risk for fin, humpback, and blue whales was influenced by the ship traffic scenarios. Interannual variability in predicted whale distributions also influenced the magnitude of ship-strike risk, but generally did not change whether the nearshore or offshore traffic scenario had higher risk. The consistency in the highest risk from the traffic scenarios likely occurred because areas containing the highest predicted number of whales were generally the same across years. The consistency in risk from the traffic scenarios suggests that static spatial management measures (e.g., changing shipping lanes, creating areas to be avoided, and seasonal speed reductions) can provide an effective means of mitigating risk resulting from ship traffic variability off California.
Introduction
Ship strikes are one of the largest sources of human-caused mortality for fin (Balaenoptera physalus), humpback (Megaptera novaeangliae), and blue (B. musculus) whales on the United States West Coast (Carretta et al., 2017). The risk of ships striking whales (hereafter, ship-strike risk) has been assessed for these species in several regions: for all three species off the entire United States West Coast (Rockwood et al., 2017) and southern California (Redfern et al., 2013, 2019), for blue whales off the entire United States West Coast (Hazen et al., 2017; Abrahms et al., 2019b), and for humpback whales off San Francisco (Dransfield et al., 2014). Many of these risk assessments and those conducted for various locations around the world (e.g., Sri Lanka and Canada; Williams and O’Hara, 2010; Priyadarshana et al., 2016) use a single year of ship traffic data and predictions of whale distributions that are averaged over several years. Redfern et al. (2013) and Redfern et al. (2019) are exceptions because they used more than one year of ship traffic data; Hazen et al. (2017) and Abrahms et al. (2019b) developed near real-time tools to predict blue whale distributions. However, most ship-strike risk assessments do not account for variability in ship traffic, species distributions, or both.
Recent studies suggest variability in both ship traffic and whale distributions off California. An analysis of ship traffic off California between 2008 and 2015 suggested that air pollution regulations implemented at both state and international levels changed the primary routes used by ships (Moore et al., 2018). Specifically, the California Air Resources Board implemented a rule on July 1, 2009 that required ships to use cleaner burning fuels when traveling within 24 nmi of the mainland coast. After implementation of the rule, ships began traveling farther offshore (Figure 1 and Table 1) to reduce the amount of time spent using the cleaner fuels, which were more expensive. Use of offshore routes was found for the entire coast of California (Moore et al., 2018) and for the major California ports: San Francisco Bay (Jensen et al., 2015) and Los Angeles/Long Beach (McKenna et al., 2012).
Figure 1. Maps of distance traveled (km/day) by ships from July–December in a 10 × 10 km grid. Analyses were conducted in four regions that are named from north to south as north, San Francisco, central, and south. Traffic was classified into nearshore (2008 and 2015; defined as having more traffic within the July 2009 clean fuel boundary compared to offshore traffic) and offshore (2009–2011; defined as a majority of traffic outside the July 2009 clean fuel boundary) scenarios. Classification of the 2012–2014 traffic was done on a region-by-region basis.
Table 1. The percentage of traffic (i.e., the sum of the distance traveled per day in each grid cell) that occurs more than 24 nmi from the mainland coast (i.e., the boundary established by the California Air Resources Board as part of the clean fuel rule implemented on July 1, 2009) in each region.
The boundary for clean fuel use was extended to include the area around the Channel Islands in the Southern California Bight on December 1, 2011. The International Maritime Organization (IMO) also increased the international standards for clean fuels in the U.S. Exclusive Economic Zone on August 1, 2012, which brought the international standards closer to the California standards. Ship traffic off southern California showed the strongest change in association with these changes in fuel regulations (Moore et al., 2018). From 2012 to 2014, some traffic began to return to the original nearshore routes and offshore traffic shifted beyond the new clean fuel boundary (Figure 1 and Table 1). Ship traffic off San Francisco showed similar, but smaller changes, while traffic in the remaining areas primarily stayed offshore (Figure 1 and Table 1). The IMO and California clean fuel standards were similar by 2015 and ship traffic in all regions was similar to the nearshore patterns observed in 2008 (Figure 1 and Table 1).
Species abundances and distributions have also changed off California. There is strong evidence that fin and humpback whale abundance has increased at broad scales in the North Pacific (Barlow et al., 2011; Moore and Barlow, 2011), suggesting that current levels of ship strikes do not negatively affect these species at these broad scales. However, ship strikes may be an issue at regional scales. Specifically, populations of humpback whales that breed off Mexico and Central America are listed as Threatened and Endangered, respectively, on the United States Endangered Species List. Both populations feed off California and it is possible that ship strikes could have negative population-level consequences. It is also possible that a unique population of fin whales remains year-round in the southern California Bight (Forney and Barlow, 1998; Calambokidis et al., 2015) and that ship strikes may impact this population.
There is no evidence that the abundance of blue whales in the North Pacific is increasing and it has been suggested that this population may have reached carrying capacity (Monnahan et al., 2015). However, it has also been suggested that blue whales are shifting farther north, potentially in response to changing ocean conditions (Calambokidis et al., 2009). Consequently, abundance may be increasing off British Columbia and in the Gulf of Alaska, but decreasing off California. Interannual variability in species distributions was also identified as an important source of uncertainty in habitat models for fin, blue, and humpback whales built using line-transect survey data (Forney et al., 2012) and telemetry data (Hazen et al., 2017).
Static management measures, which include changing shipping lanes and establishing areas to be avoided, are commonly used to mitigate ship-strike risk. For example, the International Maritime Organization (IMO) adopted five measures between 2002 and 2009 that relocate ship traffic in waters off eastern North America to minimize the co-occurrence of right whales and ships (Silber et al., 2012). Traffic separation schemes were established by the IMO for the major California ports and are reflected in the dominant ship traffic patterns (i.e., the darkest blue color off Southern California and San Francisco in the 2008 map in Figure 1). These lanes were modified in 2013 to reduce ship-strike risk. Voluntary and incentivized speed reductions have also been implemented in these traffic separation schemes to mitigate ship-strike risk (e.g., Freedman et al., 2017) because studies (e.g., Conn and Silber, 2013) have shown that the probability of a fatal ship strike increases at higher ship speeds. Voluntary shipping lanes have also been used to manage ship traffic in National Marine Sanctuaries (e.g., Monterey Bay National Marine Sanctuary) and off southern California. Interannual variability in species distributions could reduce the effectiveness of static management measures designed to reduce ship-strike risk. We used ship traffic data and whale distributions off California to explore the consequences of interannual variability on ship-strike risk.
Materials and Methods
Ship Traffic Data
Automatic Identification Systems (AIS) are maritime tracking systems that were adopted by the IMO and were initially required (December 31, 2004) on international voyages for all ships ≥300 gross tons, domestic voyages for cargo vessels ≥500 gross tons, and on all passenger ships (International Maritime Organization [IMO], 2014). The type and range of ships required to use AIS has expanded since this time (for example, see1). Data include dynamic information, such as ship position, speed, and course, and static information, such as ship identifier, type, and dimensions. Data obtained from the US Coast Guard’s terrestrial Nationwide Automatic Identification System extend throughout the U.S. exclusive economic zone (i.e., out to 200 nmi) because the system was designed to improve navigational safety, search and rescue, and maritime security. However, the amount of data received may decrease farther from shore due to transmission loss.
Moore et al. (2018) analyzed an 8-year time series of terrestrial AIS data (2008–2015). We followed the methodology of Moore et al. (2018) to summarize the cumulative distance traveled by ships between July and December each year in a 10 × 10 km grid. We selected ships greater than 80 m in length and used only ships traveling at a speed over ground ≥2.5 knots to ensure that only underway ships were included in the analyses. A radius of approximately 5.6 km from the center of a grid cell was used to calculate the cumulative distance traveled because the area of the resulting circle is the same as the area of the grid cells. We divided the July–December cumulative distance traveled in each grid cell by the number of days of AIS data collection to account for data gaps (e.g., missing data in 2008 and 2010).
Whale Distributions
We used predictions of fin, humpback, and blue whale distributions from models produced by Becker et al. (2016). Becker et al. (2016) developed whale-habitat models using 7 years of line-transect survey data collected by NOAA Fisheries’ Southwest Fisheries Science Center between July and December (i.e., 1991, 1993, 1996, 2001, 2005, 2008, and 2009). Habitat variables were derived from in situ and remotely sensed oceanographic data for humpback whales and output from a Regional Ocean Modeling System for fin and blue whales. Data from the 2009 survey could not be used in the humpback whale models because the survey and, concomitantly, the in situ oceanographic sampling did not cover the entire study area.
Becker et al. (2016) used generalized additive models (GAMs) (Wood, 2006) to relate habitat variables to the number of whales in transect segments that were approximately 5 km. They fit GAMs in the R (version 3.1.1; R Core Team, 2014) package “mgcv” (version 1.8–3; Wood, 2011). The models were used to predict the number of whales in an approximately 10 × 10 km grid for distinct 8-day composites covering the entire survey period. We use the annual average of these predictions and the average across all years of survey data in our analyses (hereafter, annual and mean predictions). The ship-traffic grid was different from the whale distribution grid. Consequently, the predicted whale densities were overlaid on the ship traffic grid and used to derive the predicted number of whales in each ship traffic grid cell. This approach preserved the total abundance in the study area.
Ship-Strike Risk
We assess risk in four regions (Figure 1) that are important for ship-strike risk management. In particular, the southern and San Francisco regions contain the major California ports and efforts have been made in both regions to mitigate ship-strike risk. The central region contains traffic traveling between California ports, while the northern region contains traffic traveling to ports in the Pacific Northwest. The regions extend from the shore to 250 km beyond the shelf edge, which is an important topographic feature for many species of baleen whales because of its role in concentrating their prey (e.g., Fiedler et al., 1998; Croll et al., 2005). The shelf edge was derived from a global, seafloor geomorphic features map (Harris et al., 2014). The offshore boundary of the regions encompasses a majority of California ship traffic (approximately 90–95%) and reduces the potential for bias from AIS signal decay farther offshore.
Latitudinal breaks for each region were selected using biogeographical boundaries (i.e., Point Conception for the boundary between the southern and central regions) and biologically important areas (BIAs) for blue and humpback whales (BIAs have not yet been defined for fin whales). These BIAs were defined by Calambokidis et al. (2015) and represent areas where concentrations of feeding animals were observed in multiple years of non-systematic, coastal surveys designed to maximize encounters with blue and humpback whales for photo-identification and tagging studies.
We estimate ship-strike risk by multiplying the predicted number of whales by the mean daily kilometers of ship traffic within a grid cell. Consequently, we are defining risk as the co-occurrence between whales and ships, as has been done for multiple species (e.g., Vanderlaan et al., 2009; Williams and O’Hara, 2010; Redfern et al., 2013). There is a temporal mismatch between the ship traffic and whale data available off California: ship traffic data are available from 2008 to 2015, while whale distribution data are available from 1991 to 2009. To overcome this temporal mismatch, we classified the time series of ship traffic data into traffic scenarios using the percentage of ships traveling more than 24 nmi from the mainland coast (i.e., the 2009 clean fuel boundary).
The percentage of traffic traveling more than 24 nmi from the mainland coast was the lowest in 2008 and 2015 in all four regions (Table 1). We used the distance traveled in each grid cell for these 2 years to define a nearshore traffic scenario. The percentage of traffic traveling more than 24 nmi from the mainland coast generally increased from 2009 to 2011 (Table 1). Consequently, we used the ship traffic data from 2009 to 2011 to define an offshore traffic scenario. Traffic patterns vary by region in 2012–2014 and cannot be assigned to a single scenario (Table 1).
The total distance traveled by ships decreased throughout the time series of ship traffic data. Consequently, we had to correct for this decrease in distance traveled to meaningfully combine years of ship traffic data. Specifically, we calculated a correction factor by dividing the kilometers traveled in each region by the mean kilometers traveled in each region over all years. A correction factor greater than one implied that the distance traveled in that year was higher than the mean for that region. We divided the distance traveled by ships in each grid cell by this correction factor. Ship speeds also decreased through the time series of ship traffic data (Moore et al., 2018). Consequently, we cannot meaningfully include ship speed in our definition of ship-strike risk.
We initially assessed the risk associated with the ship traffic scenarios using mean predicted whale distributions (i.e., the average of the predictions across all years of survey data). In particular, risk associated with the nearshore traffic scenario was defined by the mean and standard error of the risk in 2008 and 2015 (i.e., risk in each year was calculated as the mean predicted number of whales multiplied by the distance traveled by ships). The risk associated with the offshore traffic scenario was defined by the mean and standard error of the risk in 2009, 2010, and 2011. We also calculated the mean and standard error of the risk in 2012, 2013, and 2014, but classify its association with the traffic scenarios on a region-by-region basis. To compare risk among regions, we summed the risk for all grid cells in each region and divided by the area of the region. We compared risk in the traffic scenarios and calculated the percent change in risk for the nearshore versus offshore scenarios and nearshore versus 2012–2014 traffic scenarios. Finally, we mapped risk for the nearshore and offshore traffic scenarios using mean predicted whale distributions and the 2008 (representative of the nearshore scenario) and 2010 (representative of the offshore scenario) ship traffic data.
Risk calculated using the mean whale distributions was compared to risk derived from the annual predictions from the Becker et al. (2016) models to understand how interannual variability in species distributions affects risk. Interannual variability in locations containing the highest predicted number of whales (Figure 2) was assessed using the number of years (7 years for fin and blue whales; 6 years for humpback whales) the prediction in each grid cell was among the highest 5% of all predictions. These analyses were conducted using all whale predictions (i.e., from the coast of California out to 300 nmi). Changes in predicted abundance are not included in this metric because the highest 5% of predictions are calculated for each year. This metric identifies areas that consistently contained the highest predicted number of whales, areas that never contained the highest predicted numbers, and areas of variability.
Figure 2. Maps of annual and mean predicted species distributions for (A) fin, (B) humpback, and (C) blue whales. Habitat variables were derived from in situ and remotely sensed oceanographic data for humpback whales and output from a Regional Ocean Modeling System for fin and blue whales. Data from the 2009 survey could not be used in the humpback whale models because the survey and, concomitantly, the in situ oceanographic sampling did not cover the entire study area. Surveys were only conducted off California in 1991 and 1993; consequently, predictions of humpback whale distributions could not be made off Oregon and Washington in these 2 years. Other differences in the study area boundary for humpback whales and missing predictions within the study area (white grid cells) arise from gaps in oceanographic sampling. The highest 2, 5, 10, …, and 40% of predicted values were calculated using the mean predicted densities. Data from all years were categorized using the values from the mean to show changes in density among years.
To assess the effect of variability in whale distributions on risk, we calculated the percent change in risk for the nearshore versus offshore traffic scenarios for each species, region, and survey year (i.e., a total of 80 calculations). Finally, we estimated the change in the total risk experienced by each whale population since the start of the survey period. Specifically, we looked at the ratio of the risk in each survey year to the risk at the start of the survey period (i.e., 1991) for the traffic scenario (i.e., nearshore or offshore) resulting in the highest risk for each species in each region.
Results
The region that had the highest density for each species also had the highest mean ship-strike risk (i.e., risk assessed using the mean of the predicted whale distributions; Figure 3). In particular, density and mean risk were highest for fin whales in the central region, for humpback whales off San Francisco, and for blue whales in the south. However, the magnitude of the mean risk within a region was influenced by the ship traffic scenarios (Figures 3, 4, and Table 2). Interannual variability in predicted whale distributions also influenced the magnitude of ship-strike risk, but generally did not change the effect of the traffic scenarios on risk (Figure 5). Specifically, interannual variability did not change whether the nearshore or offshore traffic scenario had higher risk.
Figure 3. The scenarios associated with the 2008–2015 ship traffic (i.e., nearshore or offshore; 2012–2014 was classified as nearshore or offshore on region-by-region basis) were defined using a boundary that was 24 nmi from the mainland coast (see text for details). The ship traffic scenarios influenced ship-strike risk (predicted number of whales multiplied by the km/day traveled by ships) for fin, humpback, and blue whales in each region. The risk shown here was calculated using the mean predicted whale distributions. The standard error of the mean risk was calculated using the years of ship traffic data in each scenario. The mean predicted whale density (whales per 100 km2) in each region is also shown.
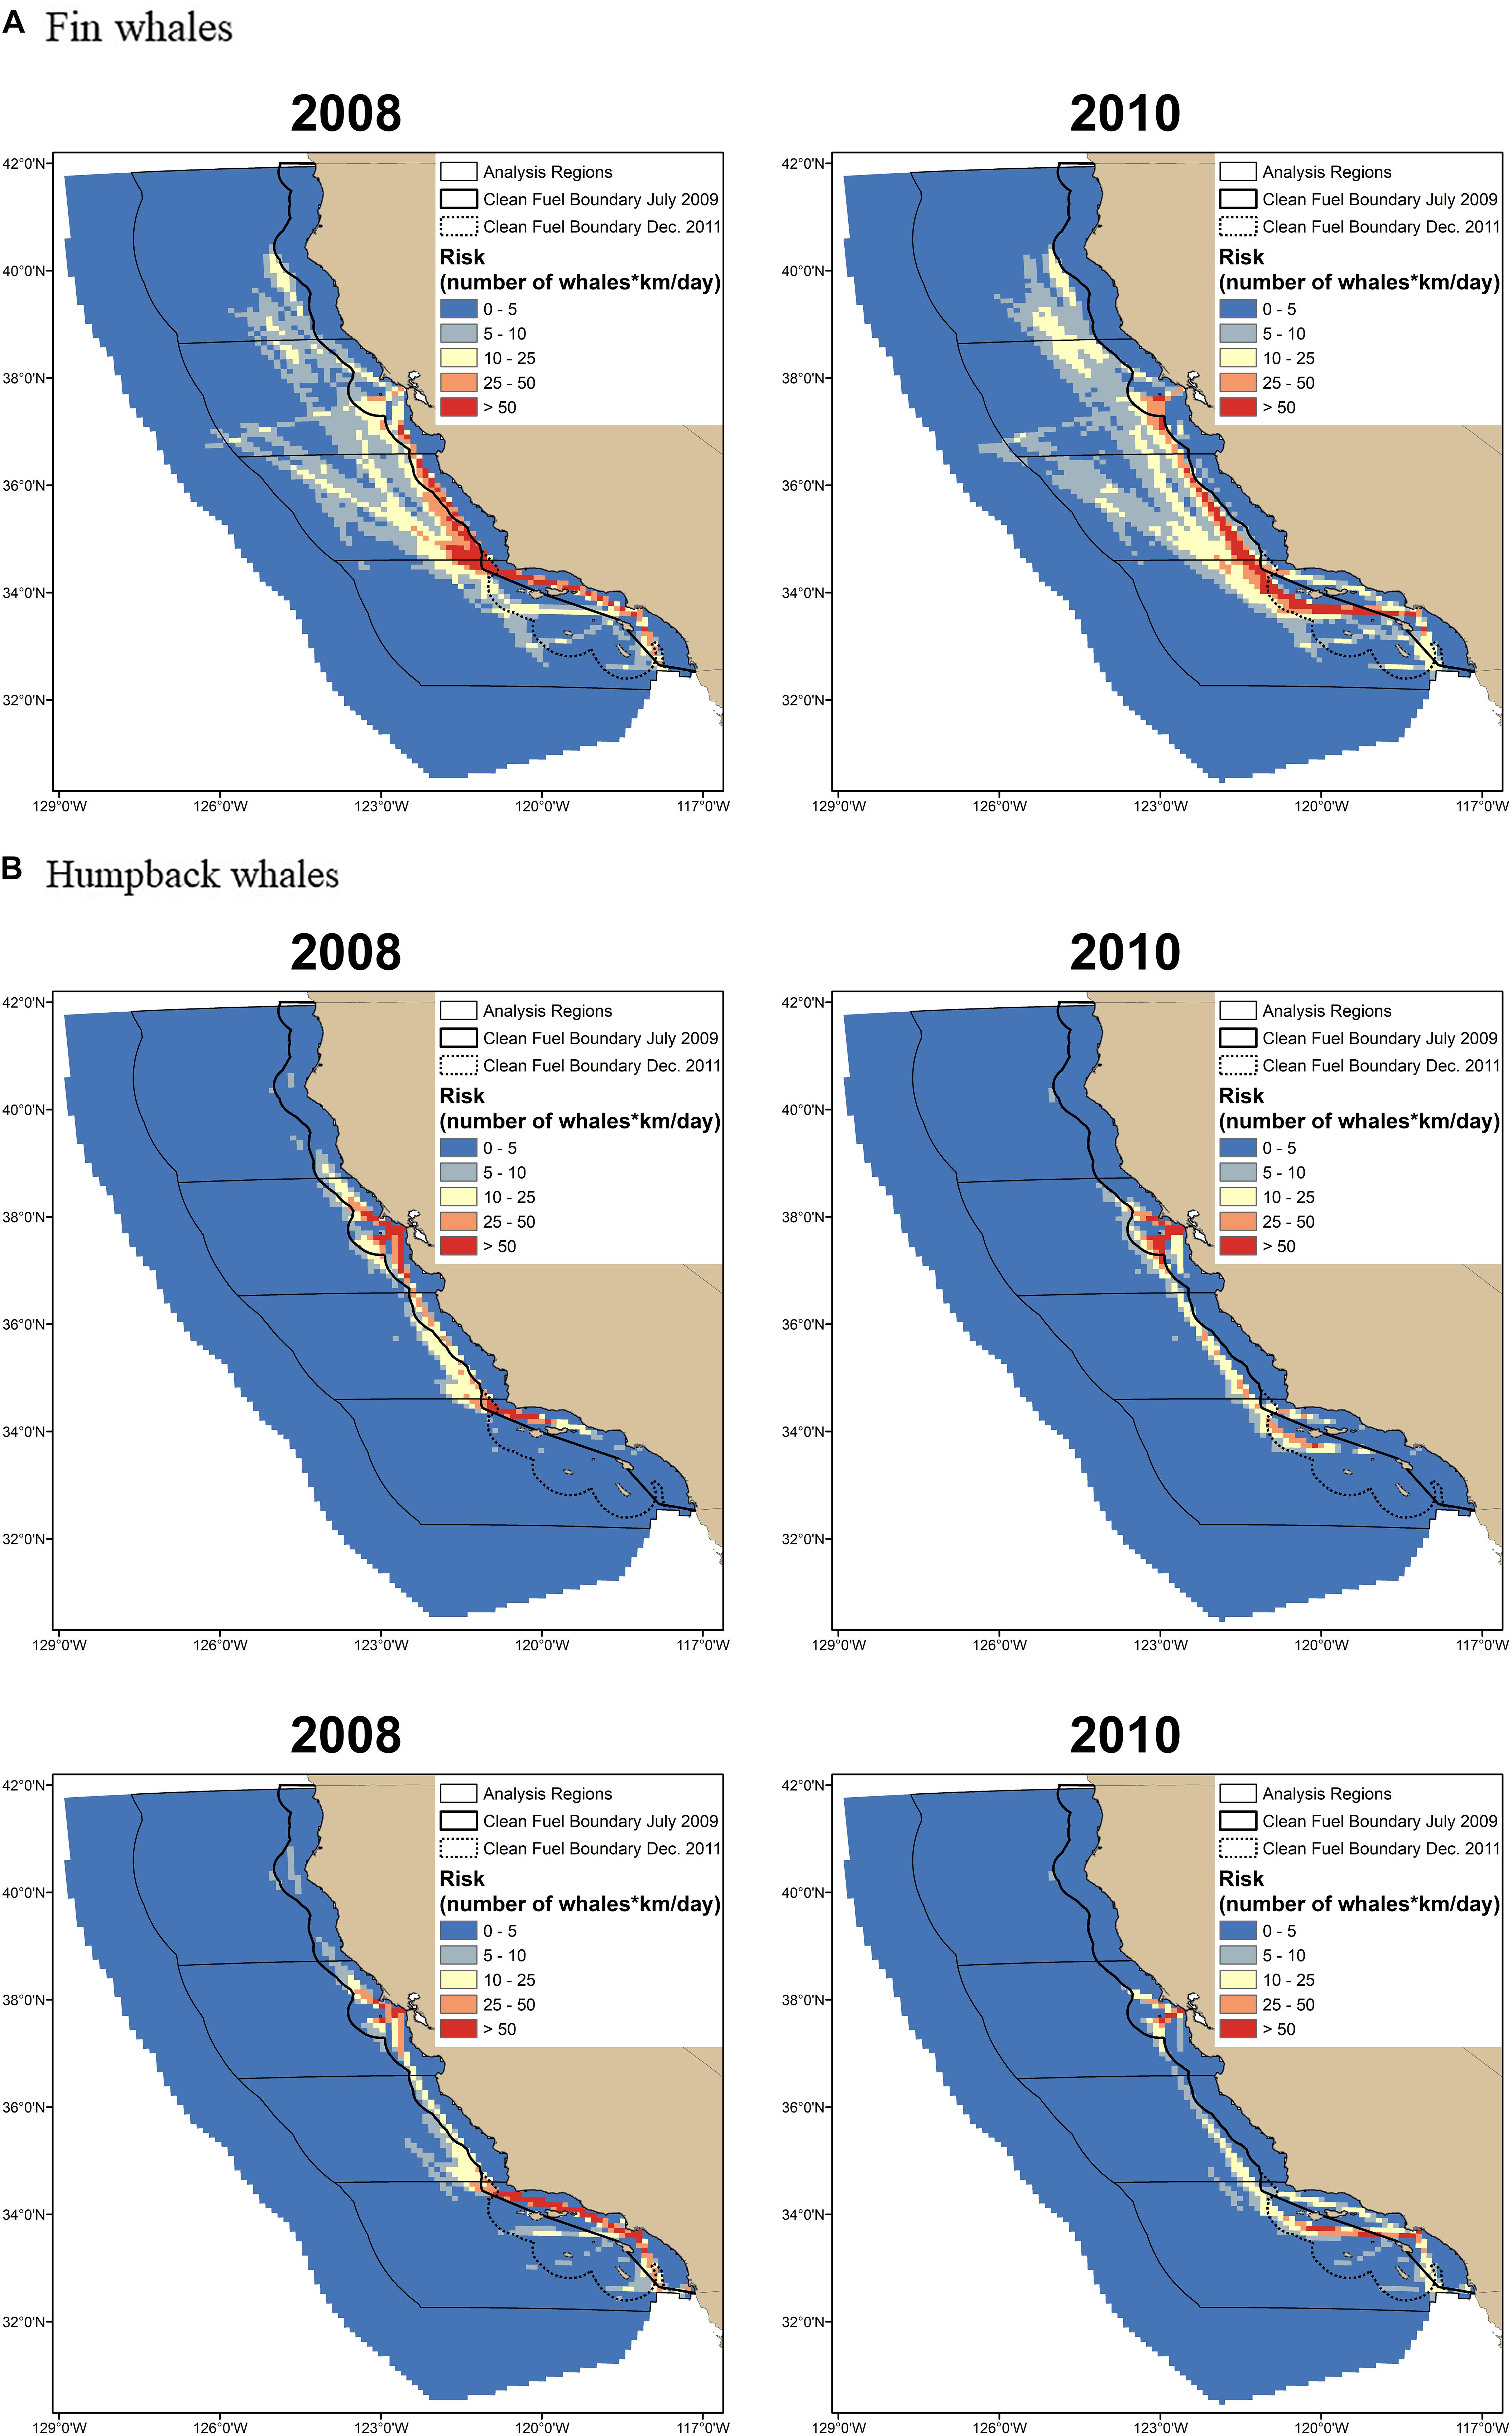
Figure 4. Ship-strike risk for (A) fin, (B) humpback, and (C) blue whales calculated using mean predicted whale distributions is shown for a year with nearshore (2008) and offshore (2010) traffic. Ship-strike risk was defined as the predicted number of whales multiplied by the km/day traveled by ships, which is a measure of co-occurrence. Consequently, the numbers used to define the break points in the maps provide a relative measure of increasing risk. The same break points were used for all species and years to allow for comparisons among maps. The percentage of ships traveling more than 24 nmi from the mainland coast (i.e., the 2009 clean fuel boundary) was used to define nearshore versus offshore traffic (see text for details).
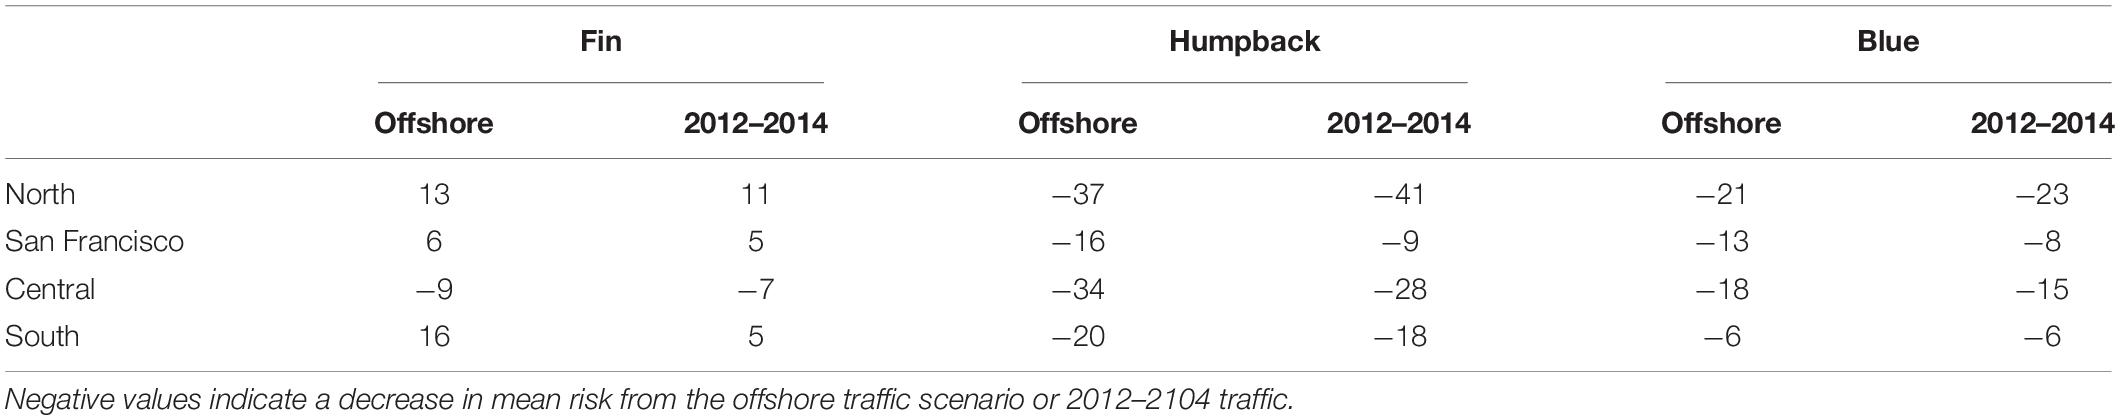
Table 2. The percent change between mean risk from nearshore versus offshore traffic and nearshore versus 2012–2014 traffic (which occurred offshore in some regions and both nearshore and offshore in other regions; Table 1), where nearshore and offshore traffic were defined using a boundary that was 24 nmi from the mainland coast (see text for details).
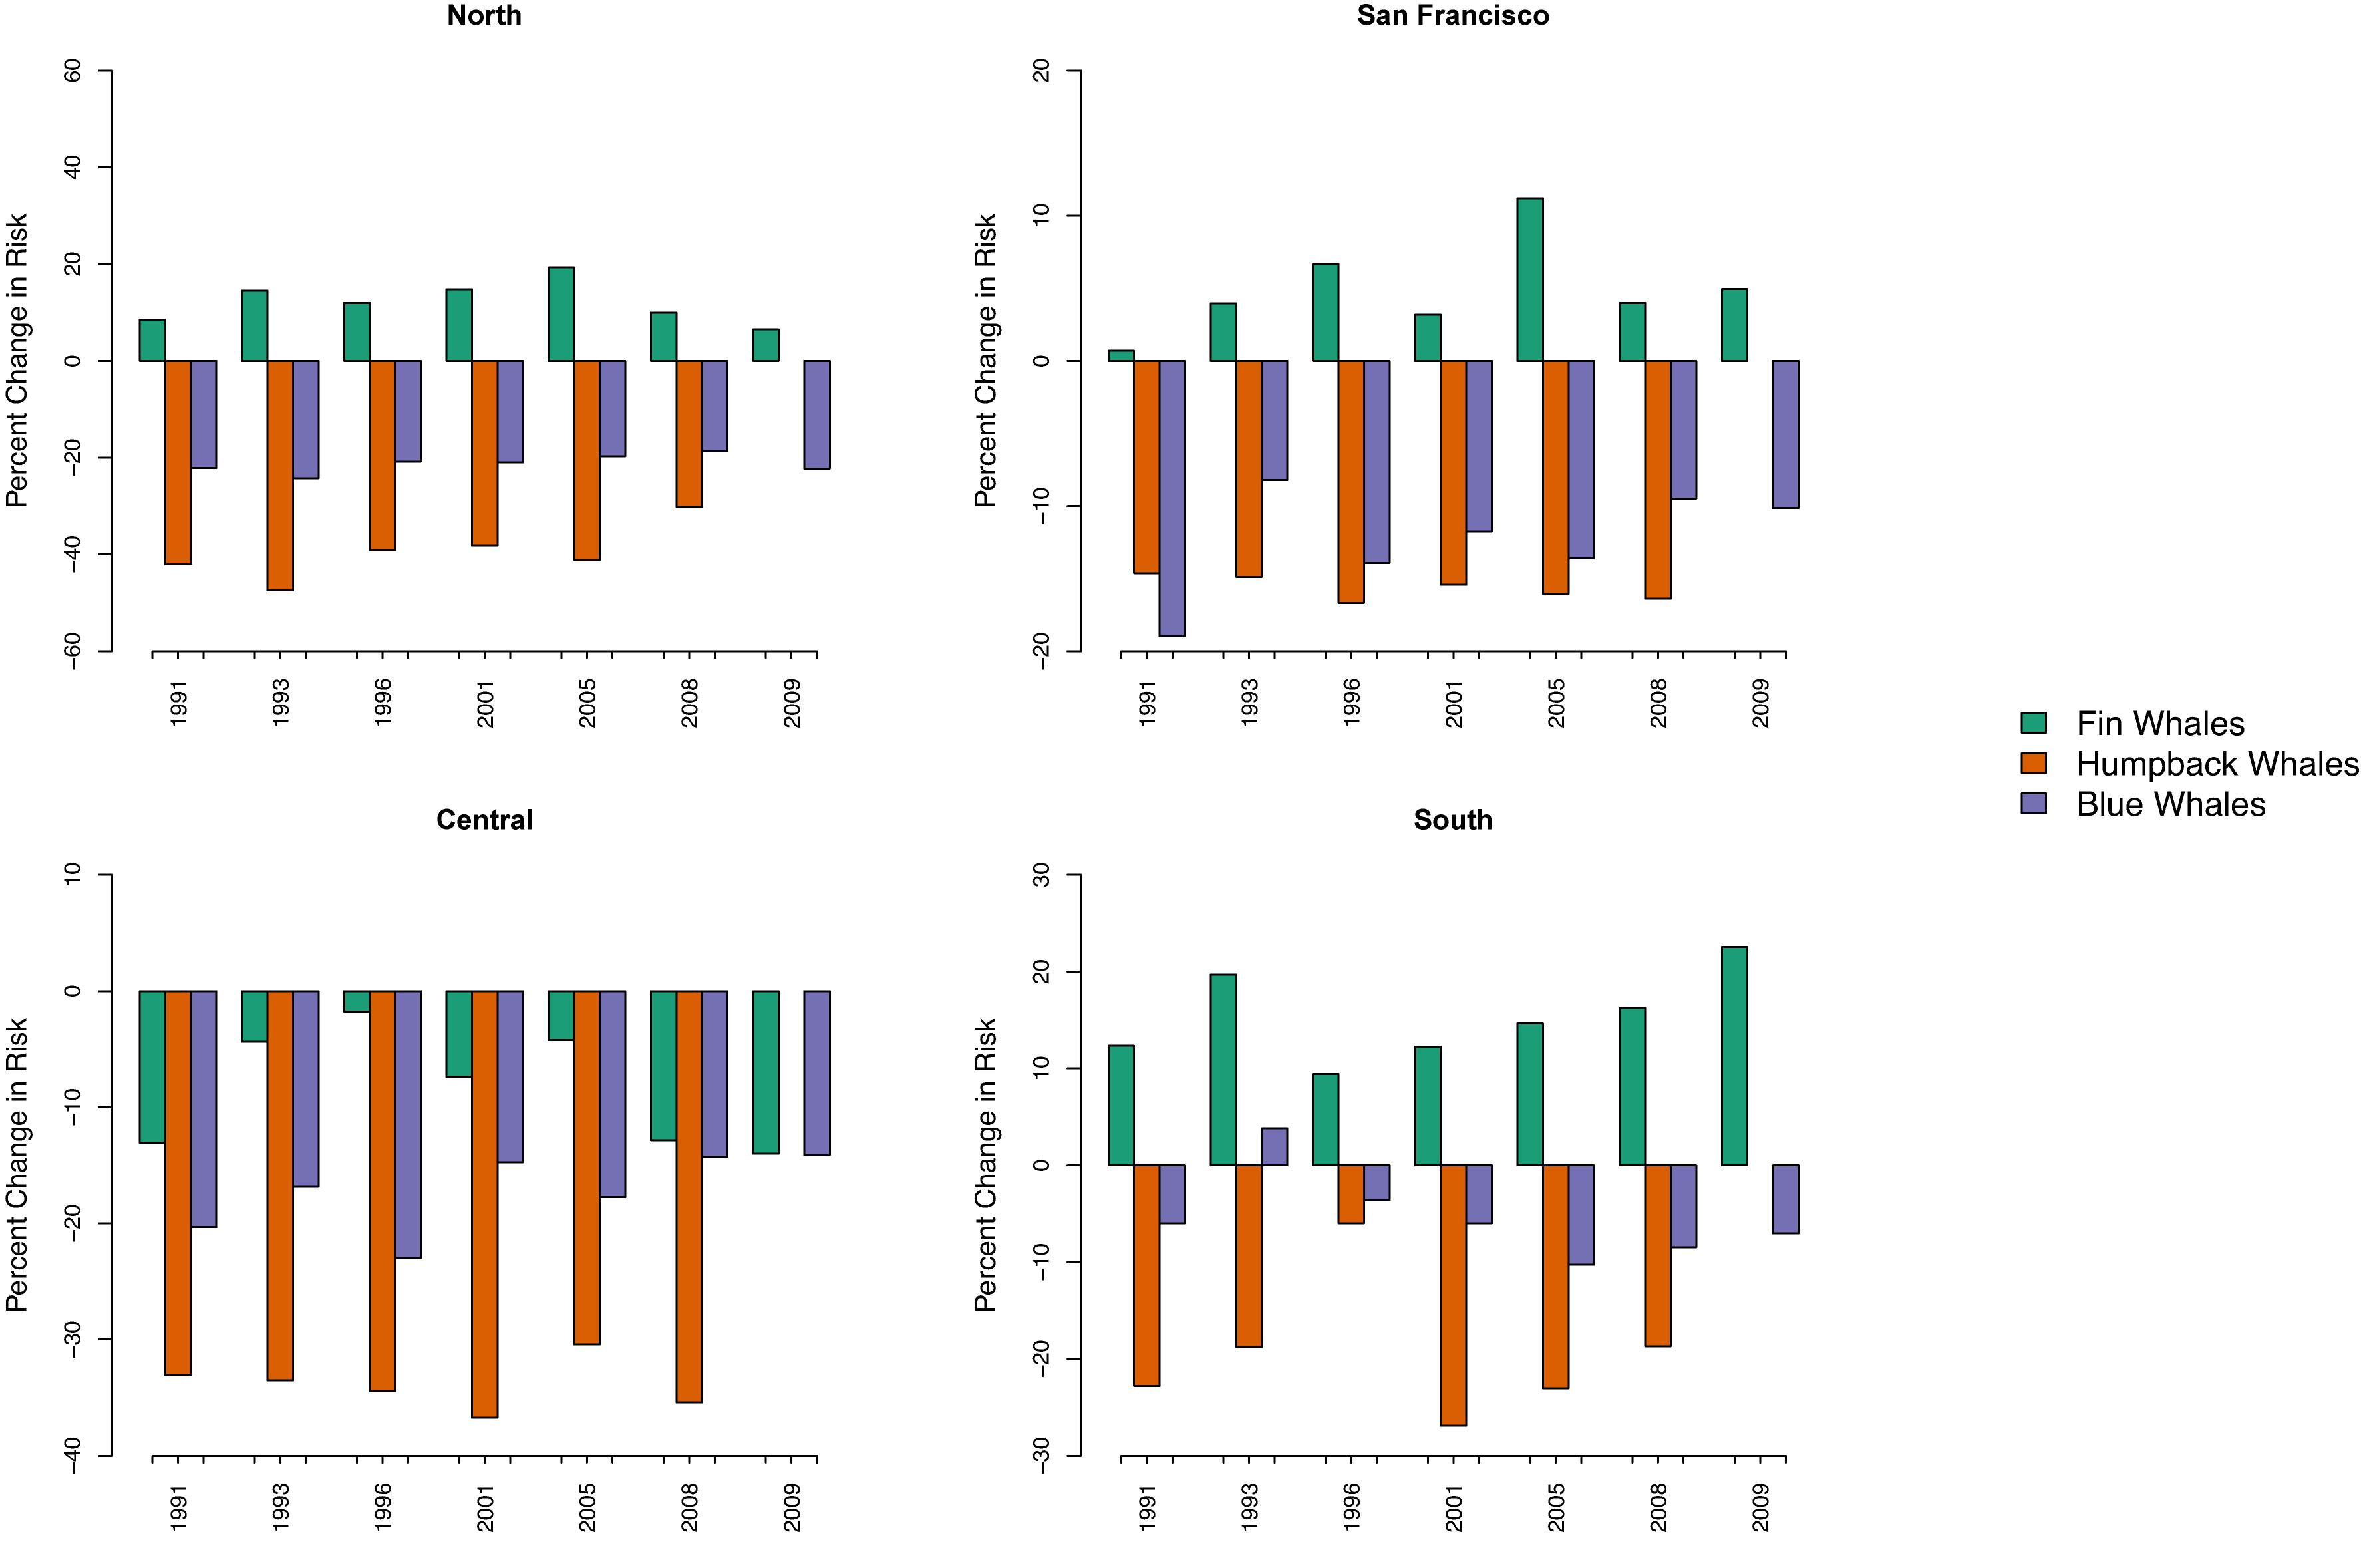
Figure 5. We assessed the effect of interannual variability in whale distributions on ship-strike risk using the percent change between risk for the nearshore versus offshore traffic scenarios; the x-axes represent years in which marine mammal surveys were conducted. Negative values indicate a decrease in mean risk from the offshore, compared to the nearshore, traffic scenario. Whether the nearshore traffic scenario poses a higher ship-strike risk than the offshore traffic scenario in each region is consistent across all years for each species, except the 1993 blue whale predictions in the southern region.
In the south, ship-strike risk for fin whales was lowest for the nearshore traffic scenario (Figures 3, 4). There was a 16% increase in the mean risk associated with the offshore traffic scenario for fin whales and a 5% increase in risk when traffic occurred both nearshore and offshore (i.e., the traffic scenario for 2012–2014; Table 2). Interannual variability in predicted fin whale distributions resulted in a 9–23% increase in risk for the offshore traffic scenario (Figure 5). The opposite pattern was seen for humpback and blue whales in the south (Table 2 and Figures 3–5). In particular, mean risk decreased by 20% and annual risk by 6–27% for humpback whales for the offshore versus nearshore traffic scenario. Mean risk decreased 18% when traffic occurred in both locations. Mean risk decreased approximately 6% for blue whales for the offshore versus nearshore traffic scenario. Risk generally decreased for the offshore versus nearshore traffic scenario (range 4–10%) for annual predicted blue whale distributions. However, offshore traffic had a higher risk than nearshore traffic for the blue whale distributions predicted in 1993. Among all regions, years, and species, predicted blue whale distributions in 1993 represented the only reversal in the traffic scenario (i.e., nearshore versus offshore) having the highest risk.
In the central region, risk for all three species was highest for the nearshore traffic scenario and lower for the offshore traffic scenario, which is represented by traffic in both 2009–2011 and 2012–2014 for this region (Table 2 and Figures 3–5). In particular, mean risk decreased by 9% for fin whales (range in annual predictions = 2–14%), 34% for humpback whales (range in annual predictions = 30–37%), and 18% for blue whales (range in annual predictions = 14–23%) when traffic occurred offshore (2009–2011) compared to nearshore.
The shift between nearshore and offshore traffic in the central region corresponded to a change from ships using primarily the northern and southern approaches off San Francisco (2008 and 2015) to increasing use of the western approach (2009–2011) or the western and northern approaches (2012–2014; Figure 1). Use of the western approach allowed ships to minimize travel nearshore (i.e., within 24 nmi of the mainland coast). Risk increased 6% for fin whales (range in annual predictions = 1–11%) off San Francisco for the offshore versus nearshore traffic scenario (i.e., in association with increased use of the western approach) and increased 5% for the 2012–2014 versus nearshore traffic scenario (i.e., in association with increased use of the western and northern approaches) (Table 2 and Figures 3–5). The opposite pattern was seen for humpback and blue whales off San Francisco (Table 2 and Figures 3–5): risk decreased 16% for humpback whales (range in annual predictions = 15–17%) and 13% for blue whales (range in annual predictions = 10–19%) for the offshore compared to nearshore traffic scenarios. Risk also decreased for the 2012–2014 traffic scenario compared to nearshore traffic scenario, although the change was generally smaller (Table 2). Risk in the northern region for all species followed similar patterns as off San Francisco. However, risk was generally lower in the north (Figure 3) and the percent changes in risk associated with the traffic scenarios were larger (Table 2 and Figure 5).
The previous results show that interannual variability in predicted whale distributions influenced the magnitude of ship-strike risk, but that the difference in risk from the nearshore versus offshore traffic scenario was consistent across all years of predicted whale distributions. To understand these results, we identified areas that consistently contained the highest predicted number of whales, areas that never contained the highest predicted numbers, and areas of variability (Figure 6). In each region, areas containing the highest predicted number of whales were generally the same across years, as were areas that never contained the highest predicted numbers.
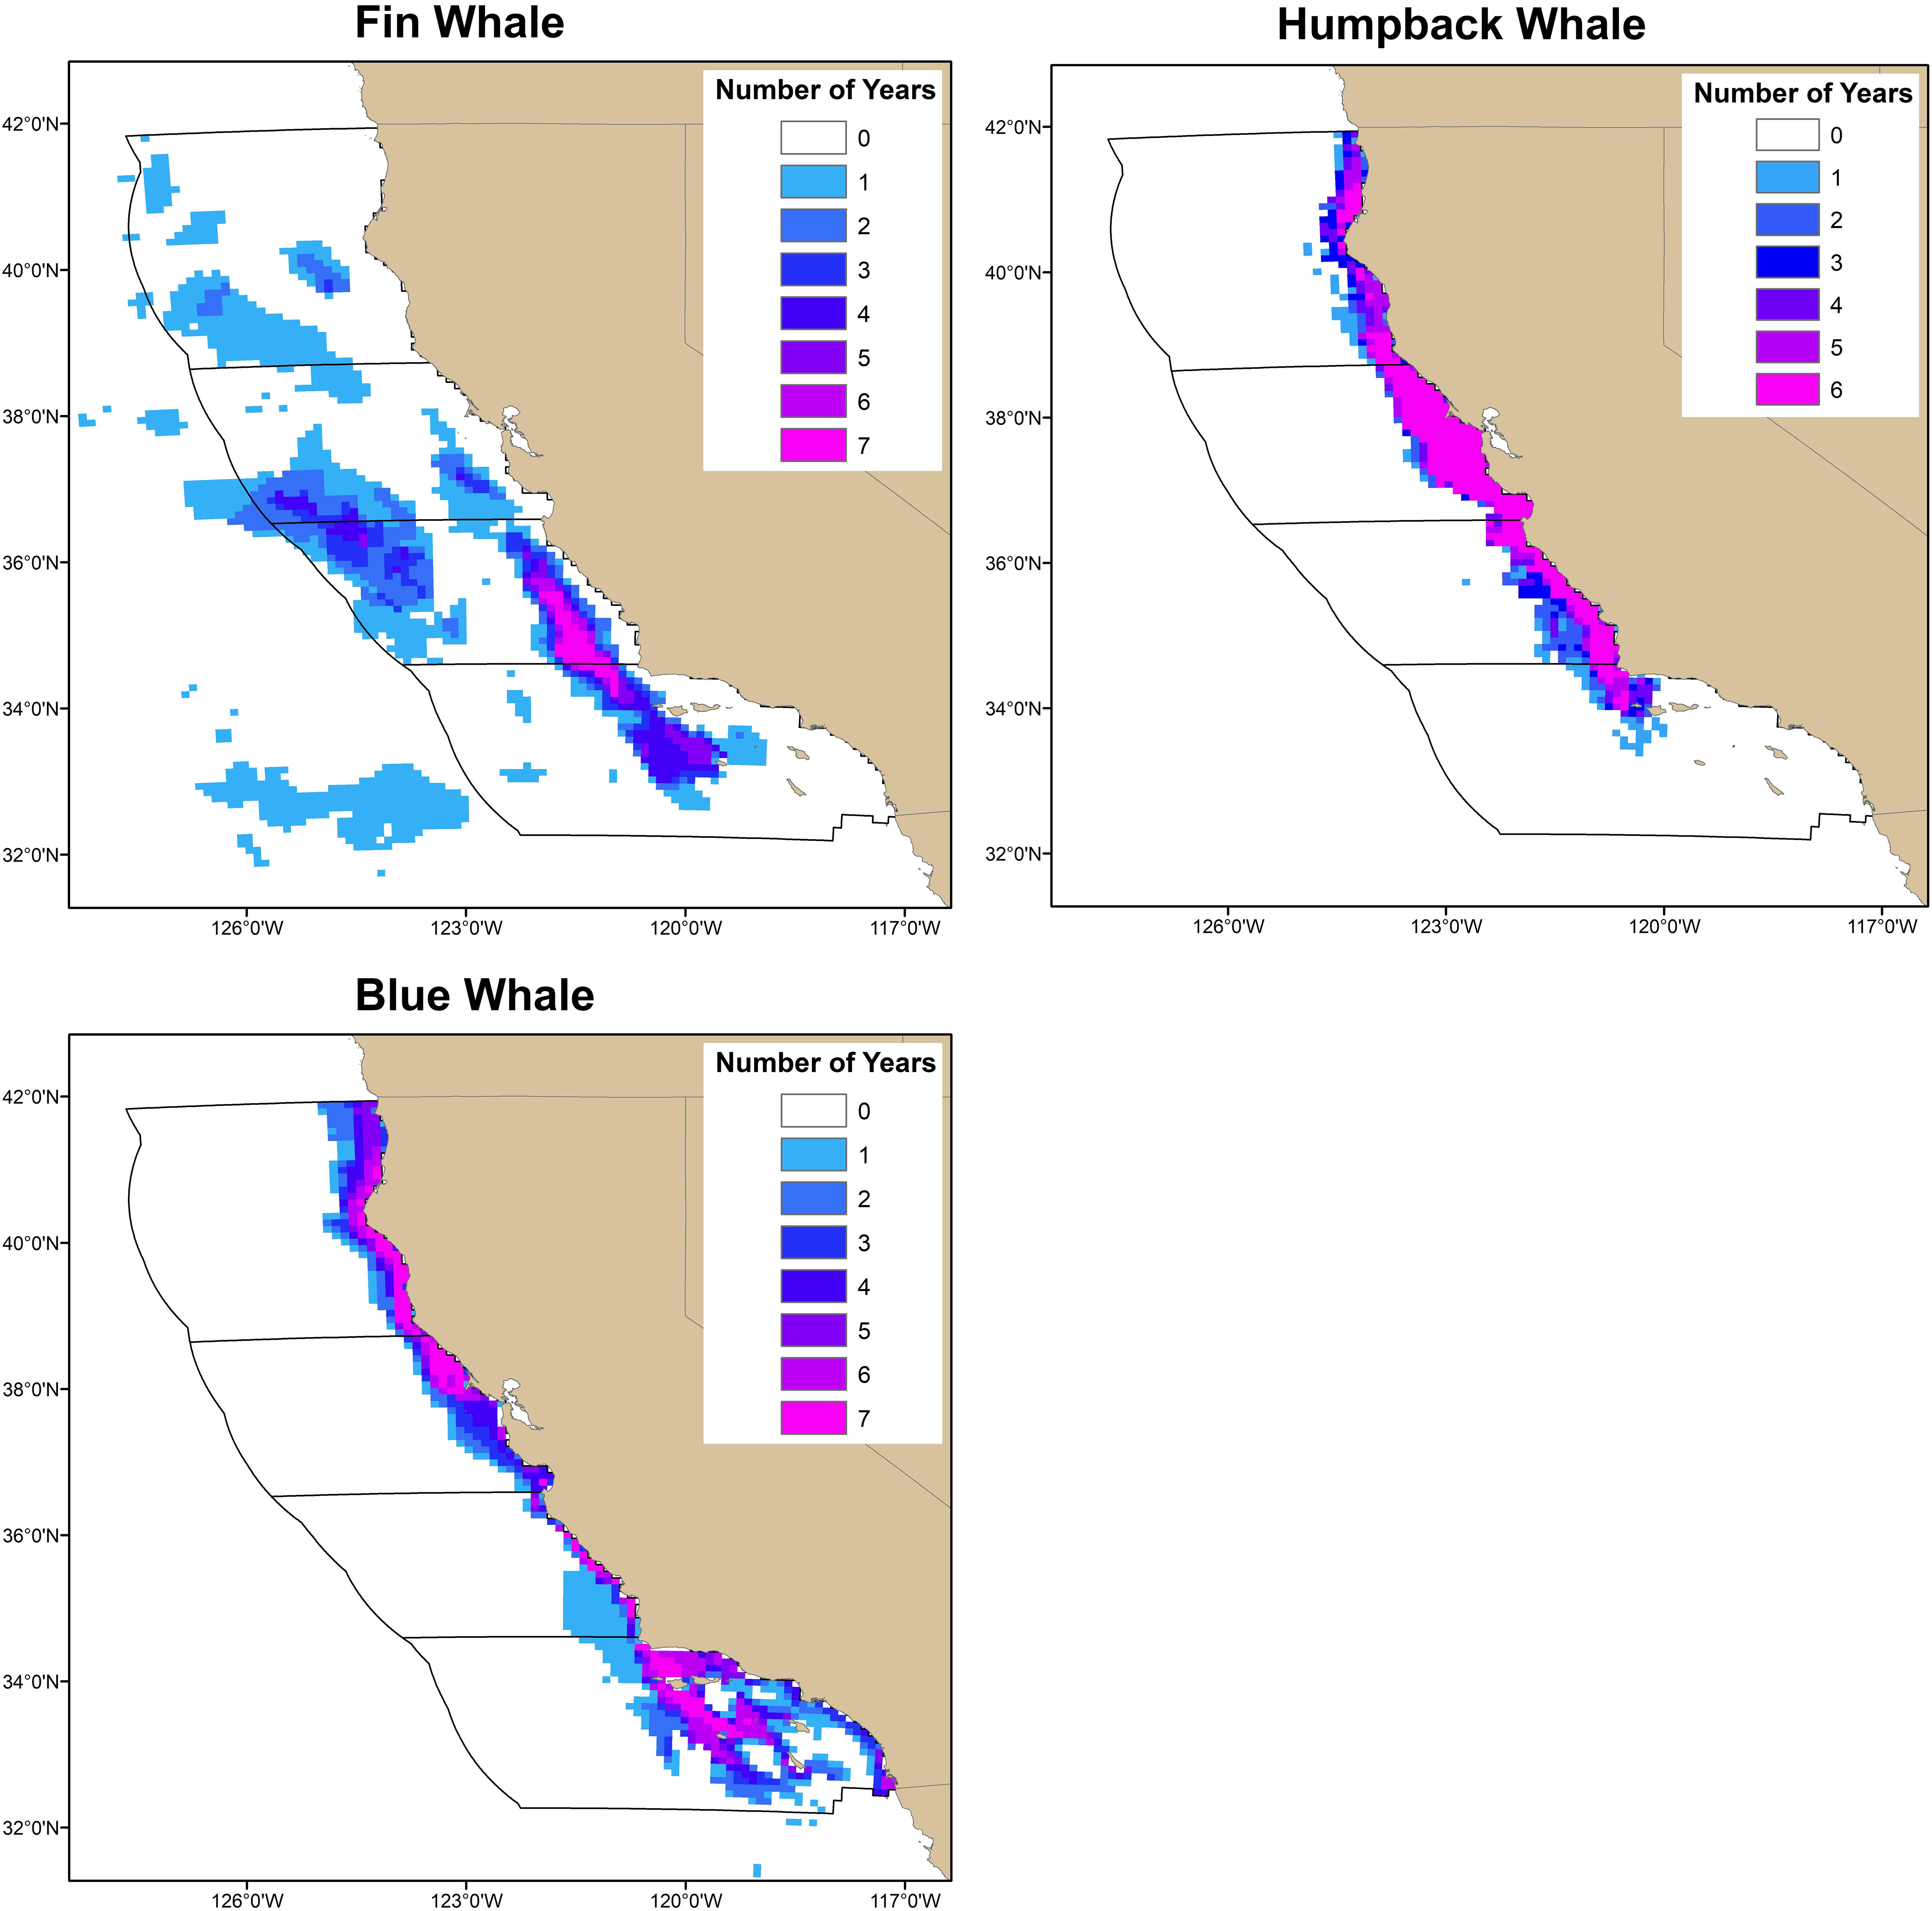
Figure 6. Interannual variability in locations containing the highest predicted number of whales was assessed using the number of years (7 years for fin and blue whales; 6 years for humpback whales) the prediction in each grid cell was among the highest 5% of all predictions. Although these analyses were conducted using all whale predictions (i.e., from the coast of California out to 300 nmi), the regions used to assess ship-strike risk (black polygons) are also shown. Areas with the highest predicted number of whales were consistent among years as were areas that never contained the highest predictions.
Ship-strike risk was also influenced by large-scale increases in whale abundance and large-scale shifts in distributions (Figure 7). In particular, the total risk experienced by both fin and humpback whale populations generally increased between the 1990s and the 2000s in all regions, consistent with previously documented increases in their abundance throughout the North Pacific. The total risk experienced by the blue whale population increased in the northern region in the 2000s, consistent with previously documented northward shifts in their distribution throughout the North Pacific.
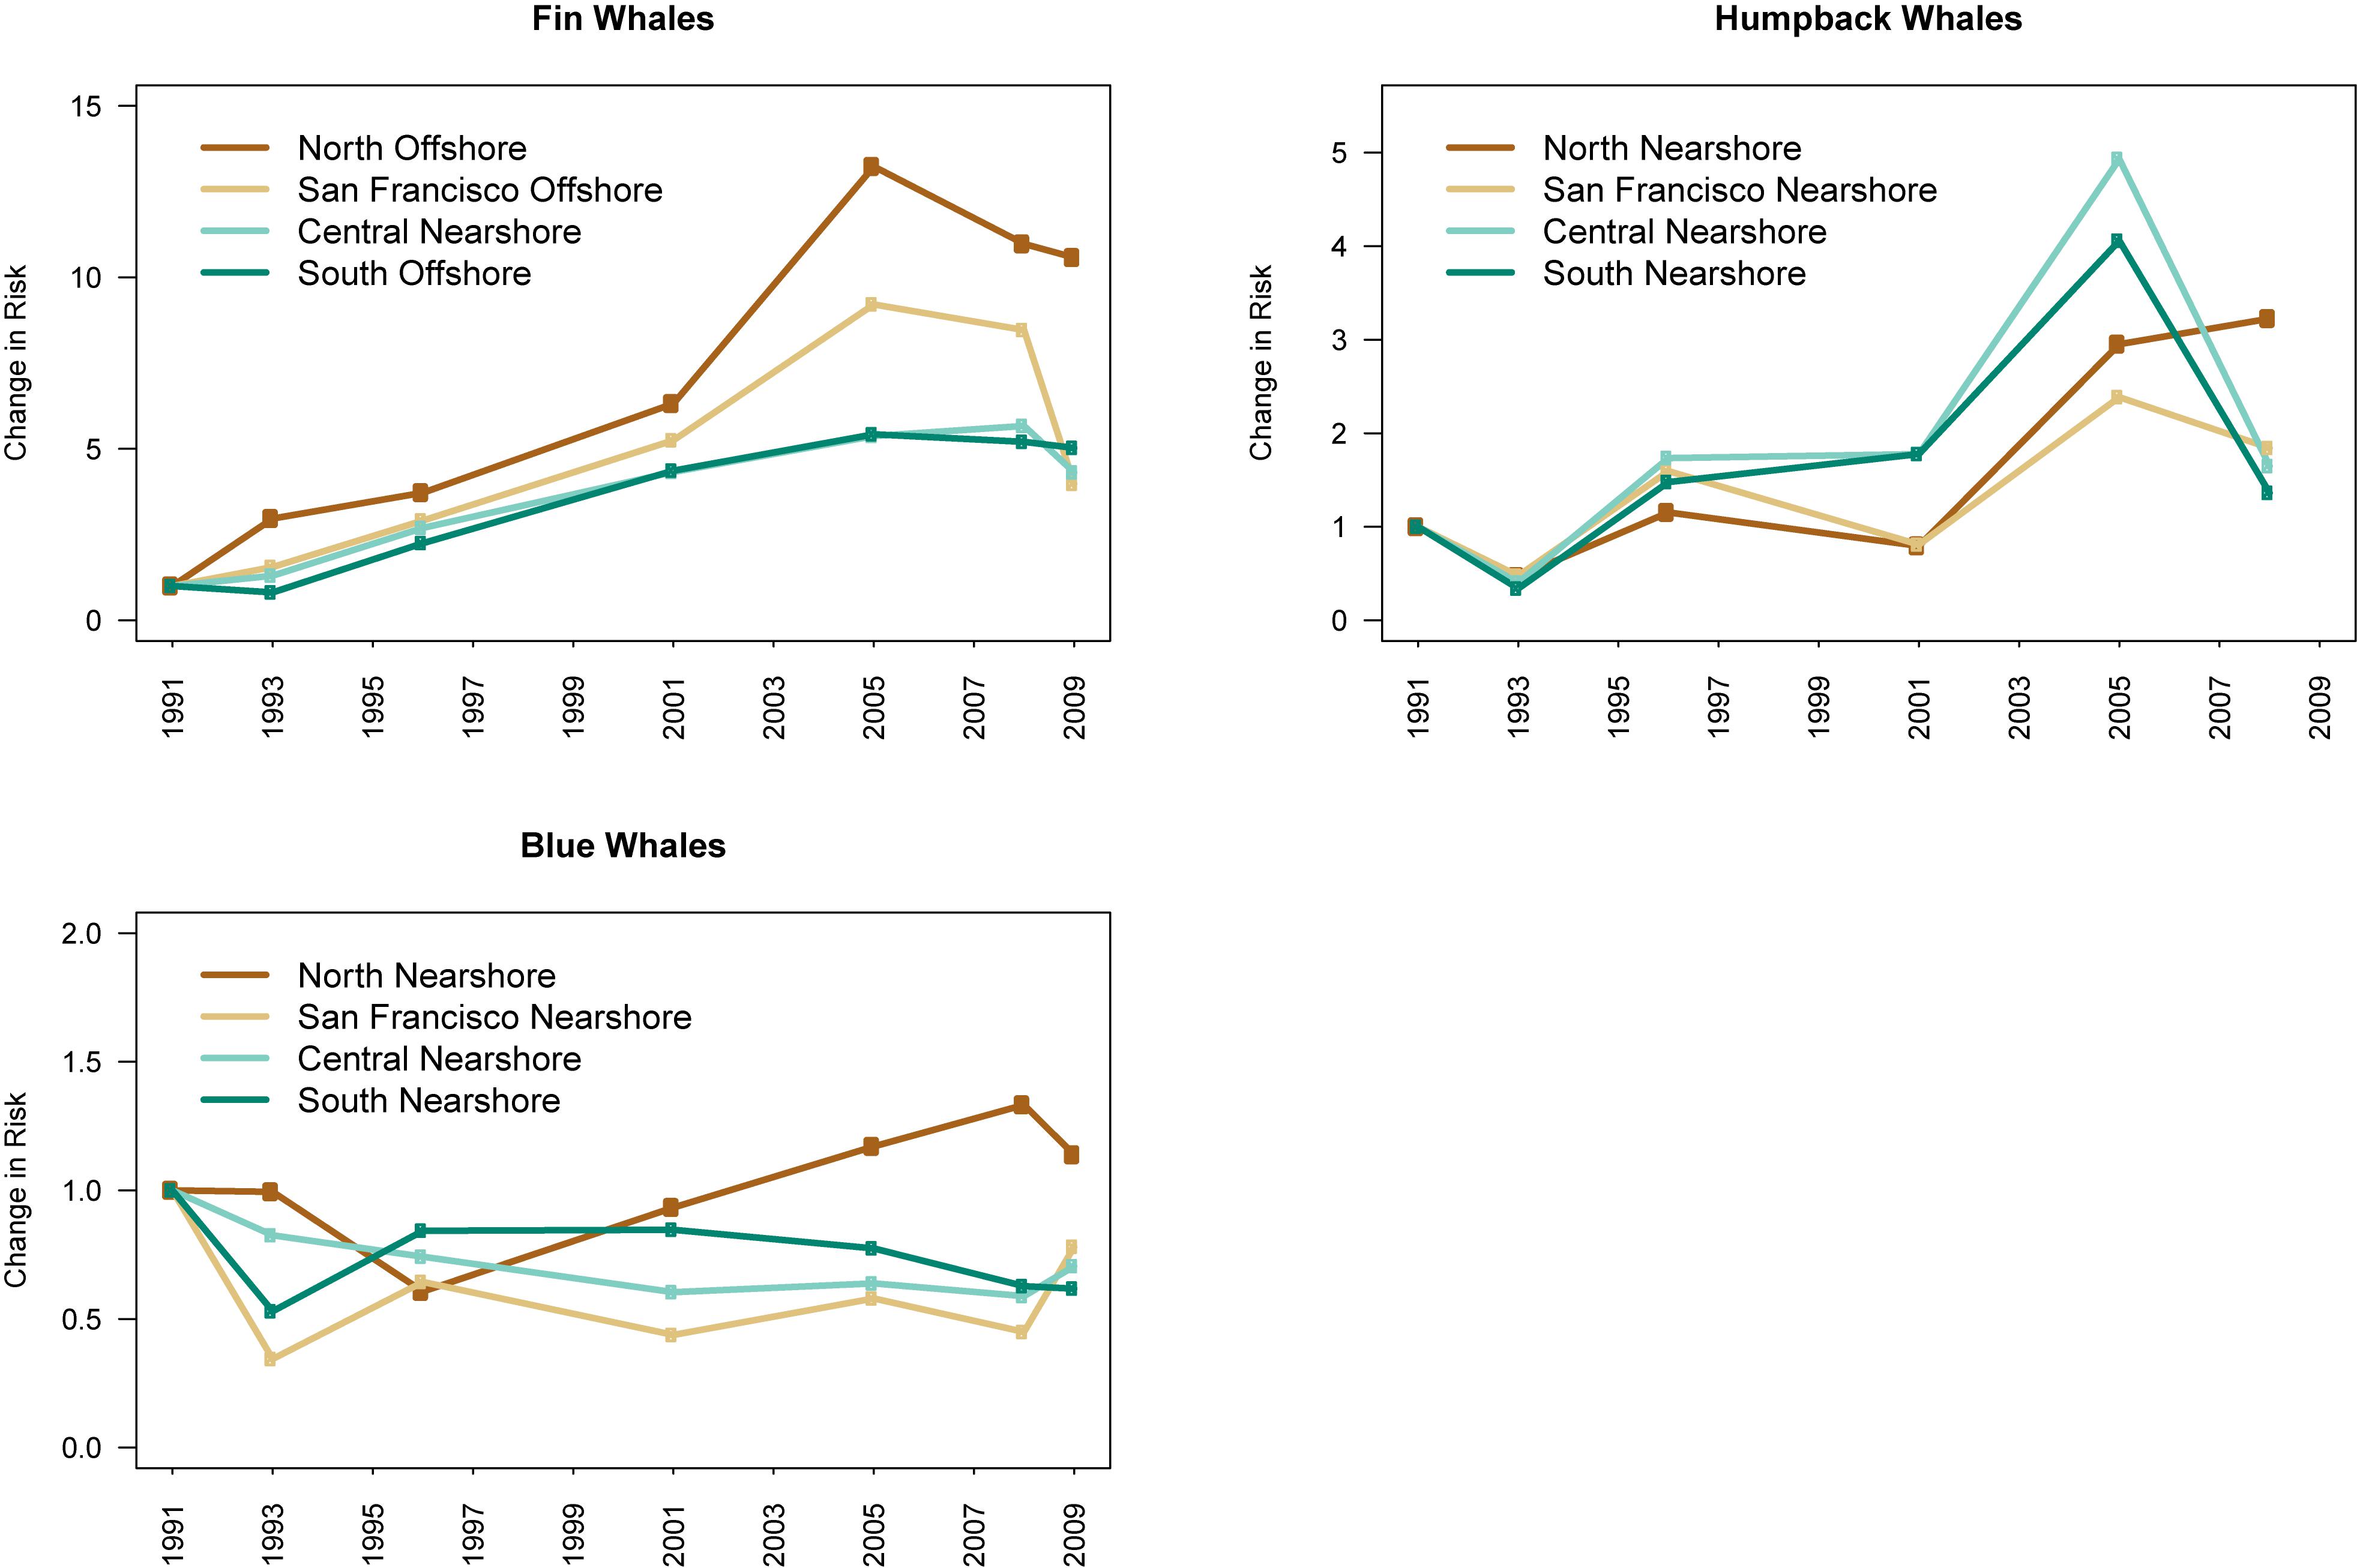
Figure 7. We estimated the change in the total ship-strike risk experienced by each whale population using the ratio of the risk in each survey year to the risk at the start of the survey period (i.e., 1991). We used the risk from the traffic scenario (i.e., nearshore or offshore; see text for details and Figure 3) resulting in the highest risk for each species in each region. For humpback and blue whales, the nearshore traffic scenario had the highest risk in all regions. For fin whales, the offshore traffic scenario had the highest risk for all regions except the central region. Risk was highest from the nearshore traffic scenario in the central region for fin whales. The x-axes represent years in which marine mammal surveys were conducted.
Discussion
Most ship-strike risk assessments do not account for variability in species distributions, ship traffic, or both. We used whale distributions and ship traffic data off California to explore the consequences of interannual variability on ship-strike risk. We found that areas containing the highest predicted number of humpback and blue whales were the same among all years of predictions (Figure 6). Predicted fin whale distributions varied more than predicted humpback and blue whale distributions. However, the highest fin whale predictions were always found far from the coast and were never found close to the coast (Figure 6). All three whale species feed off California during the time period associated with the predictions from the Becker et al. (2016) models (i.e., July–December). The stability of the presence and absence of the highest whale predictions observed at the scale of our study suggests spatially persistent feeding areas or that these areas are large enough to encompass ephemeral features associated with feeding (Becker et al., 2019). These results are consistent with the findings of Abrahms et al. (2019a) that blue whale migrations more closely tracked long-term averages of productivity than contemporaneous measurements of productivity. Abrahms et al. (2019a) also found that blue whales foraged in areas that had higher and more stable long-term productivity.
The stability of the whale predictions resulted in specific ship traffic scenarios consistently having higher ship-strike risk. In particular, either the nearshore or offshore traffic scenario (defined as within or more than 24 nmi from the coast, respectively) consistently had the highest risk for each species and region. Changes in ship traffic scenarios off California (i.e., nearshore versus offshore) were initiated by the shipping industry in response to air pollution regulations. The consistency in risk suggests that static spatial management measures (e.g., changing shipping lanes, creating areas to be avoided, and seasonal speed reductions) can provide an effective means of mitigating risk resulting from ship traffic variability off California. For example, risk was highest for all three species in the central region when traffic occurred nearshore, rather than offshore (Figures 3–5). Consequently, mean risk for all three species can be reduced by up to 35% if traffic follows an offshore route similar to the routes followed by ships in 2009–2011. This reduction in risk does not mean that ship strikes will be eliminated, but that the number of strikes will be minimized over long time periods. There are several possible reasons the nearshore traffic scenario represented a greater overlap with fin whale distributions in this region. Fin whale abundance is higher close to shore in this region, compared to the other regions. Additionally, while the percentage of traffic within 24 nmi of the coast follows the nearshore and offshore traffic scenario definitions in the central region, traffic was generally shifted farther from the coast and was more diffuse in the nearshore traffic scenario.
Ship-strike risk was different for fin whales versus blue and humpback whales in the other regions. In particular, risk for blue and humpback whales was highest in the northern, San Francisco, and southern regions for the nearshore traffic scenario. Risk for fin whales was highest for the offshore traffic scenario in these regions. Consequently, more detailed and fine-scale analyses are needed to design strategies that can mitigate risk for all species in these regions. For example, Redfern et al. (2019) developed methods to estimate ship-strike risk in strategies proposed by stakeholders to reduce risk in the Southern California Bight and found that speed reductions and expanding the existing area to be avoided may provide an optimal solution for addressing stakeholder needs and reducing ship strikes. Analyses are also needed to address risk from January-June because studies have found seasonal changes in fin (Scales et al., 2017) and humpback (Becker et al., 2017) whale distributions off California. Finally, we used a measure of whale-ship co-occurrence (i.e., predicted number of whales multiplied by the cumulative distance traveled by ships) to estimate risk and it is possible to estimate risk using encounter rate theory, which can incorporate ship speed and whale behavior (Martin et al., 2016). Moore et al. (2018) used Conn and Silber’s (2013) equation relating ship speed to the probability that a ship strike is fatal to estimate that reductions in ship speeds in the Santa Barbara Channel (i.e., the 2008 traffic pattern in the southern California region; Figure 1) represent a 20% reduction in the probability of a fatal strike. Consequently, ship speeds should be considered when designing strategies that can mitigate risk (e.g., Redfern et al., 2019).
Our analyses show that static, spatial management strategies can be used to mitigate ship-strike risk from nearshore versus offshore traffic off California. Strategies could include routing ships through areas that consistently had lower predicted whale densities and establishing areas to be avoided or requiring reduced ship speeds in areas with consistently higher predicted whale densities. At finer scales, it is important to consider where ships transition from offshore to nearshore travel. It is also important to consider how ships travel when they are nearshore. For example, nearshore traffic off southern California occurs in shipping lanes in the Santa Barbara Channel. In 2007, four blue whales were struck and killed, most likely in these shipping lanes. Seasonal voluntary and incentivized speed reductions have been used in this area to reduce ship-strike risk (Freedman et al., 2017). However, there is little compliance with voluntary speed reductions and incentivized speed reductions only reach a small percentage of ships traveling in this region and require continued financial support (Freedman et al., 2017).
Our study suggests that the magnitude of ship-strike risk may increase as whales recover from whaling. For example, increases in the abundance of fin and humpback whale populations in the North Pacific were associated with increased ship-strike risk off California (Figure 7). The magnitude of risk may also be affected by shifts in whale distributions in response to climate change. For example, a broad-scale, northward shift in blue whale distributions throughout the North Pacific was associated with increased ship-strike risk for blue whales off northern California (Figure 7). The magnitude of ship-strike risk observed for fin, humpback, and blue whales was also influenced by the location of ship traffic. The spatial variability in ship traffic patterns observed off California in response to air pollution regulations may also occur in other regions. Air pollution regulations are being considered for many regions, including the Mediterranean Sea and off Japan, Australia, Singapore, and China (Moore et al., 2018). It is important to understand how potential shifts in ship traffic in response to these regulations will affect ship-strike risk for large whales. Our study suggests that static management strategies may effectively mitigate risk from variability in ship traffic patterns, if whales congregate in consistent locations for feeding and breeding.
Data Availability Statement
The datasets generated for this study are available on request to the corresponding author.
Author Contributions
JR, EB, and TM conceived of the work and contributed to the analyses and writing the manuscript.
Funding
This study was supported in part by the NOAA Fisheries’ Office of Protected Resources.
Conflict of Interest
The authors declare that the research was conducted in the absence of any commercial or financial relationships that could be construed as a potential conflict of interest.
Acknowledgments
This study would not have been possible without the tireless efforts of the scientists, coordinator, and crew for each survey. We are grateful to members of the US Coast Guard Navigation Center, including Lora Blackburn, CWO3 Dave Marino, Patrick Gallagher, and Dave Winkler, for their help with AIS data acquisition and sharing their knowledge about AIS and AVIS data. We also thank Tomo Eguchi, Jay Barlow, Karin Forney, and the reviewers for insightful comments on this manuscript. The world country boundaries used in all maps were downloaded from Esri ArcGIS Online (http://www.arcgis.com; last modified May 13, 2015; Esri, DeLorme Publishing Company, Inc.).
Footnotes
References
Abrahms, B., Hazen, E. L., Aikens, E. O., Savoca, M. S., Goldbogen, J. A., Bograd, S. J., et al. (2019a). Memory and resource tracking drive blue whale migrations. Proc. Natl. Acad. Sci. U.S.A. 116, 5582–5587. doi: 10.1073/pnas.1819031116
Abrahms, B., Welch, H., Brodie, S., Jacox, M. G., Becker, E. A., Bograd, S. J., et al. (2019b). Dynamic ensemble models to predict distributions and anthropogenic risk exposure for highly mobile species. Diver. Distribut. 25, 1182–1193. doi: 10.1111/ddi.12940
Barlow, J., Calambokidis, J., Falcone, E. A., Baker, C. S., Burdin, A. M., Clapham, P. J., et al. (2011). Humpback whale abundance in the North Pacific estimated by photographic capture-recapture with bias correction from simulation studies. Mar. Mam. Sci. 27, 793–818. doi: 10.1111/j.1748-7692.2010.00444.x
Becker, E. A., Forney, K. A., Fiedler, P. C., Barlow, J., Chivers, S. J., Edwards, C. A., et al. (2016). Moving towards dynamic ocean management: how well do modeled ocean products predict species distributions? Remote Sensing 8:149. doi: 10.3390/rs8020149
Becker, E. A., Forney, K. A., Redfern, J. V., Barlow, J., Jacox, M. G., Roberts, J. J., et al. (2019). Predicting cetacean abundance and distribution in a changing climate. Diver. Distribut. 25, 626–643. doi: 10.1111/ddi.12867
Becker, E. A., Forney, K. A., Thayre, B. J., Debich, A. J., Campbell, G. S., Whitaker, K., et al. (2017). Habitat-based density models for three cetacean species off Southern California illustrate pronounced seasonal differences. Front. Mar. Sci. 4:121. doi: 10.3389/fmars.2017.00121
Calambokidis, J., Barlow, J., Ford, J. K. B., Chandler, T. E., and Douglas, A. B. (2009). Insights into the population structure of blue whales in the Eastern North Pacific from recent sightings and photographic identification. Mar. Mam. Sci. 25, 816–832. doi: 10.1111/j.1748-7692.2009.00298.x
Calambokidis, J., Steiger, G. H., Curtice, C., Harrison, J., Ferguson, M. C., Becker, E., et al. (2015). Biologically important areas for selected cetaceans within U.S. waters – west coast region. Aquat. Mam. 41, 39–53. doi: 10.1578/am.41.1.2015.39
Carretta, J. V., Muto, M. M., Greenman, J., Wilkinson, K., Lawson, D., Viezbicke, J., et al. (2017). “Sources of human-related injury and mortality for U.S. Pacific West Coast marine mammal stock assessments, 2011-2015,” in Proceedings of the NOAA Technical Memorandum, NOAA-TM-NMFS-SWFSC-579, La Jolla, CA.
Conn, P. B., and Silber, G. K. (2013). Vessel speed restrictions reduce risk of collision-related mortality for North Atlantic right whales. Ecosphere 4, 1–16. doi: 10.1890/ES13-00004.1
Croll, D. A., Marinovic, B., Benson, S., Chavez, F. P., Black, N., Ternullo, R., et al. (2005). From wind to whales: trophic links in a coastal upwelling system. Mar. Ecol. Prog. Ser. 289, 117–130. doi: 10.3354/meps289117
Dransfield, A., Hines, E., McGowan, J., Holzman, B., Nur, N., Elliott, M., et al. (2014). Where the whales are: using habitat modeling to support changes in shipping regulations within National Marine Sanctuaries in Central California. Endang. Species Res. 26, 39–57. doi: 10.3354/esr00627
Fiedler, P. C., Reilly, S. B., Hewitt, R. P., Demer, D., Philbrick, V. A., Smith, S., et al. (1998). Blue whale habitat and prey in the California Channel Islands. Deep Sea Res. Part II 45, 1781–1801. doi: 10.1038/s41598-019-52792-4
Forney, K. A., and Barlow, J. (1998). Seasonal patterns in the abundance and distribution of California cetaceans, 1991–1992. Mar. Mam. Sci. 14, 460–489. doi: 10.1111/j.1748-7692.1998.tb00737.x
Forney, K. A., Ferguson, M. C., Becker, E. A., Fiedler, P. C., Redfern, J. V., Barlow, J., et al. (2012). Habitat-based spatial models of cetacean density in the eastern Pacific Ocean. Endang. Species Res. 16, 113–133. doi: 10.3354/esr00393
Freedman, R., Herron, S., Byrd, M., Birney, K., Morten, J., Shafritz, B., et al. (2017). The effectiveness of incentivized and non-incentivized vessel speed reduction programs: case study in the Santa Barbara channel. Ocean Coast. Manag. 148, 31–39. doi: 10.1016/j.ocecoaman.2017.07.013
Harris, P. T., Macmillan-Lawler, M., Rupp, J., and Baker, E. K. (2014). Geomorphology of the oceans. Mar. Geol. 352, 4–24. doi: 10.1016/j.margeo.2014.01.011
Hazen, E. L., Palacios, D. M., Forney, K. A., Howell, E. A., Becker, E. A., Hoover, A. L., et al. (2017). WhaleWatch: a dynamic management tool for predicting blue whale density in the California Current. J. Appl. Ecol. 54, 1415–1428. doi: 10.1111/1365-2664.12820
International Maritime Organization [IMO], (2014). AIS transponders [Online]. Available: http://www.imo.org/en/OurWork/safety/navigation/pages/ais.aspx (accessed May 17, 2019).
Jensen, C. M., Hines, E., Holzman, B. A., Moore, T. J., Jahncke, J., and Redfern, J. V. (2015). Spatial and temporal variability in shipping traffic off San Francisco. California. Coast. Manag. 43, 575–588. doi: 10.1080/08920753.2015.1086947
Martin, J., Sabatier, Q., Gowan, T. A., Giraud, C., Gurarie, E., Calleson, C. S., et al. (2016). A quantitative framework for investigating risk of deadly collisions between marine wildlife and boats. Methods Ecol. Evol. 7, 42–50. doi: 10.1111/2041-210X.12447
McKenna, M. F., Katz, S. L., Wiggins, S. M., Ross, D., and Hildebrand, J. A. (2012). A quieting ocean: unintended consequence of a fluctuating economy. J. Acoust. Soc. Am. 132, EL169–EL175. doi: 10.1121/1.4740225
Monnahan, C. C., Branch, T. A., and Punt, A. E. (2015). Do ship strikes threaten the recovery of endangered eastern North Pacific blue whales? Mar. Mam. Sci. 31, 279–297. doi: 10.1111/mms.12157
Moore, J. E., and Barlow, J. (2011). Bayesian state-space model of fin whale abundance trends from a 1991–2008 time series of line-transect surveys in the California Current. J. Appl. Ecol. 48, 1195–1205. doi: 10.1111/j.1365-2664.2011.02018.x
Moore, T. J., Redfern, J. V., Carver, M., Hastings, S., Adams, J. D., and Silber, G. K. (2018). Exploring ship traffic variability off California. Ocean Coast. Manag. 163, 515–527. doi: 10.1016/j.ocecoaman.2018.03.010
Priyadarshana, T., Randage, S. M., Alling, A., Calderan, S., Gordon, J., Leaper, R., et al. (2016). Distribution patterns of blue whale (Balaenoptera musculus) and shipping off southern Sri Lanka. Region. Stud. Mar. Sci. 3, 181–188. doi: 10.1016/j.rsma.2015.08.002
R Core Team, (2014). R: A Language and Environment for Statistical Computing. Vienna: R Foundation for Statistical Computing.
Redfern, J. V., McKenna, M. F., Moore, T. J., Calambokidis, J., DeAngelis, M. L., Becker, E. A., et al. (2013). Assessing the risk of ships striking large whales in marine spatial planning. Conserv. Biol. 27, 292–302. doi: 10.1111/cobi.12029
Redfern, J. V., Moore, T. J., Becker, E. A., Calambokidis, J., Hastings, S. P., Irvine, L. M., et al. (2019). Evaluating stakeholder-derived strategies to reduce the risk of ships striking whales. Diver. Distribut. 25, 1575–1585. doi: 10.1111/ddi.12958
Rockwood, R. C., Calambokidis, J., and Jahncke, J. (2017). High mortality of blue, humpback and fin whales from modeling of vessel collisions on the U.S. West Coast suggests population impacts and insufficient protection. PLoS One 12:e0183052. doi: 10.1371/journal.pone.0183052
Scales, K. L., Schorr, G. S., Hazen, E. L., Bograd, S. J., Miller, P. I., Andrews, R. D., et al. (2017). Should I stay or should I go? Modelling year-round habitat suitability and drivers of residency for fin whales in the California Current. Diver. Distribut. 23, 1204–1215. doi: 10.1111/ddi.12611
Silber, G. K., Vanderlaan, A. S. M., Tejedor Arceredillo, A., Johnson, L., Taggart, C. T., Brown, M. W., et al. (2012). The role of the International Maritime Organization in reducing vessel threat to whales: process, options, action and effectiveness. Mar. Policy 36, 1221–1233. doi: 10.1016/j.marpol.2012.03.008
Vanderlaan, A. S. M., Corbett, J. J., Green, S. L., Callahan, J. A., Wang, C., Kenney, R. D., et al. (2009). Probability and mitigation of vessel encounters with North Atlantic right whales. Endang. Species Res. 6, 273–285. doi: 10.3354/esr006273
Williams, R., and O’Hara, P. (2010). Modelling ship strike risk to fin, humpback and killer whales in British Columbia. Canada. J. Cetacean Res. Manag. 11, 1–8.
Wood, S. N. (2006). Generalized Additive Models: an Introduction with R. Boca Raton, FL: Taylor and Francis Group.
Keywords: species distribution modeling, interannual variability in species distributions, commercial shipping, variability in ship traffic, spatially explicit risk assessment, ship-strike risk
Citation: Redfern JV, Becker EA and Moore TJ (2020) Effects of Variability in Ship Traffic and Whale Distributions on the Risk of Ships Striking Whales. Front. Mar. Sci. 6:793. doi: 10.3389/fmars.2019.00793
Received: 02 May 2019; Accepted: 09 December 2019;
Published: 06 February 2020.
Edited by:
Ellen Hines, San Francisco State University, United StatesReviewed by:
Samantha Cope, Anthropocene Institute, United StatesDana Briscoe, Stanford University, United States
Copyright © 2020 Redfern, Becker and Moore. This is an open-access article distributed under the terms of the Creative Commons Attribution License (CC BY). The use, distribution or reproduction in other forums is permitted, provided the original author(s) and the copyright owner(s) are credited and that the original publication in this journal is cited, in accordance with accepted academic practice. No use, distribution or reproduction is permitted which does not comply with these terms.
*Correspondence: Jessica V. Redfern, anJlZGZlcm5AbmVhcS5vcmc=