 Kátia Meirelles Felizola Freire1
 Dyhia Belhabib2
 Jeniffer C. Espedido3
 Lincoln Hood4
 Kristin M. Kleisner5
 Vicky W. L. Lam6Michel L. Machado7
 Jocemar Tomasino Mendonça8
 Jessica J. Meeuwig9
 Pietro S. Moro10
 Fábio S. Motta11
 Maria-Lourdes D. Palomares6
 Nicola Smith12
 Lydia Teh6
 Dirk Zeller4*Kyrstn Zylich6
 Daniel Pauly6
- 1Laboratório de Ecologia Pesqueira, Departamento de Engenharia de Pesca e Aquicultura, Universidade Federal de Sergipe, São Cristóvão, Brazil
- 2Ecotrust Canada, Vancouver, BC, Canada
- 3Quantitative Aquatics, Inc., Los Baños, Philippines
- 4Sea Around Us – Indian Ocean, School of Biological Sciences, University of Western Australia, Crawley, WA, Australia
- 5Environmental Defense Fund, Boston, MA, United States
- 6Sea Around Us, Institute for the Oceans and Fisheries, University of British Columbia, Vancouver, BC, Canada
- 7Núcleo de Fauna, Instituto Brasileiro do Meio Ambiente e dos Recursos Naturais Renováveis, Campo Grande, Brazil
- 8Núcleo de Pesquisa e Desenvolvimento do Litoral Sul, Instituto de Pesca, Cananéia, Brazil
- 9Marine Futures Lab, School of Biological Sciences, University of Western Australia, Crawley, WA, Australia
- 10Moro Indústria de Artigos Esportivos Ltda., Curitiba, Brazil
- 11Laboratório de Ecologia e Conservação Marinha, Instituto do Mar, Universidade Federal de São Paulo, Santos, Brazil
- 12Earth to Oceans Research Group, Department of Biological Sciences, Simon Fraser University, Burnaby, BC, Canada
Commercial fisheries catches by country are documented since 1950 by the Food and Agriculture Organization (FAO). Unfortunately, this does not hold for marine recreational catches, of which only few, if any, estimates are reported to FAO. We reconstructed preliminary estimates of likely marine recreational catches for 1950–2014, based on independent reconstructions for 125 countries. Our estimates of marine recreational catches that are retained and landed increased globally until the early 1980s, stabilized through the 1990s, and began increasing again thereafter, amounting to around 900,000 t⋅year–1 in 2014. Marine recreational catches thus account for slightly less than 1% of total global marine catches. Trends vary regionally, increasing in Asia, South America and Africa, while slightly decreasing in Europe and Oceania, and strongly decreasing in North America. The derived taxonomic composition indicates that recent catches were dominated by Sparidae (12% of total catches), followed by Scombridae (10%), Carangidae (6%), Gadidae (5%), and Sciaenidae (4%). The importance of Elasmobranchii (sharks and rays) in recreational fisheries in some regions is of concern, given the life-history traits of these taxa. Our preliminary catch reconstruction, despite high data uncertainty, should encourage efforts to improve national data reporting of recreational catches.
Introduction
Recreational fisheries are socio-economically important in industrialized economies (see, e.g., Ihde et al., 2011) and their importance has been increasing in transitional economies such as Brazil (Bower et al., 2014; Freire et al., 2018). The guidelines for recreational fisheries published by the Food and Agriculture Organization of the United Nations (FAO) recommend to “improve information on recreational fishing by collecting data on catch per species (lowest possible taxonomic level), type of gear, etc. and have member countries submit these data to central bodies such as FAO” (FAO, 2012). The only recreational catch data reported to FAO, however, are thought to originate from freshwaters in some European countries (Garibaldi, 2012). Nevertheless, for many years, Finland has been including some marine recreational catches in the data submitted to the International Council for the Exploration of the Sea (ICES), and hence FAO (Zeller et al., 2011). Even though other countries have been collecting recreational fisheries data (e.g., United States and Canada), they do not appear to have been included in formal national accounts and hence in the data submitted to FAO by each country. More recently, efforts are underway in The Bahamas to include their reconstructed estimates for recreational catches in the data reported to and by FAO (Smith and Zeller, 2016).
We found three previously published estimates of total global recreational catches. An estimate of 0.5 million t⋅year–1 was obtained when FAO approximated recreational catches (marine and inland) based on a questionnaire answered by only 30 mostly developed countries, while 2.0 million t⋅year–1 was estimated for total freshwater recreational catches only (Coates, 1995). A third estimate of 10.9 million t⋅year–1 was derived from an extrapolation of Canadian recreational participation and catch rates, and refers to both marine and inland areas (Cooke and Cowx, 2004).
Problems associated with the collection of catch data are not restricted to recreational activities, but also include commercial and subsistence activities. Indeed, the major problem with official national and hence global statistics is widespread under-reporting, which especially affects small-scale fisheries (e.g., Zeller et al., 2015). The Sea Around Us1, based on the rationale in Pauly (1998) as operationalized by Zeller et al. (2016), has completed over 200 historical ‘catch reconstructions’ to begin addressing this under-reporting challenge (e.g., Smith and Zeller, 2016; Derrick et al., 2017; Léopold et al., 2017; Cashion et al., 2018; Freire et al., 2018; Popov and Zeller, 2018), of which about half have been published in peer-reviewed outlets. These reconstructions not only cover every maritime country and territory in the world (Pauly and Zeller, 2016b), but also address both commercial and non-commercial fisheries, such as the small-scale subsistence (e.g., Zeller et al., 2015) and recreational fisheries (e.g., Smith and Zeller, 2016). Because of the diversity as well as general paucity of information and data sources available for each country, recreational catch estimates contain high uncertainty, and each reconstruction may follow different methodological details that cannot be fully detailed here, but are presented in the accompanying Supplementary Materials for all 125 countries used here. Nevertheless, all reconstructions follow the basic principles and concepts in Zeller et al. (2016) and thus represent a consistent approach for estimation.
Here, we describe in detail the reconstruction process for four countries that illustrate the diversity of recreational fishing experiences: Brazil, Angola, the Philippines, and the United States of America (Figure 1). The Supplementary Materials present the wide variety of data, methods and assumptions made for recreational catch estimates for the 125 countries forming the foundation for the present study. In addition, we extended the reconstruction of global marine recreational catches to include the period from 2011 to 2014 to update our earlier, unpublished recreational data set of 1950–2010 (summarized in Pauly and Zeller, 2016a). All recreational (as well as commercial) data for every country are freely available under the Exclusive Economic Zone (EEZ) listing for a given country at www.seaaroundus.org. Considering the socio-economic importance of recreational fishing around the world, generating US$ 40 billion per year of global benefits (Cisneros-Montemayor and Sumaila, 2010), we hope our study strengthens the case for countries to record or estimate recreational catches, and include these data in national and global databases.
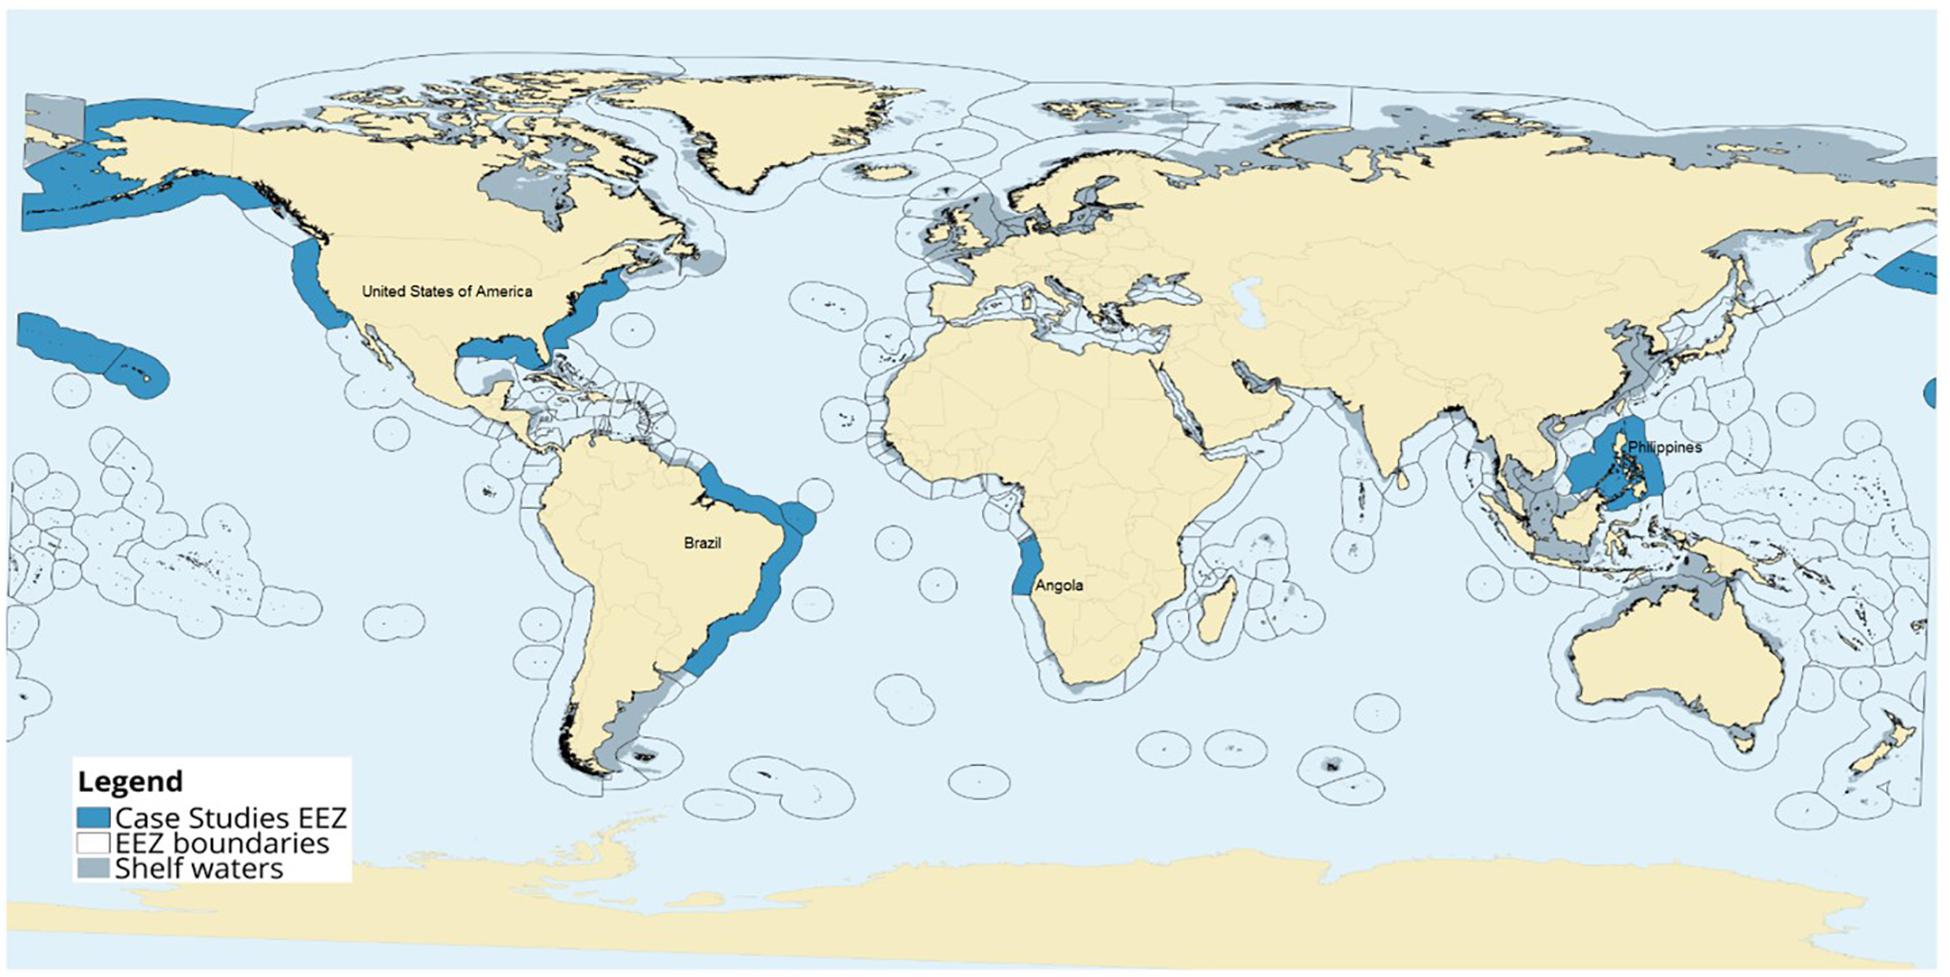
Figure 1. Map showing the Exclusive Economic Zones (EEZ) within which recreational fisheries are assumed to operate, and the shelf area to 200-m depth for all countries. Presented in dark blue are the four countries detailed as case studies of recreational catch reconstructions. All 125 countries are covered in the Supplementary Materials.
Materials and Methods
Similar to reconstructing commercial fisheries catches, the details of the data sources and methodology for estimating marine recreational catches for 1950 to 2014 varies among countries, depending on the type and quality of data and information sources available. Below we exemplify the diversity of methods and data used in our recreational catch estimation for four countries: Brazil, Angola, the Philippines, and the United States of America (Figure 1). The details on data sources and methods used, and the assumptions made for all the 125 countries whose recreational catch estimates were used for the present synthesis are presented in the Supplementary Materials. The four examples highlighted here are used to demonstrate the diversity of estimation details to derive: (1) catches from organized recreational fishing events or competitions; and (2) catches from daily or regular, non-organized recreational fishing activities, if either exist. We use the term ‘fishing event’ to encompass different organized recreational fishing experiences, such as tournaments, championships, jamborees, etc., that have different meanings in different countries. The starting year of all reconstructions, 1950, was chosen to correspond to the start of FAO’s Yearbook of Fisheries and Aquaculture Statistics. We realize that recreational fishing predates this time period in some countries, at least to the 17th century (Walton, 1653), but likely much earlier (e.g., Berners, 1496), while in other countries, recreational fishing only started in more recent years. The final year of reconstruction used here, 2014, corresponds to the current end-year of the global database on commercial and non-commercial marine catches compiled, maintained and published by the Sea Around Us (Pauly and Zeller, 2015), which will continue to be progressively updated. The Sea Around Us reconstructed catch database complements the officially reported data (national and/or FAO data) with comprehensive estimates of unreported catches of commercial (industrial and artisanal) and non-commercial (subsistence and recreational) fisheries (Pauly and Zeller, 2016a), as well as estimates of major discards (Zeller et al., 2018).
Throughout, we adopted the definition for recreational fisheries provided by the FAO: “[…] fishing of aquatic animals (mainly fish) that do not constitute the individual’s primary resource to meet basic nutritional needs and are not generally sold or otherwise traded on export, domestic or black markets” (FAO, 2012). In short, non-commercial fishing for which leisure or pleasure is the main driver. However, we do realize that there are cases in which ‘recreational’ fishing is used as a cover for actual commercial activities, leading to economic losses to society as well as to legitimate commercial fisheries (Babali et al., 2018). For details on the data sources and methods used for recreational catch data reconstruction in the 125 countries summarized here, see Supplementary Materials.
Brazil
Brazil (Figure 1) consists of 26 states, of which 17 are coastal and are thus considered in this reconstruction (Freire et al., 2014). Our entry point in the reconstruction is the 2011 national license database, which combines marine and inland recreational fisheries. The number of licenses for recreational fisheries in Brazil increased from 276,500 in 2011 to 400,847 in 2013, most of them issued in the southern states of São Paulo and Paraná. The percentage of licensed recreational fishers versus the total number of recreational fishers (licensed and non-licensed) obtained from local studies (Table 1) was then used to conservatively estimate the total number of recreational fishers in each state (Freire et al., 2014). The licensed/total recreational fisher percentages varied from 11% in Bahia to 56% in São Paulo and Paraná (Table 1).
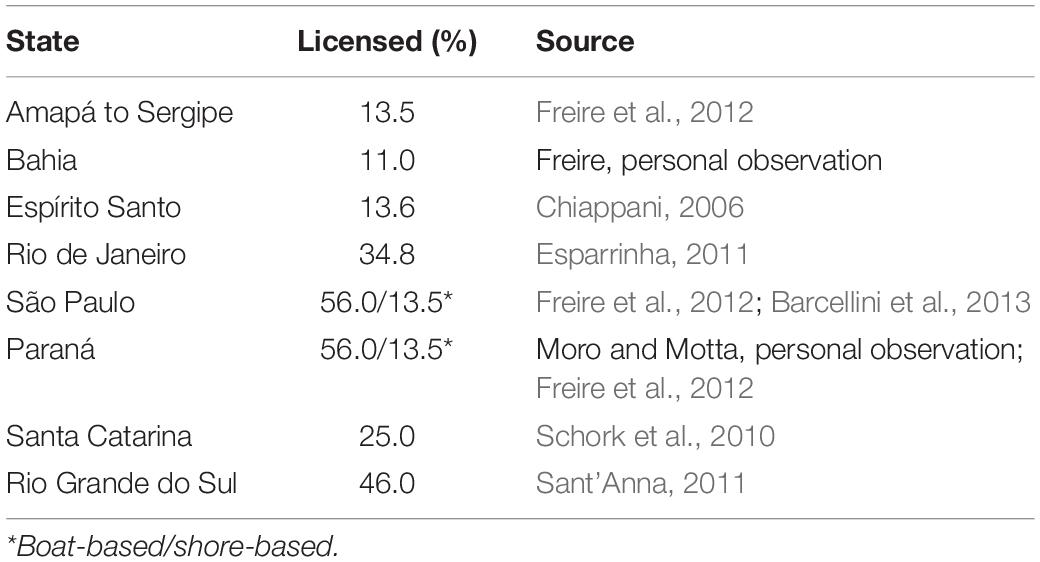
Table 1. Brazilian coastal states with data on the percentage of licensed recreational fishers versus total recreational fishers interviewed in local studies.
Unfortunately, this type of information was not available for every state, in which case a national average proportion of 13.5% was used (Freire et al., 2012). Thereafter, the general national average percentage of recreational fishers fishing in saltwater (i.e., marine fishing) was estimated at 44% (Freire et al., 2014), but this proportion varies among states (Table 2). Overall, this suggested a national total of about 435,000 marine recreational fishers for Brazil, which represents a national marine recreational fishing participation of 0.41% of the total population of Brazil of 191 million inhabitants in 2010 (IBGE, 2012). A time series of the number of marine recreational fishers for each coastal state in Brazil was derived based on an assumed constant 0.41% national marine recreational fishing participation rate (IBGE, 2012). The Brazilian Institute of Geography and Statistics (IBGE) provides census-based data on national population levels for each decade starting in 1950. We interpolated the population size between 1950 and 1959 and between subsequent decades using the logistic growth curve (Miranda and Lima, 2010).
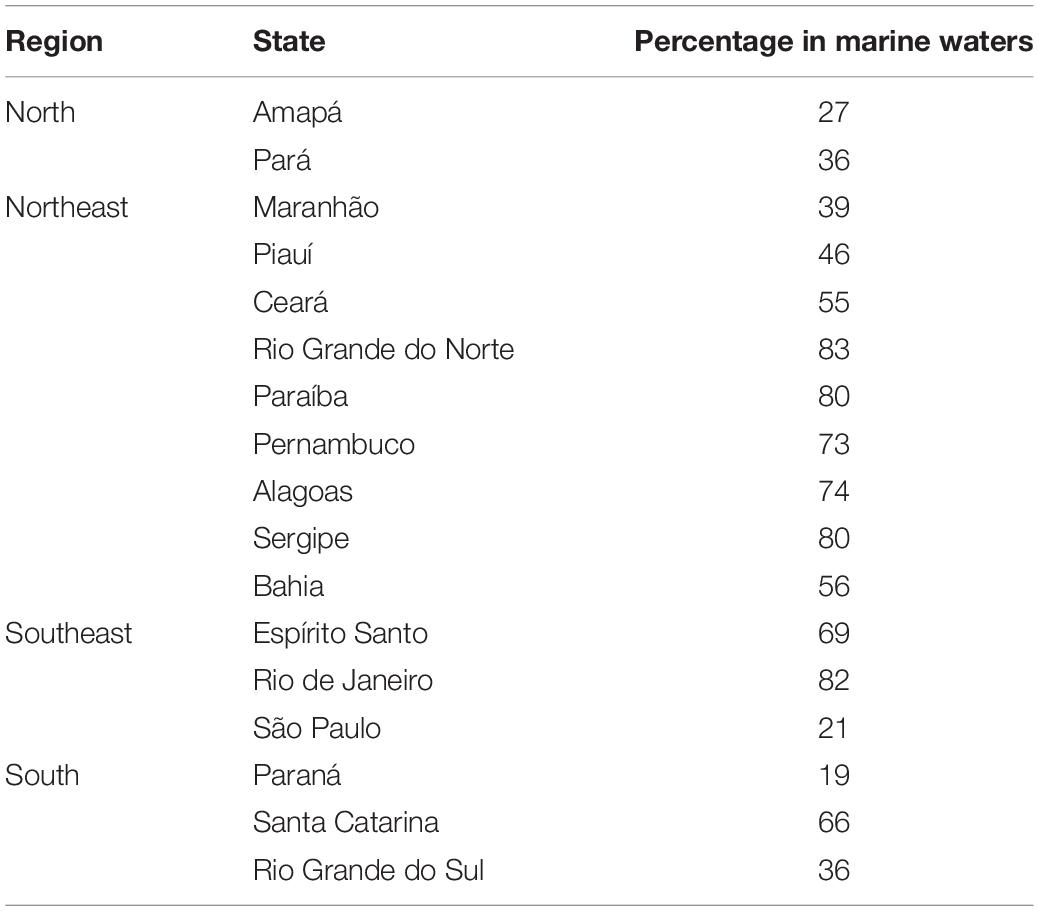
Table 2. Percentage of licensed recreational fishers fishing in marine waters (mangrove, sandy and rocky beaches, and offshore) by state and region in Brazil, based on the license database for 2009 (Freire et al., 2014).
In order to remain conservative, we considered that the year of the first establishment of fishing clubs in each state corresponded to the period when marine recreational fisheries generally started to become important in that state. For the first year in the time series (1950), only 20% of the estimated recreational catches for that decade were considered effectively taken, following the general Pareto Principle or 80–20 rule (Sanders, 1992). To avoid potentially unrealistic trends, we used a linear trend from 1950 to the year in which the first fishing club was established in each state. No fishing clubs were found to exist in the northern region (states of Amapá and Pará, Table 2). Thus, we considered as the starting point for the reconstruction the first year when a license was issued or the first fishing event promoted in the region. For the northeastern region (states from Ceará to Bahia, Table 2), fishing clubs were established between 1947 and 1982. We considered an average year for that region to replace missing data for the states of Maranhão and Piauí. In the southeastern region (states of Espírito Santo to São Paulo, Table 2), fishing clubs were established between 1956 and 1982, and in the southern region (states of Paraná to Rio Grande do Sul, Table 2) between 1955 and 1981.
To obtain a recreational license, recreational fishers have to answer an online questionnaire on a range of topics (Freire et al., 2012): type of license to be obtained, fishing area (mangrove, beach, offshore, river, reservoir, and fish-and-pay), and number of fishing days (once a year, twice a year, more than twice a year — assumed here to be 7 days per year, once a month, and every week). As each recreational fisher could choose any combination of marine and/or freshwater fishing areas, we split their fishing activities equally among the chosen areas. Thus, if fishers reported fishing in rivers/lakes (freshwater), sandy/rocky beaches (saltwater), and offshore (saltwater), we considered that 2/3 of their fishing days were fishing in marine waters.
Recreational fishers in Brazil spend on average 15.3 ± 3.9 days⋅year–1 fishing (mean ± SD), with the lowest values in the northern region (8.8–10.6 days⋅year–1) and the highest in the northeastern region (14.6–32.0 days⋅year–1) (Table 3). Catch rates for shore-based fishers varied from 18.7 g⋅fisher–1⋅day–1 in the state of Espírito Santo to 732 g⋅fisher–1⋅day–1 in the state of Bahia (Table 4). We replaced missing data with the estimate for the closest state with available information. For boat-based fishers, catch rates ranged from 3,468 to 4,541 g⋅fisher–1⋅day–1 (data available for the states of São Paulo, Paraná, and Santa Catarina, Table 4). Thus, the total catch for recreational fishers during normal recreational fishing activities (i.e., not at organized events), here called ‘total catch daily activity’ (TCDA) in tonnes was estimated as:
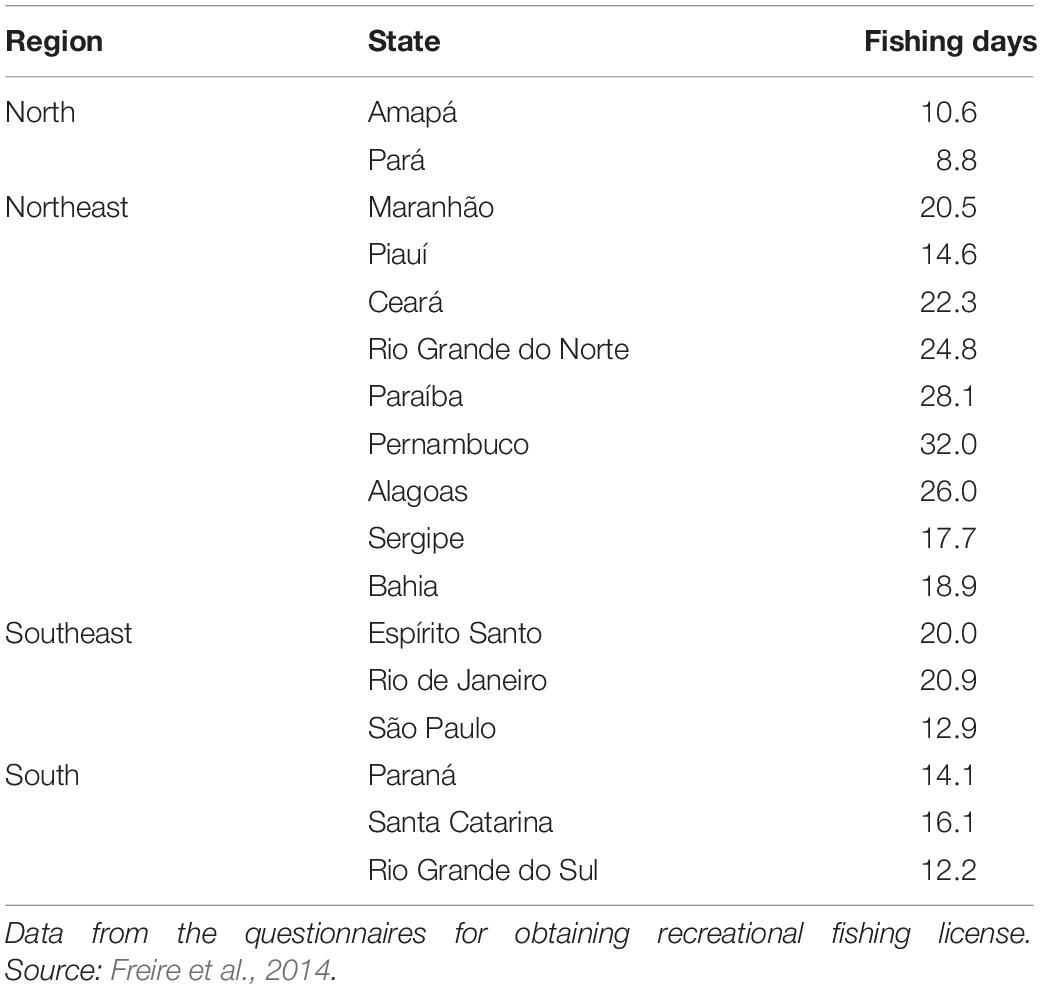
Table 3. Average number of annual recreational fishing days by state and region in Brazil.
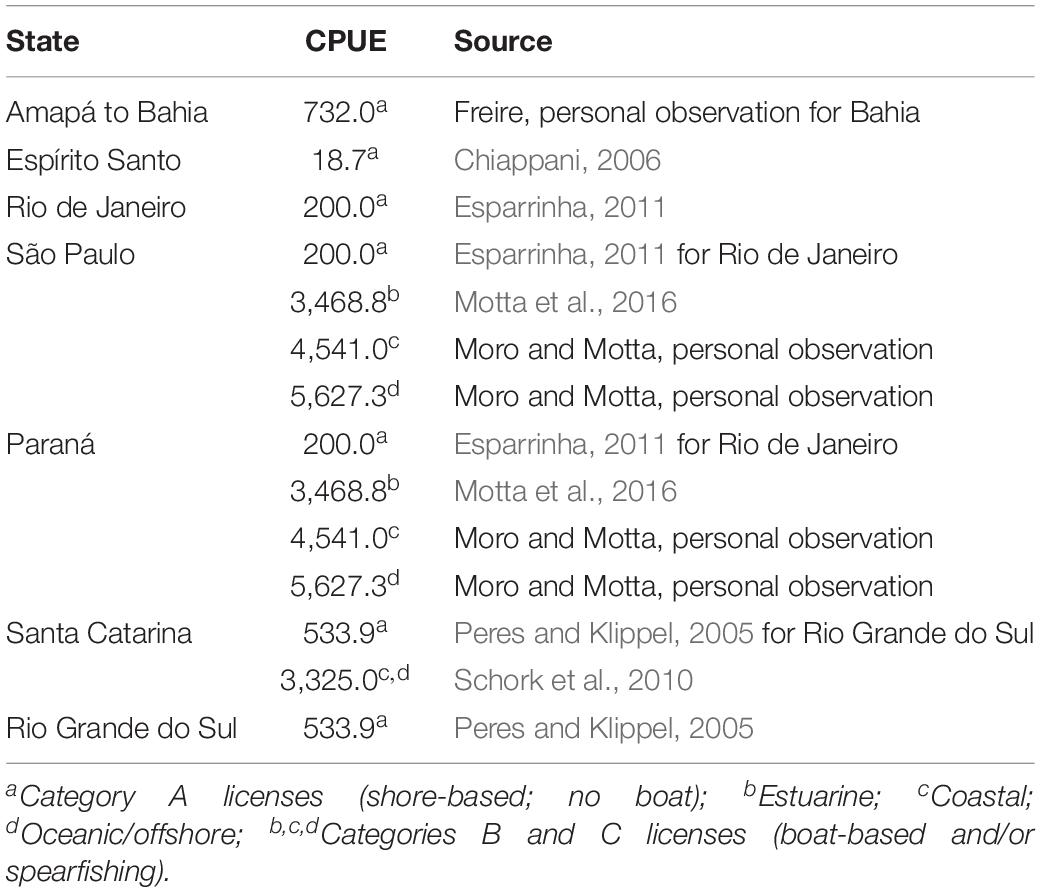
Table 4. Marine recreational catch per unit effort (CPUE; g⋅fisher–1⋅day–1) by state in Brazil.
A second component of recreational fisheries consists of organized competitive fishing events (Schramm et al., 1991) that regularly take place across the country. For this component, we used a database that has been compiled since 2001 and updated annually (Freire, 2005). For years with events that were missing records, we estimated likely catches using linear interpolation to obtain the ‘total catch from fishing events’ (TCFE) in tonnes. Thus, total recreational catch (TRC) for each year was estimated as:
This procedure was repeated for each of the 17 coastal states for the period 1950–2010, as detailed in Freire et al. (2014), and globally integrated with other fisheries sector catches in Pauly and Zeller (2016a, b). As these reconstructed recreational catches were steadily increasing up to 2010 (Freire et al., 2014), linear regressions were used for the present study to extrapolate from the pre-2010 periods to 2014 for each state. Thus, we assumed a continuation of the pre-2010 trend into the first half of the current decade. Further research will be required to examine if this assumption holds for all states.
The reconstructed recreational catch tonnages were not taxonomically disaggregated to species level, given the very high diversity of species caught along the very long Brazilian coast that spans three Large Marine Ecosystems (Pauly et al., 2008; Sherman and Hempel, 2008) and eight Marine Ecoregions (Spalding et al., 2007). Furthermore, studies with representative and reliable information on the taxonomic composition of recreational catches in Brazil are still rare. Given the well documented complexity and extremely high inconsistency of taxonomic nomenclature in Brazil (by highly localized and inconsistent common names), makes it extremely difficult to obtain reliable and actionable information on taxonomic composition (Freire and Pauly, 2005). Results of recreational fishing tournaments usually do not report catch per species but instead total number and total weight of all fishes caught by each fisher in each event (Freire et al., 2016). The only exception is for offshore events, which record catches by species. However, many of these records have been lost or are not available.
Angola
Interest in recreational fishing in Angola (Figure 1) is increasing, as illustrated by the growing number of foreign recreational fishers in recent years (Potts et al., 2009), despite a decline in the size of fishes caught (Potts et al., 2011). The present summary is based on the technical work of Belhabib and Divovich (2014), as updated by Belhabib and Divovich (2015), and highlights the main steps used for the reconstruction of recreational catches for this country.
Catches per fisher were recorded for 1974, 1992, and 2013 (Anon, 2014)2, and averaged 2.83 ± 1.07 kg⋅fisher–1⋅hour–1 for recent years. This estimate closely matches the 2.2 ± 0.03 kg⋅fisher–1⋅hour–1 reported by Potts et al. (2009) for the period 2005–2010. Potts et al. (2009) also estimated the catch per unit effort (CPUE) for 2005, 2006 and 2010 for dusky kob (Argyrosomus coronus), bluefish (Pomatomus saltatrix) and leerfish (Lichia amia), which jointly represented 87% of the total CPUE. We added the remaining 13% to this value to account for ‘other’ species. Earlier records (i.e., for 1974) suggested a predominance of sharks (e.g., hammerheads, Sphyrna spp.) and large pelagic species (e.g., Indo-Pacific sailfish, Istiophorus platypterus, formerly I. albicans) in recreational fishing (Anon, 2014), thus suggesting a distinct shift in recreational targeting. The CPUE data source for 1974 (catch per fisher) was based on the earlier target taxa (sharks and large pelagics), and it was that CPUE that was used for the pre 1974 period. Given the lack of CPUE information for the 1950s and 1960s, we did make a simplifying assumption that the 1974 shark and pelagic CPUE rate held constant back to 1950. We assumed this justifiable as the target taxa did not likely change over that time frame (1950–1974) and pelagic stocks were only lightly fished at that time. Thus, the changes in recreational targeting between the pre-civil war period (1950–1974) and the post-civil war period (2000 onward) was accounted for through the use of different CPUE data sources that were specific to each period and target grouping.
With regards to the number of recreational fishers in Angola, the periods for which records are absent correspond to the civil war years (e.g., 1975–1991, 1993, 1998, 2001–2002), suggesting that existing numbers of fishers are primarily and directly related to foreign tourists or possibly colonial staff during the pre-independence period. The existence of records as early as 1974 suggests that recreational fishing also occurred during the pre-1975 Portuguese colonial period. Angola has numerous safari lodges, but few that heavily focus on recreational fishing: Flamingo and Kwanza Lodges3, which welcomed 655 (Potts et al., 2009) and 328 recreational fishers per year, respectively (based on same assumed relationship between lodge room capacity and visitor numbers as for Flamingo Lodge, Potts et al., 2009), and Cunene Lodge, with an estimated 195 fishers (Belhabib and Divovich, 2014, 2015). This adds to a minimum of 1,208 foreign recreational fishers per year in 2010. For 1950, we assumed the number of foreign or colonial recreational fishers was half that of 2010 (i.e., 604), and assumed this number declined consistently to zero fishers by 1975, due to the 1961–1974 War of Independence. During much of the civil war period from 1975 to 2002, we assumed very little to no recreational fishing occurred. In the earlier, colonial period in Angola, tourism was not as strongly developed and often focused on land based activities, as did much of the economy. Thus, less marine fishing for recreational purposes was assumed to occur, in contrast to marine commercial fishing. The rise of the anticolonial struggles and eventually the civil wars in the early 1960s further decreased any tourism interest. This information formed the knowledge foundation on which we based our assumption of half the number of marine recreational fishers for 1950. For the years 1992, 1999, and 2000, i.e., the relatively peaceful years during the civil war period, we assumed the number of foreign recreational fishers was 1% of the number in 2010. The number of foreign recreational fishers for 2002–2010 was linearly interpolated from zero in 2002 at the end of the civil war to 1,208 in 2010, thus assuming a linear growth in fishing tourism after the civil war.
Tourists generally spend six fishing days per visit (Potts et al., 2011). Considering a conservative five fishing hours per fishing day, we multiplied the documented (Potts et al., 2009; Anon, 2014) and derived CPUE (see above for 1950) by the derived number of foreign recreational fishers for each year to obtain the total recreational catches made by visiting foreign or colonial recreational fishers in Angola between 1950 and 2010. To update the reconstructed catches, the number of recreational fishers was determined for 2011–2014 by extrapolating the interpolated rate of increase in foreign recreational fishers from 2002–2010 forward to 2014. We thus assumed a continuous growth in recreational fishers after 2010. The number of hours and days spend fishing, and the CPUE were assumed to remain constant between 2010 and 2014. These assumptions of a continuous growth in fishing tourism and constant recreational CPUE in Angola require further investigation. Throughout, we conservatively assumed that no recreational fishing was undertaken by local Angolans, i.e., we only estimated foreign or former colonial staff recreational fishing. This conservative assumption may need to be revisited in the future, as with the developing economy in Angola, one can expect increasing interest in domestic recreational fishing4. Given the very strong economic disparity between colonial rulers and the local population during the colonial period, we considered it extremely unlikely that local people that were subjugated with forced labor and deliberately economically disenfranchised would have engaged in recreational fishing during this time. Any non-commercial fishing by local people would most likely have been as subsistence fishing, which was addressed separately in Belhabib and Divovich (2014).
The smooth patterns of catches over time obtained here, and in many other country estimates (see Supplementary Materials), were due to the assumptions based around the sparse time series anchor points of information available. Such smoothness of catches over time, i.e., a lack of inter-annual variability, is the unfortunate byproduct of the limited data sources available for recreational fisheries in most countries around the world, especially for earlier time periods. Nevertheless, such estimates, despite high uncertainty and unnaturally smooth time series, are better than no estimates (i.e., no data) which would perpetuate the ‘no data = zero catch’ problem in global fisheries statistics (Pauly and Zeller, 2016a).
To taxonomically allocate recreational catches for Angola, we calculated the percentage contribution of each of the two major listed taxa for 1974 (Anon, 2014) and applied these for all pre-1975 catches, thus assuming the taxonomic disaggregation was constant between 1950 and 1975. The taxonomic breakdown of recreational landings from 2010 (Potts et al., 2009) was used to taxonomically disaggregate recreational catches for all post-1975 years. Clearly, this assumption denies the inter-annual variability in taxonomic composition that was certain to have existed, but could not be replicated due to a lack of information over time.
The Philippines
The official government fisheries statistics in the Philippines (Figure 1) include data on commercial fisheries only (Palomares and Pauly, 2014). Thus, except for ‘record’ catches listed on sport fishing websites, no consolidated reports of recreational fisheries catches are available. The present summary is based on the preliminary reconstruction of recreational catches in the Philippines by Espedido et al. (2014), and is described in detail in the Supplementary Materials.
The recreational fishing sector in the Philippines was assumed to consist of two major components: (1) angling at organized competitive fishing events, mainly for large and medium pelagic fishes; and (2) reef fishing with spear gun, with and without SCUBA gear. No other form of recreational fishing, e.g., shore-based or boat-based coastal or reef-based angling, is thought to exists to any significant extent in the Philippines, as most such activities would fall under the category of subsistence fishing for food, which is addressed separately in Palomares and Pauly (2014) and not deemed truly recreational. However, with increasing economic development and the expected growth in the middle-class, this may change in the future.
Angling for pelagic ‘gamefish’ or sport fishing started as early as 1936 with the catching of wahoo (Acanthocybium solandri) and was practiced mostly by expatriates, i.e., relatively wealthy foreign nationals working in the Philippines. In 1940, members of the Manila Yacht Club established the Philippine Game Fishing Foundation (PGFF). After World War II, the PGFF reestablished itself only in the 1960s, organizing about eight competitive fishing events per year in marine waters. By the mid-1980s, sport fishing became more popular among wealthy Filipinos and at least two new clubs were established: the Panay Anglers Association Inc. and the Philippine Sport Fishing Club.
There are no specific laws governing sport fishing in the Philippines, although all fishing activities are governed according to the Philippine Fisheries Act No. 4003, which requires reporting of catches to local government bodies. Event organizers are thus required to submit tournament results to the local office of the Department of Tourism where the tournament is held. These records are supposed to be submitted to the national office, but are not made publicly available. However, our team was permitted to look at the national office records under supervision, and take some notes. No copies were allowed to be made. These notes were then used to verify the tournament records obtained from club records. Interestingly, the records from the national office of the Department of Tourism were much less detailed than what we were led to believe, and we deemed these to be unreliable. Instead, we used the club records which were considered more complete. Thus, we used the notes obtained from viewing the Tourism Department records to confirm the club records. This is described and listed in the Supplementary Materials (Supplementary Materials Part 2 Table 8). We contacted the two largest clubs that hold tournaments, and also conducted phone and email interviews with individual fishers who were present at several of these tournaments, asking the following questions: (1) what (species) was their average catch per tournament; (2) how much did this average catch weigh; (3) how many fishers turned up for the tournament they participated in; (4) if they participated in multiple tournaments, what was the average number of participants that they fished with in these tournaments; (5) where did they fish. As these interview data were subjective (responses by individuals rather than by the organization or the club), they were not used as records per se, but rather used to confirm that the data obtained from club records (Supplementary Materials Part 2 Table 8) were representative of what occurred during these tournaments. We reconstructed recreational fisheries catches for the period 1960–2010, given the lack of historical records on the existence of sport fishing prior to 1960. Thus, catch information used in this study was gathered from fishing club catch records (i.e., name and weight of fish caught, location, and date), photos and videos (sometimes with species name, catch date and location, species length and/or weight) posted on websites or other social media from 2006 to 2013. The PGFF website5 provided the most extensive information on sport fishing in the country: catches by family/species, dating back to the 1980s, and tournament records since 2002. Currently, over 25 fishing clubs compete in national fishing events and sport fishers from 17 countries participate in international tournaments held in the Philippines. Most of these sport fishing organization websites use FishBase (Froese and Pauly, 2019) as reference for fish identification, which are usually correct at species level. We realize that many of these documentation sources are likely biased toward ‘record’ fish or ‘record’ catches, and may not reflect average catches.
The number of tournament anglers was estimated from monthly PGFF tournament data from 2002 to 2013, complemented with data from the annual Siargao International Game Fishing Tournament. For 1966, we used information from an historical anecdote (63 members, with 17 new members in 1967, Espedido et al., 2014) to estimate an approximate number of tournament anglers. We performed a (log)linear regression analysis of the number of tournament participants per year to obtain approximate estimates for years without such data between 1960 and 2014. We realize that this approach may miss inter-annual variation in participation, or the influence of socio-economic events that may affect participation such as the 1986 People Power revolution that saw the end of the Marcos regime.
The number of fishing days per year was estimated from the number and duration (in days) of tournaments per year. On average, fishing events last 4 days and there are, on average, eight tournaments per year, thus, the assumed number of tournament fishing days per year is 32 (Espedido et al., 2014).
The daily catch per tournament angler (kg⋅day–1⋅fisher–1) was estimated as the sum of the weight of fish caught in a given year (which may include several tournament records) divided by the number of fishers, assuming 1 record corresponds to 1 fisher⋅day–1. We carried out a log-linear regression analysis on the available data to estimate missing annual CPUE values for 1960–2014.
Thus, the total catch from competitive fishing events, TCFE, was estimated as:
Compared to angling, spearfishing is not as popular, because Philippine regulation bans it in most parts of the country (Walsh, 2013), although there are contradictory reports6. The bulk of spearfishing data are from photos, videos, or blogs of a handful of people, and from comments by spearfishing enthusiasts. These seem to represent the majority of active spear fishers. Recreational spearfishing is not widespread in the Philippines, and is in effect practiced mostly by tourists and expats. The enthusiasts who were interviewed and the sport fishing organizations who were contacted for this study confirmed that if the blogs, photos and videos were used, we would have already accounted for the bulk of the catch that was caught by recreational spearfishers. More recently, one group is promoting spearfishing as a free-diving activity and another group as a scuba-diving activity. Information about fish length and/or weight, when available, was encoded directly from website/photo/video records or inferred from general, broad indicators. We realize that many of these documentation sources are likely biased toward ‘record’ fish or ‘record’ catches, and may not reflect average catches. Fish species were identified to the nearest possible taxon, if not readily available from the record. Weight, when not provided, was estimated from a length-weight relationship from FishBase for the species in question.
We performed a (log)linear regression analysis of the 1965–2013 data available to obtain empirical estimates of the number of spearfishers for 1960–2014 (Supplementary Materials Part 2 Table 8).
The number of spearfishing days per year was obtained assuming that the spearfishing season lasts seven months from April to October (and avoids the winter months) and that the activity occurs in 2 out of 4 weekends in a month and is practiced for half a day each day during the weekend. This results in an assumed average of 14 spearfishing days per year.
The daily catch per spear fisher was estimated as the average catch rate computed from the catch data available, assuming conservatively that 1 data point corresponds to 1 spearfisher⋅day–1. Although most data available from these data sources may represent exceptional (‘record’) catches rather than average catches, we consider that the total catch tonnages obtained with these data may still be conservative for total annual catch volumes, even if average fish weights or sizes may be overestimated due to perceived ‘record’ catches likely being documented only.
Thus, the total catch from spearfishing, TCS, was estimated as:
Finally, the reconstructed total recreational catches (TRC) for the Philippines were obtained as the sum of catches originating from angling in competitive fishing events and spearfishing:
We analyzed the taxonomic catch composition using the rank and percentile method described in Espedido et al. (2014). See Supplementary Materials for details.
For the present study, the overall recreational catch data were extended from the original end date of data in 2010 as described in Espedido et al. (2014) to the standardized end date of 2014 used in the present study by extending the number of recreational fishers to 2014 using the original regression equations for anglers and spearfishers. Note that new data from tournaments for 2010–2018 are available (e.g., regular PGFF tournaments are held 8 or 9 months per year with 20–60 recreational fishers per tournament), which indicate that, on average, the amount and species of fish caught are similar to the 2010 levels. Thus, the number of days spent fishing and the taxonomic breakdown were assumed to have remained constant at the 2010 levels, and the catch per spearfisher per day was carried forward unaltered to 2014.
The United States of America
The United States of America (Figure 1) has one of the oldest and most extensive data collection systems for recreational catch statistics in the world. Throughout the period analyzed here (1950–2014), different approaches were used for the East Coast (Maine, New Hampshire, Massachusetts, Rhode Island, Connecticut, New York, New Jersey, Pennsylvania, Delaware, Maryland, Virginia, North Carolina, South Carolina, Georgia, and the east coast of Florida), the Gulf of Mexico (west coast of Florida, Alabama, Mississippi, Louisiana, and Texas), West Coast (California, Oregon, and Washington), Alaska, and Hawaii, depending on the data available for each region. Because reconstruction of both commercial as well as non-commercial marine fisheries catches for the United States is complex, the Sea Around Us will publish a detailed description elsewhere. Thus, the information presented here is based on Doherty et al. (2015b, d) and McCrea-Strub (2015). Here, we will describe only the main databases and methodology applied to the recreational catch reconstruction. See Supplementary Materials for details.
The U.S. Fish and Wildlife Act of 1956 regulates collection and dissemination of recreational fishing statistics in the United States. In 1960, the Salt-Water Angling Survey reported the first national estimate of total recreational catch by species, region, and method of fishing (Clark, 1962). After finding several problems in this survey, the National Marine Fisheries Service (NMFS) established the Marine Recreational Fisheries Statistics Survey (MRFSS) in 1979. Later, a review of the MRFSS methods detected some biases in the estimates and an improved survey methodology, the Marine Recreational Information Program (MRIP), was developed and implemented in 2008. Thereafter, the earlier MRFSS estimates were recalculated to address the earlier bias. However, concerns about weaknesses of the approach have been noted also for the MRIP, and revisions are ongoing. Furthermore, the MRIP may not adequately address the diversity in recreational fishing between, for example, offshore and inshore fishing, or reef versus pelagic targeted fishing. Future research on the US recreational catch data can address such concerns and thus eventually lead to further refinements in the data.
U.S. East Coast and Gulf of Mexico
National or regional recreational catch and effort data are scarce from the 1950s to the 1970s, before the implementation of the MRFSS in 1981. To reconstruct recreational catches for 1950–1980, we calculated the mean catch per unit effort (CPUE) for the earliest five years of the MRFSS dataset and applied it to annual recreational effort estimates derived from the National Surveys of Fishing, Hunting and Wildlife-Associated Recreation (FHWAR) for the years 1955, 1960, 1965, 1970, 1975, and 1980. We recognize that extrapolating more recent CPUE data into earlier time periods adds uncertainty and can create potential issues, as fishing gear and fishing technology may have changed over time, resulting in potential changes in the numbers, types, and sizes of fish caught in recreational fisheries. Thus, our efforts should be viewed as preliminary and provisional in nature. Future research should evaluate and develop such changes by re-creating more comprehensive historical time series of likely CPUE and other catch metrics.
FHWAR surveys provided nationwide estimates of the total number of anglers and the total number of fishing days for salt and fresh water combined. For each year, a nationwide ratio of saltwater anglers to total anglers was applied to the total anglers in each region to approximate the number of saltwater anglers. The surveys assumed that the number of days spent fishing in each region was proportional to the number of saltwater anglers in that region. Annual catch and effort estimates by species for 1981–1985 were extracted from the MRFSS database.
To apply CPUE estimates derived from the MRFSS database to effort estimates derived from FHWAR surveys, the annual number of days spent saltwater fishing was converted to number of trips, using the mean ratio of trips to days. FHWAR surveys from 1955 and 1960, as well as from more recent years (starting in the 1990s), provide annual estimates of both saltwater days and trips nationwide. The mean ratio of trips to days for 1955, 1960, 1991, and 1996 equaled to 0.86 (range: 0.84–0.88). To avoid overestimating catches for 1950–1980, the number of trips from FHWAR surveys was adjusted using the ratio of MRFSS total trips to FHWAR surveys total in 1985 (ratio = 0.384). We had to estimate the number of fishing trips for 1950, since no data were available. As the annual number of trips estimated from FHWAR surveys clearly increased linearly, a linear model was fitted to these data and used to predict the number of trips in 1950. The number of trips during the missing years (i.e., 1951–1954, 1956–1959, 1961–1964, 1966–1969, 1971–1974, 1976–1979) was then estimated by linear interpolation. We recognize that the time periods of missing data in this case includes the Vietnam War period and Civil Rights unrest period (1960s) and a significant recession, and thus the linear interpolations used here for US recreational fishing may have missed important socio-economic events that may have influenced the number of fishing trips and hence recreational catch during these periods. Our linear records for these time periods should thus be considered with caution and treated as preliminary. We hope that future research may address these issues, and may create a more nuanced time series for these periods for all US areas.
The mean CPUE for 1981–1985 was calculated for each species and state in the MRFSS database. For each species, resulting annual catches were summed for groups of states (e.g., Florida, Alabama, etc.) to produce region-specific estimates, which were divided by the total number of trips. Catch estimates by species in each region were then calculated for 1950–1980 by multiplying the mean species-specific CPUE for each region by the total number of estimated trips in each year.
Figueira and Coleman (2010) provide a database with estimates of annual, taxon specific catches (by weight) by region for 1981–2004. Their database was primarily based on the MRFSS, and they filled data gaps with information from the Texas Department of Fish and Wildlife and the NMFS headboat survey program. Headboats are fishing boats that take recreational fishers out for fishing while paying an individual fee per person instead of renting the entire boat.
Recreational catches for 2005–2014 were obtained from the Marine Recreational Information Program (MRIP). Some records indicate only catches by number. To estimate catch by weight, the mean weight of an individual fish was calculated for each region for 2005–2010 using the species-specific records in which both catches by number and weight were known, and multiplied by the number of fish caught. Some missing weights for 2011–2014 were due to categorizations only to the family level. In these cases, the average individual fish weight was calculated over all member species and multiplied by the number of fish caught.
The NMFS Southeast Region Headboat Survey program provided data on party or headboat trips from North Carolina to Florida and the Gulf of Mexico states for 2005–2010 and the total number of headboats for 2011–2013 came from National Marine Fisheries Service (2015). Since headboat data were unavailable for 2014, the number of vessels in 2013 was held constant for 2014. We calculated annual catch per boat and used the average catch per boat from 2005–2010 and applied that to the 2011–2014 headboat data. The taxonomic breakdown of recreational catches in 2010 was held constant for 2011–2014.
U.S. West Coast
Similar data sources were used to estimate recreational catches for the U.S. west coast for the period 1980–2014. The database provided by Figueira and Coleman (2010) was used to reconstruct catches from 1981 to 1989 and from 1993 to 2002. The Recreational Fisheries Information Network (RecFIN)7 database, which compiles state and federal recreational data (e.g., MRFSS and MRIP) for the west coast states of California, Oregon, and Washington, provided data for 1980 and 2003–2014. We used linear interpolations to estimate catches for the years 1990 to 1992, when the MRFSS was not conducted.
Recreational catch data were also available from the logbooks of California’s commercial passenger fishing vessels (CPFVs) or ‘party boats’. These data have been collected by the California Department of Fish and Game (CDFG) since 1936 (Hill and Schneider, 1999), and we used them to reconstruct California’s recreational catch from 1950 to 1979. Party boat logbook data represent a large component of recreational catch, but it is not a complete estimate of total recreational catch, as there are also anglers who fish on private boats and from shore (Chadwick, 1962; Guel and Clark, 1968; Guel, 1973; Stevens, 1977; Collins et al., 1980; White, 1986). It was necessary to increase party boat catches by a factor (KCA) for different species and years to estimate the total recreational catch: KCA = total recreational catch/total charter boat catch. We used specific KCA values for different species and time periods, compiled from Guel and Clark (1968), Guel (1973), Collins et al. (1980), White (1986), Crone et al. (2009), and Figueira and Coleman (2010).
Other data sources were used to complement or replace time series for specific taxa in the main databases. Recreational catch estimates of Pacific halibut (Hippoglossus stenolepsis) and salmon relied more heavily on datasets from the California Department of Fish and Wildlife (CDFW), the Oregon Department of Fish and Wildlife (ODFW), the Washington Department of Fish and Wildlife (WDFW), the International Pacific Halibut Commission (IPHC), and the Pacific Fishery Management Council (PFMC), which are considered more accurate than the RecFIN estimates for these species. Additional historical catch data for salmon (Oncorhynchus spp.) (INPFC, 1979; PFMC, 1993, 2013), albacore (Thunnus alalunga) (Holts, 1985), Pacific halibut (Hippoglossus stenolepis) (Miller and Gotshall, 1965; Skud, 1975), and rockfish (Sebastes spp.) (Ralston et al., 2010) were used to fill time series gaps for earlier years, whenever the other databases provided no information.
These data provided historical time series for 1950–1979 to reconstruct catches for most of the finfish species landed by recreational anglers on the West Coast — species that accounted for 99, 90, and 42% of recreational catches from 1980–2010 for California, Washington, and Oregon, respectively. Additional 1% (California), 10% (Washington), and 58% (Oregon) were subsequently added to the annual reconstructed recreational catches for 1950–1979 to account for unreported taxa.
Recreational fishing for crabs and a variety of clams, is a popular activity along the U.S. west coast and was also estimated for 1950–2014. California recreational catches were estimated for abalone (Haliotis spp.), California spiny lobster (Panulirus interruptus), crabs, and a variety of clams, using data from CDFW (P. Kalvass, unpublished data), Mello (1981), Wendell et al. (1986), Moore (2001), Haaker et al. (2001, 2004), Hankin et al. (2004), McVeigh et al. (2010), and Neilson (2011). Washington shellfish data were obtained from WDFW8 for dungeness crab (Metacarcinus magister), red rock crab (Cancer productus), spot prawn (Pandalus platyceros), Pacific oyster (Crassostrea gigas), and Pacific razor clam (Siliqua patula). For Oregon, we gathered data for dungeness crab (Ainsworth et al., 2012), Pacific razor clam (Link, 2000; Hunter, 2008; ODFW, unpublished data, provided by M. Hunter), and bay clam (Ainsworth and Vance, 2009). Many of these data were listed as numbers of individuals and converted into weights. Time series were often incomplete and only available for select years; therefore, we used the available data as anchor points and generated per-license catch estimates. These CPUE estimates were then used in conjunction with annual historical fishing license data from the U.S. Fish and Wildlife Service to estimate catch for unreported years9.
Alaska
The Alaska Department of Fish and Game (ADFG) has conducted statewide estimates of recreational catch since 1977, recorded as the number of individual fish caught for various species. Catch data for marine species from these surveys were compiled from historical reports (Mills, 1986; Howe et al., 1996) and data readily available from the ADFG10, and converted into weight to reconstruct recreational catch from 1977 to 2014 for all species, excluding the Pacific halibut. As data prior to 1977 are lacking, the number of fishing licenses issued in Alaska for 1950–1976 from the U.S. Fish and Wildlife Service was used as a proxy for annual fishing effort. We used the average annual catch per license from 1977 to 1981 in conjunction with the number of fishing licenses in Alaska in each year to estimate recreational catch from 1950 to 1976.
Pacific halibut recreational catch estimates since 1977 from the International Pacific Halibut Commission (Williams, 2012) were used to reconstruct recreational catch from 1977 to 2014. Catch estimates, in number of fish, were obtained for 1973–1975 from Skud (1981) and converted into weight.
Hawaii
For Hawaii, recreational catches were obtained from a catch data reconstruction for 1950–2002 commissioned by the Western Pacific Regional Fishery Management Council (Zeller et al., 2005, 2008). For 2003–2014, data from the Marine Recreational Information Program (MRIP) were used for recreational catch. Recreational data were converted from number of fish to catch tonnage based on length-weight conversion factors based on an assumption of half the maximum length from FishBase (Froese and Pauly, 2019). The 1991 anchor point from Hamm and Lum (1992) was used to disaggregate catches into the taxonomic composition for 1950–1991. The taxonomic composition was interpolated from 1991–2002 when MRIP taxonomic data became available. For the post-2002 period, an adjustment factor of 0.82 was applied to the catch data to account for reporting errors noted by Williams and Ma (2013).
Global Recreational Catches
Creating global time series estimates of recreational catches involved assembling the recreational catch data for every maritime country as reconstructed by the Sea Around Us over the last 15+ years (Pauly and Zeller, 2016b). Due to space constraints, we are not able to describe the estimation process for each country here, but see the Supplementary Materials for details for the 125 countries, and Zeller et al. (2016) for the basic underlying conceptual approach to reconstruction as applied in the global catch data project summarized in Pauly and Zeller (2016a). The individual data sources and detailed methods and assumptions made in each reconstruction are documented in technical reports and peer-reviewed papers associated with each country, and are summarized in the Supplementary Materials and freely available at www.seaaroundus.org. Numerous country-level estimates of reconstructed catches have already been published elsewhere (e.g., Zeller et al., 2007; Edelist et al., 2013; Ulman et al., 2013; Smith and Zeller, 2016; Derrick et al., 2017). The global estimate presented here thus represents the sum of reconstructed recreational catches for each of the 125 countries and territories for which recreational catches were estimated.
Given that all the original reconstructions focused on the 1950–2010 time period only (Pauly and Zeller, 2016a, b), the updates from 2011 to 2014 are shown in the descriptions above and in the Supplementary Materials. Overall, trends observed for the immediate pre-2010 period were retained for the 2011–2014 period, unless some significant socio-economic changes were noticed or recreational fisheries were known to have changed distinctly after 2010. We always welcome improved data and advice on changes in a country’s recreational fisheries status and data. Such changes and improved data are regularly integrated into updated versions of Sea Around Us data at www.seaaroundus.org.
Results
First, we present the results of the four country examples of recreational catch data reconstructions, followed by the global results for all 125 countries or territories based on the methods, data sources and material presented in the Supplementary Materials and associated publications.
Brazil
The estimated total reconstructed marine recreational catches in Brazil increased rapidly from around 160 t in 1950 to nearly 1,500 t in 2014 (Figure 2). The highest catches were estimated for the southern region of Brazil (including the states of Paraná, Santa Catarina, and Rio Grande do Sul), and the lowest were observed in the northern region (including the states of Amapá and Pará). We did not undertake a detailed taxonomic disaggregation of recreational catches for Brazil, as the wide range of ecosystem types along the very long Brazilian coast makes for a large diversity of target species, and local studies with useful catch composition are still too scarce to allow for such estimation.
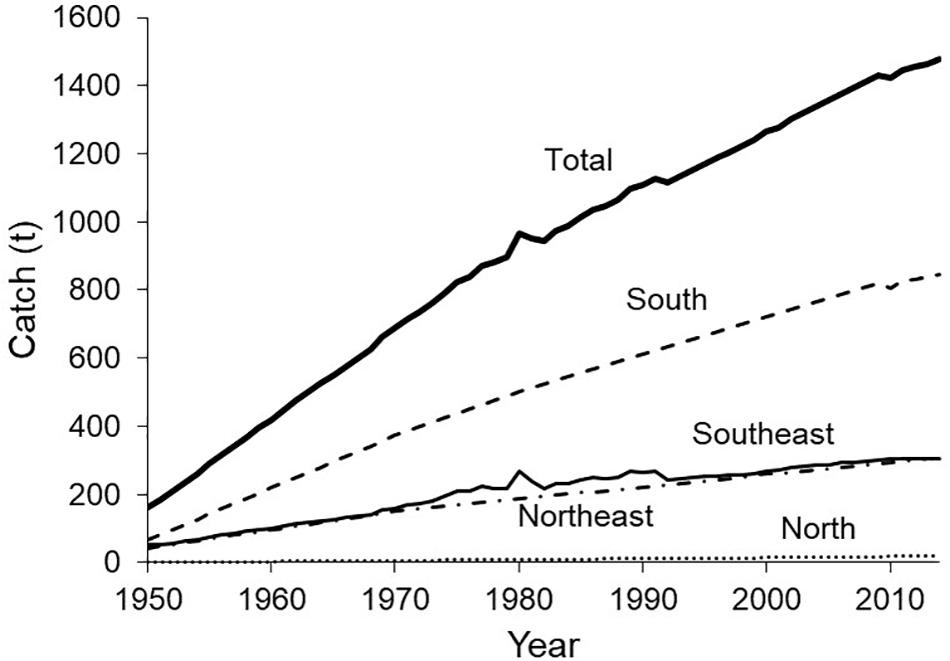
Figure 2. Total estimated catch from marine recreational fisheries by region in Brazil from 1950 to 2014 (daily recreational fishing activities plus fishing tournaments). Data based on Freire et al. (2014).
Angola
The total estimated marine recreational catches in Angola decreased from around 180 t in 1950 to 5 t in 1974 at the start of the civil war period following independence (Figure 3). During this earlier period, recreational fisheries seemed to focus mainly on Sphyrna spp. (hammerhead sharks) and Istiophorus platypterus (Indo-Pacific sailfish). The long period of civil wars, from 1975 to 2003, was not conducive to recreational fishing, as reflected in catch amounts close to zero. After 2003, catches increased rapidly to nearly 140 t by 2014 (Figure 3). By that time, catches were more diversified and mostly represented by smaller near-shore taxa readily targeted by shore-based fishing that seems predominant in Angola’s recreational sector these days, namely Pomatomus saltatrix (bluefish), Lichia amia (leerfish) and Sciaenidae (croakers).
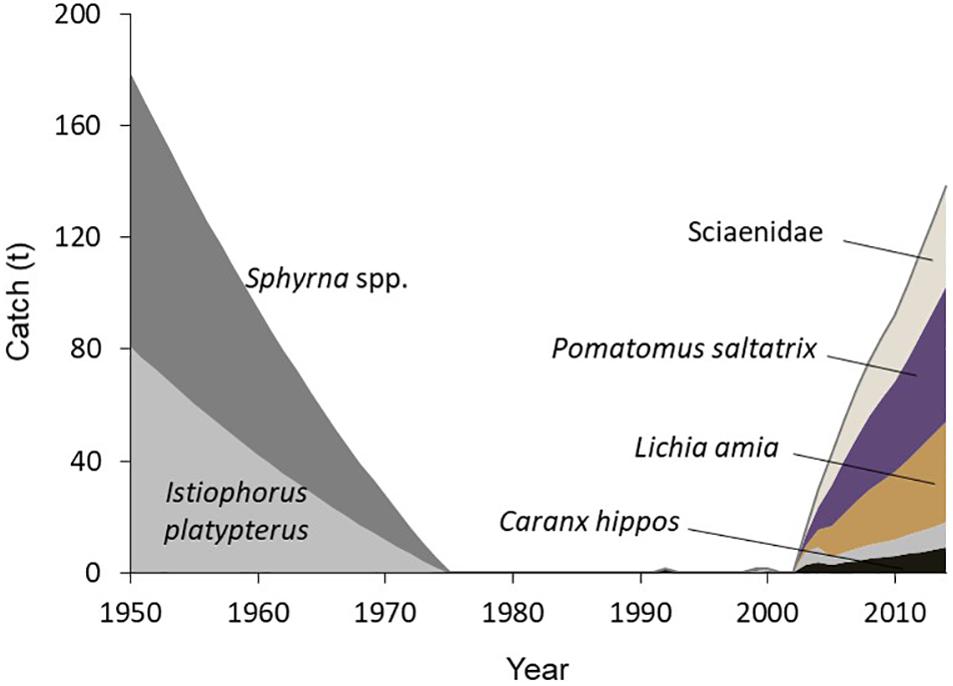
Figure 3. Estimated catches by taxon from marine recreational fisheries in Angola from 1950 to 2014. Data based on Belhabib and Divovich (2014, 2015).
The Philippines
For the Philippines, reconstructed recreational catch estimates displayed a continuously decreasing trend from around 130 t in 1950 to about 52 t by 2014 (Figure 4). Medium and large pelagic taxa dominated the catch: Scombridae (mackerels, tunas and bonitos), Istiophoridae (billfishes), Carangidae (jacks) and Coryphaenidae (dolphinfishes, Figure 4). Unspecified marine fishes accounted for 6% and Elasmobranchii (sharks, rays and skates) also accounted for large contributions to catches, especially in earlier decades (Figure 4). It is worth noting that ‘miscellaneous aquatic invertebrates’ are also caught recreationally and represented about 1.5% of total catches. Other minor catches in recreational fisheries are Pomatomidae (bluefishes), Acanthuridae (surgeonfishes), Lethrinidae (emperors), Serranidae (groupers), Haemulidae (grunts), Siganidae (rabbitfishes), and Lobotidae (trippletails), all of them grouped under “unspecified marine fishes” in Figure 4.
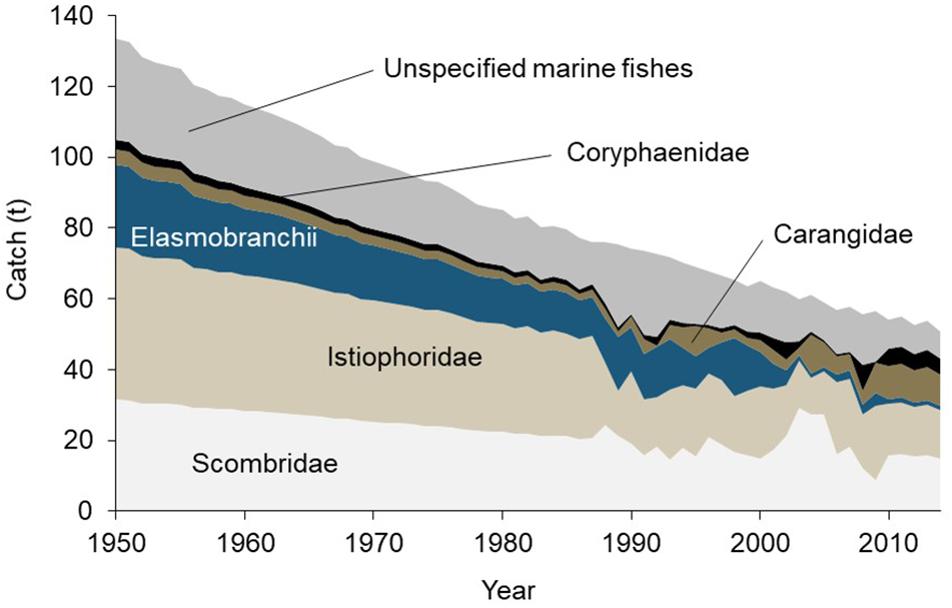
Figure 4. Derived catch composition of marine recreational fisheries in the Philippines from 1950 to 2014. ‘Unspecified marine fishes’ include Lutjanidae, Gempylidae, Sphyraenidae, Pomatomidae, Acanthuridae, Lethrinidae, Serranidae, Haemulidae, Siganidae, Lobotidae, and ‘marine fishes nei’ (not elsewhere included). ‘Marine invertebrates’ are not shown, but account for around 1.5% of recreational catches in 2010–2014. Data based on Espedido et al. (2014).
The United States of America
The marine recreational catches for the United States were the highest among the four case studies presented here. Recreational catches across the United States that were retained by the fisher (i.e., excluding catch and release) increased from around 64,000 t in 1950 to around 203,000 t by 1975, then fluctuated slightly until reaching an overall peak of 228,000 t in 1986, after which catches declined to around 160,000 t⋅year–1 throughout the 1990s (Figure 5A). A second increase to a peak of about 225,000 t in 2003 followed, before recreational catches again decreased to around 145,000 t by 2014. In general, recreational catches were the highest along the East Coast and in the Gulf of Mexico (Figure 5A). Recreational catches were also fairly common on the West Coast in the earlier decades, although they have decreased considerably since the 1990s. On the other hand, recreational catches around Hawaii have increased considerably since the early 1990s, and now exceed all other areas other than the East Coast (Figure 5A).
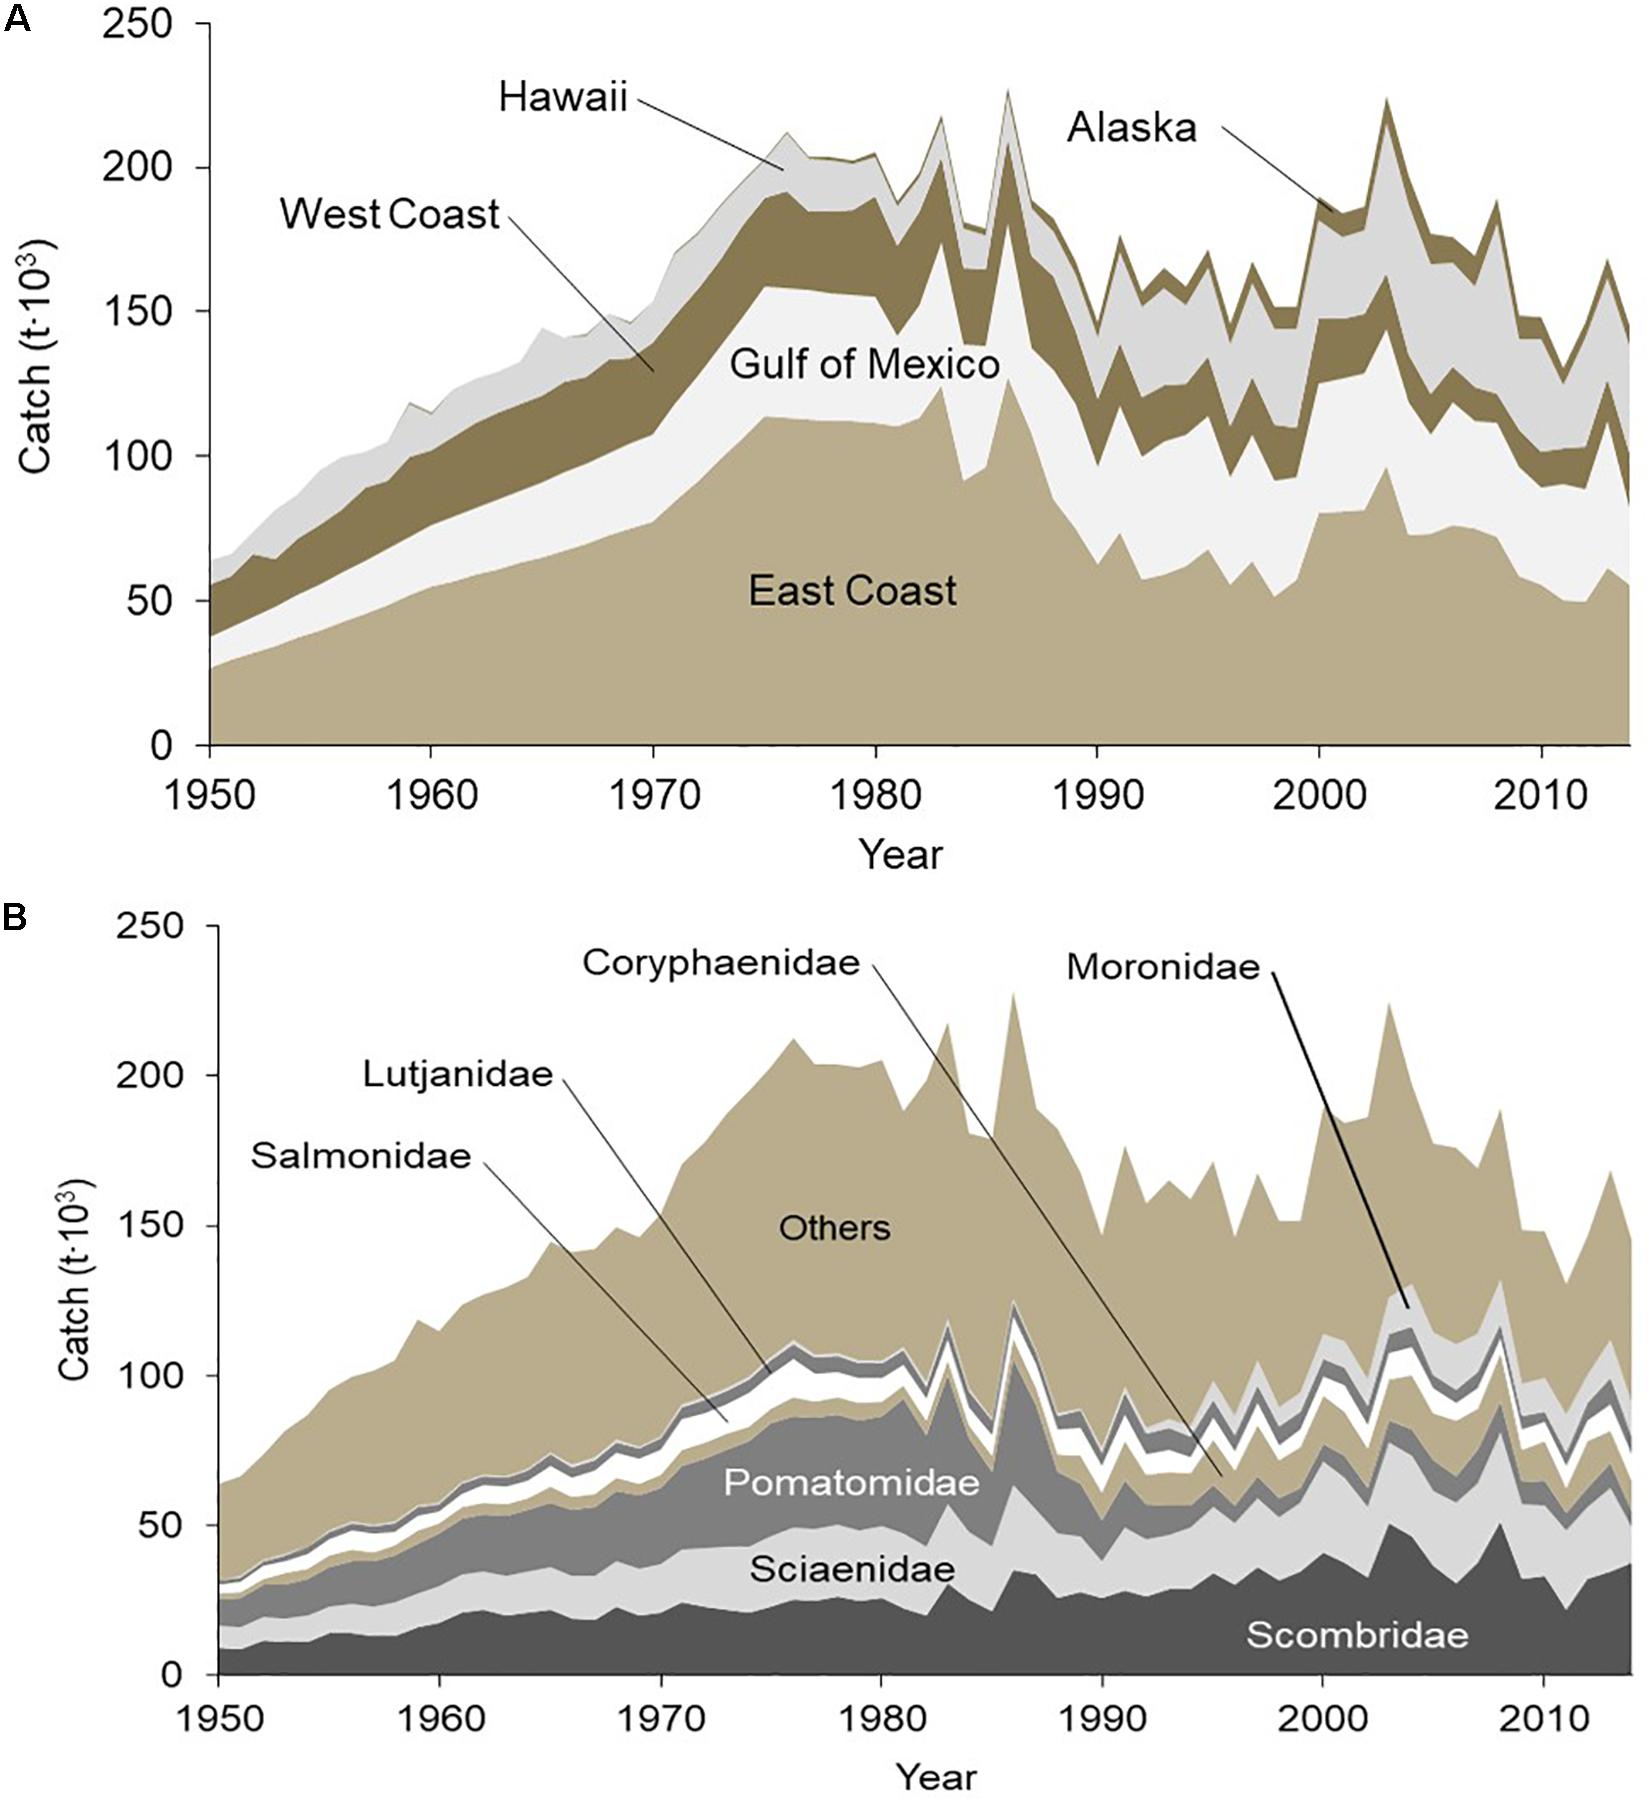
Figure 5. Catches from marine recreational fisheries in the United States of America from 1950 to 2014 by (A) different regions; and (B) taxonomic composition showing the top seven families, which represent 68% of total marine recreational catches in 2014. ‘Others’ comprises a large number of additional taxa, as well as ‘marine fishes nei’ (not elsewhere included). Data based on Zeller et al. (2005, 2008), Doherty et al. (2015b, d), and McCrea-Strub (2015).
The data underlying the US recreational catch reconstruction had the best taxonomic resolution of any data in this study. Over 120 families were included in the reconstructed estimates, and importantly, only 5% of catches fell under the highly uninformative category ‘other marine fishes’ in 2014. Overall, recreational catches in the United States were dominated by Scombridae (mackerels, tunas and bonitos), Sciaenidae (croakers), and Pomatomidae (bluefishes; Figure 5B), which jointly accounted for about 40% of total recreational catches. Throughout the period the most important changes observed were strongly declining catches of Pomatomidae starting in the 1990s and increasing catches of Coryphaenidae (dolphinfishes, commonly known as mahi-mahi) and Moronidae (basses; Figure 5B).
Global Recreational Catches
We combined recreational catch estimates for all maritime countries as reconstructed and assembled by the Sea Around Us over the last 15+ years (see Supplementary Materials) to derive the most comprehensive and detailed estimates of marine catches from recreational fisheries for 125 fishing countries and territories, including the four case studies outlined above. These estimates suggested a global total of over 900,000 t⋅year–1 being extracted from marine waters by recreational fishers in recent years (Figure 6). Estimated recreational catches increased steadily from around 280,000 t⋅year–1 in the early 1950s to just under 900,000 t⋅year–1 in the mid-1980s, and remained more or less in the low 800,000 t⋅year–1 thereafter until the late 1990s. More recently, recreational catches have been increasing again at a much slower rate to eventually reach 900,000 t⋅year–1 by 2014. The bulk of catches originated from Asia, North America and Europe, accounting for about 70% of the global total in 2014 (Figure 6). However, regional differences were observed over time: catches have been steadily increasing in Asia, South America and Africa, while catches have been decreasing strongly in North America and less so in Europe and Oceania (Australia and New Zealand mainly) since the mid-1980s (Figure 6).
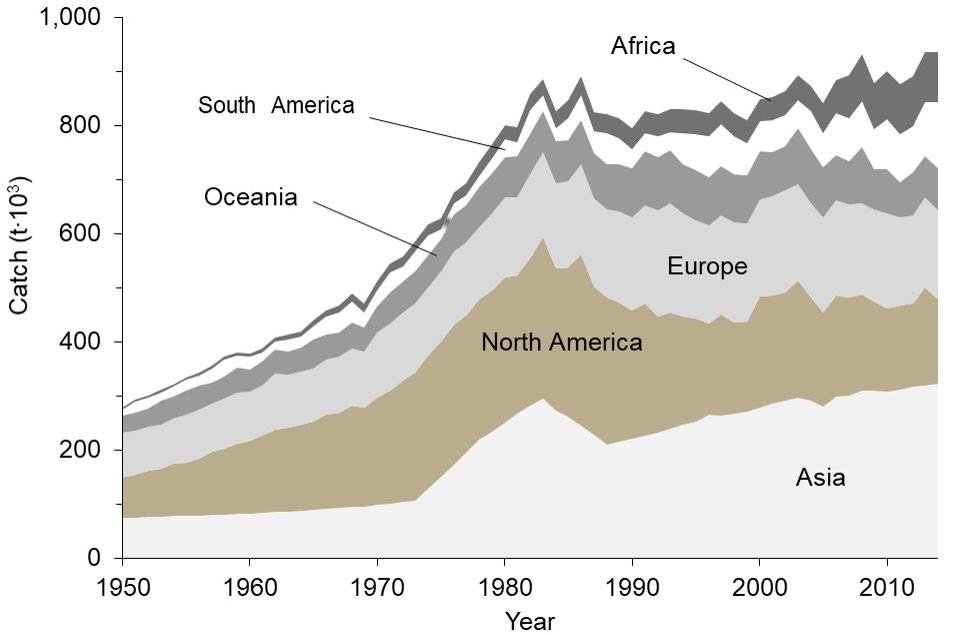
Figure 6. Global marine catches from recreational fisheries by major geographic region for 1950–2014 for all countries with marine recreational fisheries. Data based on Pauly and Zeller (2016a; 2016b, and sources therein). See Supplementary Materials for country details.
Globally, taxonomically identifiable recreational catches (Figure 7) were dominated by Sparidae (porgies; 12% of total catch in recent years), followed by Scombridae (mackerels, tunas and bonitos, 10%), Carangidae (jacks, 6%), Gadidae (cods and haddocks, 5%), and Sciaenidae (croakers, 4%). Of note is that the earlier importance of Salmonidae (salmonids) has substantially declined since the 1990s to around 3% recently, while Elasmobranchii (sharks and rays) have increased in contribution to total tonnages since the 1990s, and now account for 5–6% of total global recreational catches (Figure 7). Unfortunately, the uninformative category ‘marine fishes nei’ (nei = not elsewhere included) represented the largest single category, representing 19% of total catches. An examination by major geographic regions (Supplementary Figure S1) indicated some similarities, such as Scombridae associated with high catches in five regions, and Sciaenidae and Sparidae in four regions. On the other hand, Salmonidae contributed the highest catches in North America and Europe, while Elasmobranchii (sharks and rays) are important in Oceania and South America (Supplementary Figure S1).
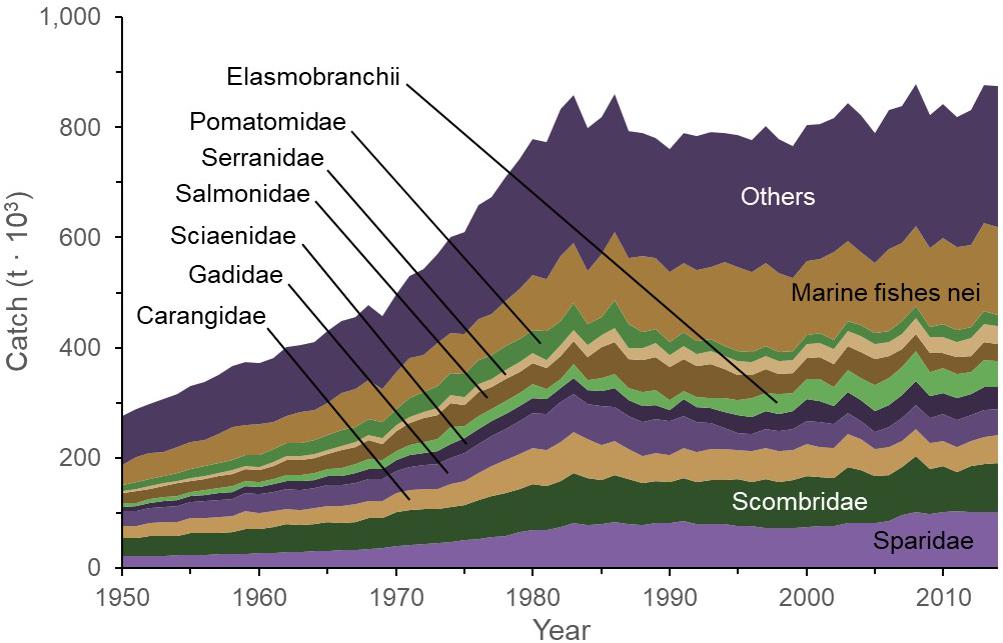
Figure 7. Taxonomic composition of global recreational catches by the nine most represented families or higher groupings. ‘Marine fishes nei’ (nei, not elsewhere included) comprises a large contribution of taxonomically unidentified catches; while ‘Others’ comprises all additional taxa with minor contributions pooled. Data based on Pauly and Zeller (2016a; b, and sources therein). See Supplementary Materials for country details.
Discussion
Estimating the global catch from marine recreational fisheries is not an easy task, as reporting on this activity is extremely sparse and highly inconsistent within and between countries and over time. Furthermore, it is sometimes difficult to delimit the boundaries of this activity, as recreational fishing sometimes overlaps with subsistence and artisanal fisheries (see Cooke et al., 2018). We found that global recreational catches may average around 900,000 tonnes per year in recent years. While not large in terms of tonnage compared to the over 100 million tonnes caught commercially each year (Pauly and Zeller, 2016a), recreational fishing has substantial economic impacts through the value adding derived from recreational activities (Cisneros-Montemayor and Sumaila, 2010).
Even though our global estimate of recreational catches is a small fraction of global commercial catches (Pauly and Zeller, 2016a), in some regions and for some taxa, recreational catches match or even surpass commercial catches (Coleman et al., 2004). A prime example of this is in The Bahamas, where recreational catches exceed the commercial take (Smith and Zeller, 2016). The time series of global recreational catch estimates for recent years suggests a pattern of gradual increase starting in the 1990s. This is due to a strong increase in recreational catches observed in Asia, and smaller increases in South America and Africa. Thus, these trends in emerging economies and developing countries sustain a gradual growth in recreational catches even though declines have been observed in North America and Europe, mainly due to decreasing participation rates in highly industrialized regions (Bower et al., 2014) as well as the likely increase in catch and release activities (Brownscombe et al., 2017), which are not treated as retained catches and hence excluded from current estimates.
Here, we consider a few of the issues encountered when estimating recreational catches, with emphasis on the four case study examples, and which are indicative of issues encountered in most, if not all, country reconstructions for recreational catches.
A major challenge we noted during our reconstruction efforts is that many scientists and fisheries experts in developed countries often erroneously assume that recreational fisheries do not exist in many developing countries, for example in West Africa. Yet, recreational fisheries can exist in even the least developed countries, where they are often associated with international tourism, and their approximate catches can be estimated based on previously unused methods, including YouTube and other social media channels (Belhabib et al., 2016).
A further issue to be addressed in recreational fisheries and their management is the species and individuals being targeted. Recreational fisheries are often directed toward trophy fishes, which can have considerable impact on the size structure of some stocks, especially if the species is a threatened species (Shiffman et al., 2014).
Recreational fisheries also increasingly emphasize catch and release as the primary method of recreational fishing (Brownscombe et al., 2017). Fish that are caught but released alive were not tallied as ‘catch’ in our reconstructions. Thus, the increasing emphasis on catch and release may account for some of the declines observed in, e.g., the U.S. recreational catches in recent years. However, catch and release practices can result in significant post-release mortality (Cooke and Cowx, 2004), but as data on this activity are generally lacking, we did not attempt to estimate the post-release mortality impacts, except for the U.S., for which reliable data are available (Figueira and Coleman, 2010; Doherty et al., 2015a, c; McCrea-Strub, 2015). Thus, unless the currently insufficiently examined catch and release mortality is consistently high, we assume that our assumption in cases of catch and release was conservative, likely leading us to underestimate both recreational fishing engagement as well as actual mortality caused by recreational fishing.
Regarding the potential sale of recreational catches, this practice is usually illegal in most countries. In countries where the sale of recreational catches is allowed, permission is usually granted only to cover the cost of fishing trips (FAO, 2012). This clearly blurs the boundaries between non-commercial recreational activities and commercial artisanal fishing. This has been shown to be particularly problematic in Algeria, where so-called recreational fishing is a smoke screen for hidden commercial activities, leading to substantial economic losses for the society as well as the legitimate commercial fisheries (Babali et al., 2018).
In some cases it is difficult to differentiate recreational from subsistence fishing. For example, Brazil has a strong consumption-oriented fishing habit (see, e.g., Freire et al., 2017), which also blurs the boundary between recreational and subsistence fishing, leading to conflicts among stakeholders (Lyman, 2008). These conflicts are more serious with groups that promote catch-and-release as a management tool (Policansky, 2002).
To illustrate how recreational catches can be considered illegal in some cases, we compared the Philippines with Brazil. Recreational fisheries in the Philippines include fishes caught by spearfishers, both with and without SCUBA gear, and competitive and non-competitive anglers (Espedido et al., 2014). Spearfishing is not explicitly stated as being illegal in federal regulations in the Philippines. Rather, it is under the jurisdiction of local governments (municipalities). Furthermore, the use of SCUBA and spear is under the jurisdiction of the Department of Tourism, and more specifically, the Philippine Commission on Sports SCUBA Diving (PCSSD), which, based on an unpublished document of rules and regulations, explicitly prohibits spearfishing using SCUBA. However, as unpublished PCSSD rules and regulations do not carry the same legal weight as federal regulations, spearfishing (with or without SCUBA) is practiced widely in the Philippines despite being considered illegal. On the other hand, in Brazil, fish cannot be caught with SCUBA, and spearfishing is allowed only using free-diving (MPA, 2012). Thus, unambiguous and consistent legislation is key to setting clear guidelines for acceptable recreational fishing activities, just as they are required for commercial fishing.
The uncertainty around catch estimates can be high in the reconstruction process for recreational fishing, especially for earlier years. However, such uncertainty can go both ways. We consider that our estimates for Brazil are likely underestimates, based on the low recreational participation rates utilized (Freire et al., 2014, 2016). For many Brazilian states, we considered only coastal catch rates (i.e., shore-based fishing), as no information was available for boat-based fishing, which would produce higher catch rates. The fishing habits of recreational fishers in the seventeen Brazilian coastal states vary; therefore, the taxonomic breakdown is highly variable and uncertain (Freire et al., 2014, 2016), and could not be presented in sufficient taxonomic detail. Given the often sparse information on the taxonomic composition of recreational fishing activities in many countries, reconstructed catch estimates by taxon need to be treated as broad approximations and viewed with caution in many cases.
As with commercial fisheries (Freire and Pauly, 2005), the widespread use of highly variable common and local names for species is a problem in recreational fisheries. Common names may differ substantially between geographic regions, even within countries, and from the names used by commercial fishers. For this reason, it was often only possible to report estimated catches at the family (or higher) level of taxonomic resolution to reduce uncertainty in the correspondence between common and scientific nomenclature. However, this can mask the impact of recreational fisheries on individual populations, such as for individual species of sharks and rays which are often reported only as Elasmobranchii. Considerable and consistent recreational catches of sharks and rays in South America and Oceania raise concerns, because these groups usually include K-strategy species with slow maturation, low reproductive output and long life histories, which make them more susceptible to overfishing. Actions such as the encouragement and re-direction of recreational shark fishing toward non- or less-lethal fishing (Cuevas, 2014) may change fishing habits from catch-and-kill to more conservationist approaches, as happened in the U.S. after the 1980s (Bonfil, 2002). On the other hand, the rise of activities such as beach-based trophy shark hunting in countries like the United States (Shiffman et al., 2017), even when nominally catch and release, is likely to put further pressure on elasmobranchs given poor post-release survivorship of species like hammerhead sharks (Gallagher et al., 2014).
An issue that also emerges is the nomenclature of organized events such as competition, tournament, jamboree, and championship. These terms are used often interchangeably, but may have different meanings, and hence different catch ramifications, in different countries. For example, in Brazil, jamboree and tournament are used to indicate events open to the public. On the other hand, championship is restricted to members of the fishing club/association that sponsors the event (Freire et al., 2014, 2016). These differences may result in substantially different catch rates and participation rates, and may have considerable impacts on the resulting catch estimates. Even though in some countries, e.g., the Philippines and Brazil, fishing event organizers are supposed to report their results to governmental organizations, we noticed that the reporting system is substantially flawed, as not all events are reported and there is little continuity over time. Often, as in the case of the Philippines, such records are not publicly available or may not be recoverable upon request from the responsible government organization. Thus, we were unable to fully compare these events with those occurring in other regions, such as North America, where extensive information is collected (Schramm et al., 1991; Schramm and Harrison, 2008).
Importantly, even in cases where governments do have data on recreational catches, e.g., from events/tournaments or annual surveys such as in the U.S. (Figueira and Coleman, 2010), fully scaled-up, country-wide recreational marine catch estimates do not seem to be incorporated into the national fisheries statistics published by these countries, nor are they included by the vast majority of countries in the data they report to FAO (but see the exception of Finland Zeller et al., 2011), despite FAO explicitly requesting such recreational catch data (FAO, 2012). For the vast majority of countries around the world, however, no such data exist as part of nationally collected and reported datasets as yet. This is why approximate reconstructed estimates, even with very high uncertainty, are better than continuing with the status quo of claiming “no data,” which is the default in most countries around the world. It is exactly a “no data” situation that leads to the under-appreciation and under-valuation of recreational and other small-scale fisheries (Zeller et al., 2015) in most countries in the world and in global discussions, as “no data” entries are not additive in numeric datasets and are thus automatically substituted with inaccurate and unreliable “zero” catches in national, regional and global summary data. The problem of not addressing and replacing “no data” through reconstructed estimates, despite data uncertainty, has been raised previously in Pauly and Zeller (2016a).
The present study represents the first comprehensive global estimate of marine recreational catches that includes complete time-series data for nearly every country in the world over the last 60+ years, and is based on a large number of detailed individual country-level catch data reconstructions (summarized in Pauly and Zeller, 2016a, b). However, there are still a number of countries for which catch data reconstructions did not address or examine recreational fisheries. This may be an additional reason for the global estimate presented here to be a conservative underestimate.
The total recreational catches from marine waters were estimated to around 900,000 t⋅year–1 for 2014, which is bracketed by the other published estimates for global recreational catches of 500,000 tonnes per year (based on limited questionnaires conducted by FAO) and 10.9 million tonnes per year (Cooke and Cowx, 2004), both of which including marine and inland catches. The second of these other estimates of 10.9 million tonnes could be consider a potentially ‘provocative’ overestimate, as it is based on a single country estimate that was then scaled up to global coverage. In contrast, our approach reconstructs catches independently for each country, before summing these independent estimates for the present global synthesis paper. We anticipate that this study, and the underlying data freely available at www.seaaroundus.org, can serve as a starting point to devise or improve national data collection and estimation procedures for catches originating from recreational fisheries by all countries in line with the annual data request by FAO. After all, ecosystem considerations in fisheries management (Pikitch et al., 2004) do require comprehensive data on all fisheries sectors (Pauly and Charles, 2015).
Data Availability Statement
The datasets generated for this study are available on request to the corresponding author.
Author Contributions
KF, DZ, and DP conceptualized and designed the study, and drafted and edited the manuscript. KF, DB, LH, DZ, and KZ led and coordinated the data collection and analysis. DB, JE, KK, VL, MM, JTM, JJM, PM, FM, M-LP, NS, and LT contributed data collection and analyses. All authors contributed to the writing and editing of the manuscript and approved its submission.
Conflict of Interest
PM was employed by the company Moro Indústria de Artigos Esportivos Ltda (sports equipment retail) in a capacity unrelated to the present study and his contributions were undertaken during his personal time.
The remaining authors declare that the research was conducted in the absence of any commercial or financial relationships that could be construed as a potential conflict of interest.
Funding
The authors acknowledge the support of the Sea Around Us and the Sea Around Us – Indian Ocean. All Sea Around Us activities were initially supported by The Pew Charitable Trusts and the Paul G. Allen Family Foundation, and are currently funded by a number of philanthropic foundations, notably Minderoo Foundation, David and Lucille Packard Foundation, Marisla Foundation, MAVA Foundation, Oak Foundation, Paul M. Angell Family Foundation, Bloomberg Philanthropies, and Oceana.
Acknowledgments
We would like to thank all current and former members and external collaborators of the Sea Around Us for helping compile data and undertaking data reconstructions over the last two decades. We thank recreational fishers for providing local information on recreational fisheries, including results of fishing events; A. R. Coghlan for preparing the map; and W. Figueira, F. Coleman, P. Kalvass, E. Kraig, D. Ayres, and M. Hunter for providing recreational catch data for the United States. Any information provided by local fishers adhered to the prevailing ethical considerations in the given country, and names and locations were treated as confidential if requested.
Supplementary Material
The Supplementary Material for this article can be found online at: https://www.frontiersin.org/articles/10.3389/fmars.2020.00012/full#supplementary-material
Footnotes
- ^ www.seaaroundus.org
- ^ www.fapd.co.ao
- ^ www.aasafaris.com
- ^ www.fapd.co.ao
- ^ http://pgff.net/
- ^ https://filipinofishingtechniques.wordpress.com/
- ^ www.recfin.org
- ^ wdfw.wa.gov
- ^ https://wsfrprograms.fws.gov
- ^ www.adfg.alaska.gov/sf/sportfishingsurvey
References
Ainsworth, J. C., and Vance, M. (2009). Recreational Shellfish Catch and Effort Surveys in Oregon Estuaries. Newport: Oregon Department of Fish and Wildlife, Marine Resources Program.
Ainsworth, J. C., Vance, M., Hunter, M. V., and Schindler, E. (2012). The Oregon Recreational Dungeness Crab Fishery, 2007-2011. Ontario: Oregon Department of Fish and Wildlife.
Anon (2014). Records do Mundo de Angola na Pesca Desportiva. Luanda: Federação Angolana de Pesca Desportiva.
Babali, N., Kacher, M., Belhabib, D., Louanchi, F., and Pauly, D. (2018). Recreational fisheries economics between illusion and reality: the case of Algeria. PLoS One 13:e0201602. doi: 10.1371/journal.pone.0201602
Barcellini, V. C., Motta, F. S., Martins, A. M., and Moro, P. S. (2013). Recreational anglers and fishing guides from an estuarine protected area in southeastern Brazil: socioeconomic characteristics and views on fisheries management. Ocean Coast. Manage. 76, 23–29. doi: 10.1016/j.ocecoaman.2013.02.012
Belhabib, D., Campredon, P., Lazar, N., Sumaila, U. R., Cheikh Baye, B., Abou Kane, E., et al. (2016). Best for pleasure, not for business: evaluating recreational marine fisheries in West Africa using unconventional sources of data. Palgrave Commun. 2:15050. doi: 10.1057/palcomms.2015.50
Belhabib, D., and Divovich, E. (2014). Rich Fisheries and Poor Data: A Catch Reconstruction for Angola, 1950-2010. Vancouver: University of British Columbia.
Belhabib, D., and Divovich, E. (2015). Rich Fisheries and Poor Data: A Catch Reconstruction for Angola, 1950-2010, an update of Belhabib and Divovich (2014). Vancouver: University of British Columbia.
Berners, D. J. (1496). “A treatyse of fysshynge wyth an angle (transcription by Risa S. Bear),” in Boke of Saint Albans, ed. D. J. Berners (London: Wynkyn de Worde).
Bonfil, R. (2002). “Trends and patterns in world and Asian elasmobranch fisheries,” in Elasmobranch Biodiversity, Conservation and Management, eds S. L. Fowler, T. M. Reed, and F. A. Dipper (Sabah: IUCN), 15–24.
Bower, S., Aas, Ø, Arlinghaus, R., Beard, D., Cowx, I. G., Danylchuk, A., et al. (2014). “Recreational fisheries in emerging economies and the developing world: identification of knowledge and management priorities,” in Proceedings of the 7th World Recreational Fishing Conference, eds E. T. Silva, A. L. Ferreira, and M. Furlaneto (São Paulo: Edições Leitura Crítica), 108.
Brownscombe, J. W., Danylchuk, A. J., Chapman, J. M., Gutowsky, L. F. G., and Cooke, S. J. (2017). Best practices for catch-and-release recreational fisheries – angling tools and tactics. Fish. Res. 186, 693–705. doi: 10.1016/j.fishres.2016.04.018
Cashion, T., Glaser, S., Perrson, L., Roberts, P. M., and Zeller, D. (2018). Fisheries in Somali waters: reconstruction of domestic and foreign catches for 1950-2015. Mar. Policy 87, 275–283. doi: 10.1016/j.marpol.2017.10.025
Chadwick, H. K. (1962). Catch record from the striped bass sport fishery in California. Calif. Fish Game 48, 153–177.
Chiappani, L. H. B. (2006). Caracterização e Avaliação da Atividade de Pesca Amadora na Praia de Camburi, Vitória – ES. Vitória: Universidade Federal do Espírito Santo.
Cisneros-Montemayor, A. M., and Sumaila, U. R. (2010). A global estimate of benefits from ecosystem-based marine recreation: potential impacts and implications for management. J. Bioecon. 12, 245–268. doi: 10.1007/s10818-010-9092-9097
Clark, J. R. (1962). The 1960 Salt-water Angling Survey. Washington, D.C: U.S. Department of the Interior.
Coates, D. (1995). “Inland capture fisheries and enhancement: status, constraints and prospects for food security,” in Proceedings of the Contribution to the International Conference on Sustainable Contributions of Fisheries to Food Security, held in Kyoto, Japan 4-9 December 1995, Organized by the Government of Japan in Collaboration with the Food and Agriculture Organization of the United Nations (Rome: FAO).
Coleman, F. C., Figueira, W. F., Ueland, J. S., and Crowder, L. B. (2004). The impact of United States recreational fisheries on marine fish populations. Science 305, 1958–1960. doi: 10.1126/science.1100397
Collins, R., Huppert, D., Maccall, A., Radovich, J., and Stauffer, G. (1980). Pacific Bonito Management Information Document. Sacramento: Resources Agency - California Department of Fish & Game.
Cooke, S. J., and Cowx, I. G. (2004). The role of recreational fishing in global fish crises. Bioscience 54, 857–859.
Cooke, S. J., Twardek, W. M., Lennox, R. J., Zolderdo, A. J., Bower, S. D., Gutowsky, L. F. G., et al. (2018). The nexus of fun and nutrition: recreational fishing is also about food. Fish Fish. 19, 201–224. doi: 10.1111/faf.12246
Crone, P. R., Hill, K. T., McDaniel, J. D., and Lo, N. C. H. (2009). Pacific Mackerel (Scomber japonicus) Stock Assessment for USA Management in the 2009-10 Fishing Year. Portland: Pacific Fishery Management Council (PFMC).
Cuevas, J. M. (2014). “Involving anglers as key stakeholders in a shark conservation programme,” in Proceedings of the 7th World Recreational Fishing Conference. Change, Transformation and Adaptation in Recreational Fishing, eds E. T. Silva, A. L. Ferreira, and M. Furlaneto (São Paulo: Edições Leitura Crítica), 75.
Derrick, B., Noranarttragoon, P., Zeller, D., Teh, L. C. L., and Pauly, D. (2017). Thailand’s missing marine fisheries catch (1950-2014). Front. Mar. Sci. 4:402. doi: 10.3389/fmars.2017.00402
Doherty, B., Gibson, D., Zhai, Y., McCrea-Strub, A., Zylich, K., Zeller, D., et al. (2015a). Reconstruction of Marine Fisheries Catches for Subarctic Alaska, 1950-2010. Vancouver: University of British Columbia.
Doherty, B., Gibson, D., Zhai, Y., Strub, A. M., Harper, S., Zylich, K., et al. (2015b). Reconstruction of Marine Fisheries Catches for Subarctic Alaska, 1950-2010. Vancouver: University of British Columbia.
Doherty, B., Harguth, H., McCrea-Strub, A., Jenkins, L. D., and Figueira, W. F. (2015c). Reconstructing Catches along Highway 101: Historic Catch Estimates for Marine Fisheries in California, Oregon and Washington from 1950-2010. Vancouver: University of British Columbia.
Doherty, B., Harguth, H., Strub, A. M., Jenkins, L. D., and Figueira, W. (2015d). Reconstructing Catches along Highway 101: Historic Catch Estimates for Marine Fisheries in California, Oregon and Washington from 1950-2010. Vancouver: University of British Columbia.
Edelist, D., Scheinin, A., Sonin, O., Shapiro, J., Salameh, P., Gil, R., et al. (2013). Israel: reconstructed estimates of total fisheries removals in the Mediterranean, 1950–2010. Acta Adriat. 54, 253–264.
Esparrinha, P. P. N. L. (2011). Caracterização da Pesca Amadora Desembarcada Praticada em Itacuruçá, Baía de Sepetiba, Rio de Janeiro, Brasil. Ph.D. thesis, Universidade Gama Filho, Rio de Janeiro.
Espedido, J. C., Parducho, V. A., Yap, M. A., and Palomares, M. L. D. (2014). “The recreational marine sport fisheries catch of the Philippines, 1950-2010,” in Philippine Marine Fisheries Catches: A Bottom-up Reconstruction, 1950 to 2010, eds M. L. D. Palomares and D. Pauly (Vancouver: Fisheries Centre Research Reports), 92–104.
FAO (2012). Recreational Fisheries, FAO Technical Guidelines for Responsible Fisheries No. 13. Rome: FAO.
Figueira, W. F., and Coleman, C. F. (2010). Comparing landings of the United States recreational fishery sectors. Bull. Mar. Sci. 86, 499–514.
Freire, K., Sumaila, U. R., Pauly, D., and Adelino, G. (2018). The offshore recreational fisheries of northeastern Brazil. Latin Am. J. Aquat. Res. 46, 765–778. doi: 10.3856/vol46-issue4-fulltext-14
Freire, K. M. F. (2005). “Recreational fisheries of northeastern Brazil: inferences from data provided by anglers,” in Fisheries Assessment and Management in Data-limited Situations, eds G. H. Kruse, V. F. Gallucci, D. E. Hay, R. I. Perry, R. M. Peterman, T. C. Shirley, et al. (Fairbanks: University of Alaska), 377–394. doi: 10.4027/famdis.2005.22
Freire, K. M. F., Aragão, J. A. N., Rocha, A. R., Araújo, A. O. Á, Bispo, M. C. S., Canziani, G. V., et al. (2014). Revisiting Brazilian Catch Data for Brazilian Marine Waters (1950-2010). Vancouver: University of British Columbia.
Freire, K. M. F., Luz, R. M. C. A., Santos, A. C. G., and Oliveira, C. S. (2017). Analysis of the onshore competitive recreational fishery in Sergipe. Bol. Inst. Pesca 43, 487–501. doi: 10.20950/1678-2305.2017v43n4p487
Freire, K. M. F., Machado, M. L., and Crepaldi, D. (2012). Overview of inland recreational fisheries in Brazil. Fisheries 37, 484–494. doi: 10.1080/03632415.2012.731867
Freire, K. M. F., and Pauly, D. (2005). Richness of common names of Brazilian marine fishes and its effect on catch statistics. J. Ethnobiol. 25, 279–296. doi: 10.2993/0278-0771(2005)25%5B279:rocnob%5D2.0.co;2
Freire, K. M. F., Tubino, R. A., Monteiro-Neto, C., Andrade-Tubino, M. F., Belruss, C. G., Tomás, A. R. G., et al. (2016). Brazilian recreational fisheries: current status, challenges and future direction. Fish. Manage. Ecol. 23, 276–290.
Gallagher, A. J., Serafy, J. E., Cooke, S. J., and Hammerschlag, N. (2014). Physiological stress response, reflex impairment, and survival of five sympatric shark species following experimental capture and release. Mar. Ecol. Prog. Ser. 496, 207–218. doi: 10.3354/meps10490
Garibaldi, L. (2012). The FAO global capture production database: a six-decade effort to catch the trend. Mar. Policy 36, 760–768. doi: 10.1016/j.marpol.2011.10.024
Guel, D. G., and Clark, J. R. (1968). The 1965 Salt-Water Angling Survey. Washington, DC: Bureau of Sport Fisheries and Wildlife.
Haaker, P. L., Karpov, K., Rogers-Bennett, L., Taniguchi, I., Friedman, C. S., and Tegner, M. (2001). “Abalone,” in California’s Living Marine Resources: A Status Report, eds W. S. Leet, C. M. Dewees, R. Klingbeil, and E. Larson (Sacramento: California Department of Fish and Game), 89–97.
Haaker, P. L., Taniguchi, I., O’Leary, J. K., Karpov, K., Patyten, M., and Tegner, M. (2004). “Abalone,” in Annual Status of the Fisheries Report through 2003, eds C. Ryan and M. Patyten (Sacramento: California Department of Fish and Game), 8.1–8.15.
Hamm, D., and Lum, H. K. (1992). Preliminary Results of the Hawaii Small-boat Fisheries Survey. Honolulu: National Marine Fisheries Service.
Hankin, D., Warner, R., Coller, P., and Ryan, C. (2004). “Dungeness crab,” in Annual Status of the Fisheries Report through 2003, eds C. Ryan and M. Patyten (Sacramento: California Department of Fish and Game), 6.1–6.13.
Hill, K. T., and Schneider, N. (1999). Historical Logbook Databases from California’s Commercial Passenger Fishing Vessel (Partyboat) Fishery, 1936-1997. San Diego: University of California.
Holts, D. (1985). Pacific mackerel (Scomber japonicus) stock assessment for USA management in the 2009-10 fishing year. Mar. Fish. Rev. 47, 48–53.
Howe, A. L., Fidler, G., Bingham, A. E., and Mills, M. J. (1996). Harvest, Catch, and Participation in Alaska Sport Fisheries during 1995. Fairbanks: Alaska Department of Fish and Game.
Hunter, M. V. (2008). 2006 Clatsop Beach Razor Clam Fishery Status Report. Astoria: Oregon Department of Fish and Wildlife.
Ihde, T. F., Wilberg, M. J., Loewensteiner, D. A., Secor, D. H., and Miller, T. J. (2011). The increasing importance of marine recreational fishing in the US: challenges for management. Fish. Res. 108, 268–276. doi: 10.1016/j.fishres.2010.12.016
INPFC (1979). Historical Catch Statistics for Salmon of the North Pacific Ocean. Vancouver: International North Pacific Fisheries Commission (INPFC).
Léopold, M., David, G., Raubani, J., Kaltavara, J., Hood, L., and Zeller, D. (2017). An improved reconstruction of total marine fisheries catches for the New Hebrides and the Republic of Vanuatu, 1950-2014. Front. Mar. Sci. 4:306. doi: 10.3389/fmars.2017.00306
Link, T. (2000). History and Status of Oregon’s Pacific Razor Clam Resources. Astoria: Oregon Department of Fish and Wildlife.
Lyman, J. (2008). “Subsistence versus sport. Cultural conflict on the frontiers of fishing,” in Global Challenges in Recreational Fisheries, ed. O. Aas (Oxford: Blackwell Publishing Ltd.), 292–302. doi: 10.1002/9780470697597.ch14
McCrea-Strub, A. (2015). Reconstruction of Total Catch by U.S. Fisheries in the Atlantic and Gulf of Mexico: 1950-2010. Vancouver: University of British Columbia.
McVeigh, B. A. B., Geibel, J. J., and Kalvass, P. E. (2010). Sport Clamming in Humboldt Bay, California during 2008: Comparisons with Historical Survey Data. Sacramento: California Fish and Game.
Mello, J. J. (1981). A One-year Survey of Recreational Clamming on the Morro Bay Mud Flats for the Period of April, 1979 to March, 1980. San Luis Obispo: California Polytechnic State University.
Miller, D. J., and Gotshall, D. (1965). Ocean Sport Fish Catch and Effort from Oregon to Point Aruello, California, July 1, 1957-June 30, 1961. Sacramento: California Department of Fish and Game.
Mills, M. J. (1986). Statewide Harvest Study - 1985 Data. Fairbanks: Alaska Department of Fish and Game.
Miranda, L. C. M., and Lima, C. A. S. (2010). On the logistic modeling and forecasting of evolutionary processes: application to human population dynamics. Technol. Forecast. Soc. 77, 699–711. doi: 10.1016/j.techfore.2010.01.006
Moore, T. O. (2001). “Gaper clams,” in California’s Living Marine Resources: A Status Report, eds W. S. Leet, C. M. Dewees, R. Klingbeil, and E. Larson (Sacramento: California Department of Fish and Game), 445–446.
Motta, F. S., Mendonça, J. T., and Moro, P. S. (2016). Collaborative assessment of recreational fishing in a subtropical estuarine system: a case study with fishing guides from south-eastern Brazil. Fish. Manag. Ecol. 23, 291–302. doi: 10.1111/fme.12172
MPA (2012). Boletim Estatístico da Pesca e Aquicultura. Brasil 2010. Brasília: Ministério da Pesca e Aquicultura.
National Marine Fisheries Service (2015). Fisheries of the United States, 2014. Silver Springs: U.S. Department of Commerce.
Neilson, D. (2011). Assessment of the California Spiny Lobster (Panulirus interruptus). San Diego: California Department of Fish and Game.
Palomares, M. L. D., and Pauly, D. (eds) (2014). Philippine Marine Fisheries Catches: A Bottom-up Reconstruction, 1950 to 2010. Vancouver: University of British Columbia.
Pauly, D., Alder, J., Booth, S., Cheung, W. W. L., Christensen, V., Close, C., et al. (2008). “Fisheries in large marine ecosystems: descriptions and diagnoses,” in The UNEP Large Marine Ecosystem Report: a Perspective on Changing Conditions in LMEs of the World’s Regional Seas, eds K. Sherman and G. Hempel (Nairobi: UNEP Regional Seas Reports and Studies), 23–40.
Pauly, D., and Charles, A. (2015). Counting on small-scale fisheries. Science 347, 242–243. doi: 10.1126/science.347.6219.242-b
Pauly, D., and Zeller, D. (eds) (2015). Catch Reconstruction: Concepts, Methods and Data Sources. Sea Around US. Vancouver: University of British Columbia.
Pauly, D., and Zeller, D. (2016a). Catch reconstructions reveal that global marine fisheries catches are higher than reported and declining. Nat. Commun. 7:10244. doi: 10.1038/ncomms10244
Pauly, D., and Zeller, D. (2016b). Global Atlas of Marine Fisheries. A Critical Appraisal of Catches and Ecosystem Impacts. Washington: Island Press.
Peres, M. B., and Klippel, S. (2005). “A pesca amadora na costa da plataforma sul,” in Ações para a Conservação de Tubarões e Raias no Sul do Brasil, eds C. M. Vooren and S. Klippel (Porto Alegre: Igaré), 200–212.
PFMC (1993). Historical Ocean Salmon Fishery Data for Washington, Oregon and California. Portland: Pacific Fishery Management Council (PFMC).
PFMC (2013). Historical Data of Ocean Salmon Fisheries “Blue Book” - Review Appendix A. Portland: Pacific Fishery Management Council (PFMC).
Pikitch, E. K., Santora, C., Babcock, E. A., Bakun, A., Bonfil, R., Conover, D. O., et al. (2004). Ecosystem-based fishery management. Science 305, 346–347. doi: 10.1126/science.1098222
Policansky, D. (2002). “Catch-and-release recreational fishing: a historical perspective,” in Recreational Fisheries: Ecological, Economic and Social Evaluation, eds T. J. Pitcher and C. Hollingworth (Oxford: Blackwell Science Ltd.), 75–94.
Popov, S., and Zeller, D. (2018). Reconstructed Russian fisheries catches in the Barents Sea: 1950-2014. Front. Mar. Sci. 5:266. doi: 10.3389/fmars.2018.00266
Potts, W., Childs, A. R., Sauer, W., and Duarte, A. (2009). Characteristics and economic contribution of a developing recreational fishery in southern Angola. Fish. Manag. Ecol. 16, 14–20. doi: 10.1111/j.1365-2400.2008.00617.x
Potts, W., Sauer, W., and Shaw, P. (2011). Transboundary Climate Induced Distributional Changes in an Important Artisanal and Recreational West African Fish Species. Consequences and Adaptation. Luanda: Southwest Fisheries Science Center.
Ralston, S., Pearson, D. E., Field, J. C., and Key, M. (2010). Documentation of the California Catch Reconstruction Project. La Jolla: NOAA.
Sanders, R. (1992). The pareto principle: its use and abuse. J. Prod. Brand Manag. 1, 37–40. doi: 10.1108/eb024706
Sant’Anna, D. V. (2011). A Pesca Amadora em Plataformas de Pesca do Litoral Norte do Rio Grande do Sul, Brasil. Bage: Universidade Federal do Rio Grande do Sul.
Schork, G., Mottola, L. S. M., and Silva, M. H. (2010). Diagnóstico da Pesca Amadora Embarcada na Região de São Francisco do Sul (SC). Rev. CEPSUL Biodivers. Conserv. Mar. 1, 8–17.
Schramm, H. L., Armstrong, M. L., Funicelli, N. A., Green, D. M., Lee, D. P., Manns, R. E., et al. (1991). The status of competitive sport fishing in North America. Fisheries 16, 4–12. doi: 10.1371/journal.pone.0130056
Schramm, H. L., and Harrison, J. C. (2008). “Competitive Fishing and its Role in Recreational Fisheries Management,” in Global Challenges in Recreational Fisheries, ed. O. Aas (Oxford: Blackwell Publishing), 237–276.
Sherman, K., and Hempel, G. (eds) (2008). The UNEP Large Marine Ecosystem Report: A Perspective on Changing Conditions in LMEs of the World’s Regional Seas. Nairobi: United Nations Environment Programme.
Shiffman, D. S., Gallagher, A. J., Wester, J., Macdonald, C. C., Thaler, A. D., Cooke, S. J., et al. (2014). Trophy fishing for species threatened with extinction: a way forward building on a history of conservation. Mar. Policy 50, 318–322. doi: 10.1016/j.marpol.2014.07.001
Shiffman, D. S., Macdonald, C., Ganz, H. Y., and Hammerschlag, N. (2017). Fishing practices and representations of shark conservation issues among users of a land-based shark angling online forum. Fish. Res. 196, 13–26. doi: 10.1016/j.fishres.2017.07.031
Skud, B. E. (1975). The Sport Fishery for Halibut: Development, Recognition and Regulation. Seattle: International Pacific Halibut Commission.
Skud, B. E. (1981). Interactions Between Pelagic Fishes and the Relation of Dominance to Environmental Conditions. Copenhagen: International Council for the Exploration of the Sea.
Smith, N. S., and Zeller, D. (2016). Unreported catch and tourist demand on local fisheries of small island states: the case of The Bahamas 1950-2010. Fish. Bull. 114, 117–131. doi: 10.7755/fb.114.1.10
Spalding, M. D., Fox, H. E., Allen, G. R., Davidson, N., Ferdaña, Z. A., Finlayson, M., et al. (2007). Marine ecoregions of the world: a bioregionalization of coastal and shelf areas. Bioscience 57, 573–583. doi: 10.1641/b570707
Stevens, D. E. (1977). “Striped bass (Morone saxatilis) monitoring techniques in the Sacramento-San Joaquin Estuary,” in Proceedings of the Conference on Assessing the Effects of Power-plant-induced Mortality on Fish Populations, ed. W. Van Winkle (Gatlinburg: Pergamon Press), 91–109. doi: 10.1016/b978-0-08-021950-9.50014-4
Ulman, A., Bekisoglu, S., Zengin, M., Knudsen, S., Ünal, V., Mathews, C., et al. (2013). From bonito to anchovy: a reconstruction of Turkey’s marine fisheries catches (1950-2010). Mediterr. Mar. Sci. 14, 309–342.
Walsh, W. (2013). Background Paper on SCUBA Spearfishing. Honolulu: Hawaii Division of Aquatic Resources.
Wendell, F. E., Hardy, R. A., Ames, J. A., and Burge, R. (1986). Temporal and spatial patterns in sea otter, Enhydra lutris, range expansion and in the loss of pismo clam fisheries. Calif. Fish Game 72, 197–212.
White, J. R. (1986). The striped bass sport fishery in the Sacramento-San Joaquin Estuary, 1969-1979. Calif. Fish Game 72, 17–37.
Williams, G. (2012). “2011 halibut sport fishery review,” in Report of Assessment and Research Activities 2011, eds L. Erikson, J. Forsberg, T. Kong, B. Leaman, T. Loher, L. Sadorus, et al. (Seattle: International Pacific Halibut Commission (IPHC)), 45–52.
Williams, I., and Ma, H. (2013). Estimating Catch Weight of Reef Fish Species using Estimation and Intercept Data from Hawaii Marine Recreational Fishing Survey. Honolulu: Pacific Islands Fisheries Science Center.
Zeller, D., Booth, S., Davis, G., and Pauly, D. (2007). Re-estimation of small-scale fishery catches for U.S. flag-associated island areas in the western Pacific: the last 50 years. Fish. Bull. 105, 266–277.
Zeller, D., Booth, S., and Pauly, D. (2005). Reconstruction of Coral Reef- and Bottom-fisheries Catches for U.S. Flag Island Areas in the Western Pacific, 1950 to 2002. Honolulu: Western Pacific Regional Fishery Management Council.
Zeller, D., Cashion, T., Palomares, M. L. D., and Pauly, D. (2018). Global marine fisheries discards: a synthesis of reconstructed data. Fish Fish. 19, 30–39. doi: 10.1111/faf.12233
Zeller, D., Darcy, M., Booth, S., Lowe, M. K., and Martell, S. J. (2008). What about recreational catch? Potential impact on stock assessment for Hawaii’s bottomfish fisheries. Fish. Res. 91, 88–97. doi: 10.1016/j.fishres.2007.11.010
Zeller, D., Harper, S., Zylich, K., and Pauly, D. (2015). Synthesis of underreported small-scale fisheries catch in Pacific-island waters. Coral Reefs 34, 25–39. doi: 10.1007/s00338-014-1219-1
Zeller, D., Palomares, M. L. D., Tavakolie, A., Ang, M., Belhabib, D., Cheung, W. W. L., et al. (2016). Still catching attention: Sea Around Us reconstructed global catch data, their spatial expression and public accessibility. Mar. Policy 70, 145–152. doi: 10.1016/j.marpol.2016.04.046
Keywords: sport fishing, amateur fishing, fishing championship, fishing tournament, competitive fishing, catch reconstruction, unreported catches, non-commercial fisheries
Citation: Freire KMF, Belhabib D, Espedido JC, Hood L, Kleisner KM, Lam VWL, Machado ML, Mendonça JT, Meeuwig JJ, Moro PS, Motta FS, Palomares M-LD, Smith N, Teh L, Zeller D, Zylich K and Pauly D (2020) Estimating Global Catches of Marine Recreational Fisheries. Front. Mar. Sci. 7:12. doi: 10.3389/fmars.2020.00012
Received: 12 August 2019; Accepted: 09 January 2020;
Published: 27 January 2020.
Edited by:
Steven W. Purcell, Southern Cross University, AustraliaReviewed by:
Dimitrios K. Moutopoulos, University of Patras, GreeceAaron Adams, Bonefish and Tarpon Trust, United States
Copyright © 2020 Freire, Belhabib, Espedido, Hood, Kleisner, Lam, Machado, Mendonça, Meeuwig, Moro, Motta, Palomares, Smith, Teh, Zeller, Zylich and Pauly. This is an open-access article distributed under the terms of the Creative Commons Attribution License (CC BY). The use, distribution or reproduction in other forums is permitted, provided the original author(s) and the copyright owner(s) are credited and that the original publication in this journal is cited, in accordance with accepted academic practice. No use, distribution or reproduction is permitted which does not comply with these terms.
*Correspondence: Dirk Zeller, ZGlyay56ZWxsZXJAdXdhLmVkdS5hdQ==