 Anna K. James1*
 Libe Washburn1
 Chris Gotschalk1
 Stéphane Maritorena2Alice Alldredge1
 Craig E. Nelson3
 James L. Hench4
 James J. Leichter5
 Alex S. J. Wyatt6
 Craig A. Carlson1*
- 1Marine Science Institute, University of California, Santa Barbara, Santa Barbara, CA, United States
- 2Earth Research Institute, University of California, Santa Barbara, Santa Barbara, CA, United States
- 3Department of Oceanography and Sea Grant College Program, Center for Microbial Oceanography: Research and Education, University of Hawai‘i at Mānoa, Honolulu, HI, United States
- 4Marine Laboratory, Nicholas School of the Environment, Duke University, Beaufort, NC, United States
- 5Scripps Institution of Oceanography, University of California, San Diego, San Diego, CA, United States
- 6Department of Ocean Science and Hong Kong Branch of the Southern Marine Science and Engineering Guangdong Laboratory, The Hong Kong University of Science and Technology, Kowloon, Hong Kong
We sought to resolve the extent, variability, and magnitude of productivity enrichment around a high tropical island consistent with the phenomenon of an Island Mass Effect (IME). Key biogeochemical constituents and physical oceanographic parameters were measured offshore over the upper 500 m from July 27 to August 7, 2014 around the Society Island of Mo’orea in French Polynesia in association with the nearshore measurements of the Mo’orea Coral Reef Long Term Ecological Research program. High-resolution synoptic sampling in a rectangular grid around the island revealed vertical and horizontal patterns in hydrographic conditions, inorganic nutrients, rates of productivity, and concentrations of organic matter that are characteristic of oligotrophic gyre ecosystems. Within the upper euphotic zone (0–75 m), levels of net primary productivity (NPP), chlorophyll a (Chl), heterotrophic bacterioplankton productivity (BP), and particulate organic carbon (POC) exhibited concurrent enhancement at stations located within 5–15 km of shore, relative to stations farther offshore. These observations of enhanced productivity near an island are consistent with an IME. Particulate organic matter nitrogen isotopes (POM-δ15N) were significantly lower near the island than at stations farther offshore, further emphasizing spatial differences in water column biogeochemistry consistent with an IME. Vertical profiles suggest thermocline shoaling and mixing associated with the pycnocline impinging on the island’s submerged flanks and coral reef slope may have contributed to the decreasing depth and increasing intensity of chlorophyll-a concentration in the DCM at nearshore stations relative to farther offshore. Shipboard measurements of an anticyclonic flow within the upper 75 m of the water column in the vicinity of Mo’orea suggest that retention of inorganic nutrients and organic matter near Mo’orea may also have contributed to the patterns in NPP, Chl, BP, POC, and POM-δ15N, providing a potential mechanistic understanding of the processes driving an IME.
Introduction
High productivity and biomass observed on coral reefs surrounding islands such as Mo’orea, French Polynesia, are thought to be supported by the transport and retention of key, waterborne biogeochemical constituents including organic and inorganic nutrients and biological particles (Odum and Odum, 1955; Johannes et al., 1972; Leichter et al., 2013). Mo’orea, located in the westward flowing South Equatorial Current, is surrounded by nutrient-depleted waters that form the northern portion of the South Pacific Subtropical Gyre (Rougerie and Rancher, 1994). Surface waters in the South Pacific Subtropical Gyre are among the least biologically productive waters in the global oceans (Longhurst et al., 1995). However, the shallow waters near Mo’orea are distinct from offshore waters (Nelson et al., 2011; Leichter et al., 2013), indicating a potential for islands to alter the chemical and biological composition of water in their vicinity through a phenomenon known as the Island Mass Effect (IME). The IME was first described over 60 years ago as a mechanistic explanation of enhanced phytoplankton biomass observed near island-reef ecosystems (Doty and Oguri, 1956). IMEs have since been documented for numerous island-reef ecosystems, and the mechanisms that promote enhanced productivity have been shown to be ecologically important in coral reef development and persistence (e.g., Signorini et al., 1999; Palacios, 2002; Andrade et al., 2014; Gove et al., 2016 and citations therein).
Mechanisms contributing to enhanced production and the modification of water column biogeochemical characteristics near islands in otherwise stable oceanic environments include both inputs from the island terrestrial environments, and a suite of oceanographic processes contributing to local mixing, transport, and retention of water masses near islands (Gilmartin and Revelante, 1974; Heywood et al., 1996; Palacios, 2002). Transport of terrigenous material through riverine outflow and both surface and groundwater runoff can increase concentrations of nutrients and organic material nearshore (Anderson et al., 2002; Garrison et al., 2003; Knee et al., 2016). Local human impacts such as urban development and agricultural land-use changes, as well as waste water deposition may also enhance nutrient and organic matter inputs to nearshore waters (e.g., Anderson et al., 2002; Gove et al., 2016). In addition to direct inputs from land, multiple oceanographic mechanisms can increase nutrient inputs to waters surrounding oceanic islands. Coral reef organisms are known to biogeochemically transform ocean water flowing over reefs (e.g., Wyatt et al., 2010, 2012; Nelson et al., 2011). Current wakes formed through the interaction of oceanic currents with island bathymetry, may form eddies and induce upwelling of cool, deep, nutrient rich water (e.g., Takahashi et al., 1981; Wolanski and Hamner, 1988). Island wakes can also influence particle accumulation through partial trapping of water near islands (Rissik et al., 1997). Internal waves generated along and impinging on the submerged slopes of islands result in lateral and vertical transport of deep water masses as well as near-bottom mixing (Wolanski and Pickard, 1983; Merrifield et al., 2001), influencing nutrient and particle concentrations and the thermal environments of island reef ecosystems (Leichter et al., 2003, 2012; Wyatt et al., 2020). Because multiple biophysical drivers work to influence the prevalence and magnitude of IMEs, detailed observations of these processes can enhance understanding of the environmental contexts in which coral reef ecosystems develop and persist around oceanic islands.
Here we consider Mo’orea, French Polynesia as a model system, and provide one of the most comprehensive synoptic oceanographic surveys to date of the waters surrounding an oceanic island. We focus on in situ measurements of key biogeochemical parameters that support the presence of an IME surrounding the island. We find evidence suggesting enhanced productivity and potentially distinct nutrient sources in the vicinity of the island relative to farther offshore. Previous evidence of the prevalence of internal waves around Mo’orea (Leichter et al., 2012) and a net anticyclonic flow along the 15 m isobath surrounding the island (Leichter et al., 2013) indicates the potential for island-altered physical flow patterns that may magnify IMEs through localized upwelling, and the retention and accumulation of laterally advected nutrients and organic material near Mo’orea. Our spatial survey results were consistent with patterns extracted from satellite time series of chlorophyll a, suggesting that IMEs like that observed near Mo’orea may have long-term impacts on biogeochemical processes near island coral reef ecosystems in general.
Materials and Methods
Site Description
Mo’orea is a high volcanic island and part of an island chain surrounded by barrier reefs within 0.5–1 km of shore. Fringing reefs around the island (∼10 m deep) are separated from the barrier reef by shallow lagoons (<3 m). The lagoons are connected to the open ocean by reef-passes that are present around the island, and spaced approximately 5–10 km apart. The forereef slopes steeply from the reef crest offshore to >500 m within 1–2 km of the reef. Local ocean circulation near Mo’orea is influenced by the South Equatorial Current, which generally flows westward and constitutes the northern portion of the anticyclonic South Pacific Subtropical Gyre (Rougerie and Rancher, 1994). Evidence of net anticyclonic flow at a local scale along the 15 m isobath at Mo’orea has also been observed using current meter records from fixed locations around the island that were vertically averaged and low-pass filtered on 2-week or longer timescales (Leichter et al., 2013).
Sampling Scheme
High resolution hydrographic and biogeochemical data were sampled during a 3-week research cruise from July 27 to August 7, 2014 aboard the R/V Kilo Moana in the waters surrounding the island of Mo’orea, French Polynesia, in the South Pacific Subtropical Gyre (17° 36′S, 149° 43′W). The cruise included a sampling grid comprising 40 stations around the island (Figure 1). Stations near Mo’orea, as well as those near Tahiti, are referred to as “nearshore” stations and ranged from roughly 5 to 15 km offshore of the islands. Stations farther offshore ranged from roughly 15 to 30 km from Mo’orea and are referred to as “offshore stations.” At each station, Conductivity, Temperature, Depth (CTD) profiles and bottle samples were collected to determine the hydrographic and biogeochemical properties of the water column. Vertical profiles of water samples to measure biogeochemical variables including inorganic nutrients (nitrogen and phosphorous), net primary production (NPP), chlorophyll a (Chl), heterotrophic bacterial productivity (BP), bacterial abundance (BA), dissolved organic carbon (DOC), particulate organic carbon (POC) concentrations, and isotopic composition of POM were collected via 12 L Niskin bottles. Sample bottles were attached to a rosette and CTD profiler (Sea-Bird Electronics SBE 911) which had sensors for oxygen (SBE 43), PAR (Biospherical QSP-2300), Chl fluorescence (Wetlabs ECO FLNTU), an optical nitrate sensor (Satlantic ISUS), and optical transmittance (Wetlabs C-Star 25 cm transmissometer, 650 nm light source). Water samples were collected at ten depths from the surface to 500 m (nominally 10, 25, 50, 75, 100, 150, 200, 250, 300, and 500 m), with the depth of the nominal 100 m bottle adjusted and targeted to the deep chlorophyll fluorescence maximum (DCM). In addition, oceanographic currents were measured using two shipboard broadband ADCP as described below.
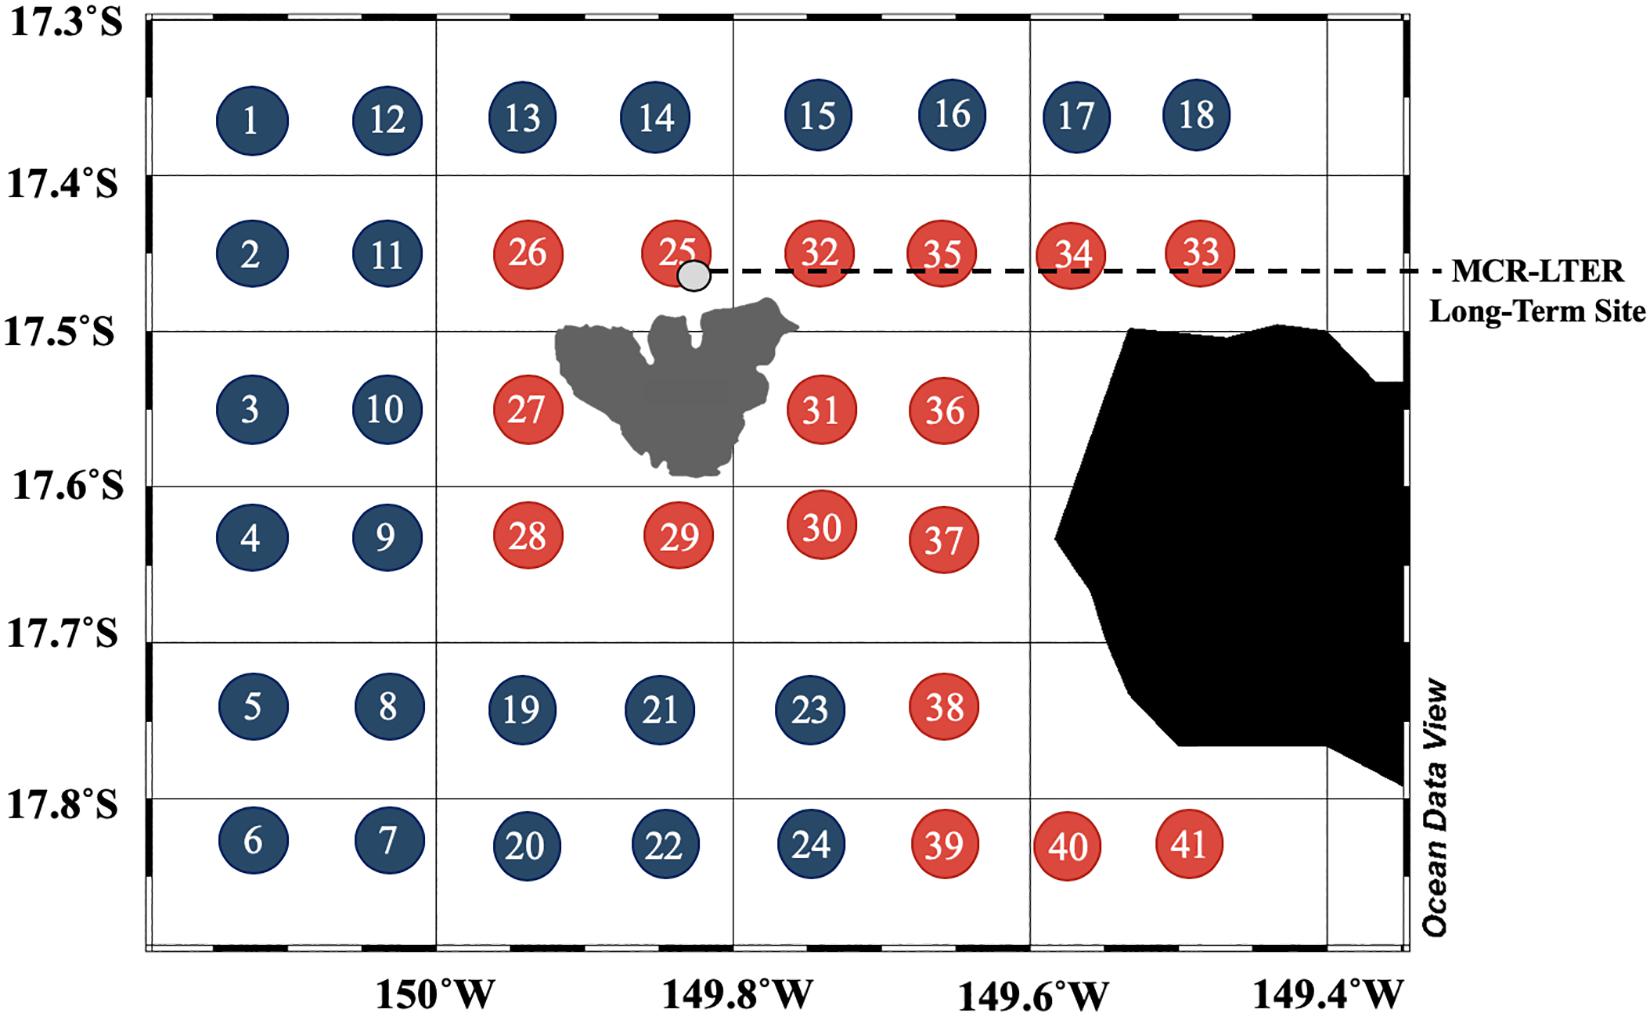
Figure 1. Map of study area around Mo’orea and shipboard sampling grid during July/August 2014. Station numbers and colors refer to offshore stations (blue) and those near Mo’orea and Tahiti (red). Gray point encircled in black is located approximately 5 km offshore of the reef crest and indicates the MCR-LTER long-term collection site (2005–2016).
CTD Measurements
CTD profile data were processed using standard Sea-Bird software (Sea-Bird Electronics, 2014) and averaged into 1-m depth bins to form water property profiles that extended from the surface to about 500 m at all stations. Mixed layer depth (MLD) was calculated as the depth where density was 0.01 kg m–3 greater than the local near-surface value.
Sample Processing
Inorganic nutrients – Unfiltered seawater samples for inorganic nutrient analysis were collected in 20 mL HDPE vials, frozen at −20°C, and analyzed using flow injection analysis on a QuickChem 8000 (Lachat Instruments, Zellweger Analytics, Inc.) by the University of California, Santa Barbara Marine Science Institute Analytical Laboratory (detection limits: NO2– + NO3–, 0.2 μmol L–1; PO43–, 0.1 μmol L–1).
Net primary productivity (NPP) – Primary production was measured using the 14C method according to USJGOFS protocols (Knap et al., 1996) with the following modifications (detection limit: 0.01 mg m–3 d–1). Seawater was collected from six depths between 10 and 150 m (nominally, 10, 25, 50, 75, 100, and 150) into 500 mL acid-washed polycarbonate bottles. One light and one dark bottle (each containing 250 mL seawater) from each depth were incubated on deck for 24–25 h in a 1 m3 clear plexiglass incubator under continuous flow with seawater at ambient upper MLD temperature and at light levels corresponding to 75%, 50%, 16%, 3%, 0.6%, and 0.02% of full sunlight based on a clear water optical model (Morel et al., 2007) and previous local Chl estimates from the MCR LTER dataset 101. 100 μL of 14C at a specific activity of 80 uCi mL–1 was added to each bottle. At the end of the incubation 100 μL was pipetted from each bottle to determine the total 14C present and then the entire bottle was filtered onto 25 mm Whatman GF/F filters and placed into scintillation vials. These were acidified with 0.25 mL of 0.5 M HCl and allowed to sit for 4–6 h to remove inorganic 14C. 10 mL of scintillation cocktail (Ultima Gold LLT, PerkinElmer) was then added to each vial and the radioactivity was counted on a Packard TriCarb Liquid Scintillation Counter. An average alkalinity value of 23611 mg C m–3 (standard deviation 0.006%) determined over four seasons from 2005 to 2012 at an offshore station 5 km north of Mo’orea by previous LTER research2 was used to calculate the carbon fixed. Gradients in alkalinity across our grid were not expected and slight variations in alkalinity would have insignificant impacts on NPP comparisons among stations.
Chlorophyll – Chlorophyll a (Chl) concentrations were determined by filtering 1035 mL of seawater from each depth and station through a glass fiber filter (GF/F) and stored at −80°C (detection limit: 0.01 μg L–1). Samples were analyzed within 3 weeks of collection by extraction in 90% acetone in the dark at −4°C for 36 h and measured with a fluorometer (Turner 10AU) according to Smith et al. (1981). While GF/F filters may not retain all of the smallest picoplankton, JGOFS protocols were followed allowing comparisons across stations to be internally consistent.
Heterotrophic bacterioplankton productivity – Samples for bacterioplankton production (BP) were measured via 3H-leucine incorporation (14–19 nmol L–1 H-leucine; specific activity 54.1 Ci mmol–1; PerkinElmer, Boston, MA, United States), using a modified microcentrifuge method (Halewood et al., 2012; Wear et al., 2015). All samples were processed at sea with incubations conducted using water drawn directly into foam coolers (up to 4) and samples incubated in the dark within 2°C of in situ temperatures for 2–3 h. Radioactivity was analyzed using a liquid scintillation counter (Packard TriCarb) and corrected with external standard and quench curve (detection limit: roughly 0.2 pmol L–1 hr–1). Leucine incorporation was converted to bacterial carbon production by applying a carbon conversion factor of 1.5 kg C mol Leu–1 (Simon and Azam, 1989).
Bacterioplankton abundance – Samples for bacterioplankton abundance were estimated with flow cytometry (BD Bioscience LSR II with SYBR Green I) according to sample preparation and instrument settings described in Nelson et al. (2011). Flow cytometry analysis enumerates total prokaryotic abundance. Thus, we were unable to differentiate between bacterial and archaeal domains and refer to the combined cell densities as bacterioplankton abundance (Glöckner et al., 1999).
Dissolved organic carbon – DOC samples were filtered through combusted glass fiber filters (GF/F) placed in polycarbonate cartridges and attached directly to the Niskin bottle via silicone tubing. Samples were collected into 60 mL high-density polyethylene bottles and frozen at −20°C until analysis on shore at UC Santa Barbara. Samples were analyzed via high temperature combustion method on a modified Shimadzu TOC-V or Shimadzu TOC-L using the standardization and referencing approaches described in Carlson et al. (2010); detection limit roughly 1 μmol C L–1.
Particulate organic carbon – Positive pressure displacement was used to concentrate POC from 4 L of seawater onto pre-combusted GF/F (25 mm) placed in high density polyethylene filter holders. Sample bottles were pressurized at low pressure (approximately 4–7 PSI of nitrogen gas). Immediately following filtration, filters were placed into pre-combusted glass scintillation vials and stored at −20°C until prepped for analysis at UC Santa Barbara. To prepare samples for analysis, glass vials containing filters were removed from −20°C storage and placed in an acid fumer (deep covered glass dish containing a 25 mL beaker of concentrated hydrochloric acid in center) and allowed to sit overnight. The following day, vials were loosely capped and placed in a 65°C drying oven for 48 h. When dry, the vials were removed from the oven, capped tightly, and submitted to the Marine Science Institute analytics laboratory for analysis. POC was quantified by combustion elemental analysis (CE440 elemental analyzer, Exeter Analytical Inc.) with a detection limit of 2–7 μg C.
Particulate organic matter stable isotope compositions – Samples for the determination of stable isotope composition of POM were collected from Niskin bottles at depths of 10 m (near the surface), 50 m, and in the DCM layer (typically 90–110 m as described above). For each sample, 8L of seawater were filtered as described above through pre-combusted GF/F (25 mm) filters. Isotope ratios were measured on the preserved filters using a continuous flow Elemental Analyzer-Isotope Ratio Mass Spectrometer (EA-IRMS) system consisting of a Flash 2000 EA coupled to a Delta V Advantage IRMS via a Conflo IV (Thermo Fisher Scientific, Inc., Bremen, Germany). Dried filters were acidified to remove inorganic carbon by dropwise addition of 1 mol L–1 HCl before being re-dried at 60°C for 24 h. Re-dried filters were then combusted to N2 and CO2 in tin capsules (Säntis Analytical AG, Teufen, Switzerland) using the EA, and the gases were purified by chromatography and injected into the IRMS. N isotope ratios (δ15N) are reported in parts per thousand (‰) relative to air and C isotope ratios (δ13C) relative to standard Pee Dee Belemnite (V-PDB). Isotope values were normalized to an international scale using a working standard, L-Alanine (SI Science Co., Ltd., AZ101, Lot: SS13; δ13C = −19.6 ‰, δ15N = 13.7 ‰), regularly spaced (every 2–3 samples) and analyzed across a range of C and N masses encompassing the range of C and N in the filters for which the precision was 0.05 ‰ for δ13C and 0.1 ‰ for δ15N. As described elsewhere, the working standard was periodically checked in-house against primary international standards (e.g., USGS) using dual-inlet IRMS (Wyatt et al., 2019). Precision (1 SD) based on repeated analysis of two different working standards treated as unknowns was always better than 0.05 ‰ for δ13C and 0.1 ‰ for δ15N.
Current measurements - Horizontal currents were measured using two shipboard broadband ADCPs operating simultaneously at 300 kHz (Workhorse) and 38 kHz (Ocean Surveyor, Teledyne RD Instruments). Velocity profiles from the 300 kHz ADCP were collected in 2-m bins with a ping interval of 0.8 s and 150 pings were ensemble-averaged over 120 s. Ship motion was removed from the ADCP velocity data using an integrated inertial navigation and GPS system. Velocity errors for both ADCPs were about 0.01 m s–1. Shipboard ADCP processing was conducted according to the recommendation of Firing and Hummon (2010). The shallowest bin that consistently provided usable data was centered at 11 m. Low concentrations of scattering particles limited the range of the 300 kHz ADCP to about 75 m depth. Velocity profiles from the 38 kHz ADCP were collected in 12-m bins with a ping interval of 4 s and 75 pings were ensemble-averaged over 300 s. The shallowest bin that consistently yielded data was centered at 37 m and good data extended down to about 1100 m.
To visualize current patterns and compare with sampling on the grid stations, the ADCP data were interpolated onto a uniform grid with 4 km spacing using optimal interpolation (e.g., Thompson and Emery, 2014). In the optimal interpolation, a spatial autocorrelation function was calculated from the data and fitted to a Gaussian curve with a standard deviation of 15 km.
Satellite Chl Observations
Subsurface Chl concentrations from the NASA Moderate Resolution Imaging Spectroradiometer (MODIS) Aqua sensor (level-3 binned operational Chl data product, R2018.0, approximately 4.6 km resolution) were extracted for the Mo’orea-Tahiti region covered by the cruise (Figure 1). Data from nine 40 to 50 km long transects distributed around Mo’orea (6) and Tahiti (3), starting at least one-half pixel away from the reef crest and running perpendicular to it were extracted. Data from the transects were interpolated to a common ∼ 3.25 km grid (equal to half the length of a pixel diagonal, resulting in each transect data point representing an approximately 10.6 km2 surface area) so the data could be aggregated from the 9 transects as a function of the distance from the reef crest (Gove et al., 2016). Data for two different time scales were analyzed: (1) A monthly composite dataset matching the time of the cruise (July and August 2014), and (2) A long-term average that covers most of the current MODIS-Aqua mission (2003–2017).
Data and Statistical Analyses
Statistical analysis of the difference in biogeochemical rates and concentrations between nearshore and offshore stations (Figure 1) was evaluated using a one-way analysis of variance (ANOVA; Scheffe, 1959). Ranged Major Axis (RMA) model II simple linear regression was conducted to assess relationships between parameters according to Legendre and Legendre (2012). Statistical analyses were conducted on log10-transformed values.
Results and Discussion
Vertical Variability
We compared vertical variability in hydrographic conditions and biogeochemical variables by comparing direct measurements of temperature, salinity, rates of productivity, and concentrations of inorganic nutrients and organic matter across the upper 300 m of the water column in vertical profile plots. In this way, we were able to evaluate vertical patterns within distinct depth layers including the upper euphotic zone (0–75 m), the lower euphotic zone which contained the deep chlorophyll maximum (75–150 m), and the upper mesopelagic zone (150–300 m).
Hydrographic Conditions
Sampling near Mo’orea during July 2014 (austral winter) revealed characteristics of stratification in the upper 300 m of the water column typical of Pacific subtropical gyre ecosystems (Karl and Church, 2014, 2017; Wilson et al., 2015). Relatively warm surface temperatures (mean, 26.8 ± standard deviation 0.2°C, range: 25.9–27.2°C) and low salinity (mean: 35.7 ± 0.1, range: 35.6–36.1) resulted in a low-density layer of water that extended from the surface to approximately 75 m and that separated the upper euphotic zone from the remainder of the water column (Supplementary Figure S1). In the lower euphotic zone, between 75 and 150 m (approximately 0.1% light level), mean temperatures decreased to 25.1 ± 1°C and mean salinity increased to 36.0 ± 0.2, leading to the depth of maximum vertical density stratification occurring between approximately 75 and 150 m across stations. These observations of stratification are similar to those previously observed near Mo’orea during the austral summer (Leichter et al., 2012). The MLD, defined as above, was variable across stations, ranging from 5 to 99 m with a mean and standard deviation of 54 ± 24 m.
Inorganic Nutrients
Concentrations of dissolved inorganic nitrogen (DIN; NO2– + NO3–; Supplementary Figure S2A) and dissolved inorganic phosphorous (DIP; PO43–; Supplementary Figure S2B) were consistently below detection limits in the upper euphotic zone and increased at the base of the euphotic zone (>100 m) into the upper mesopelagic. The nutricline (approximately 100–150 m) was consistently deeper than the MLD (see white line in Supplementary Figure S2). This observation of separation between the upper portion of the nutricline and the MLD is consistent with a previous study near Mo’orea during the austral summer (Leichter et al., 2012) and indicates that vertical mixing at the time of sampling was not deep enough to entrain nutrients from the nutricline into the upper euphotic zone.
Net Primary Productivity and Chlorophyll a
Rates of NPP were highest and most variable in the upper euphotic zone, ranging from 0 to 1.5 μmol C L–1 d–1 with a mean value of 0.3 ± 0.3 μmol C L–1 d–1 (Figure 2A). The depth of maximum NPP was consistently shallower than the depth of the upper portion of the nutricline and was approximately 65–90 m shallower than the DCM (compare Figures 2A,B). This observation is consistent with oligotrophic gyre ecosystems in the North Pacific and North Atlantic, where the DCM is generally deeper in the water column than maximum rates of NPP due to photoadaptation of phytoplankton cells over depth (Steinberg et al., 2001; Karl and Church, 2014; Cullen, 2015). Rates of NPP decreased by an order of magnitude in the lower euphotic zone and were below limits of detection below approximately 120 m for all stations (Figure 2A).
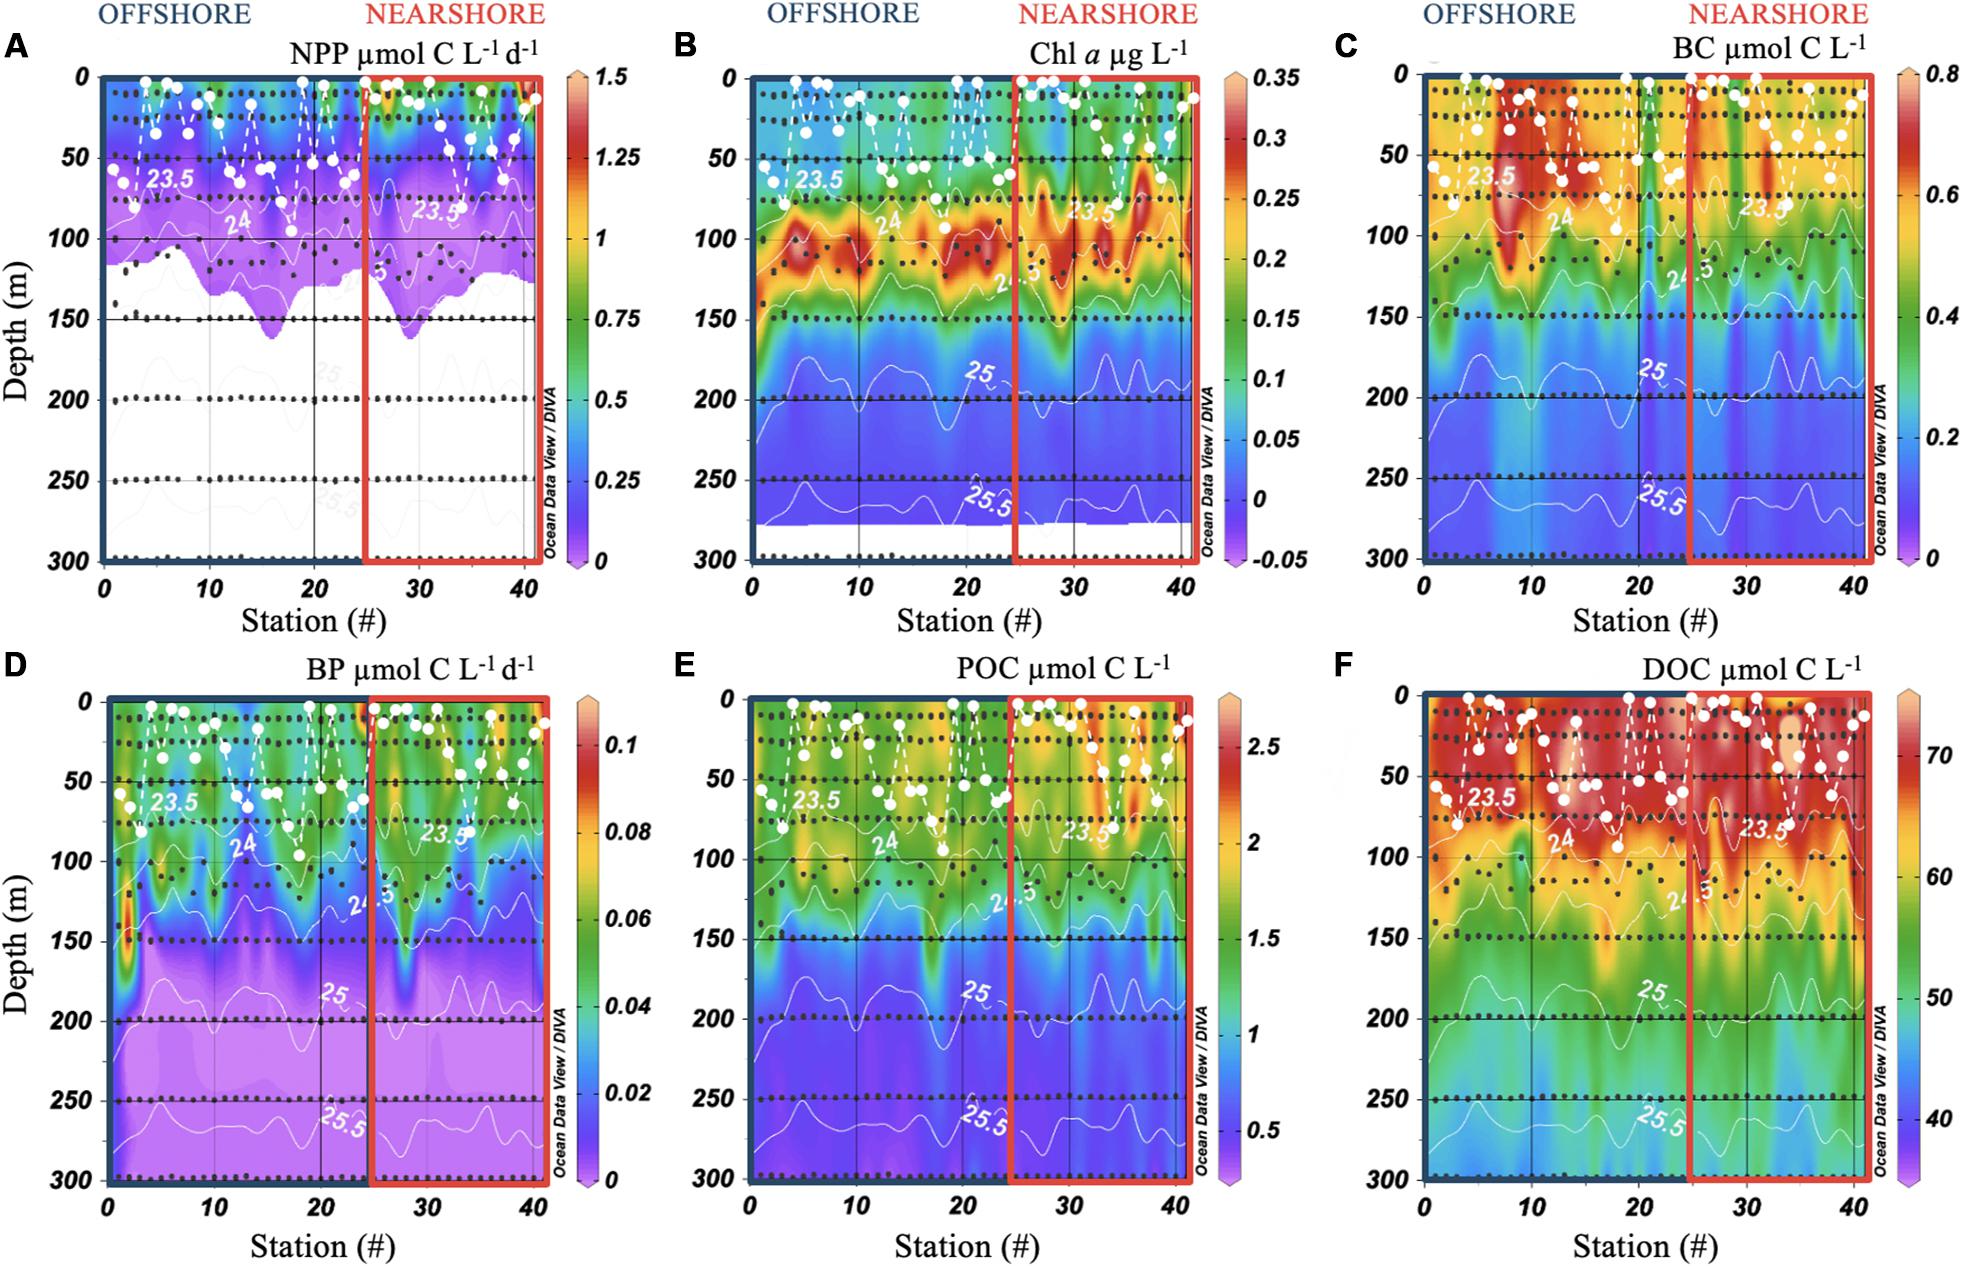
Figure 2. Contour plots of net primary productivity (NPP; A), chlorophyll a (Chl; B), bacterioplankton carbon (BC; C), heterotrophic bacterioplankton productivity (BP; D), particulate organic carbon (POC; E), and dissolved organic carbon (DOC; F) in the upper 300 m of the water column. Black dots indicate sites of seawater collection. The dashed white line represents mixed layer depth at each station. Solid white contour lines are potential density anomaly (kg m–3). Color boxes indicate offshore (blue) and nearshore (red) stations as in Figure 1.
In contrast to NPP, mean concentrations of Chl were approximately 33% lower in the upper euphotic zone (0.12 ± 0.06 μg Chl L–1), compared with the lower euphotic zone (0.18 ± 0.09 μg Chl L–1; Figure 2B). The DCM was consistently present in the lower euphotic zone between the 23.5 and 24.5 kg m–3 potential density isopycnals, and was bound by sampling depths of approximately 75–150 m (Figure 2B). The depth of maximum concentrations of Chl varied by station, ranging from 74 to 140 m, with a mean depth of 107 ± 16 m. Six stations exhibited mean or above mean concentrations of Chl throughout the upper 75 m of the water column (Figure 2B). All of these stations exhibited MLDs that were shallower (≤76 m, Figure 2B) than the depth of maximum Chl concentration, and in most cases the upper portion of the DCM, suggesting that vertical mixing at the time of sampling was not sufficiently deep to entrain high concentrations of Chl from the DCM into the upper euphotic zone. We also note the depth of the DCM in Figure 2 was often shallower at stations near the island than stations farther offshore. This appears to be consistent with shoaling of the density stratification near the island, and with nutrient mixing associated with interactions between the pycnocline and the submerged flanks of the island.
Bacterioplankton Dynamics
Rates of BP and concentrations of BA decreased over the upper 300 m of the water column and ranged from 0 to 0.1 μmol C L–1 d–1, and 0.6–8.5 × 10⁵ cells mL–1, respectively. To evaluate the contribution of bacterioplankton biomass to carbon dynamics, we converted BA to bacterioplankton carbon (BC) using a carbon conversion factor of 10 fg C cell–1 to reflect small cells in oligotrophic regions (Caron et al., 1995; Fukuda et al., 1998; Gundersen et al., 2002). Concentrations of BC, and rates of BP, were elevated in the upper and lower euphotic zones and substantially decreased in the upper mesopelagic (Figures 2C,D).
Rates of BP were substantially reduced and demonstrated low variability in the upper mesopelagic (Figure 2D). In contrast, concentrations of BC were variable and exhibited elevated concentrations that extended throughout the upper mesopelagic at stations offshore, as well as near Mo’orea (Figure 2C). These elevated concentrations of BC in the upper mesopelagic may be indicative of previous vertical export of organic material and subsequent utilization of this material by extant bacterioplankton communities (e.g., Hansell and Carlson, 2001; Letscher et al., 2015).
Organic Carbon
Concentrations of POC and DOC were highest in the upper and lower euphotic zones and decreased in the mesopelagic (Figures 2E,F). Concentrations of POC in the upper euphotic zone were low (<3 μmol C L–1), and similar in amount to those observed in the oligotrophic waters of the North Pacific (Karl and Church, 2014; Wilson et al., 2015) and North Atlantic Subtropical Gyres (Lomas et al., 2013). Concentrations of DOC in the upper euphotic zone reflected the accumulation of DOC within surface waters of subtropical gyres (Hansell et al., 2009) and ranged from 66 to 77 μmol C L–1, consistent with previously reported ranges from these waters (Nelson et al., 2011; Carlson and Hansell, 2015).
Despite lower concentrations of POC and DOC in the upper mesopelagic, several stations exhibited elevated concentrations of POC (Figure 2E) and DOC (Figure 2F) similar to those observed for concentrations of BC (Figure 2C). In contrast to BC, comparison of offshore and nearshore stations in the upper mesopelagic revealed significantly elevated POC (p value = 0.02) and DOC (p value = 0.03) nearshore (one-way ANOVA; see red box indicating nearshore stations in Figures 2E,F). Additionally, statistical analysis revealed a positive correlation between log-transformed mean POC and DOC concentrations in the upper mesopelagic (integrated and depth normalized; p value < 0.01, R2 adjusted 0.18, RMA), indicating coincident enhancement of particulate and dissolved organic carbon within this depth layer. These coincident elevated concentrations extended through isopycnal surfaces and may have occurred in the absence of deep mixing. Though we lack measurements of the amount of POC exported from the upper and lower euphotic zone, as well as sinking rates into the upper mesopelagic, solubilization of POC to DOC (Smith et al., 1992) may have partially contributed to contemporaneous enhancement of organic carbon in the upper mesopelagic. Submesoscale dynamics arising from eddy interactions may also help to explain some of the elevated pulses of DOC, POC observed in the mesopelagic at depths well below the MLD (Mahadevan, 2016; Erickson and Thompson, 2018).
There were two clear patterns in the POM stable isotope data. First, the carbon and nitrogen isotope compositions were distinct in the DCM relative to the shallower layers (Figure 3). In the DCM mean δ13C was lower (−23.90 ± 0.09 %) and mean δ15N higher (7.19 ± 0.08 %) than in the surface (−21.50 ± 0.06 % and 5.87 ± 0.10 %, respectively) and mid layers (−21.60 ± 0.06 % and 5.85 ± 0.10 %, respectively). Second, for the surface and mid layers there was evidence of significantly lower POM-δ15N values at the stations near the island relative to stations farther offshore, e.g., 5.58 ± 0.09 % at near stations compared to 6.23 ± 0.25 % at far stations, respectively (p < 0.01, one-way ANOVA; Figure 3). A variety of factors including temperature and irradiance can lead to differential C fractionation in marine phytoplankton (Hinga et al., 1994). The differences in δ13C with depth could reflect light availability with samples in the DCM likely containing phytoplankton growing in the lower euphotic zone, whereas surface and mid layers may have had phytoplankton growing at higher irradiance. The higher δ15N in the DCM relative to shallower depths could represent the role of deeper water nitrate supporting primary production in the DCM. Bottle samples showed that nitrate concentrations increased markedly below the pycnocline and DCM and deep-water nitrate in oceanic environments including the central South Pacific Gyre would be expected to have elevated δ15N relative to shallow water nutrients (Sigman et al., 1997; Altabet, 2001). Lower POM-δ15N in the surface layers could also reflect higher assimilation of nitrogen from nitrate (fractionation ∼5 %) relative to ammonium (fractionation ≤ 20 %), or a greater contribution from nitrogen fixation (with expected δ15N ∼ 0 %) (Sigman et al., 2009). The significant differences in δ15N values between near and far stations at the surface and mid depths support the observations of spatial differences in biogeochemical properties suggestive of an IME. We can speculate regarding the causes of the direction of the differences. If there were a strong signal of terrestrial nutrients including agricultural or waste water runoff we would expect elevated δ15N values in nearshore samples, however, that is not the direction of the observed differences. Another possibility is that the lower δ15N values observed in stations closer to the island reflect organic material with a nutrient source from nitrogen fixation on the reef, and/or trophic alteration of the POM by reef organisms. Coral reef communities also contain exceptional abundance of suspension feeding organisms which are known to consume large quantities of zooplankton from overlying waters (Hamner et al., 2007; Wyatt et al., 2013). A result of extensive consumption of zooplankton by the reef communities might be that the remaining POM pool could represent material with an overall lower trophic position and average δ15N than the zooplankton. Again, while these potential mechanistic explanations would require additional research to confirm or refute, the spatial differences in isotope compositions between nearshore and offshore stations is clearly suggestive of an overall influence of island proximity reflecting an IME.
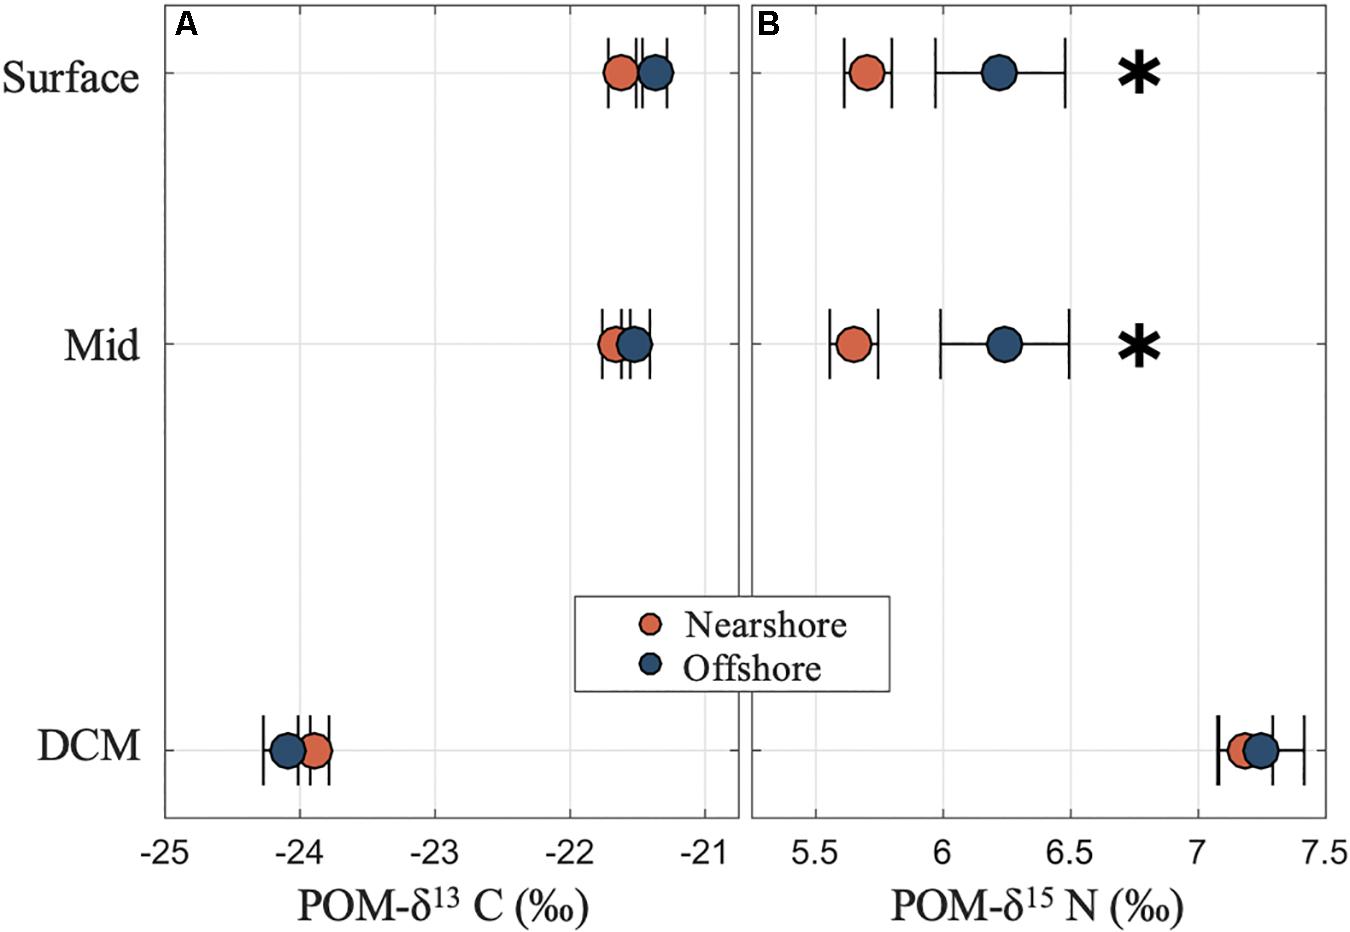
Figure 3. Carbon and nitrogen isotope compositions of POM in surface, mid and deep chlorophyll maxima (DCM) layers near and offshore from Mo’orea showing (A) depleted carbon isotopes (POM-δ13C in ‰) for POM in the DCM relative to the surface layers and (B) significantly elevated nitrogen isotopes (POM-δ15N in ‰) in the DCM and at stations offshore relative to near the island. Asterisks denote significant differences between nearshore and offshore samples (p values < 0.05).
Estimates of apparent oxygen utilization (AOU) account for the effects of temperature and salinity on dissolved oxygen concentrations, and reflect remineralization of organic carbon and the removal of dissolved oxygen by respiration (Doval and Hansell, 2000; Carlson et al., 2010). To estimate the contribution of DOC remineralization to AOU, we converted AOU to carbon equivalents (AOU-Ceq) using a molar ratio of −ΔC: ΔO2 of 0.72 (Anderson, 1995). Comparing direct measurements of log-transformed concentrations of DOC in the upper mesopelagic to direct estimates of log-transformed AOU, we found DOC remineralization accounted for approximately 18% of AOU within the upper mesopelagic. This observation is at the lower end of previous reports of the contribution of DOC oxidation to AOU in the upper mesopelagic of subtropical gyre ecosystems (e.g., Carlson et al., 2010; Pan et al., 2014). The remaining AOU signal is likely due to remineralization of sinking particle flux over an unknown period of time.
Upper Euphotic Zone (0–75 m) Variability and Evidence of an IME
To assess the presence of an IME, we compared vertical profiles of rates of productivity, as well as concentrations and compositions of organic matter within the upper euphotic zone (0–75 m; Figures 3, 4). Stations were grouped by their relative proximity to island shores (Figure 1) into offshore (# 1–24) and nearshore (# 25–41) stations. Statistical differences between the two groups were analyzed using log-transformed values of each measured parameter.
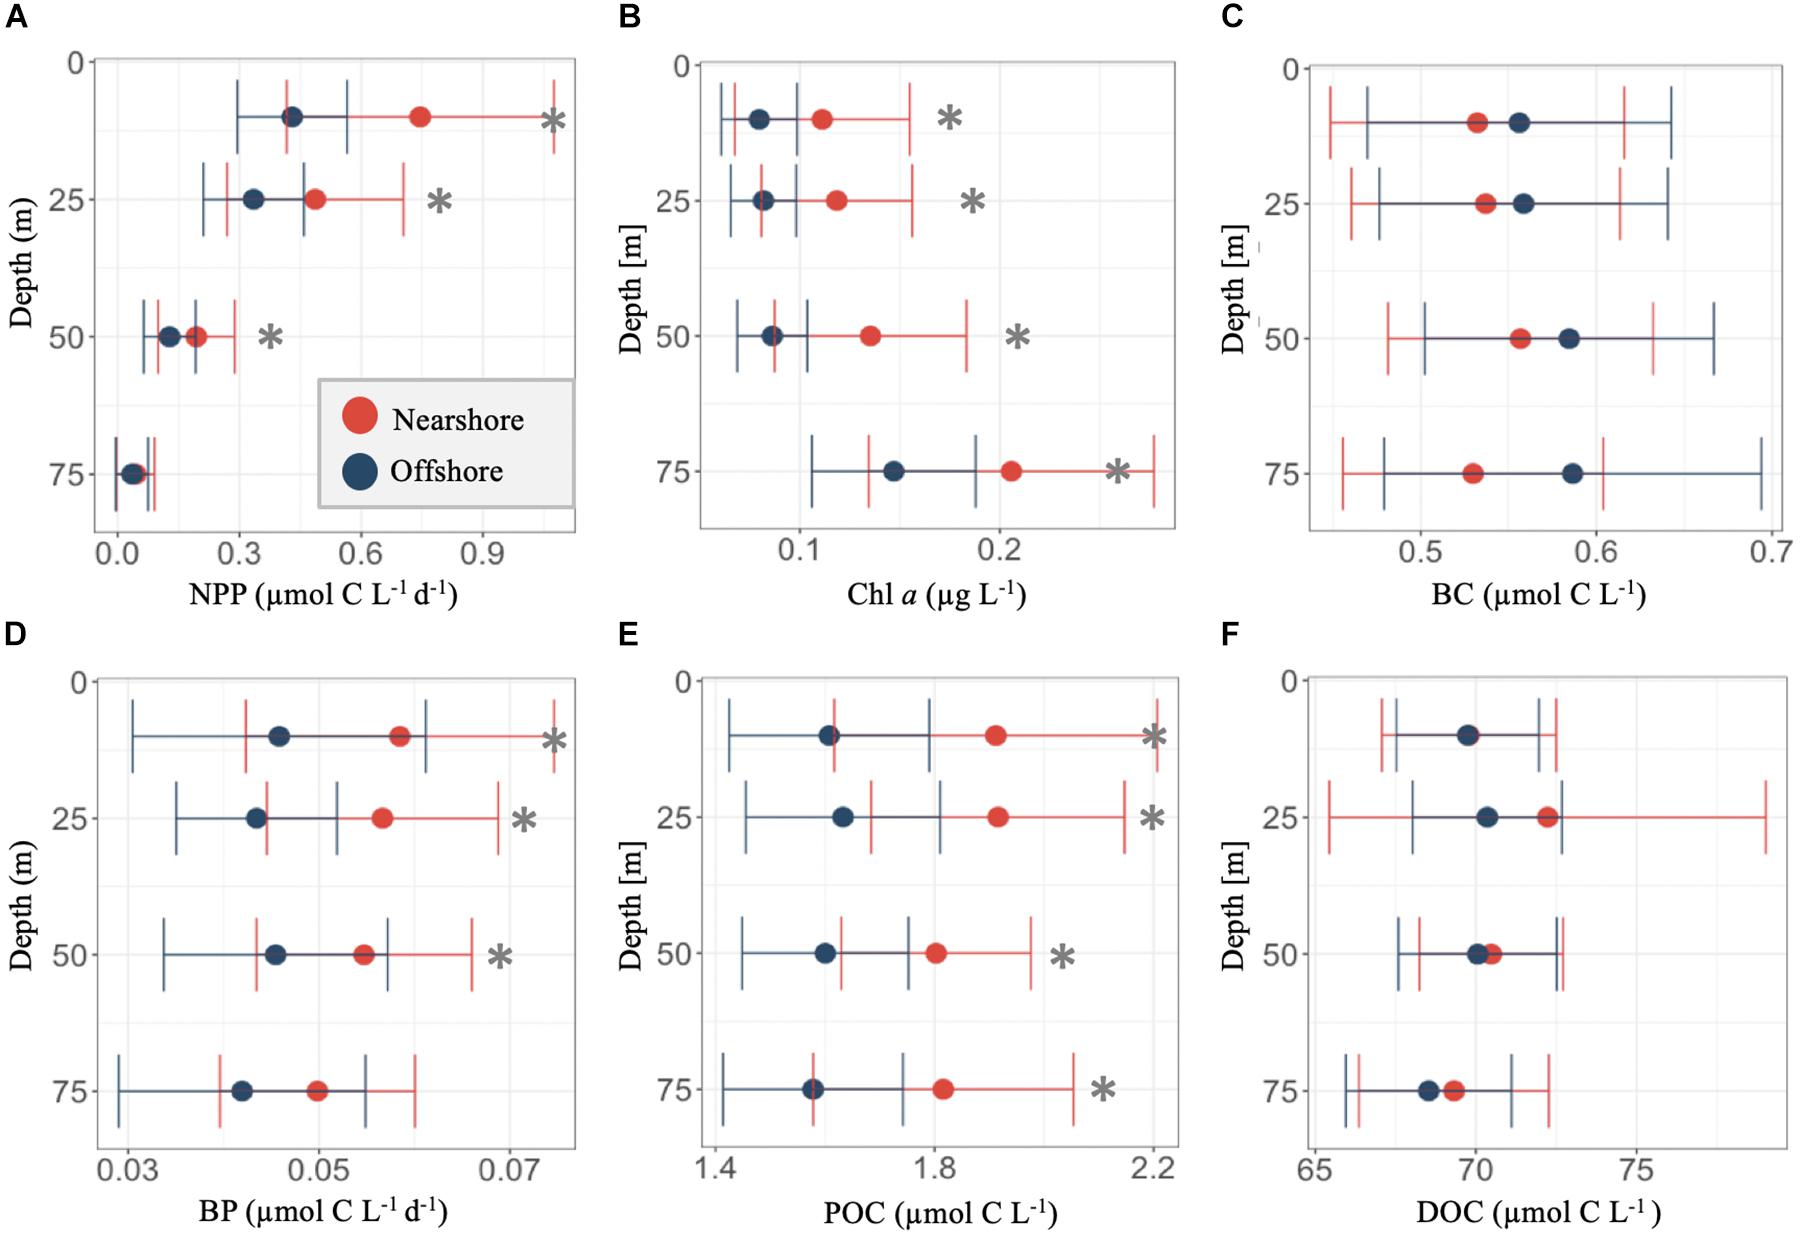
Figure 4. Depth profiles of in the upper euphotic zone (0–75 m) of concentrations of net primary productivity (NPP; A), chlorophyll a (Chl; B), bacterioplankton carbon (BC; C), heterotrophic bacterioplankton productivity (BP; D), particulate organic carbon (POC; E), and dissolved organic carbon (DOC; F). Dark blue points indicated means ± SD for offshore stations, while red represents means ± SD for stations near Mo’orea. Asterisks denote significant differences (p values < 0.05) in log(10)-transformed measured biogeochemical rates and concentrations as a function of station location (offshore versus nearshore). Statistical analysis was evaluated using a one-way analysis of variance (ANOVA).
In the upper euphotic zone, grouping stations by proximity to Mo’orea (“nearshore”) revealed coincident horizontal variability in NPP, Chl, BP, POC, and POM-δ15N (0–75 m; Figures 3B, 4A,B,D,E and Supplementary Table S1). Collectively, nearshore stations exhibited significantly elevated log-transformed mean concentrations of Chl (p value < 0.01) and POC (p value < 0.01), as well as lower values of POM-δ15N (p value < 0.01) throughout the upper euphotic zone (0–75 m; Figures 4B,E), compared with offshore stations (Supplementary Table S1). In addition, nearshore stations exhibited elevated log-transformed mean rates of NPP (p value < 0.01) and BP (p value ≤ 0.01) over the upper 50 m of the water column, compared with offshore stations (Figures 4A,D and Supplementary Table S1). These observations in the upper euphotic zone indicate that key biogeochemical constituents were enhanced at nearshore stations, compared with offshore stations, during our sampling period and may be indicative of an IME that resulted in distinct biogeochemical characteristics near the island (e.g., Takahashi et al., 1981; Xie et al., 2001; Caldeira et al., 2005; Gove et al., 2016 and citations therein).
An IME may have contributed to elevated rates of productivity, as well as concentrations of POC and Chl, through the introduction of limiting nutrients to stations nearshore, thus stimulating productivity and production of organic matter. Enhanced rates of BP in the upper euphotic zone may indicate a rapid response of bacterioplankton to this freshly produced organic matter. However, in contrast to previous observations of upwelling induced IMEs near deep-sea islands (Furuya et al., 1986; Heywood et al., 1990; Hasegawa et al., 2004), our observations of MLDs suggest that vertical mixing was not sufficiently deep to entrain nutrients from the upper portion of the nutricline into the upper euphotic zone during our sampling period (see MLD in white line in Supplementary Figure S2).
Observations by satellite remote sensing, shipboard ADCPs, and nearshore moorings were all consistent with a general anticyclonic flow pattern around Mo’orea. Satellite altimetry data3 averaged over the sampling period revealed generally positive sea surface height anomalies (SSHAs) at large scales around Mo’orea. Geostrophic flow vectors derived from the SSHAs indicated the predominance of anticyclonic flow in the region (Figure 5A). A few areas of cyclonic flow were also observed at these scales 200–300 km southeast and southwest of Mo’orea. Shipboard ADCP measurements in the upper ocean (averaged over depths ≤75 m) indicated a general pattern of anticyclonic flow at smaller scales around Mo’orea, consistent with the SSHA observations (Figure 5B). It should be noted that the ADCP data were collected over 2 weeks and changes in the current field around Mo’orea likely occurred over the measurement period. Despite this, the orientations of most current vectors measured by the ADCPs suggested an anticyclonic flow pattern. Nearshore moored current observations averaged over the 2-week sampling period (vertically averaged in 15-m water depths) also indicated anticyclonic flow around Mo’orea (Figure 5B). Anticyclonic flow at mesoscales results in elevated sea surface height and downward displacement of the pycnocline, often depressing the nutricline and reducing nutrient supply to the upper euphotic zone (McGillicuddy et al., 1999). Consequently, the observed IME in the upper euphotic zone around Mo’orea is most likely not driven by nutrient supply from below the nutricline. We therefore suggest that lateral transport of inorganic nutrients originating from the islands, rather than vertical transport via mixing, stimulated productivity at these stations. Observations of offshore flow along western Tahiti, as well as anticyclonic flow around Mo’orea (Figure 5B), during the sampling period may have led to the introduction of nutrients near Mo’orea via mechanisms such as submarine groundwater discharge, local human impacts, atmospheric deposition, or previous mixing induced by upwelling near the island (e.g., Furuya et al., 1986; Hasegawa et al., 2004). Furthermore, entrainment of inorganic nutrients and organic matter in the anticyclonic flow around Mo’orea could lead to retention of this material near the island.
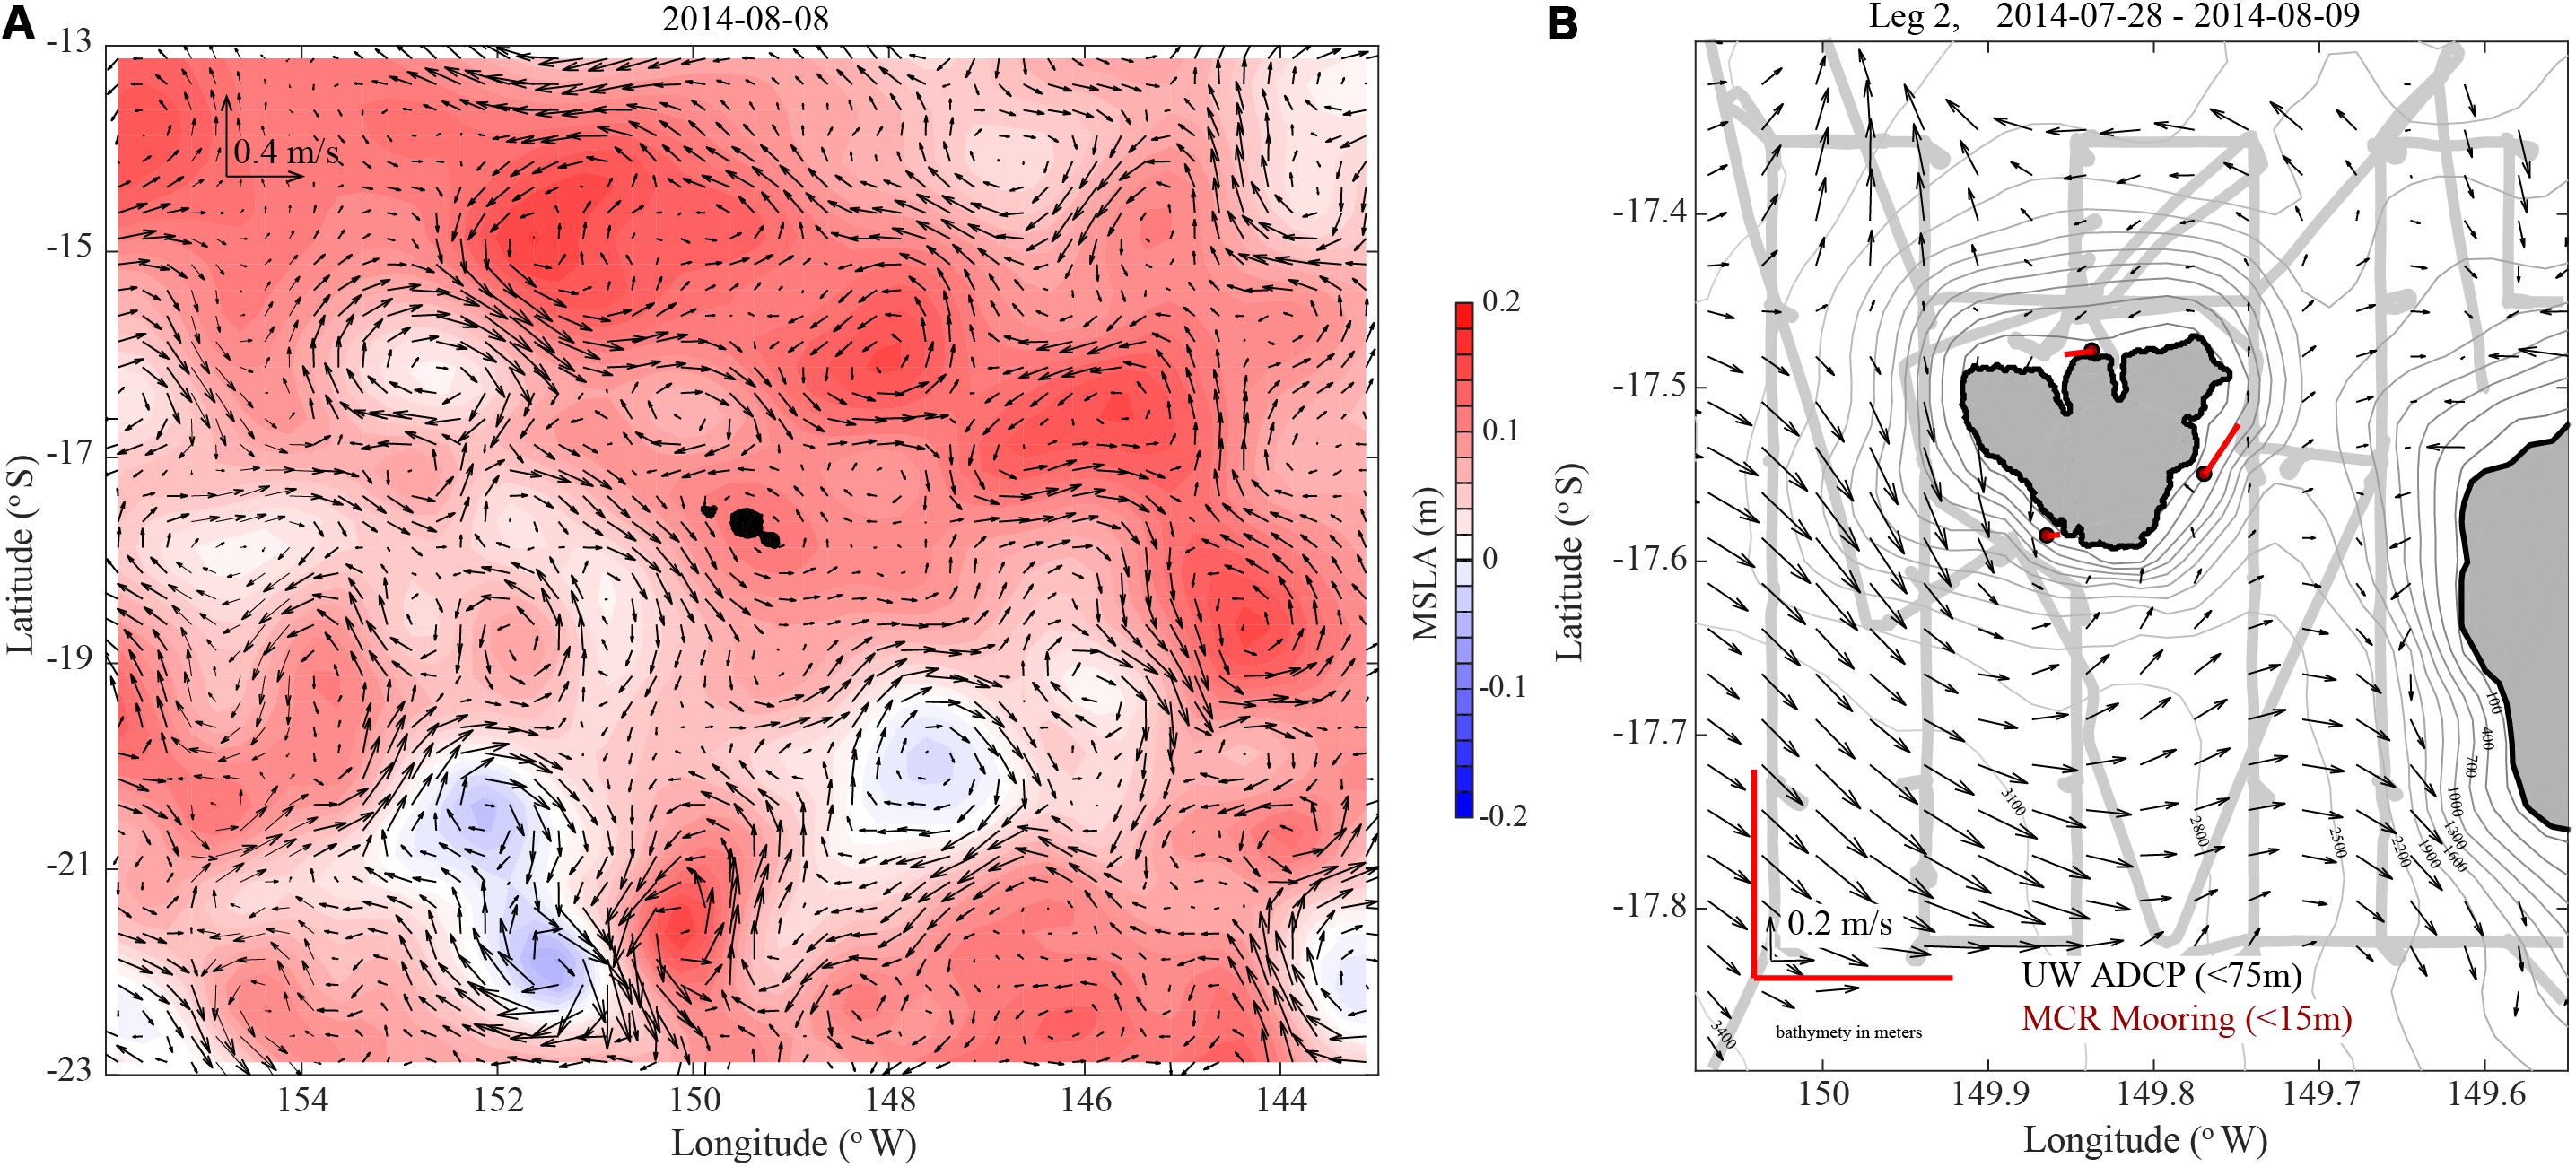
Figure 5. Surface current patterns in the vicinity of Mo’orea. (A) Large-scale currents from 8 August 2014 from satellite radar altimetry http://marine.copernicus.eu/. Velocity scale for current vectors is at upper left. Color bar at right of panel indicates mean sea level anomaly (MSLA). (B) Currents around Mo’orea. Black vectors show optimally interpolated currents from a shipboard ADCP during 28 July–9 August 2014 as described in the text. Red current sticks near Mo’orea show vertically averaged currents from three bottom-mounted ADCPs on the 15 m isobath during 28 July–9 August 2014. Velocity scales at lower left correspond to ADCP vectors (black arrows) and moored currents (red sticks). Gray line shows ship track during ADCP data collection.
Satellite Chl Observations
Enhanced productivity near the island is also evidenced from the MODIS Chl imagery. The satellite data show higher Chl concentrations in the close vicinity of both Mo’orea and Tahiti compared to offshore waters over the time period July–August 2014 (Figure 6A). On average, Chl values within ∼10–12 km of the reef crest are higher than in more offshore waters (Figure 6B). This is true for the two time-scales that were tested in this study: July to August 2014 and 2003–2017 (Figure 6B). The enhanced Chl pattern and its magnitude as observed around Mo’orea and Tahiti agree well with those presented in Gove et al. (2016) for other islands in the tropical Pacific. The fact that increased Chl close to the islands is observed at very different time scales suggests that this is a persistent pattern in the Mo’orea and Tahiti island system.
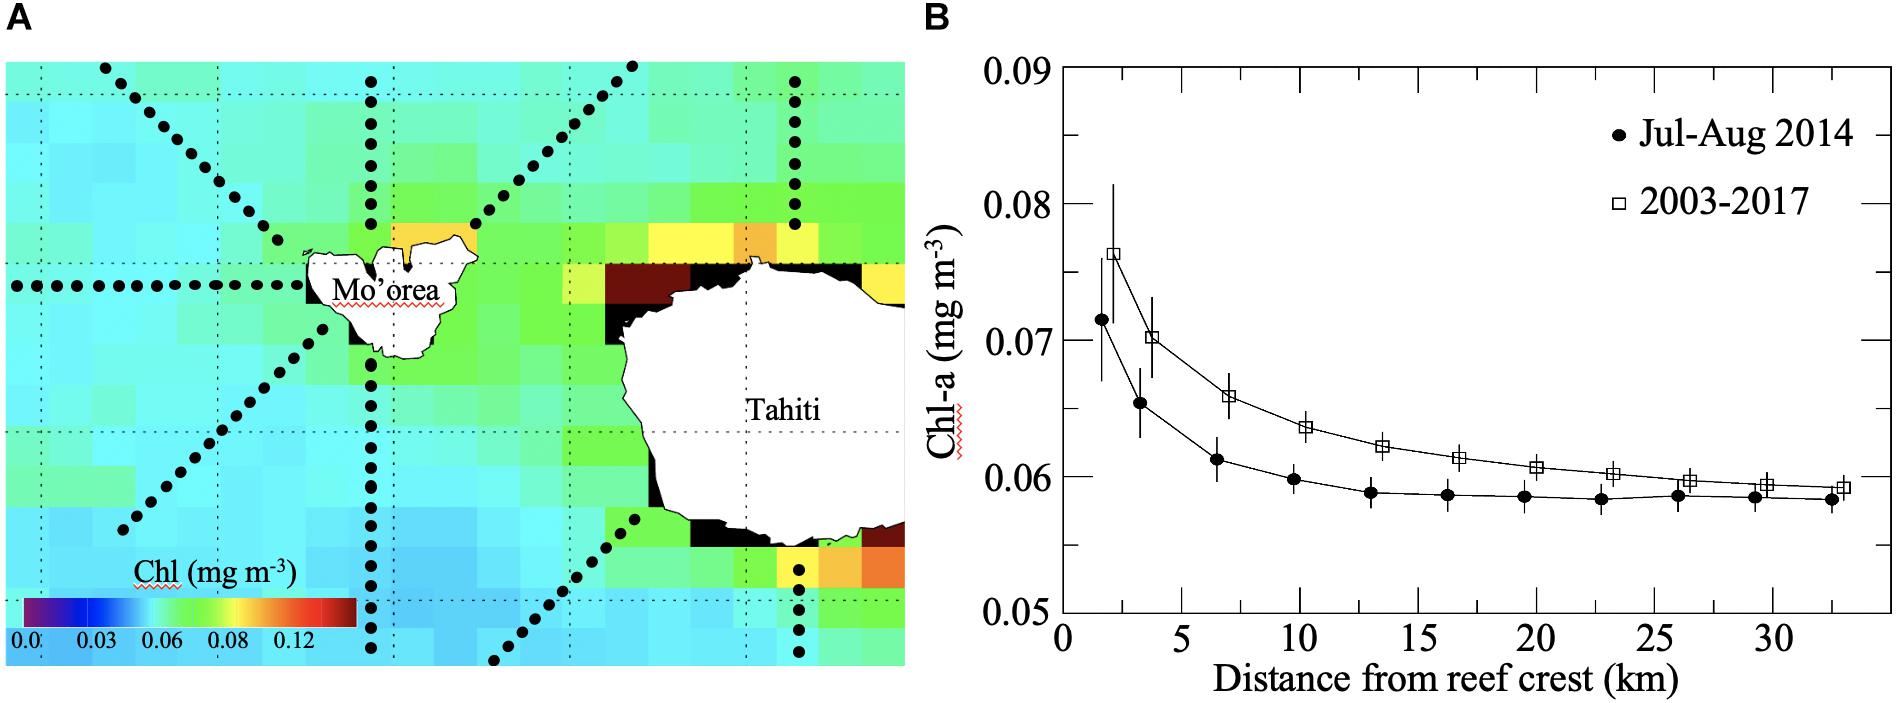
Figure 6. Chlorophyll a distribution surrounding Mo’orea and near Tahiti from MODIS-Aqua data. (A) Map of the Chl distribution for the July–August 2014 time period and the 9 transects sampled. (B) Chl mean and standard error from all transects as a function of the distance to the reef crest for July–August 2014 (black circles) and over the 2003–2017 time period (squares).
Summary
Overall, our observations of physical and biogeochemical variables in the upper 300 m of the water column near Mo’orea provide evidence of enhancement of key biogeochemical variables (i.e., NPP, Chl, BP, and POC) in the upper euphotic zone within 5 to 15 km of shore, compared with farther offshore. This, along with distinct physical dynamics and the presence of POM with distinct isotopic characteristics at stations near Mo’orea, provides evidence of an IME which remote sensing data also appear to support. While the work presented here was primarily observational in nature, it does lend support to prior considerations of the mechanisms supporting IMEs. Mechanisms contributing to the IME surrounding Mo’orea likely include inputs to the marine environment from the relatively high (∼1,200 m highest elevation) volcanic island, potentially including both surface and groundwater run off (Knee et al., 2016), as well as from alteration of oceanic water by the island’s reefs and oceanic sources associated with internal waves (Wolanski and Delesalle, 1995; Leichter et al., 2012) and island-induced mixing and potential retention processes (Leichter et al., 2013). The presence of an IME likely augments the spatial variability in key biogeochemical variables in an otherwise stable oceanic environment and ultimately enhances the role of vertical and lateral transport along with retention of inorganic nutrients and organic matter in supporting the high biomass and productivity on oceanic island coral reefs such as Mo’orea.
Data Availability Statement
The datasets generated for this study can be found in http://mcrlter.msi.ucsb.edu/cgi-bin/showDataset.cgi?docid=knb-lter-mcr.5035.
Author Contributions
All authors designed the research, conducted the research, and contributed to writing the manuscript.
Funding
This study was supported in part by the National Science Foundation grants OCE-1236905 to MCR-LTER, OCE-1538428 to CC, OCE-1538393 to CN and OCE-1535203 to JL, and NASA grant NNX11AE87G (The Science of Terra and Aqua) to SM. CN was funded in part by a grant/cooperative agreement from the National Oceanic and Atmospheric Administration, Project A/AS-1, which is sponsored by the University of Hawai‘i Sea Grant College Program under Institutional Grant No. NA18OAR4170076 from NOAA Office of Sea Grant, Department of Commerce. AW was partially supported by a fellowship from the Japan Society for the Promotion of Science (JSPS) and isotope measurements by JSPS Grant #15F15904. The views expressed herein are those of the authors and do not necessarily reflect the views of NOAA or any of its sub-agencies. This manuscript is University of Hawai‘i at Mānoa School of Ocean and Earth Science and Technology publication no. 10887 and UH Sea Grant publication number UNIHI-SEAGRANT-JC-19-04.
Conflict of Interest
The authors declare that the research was conducted in the absence of any commercial or financial relationships that could be construed as a potential conflict of interest.
Acknowledgments
We thank the officers and crew of the R.V. Kilo Moana, as well as Kristina Remple, Maverick Carey, Keri Opalk, Elisa Halewood, Daniel Ellis, Nick Baetge, Henry Morse, Jonathan Jones, Mark Bitter, Josh Hancock, Eric Tong, Matt Olson, Marge Blackford, Johanna Rosman, Sandra Rolle, and Amethyst Juknovarian, without whose assistance and expertise this work would not have been possible. We also thank Andrew Brooks, Keith Seydel, and Jessica Nielson for their invaluable logistical support and expertise. The satellite ocean color data used in this study were obtained from the NASA Ocean Biology Processing Group and OB.DAAC (https://oceancolor.gsfc.nasa.gov).
Supplementary Material
The Supplementary Material for this article can be found online at: https://www.frontiersin.org/articles/10.3389/fmars.2020.00016/full#supplementary-material
Footnotes
- ^ http://mcrlter.msi.ucsb.edu/cgi-bin/showDataset.cgi?docid=knb-lter-mcr.10
- ^ http://mcrlter.msi.ucsb.edu/cgi-bin/showDataset.cgi?docid=knb-253lter-mcr.1037
- ^ http://marine.copernicus.eu/
References
Altabet, M. A. (2001). Nitrogen isotopic evidence for micronutrient control of fractional NO3- utilization in the equatorial Pacific. Limnol. Oceanogr. 46, 368–380. doi: 10.4319/lo.2001.46.2.0368
Anderson, D. M., Glibert, P. M., and Burkholder, J. M. (2002). Harmful algal blooms and eutrophication: nutrient sources, composition, and consequences. Estuaries 25, 704–726. doi: 10.1007/bf02804901
Anderson, L. A. (1995). On the hydrogen and oxygen content of marine phytoplankon. Deep Sea Res. Part I: Oceanogr. Res. Pap. 42, 1675–1680. doi: 10.1016/0967-0637(95)00072-E
Andrade, I., Sangrà, P., Hormazabal, S., and Correa-Ramirez, M. (2014). Island mass effect in the Juan Fernández Archipelago (33°S), Southeastern Pacific. Deep Sea Res. Part I Oceanogr. Res. Pap. 84, 86–99. doi: 10.1016/j.dsr.2013.10.009
Caldeira, R. M. A., Marchesiello, P., Nezlin, N. P., DiGiacomo, P. M., and McWilliams, J. C. (2005). Island wakes in the Southern California Bight. J. Geophys. Res. 110:C11012. doi: 10.1029/2004JC002675
Carlson, C. A., and Hansell, D. A. (2015). “Chapter 3 – DOM sources, sinks, reactivity, and budgets,” in Biogeochemistry of Marine Dissolved Organic Matter, 2nd Edn, eds D. A. Hansell and C. A. Carlson (Boston, MA: Academic Press), 65–126. doi: 10.1016/b978-0-12-405940-5.00003-0
Carlson, C. A., Hansell, D. A., Nelson, N. B., Siegel, D. A., Smethie, W. M., Khatiwala, S., et al. (2010). Dissolved organic carbon export and subsequent remineralization in the mesopelagic and bathypelagic realms of the North Atlantic basin. Deep Sea Res. Part II Top. Stud. Oceanogr. 57, 1433–1445. doi: 10.1016/j.dsr2.2010.02.013
Caron, D. A., Dam, H. G., Kremer, P., Lessard, E. J., Madin, L. P., Malone, T. C., et al. (1995). The contribution of microorganisms to particulate carbon and nitrogen in surface waters of the Sargasso Sea near Bermuda. Deep Sea Res. Part I Oceanogr. Res. Pap. 42, 943–972. doi: 10.1016/0967-0637(95)00027-4
Cullen, J. J. (2015). Subsurface chlorophyll maximum layers: enduring enigma or mystery solved? Annu. Rev. Mar. Sci. 7, 207–239. doi: 10.1146/annurev-marine-010213-135111
Doval, M. D., and Hansell, D. A. (2000). Organic carbon and apparent oxygen utilization in the western South Pacific and the central Indian Oceans. Mar. Chem. 68, 249–264. doi: 10.1016/s0304-4203(99)00081-x
Erickson, Z. K., and Thompson, A. F. (2018). The seasonality of physically driven export at submesoscales in the northeast Atlantic Ocean. Global Biogeoch. Cycles 32, 1144–1162.
Firing, E., and Hummon, J. M. (2010). Shipboard ADCP Measurements. The GO-SHIP Repeat Hydrography Manual: A Collection of Expert Reports and Guidelines. IOCCP Report #14. ICPO Publication Series 134; Version 1. Available at: http://www.go-ship.org/HydroMan.html
Fukuda, R., Ogawa, H., Nagata, T., and Koike, I. (1998). Direct determination of carbon and nitrogen contents of natural bacterial assemblages in marine environments. Appl. Environ. Microbiol. 64, 3352–3358. doi: 10.1128/aem.64.9.3352-3358.1998
Furuya, K., Takahashi, M., and Nemoto, T. (1986). Summer phytoplankton community structure and growth in a regional upwelling area off Hachijo Island, Japan. J. Exp. Mar. Biol. Ecol. 96, 43–55. doi: 10.1016/0022-0981(86)90012-2
Garrison, G., Glenn, C. R., and McMurtry, G. R. (2003). Measurement of submarine groundwater discharge in Kahana Bay, O’ahu, Hawai‘i. Limnol. Oceanogr. 48, 920–928. doi: 10.4319/lo.2003.48.2.0920
Gilmartin, M., and Revelante, N. (1974). The ‘island mass’ effect on the phytoplankton and primary production of the Hawaiian Islands. J. Exp. Mar. Biol. Ecol. 16, 181–204. doi: 10.1016/0022-0981(74)90019-7
Glöckner, F. O., Fuchs, B. M., and Amann, R. (1999). Bacterioplankton compositions of lakes and oceans: a first comparison based on fluorescence in situ hybridization. Appl. Environ. Microbiol. 65, 3721–3726. doi: 10.1128/aem.65.8.3721-3726.1999
Gove, J. M., McManus, M. A., Neuheimer, A. B., Polovina, J. J., Drazen, J. C., Smith, C. R., et al. (2016). Near-island biological hotspots in barren ocean basins. Nat. Commun. 7:10581. doi: 10.1038/ncomms10581
Gundersen, K., Heldal, M., Norland, S., Purdie, D. A., and Knap, A. H. (2002). Elemental C, N, and P cell content of individual bacteria collected at the Bermuda Atlantic Time-series Study (BATS) site. Limnol. Oceanogr. 47, 1525–1530. doi: 10.4319/lo.2002.47.5.1525
Halewood, E., Carlson, C., Brzezinski, M., Reed, D., and Goodman, J. (2012). Annual cycle of organic matter partitioning and its availability to bacteria across the Santa Barbara Channel continental shelf. Aquat. Microb. Ecol. 67, 189–209. doi: 10.3354/ame01586
Hamner, W. M., Colin, P. L., and Hamner, P. P. (2007). Export–import dynamics of zooplankton on a coral reef in Palau. Mar. Ecol. Prog. Ser. 334, 83–92. doi: 10.3354/meps334083
Hansell, D. A., and Carlson, C. A. (2001). Marine dissolved organic carbon and the carbon cycle. Oceanography 14, 41–49. doi: 10.5670/oceanog.2001.05
Hansell, D. A., Carlson, C. A., Repeta, D. J., and Schlitzer, R. (2009). Dissolved organic matter in the ocean: a controversy stimulates new insights. Oceanography 22, 202–211. doi: 10.5670/oceanog.2009.109
Hasegawa, D., Yamazaki, H., Lueck, R. G., and Seuront, L. (2004). How islands stir and fertilize the upper ocean. Geophys. Res. Lett. 31:L16303. doi: 10.1029/2004GL020143
Heywood, K. J., Barton, E. D., and Simpson, J. H. (1990). The effects of flow disturbance by an oceanic island. J. Mar. Res. 48, 55–73. doi: 10.1357/002224090784984623
Heywood, K. J., Stevens, D. P., and Bigg, G. R. (1996). Eddy formation behind the tropical island of Aldabra. Deep Sea Res. I 43, 555–578. doi: 10.1016/0967-0637(96)00097-0
Hinga, K. R., Arthur, M. A., Pilson, M. E. Q., and Whitaker, D. (1994). Carbon isotope fractionation by marine phytoplankton in culture: the effects of CO2 concentration, pH, temperature, and species. Global Biogeochem. Cycles 8, 91–102. doi: 10.1029/93GB03393
Johannes, R. E., Alberts, J., D’Elia, C., Kinzie, R. A., Pomeroy, L. R., Sottile, W., et al. (1972). The metabolism of some coral reef communities: a team study of nutrient and energy flux at Eniwetok. Bioscience 22, 541–543. doi: 10.2307/1296314
Karl, D. M., and Church, M. J. (2014). Microbial oceanography and the Hawaii Ocean Time-series programme. Nat. Rev. Microbiol. 12, 699–713. doi: 10.1038/nrmicro3333
Karl, D. M., and Church, M. J. (2017). Ecosystem structure and dynamics in the North Pacific Subtropical Gyre: new views of an old ocean. Ecosystems 20, 433–457. doi: 10.1007/s10021-017-0117-0
Knap, A., Michaels, A., Close, A., Ducklow, H., and Dickson, A. (1996). Protocols for the Joint Global Ocean Flux Study (JGOFS) Core Measurements. JGOFS Report Nr. 19, vi+170 pp. Reprint of the IOC Manuals and Guides No. 29, UNESCO 1994. Paris: UNESCO.
Knee, K. L., Crook, E. D., Hench, J. L., Leichter, J. J., and Paytan, A. (2016). Assessment of submarine groundwater discharge (SGD) as a source of dissolved radium and nutrients to Moorea (French Polynesia) coastal waters. Estuaries Coasts 39, 1651–1668. doi: 10.1007/s12237-016-0108-y
Legendre, P., and Legendre, L. (2012). Numerical Ecology, Vol. 24, Developments in Environmental Modelling, 3rd Edn. Amsterdam: Elsevier.
Leichter, J. J., Alldredge, A., Bernardi, G., Brooks, A., Carlson, C., Carpenter, R., et al. (2013). Biological and physical interactions on a tropical island coral reef: transport and retention processes on Moorea, French Polynesia. Oceanography 26, 52–63. doi: 10.5670/oceanog.2013.45
Leichter, J. J., Stewart, H. L., and Miller, S. L. (2003). Episodic nutrient transport to Florida coral reefs. Limnol. Oceanogr. 48, 1394–1407. doi: 10.4319/lo.2003.48.4.1394
Leichter, J. J., Stokes, M. D., Hench, J. L., Witting, J., and Washburn, L. (2012). The island-scale internal wave climate of Moorea, French Polynesia. J. Geophys. Res. Oceans 117:C06008. doi: 10.1029/2012JC007949
Letscher, R. T., Knapp, A. N., James, A. K., Carlson, C. A., Santoro, A. E., and Hansell, D. A. (2015). Microbial community composition and nitrogen availability influence DOC remineralization in the South Pacific Gyre. Mar. Chem. 177(Pt 2), 325–334. doi: 10.1016/j.marchem.2015.06.024
Lomas, M. W., Bates, N. R., Johnson, R. J., Knap, A. H., Steinberg, D. K., and Carlson, C. A. (2013). Two decades and counting: 24-years of sustained open ocean biogeochemical measurements in the Sargasso Sea. Deep Sea Res. Part II Top. Stud. Oceanogr. 93, 16–32. doi: 10.1016/j.dsr2.2013.01.008
Longhurst, A., Sathyendranath, S., Platt, T., and Caverhill, C. (1995). An estimate of global primary production in the ocean from satellite radiometer data. J. Plankton Res. 17, 1245–1271. doi: 10.1093/plankt/17.6.1245
Mahadevan, A. (2016). The impact of submesoscale physics on primary productivity of plankton. Annu. Rev. Mar. Sci. 8, 161–184. doi: 10.1146/annurev-marine-010814-015912
McGillicuddy, D. Jr., Johnson, R., Siegel, D., Michaels, A., Bates, N., and Knap, A. (1999). Mesoscale variations of biogeochemical properties in the Sargasso Sea. J. Geophys. Res. Oceans 104, 13381–13394. doi: 10.1029/1999jc900021
Merrifield, M. A., Holloway, P. E., and Johnston, T. S. (2001). The generation of internal tides at the Hawaiian Ridge. Geophys. Res. Lett. 28, 559–562. doi: 10.1029/2000gl011749
Morel, A., Huot, Y., Gentili, B., Werdell, P. J., Hooker, S. B., and Franz, B. A. (2007). Examining the consistency of products derived from various ocean color sensors in open ocean (Case 1) waters in the perspective of a multi-sensor approach. Remote Sens. Environ. 111, 69–88. doi: 10.1016/j.rse.2007.03.012
Nelson, C. E., Alldredge, A. L., McCliment, E. A., Amaral-Zettler, L. A., and Carlson, C. A. (2011). Depleted dissolved organic carbon and distinct bacterial communities in the water column of a rapid-flushing coral reef ecosystem. ISME J. 5, 1374–1387. doi: 10.1038/ismej.2011.12
Odum, H. T., and Odum, E. P. (1955). Trophic structure and productivity of a windward coral reef community on Eniwetok Atoll. Ecol. Monogr. 25, 291–320. doi: 10.2307/1943285
Palacios, D. M. (2002). Factors influencing the island-mass effect of the Galápagos Archipelago. Geophys. Res. Lett. 29, 1–4.
Pan, X., Achterberg, E. P., Sanders, R., Poulton, A. J., Oliver, K. I. C., and Robinson, C. (2014). Dissolved organic carbon and apparent oxygen utilization in the Atlantic Ocean. Deep Sea Res. Part I Oceanogr. Res. Pap. 85, 80–87. doi: 10.1016/j.dsr.2013.12.003
Rissik, D., Suthers, I. M., and Taggart, C. T. (1997). Enhanced zooplankton abundance in the lee of an isolated reef in the south Coral Sea: the role of flow disturbance. J. Plankton Res. 19, 1347–1368. doi: 10.1093/plankt/19.9.1347
Rougerie, F., and Rancher, J. (1994). The Polynesian south ocean: features and circulation. Mar. Pollut. Bull. 29, 14–25. doi: 10.1016/0025-326x(94)90421-9
Sea-Bird Electronics (2014). Seasoft V2: SBE Data Processing Manual. Bellevue, WA: Sea-Bird Electronics, Inc., 174.
Sigman, D. M., Altabet, M. A., Michener, R., McCorkle, D. C., Fry, B., and Holmes, R. M. (1997). Natural abundance-level measurement of the nitrogen isotopic composition of oceanic nitrate: an adaptation of the ammonia diffusion method. Mar. Chem. 57, 227–242. doi: 10.1016/s0304-4203(97)00009-1
Sigman, D. M., Karsh, K. L., and Casciotti, K. L. (2009). “Nitrogen isotopes in the ocean,” in Encyclopedia of Ocean Sciences, 2nd Edn, ed. J. H. Steele (Oxford: Academic Press), 40–54. doi: 10.1016/b978-012374473-9.00632-9
Signorini, S. R., McClain, C. R., and Dandonneau, Y. (1999). Mixing and phytoplankton bloom in the wake of the Marquesas Islands. Geophys. Res. Lett. 26, 3121–3124. doi: 10.1029/1999gl010470
Simon, M., and Azam, F. (1989). Protein content and protein synthesis rates of planktonic marine bacteria. Mar. Ecol. Prog. Ser. 51, 201–213. doi: 10.3354/meps051201
Smith, D. C., Simon, M., Alldredge, A. L., and Azam, F. (1992). Intense hydrolytic enzyme activity on marine aggregates and implications for rapid particle dissolution. Nature 359, 139–142. doi: 10.1038/359139a0
Smith, R. C., Baker, K. S., and Dustan, P. (1981). Fluorometric Techniques for the Measurement of Oceanic Chlorophyll in the Support of Remote Sensing. San Diego, CA: University of California San Diego, San Diego.
Steinberg, D. K., Carlson, C. A., Bates, N. R., Johnson, R. J., Michaels, A. F., and Knap, A. H. (2001). Overview of the US JGOFS Bermuda Atlantic Time-series Study (BATS): a decade-scale look at ocean biology and biogeochemistry. Deep Sea Res. Part II Top. Stud. Oceanogr. 48, 1405–1447. doi: 10.1016/s0967-0645(00)00148-x
Takahashi, M., Yasuoka, Y., Watanabe, M., Miyazaki, T., and Ichimura, S. (1981). Local upwelling associated with vortex motion off Oshima Island, Japan. Coast. Estuar. Sci. 1, 119–124. doi: 10.1029/co001p0119
Thompson, R. E., and Emery, W. (2014). Data Analysis Methods in Physical Oceanography, 3rd Edn. Oxford: Elsevier.
Wear, E. K., Carlson, C. A., James, A. K., Brzezinski, M. A., Windecker, L. A., and Nelson, C. E. (2015). Synchronous shifts in dissolved organic carbon bioavailability and bacterial community responses over the course of an upwelling-driven phytoplankton bloom: bloom-induced shifts in DOC availability. Limnol. Oceanogr. 60, 657–677. doi: 10.1002/lno.10042
Wilson, S. T., Barone, B., Ascani, F., Bidigare, R. R., Church, M. J., del Valle, D. A., et al. (2015). Short-term variability in euphotic zone biogeochemistry and primary productivity at Station ALOHA: a case study of summer 2012. Global Biogeochem. Cycles 29, 1145–1164. doi: 10.1002/2015gb005141
Wolanski, E., and Delesalle, B. (1995). Upwelling by internal waves, Tahiti, French Polynesia. Cont. Shelf Res. 15, 357–368. doi: 10.1016/0278-4343(93)e0004-r
Wolanski, E., and Hamner, W. M. (1988). Topographically controlled fronts in the ocean and their biological influence. Science 241, 177–181. doi: 10.1126/science.241.4862.177
Wolanski, E., and Pickard, G. L. (1983). Upwelling by internal tides and Kelvin waves at the continental shelf break on the Great Barrier Reef. Mar. Freshw. Res. 34, 65–80.
Wyatt, A. S. J., Falter, J. L., Lowe, R. J., Humphries, S., and Waite, A. M. (2012). Oceanographic forcing of nutrient uptake and release over a fringing coral reef. Limnol. Oceanogr. 57, 401–419. doi: 10.4319/lo.2012.57.2.0401
Wyatt, A. S. J., Leichter, J. J., Toth, L. T., Miyajima, T., Aronson, R., and Nagata, T. (2020). Heat accumulation on coral reefs mitigated by internal waves. Nat. Geosci. 13, 28–34. doi: 10.1038/s41561-019-0486-4
Wyatt, A. S. J., Lowe, R. J., Humphries, S., and Waite, A. M. (2010). Particulate nutrient fluxes over a fringing coral reef: relevant scales of phytoplankton production and mechanisms of supply. Mar. Ecol. Prog. Ser. 405, 113–130. doi: 10.3354/meps08508
Wyatt, A. S. J., Lowe, R. J., Humphries, S., and Waite, A. M. (2013). Particulate nutrient fluxes over a fringing coral reef: source-sink dynamics inferred from carbon to nitrogen ratios and stable isotopes. Limnol. Oceanogr. 58, 409–427. doi: 10.4319/lo.2013.58.1.0409
Wyatt, A. S. J., Matsumoto, R., Chikaraishi, Y., Miyairi, Y., Yokoyama, Y., Sato, K., et al. (2019). Enhancing insights into foraging specialization in the world’s largest fish using a multi-tissue, multi-isotope approach. Ecol. Monogr. 89:e01339. doi: 10.1002/ecm.1339
Keywords: Island Mass Effect, productivity enhancement near islands, coastal processes, marine biogeochemistry, tropical island marine ecosystems
Citation: James AK, Washburn L, Gotschalk C, Maritorena S, Alldredge A, Nelson CE, Hench JL, Leichter JJ, Wyatt ASJ and Carlson CA (2020) An Island Mass Effect Resolved Near Mo’orea, French Polynesia. Front. Mar. Sci. 7:16. doi: 10.3389/fmars.2020.00016
Received: 01 November 2019; Accepted: 10 January 2020;
Published: 30 January 2020.
Edited by:
Christian Lønborg, Australian Institute of Marine Science (AIMS), AustraliaReviewed by:
Ines D. Lange, University of Exeter, United KingdomCoulson Lantz, Southern Cross University, Australia
Copyright © 2020 James, Washburn, Gotschalk, Maritorena, Alldredge, Nelson, Hench, Leichter, Wyatt and Carlson. This is an open-access article distributed under the terms of the Creative Commons Attribution License (CC BY). The use, distribution or reproduction in other forums is permitted, provided the original author(s) and the copyright owner(s) are credited and that the original publication in this journal is cited, in accordance with accepted academic practice. No use, distribution or reproduction is permitted which does not comply with these terms.
*Correspondence: Anna K. James, YWphbWVzQHVjc2IuZWR1; Craig A. Carlson, Y3JhaWdfY2FybHNvbkB1Y3NiLmVkdQ==