 Anne Britt Sandø
 Geir Odd Johansen
 Asgeir Aglen
 Jan Erik Stiansen
 Angelika H. H. Renner
- Institute of Marine Research, Bergen, Norway
In this study we investigate both historical and potential future changes in the spatial distribution of spawning habitats for Northeast Arctic cod (NEA cod) based on a literature study on spawning habitats and different physical factors from a downscaled climate model. The approach to use a high resolution regional ocean model to analyze spawning sites is new and provides more details about crucial physical factors than a global low resolution model can. The model is evaluated with respect to temperature and salinity along the Norwegian coast during the last decades and shows acceptable agreement with observations. However, the model does not take into consideration biological or evolutionary factors which also have impact on choice of spawning sites. Our results from the downscaled RCP4.5 scenario suggest that the spawning sites will be shifted further northeastwards, with new locations at the Russian coast close to Murmansk over the next 50 years, where low temperatures for many decades in the last century were a limiting factor on spawning during spring. The regional model gives future temperatures above the chosen lower critical minimum value in larger areas than today and indicates that spawning will be more extensive there. Dependent on the chosen upper temperature boundary, future temperatures may become a limiting factor for spawning habitats at traditional spawning sites south of Lofoten. Finally, the observed long-term latitudinal shifts in spawning habitats along the Norwegian coast the recent decades may be indirectly linked to temperature through the latitudinal shift of the sea ice edge and the corresponding shift in available ice-free predation habitats, which control the average migration distance to the spawning sites. We therefore acknowledge that physical limitations for defining the spawning sites might be proxies for other biophysically related factors.
1. Introduction
The recent warming of the oceans (Levitus et al., 2009; IPCC, 2013) has resulted in shifts in the geographical distribution of marine fish (Perry, 2005; Dulvy et al., 2008; Fossheim et al., 2015). Several factors and mechanisms, both physical and biological, determine geographical distributions, and subsequently distribution shifts, of fish stocks (Planque et al., 2011). The Northeast Arctic (NEA) cod (Gadus morhua) is one of the most important fish stocks in the Barents Sea, both because of its role in the North Atlantic ecosystem and as a major fishing resource. The spawning sites have sustained a coastal fishery for thousands of years and a potential shift in the spatial distribution of the spawning sites is likely to impact current fishing activities. NEA cod has undergone distribution shifts involving most of its life history stages, parallel to the observed ocean warming during the last 3 decades (Kjesbu et al., 2014; Ingvaldsen et al., 2015; Fall et al., 2018). Considerable expansion of its distribution limits north- and eastwards in the Barents Sea has been observed following increased inflow of warm Atlantic Water into the region (Eriksen et al., 2011; Kjesbu et al., 2014; Fossheim et al., 2015). Further distribution shifts (Stenevik and Sundby, 2007; Drinkwater, 2011) and changes in total stock biomass (Årthun et al., 2018) in the NEA cod stock as a whole have been predicted due to continued ocean warming.
Fish may exhibit a remarkable variability in geographical distribution patterns on population level, and the mechanisms behind are often interacting throughout the life cycle (Planque et al., 2011; Ciannelli et al., 2014). This complicates the identification of important mechanisms, their relative importance and interactions, and thus the projection of future distribution patterns (Loots et al., 2010, 2011; Planque et al., 2011). However, during the spawning season, fish tend to aggregate at spawning sites defined by a narrower set of physical and biological factors, compared to during other life history stages (Planque et al., 2011; Ciannelli et al., 2014). NEA cod is an example of such a species (Figure 1), exhibiting a limited degree of spawning plasticity on the population level (Ciannelli et al., 2014; Michalsen et al., 2014). This means that it is likely to track favorable environmental conditions on local scale for spawning and subsequent survival of the offspring (Righton et al., 2010). The variability in the physical conditions at the spawning sites of NEA cod is therefore an interesting candidate for studying reasons for shifts in these sites. In a warmer future climate this relationship could result in a northward migration of the NEA cod and potentially to immigration of other cod populations adapted to other sets of environmental conditions. The center of the geographic distribution and the outer fringes of the main spawning site of NEA cod along the coast of Norway have fluctuated throughout at least the last century, where we have reliable observations showing both interannual variability in the use of specific spawning sites, as well as multidecadal distribution shifts (Opdal et al., 2008; Sundby and Nakken, 2008; Opdal and Jørgensen, 2015; Langangen et al., 2018). The alternative to shifting spawning sites in a warmer future could be an evolutionary change of the local population (Mieszkowska et al., 2009).
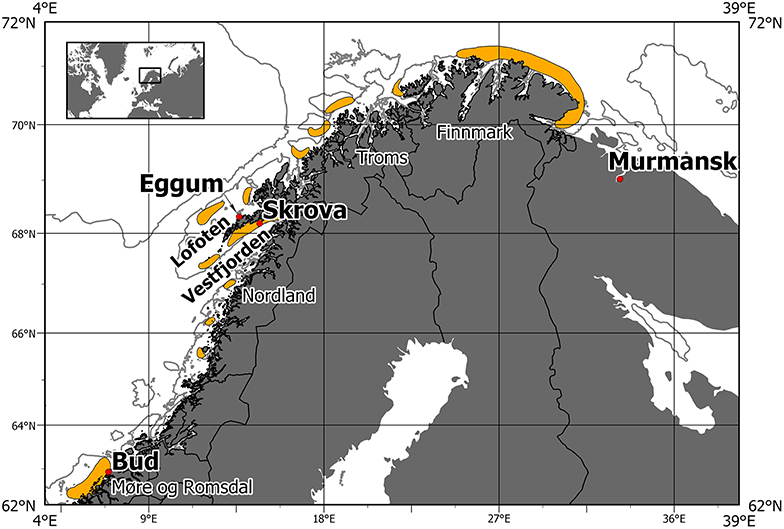
Figure 1. Distribution of spawning sites for Northeast Arctic cod for both warm and cold periods. Based on spawning map and details from Sundby and Nakken (2008).
The NEA cod has a substantial spawning migration from the feeding grounds in the Barents Sea to the west coast of Norway. The choice of spawning location will be a trade-off between the cost of migration and reaching favorable spawning locations. This also involves the need of the larvae to drift back to suitable nursery areas while having survivable conditions on the journey. The success criteria for this cycle involves a broad spectrum of biological and environmental factors (Ellertsen et al., 1987; Sundby, 2000). In this exercise we address some of the physical properties, while acknowledging that biological and other environmental factors both are important and even dominating in a complete picture. However, it is beyond the scope of this paper to give a full evaluation, and we focus instead solely on selected physical parameters as temperature, salinity, depth, and bathymetry. From hydrographic properties sampled annually at fixed stations along the Norwegian coast since the middle of the last century we know that the temperatures have been steadily increasing over the last 3–4 decades (Skagseth et al., 2015). Effects of climate change are particularly noticeable in the Barents Sea and in the Arctic Ocean, where surface air and sea surface temperatures have increased at twice the global rate (Hansen et al., 2006; Skagseth et al., 2015; Iz, 2018). However, air and ocean temperatures show also strong multidecadal variability on timescales of 50–80 years. Under a future ocean warming scenario it is likely that the spatial distribution of spawning sites will change and follow a northeastward displacement of the isotherms. The development of regional ocean models enables precise description of the physical environment at local scale (Melsom et al., 2009). These new modeling tools therefore enable detailed analyses of physical characteristics of potential spawning sites for NEA cod that can reveal some of the physical mechanisms behind localization of NEA cod spawning sites and possible shifts of these due to climatic variability.
The general physical characteristics such as hydrography, spawning depths and bathymetry at different spawning sites of NEA cod are presented in a number of papers (Bergstad et al., 1987; Ottersen and Sundby, 2005; Righton et al., 2010; Höffle et al., 2014), as well as the large-scale variability in spawning locations (Sundby and Nakken, 2008; Opdal, 2010; Opdal and Jørgensen, 2015; Langangen et al., 2018). Two main hypotheses for the observed large-scale variability in spawning location have been presented, suggesting multidecadal climate variability (Sundby and Nakken, 2008), or demographic processes as main drivers (Opdal and Jørgensen, 2015). Langangen et al. (2018) did only find support for the climate hypothesis by combining economic and genetic data. Observations from Data Storage Tags (DST) on ambient depth and temperature experienced by individual cod contain information about the prevailing conditions at the spawning sites (Godø and Michalsen, 2000; Michalsen et al., 2014). The information about physical conditions at the spawning sites from these sources are summarized in Table 1. To investigate the implications of future climate change on stock development, model results are needed. Some attempts to model the future distribution of cod have been done using global climate models coupled with physiological characteristics of cod (Dahle et al., 2018). However, global climate models do not have the horizontal resolution that is needed to properly resolve relevant circulation features, hydrographic conditions, and constraints such as bottom topography at local spawning sites in the Norwegian and Barents Seas (Figure 1). Vestfjorden on the inside of Lofoten will for example not be more than one grid cell in a global model with the commonly used resolution of 1 degree. Global climate models must therefore be downscaled to provide the detailed hydrographic descriptions needed to project the potential spawning habitat of NEA cod in the future. To our knowledge, the use of a high resolution ocean model with abilities to describe and project variability in spawning sites of fish has not yet been explored. Hopefully modeled physical characteristics of spawning sites from downscaled models can be used to give future projections of the spatial distribution of cod spawning sites under ocean warming.
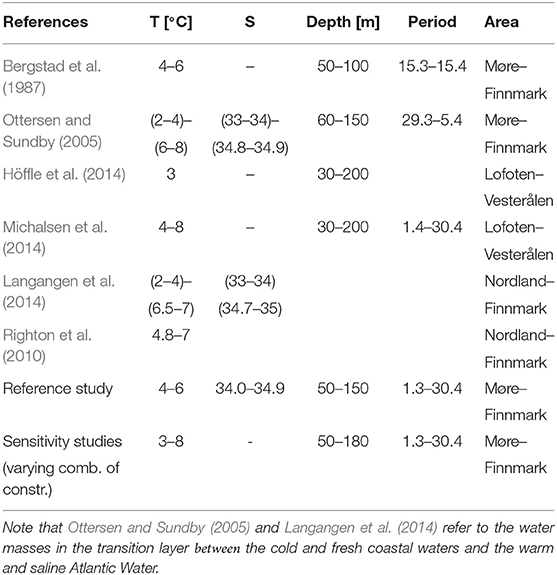
Table 1. Criteria on salinity, temperature, depth and position used for NEA cod spawning in different papers of interest and in this study.
In this study we address the main question: In the future, will there be other areas with physical properties corresponding to potential spawning habitat for NEA cod which may be chosen as new spawning sites? In particular, we will address the following subquestions: (1) How do we describe the current physical characteristics of the spawning site of NEA cod with detailed numerical model output? (2) Is it possible to reproduce variability in observed spawning sites based on a physical habitat criteria from a numerical climate model? (3) What are the future projections of the spatial distribution of NEA cod spawning sites under ocean warming? To answer these questions, we combine existing knowledge about hydrographic conditions at various spawning sites and output from a regional ocean model to see to which areas the preferred water mass conditions have been and will be shifted. The paper describes the spatial distribution of potential spawning habitats for NEA cod based solely on physical factors from a downscaled climate model. The novel approach to use a high-resolution regional model that provides more detail and spatial information of the physical factors for habitat description, gives results that lead to new hypotheses for the projection of spawning sites for NEA cod under a warming ocean climate in the Barents Sea during the next 50 years. We are mainly interested in the optimum spawning habitat criteria where NEA cod prefers to spawn according to probability density functions (Righton et al., 2010), and not necessarily in the extreme spawning habitat limits. Nevertheless, to explore the sensitivity of our choice of spawning habitat criteria, we perform a sensitivity study where we step by step test the response of using different criteria, all based on numbers from the literature as given in Table 1.
2. Methods
In this paper we define water masses along the Norwegian coast from a downscaled ocean model corresponding to the physical conditions temperature, salinity and depth characterizing the physical conditions of the spawning habitat of NEA cod. The geographic distribution of these water masses is then compared to the observed geographic distribution of NEA cod spawning sites to evaluate their ability to predict this distribution. Then the potential future shift of spawning sites under climate change are studied using output from an ocean model projection.
2.1. Spawning Site Characteristics for North East Arctic cod (Gadus morhua)
Physical conditions characteristic of the spawning sites of NEA cod are described and reviewed by Bergstad et al. (1987), Ottersen and Sundby (2005), Righton et al. (2010), Höffle et al. (2014), Langangen et al. (2014), and Michalsen et al. (2014). The values from the literature study are summarized in Table 1. The main spawning sites of NEA cod are observed along the Norwegian coast from Møre to Finnmark, but mainly centered on and along the shelves off Nordland and Troms as can be seen in Figure 1 and Sundby and Nakken (2008). Spawning takes place in near-shore areas in March and April. Most intensive spawning is reported to occur in the transition layer between the cold and fresh coastal waters and the warm and saline Atlantic Water masses, except when this layer is very thin (Eggvin, 1933, 1934). Temperature and spawning depth are a common constraint in all the studies listed in Table 1. Salinity is not, and may be listed in some of them as salinity usually correlates well with temperature and therefore appears to be a varying constraint on the spawning water mass.
Our choice of physical habitat descriptors for high intensive spawning is defined as water masses within a temperature range of 4–6°C, a salinity range of 34.0–34.9, within a depth range of 50–150 m, and limited by a maximum sea floor depth of 180 m. Modeled temperature and salinity are averaged for March and April. The spatial distribution of spawning sites is defined by model cells satisfying the characteristics given above. Volumes of spawning water masses in each horizontal grid point are determined by vertical integration of each of these grid areas. That means that the volumes of every model cube that satisfy the above criteria are summed up vertically at every horizontal grid cell in the model. Thus, based on hydrography and depth constraints applied to the output from a high resolution regional ocean model (section 2.2.1) that is downscaled from a global climate model (section 2.2.2), we can get projections of potential spawning sites 50 years into the future.
2.2. Model Descriptions
2.2.1. Regional Model
The model used for downscaling here is the regional ocean model system, ROMS, described in Shchepetkin and McWilliams (2005). The regional model is initialized from a medium resolution version of the Norwegian Earth System Model (NorESM1-M) (Bentsen et al., 2013), and results from this model are also used at the open boundaries and as atmospheric forcing. A weak relaxation with a time scale of 360 days toward NorESM sea surface salinity is also applied. ROMS is run on a stretched orthogonal curvilinear grid with an average horizontal resolution of 10 km and covers the Arctic and the Atlantic Ocean south to about 20°S (see Figure 2 in Sandø et al., 2014b). There are 40 generalized sigma (terrain following) levels in the vertical, applying the scheme of Song and Haidvogel (1994), with stretching that enhances the vertical resolution toward the bottom and the surface. Lateral motions and diffusive energy losses induced by small-scale processes are related to the gradients of the mean velocities and tracers by eddy viscosity and diffusivity coefficients (Smagorinsky, 1963). For advection, we use the third-order upwind biased scheme proposed by Shchepetkin and McWilliams (2008). ROMS employs split-mode explicit time stepping, and in this study, the baroclinic mode time step is 100 s, while the barotropic mode time step is 10 s.
To evaluate ROMS results directly against observed time series, a hindcast simulation forced with atmospheric forcing from the CORE2 reanalysis (Large and Yeager, 2009) from 1958 to 2008 was performed in a parallel study parallel study (Sandø et al., in preparation). Simulated volume and heat transports in different sections were compared to observation based estimates with respect to mean values and variability. The modeled mean inflows to the Nordic Seas were shown to be close to the observed mean inflows Thereafter, the same model was used to downscale the future RCP4.5 scenario from NorESM1-M for the period 2006–2070.
2.2.2. Choice of Global Climate Model for Downscaling
The Coupled Model Intercomparison Project Phase 5 (CMIP5) offers many global climate models that can be used for downscaling, but it is important to be aware that every model has strengths and weaknesses. Although the latest IPCC report (AR5) (IPCC, 2013) confirms the results from the previous IPCC report (AR4) about projected strong decreases in sea ice extent in the Arctic toward the end of this century, the inter-model spread is considerable. It is therefore important to evaluate different models in the region of interest, before downscaling the model that is closest to the observed values of the most relevant variables, both with respect to mean values and variability. To get an estimate of the uncertainty in the results, it is desirable to downscale an ensemble of models, but time and computational resources often put constraints on this. For this study, where heat content and sea ice extent strongly influence the regional ecosystem, evaluation of the heat transport into the Barents Sea and Arctic Ocean is of particular importance. Sandø et al. (2014a) evaluated three coupled climate models (CNRM-CM5, MRI-CGCM3, and NorESM1-M) against multiple estimates from the literature with respect to poleward heat transport through four gateways to the Arctic, and NorESM1-M transports were found to be closest to the observed mean in both Barents Sea Opening between Svalbard and Norway and in the Fram Strait between Greenland and Svalbard. These gateways are closest to the region of interest in this study, and NorESM1-M is therefore chosen for downscaling in this analysis.
The future climate is strongly dependent on the future emissions of greenhouse gases. Four different representative concentration pathways (RCPs) are used to describe a set of greenhouse gas concentration trajectories adopted by the IPCC for its fifth Assessment Report (AR5) in 2014 (IPCC, 2013). These are RCP2.6, RCP4.5, RCP6, and RCP8.5. Of these, the RCP4.5, in which the emissions peak around 2040, decline, and stabilize at an increased radiative forcing of 4.5 W m−2 relative to preindustrial time, is the one used for downscaling in this study.
3. Results
In this section, we first evaluate the hindcast simulation and its ability to reproduce the observed southerly offset in spawning water masses (Table 1) in cold years and the northerly offset in warm years (Sundby and Nakken, 2008; Langangen et al., 2018). Thereafter we apply the same criteria on the results from the future projection to see how spawning sites may change in the future, given that there is a close link to the hydrographic properties.
3.1. Spawning Sites in the Past and Associated Shifts
The main spawning site has traditionally been in Nordland and Troms, with secondary areas at the coasts of Møre in the south and Finnmark in the north as indicated in Figure 1. During February and March 2004 and 2005, the fishing industry reported large numbers of mature and pre-spawning cod at the fishing grounds along the coast of East Finnmark. This came after an extended period of high temperature, starting in the early 1990s (Sundby and Nakken, 2008). These observed spawning sites are comparable to the simulated sites from the hindcast simulation shown in Figure 2, where the potential spawning sites for cod in the cold 1960s (1965–1970) and the warm 2000s (2003–2008) are shown by colors that indicate the volumes of water masses that correspond to the hydrography and depth criteria listed Table 1 (4<T<6°C, 34.0<S<34.9, 50 m<depth<150 m, sea floor depth <180 m). As indicated in Figures 1, 2 shows how the spawning sites are shifted southwards in cold years and northwards in warm years. In the cold 1960s there are larger areas at Mørebanken and along the coast up to Lofoten islands compared to the warm 2000s, and in the warm 2000s the figure indicates more spawning in Troms and also spawning sites in a narrow belt close to the coast between 20°E and 30°E that are not present in the cold 1960s. These southward and northward shifts in potential spawning sites are in agreement with results in Sundby and Nakken (2008) which were based on cod roe indices. In some regions, especially in Troms, our results show larger volumes of spawning water further from the coast compared to the official spawning map (Figure 1). These offshore spawning sites are to some degree related to the chosen maximum sea floor depth.
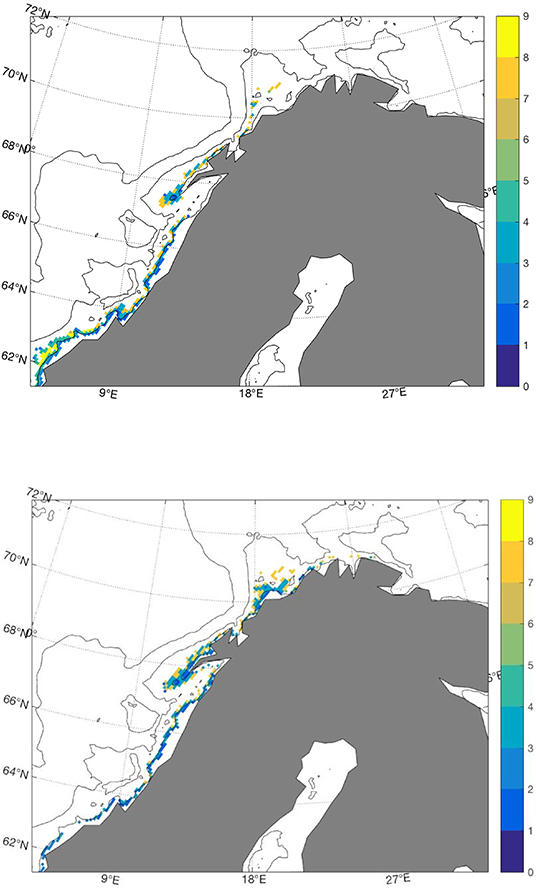
Figure 2. Volumes of water masses (km3) between 50 and 150 m that satisfy 4<T<6°C and 34.0<S<34.9 in the cold 1960s (upper) and warm 2000s (lower).
Time series of temperature from the hindcast simulation at locations close to Bud at Møre and Eggum outside the Lofoten islands are compared to observations in the depth interval from 50 to 150 m in Figure 3. These time series show that the simulated temperatures are close to the observed ones both at Bud and Eggum, with temperatures at Eggum lying about 1°C below those at Bud. The simulated salinities are too high compared to observations, about 0.5 higher at Bud and about 0.75 higher at Eggum. Insufficient impact or rendering of the river runoff is one explanation, and detected inaccurate instrumental measurements is another (Carvajalino-Fernández et al., 2018). Furthermore, the observed time series of salinity in Figure 3 suggest that these salinities were too low several years compared to our criteria, but as these time series are averages from different standard depths which contain values well within our criteria, there are values at selected depths satisfying the criteria most of the time (not shown). On the other hand, the modeled salinity profiles show little variability with depth due to the insufficient representation of coastal water in the upper water column, and the time series is therefore representative for most layers in the chosen depth interval of 50–150 m. Modeled and observed salinities in the southern part of the Barents Sea Opening, the Fugløya-Bjørnøya section, are shown in Figure 3. These salinities are more consistent with each other, at least with respect to mean values and biases. The instruments used here are known to be more exact, and last but not least, the area is farther from coast and less affected by runoff and fresh coastal waters. Based on the information collected in Table 1 and used as criteria for spawning water mass in Figure 2, it seems plausible that Bud was not very well suited for spawning in the early 1990s and in the 2000s, while the area outside the Lofoten islands was well suited the whole period.
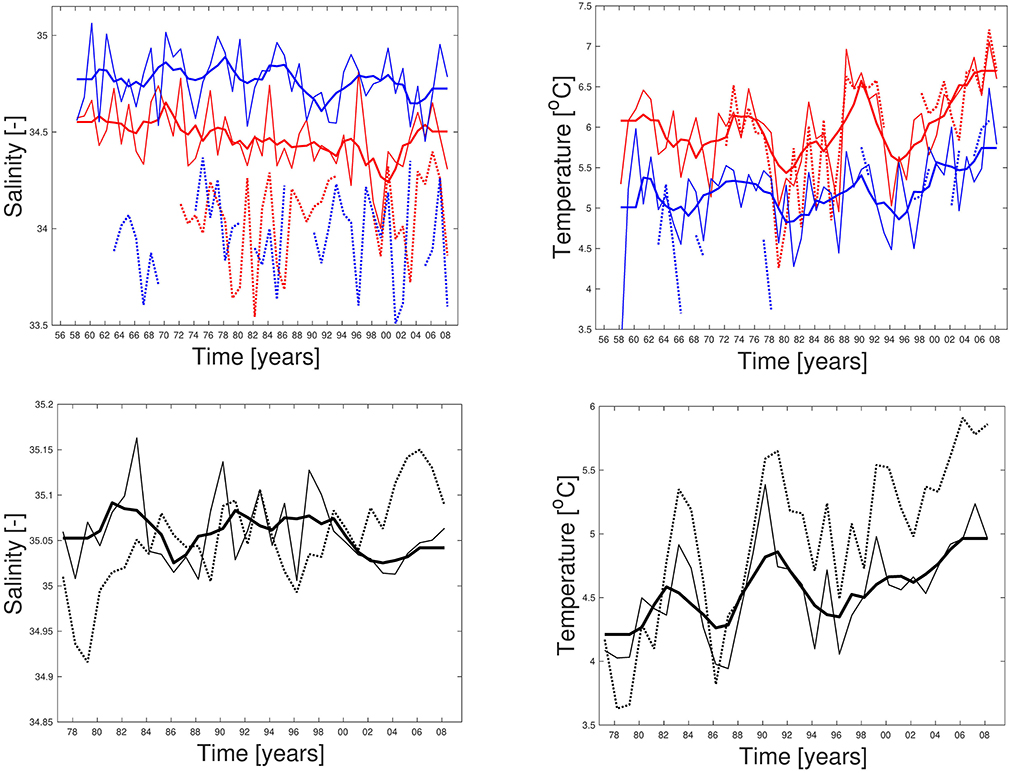
Figure 3. Modeled (lines) and observed (dotted) salinity (left) and temperature (right) time series from area outside Bud and Eggum (1958–2008) (upper), and Fugløya-Bjørnøya in the Barents Sea Opening (1977–2008) (lower). Bold lines are 5-year running model means. Times series from Bud and Eggum are red and blue, respectively. All are averages for March at depths ranging from 50 to 150 m.
The observed shifts in spawning sites, may also be linked to temperature through the shifts of sea ice edge in the Barents Sea in cold and warm periods (Figure 4). Such shifts in the sea ice edge change the area available for predation (Sundby and Nakken, 2008; Drinkwater and Kristiansen, 2018). To find the mean position or center of geographic distribution for the spawning sites along the coast in March and April, we use the masks satisfying the spawning mass criteria for this study given in Table 1. Likewise, we find the mean position for ice free waters available for predation in the Barents Sea in September (Figure 4) by masking out grid cells of non-zero sea ice concentration between 68–82° N and 20–70° E. The distance between the average position of ice free waters in the Barents Sea during summer in cold and warm periods is here calculated to be 319 km. A corresponding shift in the spawning site center of geographic distribution is calculated to be 278 km.
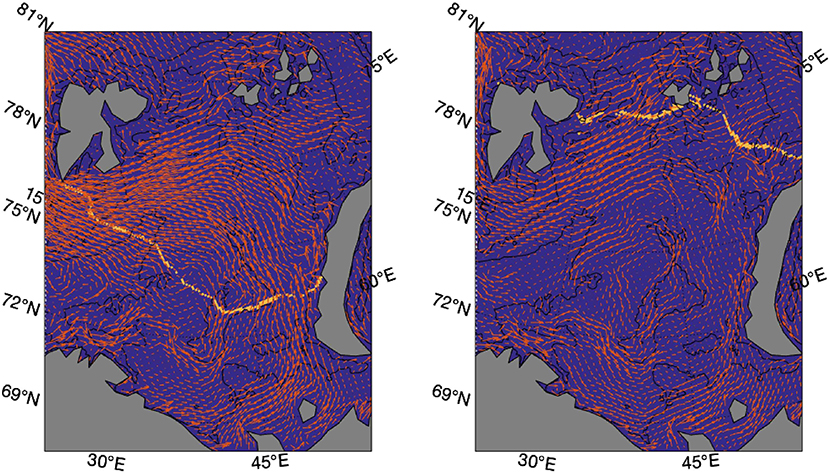
Figure 4. March sea surface currents and September sea ice edge (15% concentration) in the cold 1960s (left) and warm 2000s (right). Note that surface currents and the sea ice edge are extracted from different months to illustrate drifting after spawning in March and maximum feeding area when sea ice extent is at minimum in September, respectively.
3.2. Potential Future Change in Climate and Spawning Sites During 2010–2070
A similar analysis for potential future cod spawning sites is done for the RCP4.5 scenario. Results from the last decade of the downscaled model run, 2060–2069, are compared to the decade representing the present climate, 2010–2019, from the same model run. This future simulation is initialized and run with an atmospheric forcing from a global climate model that has a another natural variability than the hindcast simulation (1958–2008), simply because the hindcast simulation is forced with an observation based atmospheric forcing. The two simulations may therefore have different biases in temperature and salinity. The results from the hindcast simulation and future projection are therefore not directly comparable, and the projection can not be considered as a continuation of the hindcast simulation.
Figure 5 (upper) shows the simulated spawning sites in the first decade, the 2010s. Compared to the warm 2000s in the hindcast run, there are no longer any spawning sites at Møre, and the easternmost limit at the coast of Finnmark is now even further east. Looking at the last decade, the 2060s, (Figure 5, lower) the spawning site around the Lofoten islands has now disappeared, but the area off Finnmark has extended eastwards to the longitude of Murmansk.
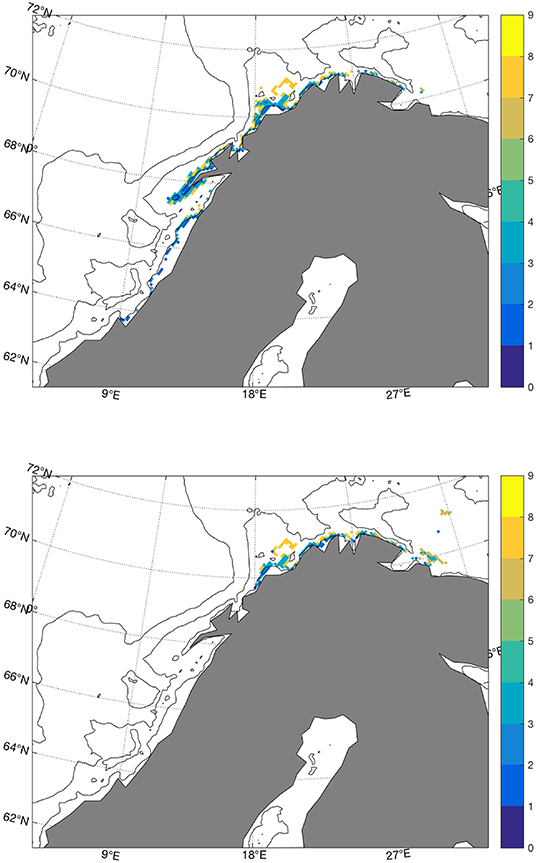
Figure 5. Volumes of water masses (km3) between 50 and 150 m that satisfy 4 <T<6°C and 34.0<S<34.9 in the 2010s (upper) and 2060s (lower).
From the literature study on criteria for spawning water masses summarized in Table 1, we experience that not all studies consider salinity at the spawning site to be important, and also the lower and upper temperature limits vary. Hoegh-Guldberg and Bruno (2010) indicate a lower limit of 3°C, Righton et al. (2010) find that NEA cod experiences and tolerates temperatures during spawning time up to 7°C while Michalsen et al. (2014) observe that cod during spawning time aggregate at temperatures between 4°C and 8°C with an average temperature around 5.5°C, and at depths between 30 and 200 m. To test the consequences for using such criteria, we perform different sensitivity calculations with temperature limits of 3°C and 8°C, without any limitations with respect to salinity, and finally with a combination of these two new criteria. The resulting extent and change of spawning water masses between the 2010s and 2060s for the reference (4<T<6°C, 34.0<S<34.9) and the sensitivity cases can be seen in Figure 6. The figure shows how the altered temperature limits change the spawning sites at Møre and in the Russian sector (Figure 6, lower left), while salinity has minor implications along the Norwegian coast, except for the Lofoten area where omission of this criterion imply less reduction of spawning water masses between the two periods (Figure 6, upper right). A combination of a longer temperature interval and no salinity criterion gives more spawning water masses in the Russian sector and less at Møre toward the 2060s (Figure 6, lower right). The choice of spawning depth range used here is not found to be sensitive (not shown). Time series of salinity and temperature from the projection at Bud and Eggum are presented in Figure 7. These show that the temperatures off Møre are too high compared to the temperature criteria in Table 1 during this period and that also the temperatures outside the Lofoten islands at Eggum become too high after short time. The salinities at these locations are within the range most of the time with some exceptions in the middle and at the end of the integration period, and like the time series for the hindcast study, these time series reveal large interannual to decadal variability.
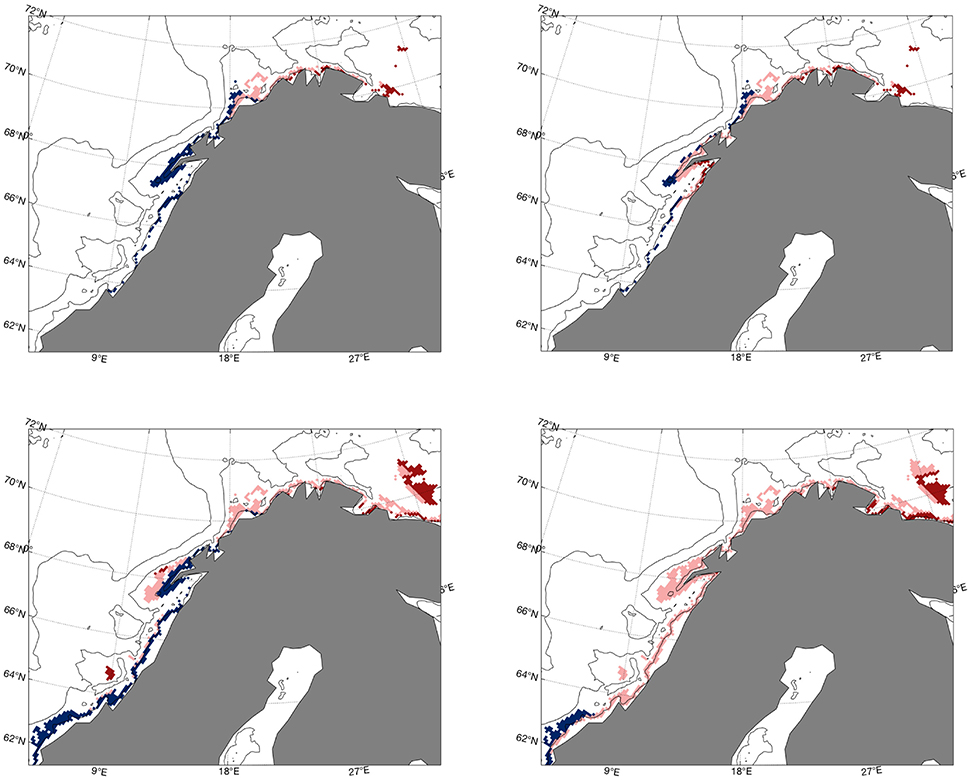
Figure 6. Difference between the 2010s and 2060s (2060s–2010s) in extent of water masses between 50 and 150 m that satisfy 4<T<6°C and 34.0<S<34.9 (reference case, upper left), 4<T<6°C with no salinity criteria (upper right), 3<T<8°C and 34.0<S<34.9 (lower left) and 3<T<8°C with no salinity criteria (lower right) between the 2010s and 2060s. Blue color indicates reduction, red increase, and pink no change with time.
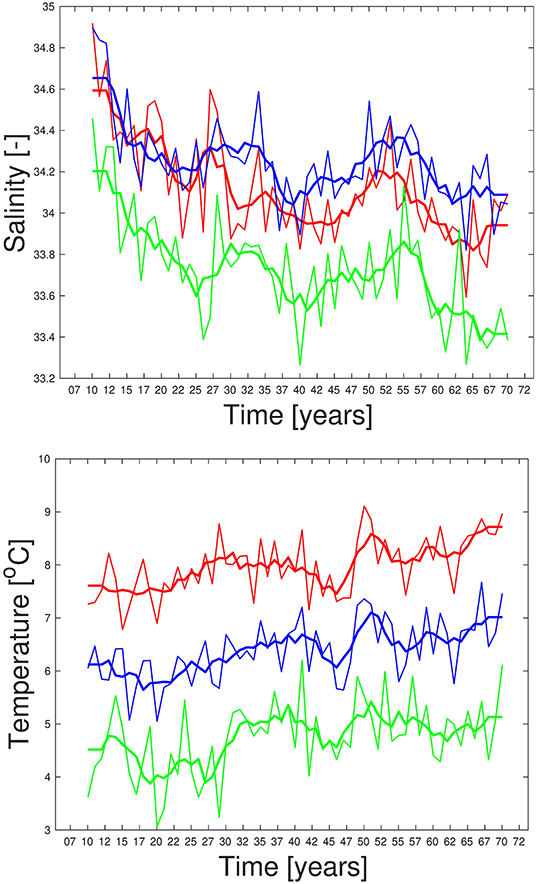
Figure 7. Modeled RCP45 salinity (upper) and temperature (lower) time series from area outside Bud (red), Skrova (green), and Eggum (blue). Bold lines are 5-year running model means. All are averages for March at depths ranging from 50 to 150 m.
4. Discussion
Our approach in this study is to reproduce historical spawning sites and shifts in these based purely on the physical criteria from a literature study summarized in Table 1, and thereafter apply the same method to downscaled projections of the future climate. The methodological limitations to this kind of analysis are that it is based on an exercise where the physical climate is the only explanation for the variability in spawning at the sites in consideration. There are probably both direct and indirect causes for temperature to be important, as well as biological mechanisms. An argument supporting that hydrography is essential for spawning is that the transition layer between the relatively fresh coastal water and the more saline Atlantic Water was used as an indicator for the typical depth where the spawning NEA cod arrived the eastern Lofoten and Vestfjorden (Eggvin, 1933; Ellertsen et al., 1981). The vertical position of this layer was therefore used by the fishermen to find the depth of spawning cod.
4.1. Historical and Present Spawning Sites
The simulated temperatures at the fixed stations at Bud and Eggum reproduce the observed values well, at both interannual and decadal timescales (Figure 3), and likewise for temperatures and salinities in the Fugløya-Bjørnøya section in the Barents Sea Opening. As described in section 3.1, Figure 2 shows how the spawning sites are shifted southwards in cold years and northwards in warm years, in agreement with observations presented in Sundby and Nakken (2008). The same figure also shows yellow spots on the periphery or outside the observed spawning sites in Figure 1, where the bathymetry is relatively deep compared to the depth at the traditional spawning sites. The mismatch in these areas can be associated to the method of calculating the spawning water masses which is dependent on the topography as explained in section 2.1, and the volume will therefore increase by depth as long as the conditions with respect to hydrography and maximum bottom depth are fulfilled. Apart from that, using the criteria specified in section 2.1, we are able to reproduce the latitudinal shifts of spawning sites along the Norwegian coast with shifting climate.
4.2. Future Potential Areas for Spawning
Repeating the analysis with output from the future scenario, the most remarkable results here are the total disappearance of the specific spawning water masses in the Lofoten area as indicated in Figure 5, a region known for its cod fisheries related to spawning migration through centuries. Less surprising are the new potential spawning sites outside Murmansk, based on the current knowledge about the recent Barents Sea warming and reports about large numbers of mature and pre-spawning cod at the fishing grounds along the coast of East Finnmark in the early 2000s (Sundby and Nakken, 2008). Filina and Trostyanskii (2007) also report about spawning individuals in the coastal waters of Murmansk in 1999–2003, when the temperature in the Kola section exceeded 4°C for the first time since the late 1930s (Tereshchenko, 1999). In other words, this can be viewed as an extension of the previous trend. Shifts in the spawning center of geographic distribution following the slow, large scale changes in temperature and position of sea ice edge were well documented by Sundby and Nakken (2008), but a termination of spawning in the southern site at Møre in warm periods was not previously found. This is also in contrast to our simulated results from the cold 1960s and the warm 2000s (Figure 2), where there are indications of reductions and increases of spawning water masses at the respective spawning sites with temperature and salinity anomalies, not a disappearance. Figure 7 shows that modeled temperatures at Bud are outside our defined range throughout the entire projection, and therefore explain the vanished spawning site. From the sensitivity analysis in Figure 6 it can also be concluded that a temperature limit of 8°C will also counteract spawning south of 63° N in the future. That said, the absolute upper temperature limit for Atlantic cod to spawn in the Celtic and North Sea is 9.6°C (Meeren and Ivannikov, 2006; Kjesbu et al., 2010), so based on this, the Atlantic cod stock may still have some extra years left to spawn at Møre before it meets this limit (Figure 7).
Next, what is the cause for the future depletion of spawning waters in the Lofoten area? The time series for temperature at Eggum is outside the range given in Table 1 most of the time (Figure 7), while that for Skrova is within, especially at the end. It is therefore reasonable to test the salinity criteria, which are suggested by only 2 of 6 studies. Omission of the salinity criteria on the water masses gives the same result as the reference case east of North Cape (Figure 6), but for the region outside Lofoten the reductions in spawning sites are less without any salinity criteria, and at Skrova there is even an increase, meaning that the future climate and higher temperatures give more favorable temperatures for spawning there. So therefore, based on the reference case and the sensitivity experiments herein, the only clear conclusion to be drawn is that increased temperatures in the southern Barents Sea will lead to more suitable spawning conditions along the coast in that region, and especially outside Murmansk in the Russian sector. Dahlke et al. (2018) assessed the embryonic ranges of thermal tolerance under different RCP scenarioes and mapped the corresponding spawning habitat suitability by using CMIP5 ensemble median of maximum potential egg survival. For the RCP4.5 scenario they found that the thermally suited spawning habitat was reduced by up to 20% along the Norwegian coast and further east to about 40°E at the Russian coast. It should be noticed that the horizontal resolution of the CMIP5 models are only 1° × 1° and is therefore a limitation to reproduce realistic circulation and hydrographic features at specfic spawning sites along the coast.
4.3. Uncertainties
A crucial uncertainty regarding the results of this study is the use of hydrography and depths as a choice of method for describing spawning sites. In addition to the direct effect of hydrography on spawning sites (Bergstad et al., 1987; Ottersen and Sundby, 2005; Hoegh-Guldberg and Bruno, 2010; Righton et al., 2010; Langangen et al., 2014), indirect effects suggest other mechanisms for changes in spawning sites (Sundby and Nakken, 2008; Opdal and Jørgensen, 2015). As shown in section 3.1, these can be related to the migration distance from the feeding area of high food abundance at the ice edge in the Barents Sea to a suitable spawning site close to the Norwegian coast (Sundby and Nakken, 2008). The distribution of cod catches from bottom trawls shown in Kjesbu et al. (2014) indicates increased catches in the northern and eastern parts of the Barents Sea where sea ice retreats in warm years. So, in warm years when the simulated sea ice edge is further north and east (Figure 4), the increased migration distance may be a limiting factor of how far south cod can reach at constant speed before the spawning season peaks around April 1st. The distance between the average position of ice free waters in the Barents Sea during summer in cold and warm periods is here calculated to be 319 km. This is comparable to the shift of 278 km in the simulated spawning center of geographic distribution, and therefore supports the idea of an indirect temperature effect in terms of sea ice extent as suggested by Sundby and Nakken (2008). Another indirect effect can be faster gonad maturation in warm years (Kjesbu et al., 2010), limiting the distance cod can migrate at constant speed before it is ready to spawn.
The observed temperature, salinity and depth intervals for the transition layer between coastal and Atlantic waters at the spawning sites of NEA cod may also be a proxy of where there is sufficient food available for survival of early life history stages. From observations (Drinkwater, 2011) and modeling studies (Slagstad and Tande, 2007) Calanus finmarchicus is known to be the dominant zooplankton species along the Norwegian Shelf in spring, where they are held by eddies and mean circulation and is important as it constitutes the prey for larval and early juvenile cod (Sundby, 2000).
Another uncertainty by using this kind of method is that we don't take into account adaptation of cod to spawn at higher temperatures than the observed limits of today. If cod or its prey adapt to climate change faster than the period of interest here, then our assumptions will break down. There is no doubt that adaptation has played an important role in developing different stocks of Atlantic cod that now lives and spawn in very different habitats, but this evolution have probably happened over much longer time scales than those considered here (Mieszkowska et al., 2009).
Common to the explanations listed here, is that they are all, directly or indirectly, dependent on temperature variability. So, taking into account that the resulting spawning sites are affected by different factors, involving hydrography, distance of migration from feeding grounds or gonad maturation, we argue that the hydrography, and in particular the temperature, can be used as an indicator for potential changes in the future. Anyway, such sources of uncertainty should be kept in mind when concluding on the effects of future warming on spawning sites.
There are also uncertainties with respect to the simulated future climate. According to Hawkins and Sutton (2009), such uncertainties strongly depend on three parts, namely model errors, internal or natural variability in the climate system, and future scenarios on emissions of greenhouse gases. On interannual to decadal time scales, the natural variability is much bigger than the effects of anthropogenic emissions of greenhouse gases on climate change, but as the contributions from anthropogenic emissions are positive every year, the effects of these emissions are substantial after some decades. Hawkins and Sutton (2009) therefore find that on regional scale, the internal variability and model errors dominate in the first period of about 20 years. After this, the uncertainties due to internal variability are strongly reduced, and toward the end of a century-long projection, uncertainties due to future emissions are totally dominating.
4.4. Possible Impacts of Spawning Site Shifts
A question rising from the analysis done here, is how increased temperature will impact successful spawning and further survival of 0-group cod. The recent warming in the Barents Sea has both led to a shift in spawning sites, and to a change in the spatial distribution of fish communities with a northward expansion of boreal species at a pace reflecting the local climate change (Kjesbu et al., 2014; Fossheim et al., 2015). As for spawning sites, indications about altered distributions of species at different trophic layers in the future can be found based on a combination of changes in water masses as simulated herein and already known effects of climate on ecosystem dynamics as described in e.g., Drinkwater (2011), Johannesen et al. (2012), Kjesbu et al. (2014), and Fossheim et al. (2015). That said, can such effects from present day climate be extrapolated into the future?
Prerequisites for survival of cod larvae is that they are spawned in an upstream water mass where they can drift into a suitable nursery area (Ådlandsvik, 1989), and that there is sufficient food for them as they are drifting (Ellertsen et al., 1987). Lofoten has up to now been such an appropriate place with optimal hydrographic spawning conditions, subsequent drifting by the ocean current into the Barents Sea, and plenty of food on their way in terms of Calanus finmarchicus (Ellertsen et al., 1987). Sundby et al. (2016) define the North Atlantic adjacent to the Polar Circle with its spring bloom system as a critical region due to the seasonal light cycle which sets particular demands on planktivorous species. Planktivorous species such as Calanus finmarchicus deposits lipids during the short spring bloom period and are therefore able to overwinter at great depths during winter when phytoplankton is insufficient. Therefore, if the spawning and drifting areas are invaded by more temperated species from further south that are not able to adapt to such a seasonal life cycle, it might become a problem for the drifting larvae. Furthermore, what will be the fate of the eggs that potentially will be spawn in Russian waters outside Murmansk in the future? Will they drift into an area of sufficient food abundance? Figure 4 indicates that eggs spawn in that area will drift northeastwards west of Novaya Zemlya toward the sea ice edge and remain in the Barents Sea. In a parallel study, (Sandø et al., in preparation), results from an end-to-end ecosystem model, NORWECOM.e2e (Skogen et al., 2018), forced with the same physical output from the RCP4.5 scenario as analyzed in this study, show that areas where sea ice concentration decreases will have an increase in both primary and secondary production (Sandø et al., in preparation). The simulations show that there will be a change to more Atlantic characteristics (T>3°C) in the eastern Barents Sea up to the northern tip of Novaya Zemlya. These results therefore indicate that spawning and drifting, and subsequent survival may be successful in the eastern Barents Sea, but a more comprehensive study needs to be done to conclude on this. Such a combination of physics from a downscaled climate model for a future scenario with chemical and biological model components as in NORWECOM.e2e (Skogen et al., 2018) is an example of how further knowledge about potential climate impacts on the marine ecosystem can be gained and will be one of the main perspectives in our future work.
5. Conclusions
A regional ocean model, ROMS, has been used to describe the physical characteristics of NEA cod spawning sites for the period 1958–2008, and similarly for projections into the future. The physical criteria are collected from a literature study and include hydrographic properties of spawning waters, spawning depth and bottom topography. Based on this method we are able to reproduce a long-term spatial shift of the mean position of the spawning sites, with a southern displacement in cold years (1965–1970) and a northern displacement in warms years (2003–2008). Applying the same method on results from a downscaled future scenario we find that the spawning sites are shifted further northeastwards, and with new locations at the coast close to Murmansk 50 in years. Dependent on whether salinity is important for the spawning habitat or not, future freshening may lead to additional reduction of the spawning habitat in the Lofoten area.
The mechanisms for these shifts can be linked to the temperature change in two ways. Low temperatures have up to now been a limiting factor east of Finnmark in the southern Barents Sea during spawning in March and April. In the future scenario, global warming leads to increased occurrences of waters warmer than 4°C in this region, and spawning will probably take place more often and to a greater extent than today. Dependent on the maximum temperature for spawning, temperature may be a limiting factor for spawning habitats at Møre. It has also been shown that the observed and simulated long-term shift in spawning habitats along the Norwegian coast can be linked to temperature through the latitudinal shift of the sea ice edge and the corresponding shift in predation habitats in the Barents Sea in September, which in that way control the maximum southward migration distance. Therefore, while acknowledging that the location of spawning sites can be indirectly related to biophysical processes as migration distance and appropriate larval prey, our results indicate that direct physical limitations may work as criteria in future projections of spawning sites in a moderate emission scenario and at time scales as considered here.
Data Availability Statement
The datasets generated for this study are available on request to the corresponding author.
Author Contributions
AS has contributed with evaluation of model and model analyses, literature studies, making figures, and essential writing of paper. GJ has contributed to the model analyses, literature studies, writing and structuring of the paper. AA has contributed with constructive discussions and feedback on the paper writing. JS has contributed to the model analyses, constructive discussions, and feedback on the paper writing. AR has contributed with constructive discussions and feedback on the paper writing.
Funding
This work was supported by the Norwegian Research Council Projects ArcChange (Grant: 257630) and Stockshift (Grant: 257614), by the Trond Mohn Foundation (Project number: BFS2018TMT01), and by the UNINETT Sigma2 AS through a grant of computing time.
Conflict of Interest
The authors declare that the research was conducted in the absence of any commercial or financial relationships that could be construed as a potential conflict of interest.
Acknowledgments
We would like to thank Per Arne Horneland for contributions to the map on observed spawning sites.
References
Ådlandsvik, B. (1989). Wind-driven variations in the Atlantic inflow to the Barents Sea. ICES Council Meeting C18:18.
Årthun, M., Bogstad, B., Daewel, U., Keenlyside, N. S., Sandø, A. B., Schrum, C., et al. (2018). Climate based multi-year predictions of the Barents Sea cod stock. PLoS ONE 13:e0206319. doi: 10.1371/journal.pone.0206319
Bentsen, M., Bethke, I., Debernard, J. B., Iversen, T., Kirkevåg, A., Seland, Ø., et al. (2013). The Norwegian Earth System Model, NorESM1-M Part 1: description and basic evaluation of the physical climate. Geosci. Model Dev. 6, 687–720. doi: 10.5194/gmd-6-687-2013
Bergstad, O., Jørgensen, T., and Dragesund, O. (1987). Life history and ecology of the gadoid resources of the Barents sea. Fish. Res. 5, 119–161. doi: 10.1016/0165-7836(87)90037-3
Carvajalino-Fernández, M., Asplin, L., and Hovland, T. (2018). CTD Inter-comparison Experiment in Norwegian Coastal Waters – Cruise HB2018932. Internal Report, Institute of Marine Research, Bergen.
Ciannelli, L., Bailey, K., and Olsen, E. M. (2014). Evolutionary and ecological constraints of fish spawning habitats. ICES J. Mar. Sci. 72, 285–296. doi: 10.1093/icesjms/fsu145
Dahle, G., Johansen, T., Westgaard, J.-I., Aglen, A., and Glover, K. A. (2018). Genetic management of mixed-stock fisheries “real-time”: the case of the largest remaining cod fishery operating in the Atlantic in 2007–2017. Fish. Res. 205, 77–85. doi: 10.1016/j.fishres.2018.04.006
Dahlke, F. T., Butzin, M., Nahrgang, J., Puvanendran, V., Mortensen, A., Pörtner, H.-O., et al. (2018). Northern cod species face spawning habitat losses if global warming exceeds 1.5°C. Sci. Adv. 4. doi: 10.1126/sciadv.aas8821
Drinkwater, K. F. (2011). The influence of climate variability and change on the ecosystems of the Barents Sea and adjacent waters: review and synthesis of recent studies from the NESSAS Project. Prog. Oceanog. 90, 47–61. doi: 10.1016/j.pocean.2011.02.006
Drinkwater, K. F., and Kristiansen, T. (2018). A synthesis of the ecosystem responses to the late 20th century cold period in the northern North Atlantic. ICES J. Mar. Sci. 75, 2325–2341. doi: 10.1093/icesjms/fsy077
Dulvy, N. K., Rogers, S. I., Jennings, S., Stelzenmller, V., Dye, S. R., and Skjoldal, H. R. (2008). Climate change and deepening of the North Sea fish assemblage: a biotic indicator of warming seas. J. Appl. Ecol. 45, 1029–1039. doi: 10.1111/j.1365-2664.2008.01488.x
Eggvin, J. (1933). De oceanografiske Forhold I Vestfjorden Og Deres Sammenheng Med Lofotfisket 1933. Årsberetn. norg. fisk. 1933, Bergen.
Eggvin, J. (1934). Litt om de Oceanografiske Forhold Under Lofotfisket 1934. Årsberetn. norg. fisk. 1934, Bergen.
Ellertsen, B., Fossum, P., Solemdal, P., Sundby, S., and Tilseth, S. (1987). The Effect of Biological and Physical Factors on the Survival of Arcto-Norwegian Cod and the Influence on Recruitement Variability. Bergen: Institute of Marine Research, 101–126.
Ellertsen, B., Solemdal, P., Strømme, T., Sundby, S., Tilseth, S., Westgard, T., et al. (1981). Spawning period, transport and dispersal of eggs from the spawning area of arcto-norwegian cod (Gadus morhua L.). Rapports et Proce's-Verbaux des re Unions/conseil per- Manent International Pour l'Exploration de la Mer 178, 260–267.
Eriksen, E., Bogstad, B., and Nakken, O. (2011). Ecological significance of 0-group fish in the Barents Sea ecosystem. Polar Biol. 34, 647–657. doi: 10.1007/s00300-010-0920-y
Fall, J., Ciannelli, L., Skaret, G., and Johannesen, E. (2018). Seasonal dynamics of spatial distributions and overlap between Northeast Arctic cod (Gadus morhua) and capelin (Mallotus villosus) in the Barents Sea. PLoS ONE 13:e0205921. doi: 10.1371/journal.pone.0205921
Filina, E. A., and Trostyanskii, N. N. (2007). On the spawning of the northern arctic cod Gadus morhua (Gadidae) in coastal waters of Murman. J. Ichthyol. 47, 106-109. doi: 10.1134/S0032945207010122
Fossheim, M., Primicerio, R., Johannesen, E., Ingvaldsen, R. B., Aschan, M. M., and Dolgov, A. V. (2015). Recent warming leads to a rapid borealization of fish communities in the Arctic. Nat. Clim. Change 5, 673-677. doi: 10.1038/nclimate2647
Godø, O. R., and Michalsen, K. (2000). Migratory behaviour of north-east Arctic cod, studied by use of data storage tags. Fish. Res. 48, 127-140. doi: 10.1016/S0165-7836(00)00177-6
Hansen, J., Sato, M., Ruedy, R., Lo, K., Lea, D. W., and Medina-Elizade, M. (2006). Global temperature change. Proc. Natl. Acad. Sci. U.S.A. 103, 14288-14293. doi: 10.1073/pnas.0606291103
Hawkins, E., and Sutton, R. (2009). The potential to narrow uncertainty in regional climate predictions. Amer. Meteorl. Soc. 90, 1095–1108. doi: 10.1175/2009BAMS2607.1
Hoegh-Guldberg, O., and Bruno, J. F. (2010). The impact of climate change on the world's marine ecosystems. Science 328, 1523–1528. doi: 10.1126/science.1189930
Höffle, H., Solemdal, P., Korsbrekke, K., Johannessen, M., Bakkeplass, K., and Kjesbu, O. S. (2014). Variability of northeast arctic cod (Gadus morhua) distribution on the main spawning grounds in relation to biophysical factors. ICES J. Mar. Sci. 71, 1317–1331. doi: 10.1093/icesjms/fsu126
Ingvaldsen, R., Bogstad, B., Dolgov, A., Ellingsen, K., Gjøsæter, H., Gradinger, R., et al. (2015). Sources of uncertainties in cod distribution models. Nat. Clim. Change 5, 788–789. doi: 10.1038/nclimate2761
IPCC (2013). Climate Change 2013: The Physical Science Basis. Contribution of Working Group I to the Fifth Assessment Report of the Intergovernmental Panel on Climate Change, Cambridge University Press. Cambridge; New York, NY: Cambridge University Press.
Iz, H. B. (2018). Is the global sea surface temperature rise accelerating? Geodesy Geodyn. 9, 432–438. doi: 10.1016/j.geog.2018.04.002
Johannesen, E., Ingvaldsen, R. B., Bogstad, B., Dalpadado, P., Eriksen, E., Gjøsæter, H., et al. (2012). Changes in Barents Sea ecosystem state, 1970-2009: climate fluctuations, human impact, and trophic interactions. ICES J. Mar. Sci. 69, 1–10. doi: 10.1093/icesjms/fss046
Kjesbu, O. S., Bogstad, B., Devine, J. A., Gjøsæter, H., Howell, D., Ingvaldsen, R. B., et al. (2014). Synergies between climate and management for Atlantic cod fisheries at high latitudes. Proc. Natl. Acad. Sci. U.S.A. 111, 1–6. doi: 10.1073/pnas.1316342111
Kjesbu, O. S., Righton, D., Krüger-Johnsen, M., Thorsen, A., Michalsen, K., Fonn, M., et al. (2010). Thermal dynamics of ovarian maturation in atlantic cod (Gadus morhua). Can. J. Fish. Aquat. Sci. 67, 605–625. doi: 10.1139/F10-011
Langangen, Ø., Färber, L., Stige, L. C., Diekert, F. K., Barth, J. M. I., Matschiner, M., et al. (2018). Ticket to spawn: combining economic and genetic data to evaluate the effect of climate and demographic structure on spawning distribution in atlantic cod. Glob. Change Biol. 25, 134–143. doi: 10.1111/gcb.14474
Langangen, Ø., Stige, L. C., Yaragina, N. A., Ottersen, G., Vikebø, F. B., and Stenseth, N. C. (2014). Spatial variations in mortality in pelagic early life stages of a marine fish (Gadus morhua). Prog. Oceanogr. 127, 96–107. doi: 10.1016/j.pocean.2014.06.003
Large, W. G., and Yeager, S. G. (2009). The global climatology of an interannually varying air–sea flux data set. Clim. Dyn. 33, 341-364. doi: 10.1007/s00382-008-0441-3
Levitus, S., Antonov, J. I., Boyer, T. P., Locarnini, R. A., Garcia, H. E., and Mishonov, A. V. (2009). Global ocean heat content 1955-2008 in light of recently revealed instrumentation problems. Geophys. Res. Lett. 36. doi: 10.1029/2008GL037155
Loots, C., Vaz, S., Planque, B., and Koubbi, P. (2010). What controls the spatial distribution of the North Sea plaice spawning population? Confronting ecological hypotheses through a model selection framework. ICES J. Mar. Sci. 67, 244–257. doi: 10.1093/icesjms/fsp238
Loots, C., Vaz, S., Planque, B., and Koubbi, P. (2011). Understanding what controls the spawning distribution of North Sea whiting (Merlangius merlangus) using a multi-model approach: spatial distribution of whiting population. Fish. Oceanogr. 20, 18–31. doi: 10.1111/j.1365-2419.2010.00564.x
Meeren, T. V. D., and Ivannikov, V. P. (2006). Seasonal shift in spawning of atlantic cod (Gadus morhua L.) by photoperiod manipulation: EGG quality in relation to temperature and intensive larval rearing. Aquacult. Res. 37, 898–913. doi: 10.1111/j.1365-2109.2006.01510.x
Melsom, A., Lien, V. S., and Budgell, W. P. (2009). Using the Regional Ocean Modeling System (ROMS) to improve the ocean circulation from a GCM 20th century simulation. Ocean Dyn. 59, 969–981. doi: 10.1007/s10236-009-0222-5
Michalsen, K., Johansen, T., Subbey, S., and Beck, A. (2014). Linking tagging technology and molecular genetics to gain insight in the spatial dynamics of two stocks of cod in Northeast Atlantic waters. ICES J. Mar. Sci. 71, 1417–1432. doi: 10.1093/icesjms/fsu083
Mieszkowska, N., Genner, M., Hawkins, S., and Sims, D. (2009). Chapter 3 effects of climate change and commercial fishing on atlantic cod Gadus morhua. Adv. Mar. Biol. 56, 213–273. doi: 10.1016/S0065-2881(09)56003-8
Opdal, A. F. (2010). Fisheries change spawning ground distribution of northeast Arctic cod. Biol. Lett. 6, 261–264. doi: 10.1098/rsbl.2009.0789
Opdal, A. F., and Jørgensen, C. (2015). Long-term change in a behavioural trait: truncated spawning distribution and demography in Northeast Arctic cod. Glob. Change Biol. 21, 1521–1530. doi: 10.1111/gcb.12773
Opdal, A. F., Vikebø, F. B., and Fiksen, Ø. (2008). Relationships between spawning ground identity, latitude and early life thermal exposure in northeast arctic cod. J. Northw. Atl. Fish. Sci. 41, 13–22. doi: 10.2960/J.v41.m621
Ottersen, G., and Sundby, S. (2005). “Life history of arcto-norwegian cod,” in Spawning and Life History Information for North Atlantic Cod Stocks, Number 274 in ICES Cooperative Research Report, eds K. Brandner, W. G. on Cod, and Climate Change (Internat Council for the Exploration of the Sea) (Copenhagen) 11–18.
Perry, A. L. (2005). Climate change and distribution shifts in marine fishes. Science 308, 1912–1915. doi: 10.1126/science.1111322
Planque, B., Loots, C., Petitgas, P., LINDSTRøM, U., and Vaz, S. (2011). Understanding what controls the spatial distribution of fish populations using a multi-model approach: spatial distribution of fish populations. Fish. Oceanogr. 20, 1–17. doi: 10.1111/j.1365-2419.2010.00546.x
Righton, D., Andersen, K., Neat, F., Thorsteinsson, V., Steingrund, P., Svedäng, H., et al. (2010). Thermal niche of Atlantic cod Gadus morhua: limits, tolerance and optima. Mar. Ecol. Prog. Ser. 420, 1–13. doi: 10.3354/meps08889
Sandø, A. B., Gao, Y., and Langehaug, H. (2014a). Relation between ocean heat transports, sea ice processes and Arctic Sea ice variability in NorESM1-M simulations. J. Geoph. Res. 119, 2095–2108. doi: 10.1002/2013JC00943
Sandø, A. B., Melsom, A., and Budgell, W. P. (2014b). Downscaling IPCC control run and future scenario with focus on the Barents Sea. Ocean Dyn. 64, 927–949. doi: 10.1007/s10236-014-0731-8
Shchepetkin, A. F., and McWilliams, J. C. (2005). The regional oceanic modeling system (ROMS): a split-explicit, free-surface, topography-following-coordinate oceanic model. Ocean Model. 9, 347–404. doi: 10.1016/j.ocemod.2004.08.002
Shchepetkin, A. F., and McWilliams, J. C. (2008). Quasi-monotone advection schemes based on explicit locally adaptive dissipation. Mon. Wea. Rev. 126, 1541–1580.
Skagseth, Ø., Slotte, A., Stenevik, E. K., and Nash, R. D. M. (2015). Characteristics of the norwegian coastal current during years with high recruitment of norwegian spring spawning herring (Clupea harengus L.). PLoS ONE 10:e0144117. doi: 10.1371/journal.pone.0144117
Skogen, M. D., Hjøllo, S. S., Sandø, A. B., and Tjiputra, J. (2018). Future ecosystem changes in the Northeast Atlantic: a comparison between a global and a regional model system. ICES J. Mar. Sci. 75, 2355-2369. doi: 10.1093/icesjms/fsy088
Slagstad, D., and Tande, K. S. (2007). Structure and resilience of overwintering habitats of Calanus finmarchicusin the Eastern Norwegian Sea. Deep Sea Res. II 54, 2702-2715. doi: 10.1016/j.dsr2.2007.08.024
Smagorinsky, J. (1963). General circulation experiments with the primitive equations. Mon. Wea. Rev. 91, 99–164.
Song, Y., and Haidvogel, D. (1994). A semi-implicit ocean circulation model using a generalized topography-following coordinate system. J. Comput. Phys. 115, 228–244. doi: 10.1006/jcph.1994.1189
Stenevik, E. K., and Sundby, S. (2007). Impacts of climate change on commercial fish stocks in Norwegian waters. Mar. Policy 31, 19–31. doi: 10.1016/j.marpol.2006.05.001
Sundby, S. (2000). Recruitment of Atlantic cod stocks in relation to temperature and advection of copepod populations. Sarsia 85, 277–298. doi: 10.1080/00364827.2000.10414580
Sundby, S., Drinkwater, K. F., and Kjesbu, O. S. (2016). The North Atlantic spring-bloom system—where the changing climate meets the winter dark. Front. Mar. Sci. 3:28. doi: 10.3389/fmars.2016.00028
Keywords: Northeast Arctic cod, spawning site, shift, climate change, downscaling
Citation: Sandø AB, Johansen GO, Aglen A, Stiansen JE and Renner AHH (2020) Climate Change and New Potential Spawning Sites for Northeast Arctic cod. Front. Mar. Sci. 7:28. doi: 10.3389/fmars.2020.00028
Received: 29 March 2019; Accepted: 16 January 2020;
Published: 11 February 2020.
Edited by:
Michael J. Fogarty, National Marine Fisheries Service (NOAA), United StatesReviewed by:
Keith Brander, Technical University of Denmark, DenmarkJoanne Morgan, Department of Fisheries and Oceans, Canada
Copyright © 2020 Sandø, Johansen, Aglen, Stiansen and Renner. This is an open-access article distributed under the terms of the Creative Commons Attribution License (CC BY). The use, distribution or reproduction in other forums is permitted, provided the original author(s) and the copyright owner(s) are credited and that the original publication in this journal is cited, in accordance with accepted academic practice. No use, distribution or reproduction is permitted which does not comply with these terms.
*Correspondence: Anne Britt Sandø, YW5uZS5icml0dC5zYW5kb0BoaS5ubw==