 Christopher R. German1*
 Joseph A. Resing2,3
 Guangyu Xu1†
 Isobel A. Yeo4†
 Sharon L. Walker3
 Colin W. Devey4
 James W. Moffett5Gregory A. Cutter6
 Olivier Hyvernaud7
 Dominique Reymond7
- 1Geology & Geophysics, Woods Hole Oceanographic Institution, Woods Hole, MA, United States
- 2Joint Institute for the Study of the Atmosphere and Ocean, University of Washington, Seattle, WA, United States
- 3NOAA Pacific Marine Environmental Laboratory, Seattle, WA, United States
- 4GEOMAR - Helmholtz Centre for Ocean Research Kiel, Kiel, Germany
- 5Biological Sciences & Earth Sciences, University of Southern California, Los Angeles, CA, United States
- 6Ocean, Earth & Atmospheric Sciences, Old Dominion University, Norfolk, VA, United States
- 7CEA/DIF/DASE, Laboratoire de Géophysique, Papeete, Tahiti, French Polynesia
Along mid-ocean ridges, submarine venting has been found at all spreading rates and in every ocean basin. By contrast, intraplate hydrothermal activity has only been reported from five locations, worldwide. Here we extend the time series at one of those sites, Teahitia Seamount, which was first shown to be hydrothermally active in 1983 but had not been revisited since 1999. Previously, submersible investigations had led to the discovery of low-temperature (≤30°C) venting associated with the summit of Teahitia Seamount at ≤1500 m. In December 2013 we returned to the same site at the culmination of the US GEOTRACES Eastern South Tropical Pacific (GP16) transect and found evidence for ongoing venting in the form of a non-buoyant hydrothermal plume at a depth of 1400 m. Multi-beam mapping revealed the same composite volcano morphology described previously for Teahitia including four prominent cones. The plume overlying the summit showed distinct in situ optical backscatter and redox anomalies, coupled with high concentrations of total dissolvable Fe (≤186 nmol/L) and Mn (≤33 nmol/L) that are all diagnostic of venting at the underlying seafloor. Continuous seismic records from 1986-present reveal a ∼15 year period of quiescence at Teahitia, following the seismic crisis that first stimulated its submersible-led investigation. Since 2007, however, the frequency of seismicity at Teahitia, coupled with the low magnitude of those events, are suggestive of magmatic reactivation. Separately, distinct seismicity at the adjacent Rocard seamount has also been attributed to submarine extrusive volcanism in 2011 and in 2013. Theoretical modeling of the hydrothermal plume signals detected suggest a minimum heat flux of 10 MW at the summit of Teahitia. Those model simulations can only be sourced from an area of low-temperature venting such as that originally reported from Teahitia if the temperature of the fluids exiting the seabed has increased significantly, from ≤30°C to ∼70°C. These model seafloor temperatures and our direct plume observations are both consistent with reports from Loihi Seamount, Hawaii, ∼10 year following an episode of seafloor volcanism. We hypothesize that the Society Islands hotspot may be undergoing a similar episode of both magmatic and hydrothermal reactivation.
Introduction
More than 40 years after the first discovery of seafloor hydrothermal activity, systematic exploration along the global mid-ocean ridge crest has established that submarine venting can occur in every ocean basin and along ridges of every spreading rate (Beaulieu et al., 2013). While the rate of discovery of submarine hydrothermal systems along tectonic plate boundaries has accelerated over the past 25 years, however (Baker et al., 1995; Baker and German, 2004; Beaulieu et al., 2015), exploration for intraplate hydrothermal activity across the vast interior of Earth’s ocean basins has stagnated. Only five such submarine vent systems have ever been reported to the InterRidge vents data base, four of which are located in the central Pacific Ocean (Figure 1). Further, only one of these vent-sites represents a new discovery since the start of the current millenium – the Vailulu’u Seamount, Samoa, where venting was only discovered in 2005 (Staudigel et al., 2006). With the recent recognition that even deep-sea hydrothermal sources of Fe can provide a significant impact on global-scale ocean biogeochemical cycles, however (Resing et al., 2015) there is now a renewed interest in investigating the role that shallower-sourced (including intra-plate) volcanism and associated hydrothermal activity could also play in stimulating upper ocean productivity.
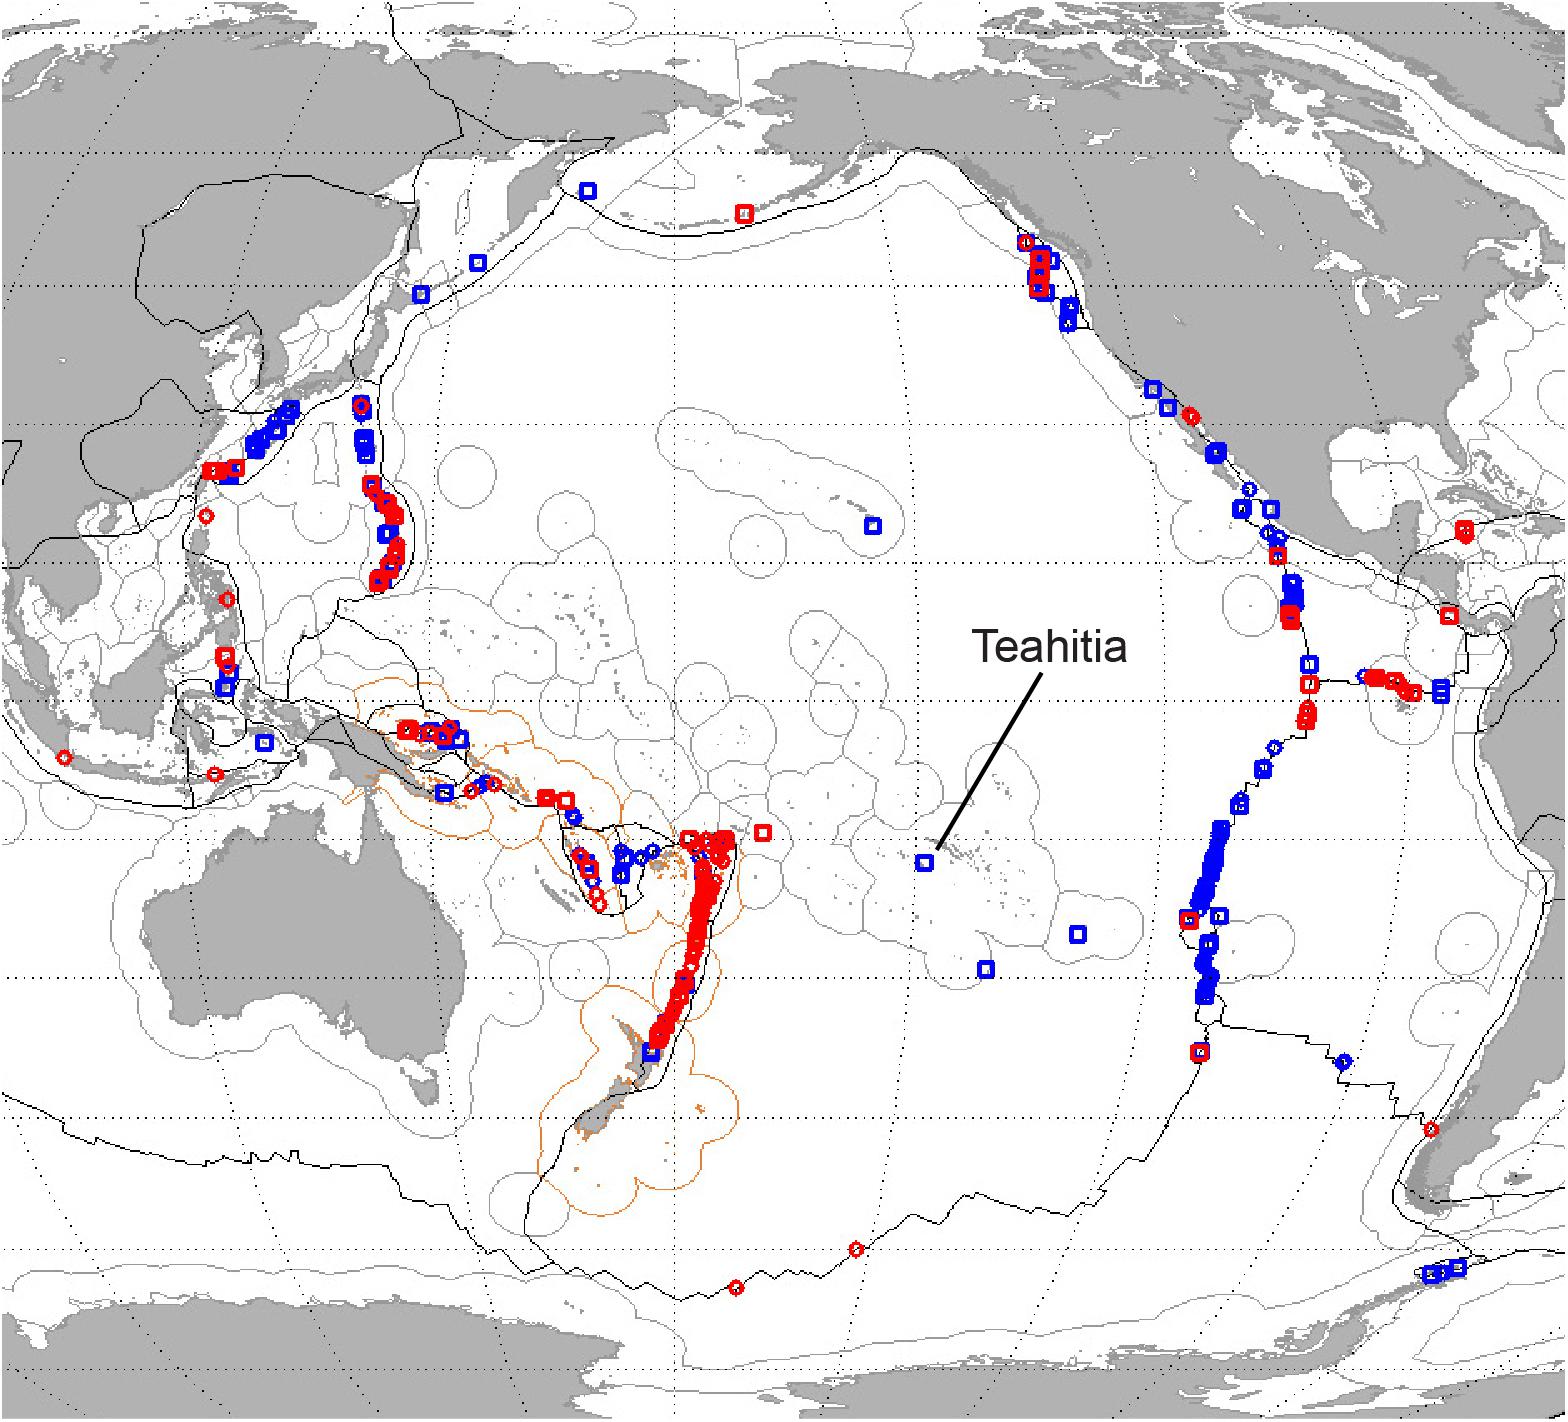
Figure 1. Plot of all known locations of submarine hydrothermal venting in the Circum-Pacific as reported to the InterRidge Vents Data Base (Beaulieu et al., 2013). Red symbols denote sites located since 2000, while blue symbols denote sites already known at the turn of the millennium. The location of the Teahitia site is indicated, close to 17°30′S, 148°50′W.
The Society Islands hotspot (Figure 2) extends for approximately 100 km, east, from the (now inactive) island of Tahiti to the volcanically active island of Mehetia which rises to ∼450 m above sealevel (Cheminée et al., 1989). Teahitia (“Standing Fire” in Polynesian) represents the most westerly active seamount within this chain, and rises from ∼3300 m at its base to ≤1500 m at its summit. Together Mehetia and Teahitia share a history of intense recorded seismicity. In March 1981, a seismic episode centered to the SE of Mehetia was followed by a series of further swarms of activity, starting in 1982, that were centered at and around Teahitia (Talandier and Okal, 1984). Over a 4 year period (1981–1985), approximately 32,000 separate earthquakes (ML > 1.0) were detected with the vast majority occurring at Teahitia, including a ∼2 week swarm located at its summit in July 1983. Analysis of that seismicity suggested the presence of initially deep magmatic activity at both locales that culminated in seafloor eruptive volcanism at Teahitia (Talandier and Okal, 1984, 1987).
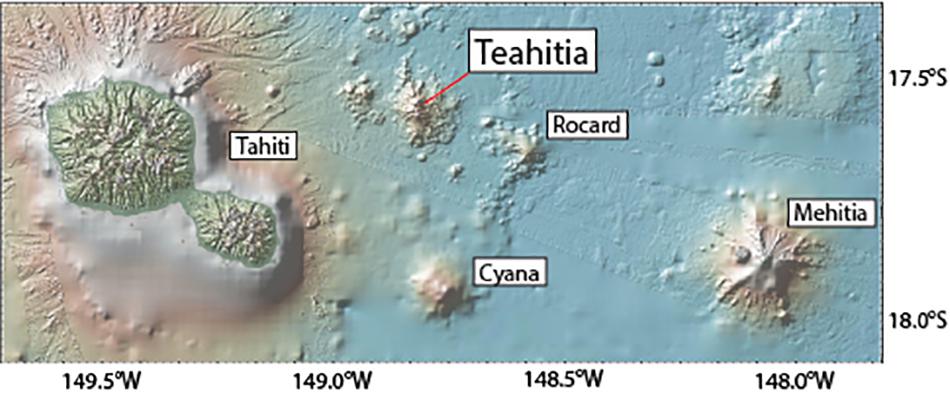
Figure 2. Bathymetric map showing the position of Teahitia Seamount in the context of the currently active portion of the Society Islands hotspot trace which extends for ∼100 km from Tahiti to Mehitia (Cheminée et al., 1989).
Following detection of the seismicity and inferred volcanism at Teahitia, a single Cyana submersible dive in 1983 confirmed the presence of low-temperature (∼30°C) hydrothermal venting close to the summit of the seamount (Cheminée et al., 1989). SeaBeam mapping subsequently revealed Teahitia to be a composite volcano comprising four distinct cones and this informed a more extensive series of Cyana dives in Austral Summer 1988–1989 (Binard et al., 1992). Those dives revealed shimmering fluids exiting from small Fe oxyhydroxide chimneys and from orifices in the seafloor close to the summits of two of Teahitia’s four cones (TH1, TH2) while no activity was observed at the adjacent summits (TH3, TH4). Vent-fluids from TH1 sampled during that expedition exhibited fluid temperatures of ∼30°C, pH values that fell in the range 5.3–5.6, high concentrations of Si (0.8–0.9 mmol/kg), Fe (170–190 μmol/kg) and Mn (6–13 μmol/kg) but no detectable dissolved H2S (Michard et al., 1993). Repeat submersible dives with the Nautile a decade later (Hékinian, 1999) confirmed that venting was on-going at TH1 (Tmax ∼30°C) but that activity had waned (Tmax ≤ 16°C) at the adjacent TH2 summit. No subsequent studies of hydrothermal activity at this site were conducted in the ensuing ∼15 years.
Materials and Methods
Fieldwork for this project was conducted aboard RV Thomas G Thompson cruise TN303 at the culmination of the US GEOTRACES East Pacific Zonal Transect (Moffett and German, 2018). Multibeam mapping of the summit of Teahitia Seamount was conducted using the EM302 multibeam sonar mounted aboard the RV Thompson. Survey lines were occupied in a NW/SE orientation to accommodate prevailing wind directions and the entire seamount was mapped in a series of overlapping ∼9 km surveys, offset from one another by 2 km and surveyed at 7.5 kts.
Seismic data for the study area are collected continuously by the Polynesian Seismic Network/Réseau Sismique, Polynésie (RSP). Data are monitored continuously at the Laboratoire de Géophysique in Papeete, Tahiti, where the seismic energy of each event is calculated using the standard methods described by Gutenberg and Richter (1954). Earthquake magnitude (ML) coefficients are assigned according to the approach established by J. Talandier and colleagues, as described in Talandier and Kuster (1976), Okal et al. (1980) and Talandier and Okal (1984).
Water column studies at Teahitia were conducted using a CTD-rosette system furnished by the Scripps Institution of Oceanography’s Ocean Data Facility. The system comprised a Sea-Bird SBE9 + conductivity temperature depth (CTD) instrument mounted on a rosette frame equipped with a 12-position carousel holding 30L General Oceanics Niskin sampling bottles. In addition to conventional in situ sensors (dissolved oxygen, fluorometer, transmissometer), two additional sensors were employed, specifically, for the hydrothermal plume studies conducted on this cruise: a Seapoint STM11 turbidity meter and a NOAA-PMEL Oxidation-Reduction Potential (ORP) sensor.
Upon arrival at Teahitia, the CTD rosette was lowered directly over the summit of the TH1 cone as the ship’s position was maintained in dynamic positioning mode (Figure 3). In situ sensor data, monitored on board ship throughout the cast, were used to inform the twelve discrete depths at which water column samples were collected during the upcast. Upon recovery aboard ship, samples were drawn, unfiltered into acid-washed 100 mL low density polyethylene (LDPE) bottles and acidified to pH ∼1.7 with 12N ultra-pure hydrochloric acid. Total dissolvable Fe and Mn concentrations (TDFe and TDMn, respectively, hereafter) were determined in the laboratory in Seattle, post cruise, using Flow-Injection Analysis. A detailed description of the methods used across the entire US GEOTRACES EPZT cruise is provided in Resing et al. (2015).
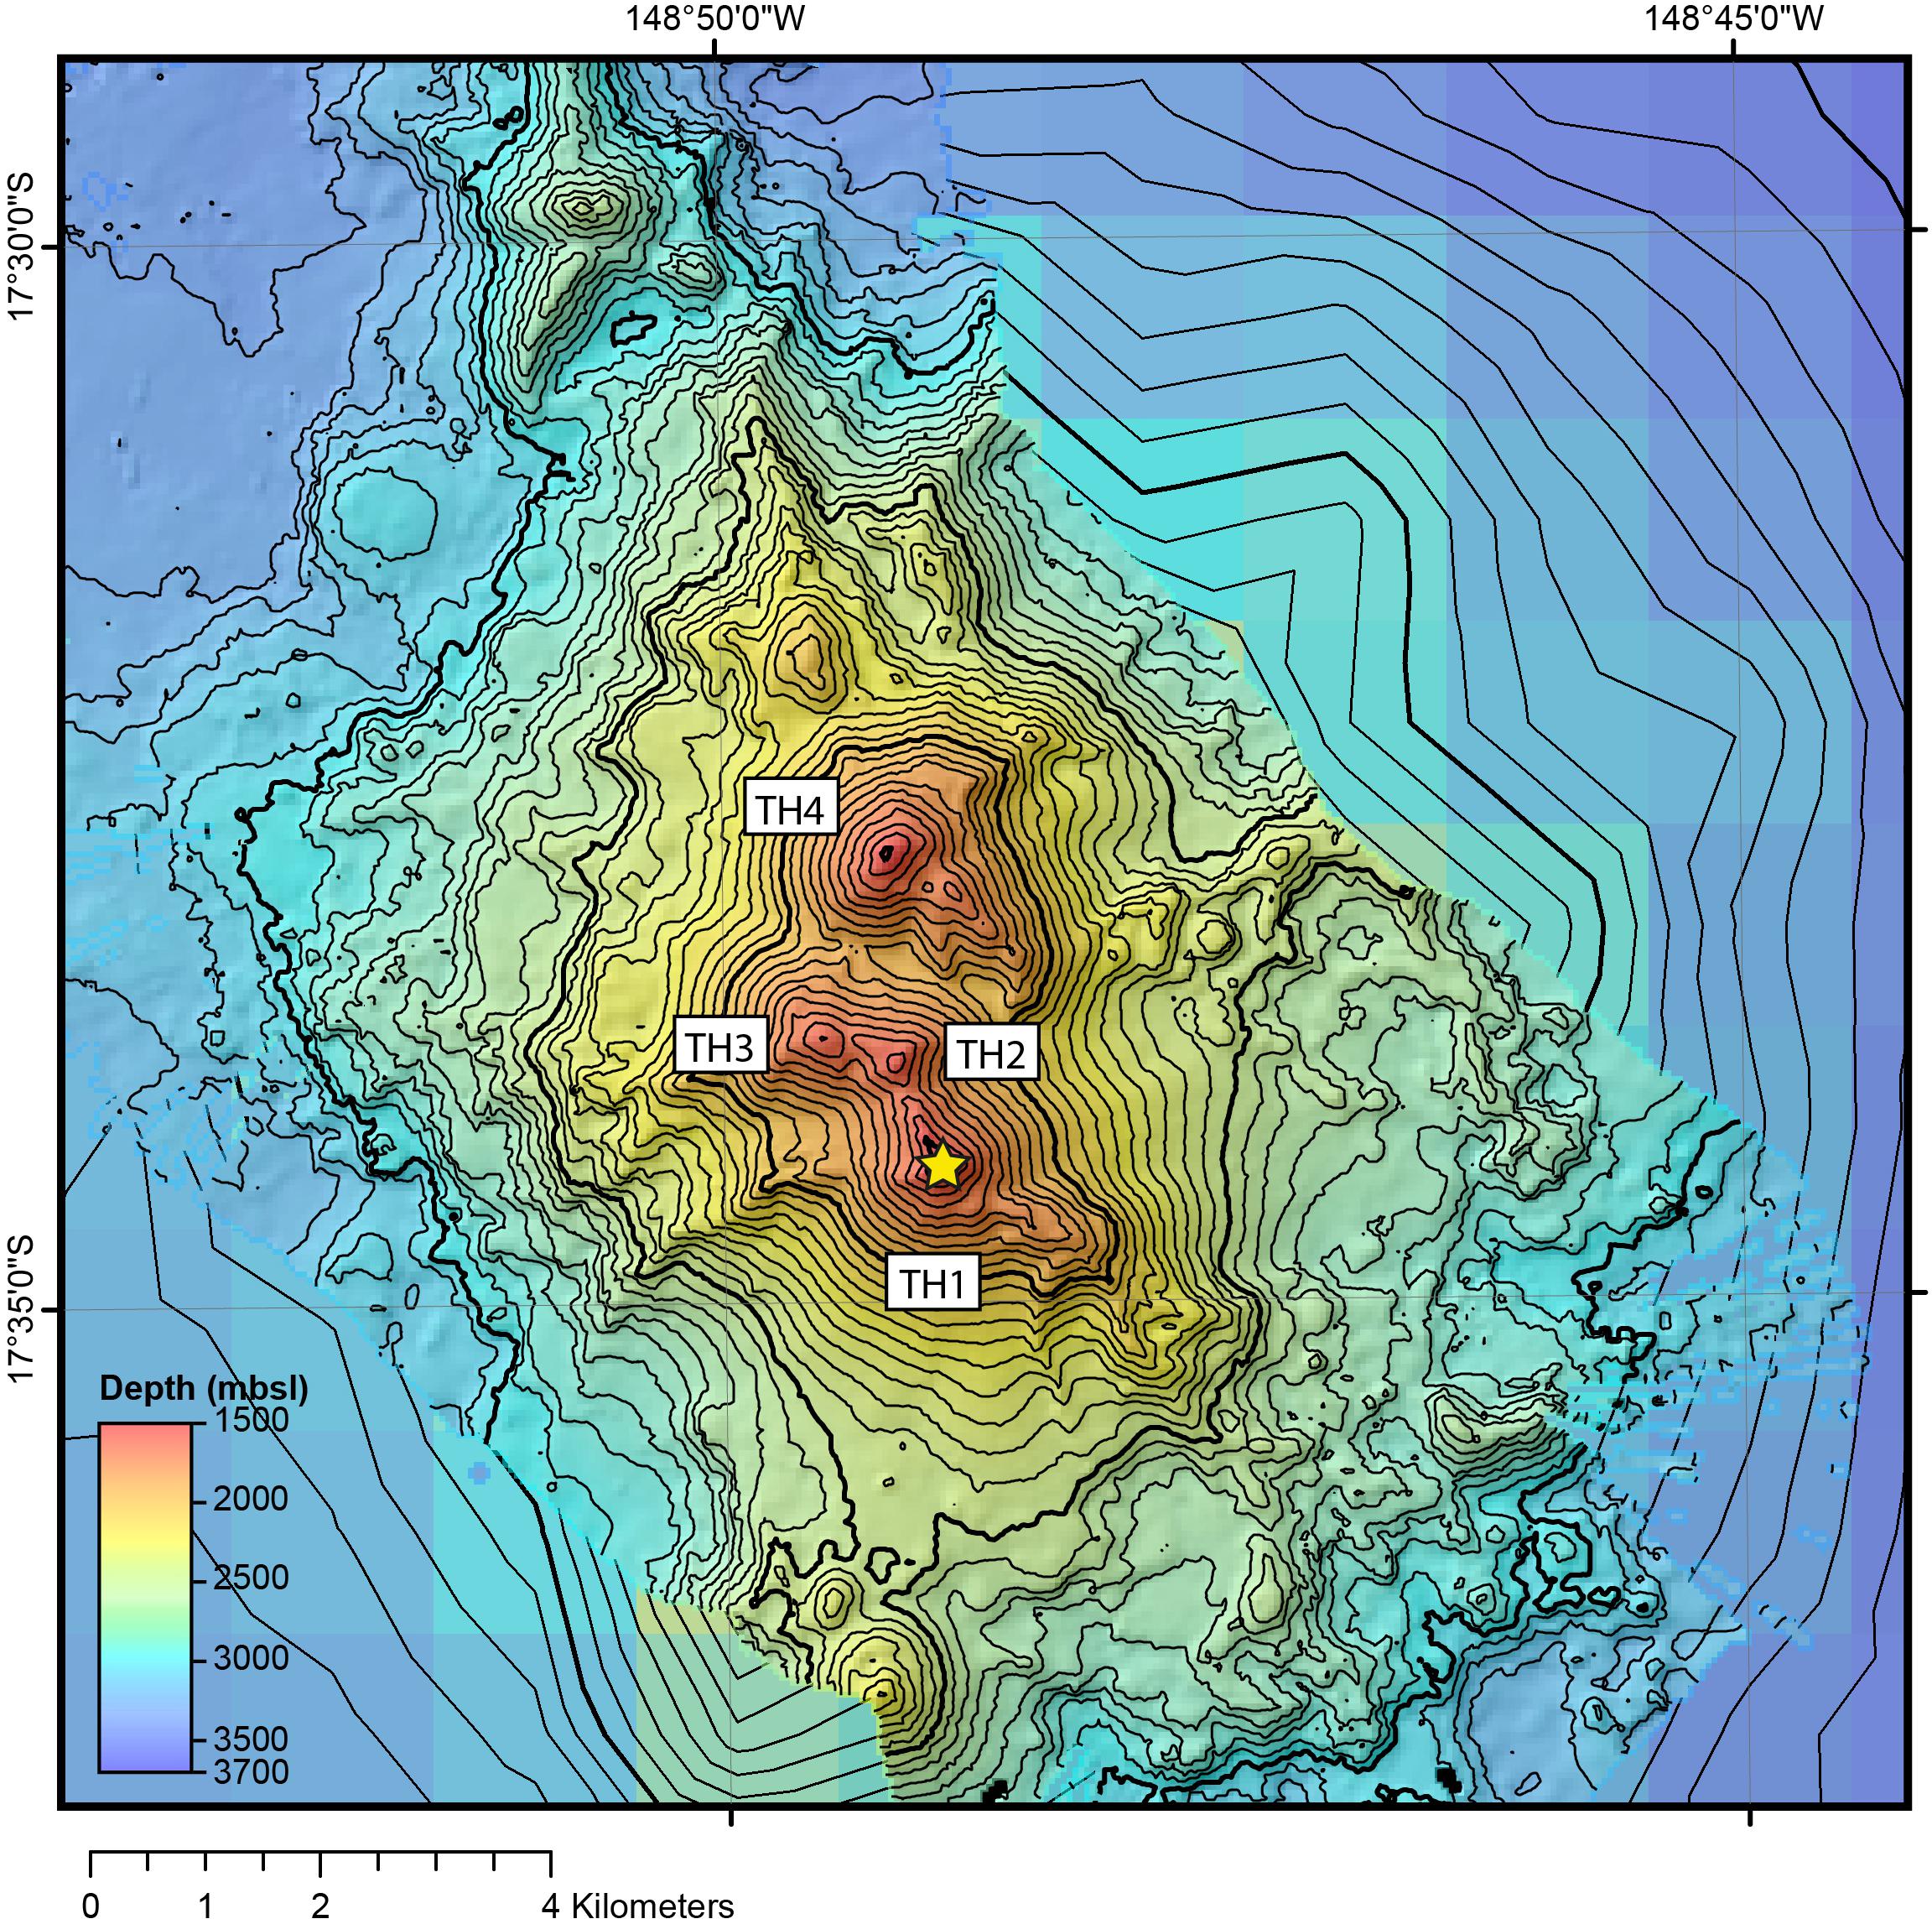
Figure 3. Multibeam bathymetric plot of Teahitia Seamount as mapped during RV Thomas G. Thompson cruise TGT303 in December 2013. TH1-TH4 represent the four principle cones of this composite volcano. Yellow star shows the location of US GEOTRACES CTD Station GP16- 37 occupied directly above the TH1 cone at 17°34.4′S, 148°49.0′W using the ship’s dynamic positioning system.
Results
The multibeam bathymetry for Teahitia Seamount (Figure 3) reveals near identical morphology (within the resolution of the earlier data set) as that from the only prior multibeam survey of the seamount (Cheminée et al., 1989). Profiles of temperature, salinity, dissolved oxygen concentrations and light transmission throughout the entire water column are shown in Figure 4. All four traces reveal monotonous trends throughout the lower half of the water column, below 800 m water depth, with the notable exception of the transmissometer data which show a distinct particle-rich (low light transmission) anomaly at ∼1400 m depth, i.e., ∼100 m shallower than the summit of Teahitia seamount. When examined in closer detail this deep portion of the water column also shows clear evidence of hydrothermal plume activity in the profiles for the two dedicated hydrothermal in situ sensors as well as in the profiles for TDFe and TDMn concentrations (Figure 5). The SeaPoint Turbidity (STM) sensor, like the transmissometer, shows clear evidence for a lens of particle-rich water centered at ∼1400 m (Figure 5A) together with a secondary plume maximum at ∼1450 m that is also apparent in the transmissometer profile (Figure 4B). Optically clear water is observed both immediately above (≤1350 m) and immediately below (≥1475 m) these plume depths. The profile for the NOAA-PMEL oxidation-reduction probe (ORP) also shows a distinct response across the top of the hydrothermal plume layer with a steep drop in voltage across the same depth range as the uppermost horizon of the STM-defined plume (Figure 5A). Despite the non-instantaneous nature of this sensor’s response, there are clear changes in gradient in the ORP profile below 1400 m, as well, and the sign of the gradient reverses below ∼1450 m, roughly coincident with the depth of the lower STM particle maximum. Profiles of TDFe and TDMn concentrations in water samples collected during the upcast of the same CTD-rosette deployment are shown in Figure 5B; the corresponding analytical data are listed in Table 1. Maximum TDFe and TDMn concentrations occur at 1400 m, coincident with the maximum in situ STM anomaly and the depth at which the ORP sensor profile shows the steepest negative gradient. The sharp increases and decreases in TDMn concentrations, immediately above and below 1400 m, are particularly reminiscent of the STM profile, as is the presence of lower (but still anomalously high) TDMn concentrations beneath the plume maximum, extending down to 1460 m water depth. Background TDMn concentrations were observed at all depths shallower than 1375 m and deeper than 1475 m, coincident with the narrow (∼100 m thick) STM-defined non-buoyant hydrothermal plume. Similar trends are observed in the TDFe profile with the exception that the maximum plume concentrations are observed across a broader depth range of 1390–1425 m and deep concentrations below 1475 m remained significantly higher (6–15 nM) than above-plume background concentrations (≤1 nM), perhaps due to settling of particulate Fe oxyhydroxide material from the overlying non-buoyant plume.
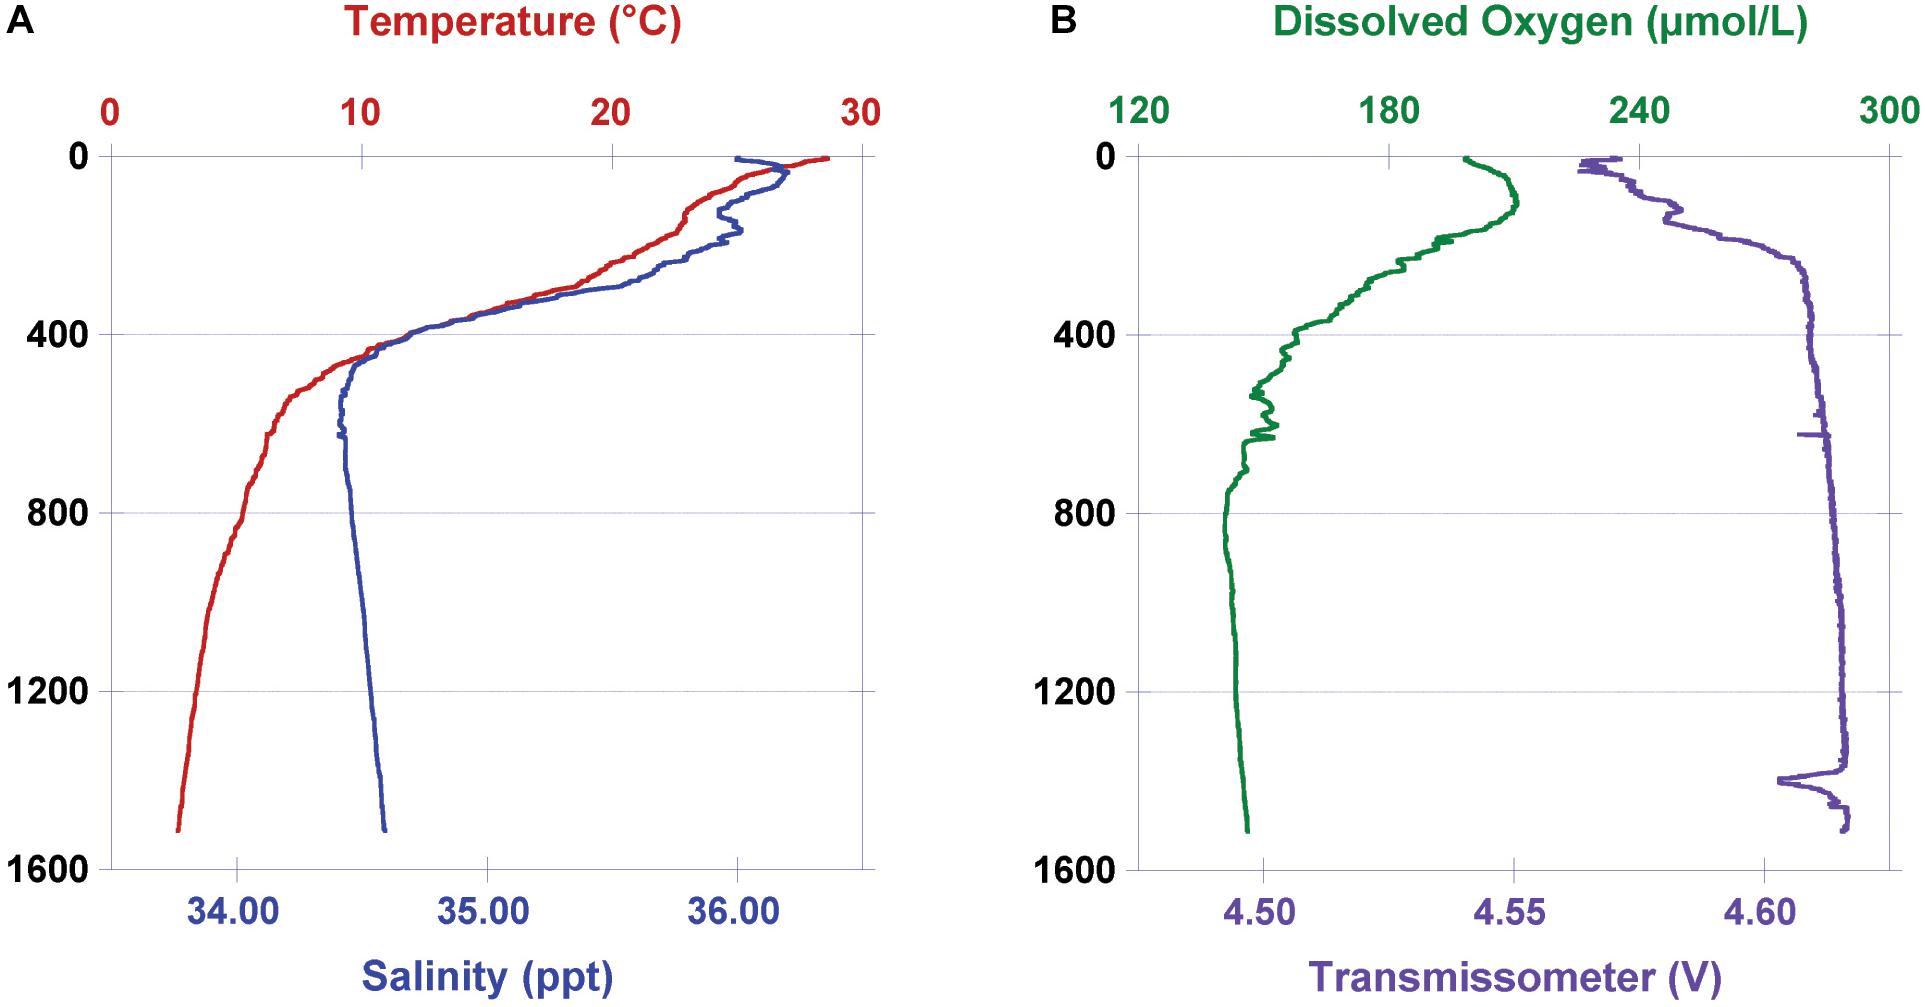
Figure 4. Vertical profiles for (A) Temperature and Salinity and (B) Dissolved Oxygen and Light Transmission above the TH1 summit of Teahitia Seamount from US GEOTRACES CTD Station GP16-37.
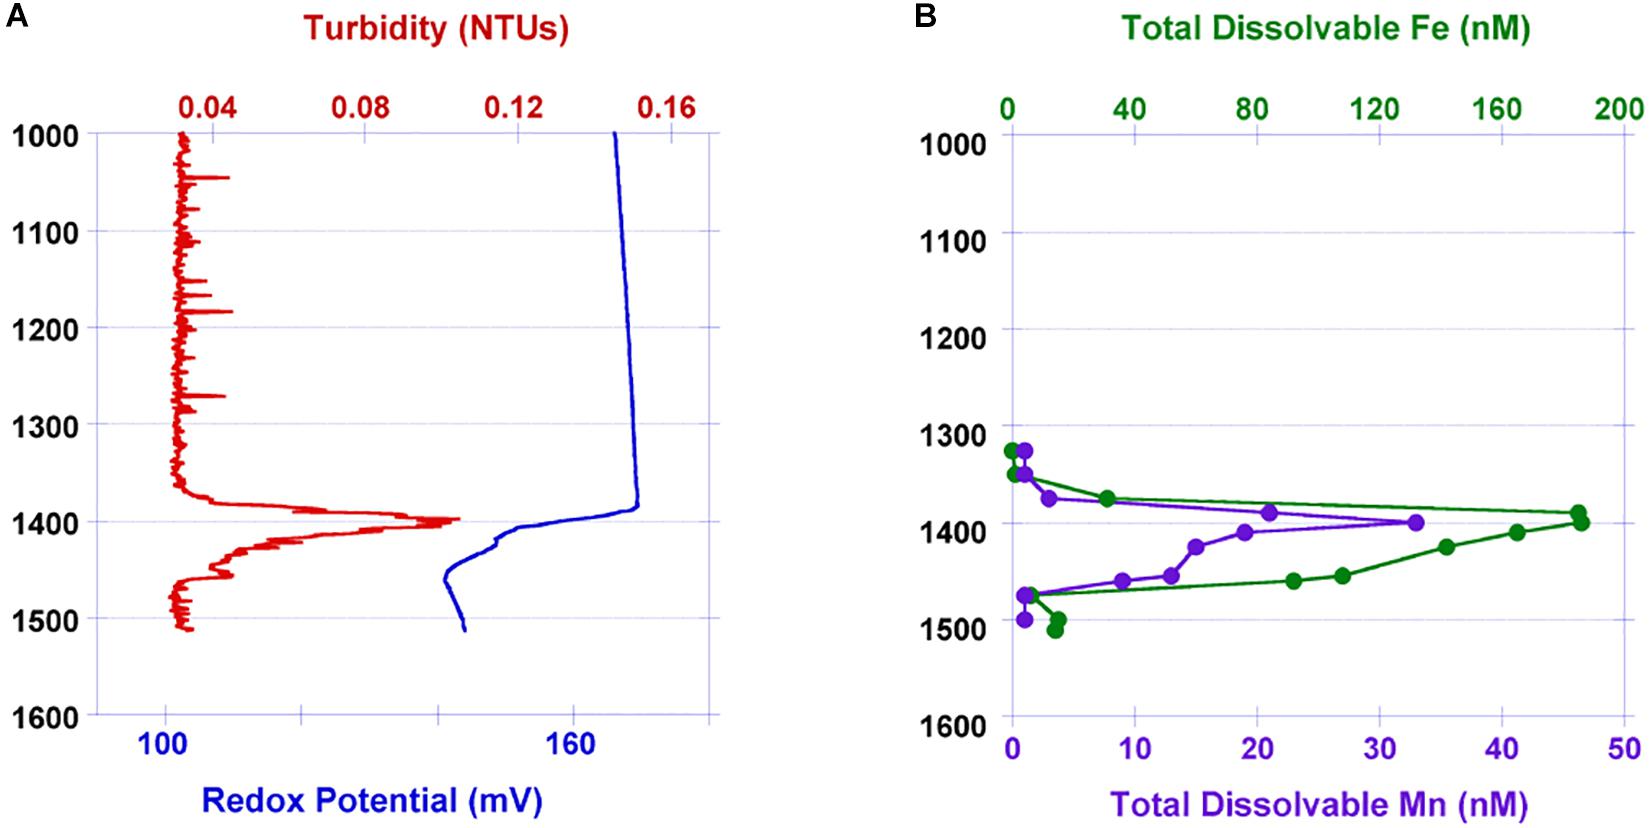
Figure 5. Vertical profiles for (A) Turbidity (NTUs; Seapoint Turbidity Meter) and Redox Potential (mV; NOAA-PMEL Oxidation Reduction Probe) and (B) Total Dissolvable Fe and Total Dissolvable Mn concentrations from the deep portion (>1000 m) of US GEOTRACES CTD Station GP16-37.
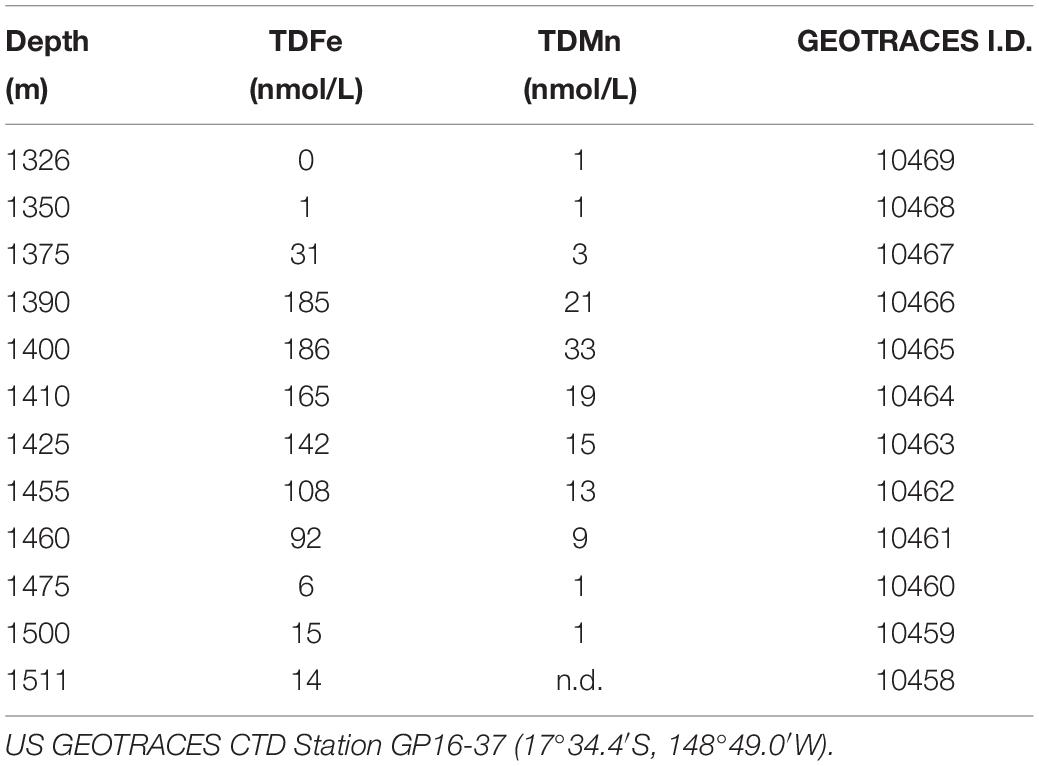
Table 1. Total Dissolvable Fe and Mn concentrations at Teahitia Seamount.
Discussion
Hydrothermal Plume Signals Over Teahitia Seamount
Historically, InterRidge led exploration along the global mid-ocean ridge crest has assumed that particle-rich lenses of water detected from CTD profiling activities were indicative of a source of high temperature “black smoker” hydrothermal venting on the adjacent and underlying seafloor (see, e.g., Baker et al., 1995; Baker and German, 2004; Beaulieu et al., 2013). Traditionally, this interpretation has been further reinforced whenever suspended particulate anomalies of the kind detected here, using in situ optical sensors (Figures 4B, 5A), have been found to be coincident with both in situ redox anomalies (Figure 5A) and measurable concentrations of geochemical tracers (e.g., Fe, Mn, CH4, ∂3Hexs) that are known to be present in extremely high concentrations in seafloor hydrothermal vent fluids but otherwise present in only minute concentrations in background seawater elsewhere in the ocean (German and Seyfried, 2014). From that perspective, a simple explanation of the plume data presented here, in isolation, might appear to be that a “black smoker” source of high temperature hydrothermal venting was active at the underlying seafloor. Recognizing that Teahitia is part of a rare family of isolated hot-spot hosted intraplate volcanic systems, however, such an interpretation is problematic. First, the depth of venting at this location should be too shallow to preclude phase separation occurring at temperatures significantly lower than the ∼350°C temperatures typical of “black smoker” hydrothermal vents: eruption of such high-temperature fluids should be physically impossible (German and Seyfried, 2014). Second, the only forms of submarine venting reported previously from the summit of Teahitia, in the 1980s and again in 1999, were relatively low temperature (15–30°C) venting from small Fe-oxide rich chimneys, similar to those reported contemporaneously during first discoveries of venting at Loihi Seamount, off Hawaii (≤30°C (Karl et al., 1988). At Loihi seamount, the highest vent temperatures ever recorded were ≤200°C, immediately following an episode of volcanism that led to the formation of the present-day summit collapse pits (Davis and Clague, 1998) but vent temperatures at those sites have subsequently relaxed back to near pre-eruption temperatures (60–30°C) over the ensuing decades (Glazer and Rouxel, 2009; German et al., 2018).
The most complete published CTD data from directly above the currently active vent-fields at Loihi Seamount (Bennett et al., 2011) show similar features to those reported here (Figure 5): in situ optical and redox sensor anomalies are accompanied by increases in metal concentrations in a sub-horizontal plume, ∼100 m above the seafloor, that reach maximum concentrations of 465 nM TDFe and 23 nM TDMn. Those results were collected approximately 10 years after the formation of the Pele’s Pit in which modern venting is hosted, at a time when the source vent-sites at the seafloor exhibited maximum vent-fluid temperatures of 50–60°C (Glazer and Rouxel, 2009). In earlier work at Loihi, Sakai et al. (1987) had analyzed unfiltered water samples from a profile above Loihi Seamount and reported maximum plume concentrations of 200–250 nM Fe and 15–20 nM Mn at ∼1100 m depth. We note that those analyses date from 1985, prior to the formation of the collapse pits that host current hydrothermal venting. Concentrations of Fe and Mn from near-contemporaneous vent fluids, collected from the (since destroyed) Pele’s Vents (30°C, 975 m depth) contained 1010 μM Fe and 21 μM Mn (Karl et al., 1988). Those values are approximately 5 times higher in Fe, and double the concentration in Mn than the similar-temperature fluids sampled at Teahitia in 1989 (Michard et al., 1993). A contemporaneous hydrothermal plume study at Teahtia reported maximum TDFe and TDMn concentrations of 68 nM and 19 nM, respectively, at the TH1 summit (Stüben et al., 1992) both of which are significantly lower (particularly for Fe) than the concentrations that we report here (Table 1 and Figure 5B). Higher concentrations were reported from a station closer to TH4 (125 nM TDFe, 7 nM TDMn) but in both cases, what is important to note is that those signals were reported from plume depths of 1580 m (TH1) and 1540 m (TH4). Significantly, these depths are not only 140–180 m deeper than the plume data reported here (Figure 5) but also ∼100 m deeper than the source vent-fluids that were sampled on the same cruise (Michard et al., 1993). Thus, those data cannot readily be considered as a part of a time-series relevant to the plume data reported here, nor, indeed, as a product of the TH1 vent fluids. The origins of those early plume data remain enigmatic. Perhaps the most simple interpretation is that they represented output rising up from sources on the flanks of Teahitia, located deeper than the summit, at the time of that study. Because our sole CTD cast in 2013 targeted the TH1 site, our package could only descend as far as the seabed at that site and, hence, we do not have any additional information regarding what else might still be present in the water column below ∼1510 m depth.
Geophysical Evidence for Volcano-Tectonic Perturbations at Teahitia Seamount
At the time of their discovery, it was immediately noted that the venting discovered at the summit of Teahitia Seamount was very similar to that which had just been discovered at Loihi (Karl et al., 1988; Michard et al., 1993). Approximately a decade later, however, Loihi seamount experienced an episode of seafloor activity that led to volcanic pit collapse and a complete reconfiguration of the seafloor hydrothermal system. Fluid temperatures at the newly established vents inside Pele’s Pit initially reached as high as 200°C (Davis and Clague, 1998) but intermittent studies of those same vent-sites over the following decades, have revealed that fluid temperatures had subsequently relaxed back to 50–60°C (∼10 years post-eruption (Glazer and Rouxel, 2009) and now fall in the range 30–40°C (German et al., 2018) – i.e., comparable to fluid temperatures at the pre-eruption vent-sites. From this perspective, it is interesting to ask whether any similar geological/hydrothermal perturbation event could have occurred at Teahitia between the last reported Nautile dives and our fieldwork in 2013. While the Society Islands hot-spot lacks the same opportunities for repeat submersible investigations as Lo’ihi, we can use geophysical approaches to address this issue.
First, we note that the morphology of the seafloor at Teahitia as surveyed in 2013 (Figure 3) is remarkably similar to that observed in the original 1986 SeaBeam survey (Cheminée et al., 1989) with the same 4 peaks of the composite volcano prominent (TH1-TH4). Certainly, there is no evidence for the drastic changes in surface morphology (including pit collapse) observed at Loihi over the same time frame (Clague et al., 2019). More specifically, we also note that the shallowest summit of the TH1 cone in our 2013 survey is 1460 m (Figure 3) which coincides exactly with the depth at which submarine venting was located at the summit of this same cone in both 1989 (Michard et al., 1993) and 1999 (Hékinian, 1999). There is no bathymetric evidence for seamount inflation or deflation. Perhaps uniquely for this deep ocean study site, however, the Polynesian seismic array (Réseau Sismique Polynésian; RSP) provides a continuous record of seafloor activity across the Society Islands hotspot area, with a sensitivity that extends down to ≤ML 1.0 magnitude events. This record dates from 1985 and, hence, spans the entirety of the time period under consideration here (Figure 6). Following the periods of intense seismicity that coincided with the first multibeam survey and submersible-based investigations of Teahitia seamount (1986–1992), a period of quiescence ensued (≤5 events per year, ∼1993–2009) that continued beyond the repeat seafloor observations conducted using Nautile in 1999 (Hékinian, 1999). Since 2010, however, the frequency of occurrence of seismic events at Teahitia has shown an increase back to sustained rates not observed since the end of the 1980s. Interestingly the majority of events over this recent cycle have all been relatively weak (ML < 1.0), indicative of magmatic rather than tectonic sub-seafloor activity (Talandier and Okal, 1987). The one exception to that rule, at Teahitia, was a single ML 4.9 earthquake in August 2012. Similarly large (ML > 4.0) earthquakes detected at Mehetia and Teahitia at the time of the 1981–1985 seismicity crisis were attributed to tectonic events, perhaps linked to seafloor volcanic pit collapse (Talandier and Okal, 1984). As such, that work accurately presaged exactly the processes that arose in association with seafloor volcanic activity at Loihi Seamount, more than a decade later (Davis and Clague, 1998; Clague et al., 2019). In their original Teahitia study, Talandier and Okal (1984) also noted that a comparable abundance of seismic tremors, similar to that witnessed during the 1980s, had only previously been detected on Tahiti in 1918 (Lespinasse, 1919). This led the same authors to infer that episodes of renewed activity at the Society Islands hotspot might recur periodically, every 20–60 years. From this perspective, and at a 35 year remove from the last major seismicity crisis, it is interesting to note that the large (ML 4.9) seismic event at Teahitia in August 2012 was bracketed by two additional, distinctive, seismic events in March 2011 and April 2013, at the Rocard seamount, just 20 km to the East (Figure 2). Those records were sufficiently distinctive that they could be interpreted to represent transient periods of strong hydrostatic pressure acting on the rift zones of the Rocard submarine shield volcano (Talandier et al., 2016). In that work, it was inferred that these seismic signatures were each diagnostic of an episode in which lava flowed through a shallow open conduit in the subseafloor, for example in a meter-wide dike or vertical upflow pipe, prior to eruptive outpouring at the seafloor. Could all of these data be consistent with a reactivation of the Society Islands hot-spot?
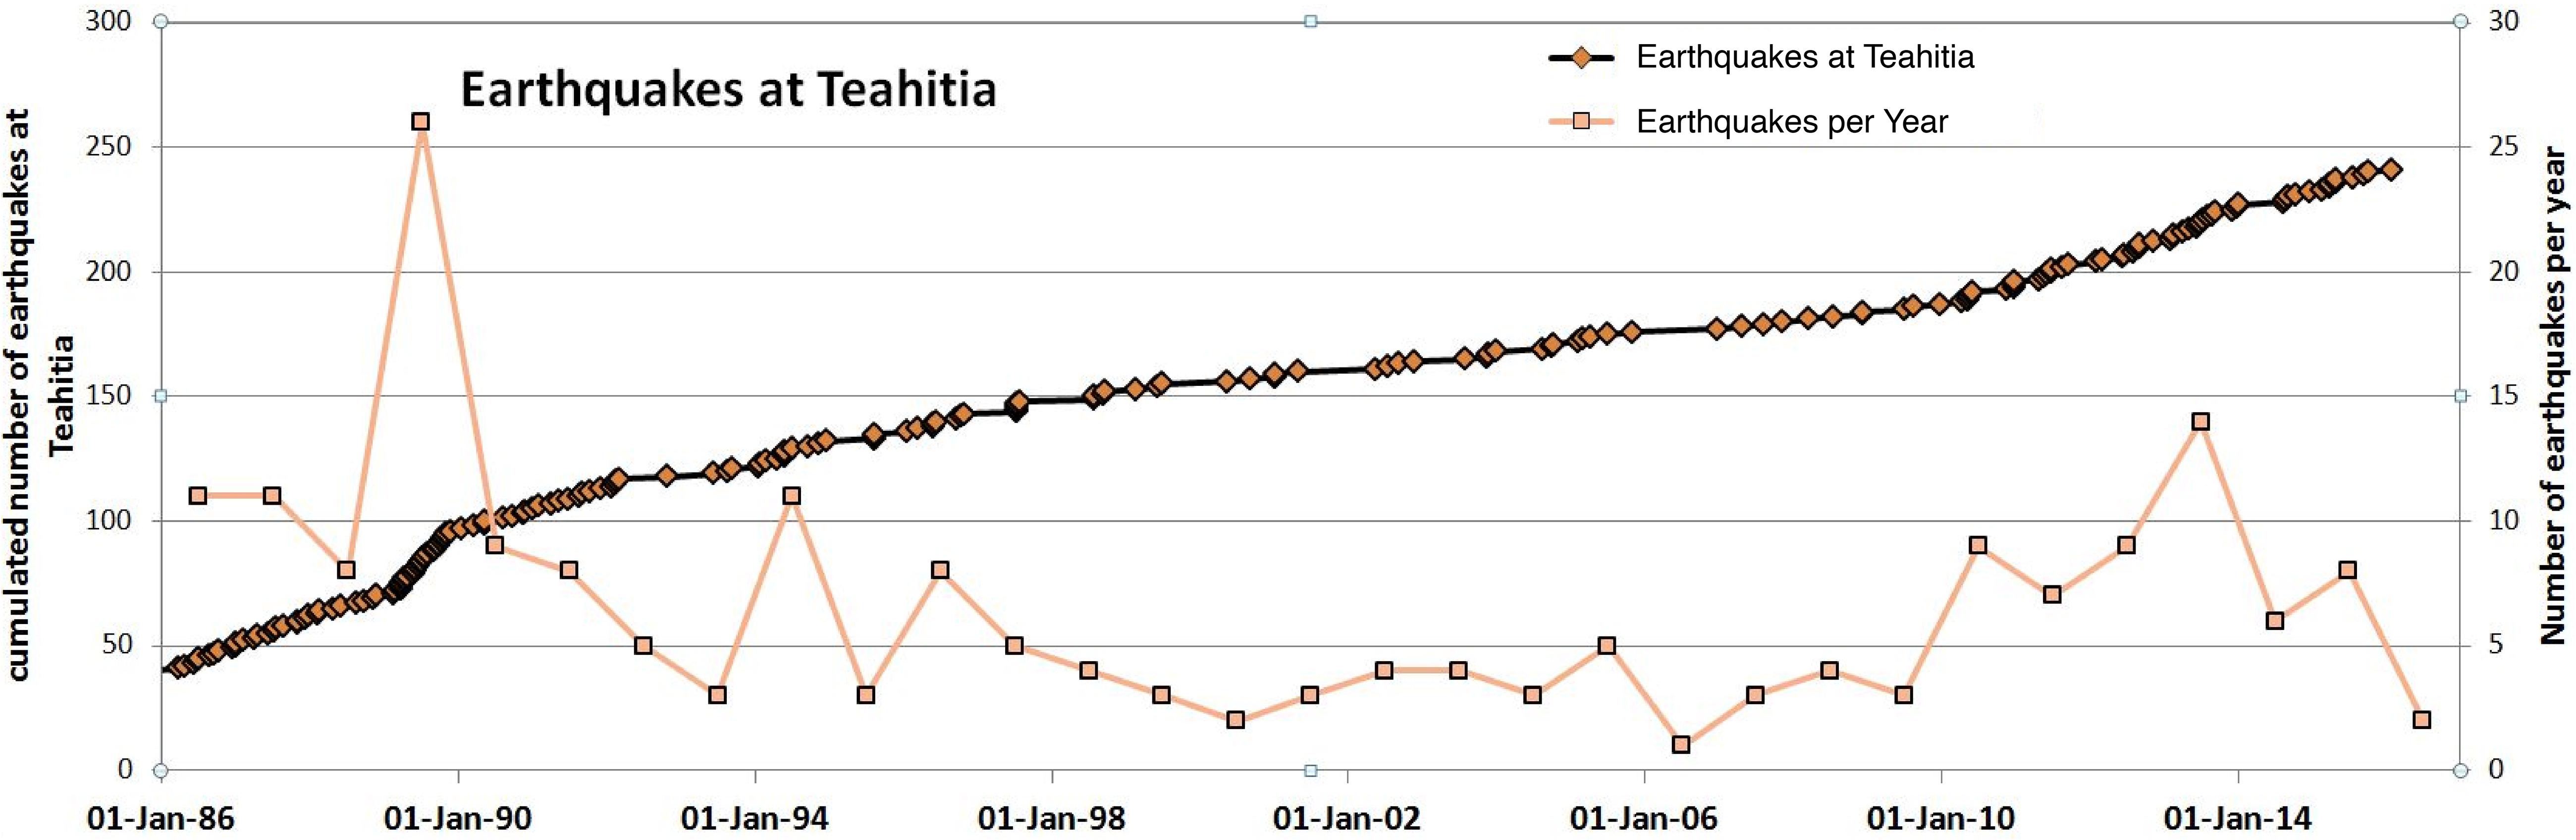
Figure 6. Time series plot for cumulative number of seismic earthquake events detected at Teahitia Seamount via the Réseau Sismique Polynésie (Polynesian Seismic Network), 1986–2019, and the frequency (events per year) of those earthquakes over the same period.
Oceanographic Evidence for Hydrothermal Perturbations at Teahitia Seamount
In the preceding section, we presented geophysical evidence that document temporal variability in the volcano-tectonic cycle at Teahitia, and beyond, that could be consistent with a re-activation of that seamount specifically, and/or across the Society Islands hotspot in general. But a question that we can address using our CTD plume data from directly above Teahitia is: do the heat-flux values that can be derived from our water column investigations require any departure from what was observed at the seafloor previously?
To address this question, a first calculation that we can pursue is to determine the heat flux implicit in our observed plume data. The optical and redox sensor data from our CTD cast provide clear evidence for a neutrally buoyant hydrothermal plume at ∼1400 m (Figure 5), i.e., at a height of ∼100 m above the seafloor source, assuming hydrothermal activity continues to be focused at the TH1 Summit (Michard et al., 1993; Hékinian, 1999). This terminal height for a hydrothermal plume depends mainly on its source buoyancy flux, together with the ambient stratification of the water column that it is injected into (Lupton, 1995). The scaling analysis of Turner (1986) suggests:
where Zmax (m) is the terminal height of a plume, B (m4s−3) is the source buoyancy flux, and N (rad/s) is the buoyancy frequency of the ambient stratification. Using the temperature and salinity profiles from the nearest available “background” station (WOCE Station P16-220: 17°31′S, 150°30′W), over the depth range from 1200–1600 m that spans from below the TH1 summit to above the non-buoyant plume, we arrive at a value for N = 0.0018 rad/s. Substituting this value, and Zmax = 100 m into equation (1) allows us to calculate a value of B = 0.0028m4s−3 for the source of venting at Teahitia seamount. Assuming this buoyancy flux results primarily from the temperature anomaly of the source hydrothermal fluid (hydrothermal fluids are typically within a factor of two of seawater salinities and mix rapidly post-eruption (German and Seyfried, 2014), we calculate a corresponding heat flux, H, using the equation:
in which Cp0 = 3947 J /kg/°C and ρ0 = 1027 kg/m3 are the specific heat capacity and density of the ambient seawater at the depth of the vent source, respectively, α = 1.23×10⁻⁴°C–1 is the corresponding thermal expansion coefficient, and g = 9.8 m/s2 is the gravitational acceleration. For a value of B = 0.0028m4s−3, the corresponding heat flux that we calculate for hydrothermal activity at the TH1 summit of Teahitia seamount is ∼9.5 MW.
A potential weakness to this traditional approach to hydrothermal heat-flux determinations from static CTD profile data, however, is that the derivation of equation (1) assumes an idealized plume that originates from an idealized point source and rises in a calm (i.e., zero ambient flow) and linearly stratified environment. In reality, the plume overlying any hydrothermal field, world-wide, must rise above a source that is distributed over a finite area (even if only the size of a single vent-chimney orifice). Further, in a deep ocean seamount setting there are almost certainly lateral currents present that can also affect plume rise. To obtain a more sophisticated/less idealized estimate of the source heat flux at Teahitia, therefore, we have also conducted a 3-D numerical simulation using the plume model described in Lavelle et al. (2013). The model is a 3-D non-hydrostatic, time-dependent, turbulent convection construct for a domain that is open to flow on all four sides. Injection of heat flux over a 20 by 20 m area through the bottom boundary drives the buoyant rise of a plume into a calm, stratified, rotating (f-plane) water column. The spatial resolution of the model simulation run for Teahitia was 1.5 m in all three dimensions. The background temperature and salinity used in the model were imported from the same WOCE Station P16-220 data set used to calculate the buoyancy frequency, previously (see above). An example of our model output is shown in Figure 7: calculated temperature anomalies for a hydrothermal plume driven by a 10 MW heat flux, 4 h after initiation of the simulation. In this example, the plume rises to a maximum height of ∼90 m above the seafloor before relaxing back to disperse, laterally, at a height of 60–70 m above the seafloor. Assuming a constant depth of seafloor venting at the TH1 summit of Teahitia (1460 m) this would be consistent with the formation of a non-buoyant plume dispersing at 1390–1400 m providing a reassuringly close fit to what we have observed from our geochemical data (Figure 5).
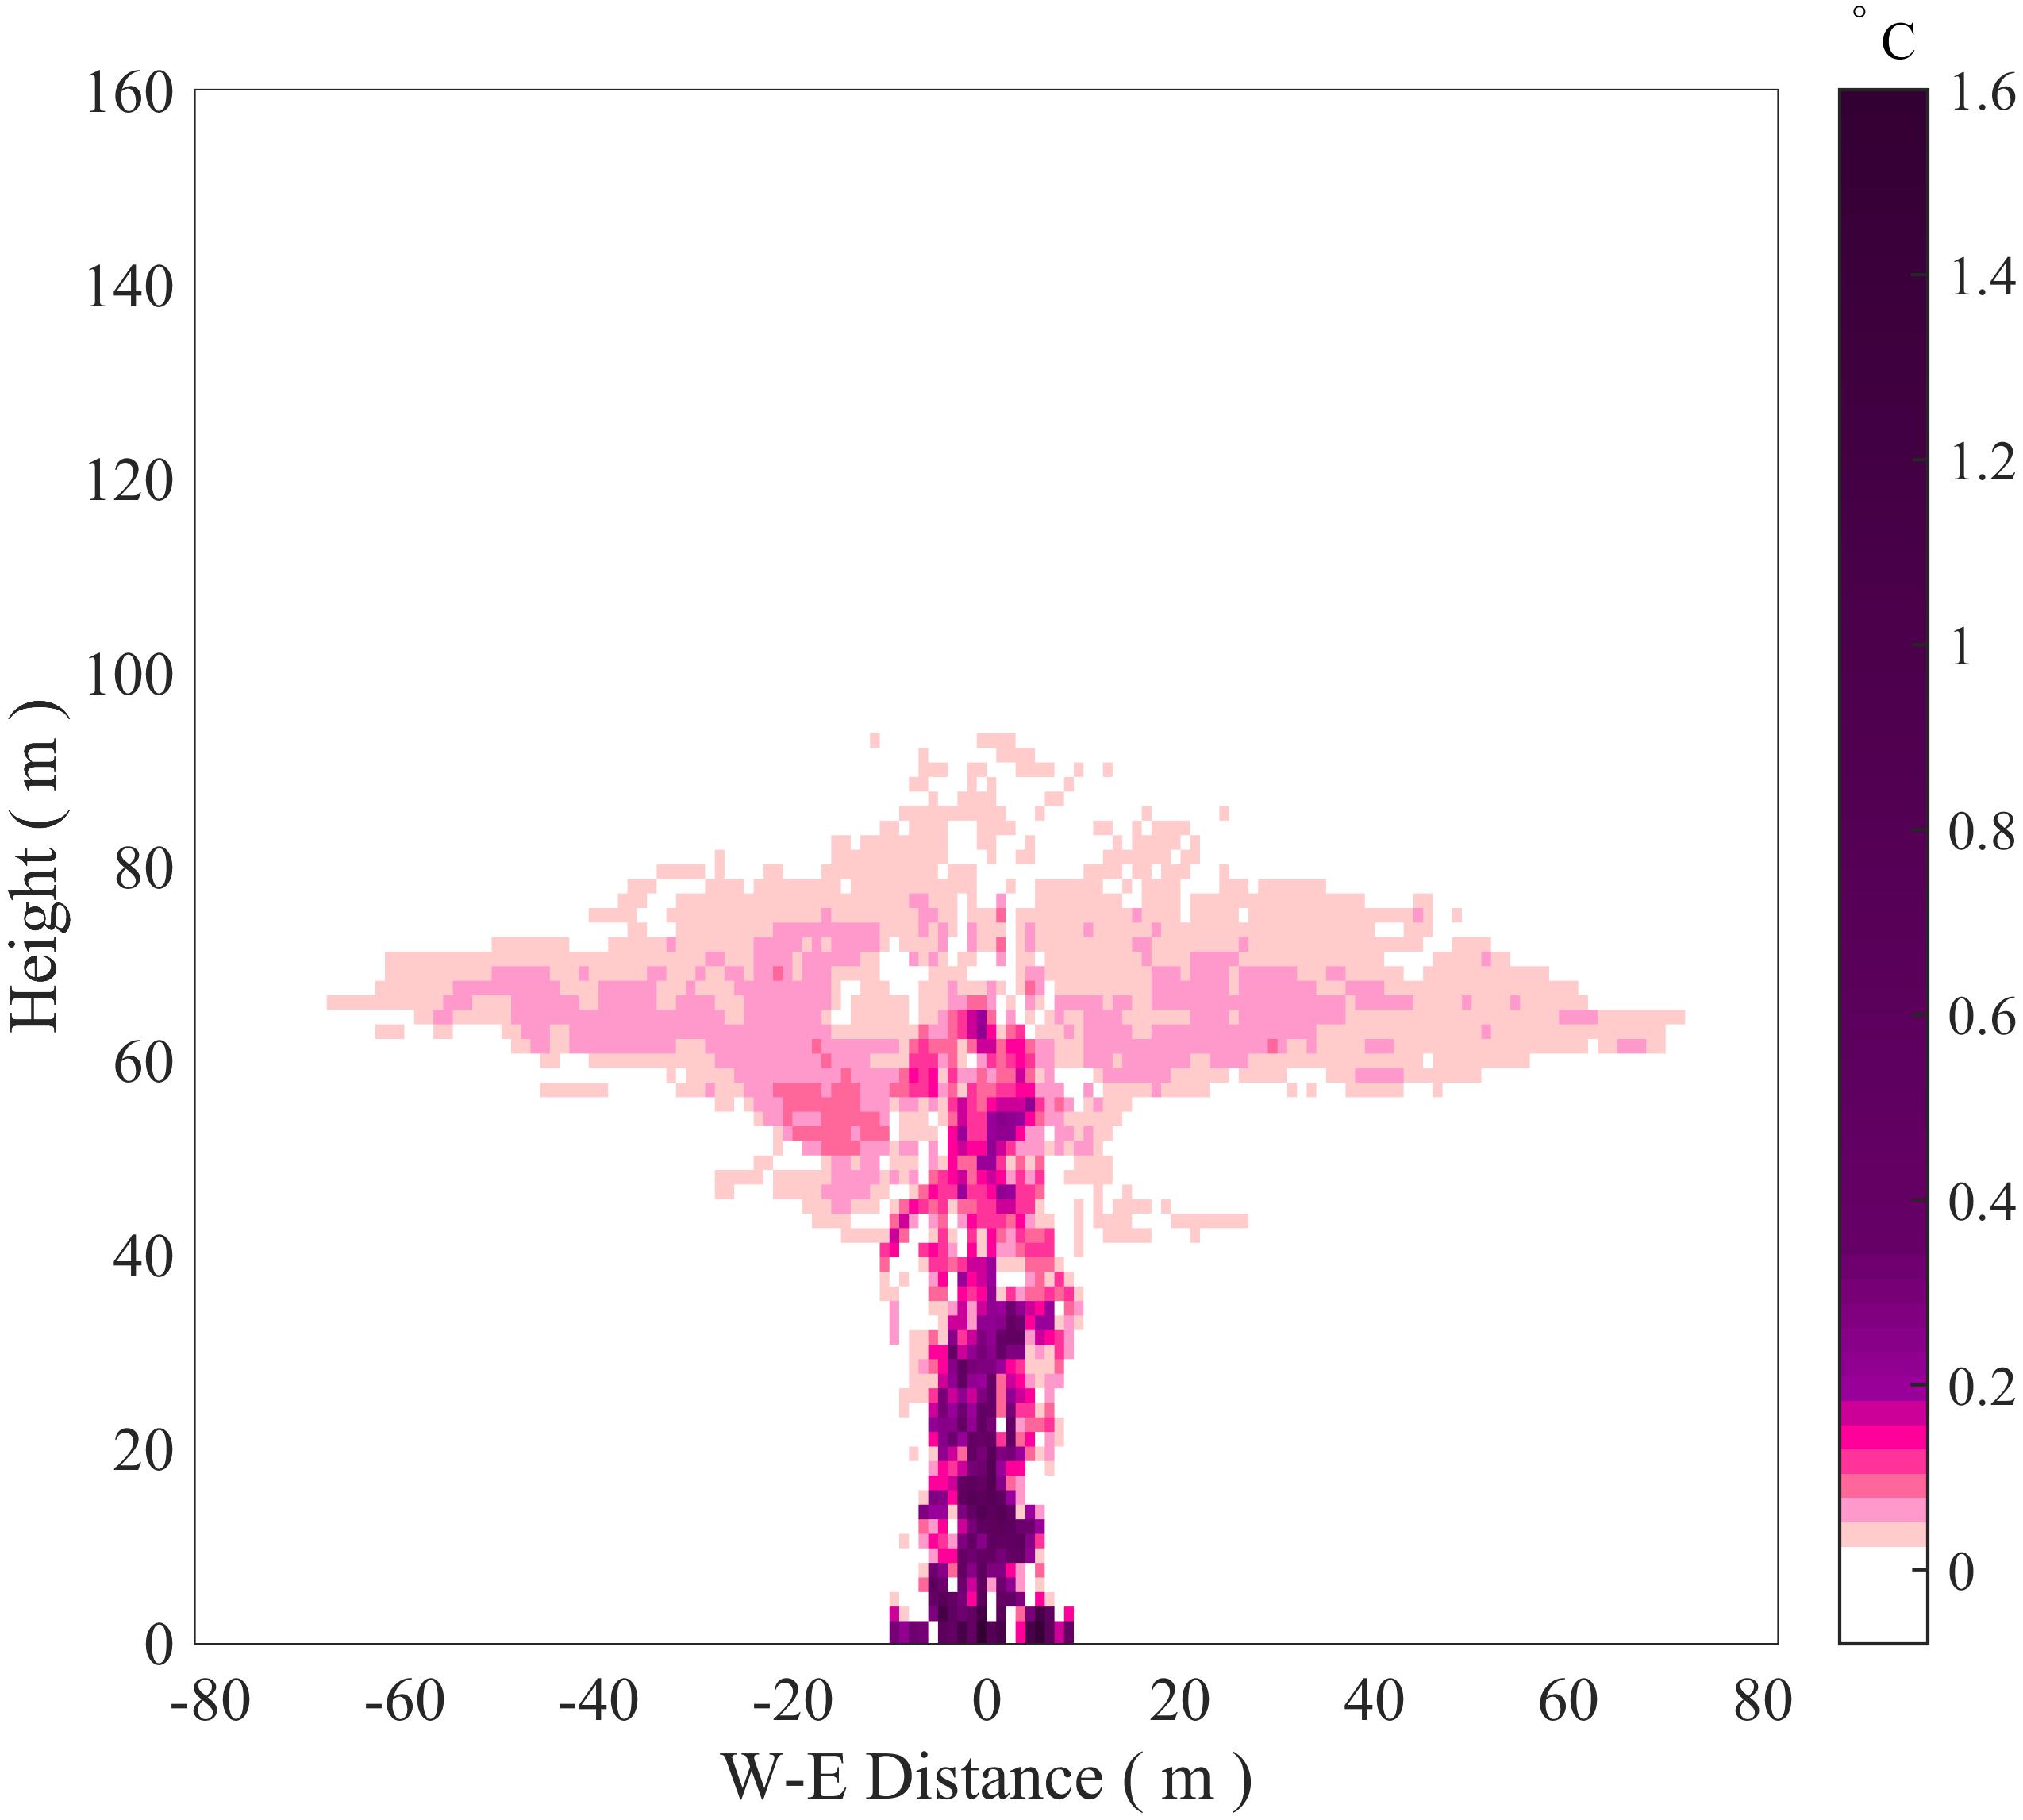
Figure 7. Temperature anomalies for a simulated plume rising from a flat bottom into a stratified environment with zero ambient flow. The source heat flux for the plume is 10 MW and the area over which that source is distributed is 20 × 20 m. Background hydrography for the model is derived from CTD data taken from WOCE Station P16-220. The maximum height reached by the simulated plume is ∼90 m above the seafloor and the lateral dispersion height for the non-buoyant plume is centered at ∼65 m above bottom (equivalent to 1395–1400 m depth for a plume source situated on the shallowest 5 m of the TH1 cone at Teahitia (1460–1465 m).
The results from our scaling analysis and our 3-D simulation approaches, above, both suggest that a hydrothermal heat flux of ∼ 10 MW could be responsible for the dispersing non-buoyant hydrothermal plume signals observed in 2013 at Teahitia. However, neither case takes into account ambient flows and previous studies suggest that a hydrothermal plume injected into a cross-flow will rise to a lower level than a plume injected into a calm environment (Middleton and Thomson, 1986). Consequently, this estimate of 10 MW should be considered to be a highly conservative value, considering the likelihood of the presence of seamount related currents present at and above Teahitia. Accordingly, in the following discussion, we use 10 MW as the minimum source heat flux for the current state of venting at Teahitia.
Previously, seafloor surveys had revealed no evidence for high temperature venting at Teahitia. Instead, all that had been reported were a cluster of low-temperature chimneys, venting fluids at just 30°C at this intra-plate hot spot hydrothermal field. A question, arises, therefore, whether such a form of seafloor fluid flow could give rise to a coherent upflow of ≥10 MW that, in turn, could give rise to the non-buoyant hydrothermal plume signals that we have observed (Figure 5). If the answer is negative, then it implies that the hydrothermal venting at Teahitia, in 2013, could not be sustained by the venting observed previously and would, instead, be more consistent with a system that has been re-invigorated. To complete this next set of calculations, we first had to estimate an area over which low temperature venting might be taking place at Teahitia seamount in such a way that the cumulative flux may coalesce into a single coherent buoyant plume. The lateral extent of the venting area observed during past submersible dives at Teahitia is not well documented but detailed reading of the two Polynaut dive reports reveals a consistent pattern for the summit of the TH1 cone: while inactive Fe-rich chimneys became apparent at all depths shallower than 1470 m, it was only in the shallowest 4–5 m of each dive that active chimneys were observed. This potentially provides us with an important constraint because a detailed examination of the bathymetry close to the TH1 summit from 2013 (Figure 3) reveals that the shallowest 1470 m contour describes a roughly rectangular area of ∼50 × 100 m (Figure 8). Assuming regular geometry from there to the 1460 m summit, this would suggest that the uppermost 5 m (by depth) of the TH1 peak should represent an area of ∼20 m x 40 m yielding an area of venting, assuming 50% coverage of that uppermost region (Hékinian, 1999) of ∼400 m2. For the calculations that follow, therefore, this is the idealized surface area that we have assumed for the source of input to our non-buoyant plume. For comparison, the largest contiguous area of low temperature flow documented anywhere at Loihi, the Spillway site, has recently been measured to cover an area of ≤450 m2 (German et al., 2018). To estimate the heat flux that could be carried by ≤30°C fluids from the summit of Teahitia, we next need to obtain an estimate of the venting flow rate averaged over the source area. In the absence of direct flow rate measurements, we assume that the subsurface hydrothermal circulation at Teahitia follows Darcy’s Law (Darcy, 1856; Whitaker, 1986) as viscous fluid flows through a porous medium, and calculate the venting flow rate, following Germanovich and Lowell (2004), as:
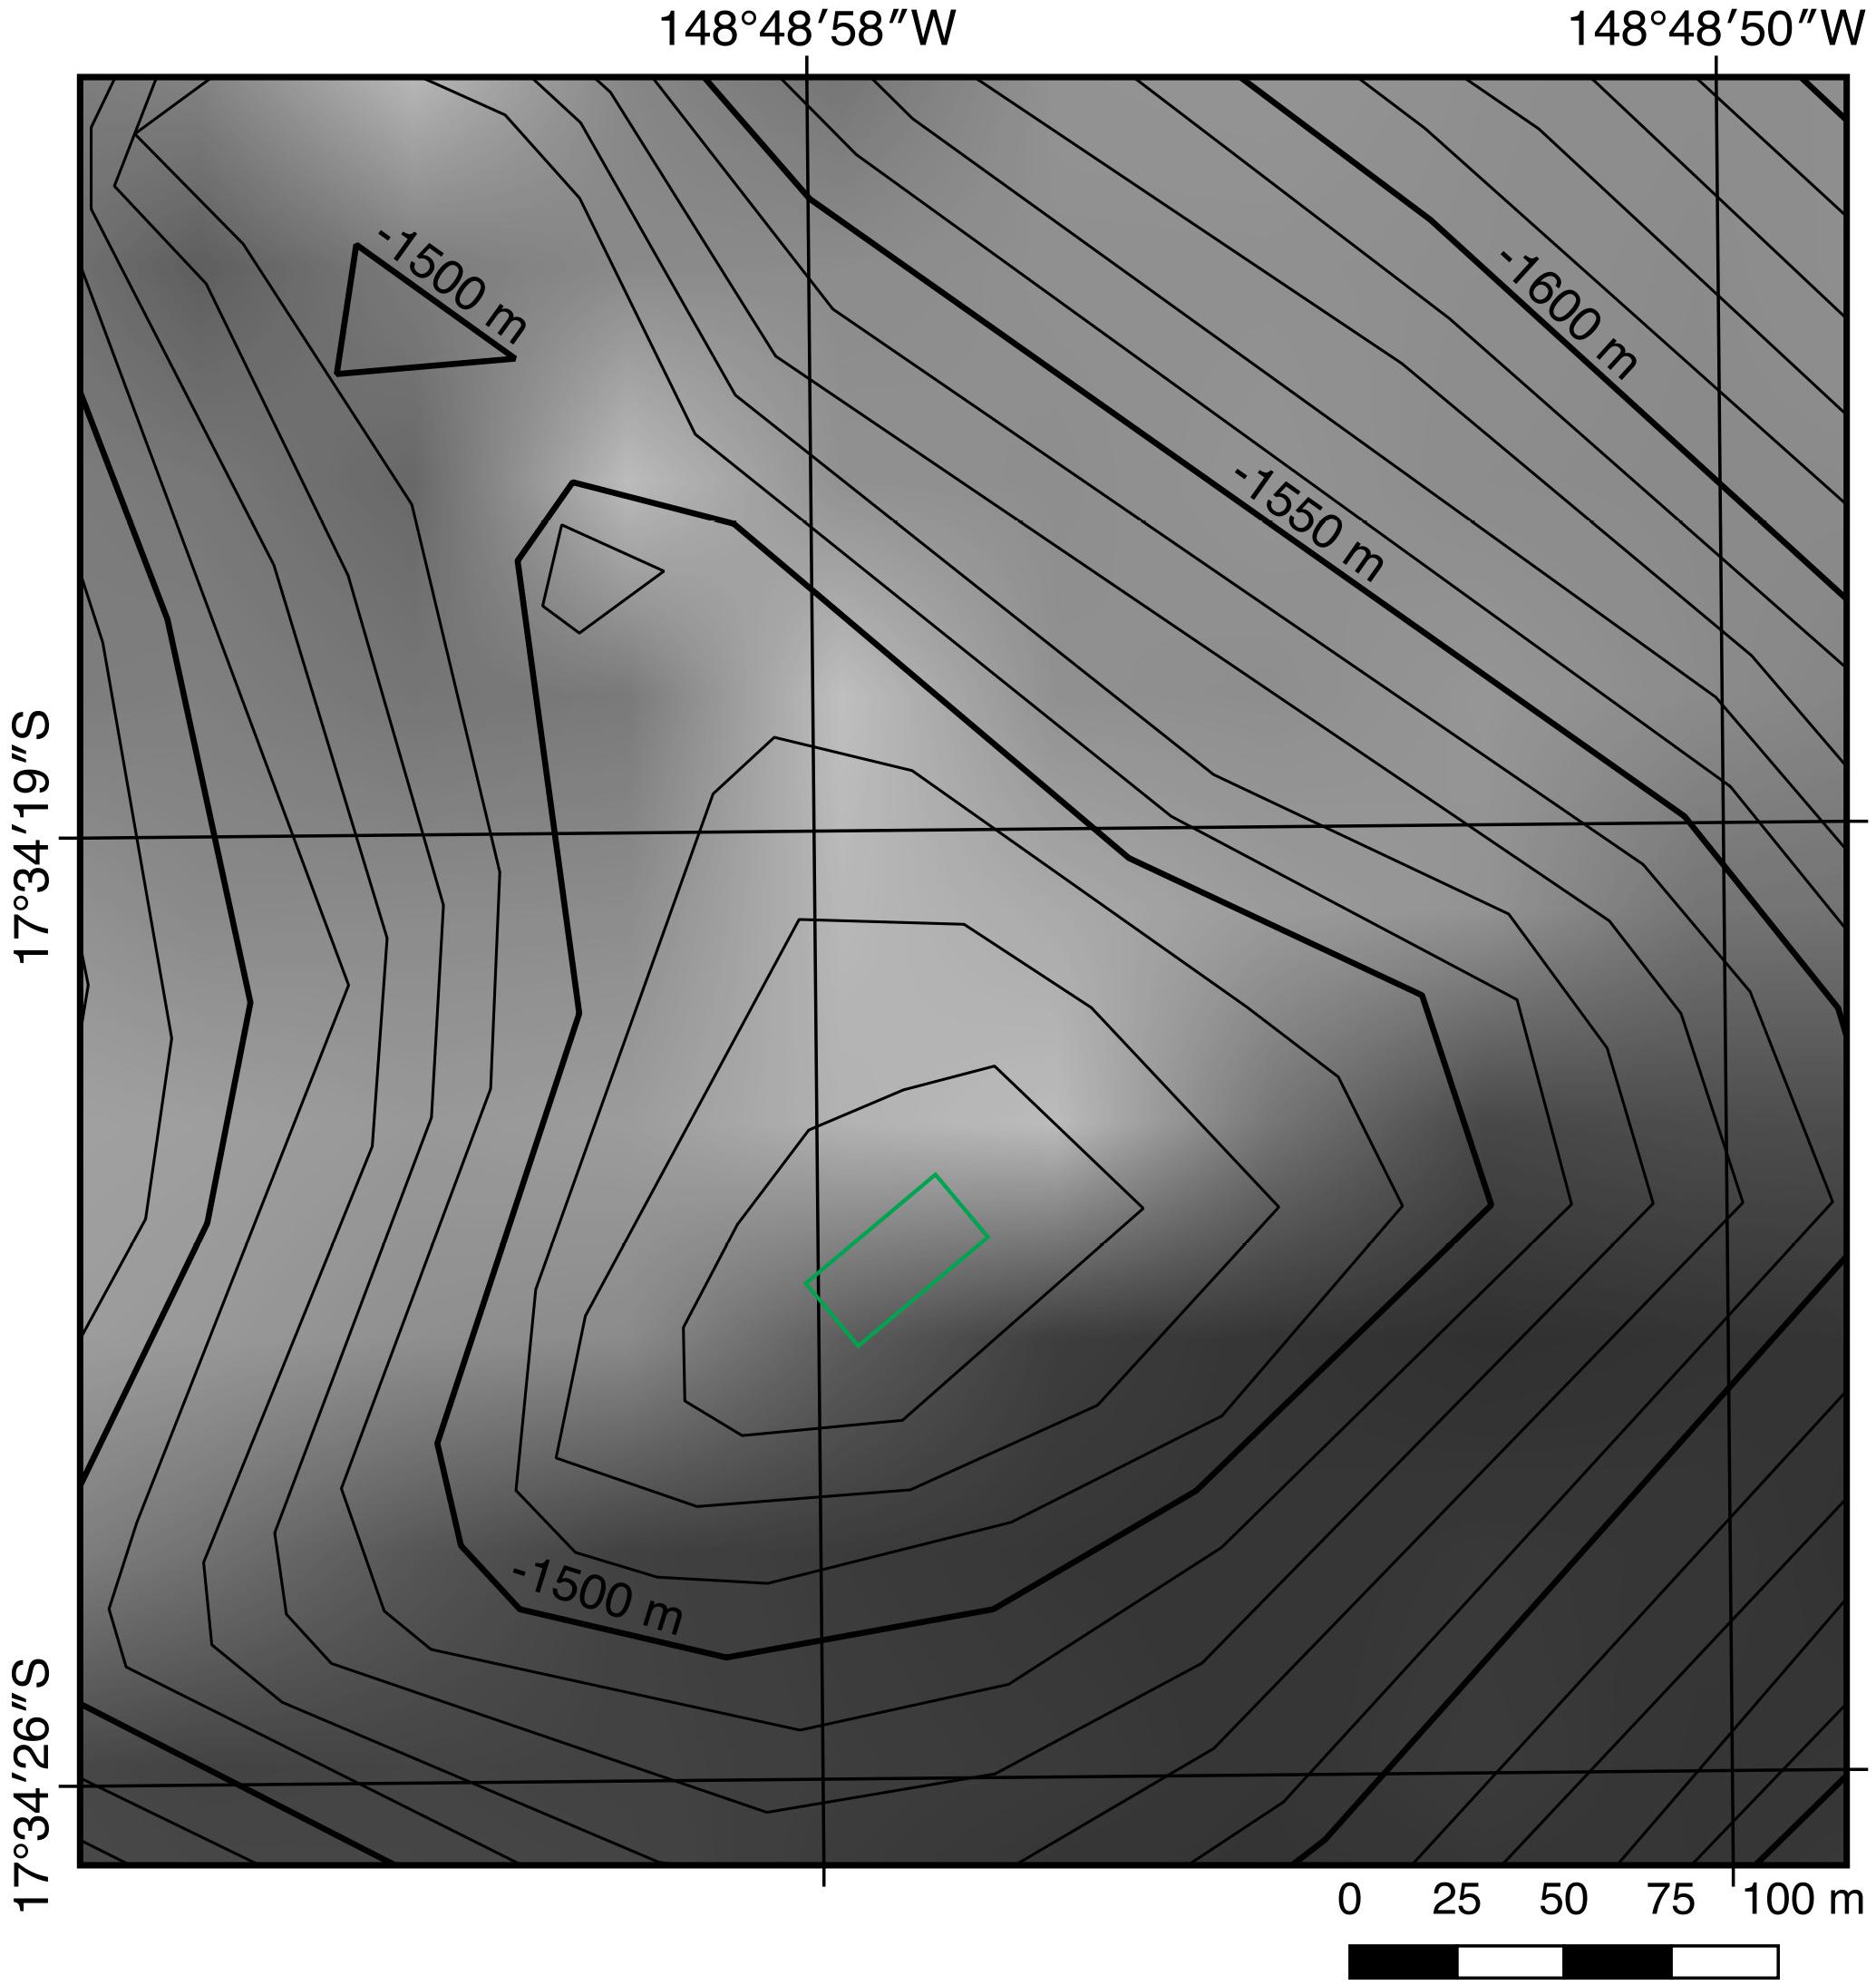
Figure 8. Detailed bathymetric map (10 m contours) for the summit of the TH1 cone at Teahitia seamount (see Figure 3). Green rectangle illustrates a projected area of ∼40 × 20 m for the upper 4–5 m of the cone where low-temperature venting had previously been noted to be concentrated (Hékinian, 1999).
in which k is the crustal permeability, μh,ρh,αh,Th are the dynamic viscosity, density, thermal expansion coefficient, and temperature of hydrothermal fluids, respectively, and Tb is the temperature of background pore fluids, which are assumed to be the same as local bottom water (2.6°C). According to Germanovich et al. (2000), the dynamic viscosity can be estimated as μh(Th) = C1/(Th + C2) where and . We calculate ρh and αh using the equation of state developed by Driesner (2007) as functions of Th at a reference salinity of 34.76 ppt and a pressure of 149.4 bar. These values correspond to the salinity and pressure of background seawater at Teahitia at a depth of 1480 m. Subsequently, we calculate the source heat flux as:
where Cph is the specific heat capacity of the vent fluids calculated using the Driesner (2007) equation of state as a function of Th at the same reference salinity and pressure mentioned above, and A = 400 m2 is the source area. To the best of our knowledge, there have been no previous estimates of crustal permeability at Teahitia. In the absence of relevant data from that site (or, indeed, any of the other four known intra-plate hotspot hydrothermal fields) we rely, instead, upon the known crustal permeability values from the Endeavor Segment, Juan de Fuca Ridge, as a surrogate (Endeavor is known for its vigorous hydrothermal activity, which consists of five major vent fields with a combined heat flux >1000 MW (Kellogg, 2011). In the following calculation, we use the upper limit for estimated crustal permeability at Endeavor, k∼10−10 m2 (Hearn et al., 2013), to establish a maximum crustal permeability at Teahitia. Substituting k = 10−10m2 along with and into equations (3) and (4) gives w = 1.34×10⁻⁵m/s and, consequently, an estimate of heat-flux, H = 0.6 MW.
This is much lower than the minimum value of 10 MW that we had previously established would be required to sustain the non-buoyant hydrothermal plume signals that we have observed (Figure 5). Apparently, then, the plume signals that we have observed could not be sustained by an area of low-temperature flow restricted to the uppermost portion of TH1 with venting at ≤30°C as reported from Teahitia in 1989 and again in 1999 (Michard et al., 1993; Hékinian, 1999). Nevertheless, we do know that very similar hydrothermal plume signals have subsequently been reported from above Loihi seamount (Bennett et al., 2011) at a time when the underlying vent-fluids, also exiting from Fe-rich hydrothermal chimneys, were significantly hotter, at 50–60°C (Glazer and Rouxel, 2009). Could the hydrothermal heat output at Teahitia have increased by more than an order of magnitude between the time of the last Nautile submersible dives in 1999, therefore, and our return study in 2013? To investigate this, we allowed Th to vary from 30 up to 100°C while recalculating predicted heat-flux values, H, using equations (3) and (4). Our results (Figure 9) indicate that an area of low-temperature flow exiting the seafloor at the summit of Teahitia could sustain a source heat flux of ≥10 MW over the prescribed 400 m2 area (and, hence, generate the non-buoyant plume observed in our CTD data) if the effective vent-temperatures for that low temperature flow were ≥70°C, rather than ≤30°C. We consider this entirely plausible, given that the model temperatures required match so closely to those recorded from Loihi across the decade immediately following the most recent volcanic activity at that site in 1996, with temperatures up to 200°C soon after the event (Davis and Clague, 1998) relaxing back to 50–60°C a decade later in 2005–2007 (Glazer and Rouxel, 2009). In summary, the oceanographic data for Teahitia do appear to be consistent with a field of low temperature hydrothermal venting clustered at the summit of the TH1 cone, similar to what had been described previously, but only if the temperature of that venting, at the time of our field program in 2013, was ≥70°C, i.e., significantly hotter than the maximum temperatures reported when the site was last visited by submersible 15–25 years earlier. Given the close similarity between this work (both in terms of model-required source temperatures and water column plume observations) with their conjugate data sets for Loihi, approximately 10 years after the most recent seafloor volcanic event, we tentatively conclude that our oceanographic data, coupled with those from our geophysical observations, do indeed, provide evidence that the Society Islands hot spot may be in the process of renewing activity. We strongly recommend detailed follow-up investigations of this possibility in the nearest possible future.
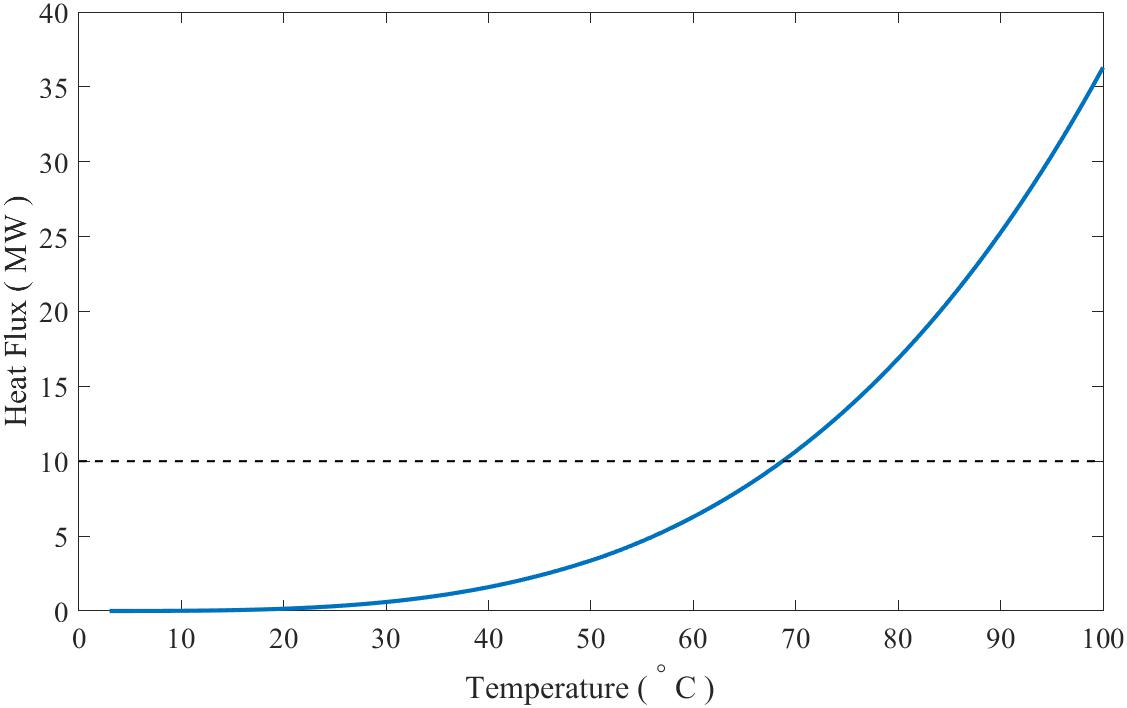
Figure 9. Plot of calculated heat flux responsible for the oceanographic plume observations reported at Teahitia, assuming venting occurs as low-temperature flow distributed across the summit of Teahita (see section “Discussion”). To reach the heat flux values calculated in this study (≥10 MW) requires seafloor fluid temperatures of ≥70°C which are significantly higher than what was observed 25 years earlier but fits closely to the range of post-eruption vent-fluid temperatures at Loihi seamount (German et al., 2018).
Summary
The Teahitia Seamount, at the western limit of the currently active Society Islands hotspot, hosts one of just five intraplate hydrothermal fields ever to have been discovered, worldwide. More than 30 years after low temperature (≤30°C) submarine venting was first discovered at Teahitia, the presence of a non-buoyant plume overlying its summit confirms that hydrothermal activity continues at this site. While there has only been one direct observation of seafloor venting in the intervening 25 years, continuous seismic monitoring of the region suggests that a ∼15 year period of quiescence followed the seismicity crisis that first led to submersible-led exploration of this area, from 1992–2007. Since then, the Polynesian Seismic Network has revealed a return to the same level of frequency of occurrence of seismic events at Teahitia reported in the late 1980s that could be consistent with a reactiviation of the Society Islands hotspot. Specifically, the preponderance of events detected at Teahitia are ML < 1.0, consistent with magmatic rather than tectonic activity, while distinct seismic signatures of events at the adjacent Rocard seamount (25 km to the East) have also been interpreted to be indicative of submarine extrusive events, in 2011 and 2013. Theoretical modeling of output for the hydrothermal plume reported here requires an input of hot, chemically enriched fluids with a net heat output of ∼10 MW. From comparison with the similar hydrothermal plume signals overlying the Loihi seamount, we recognize that such signatures do not necessarily imply a focused high-temperature hydrothermal vent source at the seafloor. However, our model simulations do suggest that if low-temperature hydrothermal activity of the kind identified previously at the summit of Teahitia is responsible, the plume signatures we observe can only be sustained if the erupting vent fluids have increased in temperature from ≤30°C to closer to 70°C. Again, such changes could be entirely consistent with renewed volcanic and hydrothermal activity at the Society Islands hotspot. Return submersible-led visits to the area are clearly merited – if not long overdue!
Data Availability Statement
The datasets generated for this study are available on request to the corresponding author.
Author Contributions
CG, JM, and GC were PIs for the cruise in 2013. CG directed shipboard operations. JR was responsible for sampling and post-cruise Fe and Mn analyses discussed in section “Hydrothermal Plume Signals Over Teahitia Seamount.” CG, JR, and CD were PIs for a planned follow-on cruise with IY, GX, and OH instead of which, IY, OH, and DR processed the geophysical data discussed in section “Geophysical Evidence for Volcano-Tectonic Perturbations at Teahitia Seamount.” GX processed the data discussed, together with complementary model simulations, in section “Oceanographic Evidence for Hydrothermal Perturbations at Teahitia Seamount.” SW prepared the NOAA-PMEL ORP probe for deployment and contributed to the processing of those data post cruise. All authors participated in the interpretation of the data and writing of the manuscript.
Funding
Field work for this project was funded through NSF Awards to CG (OCE-1130870), JR (OCE-1237011), GC (OCE-1130245), and JM (OCE-1131731). Post-cruise, additional support was provided through NOAA Cooperative Agreement NA15OAR432006 and funding from WHOI and GEOMAR Helmholtz Centre for Ocean Research Kiel. The Réseau Sismique Polynésie was supported at LDG by the Commissariat à l’Energie Atomique et aux Energies Renouvelables. Open Access publication charges for this paper were provided by the Schmidt Ocean Institute.
Conflict of Interest
The authors declare that the research was conducted in the absence of any commercial or financial relationships that could be construed as a potential conflict of interest.
The handling Editor declared a past collaboration with one of the authors CG.
Acknowledgments
We thank the Captain and crew of the RV Thomas G. Thompson cruise TN303 and, especially, Rob Palomares (SIO) for his support of our CTD operations and Patrick A’Hearn and Steve Jalickee (UW) for their support in conducting the EM302 multibeam survey. GX thanks J. W. Lavelle for support in conducting the 3D numerical simulations of the Teahitia plume. We also thank the Schmidt Ocean Institute for bringing this team of collaborators together and, in particular, Captain Bernd Buchner and the crew of the RV Falkor for their hospitality aboard ship in Papeete, where the first draft of this manuscript was generated. Finally, we thank Guest Editor DA and two reviewers for their contributions in improving the original version of this manuscript.
References
Baker, E. T., and German, C. R. (2004). On the global distribution of mid-ocean ridge hydrothermal vent-fields. Geophys. Monogr. 148, 245–266. doi: 10.1029/148gm10
Baker, E. T., German, C. R., and Elderfield, H. (1995). Hydrothermal plumes: global distributions and geological inferences. Geophys. Monogr. 91, 47–71. doi: 10.1029/gm091p0047
Beaulieu, S. E., Baker, E. T., and German, C. R. (2015). Where are the undiscovered hydrothermal vents on oceanic spreading ridges? Deep Sea Res. II 121, 202–212. doi: 10.1016/j.dsr2.2015.05.001
Beaulieu, S. E., Baker, E. T., German, C. R., and Maffei, A. (2013). An authoritative global database for active submarine hydrothermal vent fields. Geochem. Geophys. Geosystems 14, 4892–4905. doi: 10.1002/2013gc004998
Bennett, S. A., Hansman, R. L., Sessions, A. L., Nakamura, K., and Edwards, K. J. (2011). Tracing iron-fueled microbial carbon production within the hydrothermal plume at the Loihi seamount. Geochim. Cosmochim. Acta 75, 5526–5539. doi: 10.1016/j.gca.2011.06.039
Binard, N., Hékinian, R., Cheminée, J.-L., and Stoffers, P. (1992). Styles of eruptive activity on interaplate volcanoes in the Society and Austral hot spot regions: bathymetry, petrology and submersible operations. J. Geophys. Res. 97, 13999–14015.
Cheminée, J. L., Hékinian, R., Talandier, J., Albarède, F., Devey, C. W., Francheteau, J., et al. (1989). Geology of an active hot spot: Teahitia-Mehetia region in the South Central Pacific. Mar. Geophys. Res. 11, 27–50. doi: 10.1007/bf00286246
Clague, D. A., Paduan, J. B., Caress, D. W., Moyer, C. L., Glazer, B. T., and Yoerger, D. R. (2019). Structure of Loihi Seamount, Hawaii and lava flow morphology from high-resolution mapping. Front. Earth. Sci. 7:58. doi: 10.3389/feart.2019.00058
Davis, A. S., and Clague, D. A. (1998). Changes in the hydrothermal system at Loihi Seamount after the formation of Pele’s pit in 1996. Geology 26, 399–402.
Driesner, T. (2007). The system H2O—NaCl. Part II: Correlations for molar volume, enthalpy, and isobaric heat capacity from 0 to 1000 8C, 1 to 5000 bar, and 0 to 1 XNaCl. Geochim. Cosmochim. Acta 71, 4902–4919. doi: 10.1016/j.gca.2007.05.026
German, C. R., Lim, D. S. S., Breier, J. A., Huber, J. A., Nawotniak, S. K., Shock, E., et al. (2018). “Time series study of hydrothermal venting at Lo’ihi Seamount following the 2018 Kilauea eruption,” Proceedings of the Fall Meeting 2018 (Washington, DC: AGU V14A-07).
Germanovich, L. N., and Lowell, R. P. (2004). Hydrothermal processes at Mid-Ocean Ridges: results from scale analysis and single pass models. Geophys. Monogr. 148, 219–244. doi: 10.1029/148gm09
Germanovich, L. N., Lowell, R. P., and Astakhov, D. K. (2000). Stress-dependent permeability and the formation of seafloor event plumes. J. Geophys. Res. 105, 8341–8354. doi: 10.1029/1999jb900431
Glazer, B. T., and Rouxel, O. J. (2009). Redox speciation and distribution within diverse iron-dominated microbial habitats at Loihi Seamount. Geomicrobiol. J. 26, 606–622. doi: 10.1080/01490450903263392
Gutenberg, B., and Richter, C. F. (1954). Seismicity of the Earth and Associated Phenomena. Princeton, NJ: Princeton University Press, 310.
Hearn, C. K., Homola, K. L., and Johnson, H. P. (2013). Surficial permeability of the axial valley seafloor: Endeavour segment, Juan de Fuca ridge. Geochem. Geophys. Geosyst. 14, 3409–3424. doi: 10.1002/ggge.20209
Karl, D. M., McMurtry, G. M., Malahoff, A., and Garcia, M. O. (1988). Loihi Seamount, Hawaii: a mid-plate volcano with a distinctive hydrothermal system. Nature 335, 532–535. doi: 10.1038/335532a0
Kellogg, J. P. (2011). Temporal and Spatial Variability of Hydrothermal Fluxes Within a Mid-Ocean Ridge Segment. Washington: University of Washington, 141. Ph.D. Thesis.
Lavelle, J. W., Di Iorio, D., and Rona, P. (2013). A turbulent convection model with an observational context for a deep-sea hydrothermal plume in a time-variable cross flow. J. Geophys. Res. 118, 6145–6160. doi: 10.1002/2013JC009165
Lespinasse, A. (1919). Observations météorologiques faites à l’Observatoire de l’hôpital de Papeete. Bull. Soc. Étud. Océanienne Polynésie Fr. 5, 62–63.
Lupton, J. E. (1995). Hydrothermal plumes: near and far-field. Geophys. Monogr. 91, 317–346. doi: 10.1029/gm091p0317
Michard, A., Michard, G., Stüben, D., Stoffers, P., Cheminée, J.-L., and Binard, N. (1993). Submarine thermal springs associated with young volcanoes: The Teahitia vents, Society Islands, Pacific Ocean. Geochim. Cosmochim. Acta 57, 4977–4986. doi: 10.1016/s0016-7037(05)80003-1
Middleton, J. M., and Thomson, R. E. (1986). Modeling the rise of hydrothermal plumes, Can. Tech. Rep. Hydrogr. Ocean Sci 69, 18.
Moffett, J. W., and German, C. R. (2018). The US GEOTRACES Eastern Tropical Pacific Transect (GP16). Mar. Chem. 201, 1–262. doi: 10.1016/j.marchem.2017.12.001
Okal, E. A., Talandier, J., Sverdrup, K. A., and Jordan, T. H. (1980). Seismicity and tectonic stress in the Southcentral Pacific. J. Geophys. Res. 85, 6479–6495. doi: 10.1029/jb085ib11p06479
Resing, J. A., Sedwick, P. N., German, C. R., Jenkins, W. J., Moffett, J. W., Sohst, B. M., et al. (2015). Basin-scale transport of hydrothermal dissolved metals across the South Pacific Ocean. Nature 523, 200–203. doi: 10.1038/nature14577
Sakai, H., Tsubota, H., Nakai, T., Ishibashi, J., Akagi, T., Gamo, T., et al. (1987). Hydrothermal activity on the summit of Loihi Seamount. Hawaii. Geochem. J. 21, 11–21. doi: 10.2343/geochemj.21.11
Staudigel, H., Hart, S. R., Pile, A., Bailey, B. E., Baker, E. T., Brooke, S., et al. (2006). Vailulu’u Seamount, Samoa: life and death on an active submarine volcano. Proc. Natl. Acad. Sci.U.S.A. 103, 6448–6453. doi: 10.1073/pnas.0600830103
Stüben, D., Stoffers, P., Cheminée, J.-L., Hartmann, M., McMurtry, G. M., Richnow, H.-H., et al. (1992). Manganese, methane, iron, zinc and nickel anomalies in hydrothermal plumes from Teahitia and Macdonald volcanoes. Geochim. Cosmochim. Acta 56, 3693–3704. doi: 10.1016/0016-7037(92)90162-c
Talandier, J., Hyvernaud, O., and Maury, R. C. (2016). Unusual seismic activity in 2011 and 2013 at the submarine volcano Rocard, Society hot spot (French Polynesia). Geophys. Res. Lett. 43, 4247–4254. doi: 10.1002/2016gl068342
Talandier, J., and Kuster, G. T. (1976). Seismicity and submarine volcanic activity in French Polynesia. J. Geophys. Res. 81, 936–948. doi: 10.1029/jb081i005p00936
Talandier, J., and Okal, E. A. (1984). The volcanoseismic swarm of 1981-1983 in the Tahiti-Mehetia area, French Polynesia. J. Geophys. Res. 89, 11216–11234. doi: 10.1029/jb089ib13p11216
Talandier, J., and Okal, E. A. (1987). Seismic detection of underwater volcanism: the example of French Polynesia. Pure Appl. Geophys. 125, 919–950. doi: 10.1007/bf00879361
Turner, J. S. (1986). Turbulent entrainment: The development of the entrainment assumption, and its application to geophysical flows. J. Fluid Mech. 173, 431–471. doi: 10.1017/s0022112086001222
Keywords: hydrothermal, seamount, hotspot, Teahitia, Tahiti, Pacific
Citation: German CR, Resing JA, Xu G, Yeo IA, Walker SL, Devey CW, Moffett JW, Cutter GA, Hyvernaud O and Reymond D (2020) Hydrothermal Activity and Seismicity at Teahitia Seamount: Reactivation of the Society Islands Hotspot? Front. Mar. Sci. 7:73. doi: 10.3389/fmars.2020.00073
Received: 01 April 2019; Accepted: 30 January 2020;
Published: 21 February 2020.
Edited by:
Diva Amon, Natural History Museum, United KingdomReviewed by:
Mustafa Yucel, Middle East Technical University, TurkeyBenjamin Tutolo, University of Calgary, Canada
Copyright © 2020 German, Resing, Xu, Yeo, Walker, Devey, Moffett, Cutter, Hyvernaud and Reymond. This is an open-access article distributed under the terms of the Creative Commons Attribution License (CC BY). The use, distribution or reproduction in other forums is permitted, provided the original author(s) and the copyright owner(s) are credited and that the original publication in this journal is cited, in accordance with accepted academic practice. No use, distribution or reproduction is permitted which does not comply with these terms.
*Correspondence: Christopher R. German, Y2dlcm1hbkB3aG9pLmVkdQ==
†Present address: Guangyu Xu, Applied Physics Laboratory, University of Washington, Seattle, WA, United States; Isobel A. Yeo, National Oceanography Centre Southampton, Southampton, United Kingdom