 Mark F. Baumgartner1*
 Julianne Bonnell2
 Peter J. Corkeron2
 Sofie M. Van Parijs2Cara Hotchkin3Ben A. Hodges4Jacqueline Bort Thornton3Bryan L. Mensi5Scott M. Bruner5
- 1Biology Department, Woods Hole Oceanographic Institution, Woods Hole, MA, United States
- 2Northeast Fisheries Science Center, National Oceanic and Atmospheric Administration, Woods Hole, MA, United States
- 3United States Navy, Naval Facilities Engineering Command Atlantic, Norfolk, VA, United States
- 4Physical Oceanography Department, Woods Hole Oceanographic Institution, Woods Hole, MA, United States
- 5United States Navy, Naval Oceanographic Office, Stennis Space Center, Hancock County, MS, United States
Mitigating the effects of human activities on marine mammals often depends on monitoring animal occurrence over long time scales, large spatial scales, and in real time. Passive acoustics, particularly from autonomous vehicles, is a promising approach to meeting this need. We have previously developed the capability to record, detect, classify, and transmit to shore information about the tonal sounds of baleen whales in near real time from long-endurance ocean gliders. We have recently developed a protocol by which a human analyst reviews this information to determine the presence of marine mammals, and the results of this review are automatically posted to a publicly accessible website, sent directly to interested parties via email or text, and made available to stakeholders via a number of public and private digital applications. We evaluated the performance of this system during two 3.75-month Slocum glider deployments in the southwestern Gulf of Maine during the spring seasons of 2015 and 2016. Near real-time detections of humpback, fin, sei, and North Atlantic right whales were compared to detections of these species from simultaneously recorded audio. Data from another 2016 glider deployment in the same area were also used to compare results between three different analysts to determine repeatability of results both among and within analysts. False detection (occurrence) rates on daily time scales were 0% for all species. Daily missed detection rates ranged from 17 to 24%. Agreement between two trained novice analysts and an experienced analyst was greater than 95% for fin, sei, and right whales, while agreement was 83–89% for humpback whales owing to the more subjective process for detecting this species. Our results indicate that the presence of baleen whales can be accurately determined using information about tonal sounds transmitted in near real-time from Slocum gliders. The system is being used operationally to monitor baleen whales in United States, Canadian, and Chilean waters, and has been particularly useful for monitoring the critically endangered North Atlantic right whale throughout the northwestern Atlantic Ocean.
Introduction
Human activities in the ocean have the potential to impact marine mammals, and if we are to act as responsible stewards of the ocean, we must find a way to mitigate those impacts, particularly in cases where human activities pose an existential threat to one or more species (Laist et al., 2001; Kraus et al., 2005, 2016; Read, 2008; Tyack, 2008). Banning all human activities in the ocean is untenable, as human society depends on the ocean for transportation and resources (e.g. food), so mitigation efforts must balance the needs of industry and conservation, while acknowledging the strengths and limitations of our ability to monitor both human activities and the abundance or occurrence of marine mammals simultaneously (Verfuss et al., 2018). The latter is a challenge, particularly over long time scales, over large spatial scales, and in real time. Visual and passive acoustic surveys are typically applied to this challenge, and each has its own strengths and limitations (Clark et al., 2010). Visual surveys are adept at positively identifying species and estimating animal abundance, but are limited by daylight and weather (e.g. fog, rain, snow, and high winds). Passive acoustic surveys can monitor continuously for sounds produced by nearby marine mammals, often for long periods of time, but species identification can sometimes be difficult, and for most species, only occurrence can be assessed (density estimation is currently possible for a limited number of marine mammals that are obligate vocalizers using very careful study design, but may be possible in the future for facultative vocalizers if our understanding of call rate variability for these species is substantially improved).
Passive acoustic monitoring from moored archival recorders has been an important tool for marine mammal research for a few decades (e.g. Mellinger et al., 2007; Van Parijs et al., 2009; Davis et al., 2017; Charif et al., 2019). More recently, archival passive acoustic monitoring has been conducted from mobile autonomous platforms, including surface drifters, profiling floats, electric gliders, and surface autonomous vehicles (Moore et al., 2007; Baumgartner and Fratantoni, 2008; Bingham et al., 2012; Klinck et al., 2012; Matsumoto et al., 2013; Griffiths and Barlow, 2016; Bittencourt et al., 2018). These platforms have the capability to range over tens to thousands of kilometers, and often the platform is quiet enough to allow excellent passive acoustic monitoring, particularly at higher frequencies. For mobile platforms, flow and wave wash noise present unique challenges for detecting the low-frequency calls typically made by baleen whales (wave wash includes both breaking waves and waves slapping against the platform hull). Platforms that passively drift, such as profiling floats, avoid flow noise altogether, and can avoid wave wash noise by placing the hydrophone sufficiently far from the surface (e.g. mounted on a profiling float that remains mostly at depth); however, they cannot control their lateral movement and therefore cannot be navigated. Surface autonomous vehicles typically move relatively fast (e.g. >0.5 m s–1) and by definition have a component of the vehicle at the surface, so flow and wave wash noise are serious impediments to monitoring low audio frequencies (lead author’s personal observation). The electric glider represents a convenient compromise between these other platforms. It can move slowly enough (0.15–0.2 m s–1) that flow noise will not interfere with detecting low-frequency sounds, and it remains well below the surface much of the time so that wave wash is not an issue, yet it can be navigated over periods of weeks to months.
While archival passive acoustic recordings from autonomous vehicles have been useful for scientific applications (e.g. Baumgartner and Fratantoni, 2008), they are much less useful for mitigation applications because the audio recordings are not accessible to determine species presence until after recovery of the vehicle. Mitigation applications require real- or near real-time detections to immediately separate human activities from marine mammals in space or time. To date, near real-time passive acoustic systems have been developed for stationary installations, including moored buoys (Clark et al., 2005; Van Parijs et al., 2009; Baumgartner et al., 2019) and cabled hydrophones (André et al., 2011; Jarvis et al., 2014; Klinck et al., 2016). Klinck et al. (2012) describe a glider application for the detection and near real-time reporting of odontocetes, particularly beaked whales, and Matsumoto et al. (2013) used the same detection system to detect and report in near real time the clicks of Blainville’s beaked whales from profiling floats. The only near real-time passive acoustic system developed to detect the low-frequency calls of baleen whales from long-endurance autonomous vehicles that we are aware of was described by Baumgartner et al. (2013). That system consisted of a digital acoustic monitoring instrument (DMON; Johnson and Hurst, 2007) programed with the low-frequency detection and classification system (LFDCS; Baumgartner and Mussoline, 2011) installed in a Slocum glider, and it was capable of detecting the calls of humpback (Megaptera novaeangliae), sei (Balaenoptera borealis), fin (Balaenoptera physalus), and North Atlantic right whales (Eubalaena glacialis) in real time, and relaying information about those calls to shore every 2 h via the glider’s native Iridium satellite communication system.
Here, we evaluate the same system described by Baumgartner et al. (2013) (updated for the next generation of Slocum glider), but with a different approach to determining whale occurrence. Baumgartner et al. (2013) derived species-specific call rate thresholds from a logistic regression analysis of one glider dataset, and then applied those thresholds to a second independent glider dataset to automatically estimate occurrence from DMON/LFDCS call classification information. Over time scales of 15 min, this fully automated approach yielded false detection rates of 4, 23, and 0% and missed detection rates of 26, 62, and 27% for right, humpback, and fin whales, respectively (too little sei whale data were available to assess detector performance for this species). In this paper, we apply the human review methods described in Baumgartner et al. (2019) to evaluate DMON/LFDCS data relayed in near real time from Slocum gliders deployed in the southwestern Gulf of Maine during 2015 and 2016. We conducted this evaluation to determine if human review of detection information relayed in near real time could improve the accuracy of the system. We also compared the performance of three analysts reviewing the same glider dataset to understand between- and within-analyst variability in occurrence estimates after appropriate training to a formalized protocol. We believe these performance assessments are vital to our understanding of the strengths and limitations of near real-time passive acoustic monitoring systems for use in mitigation applications.
Materials and Methods
The Slocum glider (Teledyne Webb Research) is a long-endurance autonomous underwater vehicle that is powered by alkaline or lithium batteries and can carry a variety of sensors to observe the ocean environment (Rudnick et al., 2004; Schofield et al., 2007). The vehicle moves slowly (nominally 0.65 km h–1), but it can travel for weeks to months at a time covering hundreds to thousands of kilometers of survey track. The glider moves down and up in the water column by alternately becoming more and less dense than the surrounding water, respectively. It does this using a piston in the nose (called the buoyancy pump) to change its volume and therefore its density. Data from an integrated altimeter and depth sensor are used to determine when the glider should activate the buoyancy pump to descend or ascend. Short wings provide lift that propels the glider laterally, and an aft rudder and compass allow the vehicle to steer in a desired direction. Over the continental shelf, the glider typically descends to within several meters of the sea floor and ascends to within several meters of the sea surface repeatedly while steering toward a predetermined waypoint. At regular intervals (here every 2 h), the glider ascends to the surface where it acquires a position with a global positioning system (GPS) receiver and initiates a communication session with a shore-side server via Iridium satellite service. During the session, the glider sends engineering and science sensor data (including DMON data) and can receive new mission parameters and waypoints. At the end of the communication session, the glider resumes its descend/ascend sequence.
The DMON instrument Woods Hole Oceanographic Institution (WHOI) was integrated into the science bay of a Slocum glider model G2 for this study. The DMON has been described previously (Johnson and Hurst, 2007; Baumgartner et al., 2013, 2019) and was configured in an identical manner as in previous studies with one exception. Baumgartner et al. (2013) described the integration of the DMON in a Slocum glider model G1 where the hydrophones were mounted in an acoustically transparent urethane housing on the underside of the glider’s science bay; in the G2 configuration, the hydrophones were mounted in a urethane housing on the topside of the glider’s science bay (Figure 1).
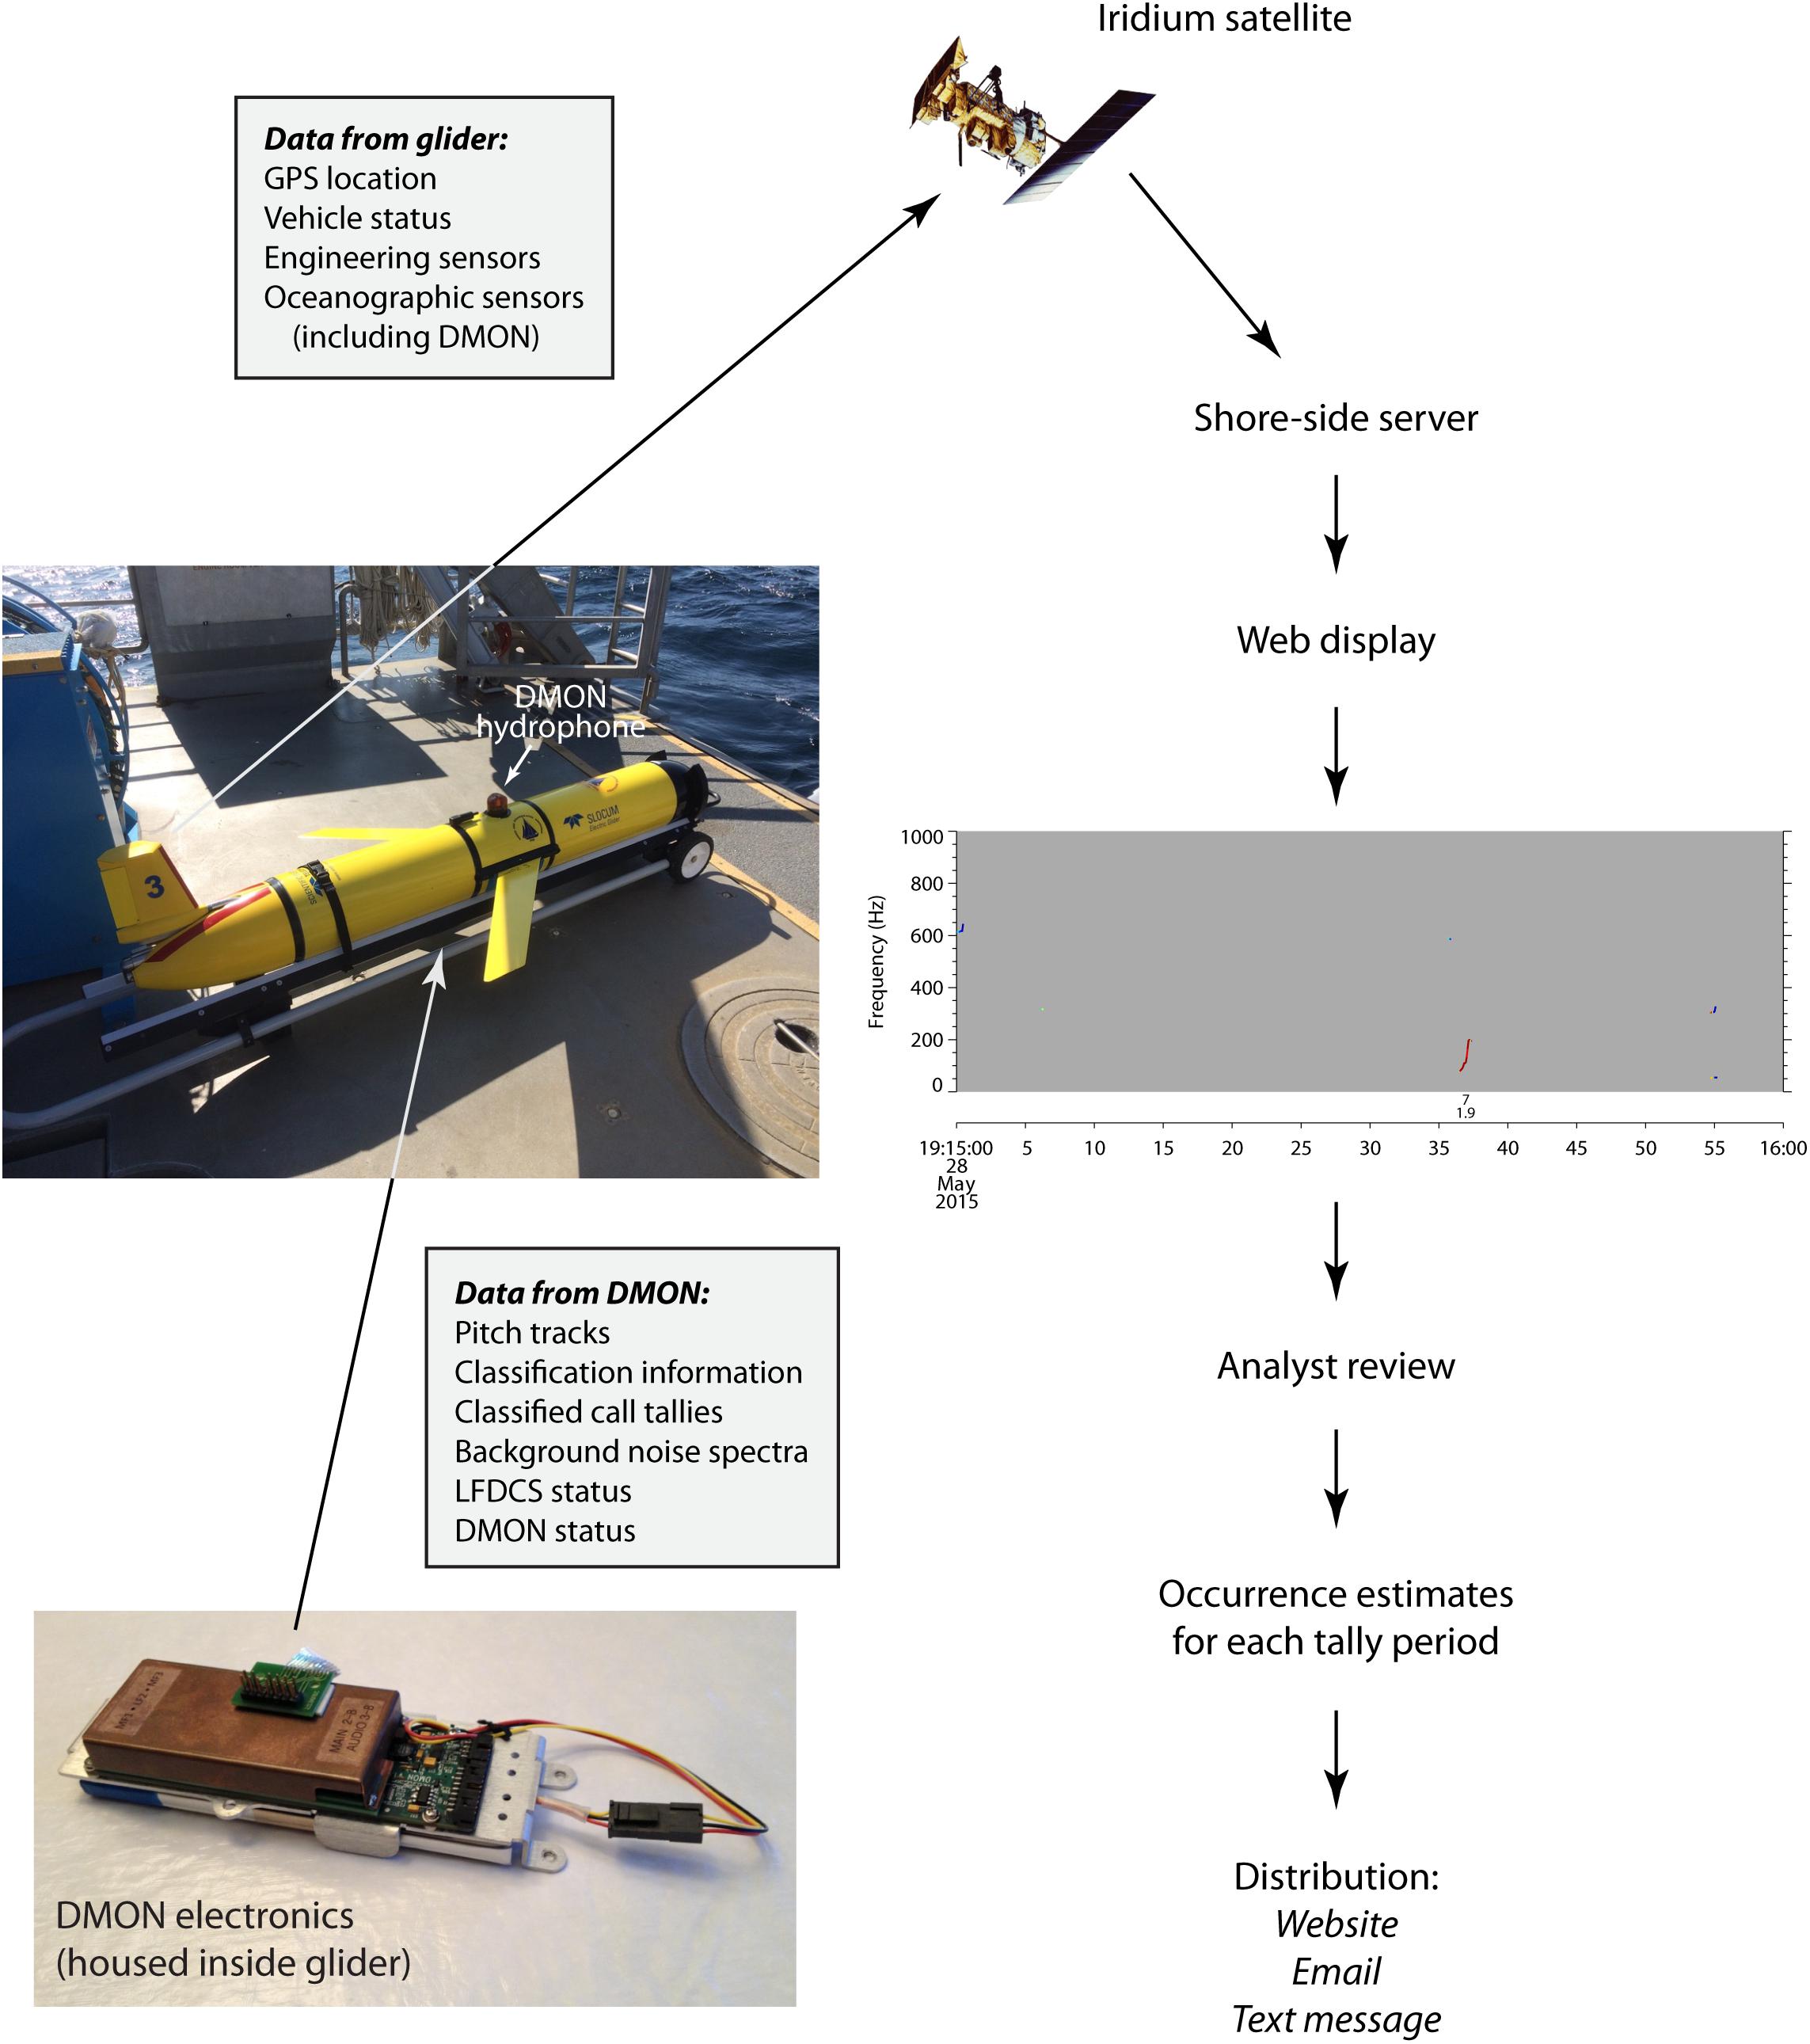
Figure 1. Diagram of data flow from the DMON integrated in a Slocum glider to a shore-side server via the Iridium satellite service. These data are displayed on a website (dcs.whoi.edu), and pitch tracks and classification information are reviewed by an analyst to produce species-specific occurrence estimates for each monitored tally period. Occurrence estimates are then distributed to users via the same publicly accessible website as well as email and text messages. Web display in the figure shows a pitch track of a single North Atlantic right whale upcall.
The DMON consists of a programmable digital signal processor (Texas Instruments TMS320C55), flash memory, and integrated hydrophones that allow the instrument to record and process audio. The DMON for this study was programed with the low-frequency detection and classification system (LFDCS; Baumgartner and Mussoline, 2011; Baumgartner et al., 2013), which continuously recorded and processed audio from the attached low-frequency hydrophone (WHOI custom-built end-capped cylinders with Navy type II ceramics, 8–7500 Hz bandwidth, 36 dB re μPa/√Hz noise floor at 2 kHz, and −169 dB re V/μPa sensitivity at 2 kHz). The LFDCS sampled and recorded audio at 2000 samples per second, created spectrograms in real time (512 sample frame, Hann window and 75% frame-to-frame overlap, resulting in a spectrogram frequency resolution of 3.9 Hz and a time step of 64 ms), equalized the spectrograms, and identified and characterized tonal sounds using a pitch tracking algorithm (Baumgartner and Mussoline, 2011). Pitch tracks were classified by comparing attributes of each pitch track to the multivariate distribution of those same attributes for a variety of call types in a call library using quadratic discriminant function analysis. Pitch tracks and their associated classification information were transferred from the DMON to the Slocum glider via serial communications, but the amount of pitch track data sent each hour was limited to 8 kilobytes (kB) to constrain the cost of sending the data and the time and cost of reviewing those data back on shore (see below). As mentioned above, the glider transferred these data to shore during Iridium satellite communication sessions once every 2 h.
For this study, the presence of species-specific calls was taken as evidence of the occurrence of one or more whales of that species. Upcalls, a frequency-modulated upsweep from ∼100 to 300 Hz (Schevill et al., 1962; Clark, 1982, 1983), were used to identify North Atlantic right whales, low-frequency downsweeps (34–82 Hz; Baumgartner et al., 2008) were used to identify sei whales, and 20-Hz pulses (17–25 Hz downsweeps; Watkins et al., 1987; Morano et al., 2012) were used to identify fin whales. Each of these species-specific calls had one or more call types in the LFDCS call library. No one call was used to identify humpback whales; instead, recognizable patterns of variable notes that comprise humpback whale song (e.g. Payne and McVay, 1971; D’Vincent et al., 1985; Clark and Clapham, 2004) were used to identify this species.
Near Real-Time Analysis
Pitch track data received from the glider by the shore-side server in near real time were immediately posted in graphical format on a publicly accessible website1 (Figure 1). An analyst reviewed these data using a protocol that was developed jointly by scientists at WHOI and the National Oceanic and Atmospheric Administration’s Northeast Fisheries Science Center (NEFSC), and is available at dcs.whoi.edu/#protocol. Details of the review process are described in Baumgartner et al. (2019). Briefly, pitch tracks from 15-min periods (called tally periods) were reviewed on a single web page where pitch tracks were displayed in stacked time-frequency plots (see time-frequency plot in Figure 1). The analyst considered the shape, amplitude, classification information and isolation from noise for each pitch track, as well as the context in which the pitch track occurred (i.e. pitch tracks in temporal proximity to a pitch track of interest) and any patterning in pitch tracks to determine if a pitch track was likely produced by a whale. Taking into account all of the information displayed in a 15-min tally period, the analyst scored the period as “detected,” “possibly detected,” or “not detected” for each of the monitored species (right, humpback, sei, or fin whale). A form on the pitch track webpage allowed the analyst to enter these scores as well as notes about what she/he had observed in the pitch tracks. For each species, a tally period was scored as “detected” when there was convincing evidence of a species’ acoustic presence, “possibly detected” when there was some evidence of acoustic presence, but the evidence was not completely convincing, or “not detected” when there was no reasonable evidence of a species’ acoustic presence (see Baumgartner et al., 2019 supporting information for further explanation). After the analyst’s review was complete, occurrence information for each of the monitored species was displayed on the website2 in tabular and graphical formats, sent directly to interested stakeholders by email or text, and was made available in several other applications, such as Whale Alert3, the United States Coast Guard’s CG1View situational awareness software, and WhaleMap4.
Post-recovery Audio Analysis
After recovery of a glider, the continuous audio recordings were downloaded from the DMON and reviewed by an experienced analyst. The analyst reviewed audio for all 15-min tally periods for which at least 3.75 min of pitch track data had been sent and reviewed in near real time (note that tally periods that contained large numbers of pitch tracks from whales or other sources may have only a few minutes of pitch track data for review in near real time because of the 8 kB hr–1 limit). The analyst visually reviewed spectrograms and aurally reviewed audio for each of these 15-min tally periods to determine if the monitored species were “detected,” “possibly detected,” or “not detected” depending on how convincing the evidence was. Audio from the entire 15-min tally period was considered when scoring, not just the period when pitch tracks were available (e.g. for a tally period that had 5 min of pitch track data available in near real time, the audio analysis considered the entire 15 min of audio recordings).
Evaluation of the Accuracy of Near Real-Time Occurrence Estimates
Confusion matrices were used to compare occurrence estimates derived in near real time to occurrence estimates derived from review of the audio, where the audio analysis was considered the “truth.” Only periods scored as either “detected,” or “not detected” in both the near real-time and audio analyses were assessed with the confusion matrices (periods scored as “possibly detected” in either the near real-time or audio analyses were assessed separately). Performance metrics were calculated from the confusion matrices. Confusion matrices and performance metrics are presented below for 15-min and daily time scales, where the 15-min time scale refers to the comparison of individual tally periods and the daily time scale refers to the comparison of tally periods aggregated over 1 day. Daily data aggregation involved scoring a day as (1) “detected” if at least one tally period that day was scored as “detected,” (2) “possibly detected” if no tally periods were scored as “detected” and at least one tally period was scored as “possibly detected,” or (3) “not detected” if none of the tally periods were scored as “detected” or “possibly detected” (i.e. all tally periods were scored as “not detected”). Correlation analysis of daily percentages of tally periods scored as “detected” for the near real-time and audio analyses was also conducted for each of the monitored species. Daily percentages were transformed using the arcsine square-root transform: (Sokal and Rohlf, 1995). Axes of transformed values were back-transformed into percentages for clarity in the figures.
Evaluation of Between- and Within-Analyst Variability in Occurrence Estimates
For one of the glider deployments, the near real-time review of pitch tracks and classification information was conducted by three different analysts. One of the analysts (JB.; hereafter referred to as the experienced analyst) had significant experience identifying species-specific calls in both audio and pitch track data. The other two analysts (CH and JBT; hereafter referred to as the novice analysts) had significant experience reviewing audio for whale occurrence, but no experience evaluating pitch tracks. The two novice analysts were trained by the experienced analyst and the lead author using the analyst protocol (available at dcs.whoi.edu/#protocol). One year after they conducted the near real-time review, all three analysts repeated their review without access to their original scores. The scores of the two novice analysts were compared with the experienced analyst to assess how well the training and protocol reduced disagreement among the analysts. For each analyst, the original scores were also compared to scores determined 1 year later to evaluate within-analyst variability in occurrence estimates. Agreement was defined as the percentage of tally periods for which the two analysts’ scores were identical, disagreement was defined as the percentage of tally periods for which the two analysts’ scores were different (equivalently computed as 100 minus agreement), and serious disagreement was defined as the percentage of tally periods for which one analyst’s score was “detected” and the other analyst’s score was “not detected” (i.e. serious disagreement ignored differences among analysts that involved a “possibly detected” score).
Results
A single glider owned and operated by WHOI was deployed during spring 2015 in the southwestern Gulf of Maine in an area known as the Great South Channel (Figure 2). The Great South Channel was chosen for the study because of the high occurrence of all 4 species monitored by the DMON/LFDCS during late spring. The glider conducted 3 sets of east-west survey transects across the channel between deployment on 11 April and recovery on 31 July (Figure 2). During 2016, this same glider conducted 2 sets of east-west survey transects after deployment on 13 April, but then conducted a survey of the northern edge of Georges Bank and Georges Basin before being recovered on 8 August (Figure 2). East-west transects were influenced by strong north-south tides in the region, hence the survey transects were often not straight lines. Also during 2016, a second glider owned and operated by the U.S. Naval Oceanographic Office (NAVOCEANO) was equipped with a DMON and deployed on 13 April to conduct 1 set of east-west survey transects in the Great South Channel before recovery on 13 May. The DMON on the NAVOCEANO glider was not permitted to record audio, but sent pitch tracks to shore in near real time via Iridium satellite communications. Results of the 2015 and 2016 WHOI glider deployments were combined to evaluate the accuracy of near real-time occurrence estimates of right, humpback, sei and fin whales using audio simultaneously recorded by the DMON, while the 2016 NAVOCEANO glider deployment was used to evaluate between- and within-analyst variability in occurrence estimates.
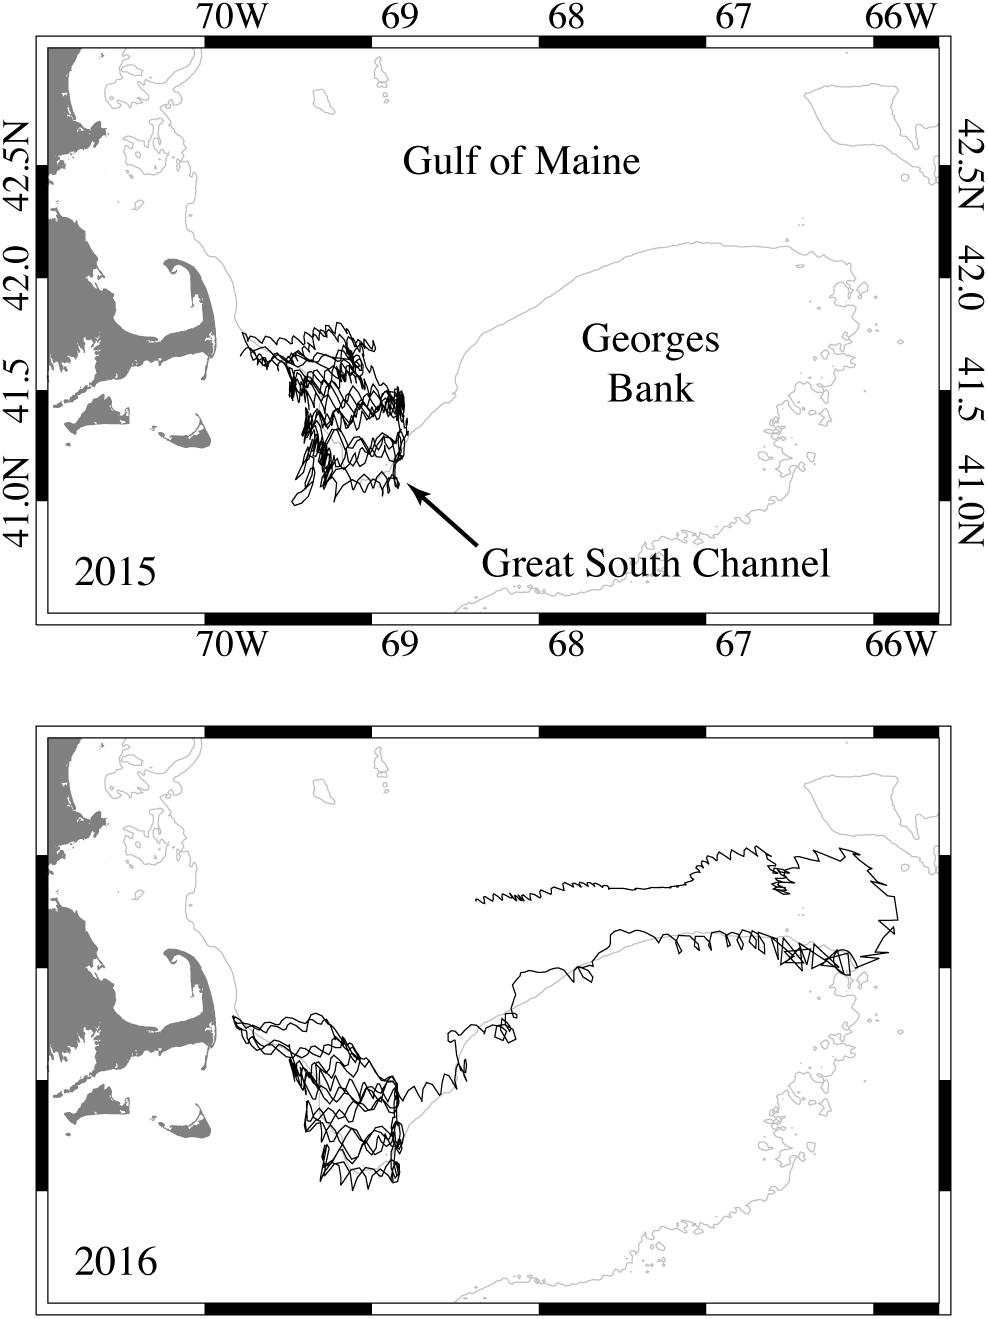
Figure 2. Track of the WHOI Slocum glider in the southwestern Gulf of Maine off the coast of Cape Cod, Massachusetts during 2015 and 2016. The 50-fathom isobath is shown in gray.
During the 112-day 2015 WHOI glider mission, 2,095,986 pitch tracks were generated by the DMON/LFDCS of which 412,980 (19.7%) were transmitted to shore. A total of 4,527 tally periods were analyzed in near real time, and audio analysis was conducted on 3,349 of those tally periods. The audio analysis focused on tally periods between 11 April and 31 July 2015 for which 3.75 min or more of pitch track data were analyzed in near real time. During the 118-day 2016 WHOI glider deployment, 2,196,583 pitch tracks were generated by the DMON/LFDCS of which 356,267 (16.2%) were transmitted to shore. A total of 4,974 tally periods were analyzed in near real time, and audio analysis was conducted on 2,072 of those tally periods. The audio analysis focused on tally periods between 25 April and 1 July 2016 for which 3.75 min or more of pitch track data were analyzed in near real time. During the 31-day 2016 NAVOCEANO glider deployment, 98,062 pitch tracks were generated by the DMON/LFDCS and transmitted to shore. The three analysts (1 experienced and 2 novice) analyzed 714 tally periods in near real time over the course of the entire glider deployment (13 April to 13 May), and repeated their analysis 1 year later. During the repeat analysis, an additional 185 tally periods were reviewed that were not available in near real time because of complications in data transfer from the NAVOCEANO Iridium server to WHOI’s web processing system; thus, 899 tally periods were reviewed during the repeat analysis.
All 4 monitored species were detected during the WHOI glider surveys (Figures 3, 4, and Table 1). Right whales had the lowest occurrence; only 68 tally periods were scored as “detected” on 28 separate days during the audio analysis (Table 1). Humpback whales, in contrast, had the highest occurrence, with 1,731 tally periods being scored as “detected” (32% of all 5,421 analyzed tally periods) on 149 separate days during the audio analysis. Sei whales were detected during 1,060 tally periods (101 separate days), while fin whales were detected during 1,071 tally periods (135 separate days) of the audio analysis.
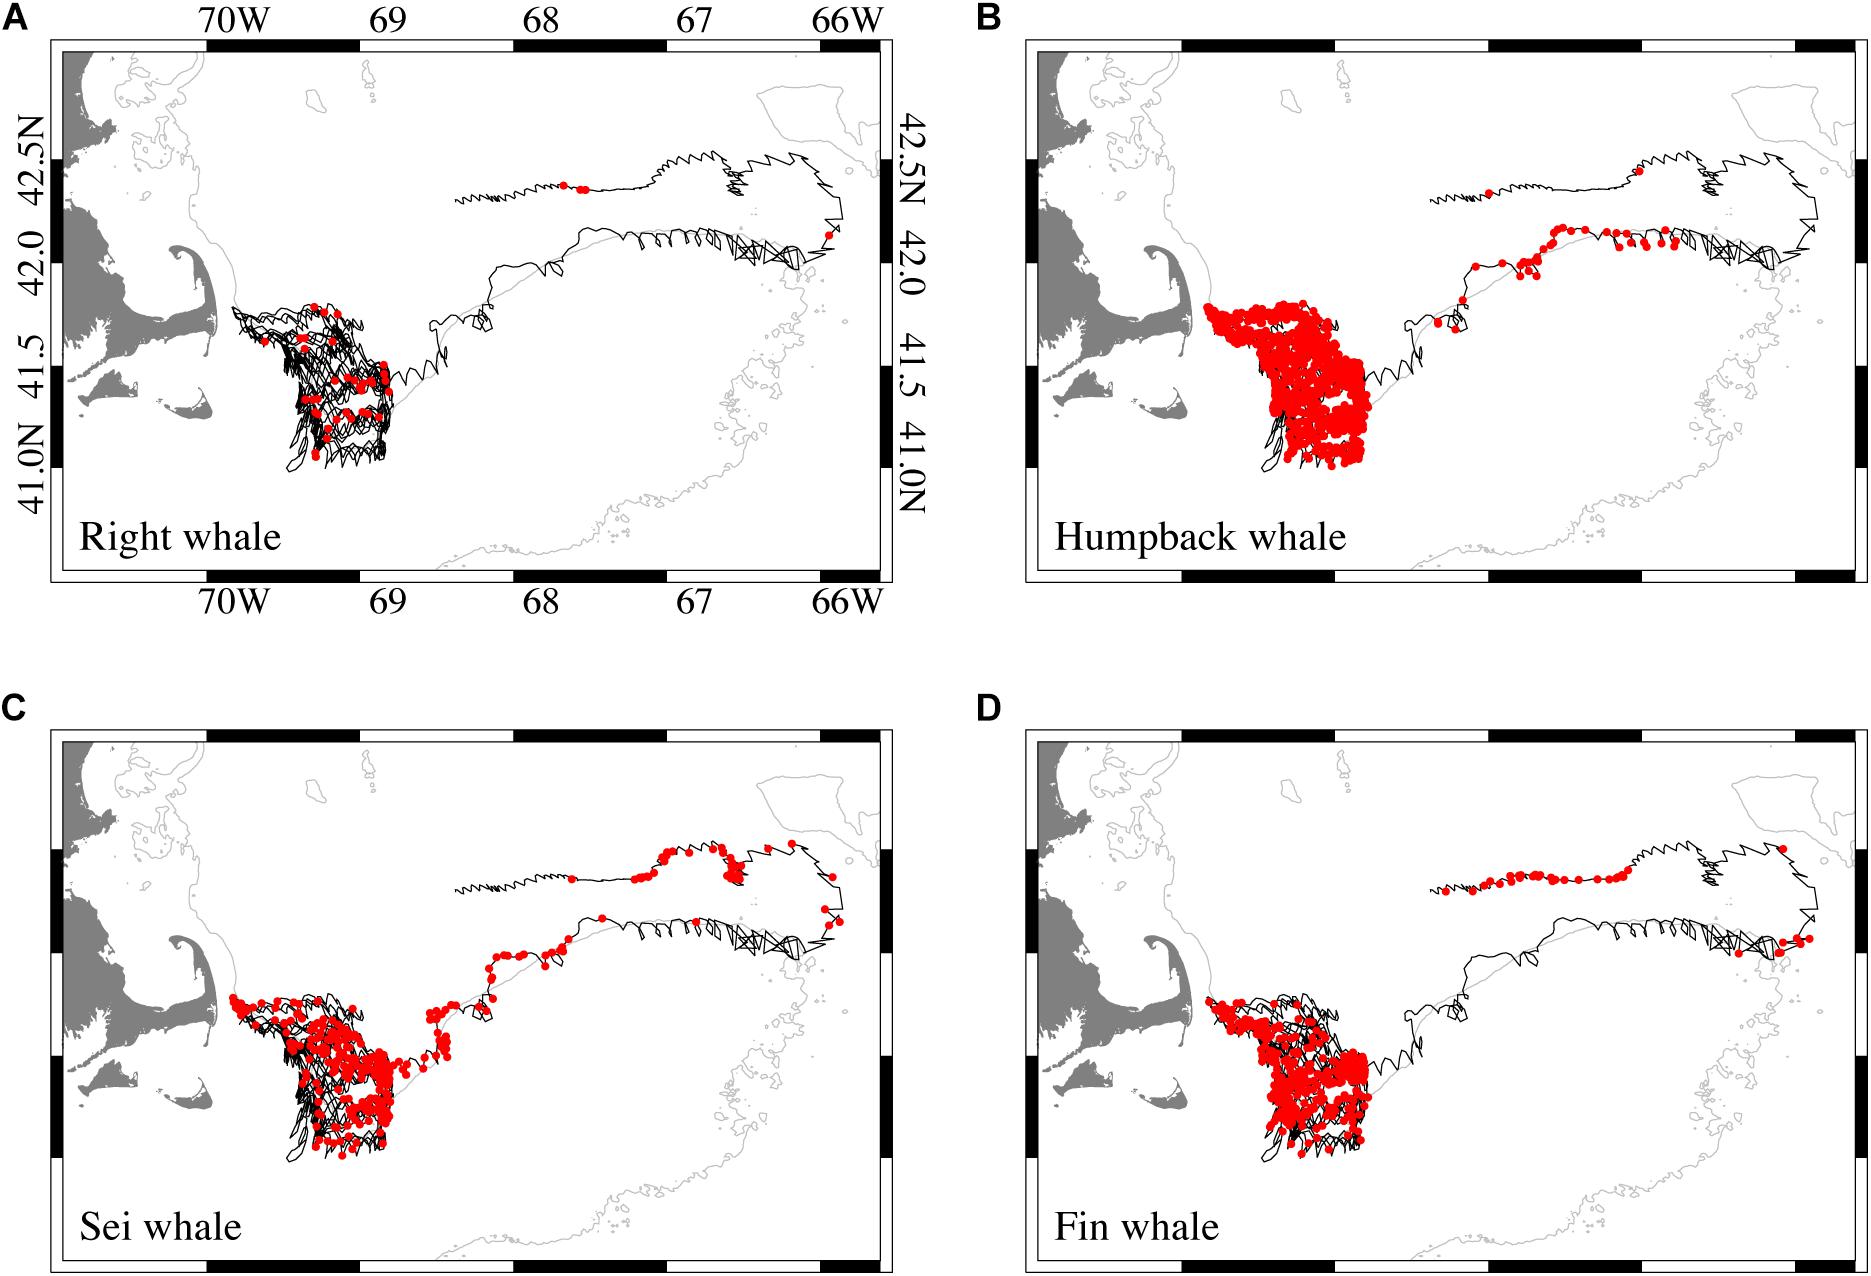
Figure 3. Track of the WHOI Slocum glider during 2015 and 2016 combined (black) and locations of the glider when (A) right, (B) humpback, (C) sei, and (D) fin whales were scored as “detected” (red filled circles). The 50-fathom isobath is shown in gray.
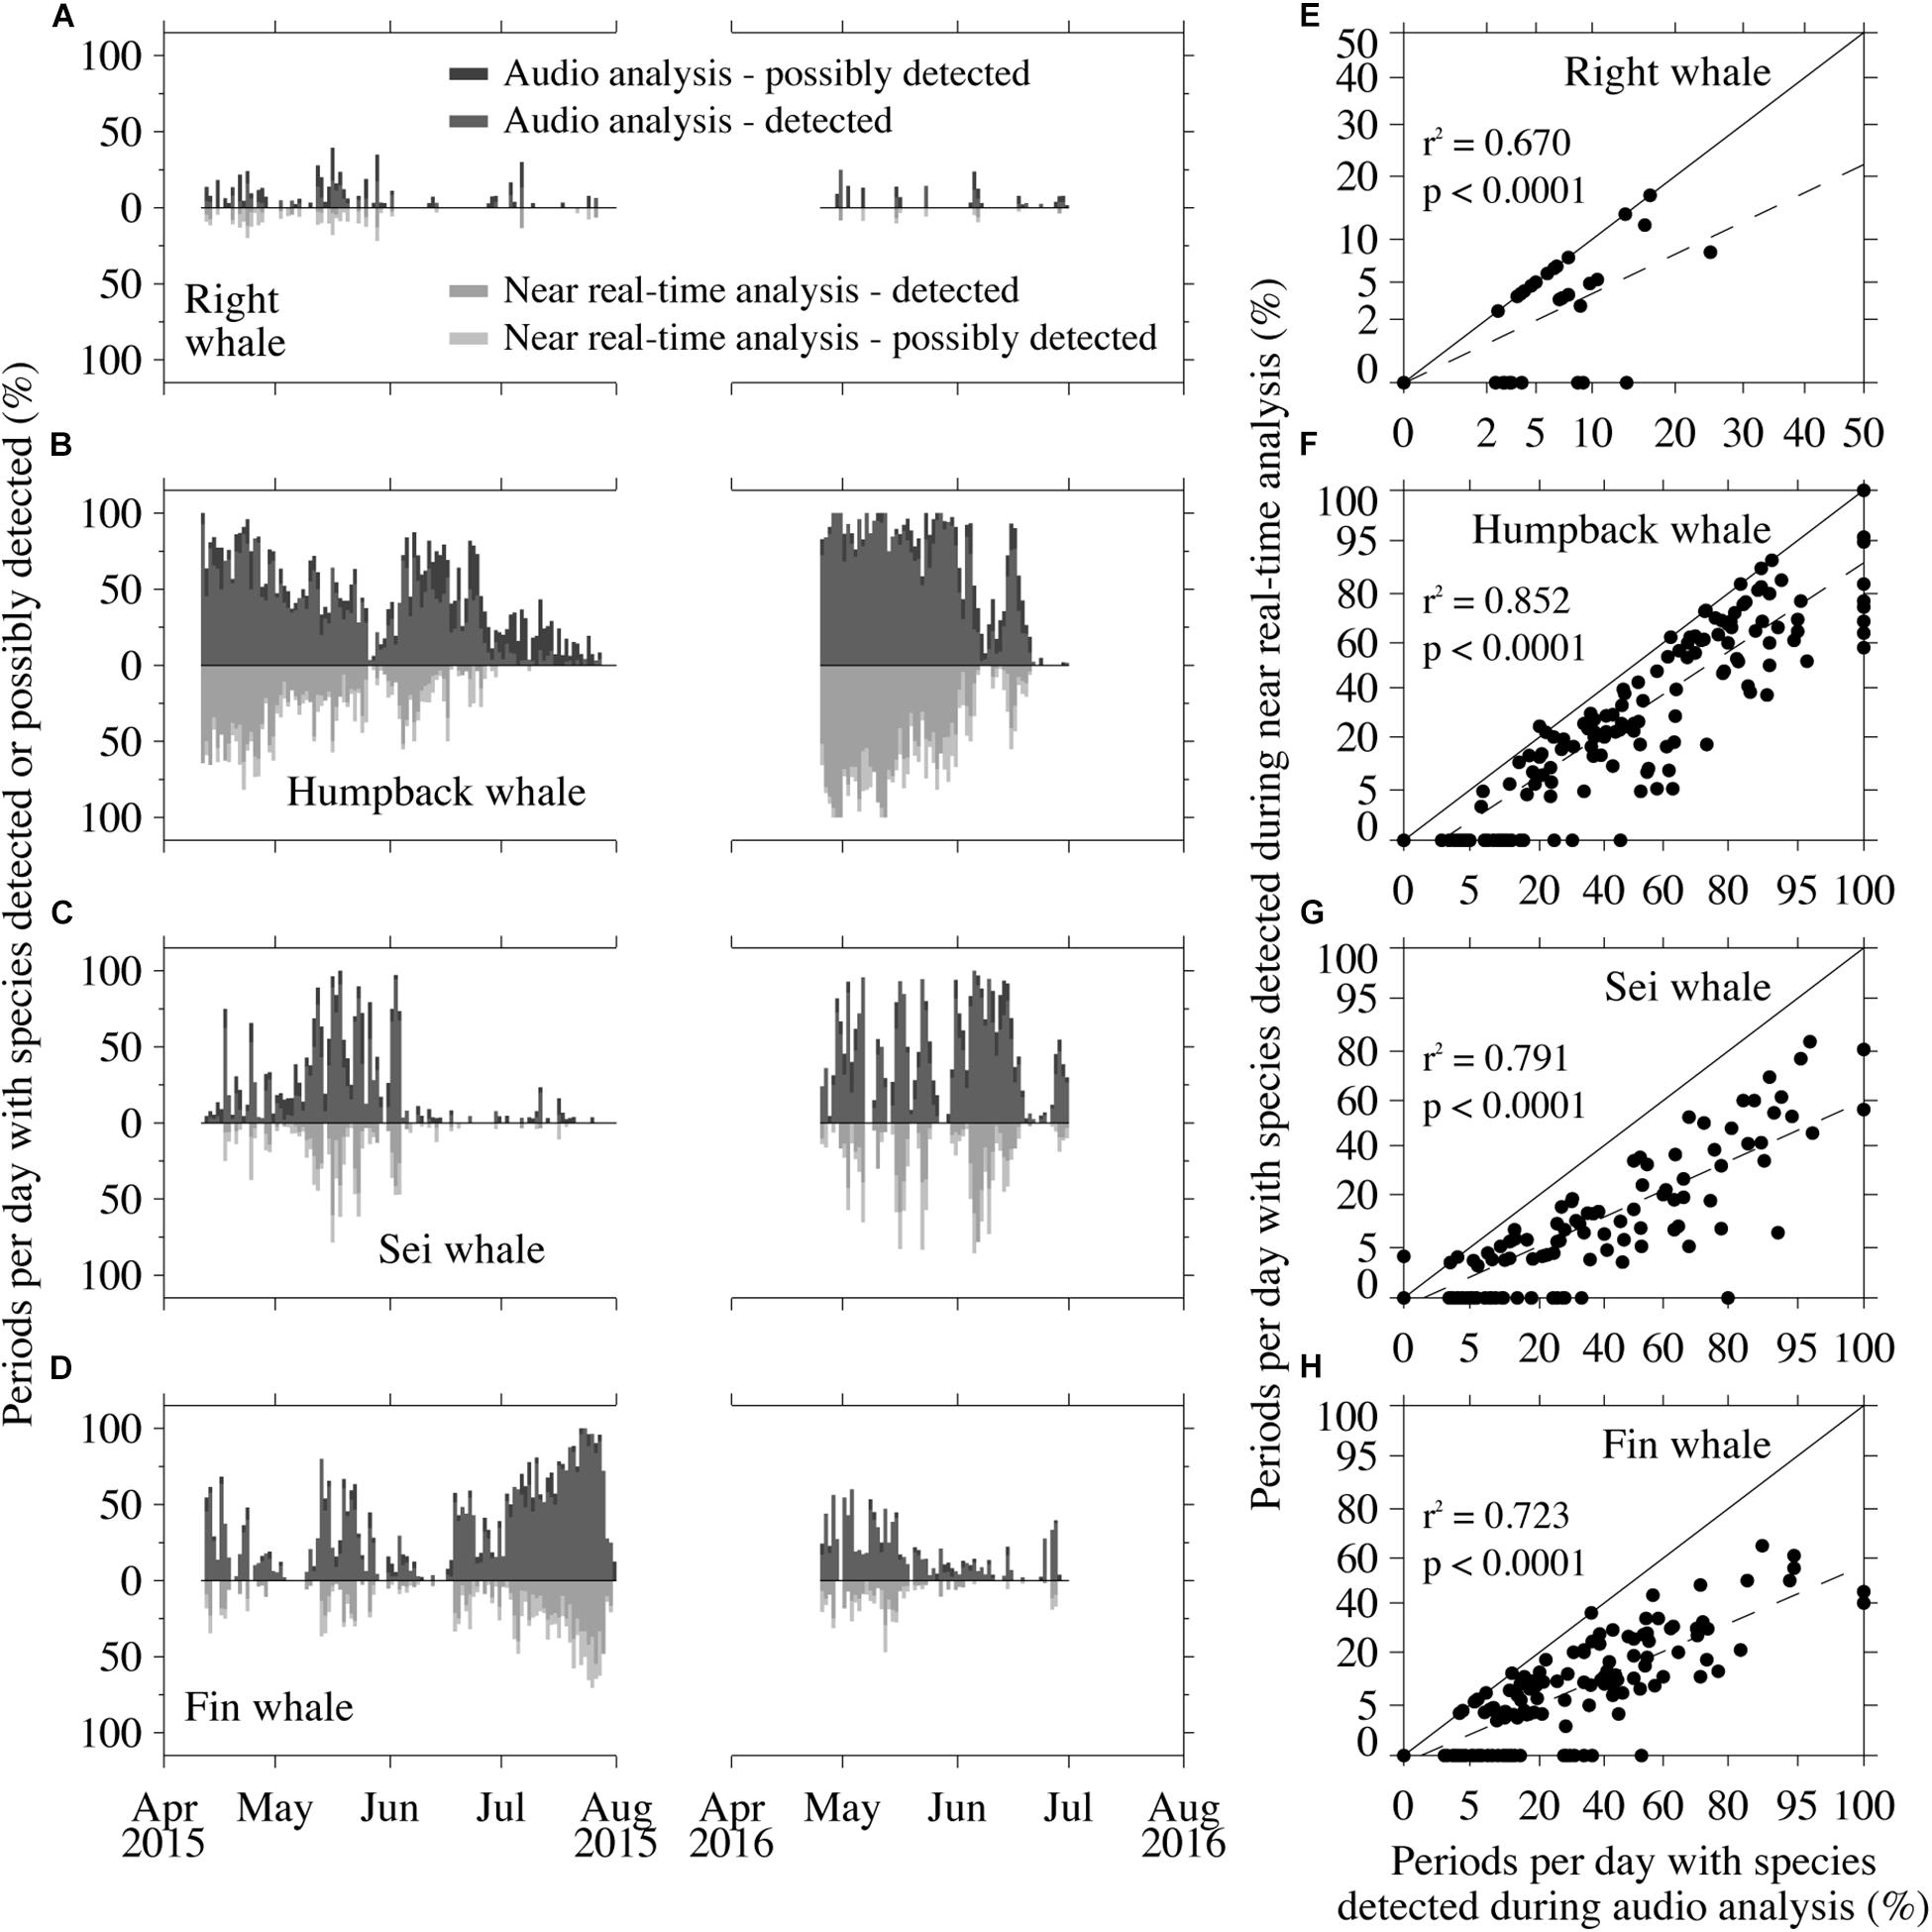
Figure 4. Time series of daily detections derived from the retrospective audio analysis (above zero line) and daily detections derived from the near real-time analysis (below zero line) for (A) right, (B) humpback, (C) sei, and (D) fin whales. Detections and possible detections are shown for both analyses. Scatterplots of near real-time versus retrospective audio detections for (E) right, (F) humpback, (G) sei, and (H) fin whales. Coefficients of determination (r2) and associated p values are shown as well as a 1:1 line (solid) and simple linear regression line (dashed).
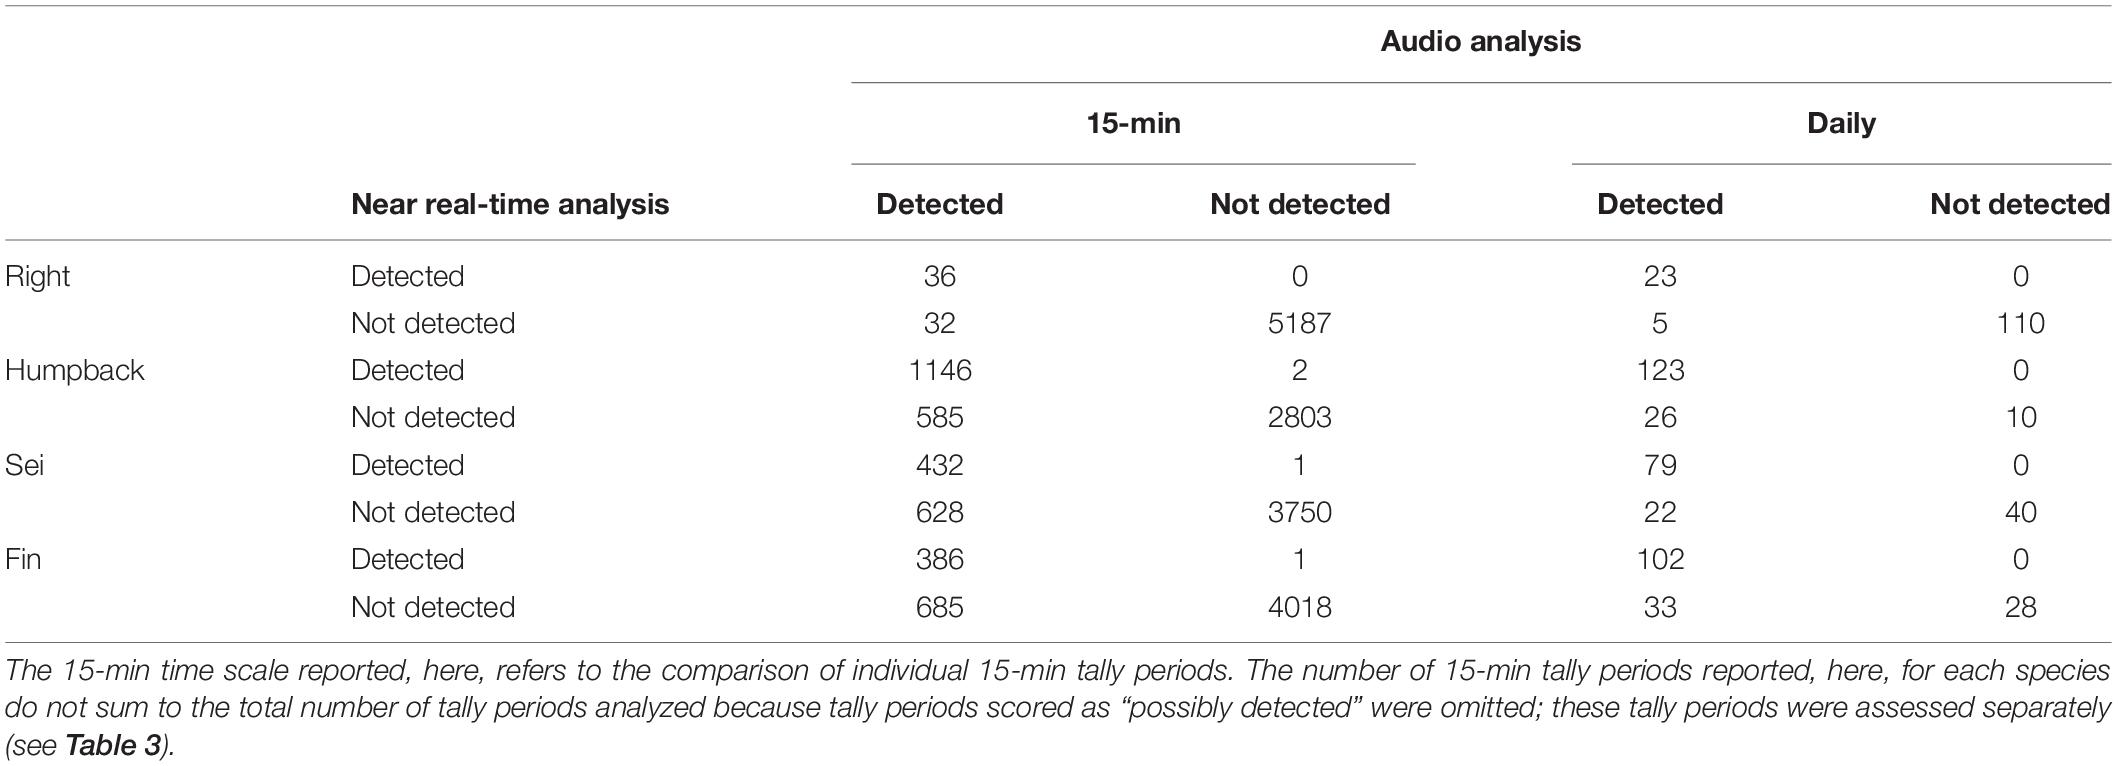
Table 1. Confusion matrices comparing near real-time analysis to audio analysis for right, humpback, sei, and fin whales over 15-min and daily time scales.
Evaluation of the Accuracy of Near Real-Time Occurrence Estimates
Using the 2015 and 2016 WHOI glider deployments combined, near real-time occurrence estimates had low false detection rates for all species on both 15-min and daily time scales when using occurrence estimates from the audio analysis as the “truth” (Tables 1, 2). False detection rates were less than 0.3% on 15-min time scales, and were 0% on daily time scales. Missed detection rates ranged from 34 to 64% on 15-min time scales and 17 to 24% on daily time scales (Table 2). For humpback, sei, and fin whales, tally periods scored as “possibly detected” in near real time were most often scored as “detected” in the audio analysis (Table 3), suggesting that the analyst erred on the side of missing true detections rather than scoring false detections (as encouraged by the analyst protocol). For right whales, tally periods scored as “possibly detected” in near real time were nearly equally likely to be scored as “detected,” “possibly detected,” or “not detected” in the audio analysis (Table 3).
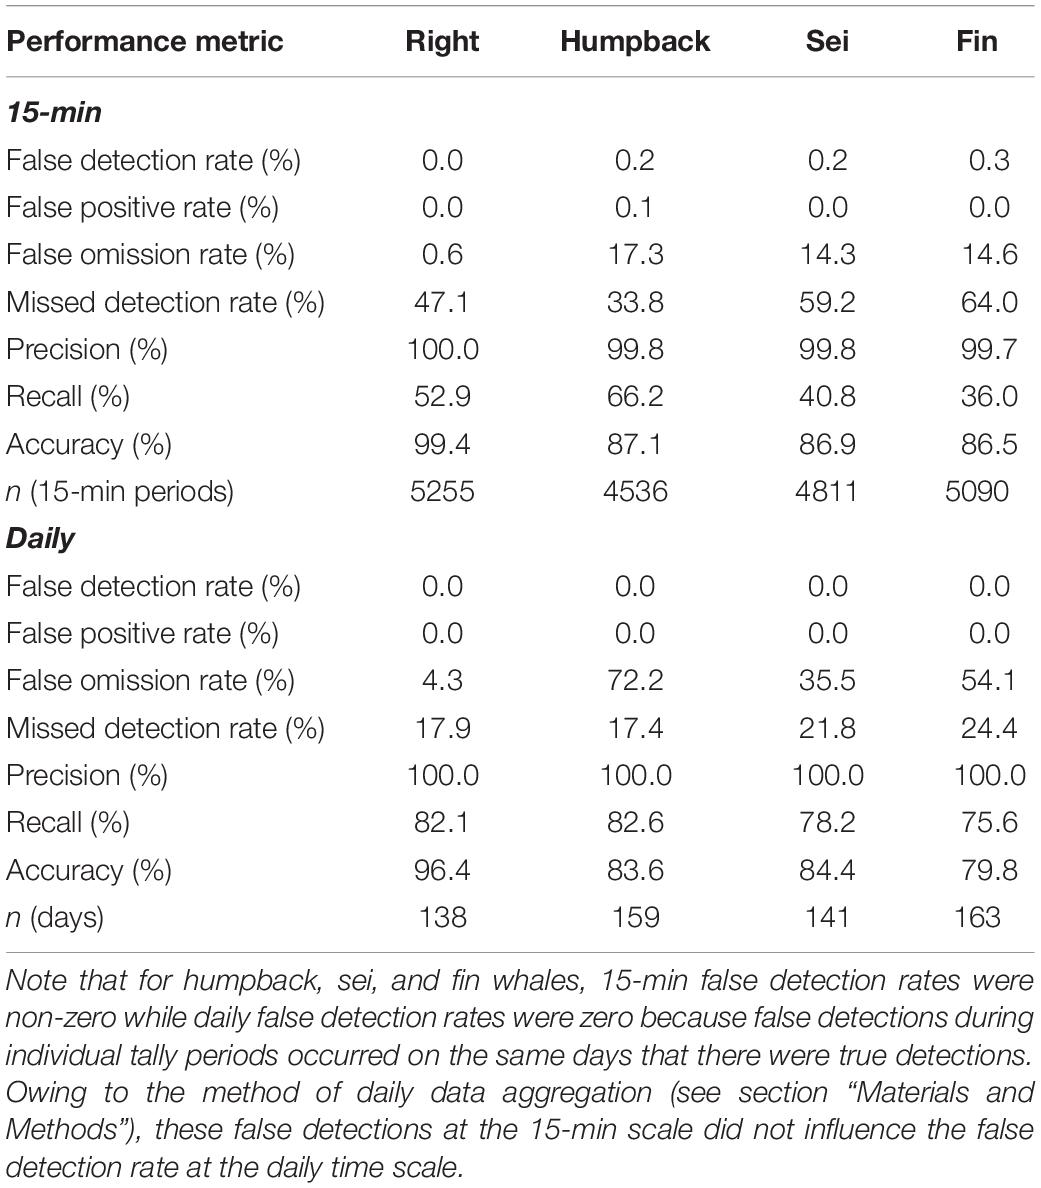
Table 2. Performance metrics for the near real-time analysis (when treating the audio analysis as the “truth”) over 15-min and daily time scales for right, humpback, sei, and fin whales based on the confusion matrices in Table 1.
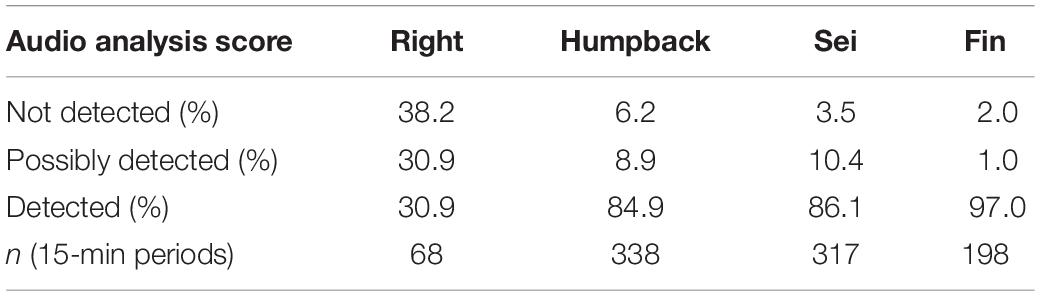
Table 3. Audio analysis scores for 15-min tally periods scored as “possibly detected” in near real time.
Temporal variability in near real-time detections mirrored that from the audio analysis for all species, but there tended to be fewer detections per day in near real time than in the audio analysis (Figures 4A–D). Scatterplots of daily percentages of detections (Figures 4E–H) confirm this observation with regression slopes that were less than 1. Daily near real-time detections of all species were strongly related to detections from the audio analysis (p < 0.0001 for all species).
Evaluation of Between- and Within-Analyst Variability in Occurrence Estimates
Using the 2016 NAVOCEANO glider deployment, agreement between the novice analysts and the experienced analyst was very high for right, sei, and fin whales; agreement was greater than 95% for these species and serious disagreement was less than 1.4% (Table 4). It is important to note that there were no right whale detections by the experienced analyst for the NAVOCEANO glider in 2016, a year of low right whale occurrence in the Great South Channel (there was only 1 right whale detection on the WHOI glider in the Great South Channel prior to 13 May, the date the NAVOCEANO glider was recovered). Agreement was lower for humpback whales, ranging from 83 to 89%, while serious disagreement for humpback whales was substantially higher than for the other species, ranging from 3.6 to 5.9% (Table 4). The analysts’ original scores largely matched their scores determined 1 year later (Table 5). The experienced analyst had higher within-analyst agreement, but the novice analysts’ agreement was still excellent, particularly for right, sei, and fin whales (within-analyst agreement for the novices was 96.5% or greater). As with the between-analyst comparisons, within-analyst comparisons showed lower agreement for humpback whales (agreement ranged from 87 to 94%, and serious disagreement ranged from 0.5 to 1.5%).
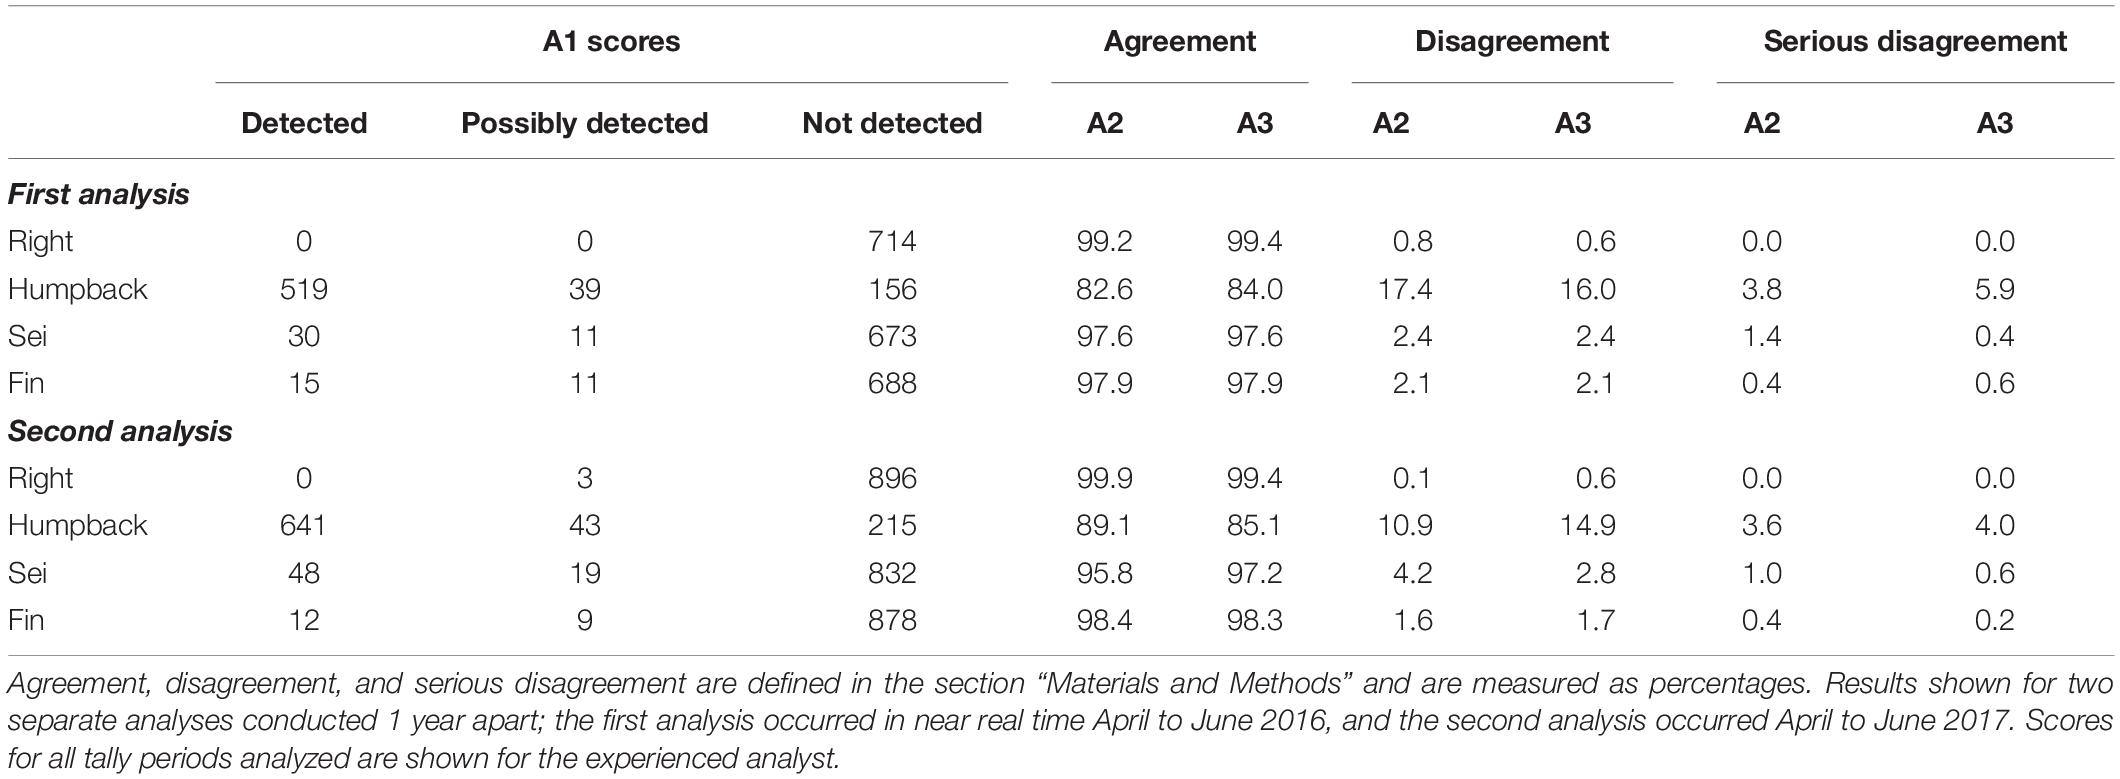
Table 4. Between-analyst agreement, disagreement, and serious disagreement for two novice analysts (A2 and A3) compared to an experienced analyst (A1).
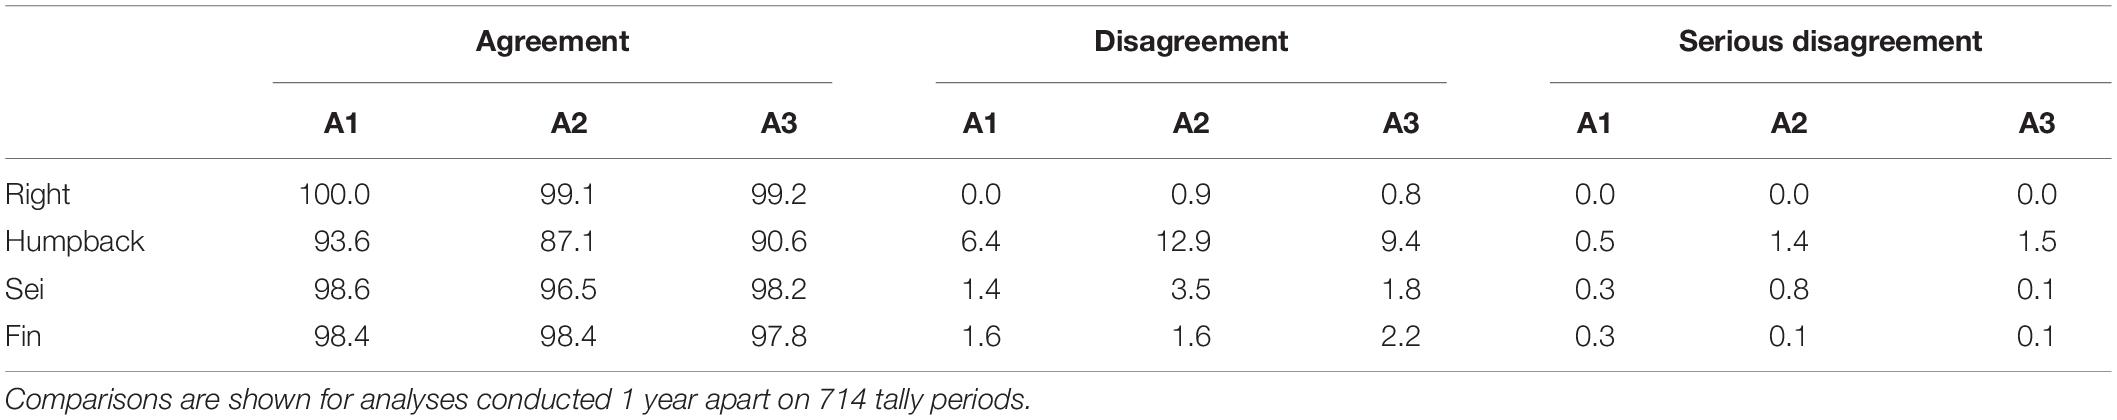
Table 5. Within-analyst agreement, disagreement, and serious disagreement (%) for one experienced (A1) and two novice analysts (A2 and A3).
Discussion
The Slocum gliders used in this study were able to successfully conduct surveys in a tidally energetic region for nearly 4 months at a time while detecting humpback, sei, fin, and North Atlantic right whales. False detection rates were extremely low for all 4 monitored species on both 15-min and daily time scales. Missed detection rates ranged from 34–64% on 15-min time scales and 17–24% on daily time scales. Compared to the automated method to estimate occurrence based on classified call counts described in Baumgartner et al. (2013), the human-review used here (after Baumgartner et al., 2019) yielded lower false detection rates for right and humpback whales, while fin whale false detection rates were equivalent (sei whales could not be evaluated by Baumgartner et al., 2013). Missed detection rates were higher for right and fin whales during the human review, but lower for humpback whales. It is important to note that these performance statistics are derived from separate glider datasets (one in the northern Gulf of Maine in November and December 2012 and one in the southwestern Gulf of Maine during April–June 2015 and 2016), so it is very possible that the noise environment and interfering sounds were quite different between the two studies. Despite differences in the underlying datasets, these results suggest that false detection rates can be improved substantially with a human review of pitch tracks, perhaps at the cost of higher missed detections (as observed for right and fin whales).
A human review of pitch tracks was used by Baumgartner et al. (2019) to assess the performance of a moored buoy equipped with a DMON/LFDCS that sent detection information to shore every 2 h via Iridium satellite. An identical human review of pitch tracks using the same protocol was used in the present study; in fact, the same experienced analyst conducted the human review for both studies. False detection rates were extremely low (≤0.3%) for both the Slocum glider and the moored buoy at 15-min time scales (Table 6), and were 0% for both platforms on daily time scales. Missed detections varied by species between the platforms: missed detections on 15-min time scales were comparable between platforms for right and sei whales, lower on the glider for humpbacks, and lower on the buoy for fin whales. At daily time scales, missed detections were lower on the glider for right, humpback, and sei whales, but lower on the buoy for fin whales. Baumgartner et al. (2019) examined the reasons for missed detections on the moored DMON/LFDCS buoy and determined that low calling rates, data limitation (i.e. the 8 kB h–1 limit on transmitted pitch tracks), low amplitude calls, and interfering sounds contributed to missed occurrence. Both the glider and the buoy are subject to the same data limitation, so this should not contribute to the differences in missed call rates. It is likely that the variation in missed detections between the platforms may have more to do with differences in whale abundance and distribution around the platform at the two study sites, which would affect both calling rates and received amplitude. Missed detections can vary over time with the number of whales present, distance of the whales from the platform, whale calling behavior, and interfering noise, factors that have little to do with the platform and more to do with the study area or chance. Collocating the platforms would be a better study design for comparing differences in detection performance; the comparison, here, may be too confounded by variability in factors that are unrelated to the platforms themselves.
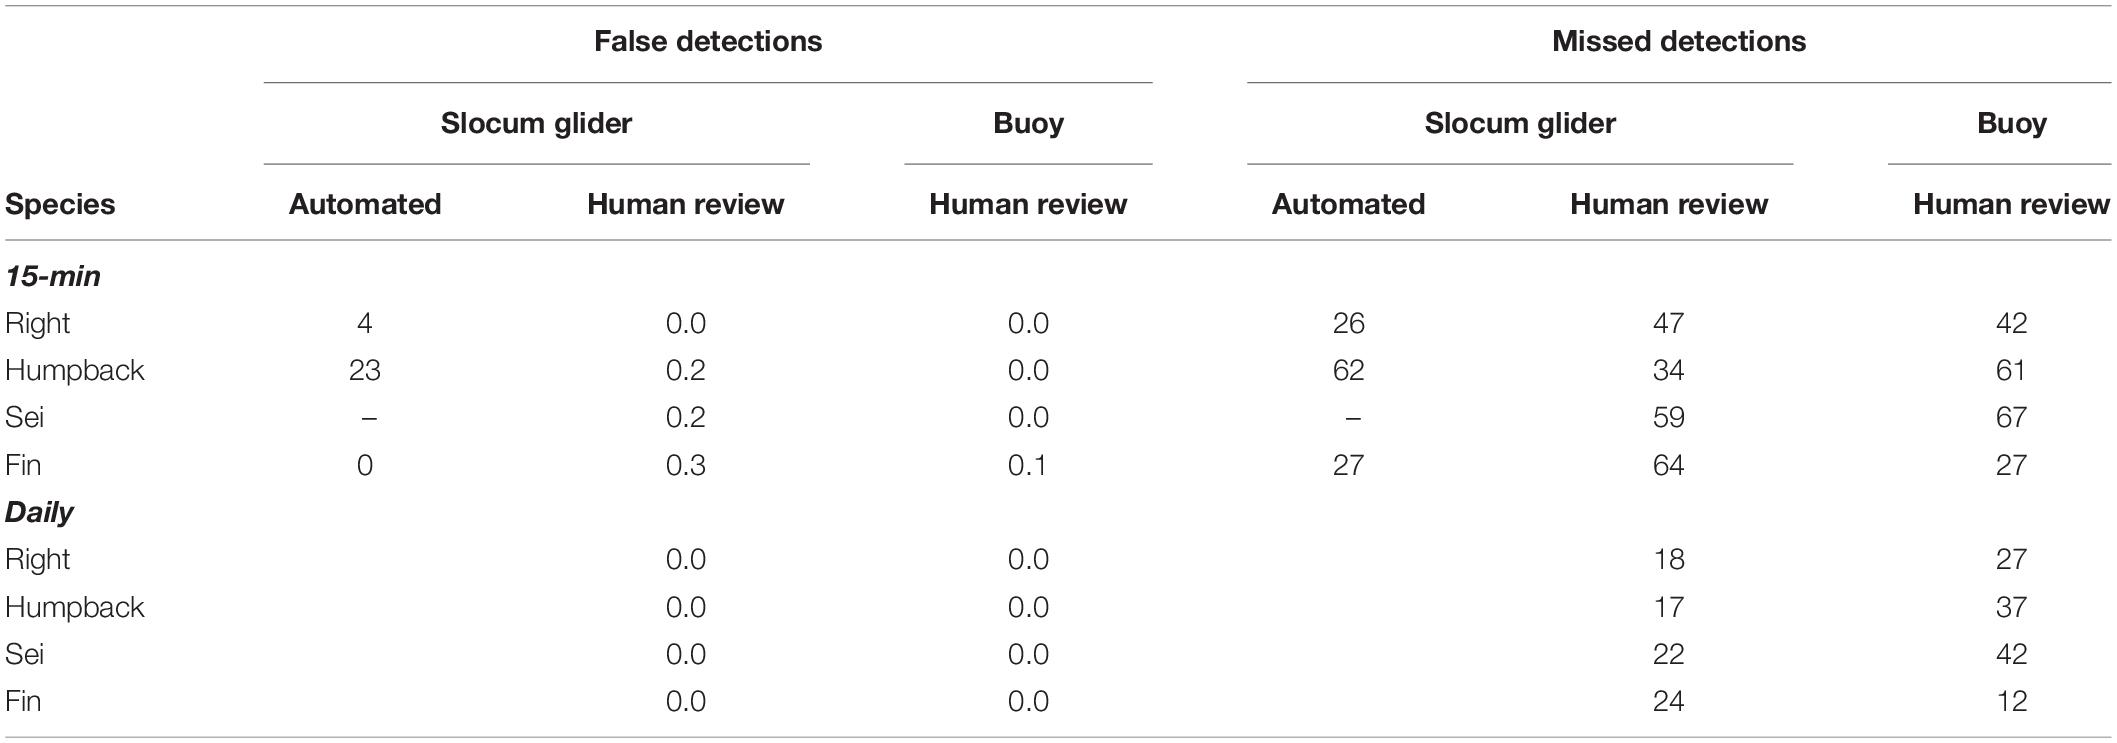
Table 6. Comparison of false and missed detection (occurrence) rates over 15-min time scales for a glider-mounted DMON/LFDCS using an automated detection method (data from Baumgartner et al., 2013) and a human review of pitch tracks (this study), as well as a moored DMON/LFDCS using a human review of pitch tracks (data from Baumgartner et al., 2019).
One of the challenges of detecting North Atlantic right whales with passive acoustics is that humpback whales often make an upsweep call that is very similar to the right whale upcall (e.g. Mussoline et al., 2012; Hodge et al., 2015; Charif et al., 2019). Despite very high humpback whale calling rates in the Great South Channel (Figure 4), right whale false detection rates were 0% on 15-min and daily time scales. The reason for such low false detection rates is that the analyst can evaluate the context in which low-frequency upsweeps are made (i.e. the sounds detected before and after a call of interest). The protocol urges the analyst to treat upsweeps that are accompanied by other pitch tracks attributable to humpback whales with skepticism and only consider upsweeps as coming from right whales if there is strong evidence to suggest the upsweeps are a different amplitude than the surrounding calls or are “off rhythm” (i.e. out of temporal sequence) with a known pattern of humpback whale calls (i.e. song notes).
Agreement among the three analysts reviewing the same set of detections was excellent for all species, particularly right, sei, and fin whales (Table 4). It is important to note that the evaluation of between- and within-analyst variability in occurrence estimates for right whales was incomplete because no right whales were detected during the 2016 NAVOCEANO glider deployment. We contend that having a documented protocol and using that protocol to train novice analysts was responsible for such strong agreement among the analysts. Agreement was lower for humpback whales, which reflects the greater subjectivity involved in identifying the varied calls that make up their song. In contrast to humpback whales, right, sei, and fin whales all have much more stereotypical calls for which the DMON/LFDCS can provide useful classification information, making identification more (but not completely) objective. There was also lower agreement for humpback whales than there was for right, sei, and fin whales for the same analyst reviewing the same dataset on two occasions 1 year apart (Table 5). Nevertheless, the analysts showed remarkable consistency in their scores after the 1-year interval, suggesting that the protocol effectively reduced both between- and within-analyst variability in occurrence estimates. This was encouraging, as it suggests that analysts with experience conducting aural reviews of audio and visual reviews of associated spectrograms can be trained over the course of only a few days to accurately review pitch track data as well. Moreover, it suggests that analysts can be “calibrated” with the protocol to produce the same results so that, for example, two analysts can conduct near real-time analysis on the same platform at different times (e.g. one analyst takes over reviewing data while the other is on vacation), and the detection process will remain consistent.
To date, Slocum gliders equipped with the DMON/LFDCS have been used for over 50 separate missions in the United States, Canada, and Chile. Deployments on the United States and Canadian east coasts have focused on right whale monitoring to provide scientists and managers information on distribution and occurrence in near real time. These observations have been used to direct aerial and shipboard surveys to whale locations to collect behavioral observations and photographs that are later used for individual identification and population estimation using mark-recapture methods (e.g. Pace et al., 2017). The United States government will soon use right whale passive acoustic detections to trigger dynamic management areas designed to reroute or slow ships in the vicinity of right whales on a voluntary basis to reduce ship strikes, and near real-time glider-based right whale detections will likely be an important data source for this management effort. Slocum gliders with the DMON/LFDCS have also been used to monitor bowhead, killer, beluga, humpback, and fin whales as well as bearded seals in the Chukchi Sea in the United States Arctic annually since 2013 (Baumgartner et al., 2014), and blue, humpback, and sei whales in the waters of northern Patagonia, Chile during 2018 and 2019 (unpublished data). The performance statistics reported, here, demonstrate that gliders are excellent platforms for near real-time passive acoustic monitoring of baleen whales, and that the technology has moved beyond the research and development phase and is now a viable operational tool for many monitoring and mitigation applications.
Data Availability Statement
The datasets generated for this study are available on request to the corresponding author.
Author Contributions
MB, SV, PC, and CH conceived the study. BH and SB prepared the WHOI and NAVOCEANO gliders, respectively. BH deployed all of the gliders and recovered the 2015 WHOI glider. MB oversaw all fieldwork, piloted the WHOI glider and recovered the 2016 WHOI and NAVOCEANO gliders, analyzed the data, and led the writing of the manuscript. BM oversaw piloting of the NAVOCEANO glider. SV and PC coordinated NOAA vessel access. SV and CH deftly managed grant funds and fund transfers among institutions. JuB reviewed all near real-time detection data and archived audio. CH and JaB analyzed the NAVOCEANO glider detection data. All authors contributed critically to the drafts and gave final approval for publication.
Funding
Funding for this project was provided by the Environmental Security Technology Certification Program of the U.S. Department of Defense and the U.S. Navy’s Living Marine Resources Program.
Conflict of Interest
The authors declare that the research was conducted in the absence of any commercial or financial relationships that could be construed as a potential conflict of interest.
Acknowledgments
We are grateful for programmatic and technical assistance from Jerry Townsend and Danielle Bryant (NAVOCEANO) as well as critical engineering support from Keenan Ball, Jim Partan, and Tom Hurst (WHOI). We are also grateful to Mark and Tom Leach of the R/V Sea Holly for deployment of all gliders in 2015 and 2016 and recovery of the 2015 WHOI glider. We thank the captains and crew of the NOAA Ship Gordon Gunter and R/V Tioga for recovery of the NAVOCEANO and WHOI gliders in 2016, respectively. This manuscript was improved by constructive suggestions offered by two journal reviewers.
Footnotes
References
André, M., van der Schaar, M., Zaugg, S., Houégnigan, L., Sánchez, A. M., and Castell, J. V. (2011). Listening to the deep: live monitoring of ocean noise and cetacean acoustic signals. Mar. Pollut. Bull. 63, 18–26. doi: 10.1016/j.marpolbul.2011.04.038
Baumgartner, M. F., Bonnell, J., Van Parijs, S. M., Corkeron, P. J., Hotchkin, C., Ball, K., et al. (2019). Persistent near real-time passive acoustic monitoring for baleen whales from a moored buoy: system description and evaluation. Methods Ecol Evol. 10, 1476–1489. doi: 10.1111/2041-210X.13244
Baumgartner, M. F., and Fratantoni, D. M. (2008). Diel periodicity in both sei whale vocalization rates and the vertical migration of their copepod prey observed from ocean gliders. Limnol. Oceanogr. 53, 2197–2209. doi: 10.4319/lo.2008.53.5_part_2.2197
Baumgartner, M. F., Fratantoni, D. M., Hurst, T. P., Brown, M. W., Cole, T., Van Parijs, S. M., et al. (2013). Real-time reporting of baleen whale passive acoustic detections from ocean gliders. J. Acoust. Soc. Am. 134, 1814–1823. doi: 10.1121/1.4816406
Baumgartner, M. F., and Mussoline, S. E. (2011). A generalized baleen whale call detection and classification system. J,. Acoust. Soc. Am. 129, 2889–2902. doi: 10.1121/1.3562166
Baumgartner, M. F., Stafford, K. M., Winsor, P., Statscewich, H., and Fratantoni, D. M. (2014). Glider-based passive acoustic monitoring in the Arctic. Mar. Technol. Soc. J. 40, 40–51. doi: 10.4031/mtsj.48.5.2
Baumgartner, M. F., Van Parijs, S. M., Wenzel, F. W., Tremblay, C. J., Esch, H. C., and Warde, A. M. (2008). Low frequency vocalizations attributed to sei whales (Balaenoptera borealis). J.Acoust. Soc. Am. 124, 1339–1349. doi: 10.1121/1.2945155
Bingham, B., Kraus, N., Howe, B., Freitag, L., Ball, K., Koski, P., et al. (2012). Passive and active acoustics using an autonomous wave glider. J. Field Rob. 29, 911–923. doi: 10.1002/rob.21424
Bittencourt, L., Soares-Filho, W., Seabra de Lima, I. M., Pai, S., Lailson-Brito, J. Jr., Barreira, L. M., et al. (2018). Mapping cetacean sounds using a passive acoustic monitoring system towed by an autonomous wave glider in the Southwestern Atlantic Ocean. Deep Sea Res. Part I 142, 58–68. doi: 10.1016/j.dsr.2018.10.006
Charif, R. A., Shiu, Y., Muirhead, C. A., Clark, C. W., Parks, S. E., and Rice, A. N. (2019). Phenological changes in North Atlantic right whale habitat use in Massachusetts Bay. Glob. Change Biol. 26, 734–745. doi: 10.1111/gcb.14867
Clark, C. W. (1982). The acoustic repertoire of the southern right whale, a quantitative analysis. Anim. Behav. 30, 1060–1071. doi: 10.1016/s0003-3472(82)80196-6
Clark, C. W. (1983). “Acoustic communication and behavior of the southern right whale,” in Behavior and Communication of Whales, ed. R. S. Payne, (Boulder, CO: Westview Press), 163–198.
Clark, C. W., Brown, M. W., and Corkeron, P. (2010). Visual and acoustic surveys for North Atlantic right whales, Eubalaena glacialis, in Cape Cod Bay, Massachusetts, 2001–2005: management implications. Mar. Mamm. Sci. 26, 837–854. doi: 10.1111/j.1748-7692.2010.00376.x
Clark, C. W., Calupca, T., Gillespie, D., von der Heydt, K., and Kemp, J. (2005). A near-real-time acoustic detection and reporting system for endangered species in critical habitats. J. Acoust. Soc.Am. 117:2525. doi: 10.1121/1.4788382
Clark, C. W., and Clapham, P. J. (2004). Acoustic monitoring on a humpback whale (Megaptera novaeangliae) feeding ground shows continual singing into late spring. Proc. R. Soc. Lon.Ser. B 271, 1051–1057. doi: 10.1098/rspb.2004.2699
Davis, G. E., Baumgartner, M. F., Bonnell, J. M., Bell, J., Berchok, C., Bort, J., et al. (2017). Long-term passive acoustic recordings track the changing distribution of North Atlantic right whales (Eubalaena glacialis) from 2004 to 2014. Sci. Rep. 7:13460. doi: 10.1038/s41598-017-13359-3
D’Vincent, C. G., Nilson, R. M., and Hanna, R. E. (1985). Vocalization and coordinated feeding behavior of the humpback whale in southeastern Alaska. Sci. Rep. Whales Res. Inst. 36, 11–47.
Griffiths, E. T., and Barlow, J. (2016). Cetacean acoustic detections from free-floating vertical hydrophone arrays in the southern California current. J. Acoust. Soc. Am. 140:EL399. doi: 10.1121/1.4967012
Hodge, K. B., Muirhead, C. A., Morano, J. L., Clark, C. W., and Rice, A. N. (2015). North Atlantic right whale occurrence in two wind planning areas along the mid-Atlantic U. S. coast: implications for management. Endanger. Species Res. 28, 225–234. doi: 10.3354/esr00683
Jarvis, S. M., Morrissey, R. P., Moretti, D. J., DiMarzio, N. A., and Shaffer, J. A. (2014). Marine mammal monitoring on navy ranges (M3R): a toolset for automated detection, localization, and monitoring of marine mammals in open ocean environments. Mar. Technol. Soc. J. 48, 5–20. doi: 10.4031/mtsj.48.1.1
Johnson, M., and Hurst, T. (2007). “The DMON: an open-hardware/open-software passive acoustic detector,” in 3rd International Workshop on the Detection and Classification of Marine Mammals using Passive Acoustics, Boston, MA.
Klinck, H., Kinderman, L., and Boebel, O. (2016). “PALAOA: The Perennial Acoustic Observatory in the Antarctic Ocean—Real-Time Eavesdropping on the Antarctic Underwater Soundscape,” in Listening in the Ocean, Modern Acoustics and Signal Processing, eds W. Au and M. Lammers, (New York, NY: Springer), 207–219. doi: 10.1007/978-1-4939-3176-7_8
Klinck, H., Mellinger, D. K., Klinck, K., Bogue, N. M., Luby, J. C., Jump, W. A., et al. (2012). Near-real-time acoustic monitoring of beaked whales and other cetaceans using a Seaglider. PLoS One 7:e036128. doi: 10.1371/journal.pone.0036128
Kraus, S. D., Brown, M. W., Caswell, H., Clark, C. W., Fujiwara, M., Hamilton, P. K., et al. (2005). North Atlantic right whales in crisis. Science 309, 561–562. doi: 10.1126/science.1111200
Kraus, S. D., Kenney, R. D., Mayo, C. A., McLellan, W. A., Moore, M. J., and Nowacek, D. P. (2016). Recent scientific publications cast doubt on North Atlantic Right Whale future. Front. Mar. Sci. 3:137. doi: 10.3389/fmars.2016.00137
Laist, D. W., Knowlton, A. R., Mead, J. G., Collet, A. S., and Podesta, M. (2001). Collisions between ships and whales. Mar. Mamm. Sci. 17, 35–75. doi: 10.1111/j.1748-7692.2001.tb00980.x
Matsumoto, H., Jones, C., Klinck, H., Mellinger, D. K., Dziak, R. P., and Meinig, C. (2013). Tracking beaked whales with a passive acoustic profiler float. J. Acoust. Soc. Am. 133, 731–740. doi: 10.1121/1.4773260
Mellinger, D. K., Stafford, K. M., Moore, S. E., Dziak, R. P., and Matsumoto, H. (2007). An overview of fixed passive acoustic observation methods for cetaceans. Oceanography 20, 36–45. doi: 10.5670/oceanog.2007.03
Moore, S. E., Howe, B. M., Stafford, K. M., and Boyd, M. L. (2007). Including whale call detection in standard ocean measurements: application of acoustic Seagliders. Mar. Technol. Soc. J. 41, 53–57. doi: 10.4031/002533207787442033
Morano, J. L., Salisbury, D. P., Rice, A. N., Conklin, K. L., Falk, K. L., and Clark, C. W. (2012). Seasonal and geographical patterns of fin whale song in the western North Atlantic Ocean. J. Acous. Soc. Am. 132, 1207–1212. doi: 10.1121/1.4730890
Mussoline, S. E., Risch, D., Hatch, L. T., Weinrich, M. T., Wiley, D. N., Thompson, M. A., et al. (2012). Seasonal and diel variation in North Atlantic right whale up-calls: implications for management and conservation in the northwestern Atlantic Ocean. Endanger. Species Res. 17, 17–26. doi: 10.3354/esr00411
Pace, R. M., Corkeron, P. J., and Kraus, S. D. (2017). State-space mark-recapture estimates reveal a recent decline in abundance of North Atlantic right whales. Ecol. Evol. 7, 8730–8741. doi: 10.1002/ece3.3406
Payne, R., and McVay, S. (1971). Songs of humpback whales. Science 173, 585–597. doi: 10.1126/science.173.3997.585
Read, A. J. (2008). The looming crisis: interactions between marine mammals and fisheries. J. Mammal. 89, 541–548. doi: 10.1644/07-mamm-s-315r1.1
Rudnick, D. L., Davis, R. E., Eriksen, C. C., Fratantoni, D. M., and Perry, M. J. (2004). Underwater gliders for ocean research. Mar. Technol Soc. J. 38, 48–59.
Schevill, W. E., Backus, R. H., and Hersey, J. B. (1962). “Sound production by marine animals,” in Bioacoustics, ed. M. N. Hill, (New York, NY: Wiley), 540–566.
Schofield, O., Kohut, J., Aragon, D., Creed, L., Graver, J., Haldeman, C., et al. (2007). Slocum gliders: robust and ready. J. Field Rob. 24, 473–485. doi: 10.1002/rob.20200
Tyack, P. L. (2008). Implications for marine mammals of large-scale changes in the marine acoustic environment. J. Mammal. 89, 549–558. doi: 10.1644/07-mamm-s-307r.1
Van Parijs, S. M., Clark, C. W., Sousa-Lima, R. S., Parks, S. E., Rankin, S., Risch, D., et al. (2009). Management and research applications of real-time and archival passive acoustic sensors over varying temporal and spatial scales. Mar. Ecol. Prog. Ser. 395, 21–36. doi: 10.3354/meps08123
Verfuss, U. K., Gillespie, D., Gordon, J., Marques, T. A., Miller, B., Plunkett, R., et al. (2018). Comparing methods suitable for monitoring marine mammals in low visibility conditions during seismic surveys. Mar. Pollut. Bull. 126, 1–18. doi: 10.1016/j.marpolbul.2017.10.034
Keywords: whale, detection, glider, autonomous, mitigation, marine mammal
Citation: Baumgartner MF, Bonnell J, Corkeron PJ, Van Parijs SM, Hotchkin C, Hodges BA, Bort Thornton J, Mensi BL and Bruner SM (2020) Slocum Gliders Provide Accurate Near Real-Time Estimates of Baleen Whale Presence From Human-Reviewed Passive Acoustic Detection Information. Front. Mar. Sci. 7:100. doi: 10.3389/fmars.2020.00100
Received: 03 October 2019; Accepted: 07 February 2020;
Published: 25 February 2020.
Edited by:
Lars Bejder, University of Hawai‘i at Mānoa, United StatesReviewed by:
Brian S. Miller, Australian Antarctic Division, AustraliaChristopher W. Clark, Cornell University, United States
Copyright © 2020 Baumgartner, Bonnell, Corkeron, Van Parijs, Hotchkin, Hodges, Bort Thornton, Mensi and Bruner. This is an open-access article distributed under the terms of the Creative Commons Attribution License (CC BY). The use, distribution or reproduction in other forums is permitted, provided the original author(s) and the copyright owner(s) are credited and that the original publication in this journal is cited, in accordance with accepted academic practice. No use, distribution or reproduction is permitted which does not comply with these terms.
*Correspondence: Mark F. Baumgartner, bWJhdW1nYXJ0bmVyQHdob2kuZWR1