 Shane W. Geange
 Ashley A. Rowden
 Simon Nicol
 Tiffany Bock5
- 1Department of Conservation, Wellington, New Zealand
- 2National Institute of Water and Atmospheric Research, Wellington, New Zealand
- 3School of Biological Sciences, Victoria University of Wellington, Wellington, New Zealand
- 4Institute for Applied Ecology, University of Canberra, Bruce, ACT, Australia
- 5Fisheries New Zealand, Ministry for Primary Industries, Wellington, New Zealand
The United Nations General Assembly has called for the adoption of conservation management measures to protect vulnerable marine ecosystems (VMEs) from significant adverse impacts outside of areas of national jurisdiction. In response, many regional fisheries management organizations (RFMOs) have implemented move-on rules triggered by encounter threshold levels for the biomass of VME indicator taxa retained as bycatch. However, due to uncertainty of the relationships between catch, catch efficiency and the in situ biomass of VME indicator taxa, move-on rules alone may not be enough to prevent significant adverse impacts on VMEs. Although spatial management measures present one possible solution to these concerns, a lack of empirical data on the distribution of VMEs within the high seas means spatial management is often informed by model predictions of the spatial distribution of VME indicator taxa. Given the uncertainty associated with predicted distributions, move-on rules can provide immediate responses when spatial management measures may not be providing the expected conservation benefits. Using bycatch data from 9,771 New Zealand bottom trawls within the South Pacific RFMO Convention Area, we illustrate a data-informed approach for selecting high move-on encounter thresholds that may suggest the predicted distributions of VME taxa used to underpin spatial management are highly inaccurate. The reasoning that high thresholds act as a safeguard against uncertainty in the performance of spatial management measures requires untested assumptions regarding the level of permissible bycatch before further management action is required, with the acceptance of those assumptions a management decision balancing the sensitivity of the move-on rule with uncertainty regarding the effectives of the spatial management measures. Additional work is required to support these management decisions, including the determination of taxa-specific catchability estimates, and the seafloor density/biomass of VME indicator taxa that represents a VME. Obtaining this information will allow for the identification of encounter thresholds that are more ecologically meaningful. In the interim, the choice of thresholds should be re-evaluated as more experience with their application is gathered.
Introduction
Based on growing concern about the risks to vulnerable marine ecosystems from fishing activities, the 2005 United Nations General Assembly (UNGA) has called for application of a precautionary approach and ecosystem approaches in the identification of vulnerable marine ecosystems, assessments of whether individual bottom fishing activities would cause significant adverse impacts to those ecosystems, and the closure of areas where vulnerable marine ecosystems are known or likely to occur until conservation and management measures have been established to prevent significant adverse impacts (United Nations General Assembly [UNGA], 2005, 2007). In support of the UNGA, the United Nations Food and Agriculture Organization (FAO) developed guidelines that included five criteria for defining VMEs (uniqueness or rarity; functional significance; fragility; probability of recovery; and structural complexity) and examples of VME indicator taxa (including: cold-water corals and hydroids; sponge-dominated communities; and seep and vent communities) (Food and Agriculture Organisation [FAO], 2009). The guidelines also defined significant adverse impacts as those compromising ecosystem structure or function, and identified six factors for determining the scale and significance of an impact (intensity of impact, spatial extent of impact relative to the availability of the habitat type affected, sensitivity to the impact, ability to recover, the extent to which ecosystems are altered by the impact, and the timing and duration of the impact). Although the guidelines have served as the principle means for RFMOs to define and manage significant adverse impacts on VMEs, they do not provide any clear guidance on what constitutes evidence of an encounter with a VME during bottom fishing operations or analytical approaches for identifying whether an area contains a VME or not. In addition, the guidelines provide only limited guidance on the spatial scale at which impact assessments should be conducted, referring to the terms areas, populations, habitats and ecosystems. Recognizing a lack of specificity in the guidelines, and that the actions that they had called for had not been sufficiently implemented by all RFMOs, the UNGA has become increasingly explicit regarding the need to develop science-based protocols to define evidence of encounters with VMEs, including the implementation of indicator-specific encounter thresholds, which in turn trigger a response, such as ceasing fishing operations and relocating elsewhere (i.e., the ‘move-on rule’) (United Nations General Assembly [UNGA], 2010, 2012). An ongoing challenge for RFMOs and member states is how to determine, based on best available scientific information and the precautionary principle, suitable encounter threshold levels that take into consideration other management measures (e.g., effort controls, spatial restrictions or closures, changes in gear design and/or operational measures) that are in place to prevent significant adverse impacts on VMEs.
Encounter thresholds, which are usually expressed as the quantity of a VME indicator taxon retained by the fishing gear, should ideally be specific to area, gear type and taxon, and based on historic bycatch levels and catchability estimates (Ardron et al., 2014). However, while scientifically validated thresholds are preferable (Food and Agriculture Organisation [FAO], 2016), in practice, most RFMOS have developed thresholds based on best judgment, with only a few RFMOs having developed thresholds based on historical catch records from either the fisheries for which the threshold is required, or from similar fisheries. For example, Kenchington et al. (2009) initially proposed the use of percentiles to identify thresholds from cumulative bycatch records for the North Atlantic Fisheries Organization (NAFO) region, and later used a kernel density approach to re-adjust the encounter threshold weights (Kenchington et al., 2014). New Zealand used historic bycatch records for the period 1990–2007 from within the South Pacific RFMO (SPRFMO) convention area, supplemented with data from the New Zealand exclusive economic zone, to determine encounter thresholds for 11 designated VME indicator taxa (at taxonomic levels ranging from phylum to order) (Parker et al., 2009). Using these data, the 50th percentile of the cumulative weight frequency distributions for each of the six primary indicator taxa (“the fishery norm”) was selected as a weight threshold (Parker et al., 2009). Recognizing that with increasing numbers of VME indicator taxa caught within a tow suggests an increased likelihood that the trawl had encountered a VME, the New Zealand encounter protocol for SPRFMO also included a ‘biodiversity’ threshold; the presence of three primary or secondary high-level VME indicator taxa retained within tows was selected as the biodiversity threshold (Parker et al., 2009). Therefore, within move-on areas (spatial management measures at the time also included closed areas and open areas within which the move-on rule did not apply) the encounter protocol for New Zealand-flagged fishing vessels was triggered by either the presence of three or more high-level VME indicator taxa, or by the catch of a single taxon above a taxon-specific weight threshold (Penney et al., 2009).
Once encounter thresholds have been exceeded, fishing vessels are typically required to move a minimum distance away from the location where VME indicator taxa were encountered. However, the conservation value associated with move-on rules is dependent on several assumptions that threshold values and move-on distances are adequate to prevent significant adverse impacts on VMEs. For example, although bycatch is assumed to be an indicator of in situ VME biomass and composition, the limited studies that have evaluated this assumption indicate that bottom-fishing gear (which is designed to catch fish) is inefficient at sampling VMEs, such that large quantities of VMEs might be destroyed on the seabed before an amount exceeding encounter thresholds is brought to the surface (Auster et al., 2010). Freese et al. (1999) found that catch efficiency for asteroids, echinoids and mollusk was <1%, and <5% for holothurians for trawls deployed in shallow water (∼200–280 m depth). With an encounter threshold set at 30 kg (the New Zealand threshold for stony corals under SPRFMO CMM-03 2017), a catch efficiency of 5% could potentially mean 600 kg of stony corals on the seafloor had been impacted. An additional concern with move-on rules is the sensitivity of the threshold; thresholds that are too sensitive result in frequent move-on events and the spreading of fishing effort away from preferred fishing grounds and, potentially, across the entire extent of a VME (Auster et al., 2010).
With concerns about the setting of encounter threshold levels and the general efficacy of move-on rules, there has been an increasing emphasis on the importance of implementing effective and representative spatial closures as a management measure to prevent significant adverse impacts on VMEs (Ardron et al., 2008, 2014; de Juan and Lleonart, 2010; Clark and Dunn, 2012; Wright et al., 2015; Thompson et al., 2016; Bell et al., 2018; Rowden et al., 2019). Bell et al. (2018) concluded that the use of closed areas is the most effective management tool for avoiding significant adverse impacts on VMEs, and encounter protocols the least effective. However, the design of spatial management is complicated by data availability. Relatively few data are available on the distribution and abundance of VME indicator taxa to use for the objective planning of spatial management measures. Consequently, spatial management is increasingly informed by combining limited biological records with environmental data in habitat suitability models to predict where VMEs are likely to occur. For example, habitat suitability models have recently been used to design spatial closures to avoid significant adverse impacts on VMEs in the SPRFMO Convention Area (Georgian et al., 2019; SPRFMO CMM 03-2019). The resulting spatial management measures close the great majority of the SPRFMO Convention Area to bottom trawling, concentrating fishing in areas that contain few cells where habitat suitability models predict high conservation value for VMEs. However, predictive habitat suitability models have associated uncertainty and may generate both false positives (VME indicator taxa are predicted to be more widespread than in actuality, potentially over-estimating the conservation value of closed areas) and false negatives (VME indicator taxa exist at high density in areas open to fishing but are not predicted by the models, potentially exposing them to fishing impacts). To address this uncertainty, SPRFMO’s current approach is to use move-on rules to provide for rapid responses to unexpectedly large benthic bycatch events (relative to the predicted distributions of VME indicator taxa used to underpin spatial management) in open areas while work to reassess the effectiveness of the spatial management measures in preventing significant adverse impacts continues. Recognizing that in the SPRFMO case spatial management measures are the primary mechanism preventing significant adverse impacts on VMEs, SPRFMO’s Scientific Committee agreed that any thresholds should be set relatively high so that they indicate when encounters are unexpected based on the relevant VME habitat suitability models (SPRFMO, 2017). Like SPRFMO, other RFMOs have controls on where fishing can occur combined with VME encounter protocols; however, key differences between SPRFMO’s approach and other RFMOs is that the latter place emphasis on encounter protocols as a key tool (rather than spatial management as a key tool), only closing designated VMEs (rather than closing the majority of the Convention Area to bottom fishing and opening areas predicted to be of low conservation value for VMEs), and thereby appear to focus on managing significant adverse impacts on VMEs at local scales (rather than at broader spatial scales).
The aim of the present study was to reassess the SPRFMO bycatch encounter thresholds using SPRFMO-specific data, including that used by Parker et al. (2009), and a range of quantitative methods to establish encounter thresholds in accordance with direction from the SPRFMO’s Scientific Committee that thresholds should be set high. Specifically, we (i) use historical bycatch data from within the SPRFMO Convention Area to construct taxon-specific cumulative distributions of VME indicator taxa bycatch and calculate a range of candidate weight and biodiversity thresholds; (ii) calculate the position of reference points on cumulative distributions to inform the systematic selection of a range of high weight and biodiversity thresholds from the suite of candidate values, from which decision-makers can choose depending on the desired sensitivity of the move-on rule. We also briefly discuss potential modifications that can be made to the approach where management objectives require more sensitive thresholds to prevent significant adverse impacts on VMEs.
Materials and Methods
The data we used in the analysis were extracted from the Fisheries New Zealand Centralized Observer Database (cod) (accessed 14 May 2019). Data were collected by scientific observers (the New Zealand bottom trawl fleet has 100% observer coverage in the SPRFMO Convention Area) and included 9,771 New Zealand trawl tows (including both bottom and mid-water trawls) targeting black oreo (Allocyttus niger), alfonsinos (Beryx splendens and B. decadacylus), cardinal fish (Epigonus telescopus), orange roughy (Hoplostethus atlanticus), and spiky oreo (Neocyttus rhomboidalis). All tows were conducted within an assessed area within the western part of the SPRFMO Convention Area (west of 143°E longitude; Figure 1) between depths of 70 – 1,328 m (median = 955 m) over the period 2008–2018. These data consisted of tow-by-tow observer data with one record per benthic taxon encountered on each tow, and included trip number, tow number, fishing method, trawl type, benthic species code, common name, bycatch weight, method of weight analysis, information on whether the benthic material was encrusting anything or encrusted by something else, and observer comments. We partitioned the data extract to retain only those tows that included VME indicator taxa as bycatch. We designated VME indicator taxa using a modification of criteria defined by Parker et al. (2009) (Table 1). For tows containing VME indicator taxa as bycatch, we aggregated individual VME indicator species into higher-order VME indicator taxa using taxonomic designations from the World Register of Marine Species (Horton et al., 2019) (RRID:SCR_013312), resulting in a final dataset consisting of 3,048 bottom trawl tows and 4,502 aggregated VME indicator taxa records (see Supplementary Material for the allocation of New Zealand fisheries codes to VME indicator taxa).
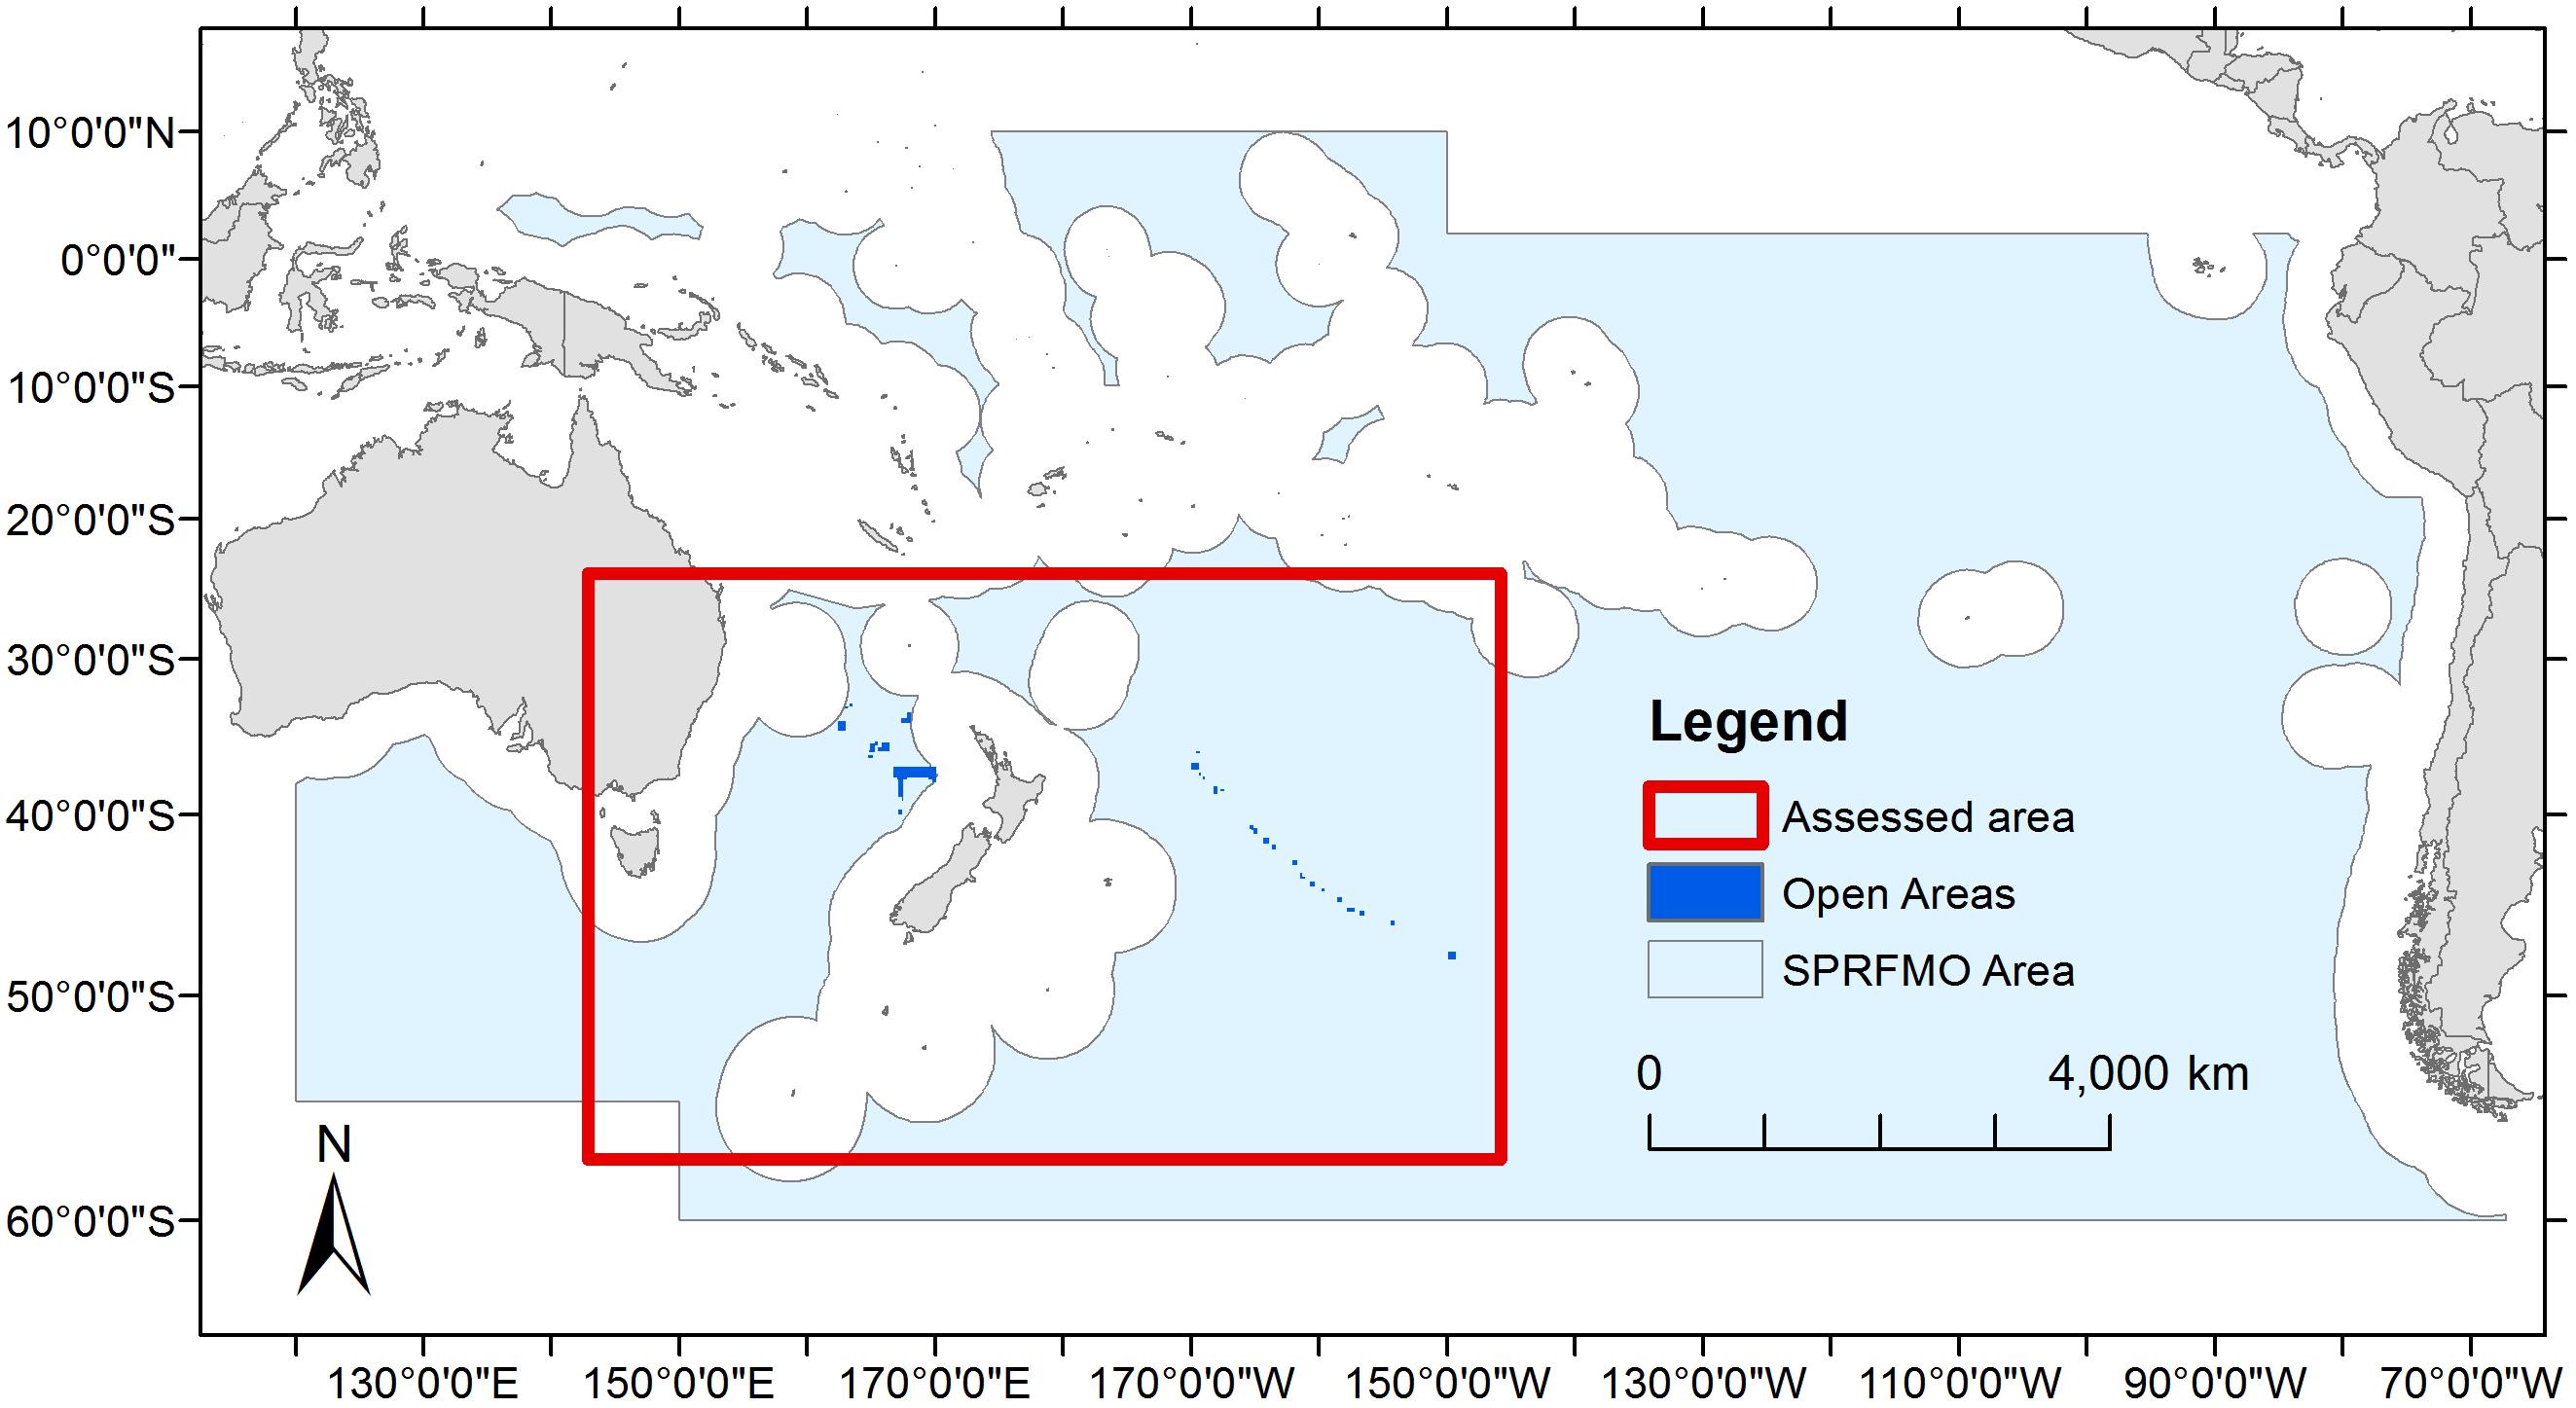
Figure 1. The SPRFMO Convention Area with the location of the assessed area from within which data collected by scientific observers from 9,771 New Zealand bottom trawl tows over the period 2008–2018 was used in this analysis. Also shown as dark blue polygons are the locations of areas open to bottom trawling under SPRFMO CMM03-2019.
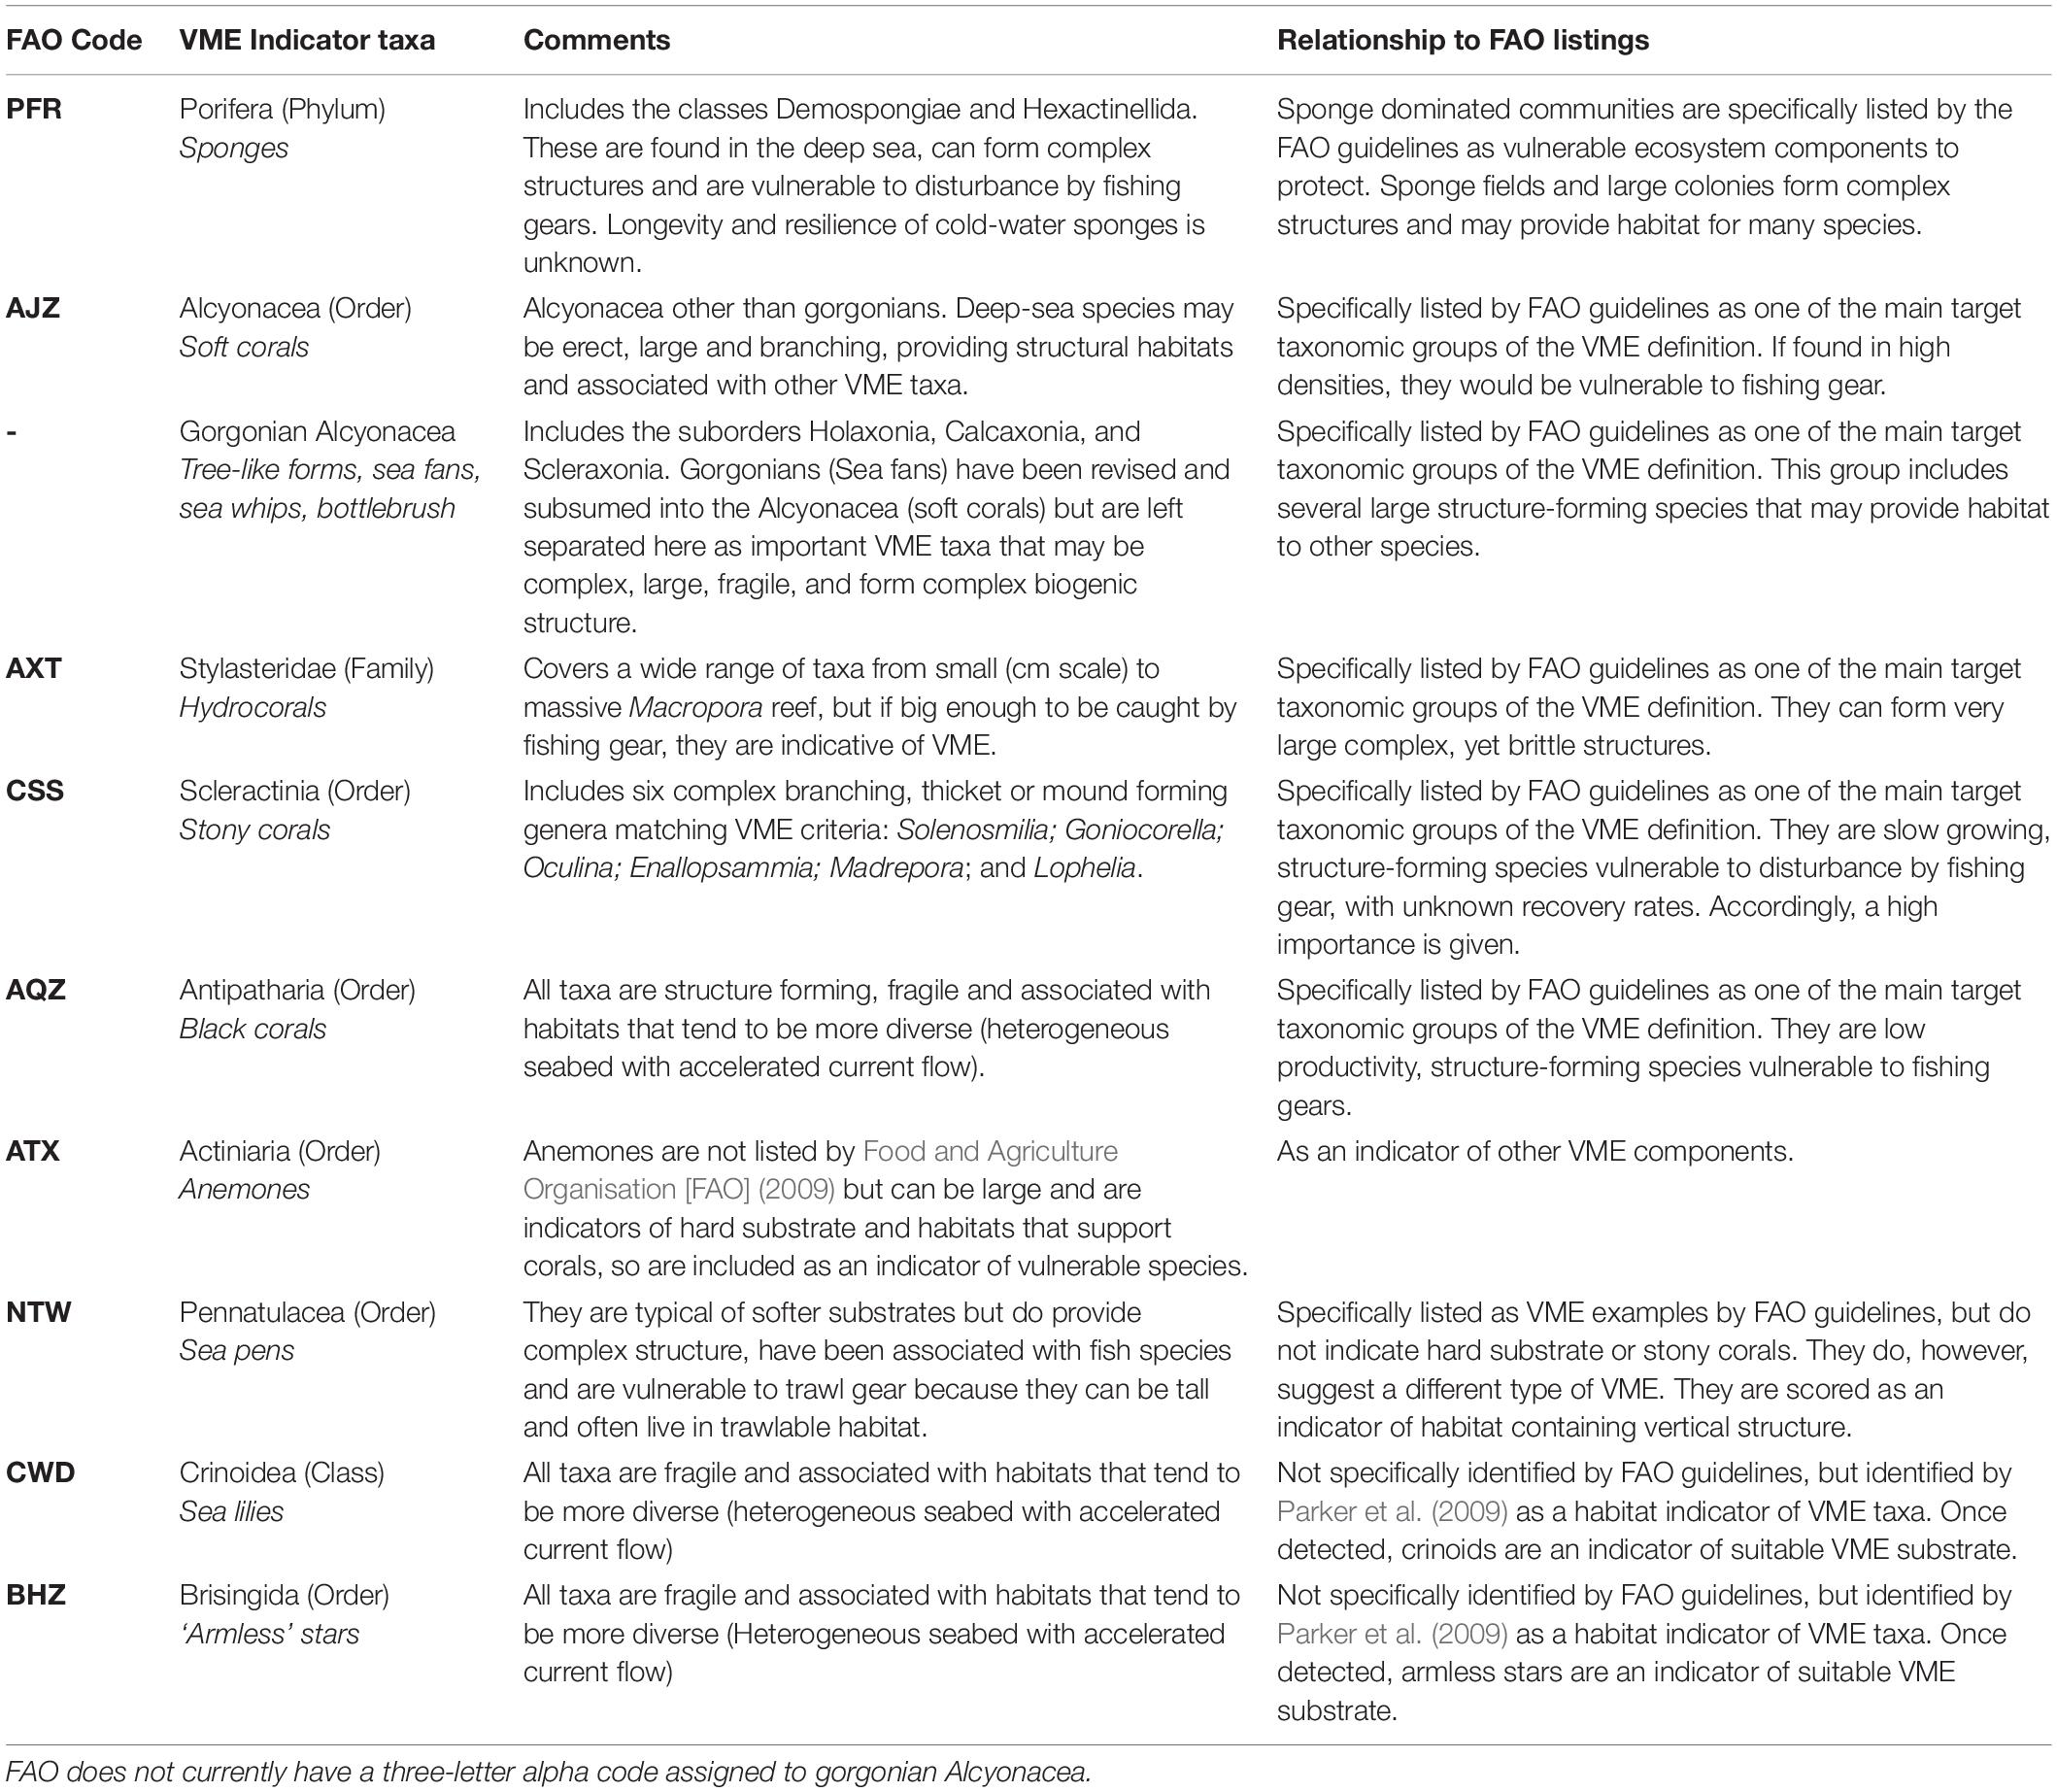
Table 1. Rationale for the designation of VME Indicator taxa (modified from Parker et al., 2009).
Prior to analysis we checked the data for spurious bycatch weights. Of the 5,079 VME indicator taxa records, 80 had no or zero specified weight due to either small samples (<0.1 kg) not being accurately weighed at sea, rounding error, or presence only being recorded. Because zero weights are indicative of the presence of VME indicator taxa, we retained all zero weights in the analysis. Twenty-five records included bycatch weights over 100 kg. For each of these records we reviewed observer comments, bycatch forms and any available photographs to verify that samples did include VME indicator taxa and weren’t composite samples that also included non-VME indicator components. None of the records greater than 100 kg were recorded as encrusting something, and only four were recorded as being encrusted by something else. For all but three of the 25 records (Porifera 1091 kg; Scleractinia 200 and 120 kg), all weights over 100 kg were estimated by eye. Because we found no compelling evidence that the reported weights were incorrect, all records were retained in subsequent analyses. We also evaluated if bycatch weights had decreased over time (potentially as a result of historical fishing), which would suggest the calculation of thresholds should be based on bycatch weights from more recent fishing events. Finding no consistent relationship between bycatch weight and year across VME indicator taxa, we included the entire temporal dataset in subsequent analyses.
For each VME indicator taxon we calculated a range of percentiles from the ordered bycatch weights, with the percentiles serving as candidate encounter threshold values. Because the distribution of bycatch weights was not normally distributed (see section Results), we used ordered values rather than interpolation to calculate percentiles. Further, because the theoretical lower limit of the sample size required for the estimation of the 100α and 100(1-α) percentile from ordered values is equal to 1/α (e.g., the estimation of the 99.5th percentile requires 1/0.005 = 300 values) some taxa had insufficient bycatch samples to calculate the full range of percentiles using ordered data. Consequently, the number of candidate weight and biodiversity thresholds differed between VME indicator taxa.
To inform the systematic selection of weight and biodiversity thresholds for individual taxa from the candidate values, taxon-specific cumulative catch curves were examined to distinguish between the initial part of the curve associated with linear increase, and the final part of the curve associated with asymptotic decrease in slope. Assuming a strong relationship between the weight of VME indicator taxa landed on deck as bycatch and the functional role of VMEs, the transition between these two parts of the curve, especially if sharp, could potentially indicate a naturally occurring or ecologically relevant reference point (Figure 2); e.g., the biomass of the indicator taxon has reached a point where it is sufficient to constitute a distinct VME, such as coral reef or sponge garden (Kenchington et al., 2009). Weight thresholds indicating unexpectedly large catches that suggest the models used to predict the distribution of VME indicator taxa have a high level of inaccuracy should ideally fall to the right of such points, whereas biodiversity thresholds indicating increasing numbers of taxa in a single tow at weights below the threshold trigger should occur to the left. We used three different methods to calculate ecologically relevant reference points for taxa with sample sizes large enough to calculate the 99.5th percentile (Figure 3): (1) the position of the final breakpoint of a three-parameter segmented regression fitted to the data using the package ‘segmented’ in R (R Core Team, 2019) (RRID:SCR_001905); (2) the point on the cumulative distribution that is closest to the top-left corner (0,1), calculated as q1 = min{} for each point belonging to the cumulative distribution M(1-y,x) (Tilbury et al., 2000); and (3) the point on the cumulative distribution that maximizes the distance between the curve and a line drawn between the extreme points on the curve (Youden Index), calculated as q2 = max{y + x -1} for each point belonging to the cumulative distribution M(1-y,x) (Ruopp et al., 2008). Segmented regressions are commonly used to identify breakpoints which differentiate data into different groups based on changes in the relationship between dependent and independent variables (e.g., Ochoa-Quintero et al., 2015; Robertson et al., 2016). Points on a curve closest to (0,1) or which maximize Youden Index are commonly used in medical research to identify thresholds and facilitate treatment decisions (e.g., Youden, 1950; Tilbury et al., 2000) and can provide identical estimates for smooth curves without large steps, which was the case in our study. We therefore omit reporting on the Youden Distance in the results.
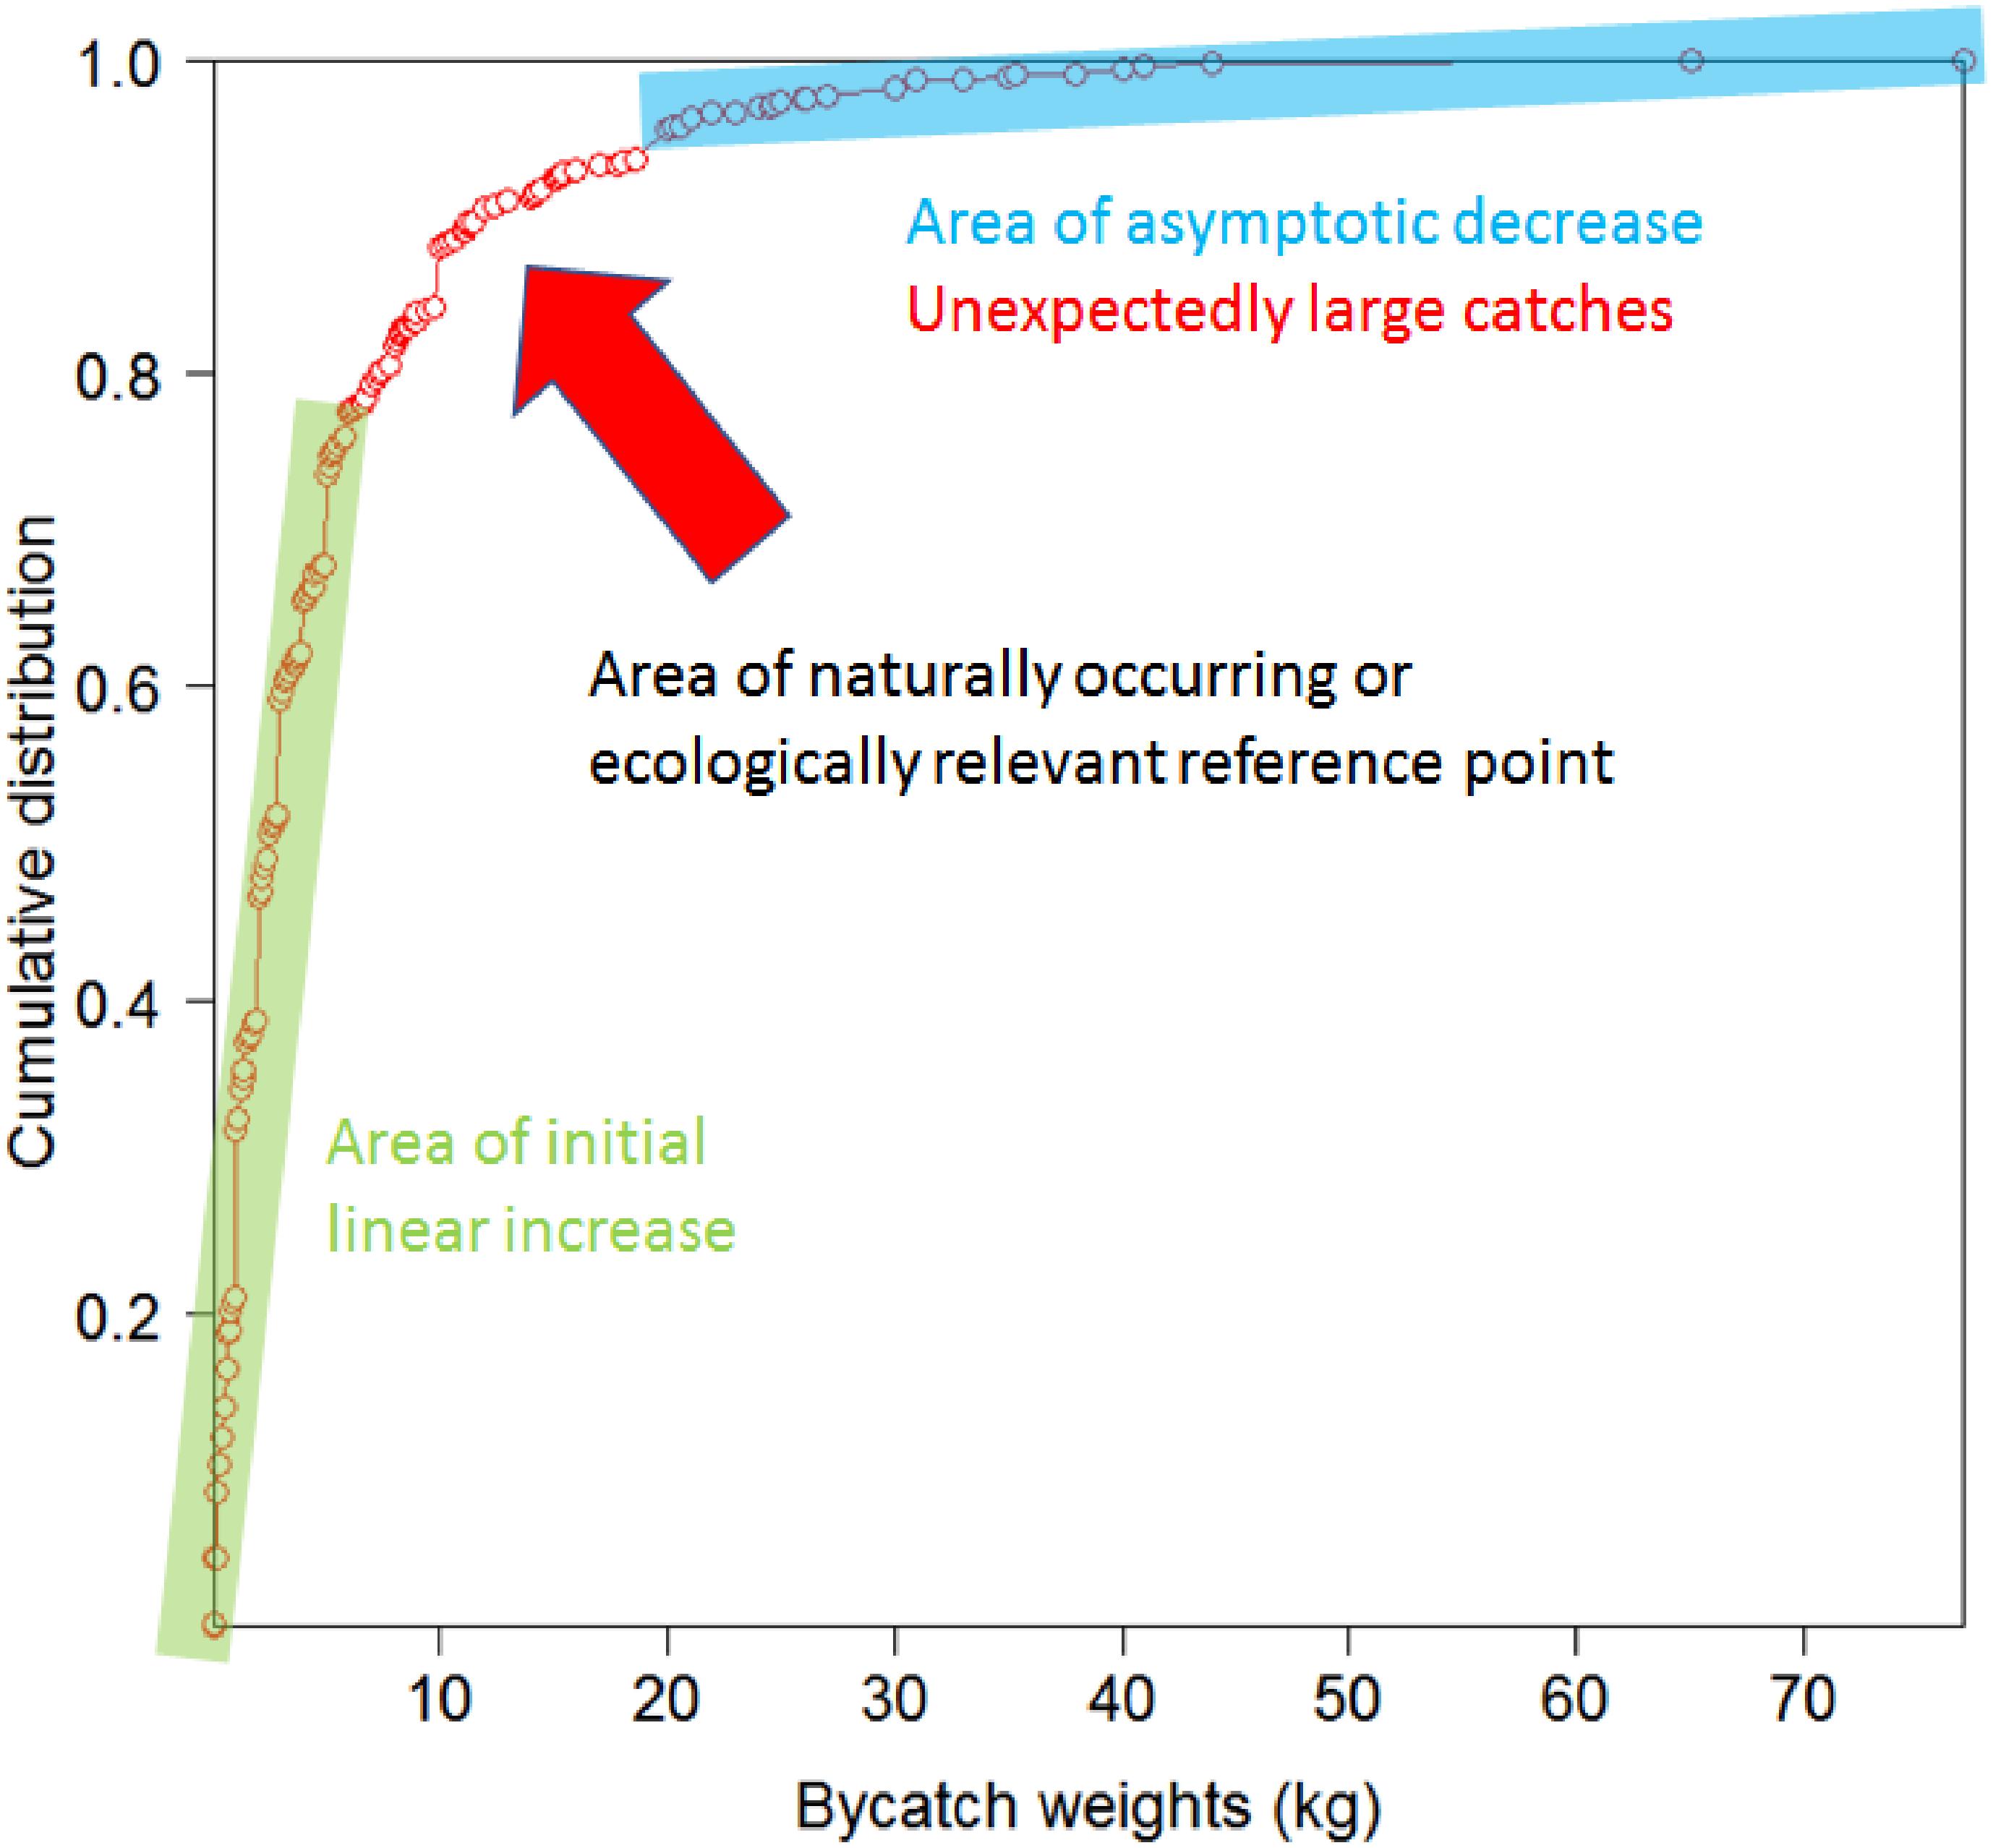
Figure 2. Cumulative distribution curve for the weight of Actiniaria bycatch from the 2008–2018 New Zealand bottom trawl fishery in the SPRFMO Convention Area, where the initial part of the curve associated with linear increase is distinguished from the final part of the curve associated with asymptotic decrease. The area distinguishing between these two parts of the curve potentially indicates a naturally occurring or ecologically relevant reference point. Thresholds indicating unexpectedly large catches that indicate the models used to predict the distribution of VME indicator taxa are highly inaccurate should ideally fall to the right of such points, whereas “biodiversity weights” indicating increasing numbers of taxa in a single tow at weights below the threshold triggers indicating unexpectedly large catches should occur to the left.
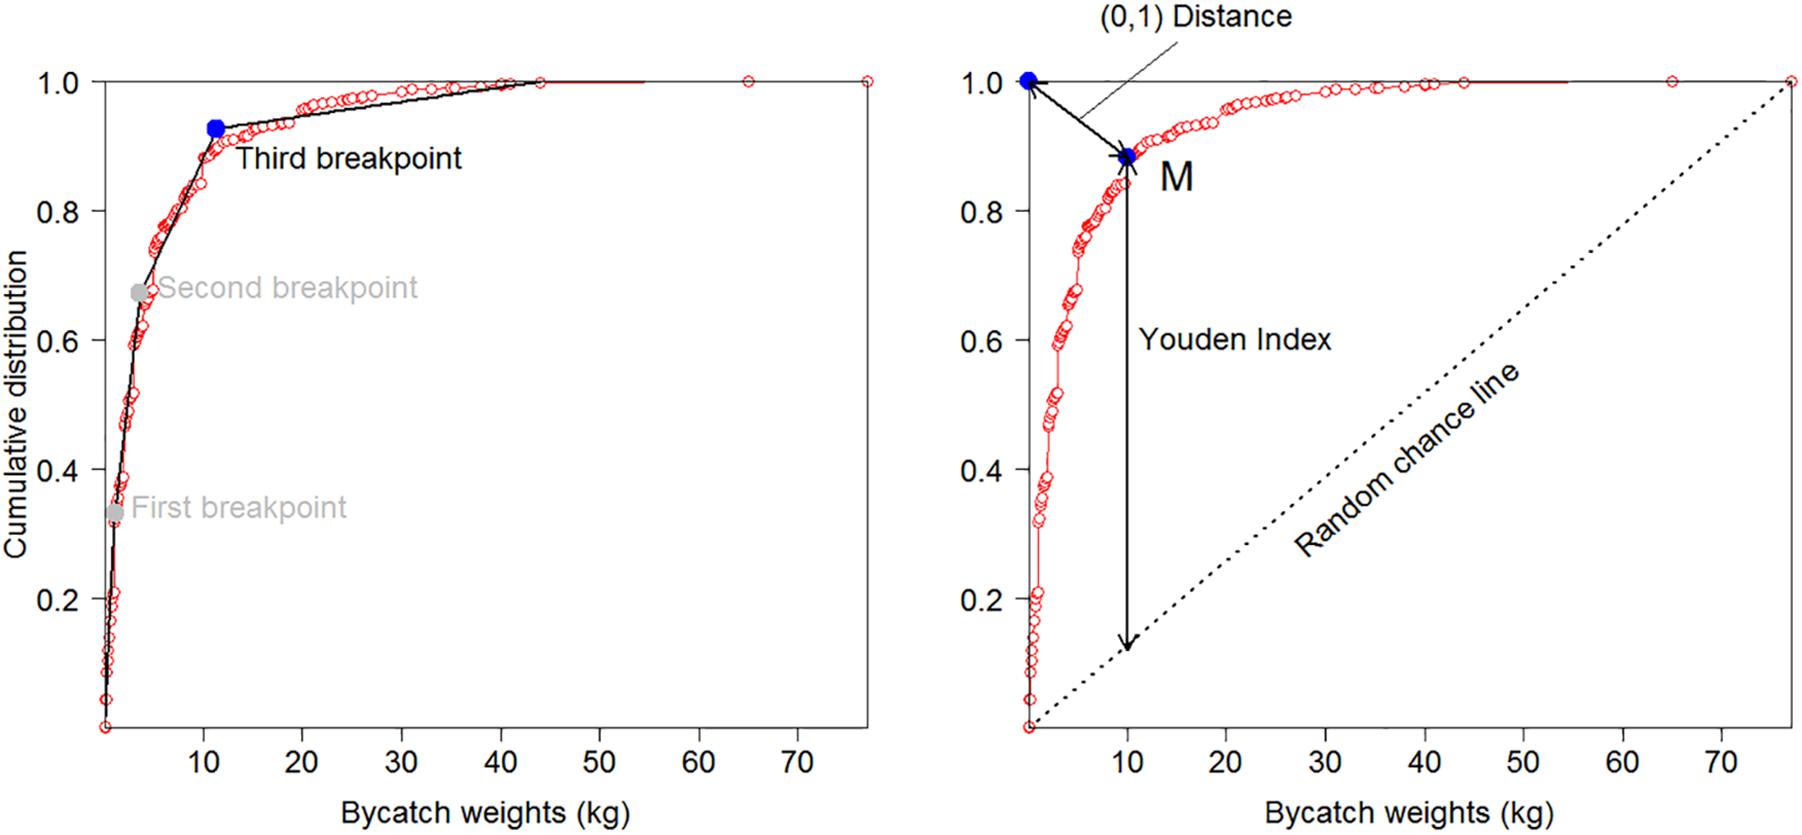
Figure 3. Cumulative distribution curve for the weight of Actiniaria bycatch from the 2008–2018 New Zealand bottom trawl fishery in the SPRFMO Convention Area and three approaches used to distinguish between the initial part of the curve associated with linear increase and the final part of the curve associated with asymptotic decrease (i.e., identification of ecologically relevant reference points): (1) the third breakpoint in a 3-parameter segmented regression (left-hand panel); (2) the point on the curve that is closest to the top-left corner [(0,1) Distance, right-hand panel]; and (3) the point on the curve that maximizes the distance between the curve and a random chance line drawn between the extreme points on the curve (Youden Index, right hand panel).
Percentiles that exceeded the maximum ecologically relevant reference point across all taxa, calculated by either method were selected as weight thresholds (rounded to the nearest 5 kg) by policy makers. Similarly, policy makers selected biodiversity thresholds (rounded to the nearest 5 kg if greater than 1 kg) as the percentile that was lower than the minimum references point across all taxa, calculated by either method. To inform how many VME indicator taxa are required to exceed their specific biodiversity thresholds before a move-on event is triggered, we explored the number of VME indicator taxa caught per fishing event with weights above the taxon-specific biodiversity thresholds (Table 2). Policy makers chose three or more taxa as an appropriately sensitive trigger level given the spatial management measures in place.
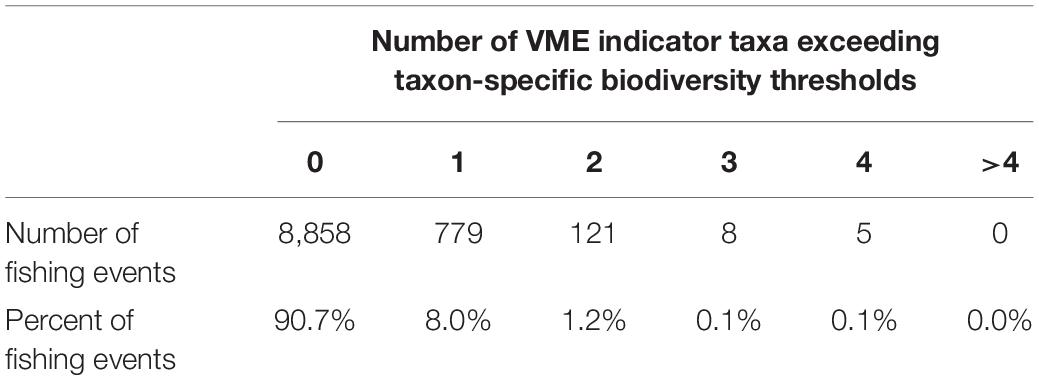
Table 2. The number and percent of 9,771 bottom trawl tows recording 0 to >4 VME indicator taxon groups exceeding taxon-specific biodiversity thresholds, as reported in Table 4.
To evaluate the potential future implications of the thresholds for fishers, we applied an encounter protocol consisting of the rounded weight and biodiversity thresholds directly to the 9,771 historic bottom trawl tows. We considered that a move-on event would have been triggered by either a single VME indicator taxon exceeding its specific weight threshold, or three or more VME indicator taxa exceeding their biodiversity thresholds, and report how many times the move-on would have been triggered had the move-on rule been in effect. All analysis was conducted in R 3.6.1 (R Core Team, 2019) (RRID:SCR_001905).
Results
The prevalence of each of the ten VME indicator taxa in the 9,771 bottom trawl tows conducted by New Zealand in the SPRFMO Convention Area between 2008 and 2018 was highly variable, ranging from two observations (<0.5% of tows) for Alcyonacea (excluding the gorgonian Alcyonacea) to 1,344 observations (approximately 15% of tows) for Scleractinia (Table 3). Similarly, the maximum observed bycatch weight was highly variable, ranging from 0.5 kg for Alcyonacea to 5,000 kg for Scleractinia (Table 3 and Figure 4). The distributions of non-zero catch weights for all taxa show that, relative to the range of observed bycatch weights, most catches were small, with many fewer large catches (Figure 5).
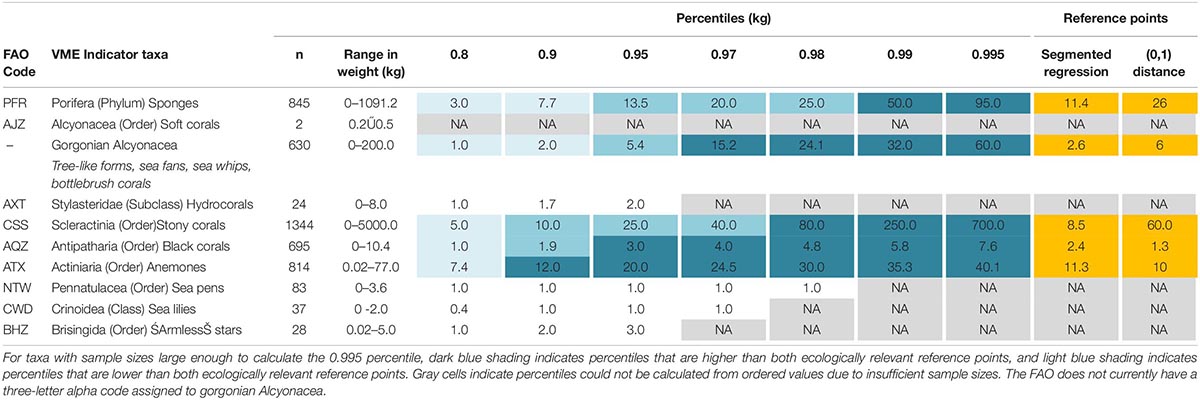
Table 3. The number of bottom trawl tows recorded as bycatch (n), range in bycatch weight (kg), percentiles in bycatch weight, and reference points per VME indicator taxon using ordered values from all New Zealand bottom trawls within the western SPRFMO Convention Area between 2008 and 2018.
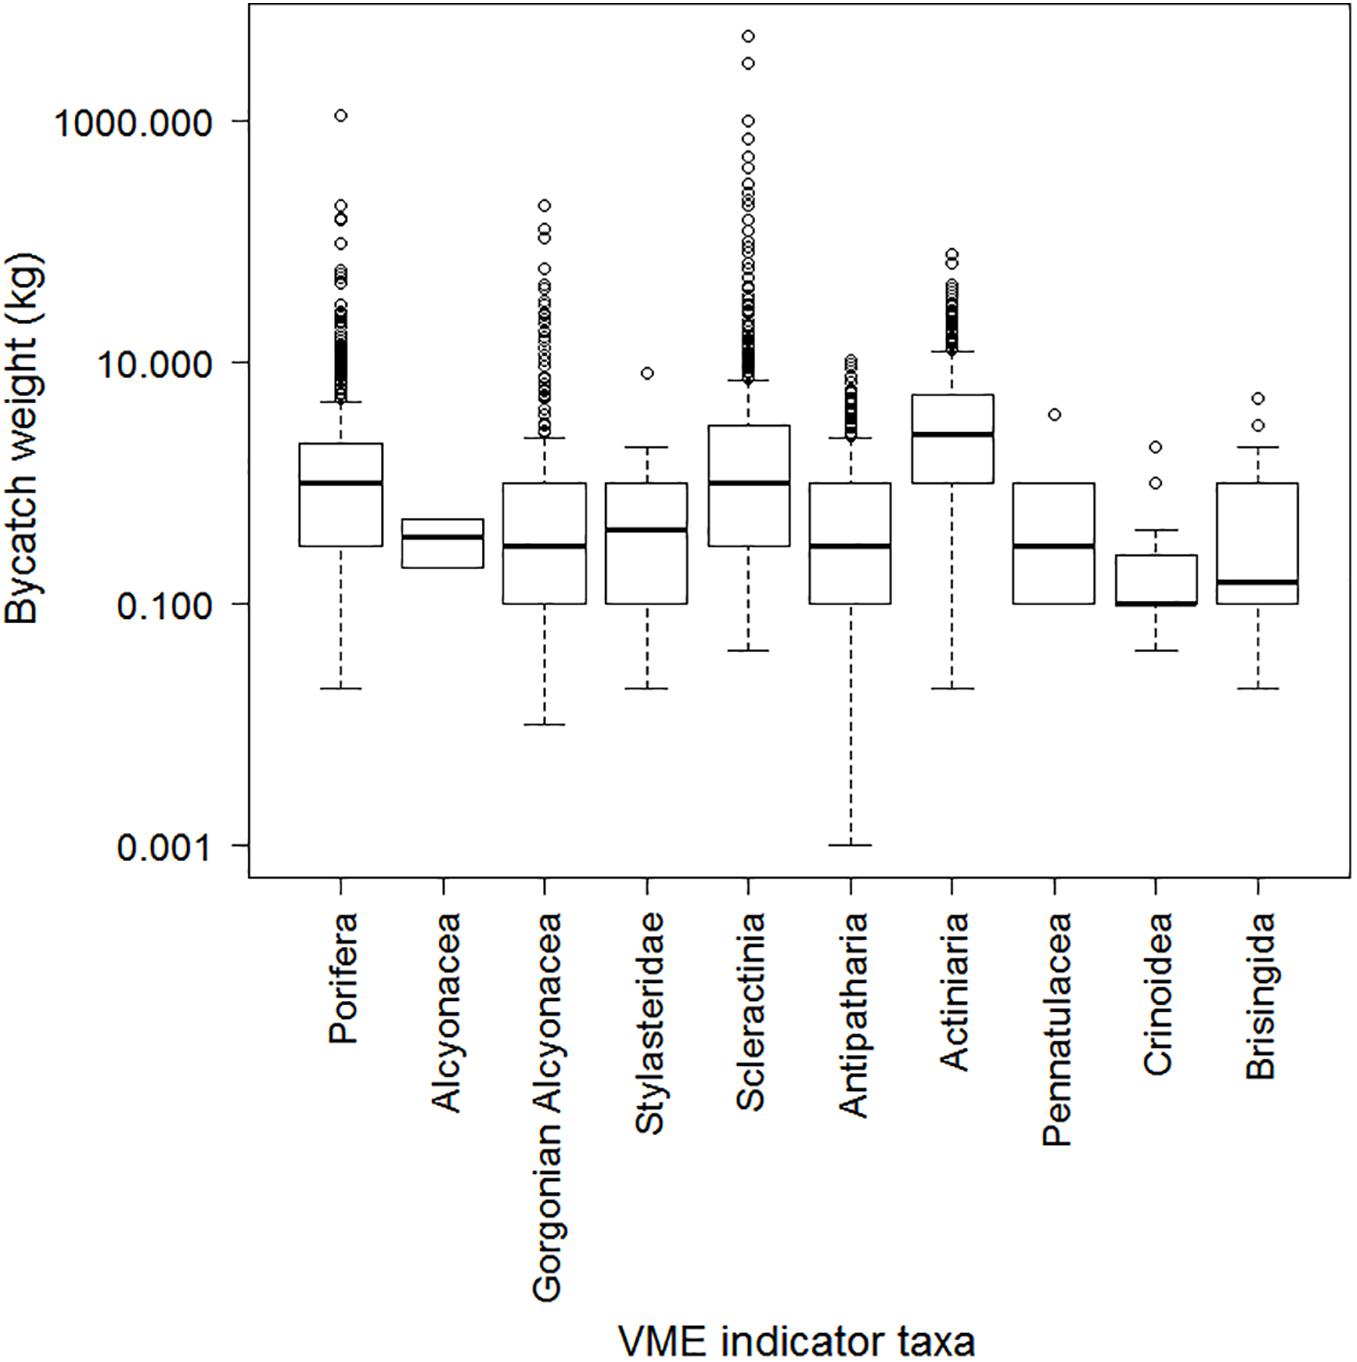
Figure 4. Bycatch weight (kg) of VME indicator taxa in New Zealand bottom trawls within the SPRFMO Convention Area as reported by observers for the 2008–2018 period. Within each boxplot the line indicates the 50th percentile (median), the box encompasses 50% of the data, from the 25th to the 75th percentile and the dashed vertical lines extend to 1.5 times the interquartile range, with circles indicating “outliers.” Note that the y-axis is plotted on a log-scale.
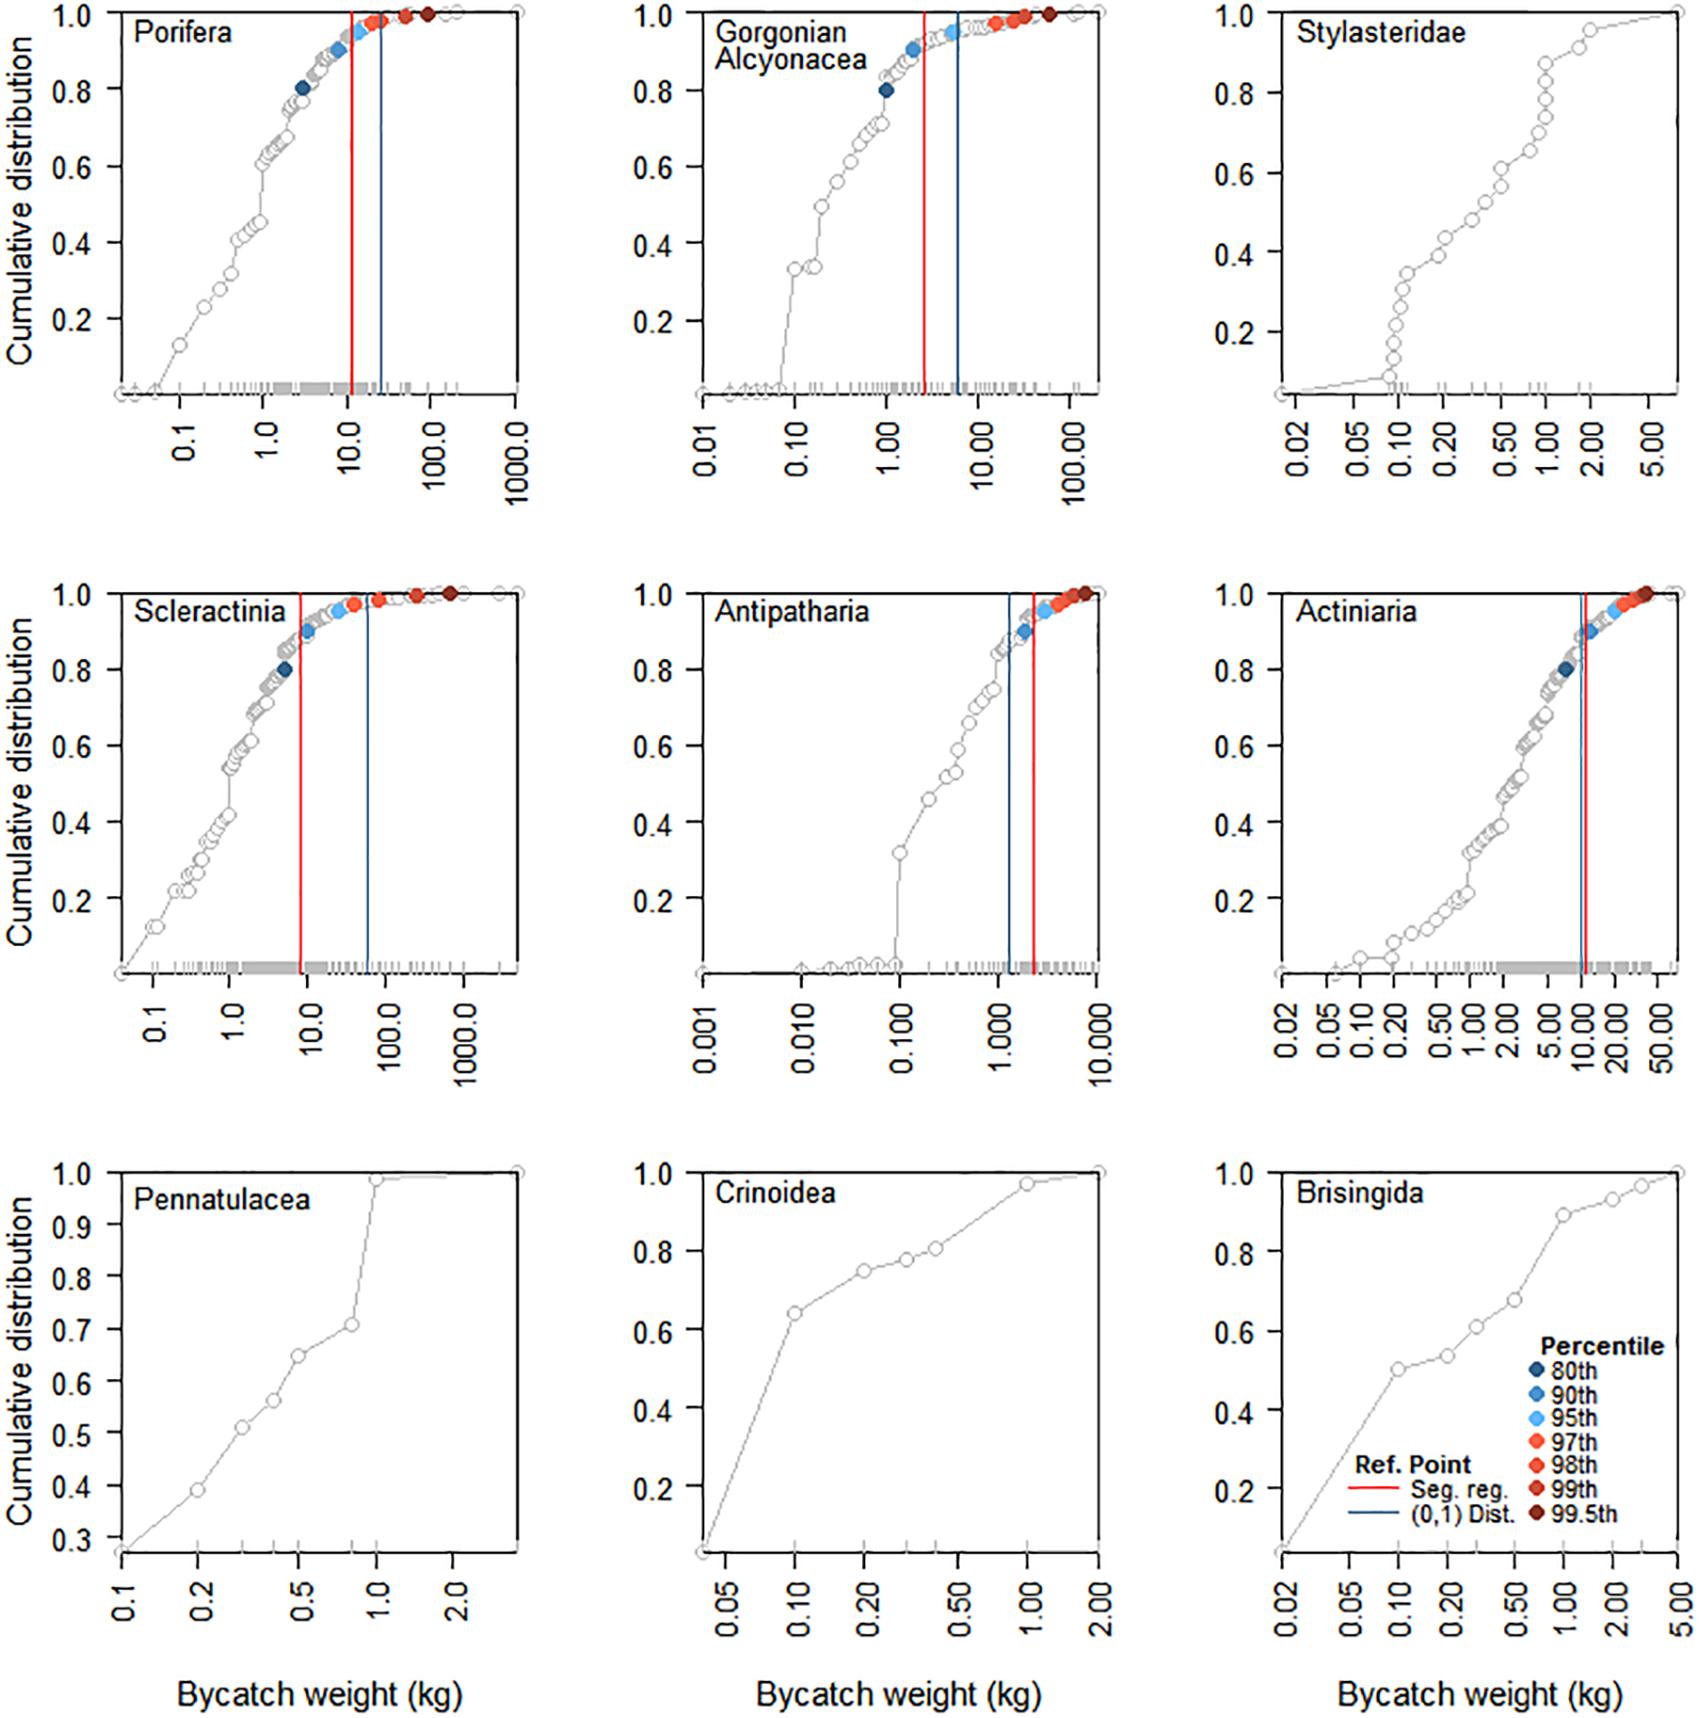
Figure 5. Cumulative distributions of bycatch weight (kg) of VME indicator taxa in New Zealand bottom trawls within the SPRFMO Convention Area as reported by observers for the 2008–2018 period. Percentiles and naturally occurring or ecologically relevant reference points calculated using 3-parameter segmented regressions and the (0,1) distance are shown for the five taxa with sample sizes large enough to calculate the 99.5th percentile. Note that the x-axis is on the log-scale, and the limits of the x-axis differ between panels.
Of the ten VME indicator taxa, five (Porifera, gorgonian Alcyonacea, Scleractinia, Antipatharia, and Actiniaria) had sample sizes large enough to calculate the 99.5th percentile from ordered values (Table 3). For these taxa, maximum ecologically relevant reference points ranged between 2.4 kg for Antipatharia to 60 kg for Scleractinia, with the 99th percentile exceeding the maximum reference points for all species (Table 3). Based on the 99th percentile, weight thresholds rounded to the nearest 5 kg ranged between 5 kg for Antipatharia and 250 kg for Scleractinia (Table 4).
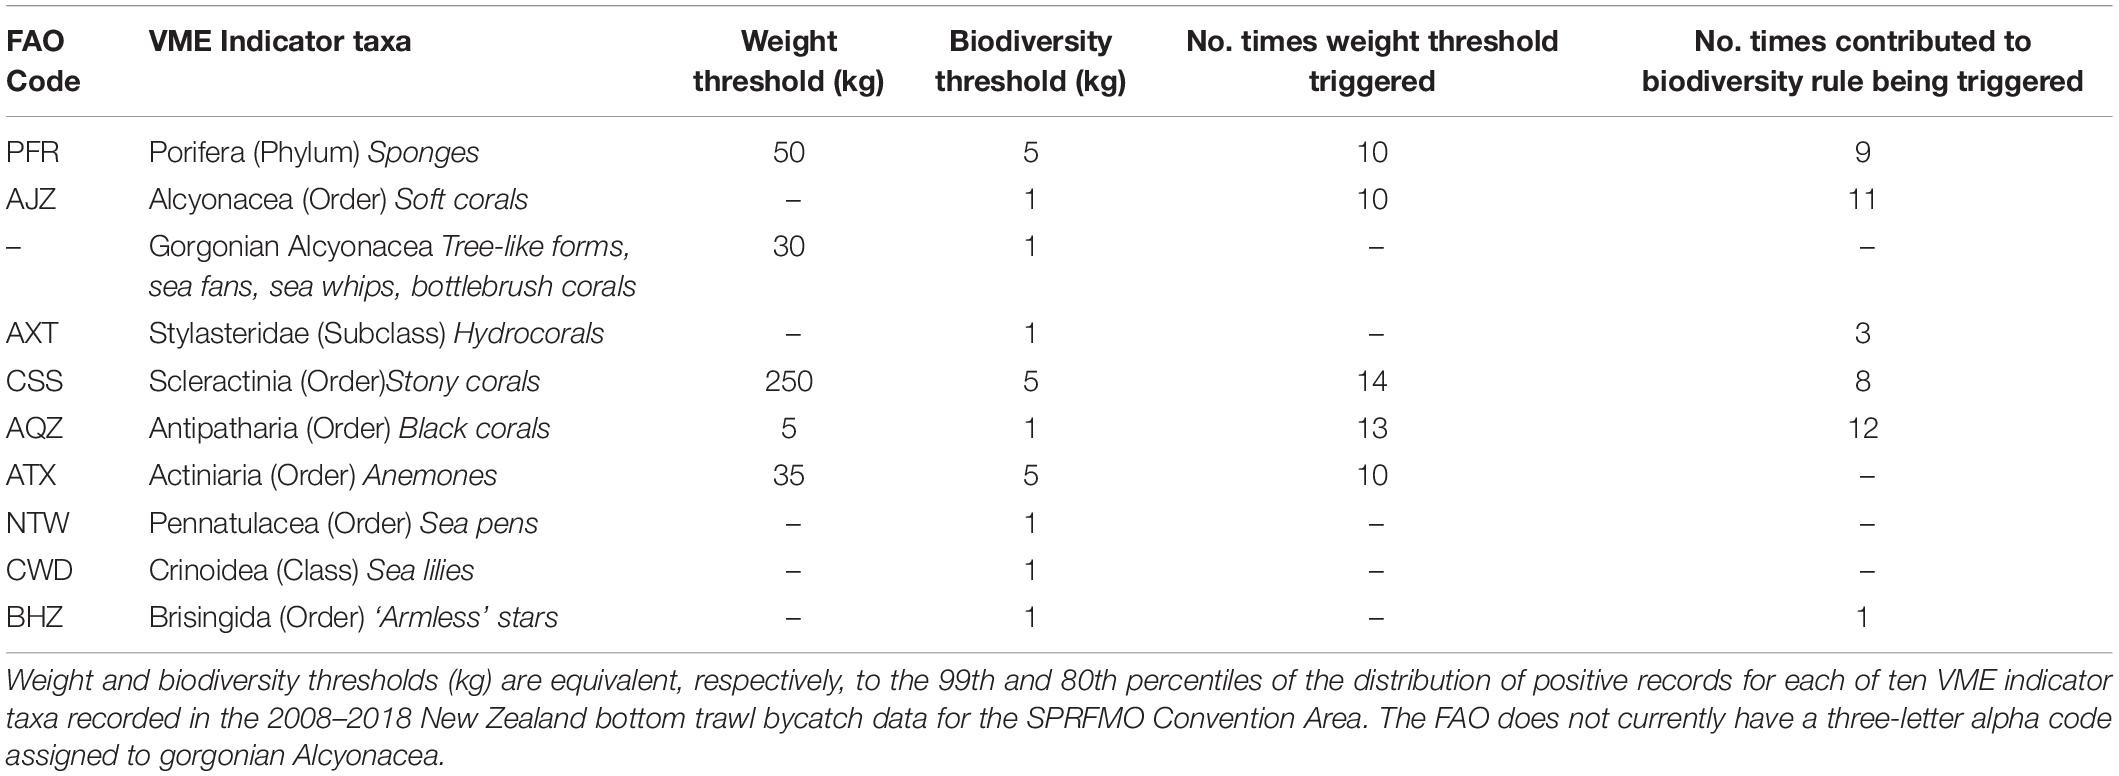
Table 4. Single-taxon thresholds for a move-on rule, and number of times thresholds triggered by 9,771 historic trawls had the move-on rule been in place.
Minimum reference points ranged between 1.3 kg for Antipatharia and 11.4 kg for Porifera, with the 80th percentile lower than the minimum ecologically relevant reference point for all species. Based on the 80th percentile, biodiversity thresholds ranged between 5 kg (for Porifera, Scleractinia, and Actiniaria) and 1 kg (for all other taxa) (Table 4).
Applying an encounter protocol based on the weight and biodiversity thresholds presented in Table 4 directly to the 9,771 bottom trawl tows conducted in the SPRFMO Convention Area by New Zealand between 2008–2018 suggest that, had the protocol been in place in all areas fished, the move-on rule would have been triggered in 53 tows (<1%), almost always as a result of an individual taxon exceeding its weight threshold. The VME indicator taxa most often triggering their weight thresholds were Scleractinia and Antipatharia (Table 4). The biodiversity component of the encounter protocol would have been triggered only rarely (13 times), and for seven tows would have led to a move-on when no individual taxa weight threshold was triggered.
Discussion
Move-on rules were not originally intended as stand-alone measures to protect VMEs from significant adverse impacts by fishing and should be complemented with spatial closures or other measures. However, there has been wide variation in the interpretation of the UNGA resolutions and FAO guidelines by RFMOs and member states, and some RFMOs or member states continue to use move-on rules within historic fishing footprints as the sole management measure preventing significant adverse impacts of bottom trawling on VMEs (e.g., member states within SIOFA). The spatial management measures currently used by SPRFMO (SPRFMO CMM 03-2019) are based on habitat suitability models (Georgian et al., 2019) and only areas containing no or few cells with high conservation value for VME indictor taxa are open to bottom trawling (Delegation of New Zealand, 2019). However, to mitigate risks caused by uncertainty in these models, we present a data-informed approach for selecting taxon-specific encounter thresholds for a move-on rule to rapidly put a stop to fishing in areas where there is an unexpectedly high catch of VME indicator taxa. This approach sets thresholds for triggering a move-on event relatively high, indicating that habitat suitability models underpinning the spatial closures might be highly inaccurate. When encounter protocols are triggered, SPRFMO CMM 03-2019 requires that: an area around the relevant trawl tow is immediately closed to fishing; the encounter must be reviewed by the Scientific Committee; and the Commission must determine if the closure should stay in effect or be lifted. The review process must consider, amongst other things, previous VME encounters within the vicinity of the new encounter (and all information on benthic bycatch), habitat suitability model predictions of VME indicator taxa, details of relevant fishing activity, and any other information the Scientific Committee considers relevant.
Because the selection of encounter thresholds by policy makers took into consideration that spatial management measures would be adopted as a key tool for preventing significant adverse impacts on VMEs in SPRFMO, the thresholds identified for some taxa in this study are higher than those used by some other RFMOs to trigger move-on events. For example, the threshold weight for Scleractinia identified in our study for the SPRFMO Convention Area is 250 kg, compared with 60 kg used by the South East Atlantic Fisheries Organization (SEAFO). However, the 50 kg encounter threshold identified for Porifera in this study is lower than the 600 kg threshold used for sponges by SEAFO. These differences in the thresholds reflect differences in the approaches taken to set thresholds, but potentially also regional differences in the relative abundance of the taxa. But, as already noted, the thresholds developed in this study must be understood as complementing spatial management (which has been evaluated as protecting approximately 85% of the predicted distribution of VME indicator taxa, Cryer et al., 2018) rather than operating in isolation. The FAO acknowledges that the role of thresholds can vary between regions and depends on the fisheries and the level of development of other elements of the VME-related management framework in place (Food and Agriculture Organisation [FAO], 2016; Thompson et al., 2016).
An encounter protocol using the thresholds presented in Table 4 applied to all areas in which historic tows occurred would have led to 53 of the historic tows triggering move-on events. Conversely, only 16 tows within “move-on areas” where lower weight and biodiversity thresholds were applied by New Zealand under SPRFMO CMM 03-2017 would have triggered move-on events. This difference in the number of encounters is primarily driven by differences in the spatial application of a move-on rule. Under SPRFMO CMM 03-2019 higher thresholds are applied to all areas open to bottom trawling, whereas New Zealand’s measures under CMM 03-2017 applied lower thresholds within “move-on areas” only, with approximately 50% of the areas open to trawling by New Zealand vessels not subjected to a move-on rule. Further, because the fishing industry actively avoided move-on areas to avoid triggering VME thresholds, tows within a historic dataset are disproportionately distributed within areas that were not subjected to a move-on rule under CMM 03-2017. These differences highlight the need to take into consideration other management measures in place when determining the sensitivity of thresholds.
An important difference between the analysis presented in this paper and an earlier analysis used to inform the thresholds that were incorporated within the current encounter protocol (SPRFMO CMM 03-2019) is the differentiation of gorgonian Alcyonacea from other Alcyonacea. Although taxonomists consider Alcyonacea to include gorgonians, we have separated the suborders Holaxonia, Calcaxonia, and Scleraxonia here because of their contrast in structure-forming characteristics to other Alcyonacea. This separation differs from that used to inform the thresholds included in current encounter protocol, which distinguished VME indicator taxa explicitly coded as Gorgonacea from all other Alcyonacea, but which didn’t consistently separate out the Holaxonia, Calcaxonia, and Scleraxonia suborders. Consequently, the thresholds in the current encounter protocol for both Alcyonacea and Gorgonacea differ from those calculated in this study. Further, the grouping of Holaxonia, Calcaxonia, and Scleraxonia into gorgonian Alcyonacea meant that there were only two bycatch samples coded as Alcyonacea, which raises doubt about the suitability of Alcyonacea as a VME indicator taxon if it is not being retained in bycatch samples. We therefore suggest that future reviews of the conservation and management measure include both a re-evaluation of the list of VME indicator taxa and their associated threshold weights.
There are several ongoing challenges with the approach we have taken to select encounter thresholds. First, due to a lack of data, we were unable to calculate area-specific thresholds. Although the portion of the SPRFMO Convention Area within which New Zealand bottom trawling occurs can be divided into two distinct geographical areas, the Louisville Seamount Chain to the east of New Zealand (where trawls are seamount feature-based and typically short), and the various Tasman Sea fisheries to the west of New Zealand (where trawls may also occur on the slope and are of longer duration), there were insufficient data for many taxa within each area to enable the generation of area-specific weight thresholds. Therefore, VME indicator taxa-specific weight thresholds were generated for the entire western SPRFMO area combined, and even then, there was insufficient data to calculate taxa-specific weight thresholds for all VME indicator taxa.
Second, is an implicit assumption that the threshold weights used to trigger move-on rules are related in some way to the presence of a VME. Previous studies linking the density or biomass of VME indicator taxa on the seafloor to bycatch indicate that bycatch of individual trawl events may be a poor indicator of the composition and density of VME indicator taxa on the seabed (Freese et al., 1999; Auster et al., 2010; Watling and Auster, 2017). The implication is that the methods used to select threshold values would ideally be supported by an explicit demonstration of a relationship between an ecologically significant biomass or density of VME indicator taxa on the seafloor (i.e., a VME such as coral reef or sponge garden), the catch efficiency of bottom trawl gear, and the biomass of VME indicator taxa retained as bycatch on the deck of fishing vessels. Unfortunately, we currently do not have those data available to quantify these relationships. The reasoning that the threshold weights and encounter protocol acts as a “backstop” to spatial management therefore requires untested assumptions regarding the level of permissible bycatch before further “real time” management action is required. The choice of whether to accept or reject those assumptions is a management decision that must consider uncertainty in the effectiveness of other management measures preventing significant adverse impacts on VMEs. Where managers are comfortable with the effectiveness of other management measures in preventing significant adverse impacts on VMEs, there is scope to select less-sensitive encounter thresholds. However, where managers are uncomfortable with the level of uncertainty in the information underpinning those management measures (including information related to the performance of spatial management measures or the relationship between the biomass of VME indicator taxa on the seabed and that landed on deck as bycatch), or the encounter protocol is the primary mechanism for preventing significant adverse impacts on VMEs, they might select more sensitive encounter thresholds to trigger a move-on rule. Where more sensitive thresholds are required, one approach would be to use a scalar to better link the biomass of VME indicator taxa on the seafloor to bycatch landed on the deck. For example, assuming a catch efficiency of 10%, a multiplier of 0.1 could be applied to the raw data prior to analysis, resulting in down-scaled, more precautionary thresholds. Alternatively, the approach used in this paper can be modified to select thresholds lower on the cumulative distribution curve of bycatch weight. For example, the first breakpoint in the three-parameter segmented regression could be used as the ecologically relevant reference point when selecting weight thresholds, which would provide policy makers with a broader range of increasingly sensitive thresholds from which to select. Similarly, the sensitivity of the biodiversity threshold could be increased by relaxing the number of taxa required to exceed taxon-specific biodiversity thresholds before the encounter protocol is triggered.
Additional work is required, to support the approach taken by SPRFMO in developing encounter protocols as a safeguard against the uncertainty associated with the effectiveness of spatial management measures in preventing significant adverse impacts on VMEs. We think this work should include the determination of taxa-specific catchability estimates (e.g., by comparing VME indicator taxa bycatch weights from trawls to those determined from seafloor imagery from the same area swept by the trawls), and the determination of the particular seafloor density/biomass of VME indicator taxa that represents an actual VME [e.g., by examining the relationship between the density/biomass of a VME indicator taxa and the diversity of associated species, see Rowden et al. (2020) this issue]. Obtaining this information will allow for the identification of encounter thresholds that are more ecologically meaningful and at the same time prevent trawling impacts to VMEs while assessing the accuracy of the habitat suitability models on which the spatial management measures are based. In the interim, and while additional work is underway, the choice of thresholds was reviewed by the SPRFMO Commission in February 2020, taking into consideration the precautionary approach as required by various UNGA resolutions and the SPRFMO Convention text. As a result, the threshold in the encounter protocol for stony corals was reduced from 250 to 80 kg, leaving the thresholds for other VME indicator taxa and the biodiversity component unchanged. SPRFMO’s bottom fishing measures will be reviewed by the Commission again in early 2021.
Data Availability Statement
The data analyzed in this study was obtained from the Ministry for Primary Industries and is classified as “Commercial and in Confidence.” Requests to access these datasets should be directed to the Ministry for Primary Industries Data Management Team for their approval (rdm@mpi.govt.nz).
Author Contributions
SG, AR, MC, and SN designed the study. SG and AR compiled the data. SG and MC checked the data for obvious errors. SG and AR analyzed the data. All authors wrote the manuscript.
Funding
This research was primarily funded by the Department of Conservations Marine Ecosystems Team and Fisheries New Zealand (Projects: SEA2018/14 and SPR2018/01) with additional funding to support the production of the manuscript provided by the New Zealand Sustainable Seas National Science Challenge (Project: SUSS16203) and aligned funding from the NIWA Coasts and Oceans Programme (Project: COME1803).
Conflict of Interest
The authors declare that the research was conducted in the absence of any commercial or financial relationships that could be construed as a potential conflict of interest.
Acknowledgments
We are grateful for comments, suggestions, and inputs from the Fisheries New Zealand’s South Pacific Fishery Assessment Working Group and the South Pacific Regional Fisheries Management Organization’s Scientific Committee.
Supplementary Material
The Supplementary Material for this article can be found online at: https://www.frontiersin.org/articles/10.3389/fmars.2020.00155/full#supplementary-material
References
Ardron, J., Gjerde, K., Pullen, S., and Tilot, V. (2008). Marine spatial planning in the high seas. Mar. Policy 32, 832–839. doi: 10.1016/j.marpol.2008.03.018
Ardron, J. A., Clark, M. R., Penney, A. J., Hourigan, T. F., Rowden, A. A., Dunstan, P. K., et al. (2014). A systematic approach towards the identification and protection of vulnerable marine ecosystems. Mar. Policy 49, 146–154. doi: 10.1016/j.marpol.2013.11.017
Auster, P. J., Gjerde, K., Heupel, E., Watling, L., Grehan, A., and Rogers, A. D. (2010). Definition and detection of vulnerable marine ecosystems on the high seas: problems with the “move-on” rule. ICES J. Mar. Sci. 68, 254–264. doi: 10.1093/icesjms/fsq074
Bell, J., Guijarro-Garcia, E., and Kenny, A. (2018). Scientific Approaches for the Assessment and Management of Deep Sea Fisheries and Ecosystems in RFMOs and RFBs. 171. Final Report for European Commission Framework Contract EASME/EMFF/2016/008. Brussels: European Commission.
Clark, M. R., and Dunn, M. R. (2012). Spatial management of deep-sea seamount fisheries: balancing exploitation and habitat conservation. Environ. Conserv. 39, 204–214. doi: 10.1017/S0376892912000021
Cryer, M., Geange, S. W., and Bock, T. (2018). Methods for Designing Spatial Management Areas Using Outputs From Zonation Software and Other Spatial Data. SPRFMO SC6-DW11. Wellington: SPRFMO.
de Juan, S., and Lleonart, J. (2010). A conceptual framework for the protection of vulnerable habitats impacted by fishing activities in the Mediterranean high seas. Ocean Coast. Manag. 53, 717–723. doi: 10.1016/j.ocecoaman.2010.10.005
Delegation of New Zealand, (2019). A Proposal for a Revised Bottom Fishing Conservation and Management Measure for SPRFMO. SPRFMO COMM7-Prop 03.1. Wellington: SPRFMO.
Food and Agriculture Organisation [FAO] (2009). International Guidelines for the Management of Deep-Sea Fisheries in the High Seas. Rome: Food and Agriculture Organisation, 73.
Food and Agriculture Organisation [FAO] (2016). Report of the FAO Workshop on Encounter Protocols and Impact Assessments, 5–8 May 2015. FAO Fisheries and Aquaculture Report. No. 1178. Rome: FAO, 51.
Freese, L., Auster, P. J., Heifetz, J., and Wing, B. L. (1999). Effects of trawling on seafloor habitat and associated invertebrate taxa in the Gulf of Alaska. Mar. Ecol. Prog. Ser. 182, 119–126. doi: 10.3354/meps182119
Georgian, S. E., Anderson, O. F., and Rowden, A. A. (2019). Ensemble habitat suitability modeling of vulnerable marine ecosystem indicator taxa to inform deep-sea fisheries management in the South Pacific Ocean. Fish. Res. 211, 256–274. doi: 10.1016/j.fishres.2018.11.020
Horton, T., Kroh, A., Ahyong, S., et al. (2019). World Register of Marine Species. Available at: https://www.marinespecies.org at VLIZ (accessed August 22, 2019).
Kenchington, E., Cogswell, A., Lirette, C., and Murillo, F. J. (2009). The Use of Density Analyses to Delineate Sponge Grounds and Other Benthic VMEs from Trawl Survey Data. NAFO SCR Doc. 09/6. Dartmouth, NS: Northwest Atlantic Fisheries Organization.
Kenchington, E., Murillo, F. J., Lirette, C., Sacau, M., Koen-Alonso, M., Kenny, A., et al. (2014). Kernel density surface modelling as a means to identify significant concentrations of vulnerable marine ecosystem indicators. PLoS One 9:e109365. doi: 10.1371/journal.pone.0109365
Ochoa-Quintero, J. M., Gardner, T. A., Rosa, I., de Barros Ferraz, S. F., and Sutherland, W. J. (2015). Thresholds of species loss in Amazonian deforestation frontier landscapes. Cons. Biol. 29, 440–451. doi: 10.1111/cobi.12446
Parker, S. J., Penney, A. J., and Clark, M. R. (2009). Detection criteria for managing trawl impacts on vulnerable marine ecosystems in high seas fisheries of the South Pacific Ocean. Mar. Ecol. Prog. Ser. 397, 309–317. doi: 10.3354/meps08115
Penney, A. J., Parker, S. J., and Brown, J. H. (2009). Protection measures implemented by New Zealand for vulnerable marine ecosystems in the South Pacific Ocean. Mar. Ecol. Prog. Ser. 397, 341–354. doi: 10.3354/meps08300
R Core Team, (2019). R: A Language and Environment for Statistical Computing. Vienna: R Foundation for Statistical Computing.
Robertson, B. P., Savage, C., Gardner, J. P., Robertson, B. M., and Stevens, L. M. (2016). Optimising a widely-used coastal health index through quantitative ecological group classifications and associated thresholds. Ecol. Indic. 69, 595–605. doi: 10.1016/j.ecolind.2016.04.003
Rowden, A. A., Pearman, T. R. R., Bowden, D. A., Anderson, O. F., and Clark, M. R. (2020). Determining Coral Density Thresholds for Identifying Structurally Complex Vulnerable Marine Ecosystems in the Deep Sea. Front. Mar. Sci. 7:95. doi: 10.3389/fmars.2020.00095
Rowden, A. A., Stephenson, F., Clark, M. R., Anderson, O. F., Guinotte, J. M., Baird, S. J., et al. (2019). Examining the utility of a decision-support tool to develop spatial management options for the protection of vulnerable marine ecosystems on the high seas around New Zealand. Ocean Coast. Manage. 170, 1–16. doi: 10.1016/j.ocecoaman.2018.12.033
Ruopp, M. D., Perkins, N. J., Whitcomb, B. W., and Schisterman, E. F. (2008). Youden Index and optimal cut-point estimated from observations affected by a lower limit of detection. Biometrical J. 50, 419–430. doi: 10.1002/bimj.200710415
Thompson, A., Sanders, J., Tandstad, M., Carocci, F., and Fuller, J. (2016). “Vulnerable marine ecosystems: processes and practices in the high seas,” FAO Fisheries and Aquaculture Technical Paper 595, (Rome: FAO), 185.
Tilbury, J. B., Van Eetvelt, W. J., Garibaldi, J. M., Curnsw, J. S. H., and Ifeachor, E. C. (2000). Receiver operating characteristic analysis for intelligent medical systems-a new approach for finding confidence intervals. IEEE T. Bio-Med. Eng. 47, 952–963. doi: 10.1109/10.846690
United Nations General Assembly [UNGA], (2005). Resolution 59/25: Sustainable fisheries, including through the 1995 Agreement for the Implementation of the Provisions of the United Nations Convention on the Law of the Sea of 10 December 1982 relating to the Conservation and Management of Straddling Fish Stocks and Highly Migratory Fish Stocks, and related instruments, UNGA A/RES/59/25, United Nations General Assembly. New York, NY: UNGA.
United Nations General Assembly [UNGA], (2007). Resolution 61/105: Sustainable fisheries, including through the 1995 Agreement for the Implementation of the Provisions of the United Nations Convention on the Law of the Sea of 10 December 1982 relating to the Conservation and Management of Straddling Fish Stocks and Highly Migratory Fish Stocks, and related instruments, UNGA A/RES/61/105, United Nations General Assembly. New York, NY: UNGA.
United Nations General Assembly [UNGA], (2010). Resolution 64/72: Sustainable fisheries, including through the 1995 Agreement for the Implementation of the Provisions of the United Nations Convention on the Law of the Sea of 10 December 1982 relating to the Conservation and Management of Straddling Fish Stocks and Highly Migratory Fish Stocks, and related instruments, UNGA A/RES/64/72, United Nations General Assembly. New York, NY: UNGA.
United Nations General Assembly [UNGA], (2012). Resolution 66/68: Sustainable fisheries, including through the 1995 Agreement for the Implementation of the Provisions of the United Nations Convention on the Law of the Sea of 10 December 1982 relating to the Conservation and Management of Straddling Fish Stocks and Highly Migratory Fish Stocks, and related instruments, UNGA A/RES/66/68, United Nations General Assembly. New York, NY: UNGA.
Watling, L., and Auster, P. J. (2017). Seamounts on the high seas should be managed as vulnerable marine ecosystems. Front. Mar. Sci. 4:14. doi: 10.3389/fmars.2017.00014
Wright, G., Ardron, J., Gjerde, K., Currie, D., and Rochette, J. (2015). Advancing marine biodiversity protection through regional fisheries management: a review of bottom fisheries closures in areas beyond national jurisdiction. Mar. Policy 61, 134–148. doi: 10.1016/j.marpol.2015.06.030
Keywords: VME, vulnerable marine ecosystem, indicator taxa, encounter protocol, move-on rule, bycatch thresholds, SPRFMO, high seas
Citation: Geange SW, Rowden AA, Nicol S, Bock T and Cryer M (2020) A Data-Informed Approach for Identifying Move-on Encounter Thresholds for Vulnerable Marine Ecosystem Indicator Taxa. Front. Mar. Sci. 7:155. doi: 10.3389/fmars.2020.00155
Received: 28 August 2019; Accepted: 28 February 2020;
Published: 18 March 2020.
Edited by:
Les Watling, University of Hawai‘i at Mānoa, United StatesReviewed by:
Angelo Fraga Bernardino, Federal University of Espirito Santo, BrazilPeter J. Auster, University of Connecticut, United States
Copyright © 2020 Geange, Rowden, Nicol, Bock and Cryer. This is an open-access article distributed under the terms of the Creative Commons Attribution License (CC BY). The use, distribution or reproduction in other forums is permitted, provided the original author(s) and the copyright owner(s) are credited and that the original publication in this journal is cited, in accordance with accepted academic practice. No use, distribution or reproduction is permitted which does not comply with these terms.
*Correspondence: Shane W. Geange, c2dlYW5nZUBkb2MuZ292dC5ueg==