 Mara Gomes
 Alexandre Correia
 Lígia Pinto
 Carolina Sá1
 Vanda Brotas
 Marcos Mateus
- 1MARE, Faculdade de Ciências, Universidade de Lisboa, Lisbon, Portugal
- 2MARETEC, Instituto Superior Técnico, Universidade de Lisboa, Lisbon, Portugal
Aquaculture has become the fastest-growing sector of the food industry worldwide. The increase of intensive aquaculture practices, however, has been raising global concern about economic and social impacts, but mostly due to the associated potential environmental impacts. The aim of this report is to make a preliminary assessment of the impact of an intensive sea bass aquaculture (Dicentrarchus labrax, L. 1758) on surrounding coastal waters. The aquaculture site is located at the SW Iberian coast (Sines, Portugal), having 16 cages, each holding approximately 150,000 specimens at different stages of growth. We present a spatial and temporal description of environmental physical, chemical, and biological parameters taken in the course of four monitoring campaigns conducted between June 2018 and April 2019. All monitored parameters, except phosphate concentration in October only at one sampling station, showed values within the desirable ranges for marine finfish production and the natural range of Portuguese coastal waters. So far, results do not reveal any detrimental impact of the production units on local water quality, although more research is needed. The preliminary findings suggest that the lack of stress on the receiving waters may be attributed to the hydrodynamic regime in the production area, the feeding strategy, and the dimension of the production.
Introduction
The oceans are an integral part of our society and economy, supplying living and non-living resources and providing a range of important goods and services. Undoubtedly, oceans are a major source of food worldwide serving as the primary source of protein of more than three billion people (United Nations, 2020). However, 90% of the global fish stocks are either overfished or fully fished (FAO, 2018). In response to the limited potential to increase wild fishery catches and the rising demand for seafood [driven by both population growth and increased per capita consumption (Godfray et al., 2010)], alternative sustainable food supplies (i.e., aquaculture) have been rapidly developing. This growth is further fostered by constant technologic improvements. Aquaculture is currently the fastest-growing food sector in the world (Diana, 2009; Troell et al., 2014; FAO, 2016; Granada et al., 2016), and the coastal and oceanic areas are seen as one of the most likely areas for large-scale expansion (Aguilar-Manjarrez et al., 2013).
The proliferation of intensive marine aquaculture, both in number of units and production areas, has been raising global concern about economic and social impacts, but mostly due to the potential environmental impacts associated with such practices (Focardi et al., 2005; Smith et al., 2010). Environmental effects of fish production on water quality are a primary concern for developing an ecologically responsible industry. Besides, aquaculture relies on a healthy environment to provide quality and safe products. Environmental impacts of intensive marine fish culturing are therefore widely documented (Frankic and Hershner, 2003; Grigorakis and Rigos, 2011), including analyses of its influence on physical and chemical properties of the water column (Sarà, 2007), ecological effects of aquaculture on nutrient concentration (e.g., Sarà et al., 2007), sediments (Wu et al., 1994; Kalantzi and Karakassis, 2006), and the biota (Guerrero-Galván et al., 1998). Intensive fish farming requires external inputs of feed, which can lead to nutrient and chemical pollution (e.g., Cao et al., 2007). In addition, suspended and dissolved matter can also originate from fish feces and excretions via gills and kidneys (Tovar et al., 2000). It should be noted that decomposition of organic matter is the main cause of oxygen demand in an aquaculture system (Wu et al., 1994; Pérez et al., 2014), making food wastage and feed quality potential inductors of oxygen depletion. Therefore, the adjustment of the given food according to fish needs is of utmost importance. Furthermore, organic wastes may add to suspended particulate matter (SPM) resulting in reduced water transparency, and nutrients can stimulate growth of phytoplankton, promoting the eutrophication of the system, and/or increase the risk of toxic algal blooms.
Physical, biogeochemical, biological, and geographical features can have direct effects on the growth of aquaculture species (e.g., Ferreira et al., 2007), so that the farm location plays a critical role in determining its productivity, environmental impact, and interactions with other ecosystem services (Gentry et al., 2017). For example, characteristics such as shallow depths and slow currents are likely to be risk factors for aquaculture operations (Jansen et al., 2016). Optimal conditions may depend on the cultured species; therefore, reference values/ranges for acceptable water quality parameters can be found in the literature (Wurts and Durborow, 1992; Australian and New Zealand Environment and Conservation Council [Anzeecc] and Agriculture and Resource Management Council of Australia and New Zealand [Armcanz], 2000; Stone and Thomforde, 2003; Bhatnagar et al., 2004; Ornamental Aquatic Trade Association [OATA], 2008; Sá, 2013; Alaska Department of Environmental Conservation [ADEC], 2016) even for specific species such as the European sea bass (Claridge and Potter, 1983; FAO, 2020), the cultured species in the region of interest of this study.
The aim of this report is to make a preliminary assessment of the impact on the surrounding coastal waters of a fish aquaculture (sea bass), located at the SW Iberian coast (Sines, Portugal). We present spatial and temporal characteristics of environmental physical, chemical, and biological parameters taken in the course of four monitoring campaigns (conducted between June 2018 and April 2019) in the vicinity of the sea bass cage culture.
Materials and Methods
Site Location and Production Characterization
The aquaculture site is located in Sines, in the western coast of Portugal, on a coastal stretch with a significant presence of infrastructures (Figure 1) that support important economic activities at a local and national scale. There are two large production centers of oil and gas, the Galp refinery and the Repsol petrochemical industrial complex, both connected via pipelines to the oil-bearing and petrochemical terminal of the port. A thermoelectric station is located on the southeastern end of Sines, at approximately 3.5 km from the aquaculture site. The station pumps seawater to be used in the cooling process and releases an effluent via two open 4.5-m deep channels, distancing approximately 400 m northwest from the intake. On a yearly average, the power plant uses 40 m3 s–1 of water (Salgueiro et al., 2015). The port of Sines is located on the south, being the main entryway of primary energy, in the form of fossil fuels (crude, coal, and natural gas) in Portugal. As a deep-water port, it is also one of the most important entry routes of containerized cargo. Besides the fishing and leisure ports, there is a commercial port made of five terminals: liquid bulk, liquid natural gas, petrochemical, container, and multipurpose terminal.
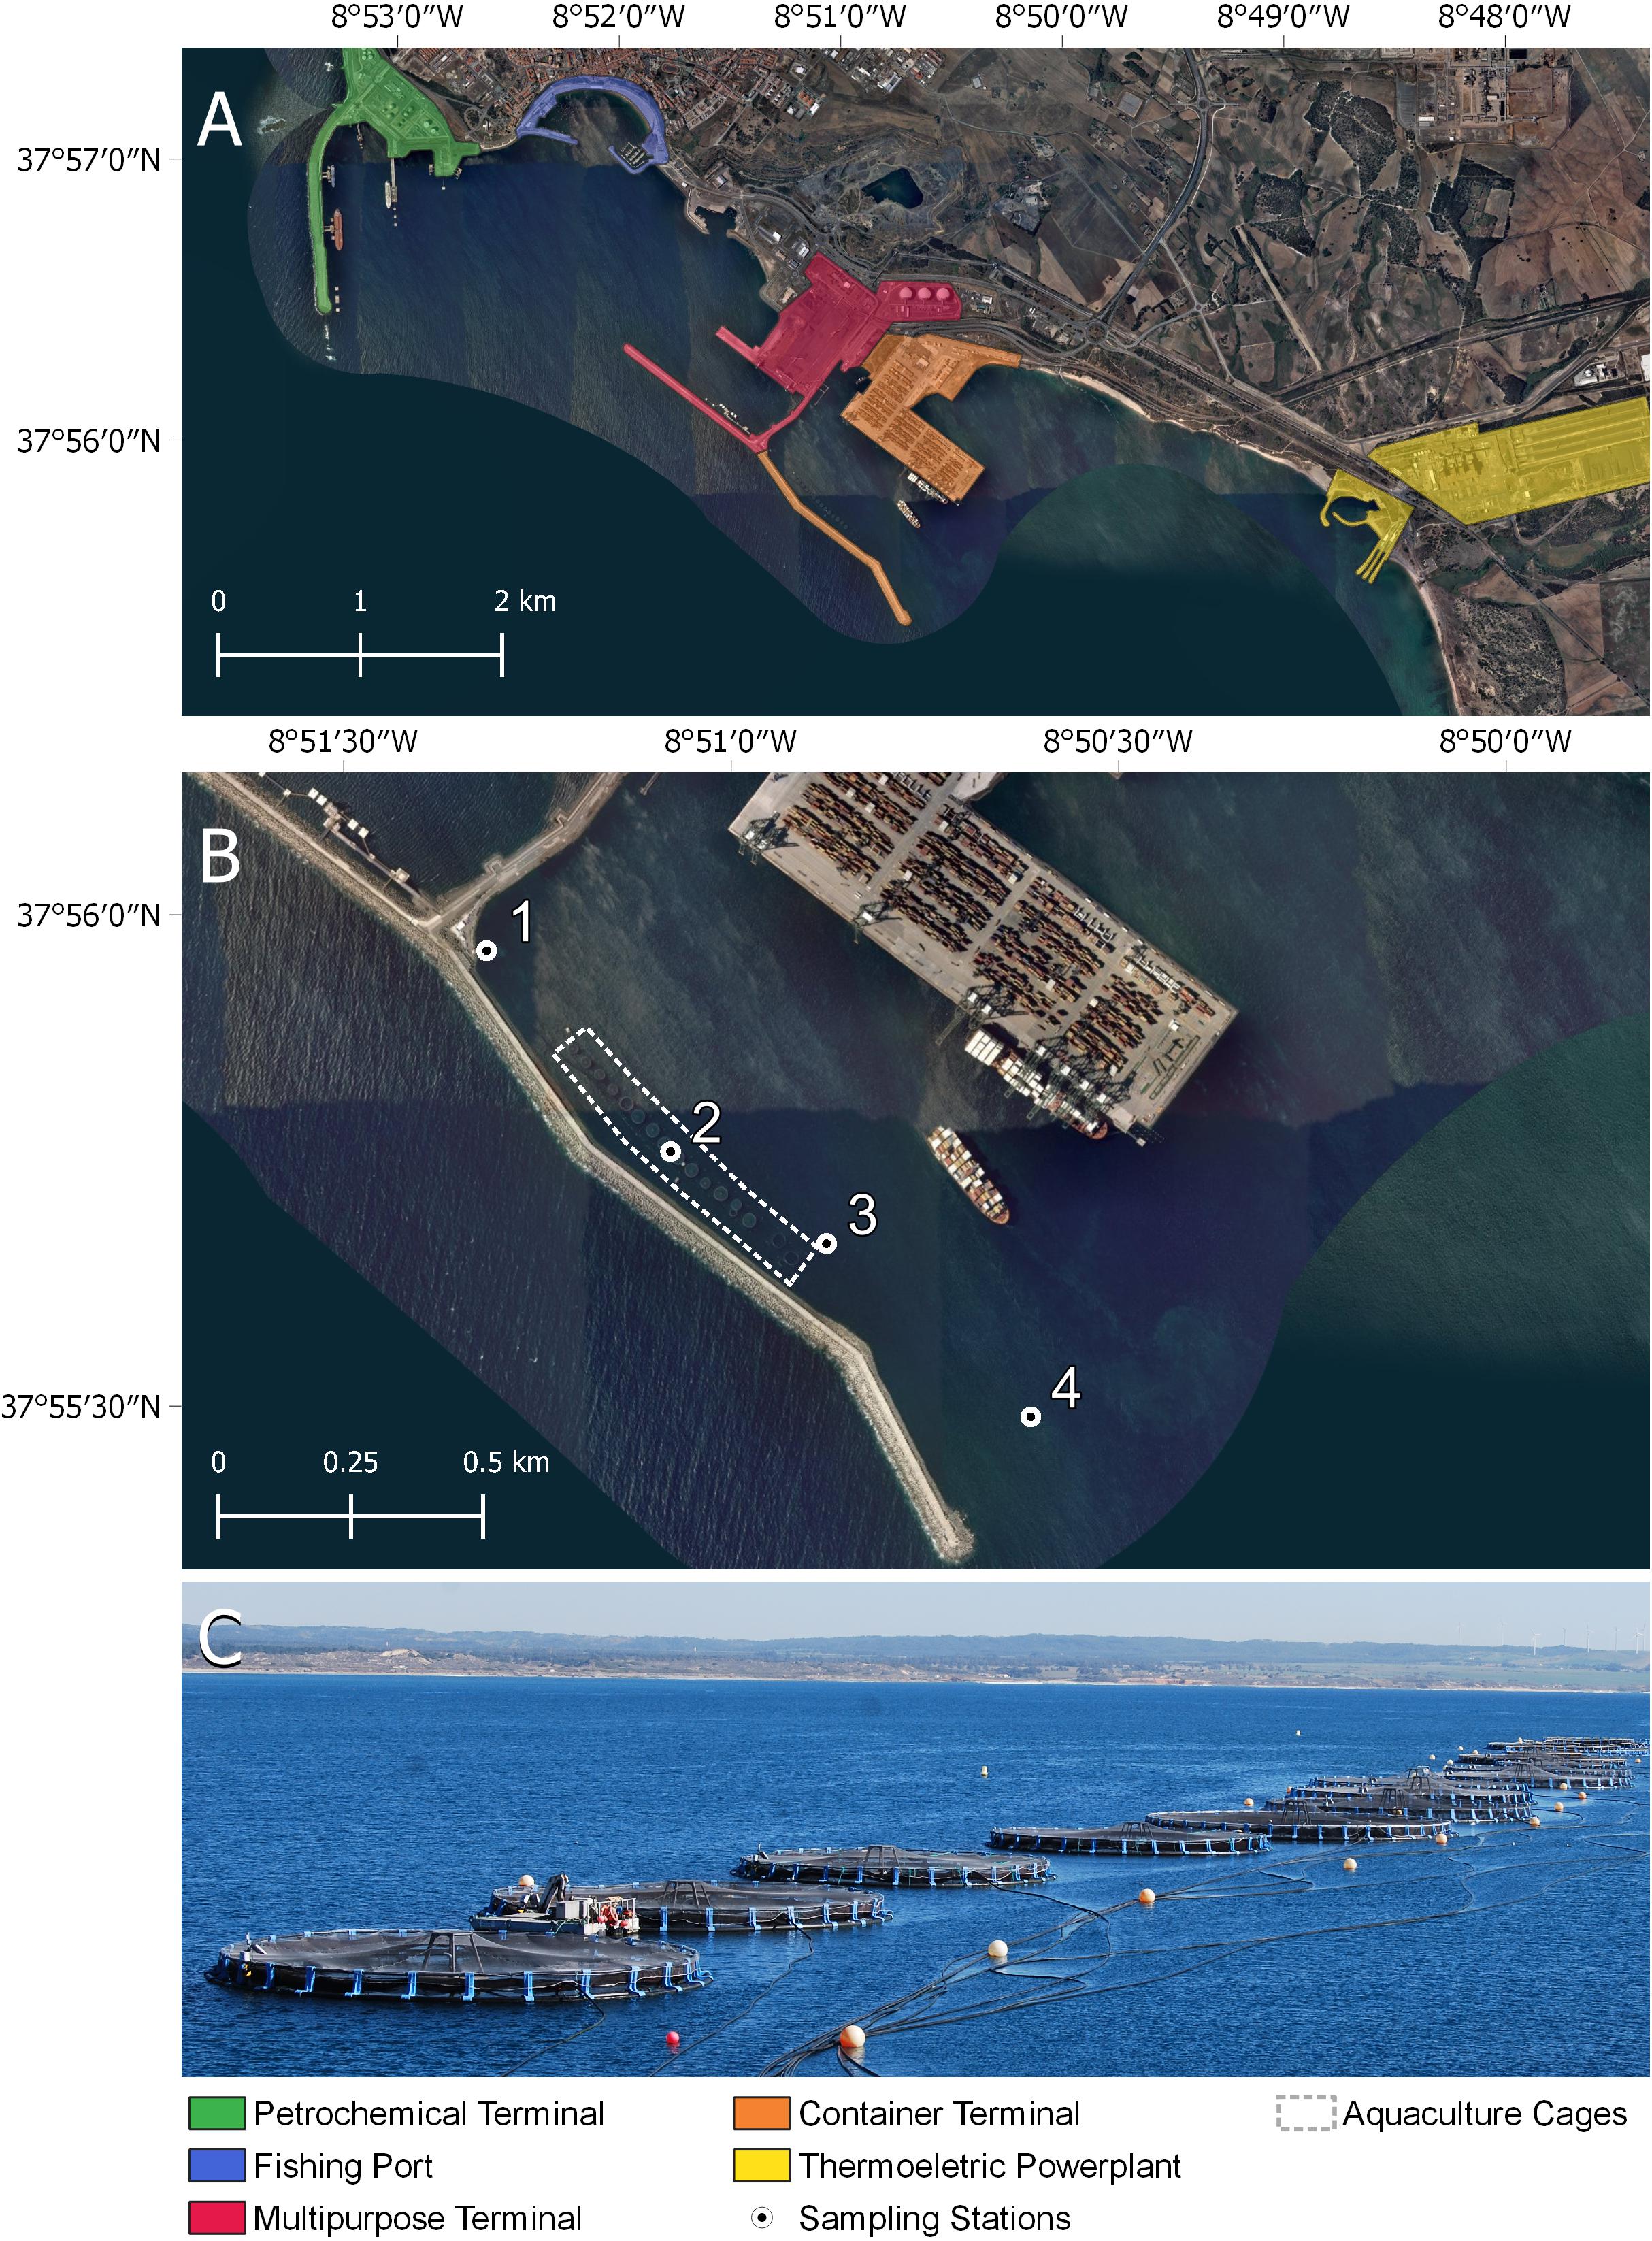
Figure 1. The study site: (A) overview of the Sines coast, highlighting the main infrastructures depending on the ocean; (B) aquaculture location inside the container terminal; (C) production cages (viewpoint from the ground facilities, near Station 1).
Water circulation in the Sines coastal area is conditioned by the dominant wind regime (Barton, 2001). Coastal upwelling is frequent during the spring and summer months, triggered by dominant northerly winds, pumping colder subsurface waters to the upper layers along the coast (Relvas et al., 2007; Kämpf and Chapman, 2016). Outside the upwelling season, the presence of a poleward flow is a well-established characteristic along the Portuguese west coast (Relvas et al., 2009). However, tide may also change local-scale circulation, generating tidal currents that overlap wind-induced currents (Trindade et al., 2016). Coastal topography and bathymetry also play an important role in shaping coastal circulation at a local scale. Water circulation in the vicinity of the study site is strongly conditioned by the breakwater, presenting lower velocities when compared with outside area. Tidal currents are the dominant forcing in this shallow area (mean depth of 24 m), promoting the water renewal of the system.
The aquaculture site is located near the container terminal (Figures 1B,C) and consists of 16 cages, each holding approximately 150,000 specimens at different stages of growth, allowing for a yearly production of up to 500 metric tons of European sea bass (Dicentrarchus labrax). It is an intensive system, with feed delivered continuously from land to the cages through a pressurized pipe system. A continuous adjustment of the amount of feed delivered to fish is made, based on a constant monitoring of fish behavior using underwater cameras. Table 1 summarizes the reference/range values of acceptable water quality parameters for marine finfish species, including the European sea bass.
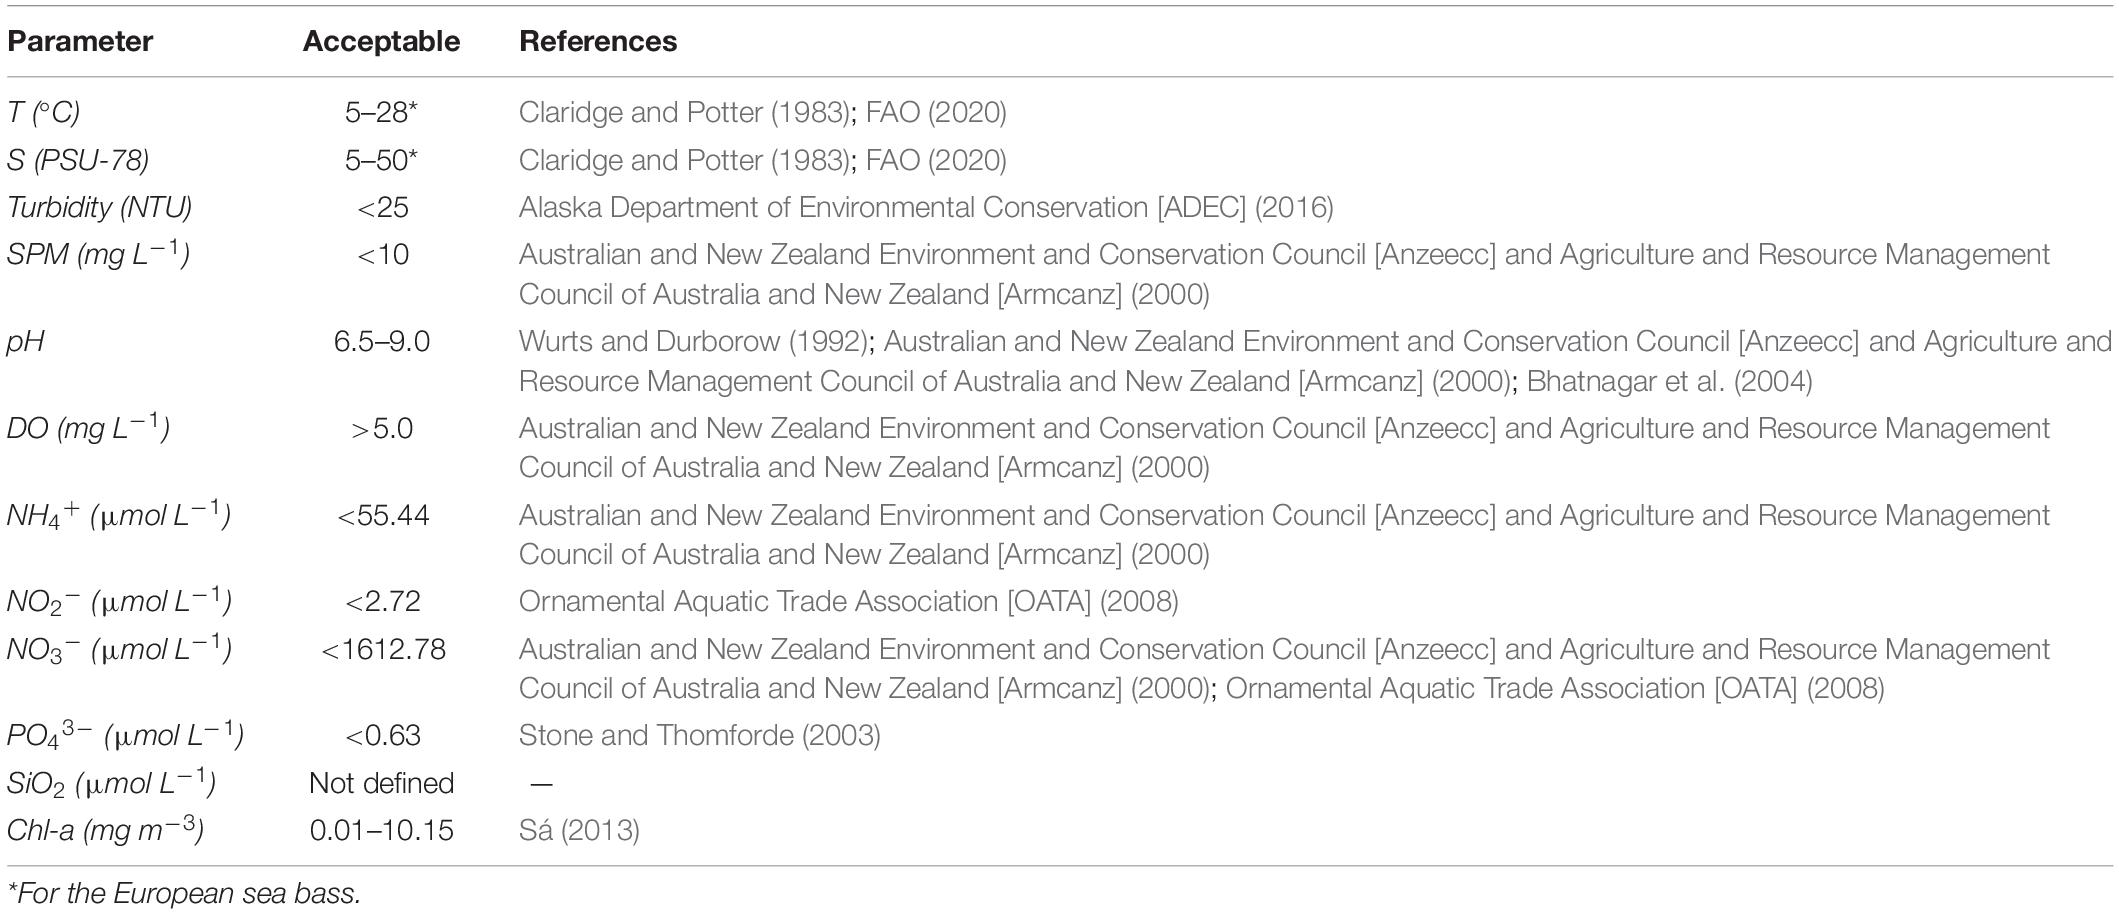
Table 1. Acceptable water quality parameters for marine finfish aquaculture.
Sampling and Processing
Physical, chemical, and biological in situ parameters were acquired at four sampling stations along the aquaculture units (Figure 1), one station north of the fish cages (Station 1, 14 m deep), other station between two cages in the middle of the production area (Station 2, 21 m deep), one station in the southern extremity of the cages (Station 3, 25 m deep), and the last station south of the cages transect (Station 4, 30 m deep). Samples and data were collected from June 2018 until April 2019 during four field campaigns, on 2018-06-29, 2018-10-25, 2019-03-12, and 2019-04-30. In the campaigns conducted in June and October 2018, only stations 1 and 3 were sampled. In total, 10 water quality parameters and indicators were evaluated in each campaign for each station, namely, temperature (T), pH, dissolved oxygen (DO), turbidity, SPM, nutrients (ammonia, nitrites and nitrates, phosphates, and silicates), and phytoplankton biomass indexed as chlorophyll-a concentration (Chl-a).
In situ temperature was measured using a Conductivity Temperature Depth probe (model NXIC, from FSI, Cataumet, Massachusetts, United States), whereas oxygen and pH measurements were performed using a multiparametric probe (model EXO2, from YSI, Yellow Springs, Ohio, United States). The aforementioned parameters were acquired along the water column at each sampling station. For the remaining parameters, that is, turbidity, SPM, nutrients, and Chl-a, surface (0.5-m depth), and bottom (12 m for Station 1, 20 m for Station 2, 22 m for Station 3, and 18 m for Station 4), water samples were collected at each sampling station for further laboratory analysis. Turbidity was determined using a laboratory compact infrared turbidity meter (Lovibond TB 210 IR). The remaining parameters were determined analytically in the laboratory and are described in Analytical Determinations.
The object of sampling and analysis in this study were the waters surrounding the aquaculture cages, not the farmed specimens. As such, ethical approval for this study was not required according to the Basel Declaration guidelines1.
Analytical Determinations
Suspended particulate matter was determined by filtration of surface and bottom water samples with Whatman GF/F filters (nominal pore size 0.7-μm and 4.4-cm diameter), previously submitted to 450°C for 4 h and weighted following Van Der Linde (1998). After filtration, the filters were carefully rinsed with ultrapure water to eliminate the salt and dried for 2 h at 50°C and weighted again. This process was done twice, to guarantee correct filter dryness given by the weight stability. The SPM concentration was then obtained through the weight difference (before and after filtration) and considering the filtered volume. For the determination of the organic and inorganic fractions, the filters were submitted further to 450°C for 4 h and weighted. Again, the organic and inorganic fractions were obtained through weight differences.
To determine the inorganic nutrient concentrations, triplicate water samples were collected in each sampling station at surface and bottom waters. These were filtered through GF/C Whatman filters (nominal pore size 1.2-μm and 4.7-cm diameter) and immediately frozen for later colorimetric analysis with a Tecator FIAstar 5000 Analyser, North Ryde, New South Whales, Australia. Nitrite (NO2–), nitrate (NO3–), phosphates (PO43–, hereafter referred to as P), and silicates (SiO2, hereafter referred to as Si) were determined according to Bendschneider and Robinson (1952); Grasshoff (1977), Murphy and Riley (1962), and Fanning and Pilson (1973), respectively. As nitrite levels in coastal waters are typically very low, the nitrite and nitrate sum were used (NO3– + NO2–, hereafter referred to as N). Ammonium (NH4+) concentrations were determined using manual colorimetric methods in filtered samples according to Koroleff (1969). Detection limits (DLs) determined were 0.16 μmol L–1 for P, 0.20 μmol L–1 for NH4+, 0.36 μmol L–1 for N, and 7.12 μmol L–1 for Si.
Chlorophyll-a concentration was obtained by pigment analysis using high-performance liquid chromatography. Surface and bottom water samples for each sampling station were filtered onto Whatman GF/F filters (nominal pore size 0.7-μm and 2.5-cm diameter). The filters were frozen and kept at −80°C until extraction. Pigments were extracted with 3 mL of 95% cold-buffered methanol (2% ammonium acetate) for 30 min at −20°C, in the dark. Pigment extracts were analyzed using a Shimadzu (Tokyo, Japan) Prominence-I LC 2030C 3D with a Fluorescent Detector [Shimadzu RF-20A Prominence (e.g., 350–800 nm)], with the LabSolution Lite version 5.82 software. Chromatographic separation was carried out using a monomeric C8 column (Symmetry C8, 15 cm long, 4.6 mm in diameter, and 3.5-μm particle size). The solvent gradient followed Zapata et al. (2000), adapted by Mendes et al. (2007), with a flow rate of 1 mL min–1, an injection volume of 100 μL, and 40-min elution program.
Statistical Analysis
Descriptive statistics were used to report acquired and determined data. For the parameters obtained with probes (T, S, pH) and turbidity, the mean of each sampling station is reported numerically. Besides, mean values for collected data in each field campaign (all stations averaged) are also provided. In addition, standard deviation is reported for each mean. Suspended particulate matter and its organic and inorganic fractions are given as the total average of all sampling stations obtained in field campaigns. Vertical profiles are shown graphically for DO, and mean values for data collected during field campaigns (all stations averaged) are provided. Nutrient concentrations were reported numerically as averages of all stations per sampling campaign, due to high percentage of results obtained below the determined DL of the analytical methods. The maxima obtained for each nutrient in each campaign are also reported. Chlorophyll-a concentrations were described through the determined range of values and graphically detailing all results.
Results
Temperature (Table 2) shows seasonal trends, increasing from June (2018-06-29: 15.86°C ± 0.40°C) to October (2018-10-25: 17.80°C ± 0.37°C) and decreasing toward March (2019-03-12: 15.15°C ± 0.23°C) and April (2019-04-30: 15.17°C ± 0.18°C). Salinity shows little variability throughout the sampling campaigns, varying from a minimum station average of 35.72 (both stations 1 and 3 in June: 2018-06-29) to a maximum of 36.06 (Station 4 in April: 2019-04-30). The vertical profiles of temperature and salinity for each station showed weak gradients along the water column: temperature decreased 0.74°C in average, whereas salinity average variation along the water column was 0.10. The pH displays an increase throughout the sampling campaigns, varying from 8.25 ± 0.03 in June (2018-06-29) to 8.42 ± 0.05 in October (2018-10-25) and to 8.77 ± 0.10 in April (2019-04-30). No pH data were obtained in March (2019-03-12). Along the water column, the pH variation was in the order of hundredths (except in Station 3 in April, where the variation was in the order of tenths). For the three parameters mentioned above, in all campaigns, all sampling stations showed great similarity to each other. Turbidity obtained in June (2018-06-29), October (2018-10-25), March (2019-03-12), and April (2019-04-30) was 0.96 ± 0.38, 1.15 ± 0.45, 2.59 ± 2.89, and 1.18 ± 0.66 NTU, respectively. Stations 1 and 4 always presented the lowest turbidity values (station average). Along the water column, turbidity was higher at the bottom than at the surface in all sampling stations in the four campaigns.
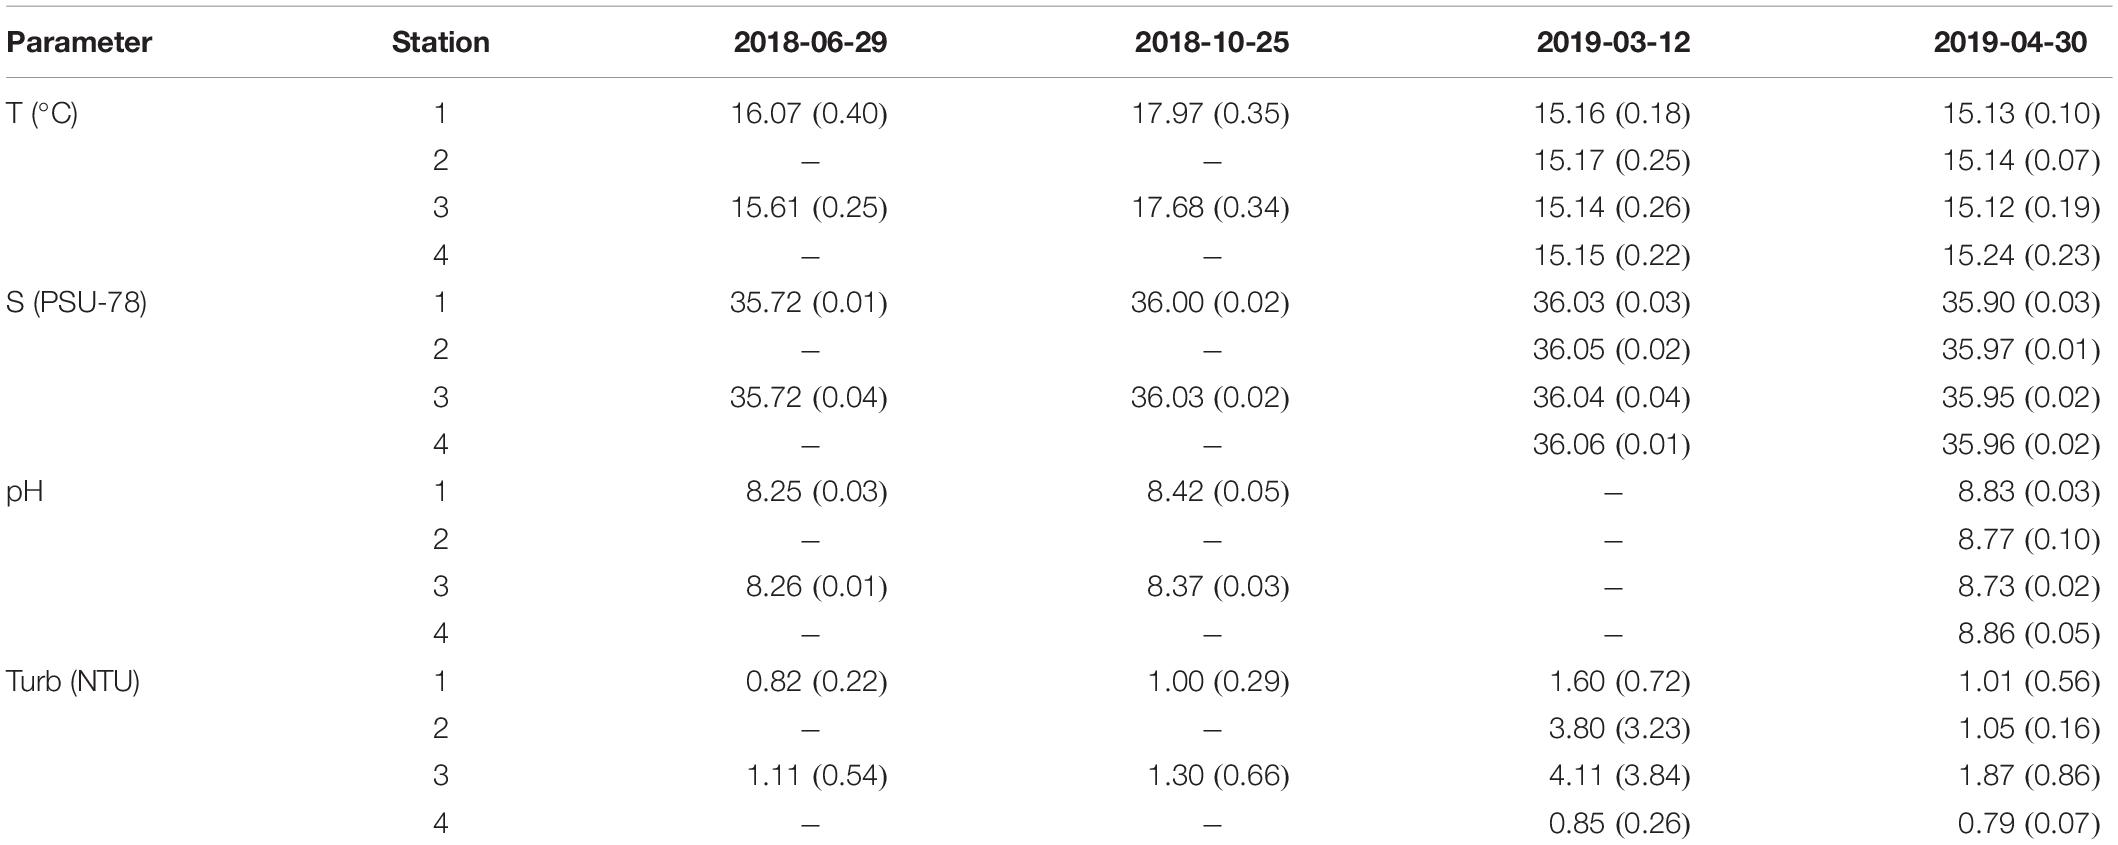
Table 2. Physical–chemical parameters per station average and standard deviation for each campaign: 2018-06-29, 2018-10-25, 2019-03-12, and 2019-04-30.
The inorganic and organic fractions of the SPM are shown in Figure 2. Suspended particulate matter concentration never exceeded 6.80 mg L–1 (absolute maximum found in 2019-03-12 in Station 3, bottom). Generally, the surface stations are dominated by the organic fraction, with 65.78 ± 10.56% of particulate organic matter, whereas bottom stations are dominated by the inorganic fraction, with an average of 56.85% ± 15.38% of particulate inorganic matter.
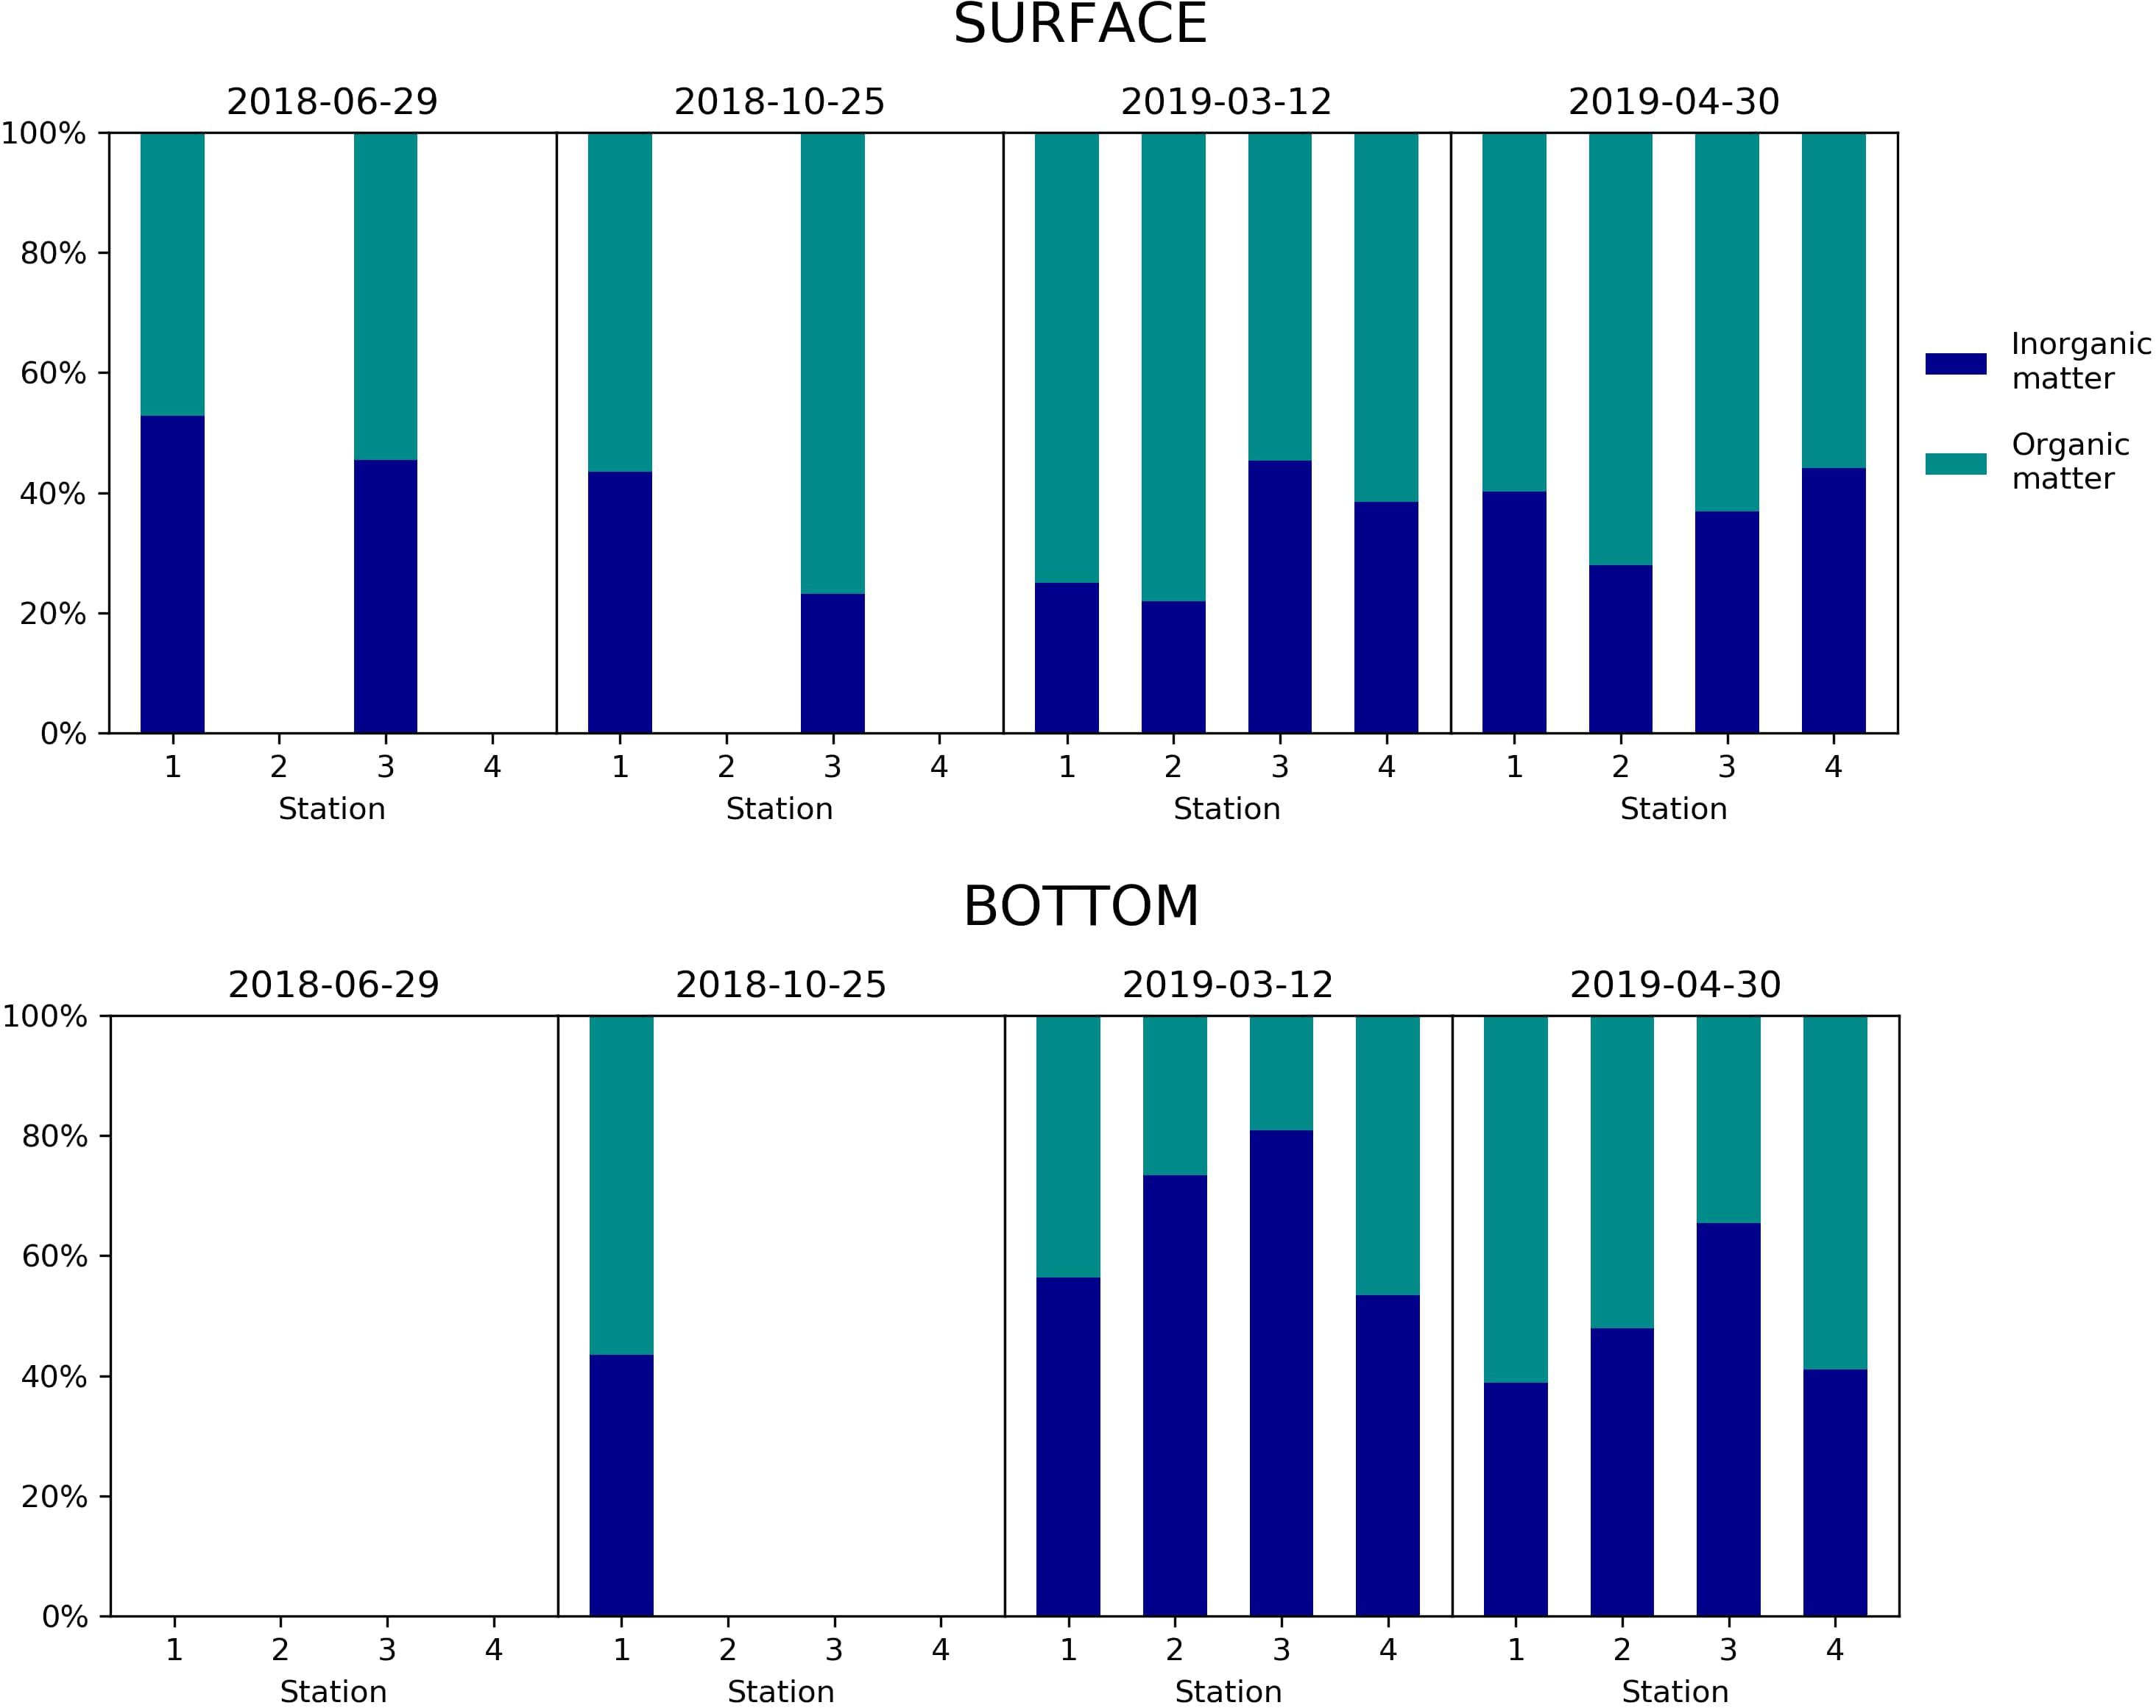
Figure 2. Percentage of particulate inorganic and organic matter in surface (top) and bottom (down) samples on 2018-06-29, 2018-10-25, 2019-03-12, and 2019-04-30. In June 2018, only stations 1 and 3 were sampled on the surface. In October 2018, only stations 1 and 3 were sampled at the surface, and only Station 1 was sampled on the bottom.
The nutrient concentrations are given in Table 3. High percentages of nutrients below the DL of the used methods denote low concentrations. N concentrations increased from June until March (1.02 ± 0.26 μmol L–1 in 2018-06-29, 3.27 ± 1.07 μmol L–1 in 2018-10-25, and 12.46 ± 3.87 μmol L–1 in 2019-03-12) and decreased in April (4.14 ± 1.77 μmol L–1 in 2019-04-30). The maximum concentrations obtained for each campaign, in chronological order, were 1.21, 4.08, 19.68, and 7.69 μmol L–1. Regarding NH4+, almost every station presented values below the DL. In October (2018-10-25), only one station (Station 3 - bottom) displayed a quantifiable concentration of 0.95 μmol L–1 of NH4+, and in March (2019-03-12), only stations 2 and 3 (bottom) had quantifiable NH4+ concentrations with an average of 1.33 ± 0.45 μmol L–1 (maximum of 1.64 μmol L–1). The P concentrations were 0.38 ± 0.01 μmol L–1 in June (2018-06-29), 0.49 ± 0.19 μmol L–1 in October (2018-10-25), 0.29 ± 0.10 μmol L–1 in March (2019-03-12), and 0.18 ± 0.00 μmol L–1 in April (2019-04-30). In the same chronological order, the found maxima were 0.39, 0.72, 0.40, and 0.19 μmol L–1 of P. All Si measurements were below the DL.
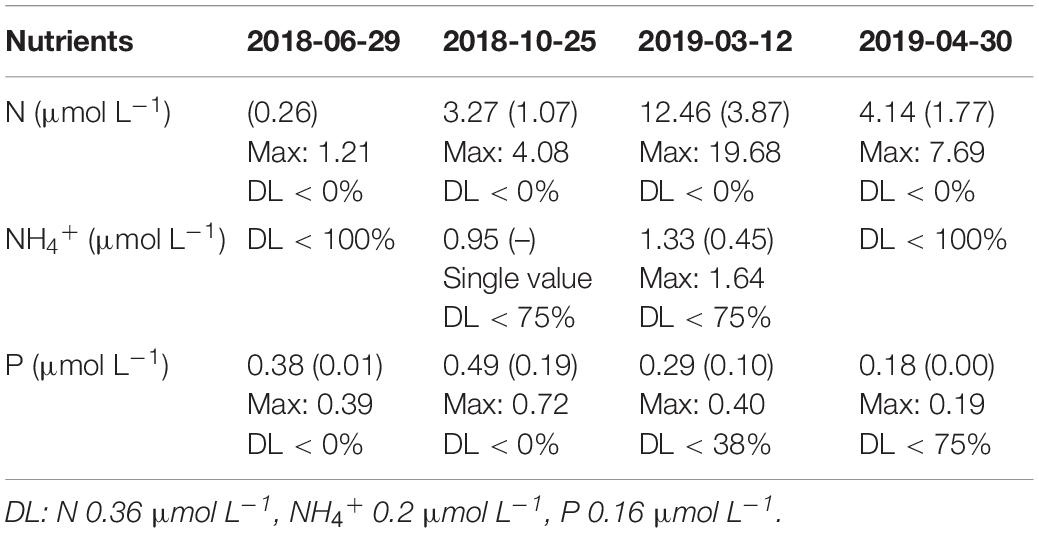
Table 3. Nutrients per field campaign average, standard deviation, maximum, and percentage of samples above the DL of the method.
The variations of DO concentration along the water column in the sampling stations throughout the field campaigns are shown in Figure 3. The DO average was 7.99 ± 0.38 mg L–1 in June (2018-06-29), 7.60 ± 0.33 mg L–1 in October (2018-10-25), 8.07 ± 0.44 mg L–1 in March (2019-03-12), and 8.43 ± 0.52 mg L–1 in April (2019-04-30). In the field campaigns carried out in March and April, where all stations were sampled, Station 4 always presented the highest oxygen concentrations (absolute maximum 9.65 mg L–1 in April at the subsurface). In March, Station 2 clearly had the lowest concentrations of oxygen, although it is never less than 7.23 mg L–1. Nonetheless, the absolute minimum was found at Station 3 in October (6.92 mg L–1 at the bottom).
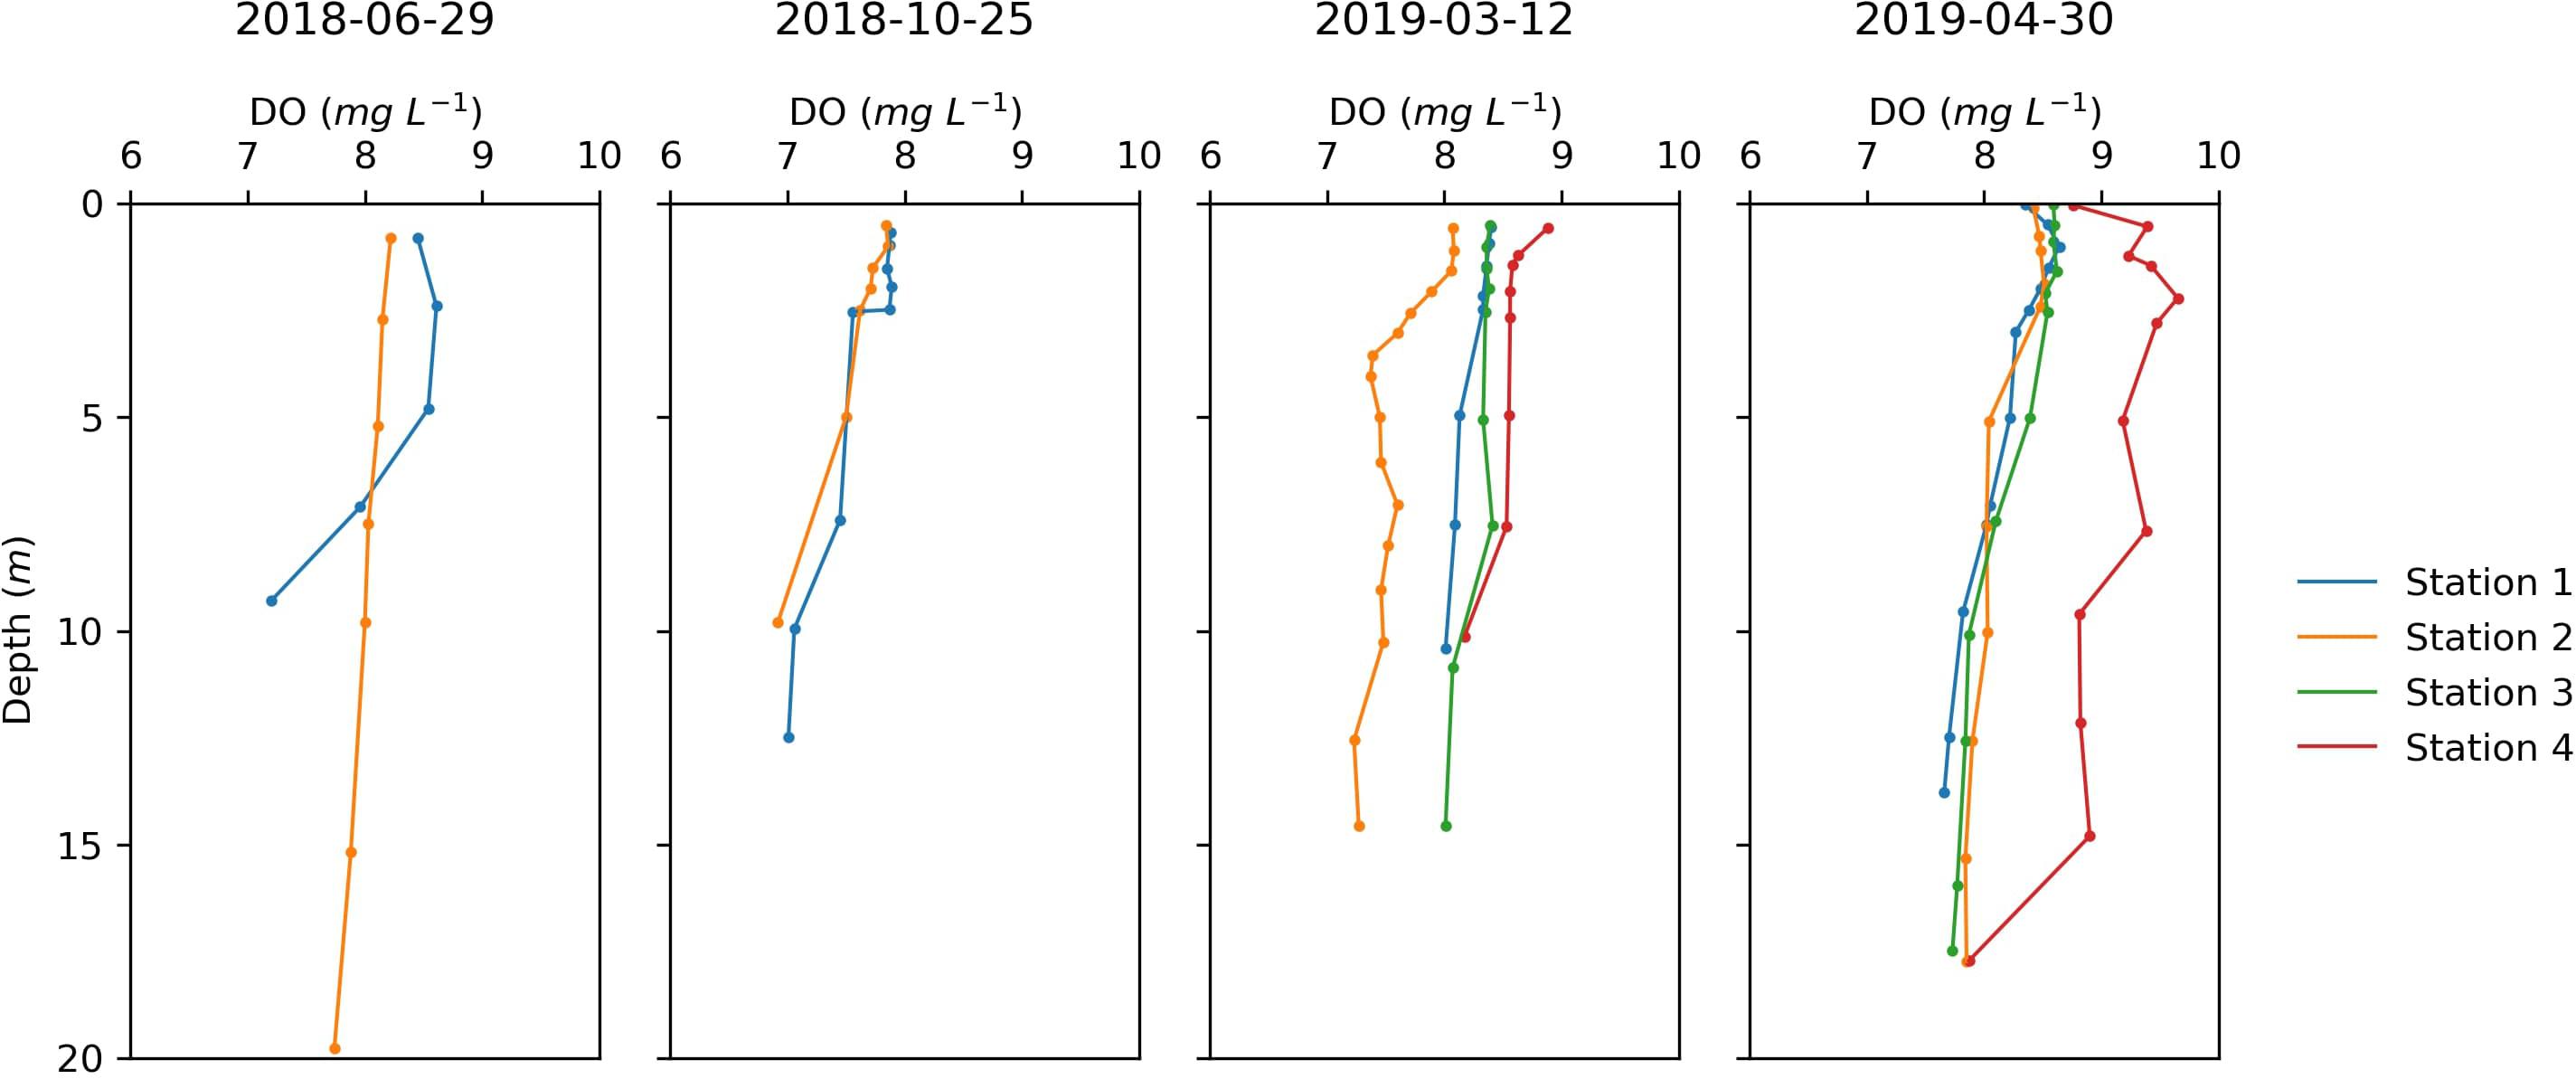
Figure 3. Dissolved oxygen in the water column of the four sampling stations on 2018-06-29, 2018-10-25, 2019-03-12, and 2019-04-30. In June and October 2018, only stations 1 and 3 were sampled.
The Chl-a concentrations, index for phytoplankton biomass, in surface and bottom waters for all campaigns are shown in Figure 4. The obtained Chl-a ranged between 0.18 and 7.38 μg L–1. Maxima were found in April (2019-04-30) in all four stations at surface and bottom, with the absolute maximum in Station 2 (7.38 μg L–1).
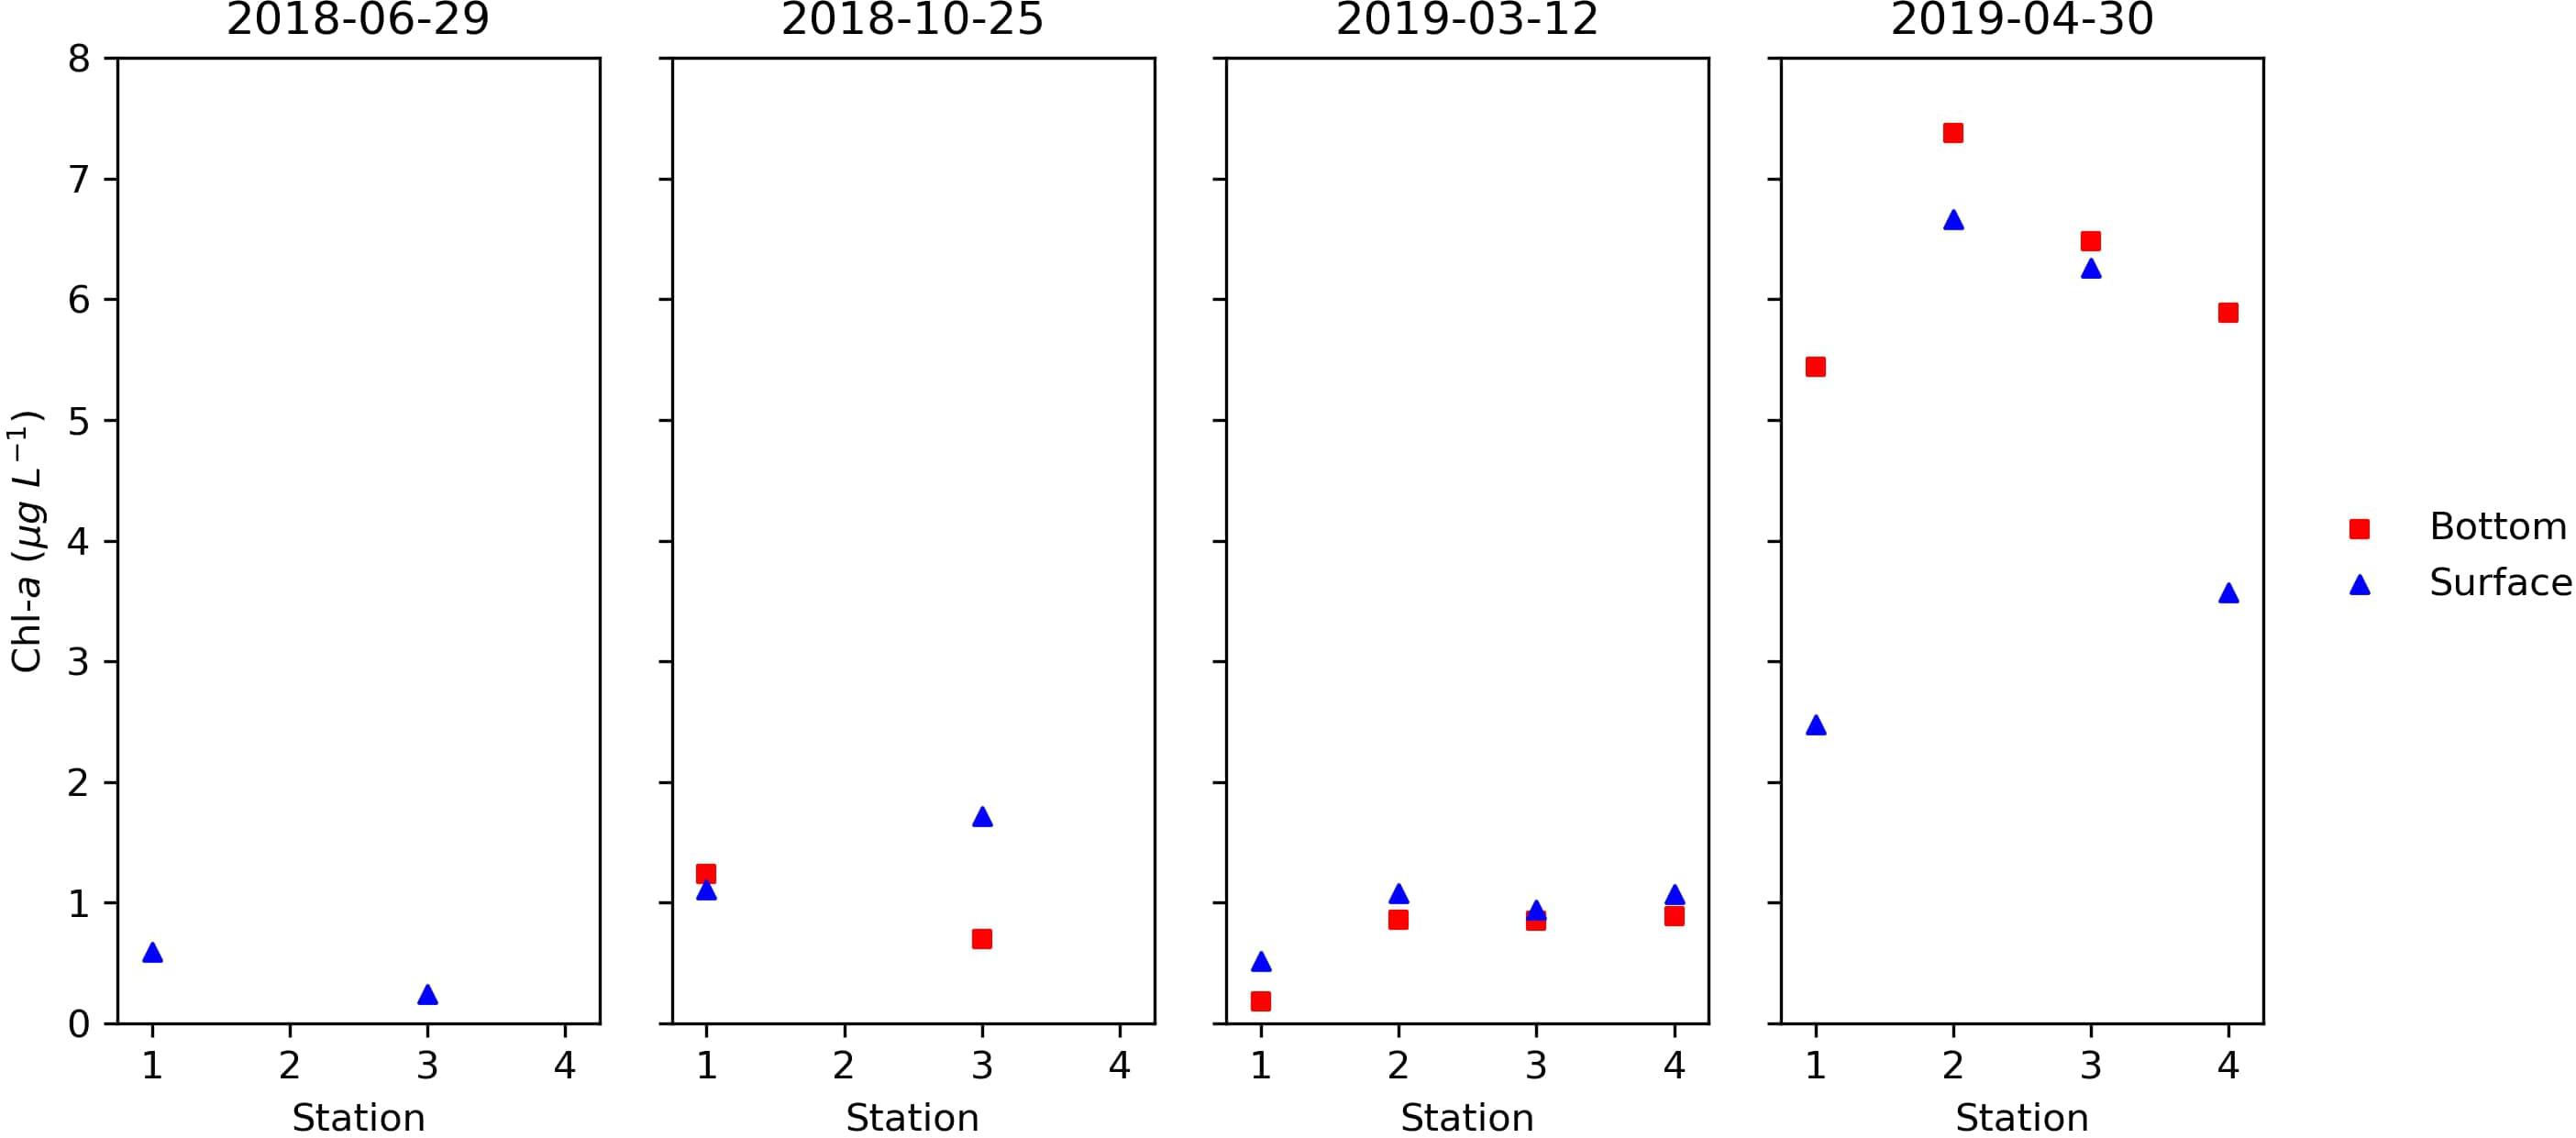
Figure 4. Total Chl-a in μg L–1, at the surface (top) and bottom (down) of the four sampling stations on 2018-06-29, 2018-10-25, 2019-03-12, and 2019-04-30. In June 2018, only stations 1 and 3 were sampled on the surface. In October 2018, only stations 1 and 3 were sampled.
Discussion
Aquaculture activities are usually associated with detrimental environmental effects on its surroundings (Read and Fernandes, 2003; Cole et al., 2009), with its magnitude determined by the type of aquaculture and the hydrodynamic and biogeochemical features of the site. The preliminary results presented in this work, however, reveal a scenario of no impact of an intense finfish aquaculture on local water quality. This is evidenced by the range of values of monitored parameters, and their variation throughout the sampling campaigns, which are within the reference ranges considered acceptable for each parameter. Only one parameter, namely, the P concentration obtained in October in Station 3, was above the ideal threshold.
Dissolved oxygen concentrations, for instance, do not show evidence of oxygen depletion or a sharp decrease in the aquaculture vicinity, a frequent occurrence at such sites, irrespective of local environmental conditions or cultivated fish species (Wu et al., 1994; Sarà, 2007; Sriyasak et al., 2015). Organic matter produced by fish feces or unconsumed feed is usually pointed out as the major cause of oxygen consumption at aquaculture sites (Wu et al., 1994; Pérez et al., 2014). However, the results suggest that this is not the case at Sines and that the aquaculture activity is not promoting anoxia. Besides, the dominance of the inorganic matter fraction in bottom waters indicates a stronger influence from the sediment substrate than organic matter originated from aquaculture activity in the region.
Water transparency parameters such as turbidity also indicate good water quality conditions, as well as the nutrient concentrations. Observations indicate that the system is not being enriched by nutrient, meaning that the aquaculture is not promoting the eutrophication of the site. Again, this is a common outcome of aquaculture in semiclosed coastal areas, such as bays, chocked lagoons, or estuaries (Islam, 2005; Qi et al., 2019).
Chlorophyll-a concentrations usually respond to the nutrient-rich water at aquaculture sites by having concentrations above background levels (Sarà et al., 2011). Our Chl-a results are contrary to this, considering that the observed values fall within the typical range observed for the Portuguese coastal area (Brito et al., 2012; Sá, 2013). The evident phytoplankton biomass maximum in April is a common feature in the Atlantic (north Atlantic bloom at mid and high latitudes), also being related to the coastal upwelling events that occur in spring and summer months along the Portuguese coast (Kämpf and Chapman, 2016).
The apparent undetectable impacts of the aquaculture on the monitored parameters may be due to their rapid dispersion. The strong influence of the costal hydrodynamic, together with the tide, and the wide entrance and the relatively shallow depth of the port promote a low residence time of the water at the cage site. As such, the good water quality observed in all campaigns can be explained by intense flushing and water renewal at the site. This feature of a well-mixed system is evident in the temperature and salinity vertical profiles, denoting the absence of stratification in the water column in all four sampling stations, for all campaigns.
Concluding Remarks
So far, results do not reveal any detrimental impact of the production units on local water quality. Although more research is needed, these preliminary findings suggest that (1) the hydrodynamic regime in the production area is responsible for a fast renewal of the water in the system, preventing local water quality conditions to deteriorate, and (2) the feeding strategy (forms to supply the feed, frequency of feeding, etc.) and the dimension of production units are not imposing stress on the receiving waters.
New approaches to aquaculture have been recently proposed aiming at reducing habitat degradation, among other benefits (Barrington et al., 2010; Granada et al., 2016; Gunning et al., 2016; Nardelli et al., 2019; Zhou et al., 2019). However, such novel and frequently costly approaches may be considered unnecessary, if site conditions allow for the operation of aquaculture production without noticeable environmental impacts. The aquaculture production area described in this work seems to be such a place, as suggested by the preliminary results. Further monitoring campaigns are necessary, however, for a full assessment of the influence of fish farming at the site. The present survey has been extended in time and has been complemented with analysis of satellite imagery of ocean color and temperature. Therefore, a more comprehensive approach will be completed and published in the future.
Data Availability Statement
The raw data supporting the conclusions of this manuscript will be made available by the authors, without undue reservation, to any qualified researcher.
Ethics Statements
The object of sampling and analysis in this study were the waters sorrowing the aquaculturecages, not the farmed specimens. As such, ethical approval for this study was not required according to the Basel Declaration guidelines (BDS: http://www.basel-declaration.org).
Author Contributions
MG and MM led the design and development of the manuscript. LP, AC, CS, and VB contributed to results analysis and the development of the manuscript. All authors equally contributed to data acquisition during the monitoring campaigns.
Conflict of Interest
The authors declare that the research was conducted in the absence of any commercial or financial relationships that could be construed as a potential conflict of interest.
Funding
The field work described in this work was fully supported by project PiscisMod - Roteiro para a sustentabilidade Ambiental e otimização da eficiência energética em aquicultura de peixes, financed by the MAR2020 (Operation MAR.02.01.01.FEAMP.0049), a national financing instrument of the European Maritime and Fisheries Fund. MM, LP, and AC were also supported by FCT/MCTES (PIDDAC) through project LARSyS - FCT Pluriannual funding 2020-2023 (UIDB/EEA/50009/2020), as well as the publication fees.
Footnotes
References
Aguilar-Manjarrez, J., Lovatelli, A., and Soto, D. (2013). “Expanding mariculture farther offshore: Technical, environmental, spatial and governance challenges,” in FAO Technical Workshop, Orbetello.
Alaska Department of Environmental Conservation [ADEC] (2016). Listing Methodology for Determining Water Quality Impairments from Turbidity GUIDANCE FINAL Listing Methodology for Determining Water Quality Impairments from Turbidity. Anchorage: ADEC.
Australian and New Zealand Environment and Conservation Council [Anzeecc], and Agriculture and Resource Management Council of Australia and New Zealand [Armcanz] (2000). Australian and New Zealand Guidelines for Fresh and Marine Water Quality. Available at: https://www.waterquality.gov.au/media/57.
Barrington, K., Ridler, N., Chopin, T., Robinson, S., and Robinson, B. (2010). Social aspects of the sustainability of integrated multi-trophic aquaculture. Aquac. Int. 18, 201–211. doi: 10.1007/s10499-008-9236-0
Barton, E. D. (2001). Canary and Portugal currents. Encycl. Ocean Sci. 1, 380–389. doi: 10.1006/rwos.2001.0360
Bendschneider, K., and Robinson, R. J. (1952). A new spectrophotometric method for the determination of nitrite in sea water. J. Mar. Res. 11, 87–96.
Bhatnagar, A., Jana, S. N., Garg, S. K., Patra, B. C., Singh, G., and Barman, U. K. (2004). “Water quality management in aquaculture,” in Course Manual of Summerschool on Development of Sustainable Aquaculture Technology in Fresh Andsaline Waters, Hisar, 203–210.
Brito, A. C., Quental, T., Coutinho, T. P., Branco, M. A. C., Falcão, M., Newton, A., et al. (2012). Phytoplankton dynamics in southern Portuguese coastal lagoons during a discontinuous period of 40 years: an overview. Estuar. Coast. Shelf Sci. 110, 147–156. doi: 10.1016/J.ECSS.2012.04.014
Cao, L., Wang, W., Yang, Y., Yang, C., Yuan, Z., Xiong, S., et al. (2007). Environmental impact of aquaculture and countermeasures to aquaculture pollution in China. Env. Sci. Pollut. Res. 14, 452–462. doi: 10.1065/espr2007.05.426
Claridge, P. N., and Potter, I. C. (1983). Movements, abundance, age composition and growth of bass, dicentrarchus labrax, in the severn estuary and inner bristol channel. J. Mar. Biol. Assoc. U. K. 63, 871–879. doi: 10.1017/S0025315400071289
Cole, D. W., Cole, R., Gaydos, S. J., Gray, J., Hyland, G., Jacques, M. L., et al. (2009). Aquaculture: environmental, toxicological, and health issues. Int. J. Hyg. Environ. Health 212, 369–377. doi: 10.1016/j.ijheh.2008.08.003
Diana, J. S. (2009). Aquaculture production and biodiversity conservation. Bioscience 59, 27–38. doi: 10.1525/bio.2009.59.1.7
Fanning, K. A., and Pilson, M. (1973). On the Spectrophotometric determination of dissolved silica in natural waters. Anal. Chem. 45, 136–140. doi: 10.1021/ac60323a021
FAO (2016). The State of World Fisheries and Aquaculture 2016: Contributing to Food Security and Nutrition for All. Rome: FAO.
FAO (2020). Fisheries & Aquaculture - Cultured Aquatic Species Information Programme - Dicentrarchus labrax (Linnaeus, 1758). Available online at: http://www.fao.org/fishery/culturedspecies/Dicentrarchus_labrax/en (Accessed January 22, 2020)Google Scholar
Ferreira, J. G., Hawkins, A. J. S., and Bricker, S. B. (2007). Management of productivity, environmental effects and profitability of shellfish aquaculture-the Farm Aquaculture Resource Management (FARM) model. Aquaculture 264, 160–174. doi: 10.1016/j.aquaculture.2006.12.017
Focardi, S., Corsi, I., and Franchi, E. (2005). Safety issues and sustainable development of European aquaculture: new tools for environmentally sound aquaculture. Aquac. Int. 13:3. doi: 10.1007/s10499-004-9036-0
Frankic, A., and Hershner, C. (2003). Sustainable aquaculture: developing the promise of aquaculture. Aquac. Int. 11, 517–530. doi: 10.1023/B:AQUI.0000013264.38692.91
Gentry, R. R., Lester, S. E., Kappel, C. V., White, C., Bell, T. W., Stevens, J., et al. (2017). Offshore aquaculture: spatial planning principles for sustainable development. Ecol. Evol. 7, 733–743. doi: 10.1002/ece3.2637
Godfray, H. C. J., Beddington, J. R., Crute, I. R., Haddad, L., Lawrence, D., Muir, J. F., et al. (2010). Food security: the challenge of feeding 9 billion people. Science. 327, 812–818. doi: 10.1126/science.1185383
Granada, L., Sousa, N., Lopes, S., and Lemos, M. F. L. (2016). Is integrated multitrophic aquaculture the solution to the sectors’ major challenges? – a review. Rev. Aquac. 8, 283–300. doi: 10.1111/raq.12093
Grasshoff, K. (1977). in Methods of Seawater Analysis, ed. K. Grasshoff Weinheim (New York, NY: Verlag Chemie).
Grigorakis, K., and Rigos, G. (2011). Aquaculture effects on environmental and public welfare - The case of mediterranean mariculture. Chemosphere 85, 899–919. doi: 10.1016/j.chemosphere.2011.07.015
Guerrero-Galván, S. R., Páez-Osuna, F., Ruiz-Fernández, A. C., and Espinoza-Angulo, R. (1998). Seasonal variation in the water quality and chlorophyll a of semi-intensive shrimp ponds in a subtropical environment. Hydrobiologia 391, 33–45. doi: 10.1023/A:1003590625379
Gunning, D., Maguire, J., and Burnell, G. (2016). The development of sustainable saltwater-based food production systems: a review of established and novel concepts. Water 8:598. doi: 10.3390/w8120598
Islam, M. S. (2005). Nitrogen and phosphorus budget in coastal and marine cage aquaculture and impacts of effluent loading on ecosystem: review and analysis towards model development. Mar. Pollut. Bull. 50, 48–61. doi: 10.1016/j.marpolbul.2004.08.008
Jansen, H. M., Reid, G. K., Bannister, R. J., Husa, V., Robinson, S. M. C., Cooper, J. A., et al. (2016). Discrete water quality sampling at open-water aquaculture sites: limitations and strategies. Aquac. Environ. Interact. 8, 463–480. doi: 10.3354/AEI00192
Kalantzi, I., and Karakassis, I. (2006). Benthic impacts of fish farming: meta-analysis of community and geochemical data. Mar. Pollut. Bull. 52, 484–493. doi: 10.1016/j.marpolbul.2005.09.034
Kämpf, J., and Chapman, P. (2016). “The canary/iberia current upwelling system BT - Upwelling systems of the world,” in A Scientific Journey to the Most Productive Marine Ecosystems, eds J. Kämpf and P. Chapman (Cham: Springer International Publishing), 203–250. doi: 10.1007/978-3-319-42524-5_6
Koroleff, F. (1969). Direct determination of ammonia in natural waters as indophenol blue. Int. Rep. Cons. Int. Explor. Mer. 3, 19–22.
Mendes, C. R., Cartaxana, P., and Brotas, V. (2007). HPLC determination of phytoplankton and microphytobenthos pigments: comparing resolution and sensitivity of a C18 and a C8 method. Limnol. Oceanogr. Methods 5, 363–370. doi: 10.4319/lom.2007.5.363
Murphy, J., and Riley, J. P. (1962). A modified single solution method for the determination of phosphate in natural waters. Anal. Chim. Acta 27, 31–36. doi: 10.1016/S0003-2670(00)88444-5
Nardelli, A. E., Chiozzini, V. G., Braga, E. S., and Chow, F. (2019). Integrated multi-trophic farming system between the green seaweed Ulva lactuca, mussel, and fish: a production and bioremediation solution. J. Appl. Phycol. 31, 847–856. doi: 10.1007/s10811-018-1581-4
Pérez, Ó, Almansa, E., Riera, R., Rodriguez, M., Ramos, E., Costa, J., et al. (2014). Food and faeces settling velocities of meagre (Argyrosomus regius) and its application for modelling waste dispersion from sea cage aquaculture. Aquaculture 420–421, 171–179. doi: 10.1016/j.aquaculture.2013.11.001
Qi, Z., Shi, R., Yu, Z., Han, T., Li, C., Xu, S., et al. (2019). Nutrient release from fish cage aquaculture and mitigation strategies in Daya Bay, southern China. Mar. Pollut. Bull. 146, 399–407. doi: 10.1016/j.marpolbul.2019.06.079
Read, P., and Fernandes, T. (2003). Management of environmental impacts of marine aquaculture in Europe. Aquaculture 226, 139–163. doi: 10.1016/S0044-8486(03)00474-5
Relvas, P., Barton, E. D., Dubert, J., Oliveira, P. B., Peliz, Á, da Silva, J. C. B., et al. (2007). Physical oceanography of the western Iberia ecosystem: latest views and challenges. Prog. Oceanogr. 74, 149–173. doi: 10.1016/j.pocean.2007.04.021
Relvas, P., Luís, J., and Santos, A. M. P. (2009). Importance of the mesoscale in the decadal changes observed in the northern Canary upwelling system. Geophys. Res. Lett. 36, doi: 10.1029/2009GL040504
Sá, C. (2013). Ocean Colour Off the Portuguese Coast: Chlorophyll a Products Validation and Applicability. Available online at: http://hdl.handle.net/10451/10592 (accessed February 14, 2020).
Salgueiro, D. V., De Pablo, H., Neves, R., and Mateus, M. (2015). Modelling the thermal effluent of a near coast power plant (Sines, Portugal). J. Integr. Coast. Zo. Manag. 15, 533–544. doi: 10.5894/rgci577
Sarà, G. (2007). A meta-analysis on the ecological effects of aquaculture on the water column: dissolved nutrients. Mar. Environ. Res. 63, 390–408. doi: 10.1016/j.marenvres.2006.10.008
Sarà, G., Lo Martire, M., Buffa, G., Mannino, A. M., and Badalamenti, F. (2007). The fouling community as an indicator of fish farming impact in Mediterranean. Aquac. Res. 38, 66–75. doi: 10.1111/j.1365-2109.2006.01632.x
Sarà, G., Lo Martire, M., Sanfilippo, M., Pulicanò, G., Cortese, G., Mazzola, A., et al. (2011). Impacts of marine aquaculture at large spatial scales: evidences from N and P catchment loading and phytoplankton biomass. Mar. Environ. Res. 71, 317–324. doi: 10.1016/j.marenvres.2011.02.007
Smith, M. D., Roheim, C. A., Crowder, L. B., Halpern, B. S., Turnipseed, M., Anderson, J. L., et al. (2010). Sustainability and Global Seafood. Science 327, 784–786. doi: 10.1126/science.1185345
Sriyasak, P., Chitmanat, C., Whangchai, N., Promya, J., and Lebel, L. (2015). Effect of water de-stratification on dissolved oxygen and ammonia in tilapia ponds in Northern Thailand. Int. Aquat. Res. 7, 287–299. doi: 10.1007/s40071-015-0113-y
Stone, N., and Thomforde, H. (2003). Understanding Your Fish Pond Water Analysis Report. Pine Bluff, AR: University of Arkansas at Pine Bluff.
Tovar, A., Moreno, C., Mánuel-Vez, M. P., and García-Vargas, M. (2000). Environmental impacts of intensive aquaculture in marine waters. Water Res. 34, 334–342. doi: 10.1016/S0043-1354(99)00102-5
Trindade, A., Peliz, A., Dias, J., Lamas, L., Oliveira, P. B., and Cruz, T. (2016). Cross-shore transport in a daily varying upwelling regime: a case study of barnacle larvae on the southwestern Iberian coast. Cont. Shelf Res. 127, 12–27. doi: 10.1016/j.csr.2016.08.004
Troell, M., Naylor, R. L., Metian, M., Beveridge, M., Tyedmers, P. H., Folke, C., et al. (2014). Does aquaculture add resilience to the global food system? Proc. Natl. Acad. Sci. U.S.A. 111, 13257–13263. doi: 10.1073/pnas.1404067111
United Nations (2020). Oceans - United Nations Sustainable Development Goals (Goal 14). Available online at: https://www.un.org/sustainabledevelopment/oceans/ (Accessed January 12, 2020).
Van Der Linde, D. W. (1998). “Protocol for the determination of total suspended matter in Oceans and coastal zones,” in CEC-JRC-Ispra Technical note I., 98, Ispray, 182.
Wu, R. S. S., Lam, K. S., MacKay, D. W., Lau, T. C., and Yam, V. (1994). Impact of marine fish farming on water quality and bottom sediment: a case study in the sub-tropical environment. Mar. Environ. Res. 38, 115–145. doi: 10.1016/0141-1136(94)90004-3
Wurts, W. A., and Durborow, R. (1992). Interactions of pH, Carbon Dioxide, Alkalinity and Hardness in Fish Ponds. South. Reg. Aquac. Cent. 3363. Available online at: https://www.researchgate.net/publication/237475261_Interactions_of_pH_Carbon_Dioxide_Alkalinity_and_Hardness_in_Fish_Ponds (Accessed January 22, 2020).
Zapata, M., Rodríguez, F., and Garrido, J. L. (2000). Separation of chlorophylls and carotenoids from marine phytoplankton: a new HPLC method using a reversed phase C8 column and pyridine-containing mobile phases. Mar. Ecol. Prog. Ser. 195, 29–45.
Keywords: aquaculture, sea bass, water quality, environmental impacts, coastal management, Dicentrarchus labrax
Citation: Gomes M, Correia A, Pinto L, Sá C, Brotas V and Mateus M (2020) Coastal Water Quality in an Atlantic Sea Bass Farm Site (Sines, Portugal): A First Assessment. Front. Mar. Sci. 7:175. doi: 10.3389/fmars.2020.00175
Received: 31 October 2019; Accepted: 05 March 2020;
Published: 03 April 2020.
Edited by:
Catarina Eira, University of Aveiro, PortugalReviewed by:
Laura Ribeiro, Portuguese Institute of Ocean and Atmosphere (IPMA), PortugalPedro M. Costa, UCIBIO Rede de Química e Tecnologia, Portugal
Copyright © 2020 Gomes, Correia, Pinto, Sá, Brotas and Mateus. This is an open-access article distributed under the terms of the Creative Commons Attribution License (CC BY). The use, distribution or reproduction in other forums is permitted, provided the original author(s) and the copyright owner(s) are credited and that the original publication in this journal is cited, in accordance with accepted academic practice. No use, distribution or reproduction is permitted which does not comply with these terms.
*Correspondence: Marcos Mateus, bWFyY29zLm1hdGV1c0B0ZWNuaWNvLnVsaXNib2EucHQ=