 Trevor John Kenchington
 Daphne E. Themelis
 Shannon Colleen DeVaney
 Ellen Lorraine Kenchington
- 1Ocean and Ecosystem Sciences Division, Department of Fisheries and Oceans, Bedford Institute of Oceanography, Dartmouth, NS, Canada
- 2Population Ecology Division, Department of Fisheries and Oceans, Bedford Institute of Oceanography, Dartmouth, NS, Canada
- 3Life Science Department, Los Angeles Pierce College, Woodland Hills, CA, United States
Midwater trawl surveys were conducted during 2007–10 at meso- and bathypelagic depths in and near The Gully, a large submarine canyon off Nova Scotia that is also a Marine Protected Area. The fish assemblage in the canyon was highly diverse but 20 species together comprised more than 90% of the catch by number and 80% by weight. The most numerous was the gonostomatid Cyclothone microdon while the myctophid Benthosema glaciale was next in number and first in weight. Most of those principal species would be expected in catches taken in oceanic waters beyond the shelf break. Only the bottom-spawning Melanostigma atlanticum was, within the surveyed area, distinctively a species of the canyon. Multivariate analyses showed that the primary variations in the assemblage were aligned with drivers that act in open ocean: depth, water mass and both diel and seasonal cycles. However, the effect of the canyon was evident in an up-canyon decline in the catches of most species. We hypothesize that the oceanic species are passively carried into The Gully by the known inflow and are there exposed to intense predation, depleting their numbers. We estimate that biomass flux as sufficient to support the Marine Protected Area's signature species: northern bottlenose whales (Hyperoodon ampullatus).
Introduction
The pelagic realm of the oceans comprises the great majority of the habitable volume on our planet (Herring, 2002). The fishes of subsurface waters, in the meso- and bathypelagic zones (200–4,000 m depth), fill important roles in transport of carbon and energy downwards from the surface, as well as in their recycling and utilization (e.g., Davison et al., 2013; Hudson et al., 2014; Trueman et al., 2014). Those fishes have most often been studied over abyssal depths, though sometimes over continental slopes and rises while, in recent decades, there has been increased attention to the deep pelagic ichthyofaunas over seamounts and mid-ocean ridges (e.g., Moore et al., 2003b, 2004; Sutton et al., 2008, 2013; Cook et al., 2013). In contrast, surveys of meso- or bathypelagic fishes in submarine canyons have been limited. Apart from studies using visual observations or gears better suited to demersal species (e.g., Baker et al., 2012; Ross et al., 2015), there have been a few continental-slope surveys that have sampled waters overlying minor canyons (e.g., Feagans-Bartow and Sutton, 2014) but none that have fished within a canyon, below its rim depth, using midwater trawls larger than macroplankton nets. In consequence, the similarities and differences between the pelagic fish assemblages within canyons and those outside their mouths are essentially unknown.
The Gully, a canyon incised into the continental margin immediately east of Nova Scotia's Sable Island (Figures 1, 2), is one of the few large enough for deployment of trawls within its depths. The thalweg meanders ≈50 km from the canyon head to the shelf break, where it is ≈2,000 m below the surface, and can be traced from there down the continental slope (for a detailed description, see Kenchington et al., 2014b). Certain components of The Gully's biota are notably enriched, including the cold-water corals, euphausiids, cetaceans, and some exploited fishes (Breeze, 2002; Sameoto et al., 2002; Cogswell et al., 2009; Whitehead, 2013). Early studies sought an explanation for that enrichment through local enhancement and retention of primary production (e.g., Kepkay et al., 2002; Mann, 2002). However, Greenan et al. (2013, 2014) have shown that phytoplankton production over the canyon is unaffected by the presence of deep water beneath, while any local enhancement would be swiftly advected over adjacent banks. Thus, the enrichment must depend on allochthonous energy. Various routes for its input have been suggested (e.g., Harding, 1998; Hooker et al., 2002a; Moors-Murphy, 2014) but no attempts have yet been made to quantify any of the biomass fluxes.
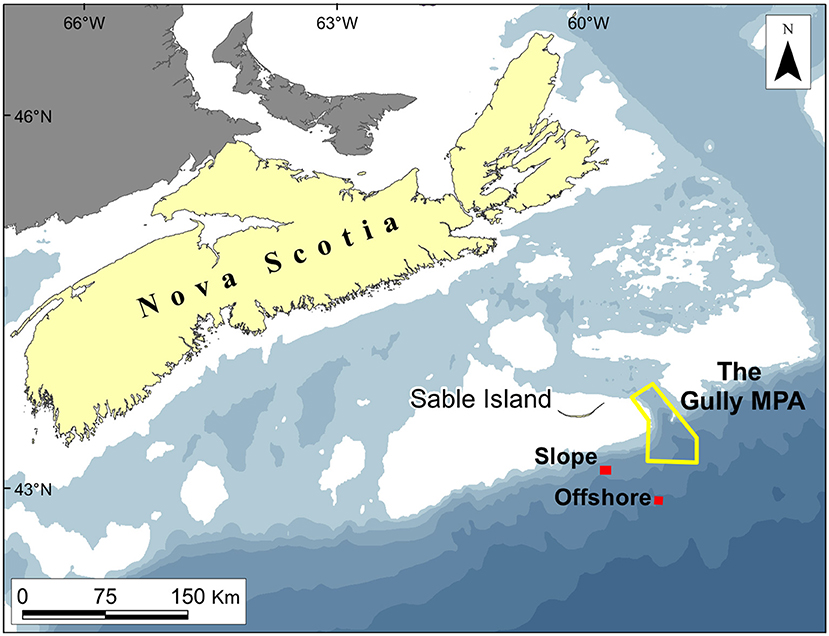
Figure 1. Location of The Gully and The Trough, showing the Offshore and Slope trawling stations: White areas are shallower than 100 m, while those shaded in the lightest blue are 100–200 m deep.
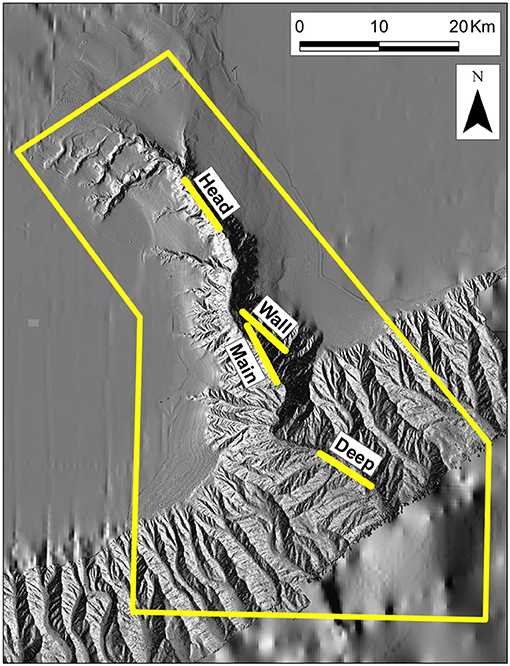
Figure 2. Bathymetry of The Gully, showing the locations of four trawling stations: The boundary of the MPA is in yellow.
In 2004, much of The Gully was declared a Marine Protected Area (“MPA:” Department of Fisheries Oceans, 2008), with objectives that include both preservation of the diverse biota and conservation of an endangered population of northern bottlenose whales (Hyperoodon ampullatus). Dozens of those whales feed in the canyon at any one time, primarily in the central canyon and southwards to the mouth, especially along the eastern side. They probably consume mostly armhook squid (Gonatus fabricii and G. steenstrupi) and certainly eat quantities far larger than could be supported by local primary production (Hooker et al., 2001, 2002a,b; O'Brien and Whitehead, 2013). Thus, the MPA's management requires, inter alia, both documentation of the species found within its boundaries and an understanding of their trophic structures, especially the energy sources that support the whales.
Themelis and Halliday (2012) surveyed the oceanic mesopelagic fishes occurring south of the shelf break off Nova Scotia, and there have been similar surveys elsewhere in the northwest Atlantic (e.g., McKelvie, 1985; Moore et al., 2003b, 2004). However, fieldwork over the adjacent continental slopes has been limited (Baker et al., 2012; Feagans-Bartow and Sutton, 2014). Meanwhile, although there have been extensive studies of The Gully's ecosystems, before the research reported here knowledge of the subsurface nekton and micronekton was confined to the results of limited sampling with macroplankton nets, which suggested enriched abundances (Sameoto et al., 2002).
Four midwater-trawl surveys of The Gully were therefore undertaken during the summers of 2007–09 and in March 2010, as both a first investigation of the pelagic fauna of a canyon and a contribution toward the knowledge requirements of the MPA's management (Kenchington et al., 2009, 2014a). Identification of specimens is on-going but the surveys took at least 255 species of fish, in addition to crustaceans, cephalopods, and other invertebrates (Kenchington et al., 2014b; MacIsaac et al., 2014). Almost all specimens of the most abundant fish species in the catches, Cyclothone microdon, were badly damaged in the trawls and could be neither counted nor measured. However, Thompson and Kenchington (2017) have examined that species' distribution in the canyon, based on catch weights. Kenchington et al. (2018) explored the distributions and length frequencies of each of the other 19 abundance- and biomass-dominant fish species individually, comparing information from The Gully to prior knowledge of their biology. Eleven of the 20 species had distributions centred outside the canyon mouth, with abundances and biomass densities decreasing up-canyon. A further six were at least as abundant in the central canyon as immediately outside its mouth but declined toward the canyon head. Moreover, 11 of the 19 species for which length data are available showed an up-canyon increase in the average sizes of the individuals taken, resulting from more-pronounced declines in the abundance of smaller size-classes than those of large ones (Kenchington et al., 2018). However, neither of those studies attempted statistical tests of the observed trends.
We here present multispecies analyses of the assemblage structure of the 19 species examined by Kenchington et al. (2018), with particular attention to the effects of the canyon on that structure, and we test departures from spatial and temporal equality of catches across the survey design. Building on our results, and drawing on the body of multi-disciplinary research that has been conducted in the canyon, we argue that passive horizontal drift of mesopelagic fish biomass, into The Gully from outside the MPA, is of sufficient magnitude to be the principal energy source supporting the northern bottlenose whales.
Oceanography of the Gully
The observed distributions of the fishes can only be understood within the context of the water masses and movements both inside the canyon and outside its mouth. Both the general patterns and the specific conditions at the times of the midwater-trawl surveys have been drawn together by Kenchington et al. (2009, 2014b), as a foundation for interpretation of the catch data. Key points are summarized here.
In most respects other than size, The Gully (Figure 2) is broadly typical of submarine canyons. The surrounding banks give it a rim depth of 200 m or less, though the steep canyon walls begin at 400 m. Unusually, the canyon's head communicates, via continental-shelf valleys, with a large, mid-shelf basin, “The Trough” (Figure 1), providing an outlet for water flowing up-canyon.
The water masses in and over The Gully are complex and variable. At the surface, most of the canyon is covered by the three layers typical of the Scotian Shelf, which include a Cold Intermediate Layer (“CIL”) at ≈50–100 m depth, with a typical summer core temperature of ≈5°C. The surface temperature varies from 0°C in winter to >20°C in summer. A southwest-going shelf-break current carries those waters across the mouth of The Gully. Weaker anticyclonic gyres circle the surrounding banks, while exchange between the gyres produces a south-westward flow over much of the canyon (taking about 3 days to cross the deep water) and a slower north-eastward drift across its head. The surface waters show no apparent response to the presence of the deep hole in the seabed beneath them (Greenan et al., 2013, 2014; Kenchington et al., 2014b).
The Scotian Shelf waters extend to a shelf/slope boundary which usually lies well south of the shelf break, though its location is exceptionally variable, on temporal scales from seasons to days. South of that boundary, the surface layer is composed of Warm Slope Water (“WSW”), formed on the fringe of the Gulf Stream near Cape Hatteras. Although a surface water, WSW reaches depths of 300 or 400 m, its temperature off Nova Scotia typically being 10–13°C, though WSW exceeds 20°C at the surface in summer. It sometimes extends under the CIL, where it contributes to the Scotian Shelf's subsurface temperature maximum. The main body of the WSW flows eastward, far south of The Gully. However, its complex northern fringe moves irregularly south-westwards over the continental slope (Kenchington et al., 2014b).
In 2007, there was exceptional development of the CIL across the Scotian Shelf (Petrie et al., 2008), with core temperatures over the Gully at the time of the survey as low as 0°C. The shelf/slope boundary was pushed southwards, beyond the trawling stations. That year, the spring blooms of phytoplankton and copepods were exceptionally rich. Although long over by the time of the survey, the effects of the enhanced production may have lingered higher in the trophic system. In contrast, the 2008 survey encountered conditions approximating to long-term summer norms. At regional and seasonal scales, 2009 was even closer to those norms but the survey that year coincided with the presence of a tongue of WSW moving across the canyon's mouth, which pushed the shelf/slope boundary to the shelf break (Kenchington et al., 2009, 2014b).
Beneath the Scotian Shelf waters and the WSW, there are two alternative water masses: Labrador Sea Water (“LSW”) and North Atlantic Central Water, the former being slightly colder and less saline at any given depth. Each water mass is cooler at greater depths, reaching ≈4°C by 1,000 m. Most of the subsurface waters within the canyon and outside its mouth during the 2007, 2009, and 2010 surveys resembled North Atlantic Central Water, though the canyon head was flooded with water that had the characteristics of LSW. Data from the 2008 survey are deficient but suggest that the canyon may then have contained LSW throughout, beneath the surface layers (Kenchington et al., 2009, 2014b).
In The Gully, north of the shelf break and below 500 m depth, cross-canyon flows are minimal but there is a net inflow, estimated at a mean rate through the central canyon and below 200 m depth of 35,500 m3s−1–sufficient to carry a water particle from the canyon's mouth to its head in 30 days. That inflow, while slow (generally <0.02 ms−1), implies upwelling in the upper canyon, with a vertical velocity of 14 m per day, which carries the water over the canyon rim or else into the shelf valleys and thence to The Trough. In the central canyon, the inflow is displaced toward the eastern side, while (particularly in summer) there is a reverse flow to the west, at depths of about 300–600 m, which may form part of a weak gyre (Greenan et al., 2013, 2014; Shan et al., 2014a,b).
Materials and Methods
Field Methods
The field methods of the surveys have been presented in full by Kenchington et al. (2009, 2014a) and are only summarized here. There were three surveys in late summer (August/September of 2007–09) and one in early spring (March 2010). The primary gear, and the only one that contributed data to the present analyses, was the International Young Gadoid Pelagic Trawl (“IYGPT”), a midwater otter trawl with a mouth area of approximately 60 m2, which was fitted with a rigid, “aquarium” codend. That gear was fished on six fixed stations (Figures 1, 2). Three (named “Head,” “Main,” and “Deep”) were arrayed along The Gully's thalweg, respectively, near the canyon head, in the central canyon and outside its mouth. One was placed over the canyon wall (“Wall Station”). The other two were, respectively, south of the canyon at a location previously sampled by Themelis and Halliday (2012; “Offshore Station”) and over the continental slope, away from the canyon's influence but where seabed depth matched that on the Main Station (“Slope Station”). The Offshore and Wall stations were only worked as time permitted. The Slope Station was added to the design in 2009 and sampling there was limited.
Like all other pelagic sampling gears, the IYGPT is selective and samples only a portion of the species and sizes present. The detailed work needed for inter-calibration of alternative gears (e.g., Potter et al., 1990) has never proven practical at mesopelagic depths, hence the selective properties of particular nets can only be inferred from the catches taken. Thus, the assemblage examined here is one conditioned on the characteristics of the IYGPT and, indeed, of the IYGPT when fished according to the design of the Gully surveys.
The water column was divided into four depth strata (0–250, 250–750, 750–1,250, and 1,250–1,750 m—the latter not fully sampled until the final survey), though seabed depths prevented fishing in the deeper strata on some stations. By intent, two replicate sets were deployed to each available stratum, at each station, in each of daylight and night (avoiding periods within 1 h of sunrise and sunset) during each survey, though typically only one set per survey was made above 250 m in daylight at each station. On the Main Station in 2007, a third replicate was attempted in each stratum and diel phase. Constraints on available ship time and other factors (primarily weather) prevented completion of that survey design, but six additional, non-standard sets were made, most reaching below the deepest available or defined stratum on the respective station. The numbers of replicates yielding data suitable for the multivariate analyses reported here are given in Table 1.
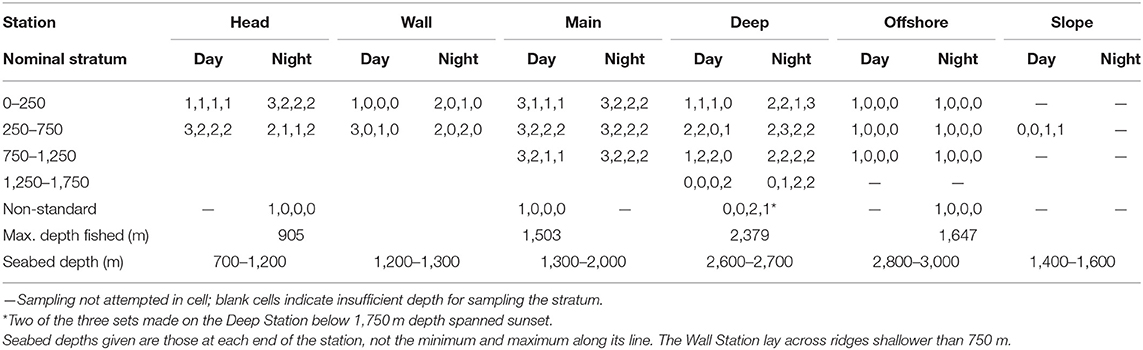
Table 1. Number of IYGPT sets in each cell of the survey design that were utilized in the multivariate analyses (numbers of sets made in each of the 2007, 2008, 2009, and 2010 surveys shown in sequence).
The IYGPT is an open net and each set necessarily fished from the surface to its maximum depth and back. Sets that fished below 250 m followed double-oblique (“V”) profiles throughout. Most fished for 30 min above 250 m and 60 min in each deeper stratum. However, the protocol followed in 2007 produced slightly faster shooting and hauling when above the set's nominal stratum, while the extra-deep, non-standard sets made on the Deep Station (Table 1) each fished for more than 60 min below 1,250 m (Kenchington et al., 2009, 2014a). At those depths and in summer, catches of the species analysed here were limited (Kenchington et al., 2018), hence the prolonged fishing had little effect on the analysed data. Sets which fished no deeper than 250 m were towed for 60 min, most following a “W” profile, and so their catches were not directly comparable with those from deeper sets.
The nets were towed at a speed through the water averaging ≈1.5 m.s−1 (Kenchington et al., 2014a). With 60 m2 nominal mouth area, they therefore filtered ≈5 × 10⁵ m3 during each set made to 750 m depth, ≈8 × 10⁵ m3 during each 1,250 m set and ≈11 × 105 m3 during each 1,750 m set. The wingspread and headline height of the IYGPT, the speed of the net through the water and the time spent in passing through each depth range were, necessarily, variable, both from set to set and within individual sets. However, excluding sets rejected as non-standard, deviations from the standard overall volumes filtered were minimal (Kenchington et al., 2009, 2014a) and no post-hoc standardization of catches was necessary. There were larger within-set variations in the volumes filtered at particular depths, resulting from changeable net geometry and irregularities in tow profiles, but corrections for those could not be applied as the precise depths of capture of the various species cannot be known.
The survey design was developed with the intent of estimating the catches taken from each stratum by subtracting, from the catch of each set which fished to the stratum's lower boundary, the average amount caught by sets deployed to the depth of its upper limit (at the same station, on the same survey and in the same diel phase)—an approach used successfully with data on the crustaceans caught (MacIsaac et al., 2014). However, while variation amongst the fish catches of replicate sets within the same cell of the survey design was low, by the standards of spatially extensive surveys, that variation was nevertheless high enough to confound estimation by subtraction. Thus, we here confine our analyses to the full catch taken by each set, as the net fished between the surface and its maximum depth, and interpret our results accordingly.
Following each set, the catch was retrieved from the net, the codend washed down and the rest of the net picked through for specimens caught in the meshes. In general, the fishes were sorted, identified, the weight and count of each taxon recorded, and each individual measured (standard length). Specimens that could not be identified at sea were preserved for examination ashore, following counting, weighing and measurement. The dominant myctophid in the catches, Benthosema glaciale, was sometimes too abundant for comprehensive length measurements. When necessary, a weighed subsample was counted and measured, the total number caught being estimated subsequently by expansion. Finally, although very large numbers of Cyclothone spp. were taken, most were retrieved from the nets as broken fragments. At sea, they were identified only to genus and neither counted nor measured, though each catch was weighed and samples were returned to shore (cf. Thompson and Kenchington, 2017). In the absence of count data, Cyclothone spp. were excluded from the analyses reported here.
Data Preparation
The surveys were followed by an extensive process of specimen identification and data verification, leading to generation of a catch database, from which data were extracted and prepared for analysis. Highly variable data on the many rarities were excluded by retaining only those species which comprised more than 1% of the total IYGPT fish catch, by either number or weight, or else more than 2% of the catch from any one of the three principal stations (Head, Main, or Deep)—the latter criterion chosen so that species locally important in parts of the canyon would be included. After exclusion of Cyclothone spp., 19 species met at least one criterion (Table 2). Small numbers of specimens that might have been members of a selected species could only be identified to genus or family, usually because of damage in the net. Such specimens were either added into or excluded from the analysed data after review of the time and location of their capture, relative to the distribution across the survey design of the species to which they might be assigned (see Kenchington et al., 2018 for details).
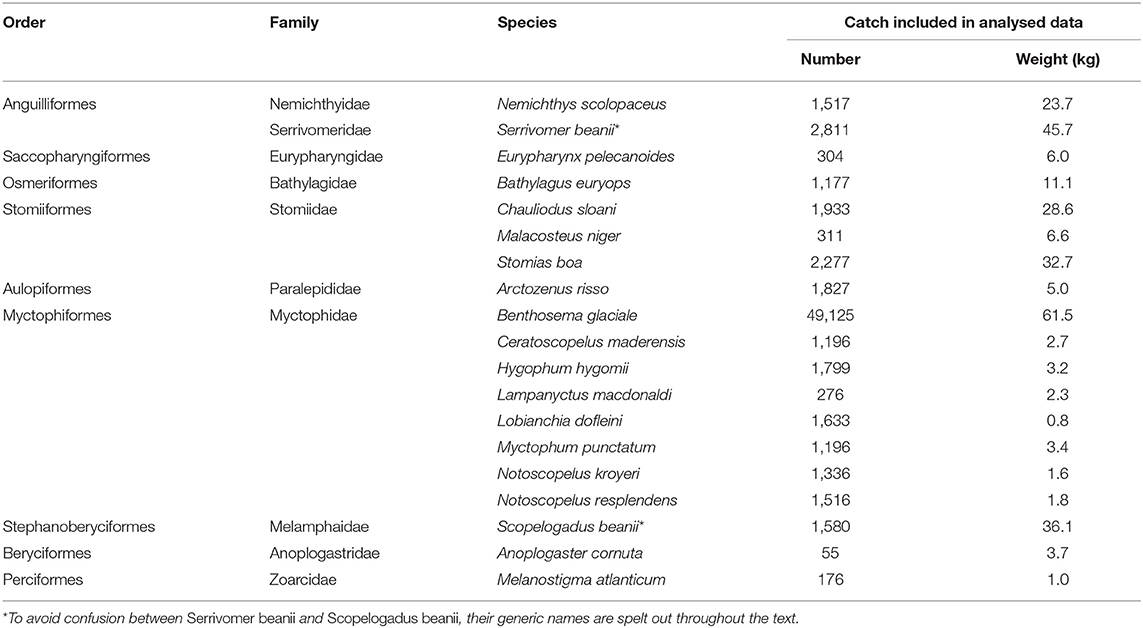
Table 2. Species included in the analyses.
Some sets made during the surveys were deemed non-valid because of irregularities in the work at sea (Kenchington et al., 2009, 2014a) or subsequently when deficiencies in data recording were discovered. Inevitably, the at-sea data collection only recorded positive catches, rendering missing data indistinguishable from zero catches. After review of the data and the distributions of the 19 species across the survey design (Kenchington et al., 2018), there was residual uncertainty over possible missing data for one or more species for five sets. Those five and all non-valid sets were dropped from further consideration, leaving 148 available for analysis.
For some species and sets, a count of specimens caught was available but not a corresponding weight or else the reverse. For each of those, the missing data were reconstructed using the average per-individual weight of the species in question from the catches of other sets. The numbers of specimens affected was usually small. However, at-sea recording of data on B. glaciale was sometimes confused when subsampling and catch counts totalling over 8,200 individuals were reconstructed from weight data (see Kenchington et al., 2018 for details).
The final outcome of those processes was a pair of data matrices (presented by Kenchington et al., 2018 and as Supplementary Data Sheet), containing the catches of the 19 principal species taken by the 148 sets, by weight and number, respectively.
Assemblage Analyses
All multivariate analyses were performed using PRIMER 6 version 6.1.6 (Clarke and Gorley, 2006). The catch data were ln (X+1) transformed, to stabilize variances. Four Bray-Curtis similarity matrices were prepared, respectively, for each of sets and species, based on transformed weights and numbers. Assemblage composition was first examined through non-metric Multi-Dimensional Scaling (“MDS”) of the Bray-Curtis matrices. Each MDS had 100 restarts, a minimum stress of 0.01 and followed Kruskal fit scheme 1. Unweighted Pair Group Method with Arithmetic Mean (“UPGMA”) clusters of sets and species, by both weights and numbers, were prepared from the Bray-Curtis matrices using the SIMPROF routine. Each mean profile was estimated from 1,000 permutations and 999 were used for simulation. Significant clusters were identified at the 5% level.
Catch compositions were compared through a series of one-way ANOSIM analyses of the transformed data, following each dimension of the survey design (survey, station, depth, and diel phase), and separately performed for transformed weights and numbers caught. Additionally, the 2007–09 data were merged into a “summer” group, contrasted with the “spring” data from March 2010. With the very large number of hypotheses that might have been tested, application of the Bonferroni adjustment would require that statistical inferences be drawn against some α <0.0001. The consequent reduction in statistical power would prevent meaningful biological differences from being detected as “significant.” Thus, statistical significance was judged against an arbitrary standard of estimated P ≤ 0.001, accepting the inflated risk of Type I errors among the multiple tests. ANOSIM analyses were initially run with up to 999 permutations. Those which returned P ≤ 0.1 were re-run with up to 9,999 permutations, to better estimate probabilities—without changing any interpretations of significance.
The survey design was necessarily incomplete, because bottom depth precluded deep fishing on some stations, while realization of the design was unbalanced (Table 1). The results of each one-way analysis were therefore confounded by the effects of dimensions other than the one of immediate interest. Interpretation of the data was further complicated by reliance on an open net and by the contrasting tow profiles used above and below 250 m depth. The latter limitations were circumvented, and the confounding narrowed, through further analyses, each of which only utilized data from sets that reached the same maximum depth. For that purpose, the sets were arrayed in three depth groups: those which only fished to 250 m, those which reached 750 m and those which fished to 1,250 m or deeper—the initial MDS and clustering having shown little depth-linked distinction between the catches of 1,250, 1,750 m and deeper sets. (The sole set that fished below 750 m on the Head Station was excluded, since its maximum depth did not accord with any of the three groups.) The MDS, clustering and one-way ANOSIMs were repeated for each of the three depth groups. Because the catches taken by sets which fished only to 250 m showed a marked difference between diel phases, the ANOSIMs were further repeated using only sets made in that depth stratum at night—too few replicate shallow sets being made in daylight for meaningful results to be obtained by a parallel analysis restricted to those. Although the full suite of ANOSIM analyses described here was performed, results are only reported below for those which returned significant outcomes and those for which the absence of significance can illuminate assemblage structure.
Where pairwise ANOSIM found a significant difference when analysing depth-specific data, SIMPER was used to examine the contributions that each of the 19 species made to that difference and to the similarity amongst the catches of sets in each group of the pair. To avoid a confusion of results, we present here SIMPER outputs for comparisons between seasons but not for those between individual surveys. Likewise, we present SIMPER outputs for comparisons between adjacent stations along the canyon thalweg (i.e., Head to Main and Main to Deep) but not for those between non-adjacent pairs. For the sets which fished only to 250 m depth, we do not present SIMPER outputs for comparisons that used night-only data. As the critical probability used in determining significance was arbitrarily chosen, we also present abbreviated SIMPER results for four comparisons for which ANOSIM returned marginally non-significant results—two being cases where there were marked differences in individual species, though not in the entire assemblage, and two where the high variability in the catches of the shallow sets eroded the power of ANOSIM to detect the effects of factors that had significant effects on the composition of catches taken by deeper sets.
Results
Overview
Across the four surveys, the IYGPT sets took more than 80,000 fishes (aside from Cyclothone spp.), with a combined weight of about 350 kg. Data on 72,045 individuals of the 19 principal species, together weighing 275.687 kg, were included in the analysed matrices. Within those, the sets deployed to 750 m on the Head Station, hence across most of the water column there, caught an average of <1 kg, whereas those deployed to 1,750 m on the Deep Station took nearly 5 kg in summer and 4 kg in spring. Average biomass densities, without correction for the species' catchabilities in IYGPT gear, varied from <0.001 g.m−3 on the Head Station in spring to 0.005 g.m−3 on the Deep Station in summer (Table 3).
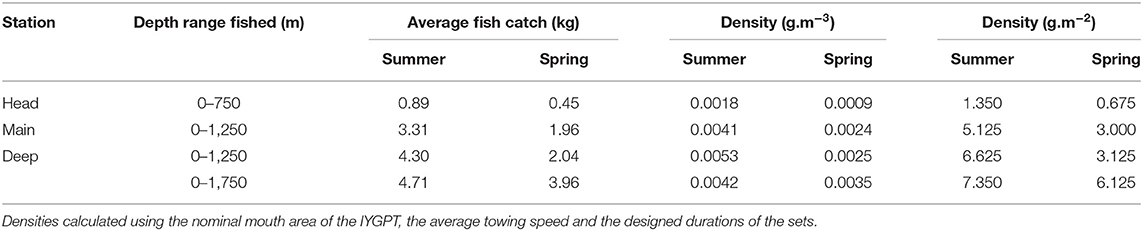
Table 3. Average water-column fish catches and IYGPT-catchable biomass densities (by volume and sea-surface area) of the 19 principal species at the three principal stations, by season.
The assemblage of IYGPT-vulnerable fish was dominated in number (Cyclothone spp. aside), and to a lesser degree in weight, by the myctophid B. glaciale. The remaining 18 principal species comprised seven other myctophids, three species of the Stomiidae (each in a different subfamily), and single members of eight other families (Table 2).
Spatio-Temporal Structure of the Assemblage
Whole Data Set
MDS, whether based on number or weight data (2D stress 0.14 and 0.15, respectively), showed a large group of closely-similar sets, centred on those that fished to 1,250 m or deeper but including many that did not go below 750 m (Figures 3, 4). That close grouping contrasted with a wide scatter of the 250 m sets. The latter showed some divergence by diel phase, season, station (sets on the Head Station being particularly scattered) and perhaps among the three summer surveys.
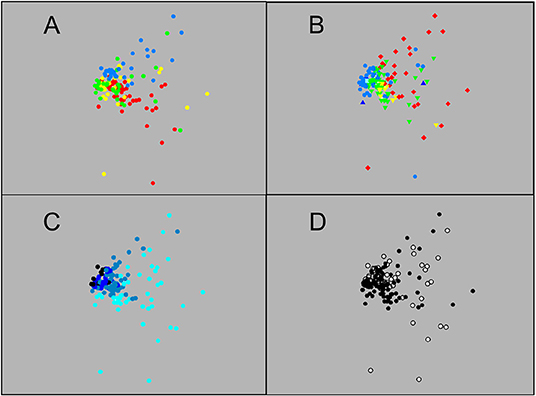
Figure 3. Ordination of the 148 sets based on catch data in numbers: (A) Sets identified by survey—red: 2007, yellow: 2008, green: 2009, blue: 2010; (B) Sets identified by station—red: Head, yellow: Wall, green: Main, light blue: Slope, medium blue: Deep, dark blue: Offshore; (C) Sets identified by maximum depth reached—light blue: 250 m, medium blue: 750 m, dark blue: >750 and ≤ 1,250 m, black: >1,250 m; (D) Sets identified by diel phase—open circle: daylight, filled circle: night (MDS 2D stress 0.14).
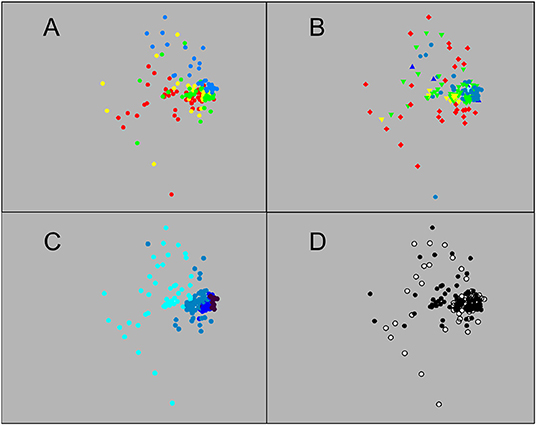
Figure 4. Ordination of the 148 sets based on catch weight: Sets identified by (A) survey, (B) station, (C) maximum depth reached, and (D) diel phase, using same colour coding as in Figure 3 (MDS 2D stress 0.15).
Resolving structure amongst the sets which fished below 250 m depth required cluster analysis. Clustering based on abundance data found 13 significant clusters and three additional singletons (Figure 5). However, most sets fell into one of seven major groups. At the core of the dataset was a group of sets (“C” in Figure 5) made in summer (mostly in 2007) on the Main or Deep stations to either 750 or 1,250 m, which group was significantly subdivided into daylight and night sets. To that were joined two other clusters, a group (“B”) of sets made to 750 m on the Main and Wall stations in summer, most of them in daylight, and another (“D”) of sets that reached 750 m or deeper, most made on the Deep Station in March 2010. Group “E” comprised sets made in summer to depths of 750 m or deeper, most on the Deep Station, while group “F” was largely composed of 250 m sets made on the Main or Deep stations, all of them during summer nights. Group “G” contained almost entirely 250 m sets made at night on the Wall, Main or Deep stations. There was a significant subdivision between summer sets and those made during March 2010. The last major group (“A”) contained 750 m sets made on the Head Station in summer. Three such sets, all made in 2007, were significantly separated from the rest. The remaining sets, outside of those major groups, were mostly ones made to 250 m depth. They formed three loose clusters, plus two singletons, with little pattern except for a tendency for sets made in 2007 (and to a lesser extent those made in 2010) to cluster together and apart from sets made during other surveys.
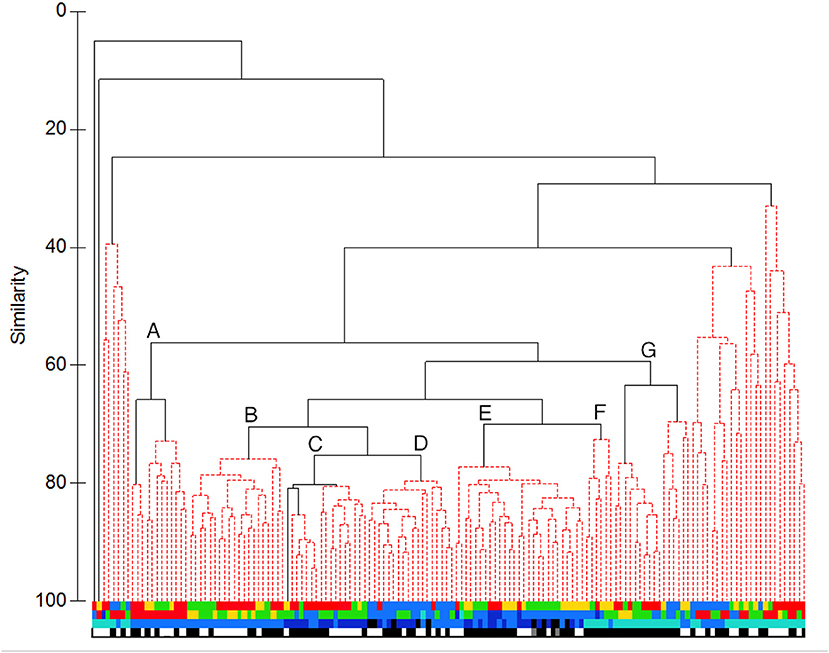
Figure 5. UPGMA cluster of sets based on catch data in numbers: Clusters significant at P = 0.05 are highlighted in red. Letters identify the major clusters described in the text. The sets are identified by four bands of colour coding: Top band: survey, second band: station, third band: maximum depth reached, bottom band: diel phase (colour coding as in Figure 3, except for bottom band, where: white: daylight, black: night, grey: sets that spanned sunset).
Clustering the sets by biomass data generated a broadly similar tree (Figure 6), though with ten major groups. The core (“VI”) comprised mostly sets made on the Main or Deep Stations to depths of at least 1,250 m, with a significant subdivision between summer and spring. To that were joined in turn a group (“V”) of sets made in summer, most on the Deep Station to depths of 750 m or more, a group (“IV”) of sets made in spring on the Main or Deep stations, again to depths of 750 m or more, a group (“III”) of sets made in summer on the Main or Wall stations to 750 m depth and a group (“II”) of sets made on summer nights, mostly on the Deep Station and to depths of 250 or 750 m. More loosely associated were a group (“VII”) of 750 m sets made on the Head Station in summer, a group (“VIII”) of 250 m night sets made on the Head, Wall or Main stations, with significant subdivision of spring and of summer 2007 sets from a larger subgroup of sets from a mixture of the three summer surveys. The 250 m sets largely fell into one of three groups: “I,” containing those made on the Head Station in spring, “X,” containing mostly those made on the Head Station in summer, and “IX,” which included sets made on all surveys and most stations but primarily in daylight.
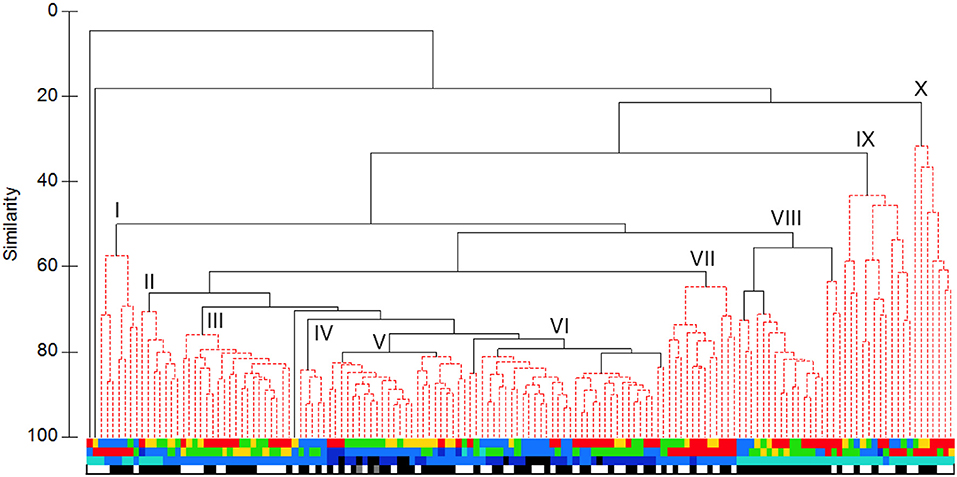
Figure 6. UPGMA cluster of sets based on catch weight: Colour coding as in Figure 5. Roman numerals identify the major clusters described in the text.
Hence, there was some differentiation of 750 m sets from deeper ones but little apparent difference between the catches of those which fished to 1,250 m and the few which went even deeper. In effect, species that were either abundant enough or of sufficient individual weight to be selected for the present analyses had depth distributions centred in the comparatively productive waters above 1,250 m depth. Deploying the open IYGPT to greater depths did not materially affect catches of such fish. There was some tendency for sets that reached at least 750 m depth to cluster by season and by station. For the latter, only the sets made on the Head Station were markedly distinct, though those on the Main and Wall stations often clustered together, while the few Offshore and Slope station sets clustered amongst the greater number made on the Deep Station. Inter-annual differences among the three summer surveys were not marked, through the 2007 sets stood out somewhat. Unlike the 250 m sets, those which fished deeper showed only weak grouping by diel phase, presumably because the open net could catch migrant fishes whether they were at the shallow or the deep end of their circuits.
ANOSIM of the entire data matrices, whether using weights or numbers, found significant differences between the catches of 250 m sets and those which reached either 750 or 1,250 m (though not between the latter two groups). There were also significant differences between the catches taken by each of the summer surveys and that in March 2010, but not among any of the summer surveys (Table 4). Catches on each of the Head, Main and Deep stations were significantly different from those on either of the others. Those taken on the Wall Station differed from the Deep and Offshore catches. However, some of those differences will have partly been because of the absence of deep sets on the Head and Wall stations. The effects of diel phase on the catches did not quite reach significance.
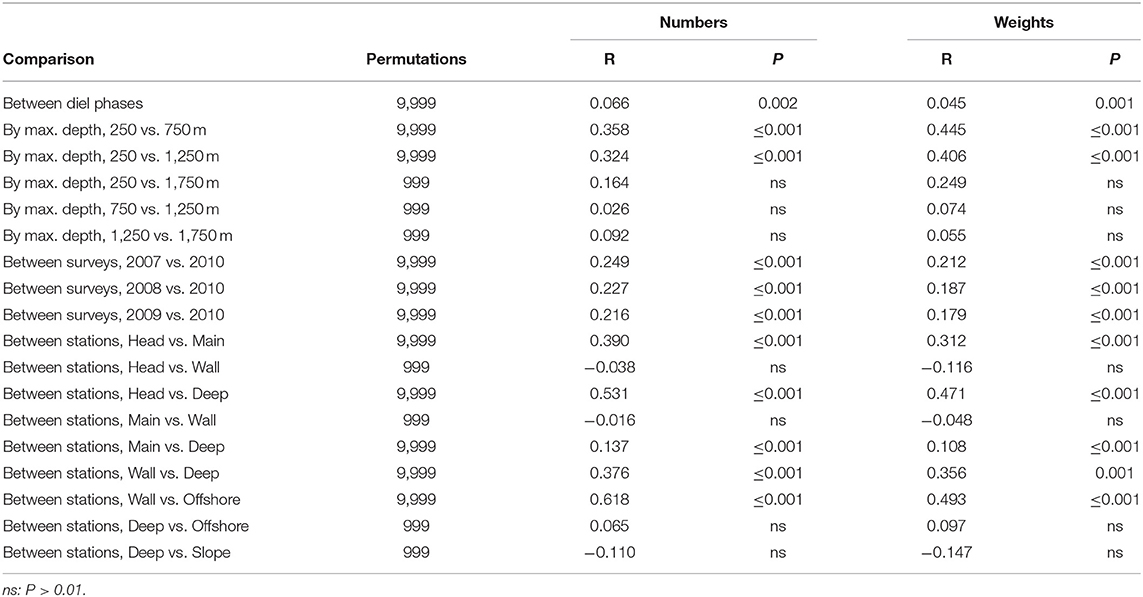
Table 4. Results of pair-wise ANOSIM tests on the whole data matrices that returned P ≤ 0.01 and of selected tests which did not.
Deep Sets
MDS of the catches of sets which sampled the water column to at least 1,250 m depth (ordinations not presented here) suggested a seasonal distinction, some inter-annual variability in summer and a weak clinal variation extending from the Main Station, through the Deep to the Offshore, but no diel differences. The sets formed three significant clusters which primarily contained those from (1) the March 2010 survey, (2) the Offshore Station in 2007 plus the Deep Station in 2008 and 2009 and (3) the Main Station in summer plus the Deep Station in 2007 (tree not presented here). In the clustering based on numbers data, only two sets fell outside that pattern, but there were more aberrant sets when weight data were used.
The difference between the summer and March 2010 catches was significant, by ANOSIM, while inter-annual variation in summer fell short of significance, though narrowly so between 2007 and 2009 (Table 5). The spring catches were generally lower than those taken in summer (Supplementary Table 1). Myctophids other than B. glaciale were especially depressed and the warm-water (Moore et al., 2003a; Themelis and Halliday, 2012; Kenchington et al., 2018) Hygophum hygomii, Lobianchia dofleini, and Notoscopelus resplendens were absent entirely—an absence that accounted for 26% of the seasonal difference in number terms. The lower catches in spring included those of Stomias boa and Arctozenus risso, which dropped to one third of their summer amounts. Together, declines in nine species accounted for 66% of the seasonal dissimilarity in number terms and 59% in weight. In contrast, catches of Chauliodus sloani, Malacosteus niger, Nemichthys scolopaceus, and Serrivomer beanii were higher in spring, when larger numbers but lower weights of Scopelogadus beanii were taken. Anoplogaster cornuta, Bathylagus euryops, and Melanostigma atlanticum were equally numerous in the catches in both seasons but increased in weight terms in the spring—the large individual size of A. cornuta making it the leading contributor to the seasonal dissimilarity in catches, in weight terms.
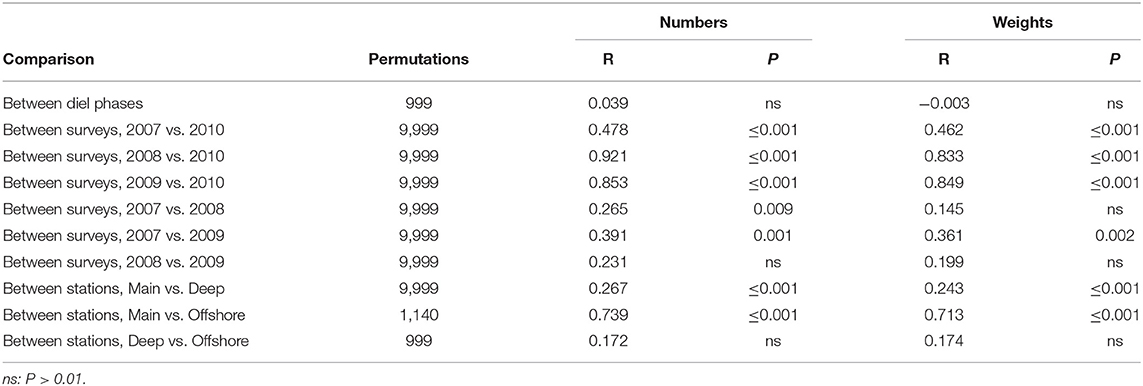
Table 5. Results of pair-wise ANOSIM tests on sets made to 1,250 m or deeper that returned P ≤ 0.01 and of selected tests which did not.
Most of the species were both more abundant and taken in greater weights in the catches from the 2009 survey, when the surface water at the mouth of The Gully was WSW, than in 2007, when the canyon was overlain by an exceptionally cold and extensive CIL. That trend was particularly prominent in the warm-water myctophids H. hygomii, L. dofleini, and N. resplendens, the first two of which increased by about an order-of-magnitude between those years (Supplementary Table 2). Higher catches in 2007 were seen only in Myctophum punctatum, known to be a northern species (Moore et al., 2003a; Møller et al., 2010; Themelis and Halliday, 2012; Dolgov, 2015; Kenchington et al., 2018), M. niger and M. atlanticum.
The catches on the Main Station were significantly different from those taken outside the canyon mouth but no difference was found between catches on the Deep Station and the few taken on the Offshore (Table 5). For most species, catches on the Main Station were smaller than those on the Deep Station, with the three warm-water myctophids showing triple the abundance on the latter. Together, they accounted for 26% of the dissimilarity between the catches on the two stations in number terms (Supplementary Table 3). M. punctatum showed the reverse trend. Otherwise, only M. niger, S. boa and the bottom-associated M. atlanticum were more abundant in catches taken on the Main Station than the Deep, while greater weights of A. cornuta, M. punctatum, and Lampanyctus macdonaldi were taken there—those three together accounting for 25% of the dissimilarity between the stations in weights caught, compared to 19% for the three warm-water myctophids. That the weight caught increased up-canyon, while numbers had the opposite trend, shows that average individual weights were higher on the Main Station. Ten species showed more than 10% greater average individual weights on the Main Station than on the Deep (with a maximum of 2.3 times greater in M. punctatum), while only three species showed the reverse.
Although the catches on the Deep and Offshore stations were not significantly different when considered as assemblages, there were marked differences in the amounts taken of myctophids other than B. glaciale (Supplementary Table 4). Catches of N. resplendens were an order-of-magnitude higher on the Offshore Station than the Deep, and those of H. hygomii were six times higher in number and eight times in weight, while L. dofleini saw a lesser increase in the same direction. Since the Offshore Station was only sampled in 2007, there was potential for spatial differences to be confounded with inter-annual variation. However, inspection of the data from that 1 year showed the differences between the catches on the two stations to be at least as well-marked as in the formal, all-years analysis.
Above 750 m
MDS of sets which fished to 750 m depth (ordinations not presented here) showed no diel variation but a difference between summer and spring that was especially marked at the Head Station. Little evidence of inter-annual variation amongst the summer catches was apparent. There was a limited along-canyon trend, in which the Head Station stood out, while the Wall Station was closely similar to the Main and the Slope Station resembled the Deep, rather than the Main. Those trends were visible in both weights and numbers, a parallelism that continued through most ANOSIM results (Table 6). There were significant differences between the catches on the Head, Main and Deep stations. The Wall Station was most similar, in catch composition, to the Main and significantly different from the Deep.
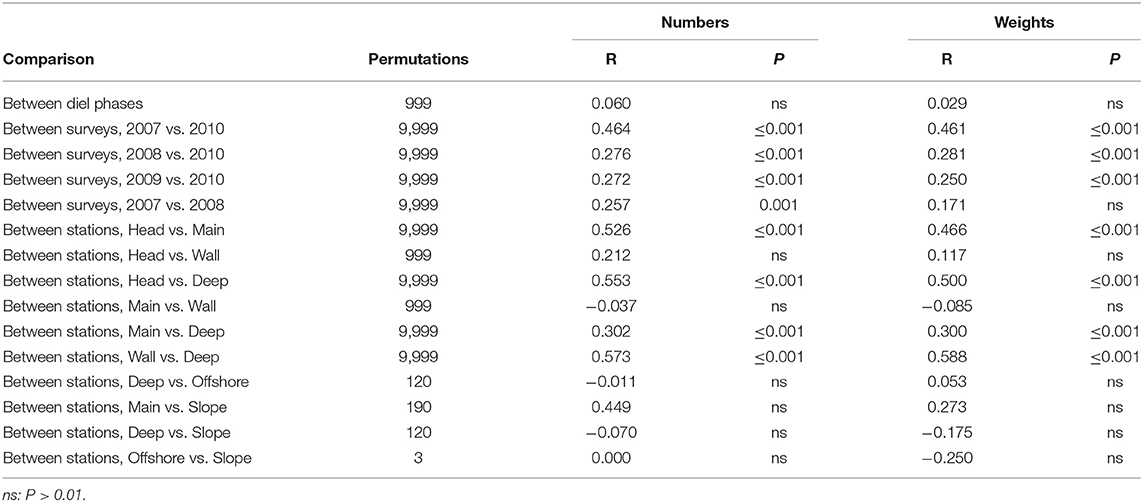
Table 6. Results of pair-wise ANOSIM tests on sets made to 750 m that returned P ≤ 0.01 and of selected tests which did not.
SIMPER showed that the average similarities within each season were much lower, and the dissimilarities between them much higher, than was seen with the catches of the deeper sets (Supplementary Tables 1, 5). The March 2010 catches taken by sets that reached 750 m depth were distinguished from those taken in summer by lower weights and numbers of almost all species, especially much lower catches of myctophids, four species of which were absent from the spring catches, when a fifth, L. dofleini, was represented by a single individual taken on the Slope Station. Even the catches of B. glaciale, which tended to be relatively stable across most comparisons, fell to one fifth of their summer average in numbers and to below one sixth in weight. The spring survey saw at least as much C. sloani, N. scolopaceus, Eurypharynx pelecanoides, and (in numbers but not in weights) Serrivomer beanii as did the summer surveys.
The Head Station (which had low average similarity amongst sets) was distinguished from the Main by much lower abundances and weights of almost all species, leading to high dissimilarity between the stations. B. glaciale was more than an order-of-magnitude less abundant on the Head Station than the Main, though that species remained the most abundant fish in the catches on the Head (exclusive of Cyclothone spp.) and second only to Serrivomer beanii in weight terms (Supplementary Table 6). Catches of S. boa were also an order-of-magnitude smaller on the Head Station in number terms and 45 times lower in weight. The three warm-water myctophids, H. hygomii, L. dofleini, and N. resplendens, were scarce on the Main Station but entirely absent from the catches on the Head. The principal exception to that up-canyon decline in numbers and weights was bottom-associated M. atlanticum. The deep-living (Themelis and Halliday, 2012; Kenchington et al., 2018) myctophid L. macdonaldi was also more common on the Head Station, due to up-canyon elevation of its depth range raising individuals above 750 m (Kenchington et al., 2018). E. pelecanoides and M. niger had higher numbers, and especially higher weights, on the Head Station, than the Main, though neither was common in the 750 m catches. A. risso was taken in lesser numbers but greater weight on the Head Station than the Main.
The Main Station was likewise distinguished from the Deep by lower abundances of most species, especially the warm-water myctophids H. hygomii and N. resplendens, plus Scopelogadus beanii and C. sloani (Supplementary Table 7). The average catch of each of those, in both weight and number terms, was at least three times higher on the Deep Station than the Main. Conversely, the northern (Moore et al., 2003a; Møller et al., 2010; Themelis and Halliday, 2012; Dolgov, 2015; Kenchington et al., 2018) myctophids M. punctatum and N. kroyeri were twice as abundant, and the former three times the weight, on the Main Station. Ceratoscopelus maderensis and M. atlanticum were also more abundant on the Main Station than the Deep, the latter with double the weight. In all, the species replacement amongst myctophids, other than B. glaciale, contributed one half of the dissimilarity between the catches on the two stations in both numbers and weights. Otherwise, A. risso, E. pelecanoides, N. scolopaceus, and S. boa were caught in smaller numbers but greater weight on the Main Station, while Serrivomer beanii was taken in about equal amounts in weight terms but smaller numbers than on the Deep Station, all of those indicating larger average individual sizes inside the canyon mouth.
There was very little fishing to 750 m depth on each of the other three stations—a limitation which both reduced statistical power and increased the potential for confounding the effects of different dimensions of the survey design. Nevertheless, the Main and Wall stations clearly produced similar catches, average dissimilarity being 25.07 by numbers and 23.09 by weights. Catches on the Slope and Offshore stations were equally similar to one another (average dissimilarity by numbers: 24.61) and to those taken on the Deep Station (dissimilarities 25.72 and 26.10, respectively).
Above 250 m
Unlike the deeper sets, the sets which only fished to 250 m depth showed significant differences between daylight and night catches (in both weight and number terms) by ANOSIM (Table 7). However, variability was so high that most other trends were non-significant, whether tested using data from all of the shallow sets or only those made at night. Only the difference between the 2007 and 2010 catches was significant and only in weight terms.
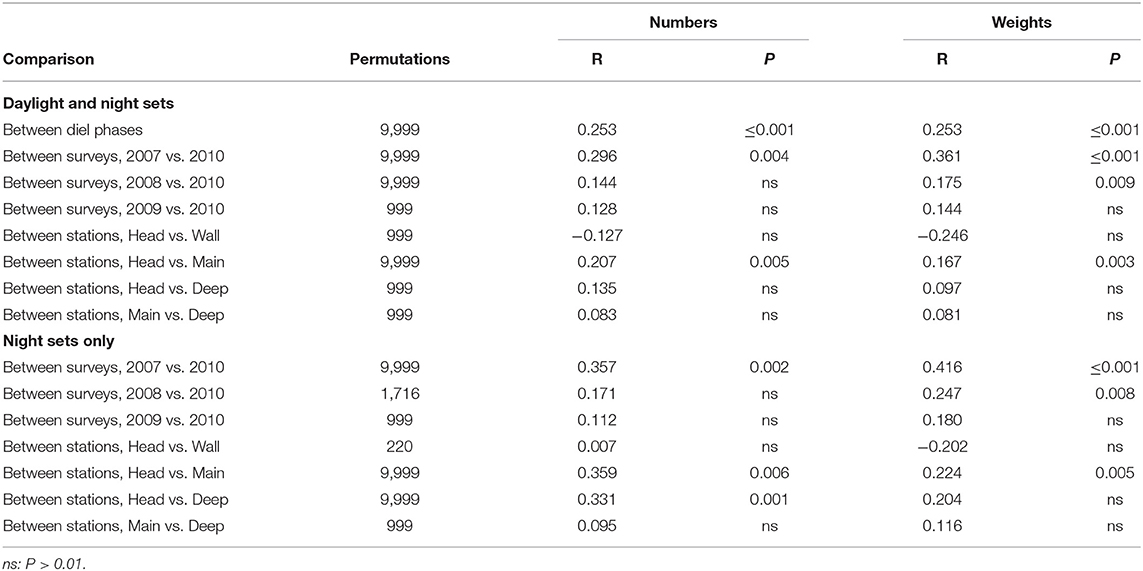
Table 7. Results of pair-wise ANOSIM tests on sets made to 250 m that returned P ≤ 0.01 and of selected tests which did not.
The diel difference comprised much lower catches in daylight for almost every species taken by the shallow sets—about 20 times lower in B. glaciale, which alone accounted for 21% of the dissimilarity in numbers and 14% in weight, while the migratory myctophids as a whole accounted for 55 and 40%, respectively (Supplementary Table 8). Only M. niger, which was rarely taken so near the surface, chanced to be caught in a greater amount in daylight (4 individuals, vs. 2 at night).
When considered as assemblages, the catches taken above 250 m did not differ significantly between the seasons. However, most of the myctophids were entirely absent in spring, while catches of C. maderensis and N. kroyeri were much reduced (Supplementary Table 9). In contrast, B. glaciale and the deep-living L. macdonaldi were taken in approximately equal quantities in both seasons—the latter perhaps because its reduced numbers in the water column (Supplementary Tables 1, 5) were balanced by sufficient shift in vertical distribution to lift a few individuals above 250 m depth. Of the non-myctophids, C. sloani, E pelecanoides, M. atlanticum, N. scolopaceus, Scopelogadus beanii, and Serrivomer beanii were all more abundant in shallow catches in spring but B. euryops and M. niger were absent then, while A. risso and S. boa were much reduced (A. cornuta was never taken by a 250 m set).
The shallow catches taken on the Head Station were not significantly different from those taken on the Main but, on average, those on the Head contained lower abundances of almost all species—more than 20 times lower in the case of B. glaciale, which was responsible for 24% of the large dissimilarity between those stations in numbers (Supplementary Table 10). Only C. sloani, E. pelecanoides, and M. atlanticum showed the reverse trend in both weights and numbers, while L. macdonaldi and Serrivomer beanii were equally scarce in the shallow catches taken on both stations. Most of those differences paralleled patterns seen in the catches of 750 m sets. The trends in C. sloani and Serrivomer beanii likely resulted from elevation of depth distributions toward the canyon head. B. euryops were taken in smaller numbers but greater weights on the Head Station, indicating a larger average individual size amongst the few caught.
Species Distributions
Cluster analyses of the 19 species found no significant groupings by either abundance or weight (Supplementary Figures 1, 2). Serrivomer beanii and C. sloani did cluster closely (though non-significantly) by both measures, which also agreed on a rather looser grouping of the warm-water myctophids H. hygomii, L. dofleini, and N. resplendens. Otherwise, each of the 19 species had its own unique distribution in space, depth and time, necessitating species-by-species examination (see Kenchington et al., 2018).
Discussion
Overview of Fish Assemblage
The surveys showed that, in numbers, the IYGPT-vulnerable meso- and bathypelagic fish assemblage of The Gully is dominated by C. microdon, the characteristic Cyclothone of the northern North Atlantic. Although not effectively sampled by the IYGPTs, extrapolating from the weights of samples (Thompson and Kenchington, 2017) suggests that the 16 kg of Cyclothone spp. recorded by the surveys included some 60,000 individuals. Next in abundance, and dominating the biomass, was B. glaciale, the principal myctophid of waters north of the Gulf Steam and North Atlantic Current (Kenchington et al., 2018). Those two, with the seven other myctophids, three stomiids and eight other species analysed here, comprised over 90% of the individuals and 80% of the biomass of fish caught by the IYGPT. The residue included members of at least 235 other fish species. Such an assemblage composition is consistent with the results of other North Atlantic mesopelagic survey programs (e.g., McKelvie, 1985; Moore et al., 2003b, 2004; Sutton et al., 2008, 2013; Themelis and Halliday, 2012).
The 19 species included in the present analyses were mostly the ones expected to be abundant in open ocean immediately south of the canyon's mouth, though the proportions of the various myctophids change at the shelf/slope boundary (Themelis and Halliday, 2012) and hence not far from the shelf break. The sole exception to that similarity between the assemblages of canyon and ocean was M. atlanticum, a species of continental slopes and shelf valleys (e.g., Chouinard and Dutil, 2011; Ross et al., 2015) which spawns in seabed burrows (Markle and Wenner, 1979; Silverberg et al., 1987; Silverberg and Bossé, 1994). It was seen in The Gully primarily on the Head and Wall stations, though also on the Main Station. While each of the 19 species analysed had its own unique distribution, the dominant B. glaciale and the non-myctophids other than M. atlanticum were broadly distributed across the stations, years, and seasons (but not depths) of the survey design, whereas the seven sub-dominant myctophids had more restricted distributions, suggesting responses to particular environmental drivers.
The Gully is noted for its rich biota but there is no apparent enrichment of mesopelagic fish biomass. Fully quantitative comparisons with biomasses in other areas are prevented by the dissimilar survey protocols of various programs, even when comparable nets are used. However, the (IYGPT-catchable) water-column biomass density on the Deep Station in summer averaged ≈7 g.m−2 and was lower further up the canyon, especially on the Head Station, where it was <1 g.m−2 in spring (Table 3). In contrast, mesopelagic fish biomass densities two orders of magnitude higher have been suggested for the Arabian Sea (Gjøsaeter and Kawaguchi, 1980) and for one study site in the Tasman Sea (May and Blaber, 1989). While there are many uncertainties in the estimates, it is sure that no large standing biomass of meso- and bathypelagic fishes, sufficient to support enough squid predation to sustain the consumption of the northern bottlenose whales, exists in The Gully.
Principal Drivers of Assemblage Composition
ANOSIM tests for differences among the catches of groups of sets, such as those taken by sampling to different maximum depths. The method cannot test for the effects of depth, nor those of other drivers of catch composition, let alone for underlying causes, such as behavioural responses to light levels. Nevertheless, where a significant difference between catches is found, it is often possible to infer some major correlate of the causative factors, such as depth or the proximity of a particular water mass, though the controlling mechanisms must remain unknown until targeted experiments become possible.
As in all marine systems and despite the use of an open net, depth proved to be one correlate of meso- and bathypelagic fish assemblage composition in the Gully, though the only significant difference was between the catches of the shallowest sets and those which fished to at least 750 m (Table 4), while amounts of the 19 principal species were little affected by sending the net below 1,250 m (Figures 5, 6). There were also differences between daylight catches and those taken at night, though those differences were only statistically significant amongst the 250 m sets (Table 7). As expected, almost all of the analysed species were much less abundant by day at such depths (Supplementary Table 8). While not significant by ANOSIM, some diel differences at greater depths were indicated by clustering (Figures 5, 6), despite the nets fishing through the depth ranges of the 19 species. Examination of the catches of individual species found that many more C. maderensis, H. hygomi, N. kroyeri, and N. resplendens were taken at night than in daylight (Kenchington et al., 2018), presumably because of a difference in catchability.
Despite there having only been one spring survey in the series, the seasonal cycle expected in northwest Atlantic ecosystems was observed, both in the whole dataset and in two of the depth bands examined (Tables 4–6). Catches of most species, especially the sub-dominant myctophids, were lower in March 2010 than during the summer surveys, three species being almost or entirely absent in spring (Supplementary Tables 1, 5). Even in warmer waters far south of the continental slope, Themelis and Halliday (2012) found H. hygomi and L. dofleini scarce in survey catches during February and April. However, those authors saw a large increase in C. maderensis in April, which was not reflected in the spring catches in The Gully. It may also be noted that the few sets which sampled to 1,750 m in March 2010 took nearly twice as much as those which only fished to 1,250 m, in contrast to the much smaller difference seen in summer (Table 3), suggesting that some of the fish biomass had withdrawn to depth for the winter.
Variation in catches was much less marked among the summer surveys but there was some tendency for the deeper sets to cluster with others from the same survey. Likewise, ANOSIM found a significant difference between the catches of sets which fished below 750 m in 2007, when the CIL was unusually well-developed (Petrie et al., 2008; Kenchington et al., 2009), and those in 2009, when the WSW lay across the mouth of The Gully (Kenchington et al., 2014a). Most species, but especially the warm-water myctophids H. hygomii, L. dofleini, and N. resplendens, were taken in greater abundance during the latter survey. The exaggerated development of the CIL in 2007 was a season-long event, as the lingering effects of the exceptional spring bloom that year may have been, but the presence of WSW in 2009 only lasted for days and so the observed variation among surveys cannot be said to be inter-annual. That variation was, in part, a much shorter-term phenomenon.
The catches of deep sets made on the Deep Station in 2008 and 2009 clustered with those on the Offshore Station (not the Deep) in 2007 (Figures 5, 6). The common factor appears to be that the stations lay close to the location of the shelf/slope boundary at the time of the respective survey. In contrast, M. punctatum, primarily a northern species, was abundant on the Deep Station in 2007 but much scarcer there during the subsequent summer surveys (Kenchington et al., 2018). Thus, the observed spatio-temporal distinction was consistent with the expected influence of water-mass characteristics on the abundances and biomasses of mesopelagic fishes, especially myctophids (e.g., Themelis and Halliday, 2012).
In summary, the multivariate analyses presented here have shown that much of the variability in the meso- and bathypelagic fish assemblage in the wider study area, including the stations outside the canyon, is aligned in space and time with the principal drivers that operate on equivalent assemblages away from the continental margin: depth, distribution of water masses, diel and seasonal cycles, plus temporal variability. The results of the SIMPER analyses of those patterns were broadly in accord with prior examination of the distributions of each of the 19 species individually (Kenchington et al., 2018), despite the very different approaches. While the multivariate analyses provide more rigor, the single-species approach incorporated information on the lengths of individuals caught, as well as considering prior knowledge of each species' biology. It found that the distributions generally followed expectations derived from published literature, which (with the exception of bottom-associated M. atlanticum) meant expectations largely based on oceanic and continental-slope studies—hence consistency with the drivers active in open ocean.
Canyon Effects
The primary interest in the Gully surveys, however, lies in the effects of the canyon on the fish assemblage, as deviations from oceanic norms. Those have been addressed by Thompson and Kenchington (2017) and by Kenchington et al. (2018) in terms of trends along the thalweg, from the Deep Station via the Main to the Head, in the number and weight of each species caught (Table 8). Changes within depth strata were confounded by elevation of the depth distributions of deeper-living species, where the seabed rose into proximity with the fish, though some species showed only truncation of the lower portion of their distributions, not elevation of their upper bounds. ANOSIM and SIMPER nevertheless found differences in catch composition along the thalweg, though those in the 0–250 m catches were non-significant.
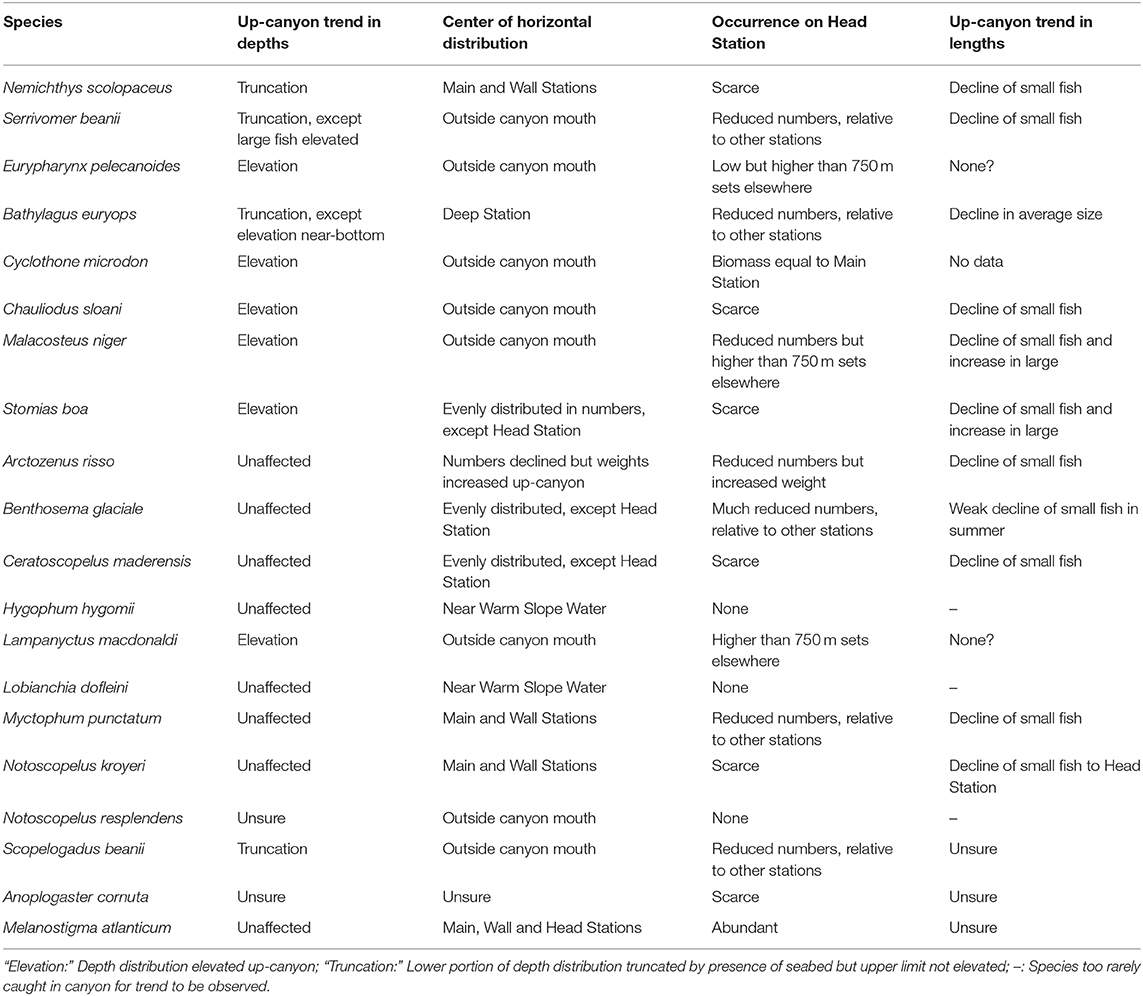
Table 8. Up-Canyon trends in the distributions and sizes of the 19 analysed species (after Kenchington et al., 2018) and for Cyclothone microdon (after Thompson and Kenchington, 2017).
The Head Station was particularly distinctive, with much lower catches of most species (Table 6, Supplementary Table 6). Only M. atlanticum was more abundant on that station than on the Main, though a greater weight (but lesser numbers) of A. risso was taken on the Head Station. Although abundant in open ocean, that species is especially frequent on continental slopes and in deep shelf valleys (e.g., Gartner et al., 2008; Chouinard and Dutil, 2011; Feagans-Bartow and Sutton, 2014; Ross et al., 2015). The depth distributions of four species that are primarily bathypelagic in open ocean, E. pelecanoides, C. microdon, M. niger, and L. macdonaldi, were strongly elevated toward the canyon head. The catches of them taken above 750 m depth on the Head Station, though not their water-column totals, were as large or larger than those on other stations (Thompson and Kenchington, 2017; Kenchington et al., 2018).
The differences between the catch compositions on the Main and Deep stations were more complex (Tables 5, 6, Supplementary Tables 3, 6). The former saw lower abundances of most species, though some of those were the warm-water myctophids that were only common near the shelf/slope boundary and hence on the Deep Station during the 2009 survey. Apart from M. atlanticum, the species with larger numbers on the Main Station were mostly migratory myctophids with colder-water associations, though B. euryops (in 0–750 m sets), M. niger and S. boa (in deeper sets) were also more abundant there than on the Deep Station. Additionally, larger average individual sizes led to greater catch weights of N. scolopaceus and A. risso on the Main Station, despite lower numbers than were taken on the Deep. As A. risso is common on continental slopes and in shelf valleys, so N. scolopaceus is a species of the “oceanic rim,” more than of mid-ocean environments (Feagans-Bartow and Sutton, 2014).
In contrast, there was no significant cross-canyon trend, above 750 m depth, between the Main and Wall stations. However, a number of species were taken in smaller amounts over the canyon wall than over the thalweg, most notably Scopelogadus beanii, while M. atlanticum showed the reverse trend, as did some deeper-living species that had elevated depth distributions in proximity to the seabed (Kenchington et al., 2018).
While few data are available, the similarity of Slope-Station catches to those taken on the Deep Station suggests that the continental-slope assemblage is continuous across the mouth of The Gully and is little affected by the presence of the canyon. Where catches on the Main and Deep stations differed, the Slope Station followed the Deep, despite having been chosen for seabed depths similar to the Main—suggesting that the observed up-canyon trends in the assemblage result from more complex causes than bathymetry alone.
Since the Gully surveys were the first to deploy midwater trawls in a canyon, there are no other observations to which those trends can be compared. Nor is it yet possible to suggest whether the results reported here can be extrapolated to other canyons. The Gully's unusual connection to the Trough, and the major up-canyon water flow at depth which that link permits, may have unique ecological consequences.
Canyon Processes
The complex structuring of the IYGPT-vulnerable assemblage of meso- and bathypelagic fishes in The Gully could have multiple contributory causes. Notably, the marked difference between the catches on the Head Station and those taken elsewhere might be linked to the apparent predominance of LSW on that one station during three of the surveys. However, we here offer a single explanatory model (Figure 7), which explains the observed distributions of the fish by linking the oceanography of the canyon with fish behaviour and trophic ecology, as a hypothesis for future testing.
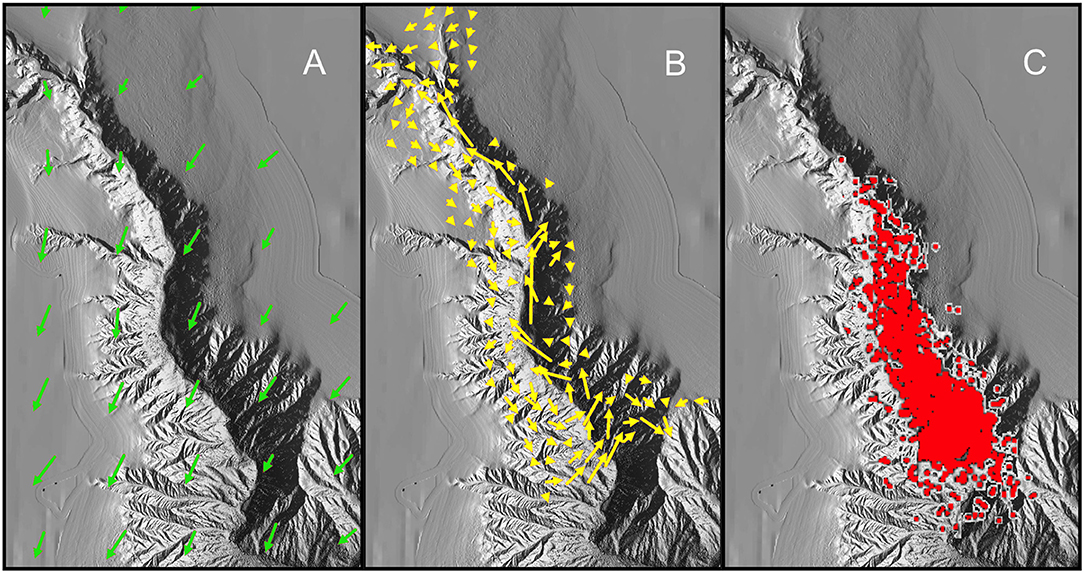
Figure 7. Illustration of hypothesis explaining the observed distribution of the fish assemblage: (A) Modelled surface current over The Gully in August—length of arrows proportional to volume of flow (simplified from Shan et al., 2014b); (B) Modelled volume transport of water below 200 m depth in August (simplified from Shan et al., 2014b); (C) Locations of surface observations of northern bottlenose whales (mapped by Hooker et al., 2002b), here supposed indicative of the distribution of concentrations of Gonatus spp. at depth. The modelled current and volume transports differ in detail from the empirical observations summarized in section Oceanography of The Gully.
N. scolopaceus, A. risso, and M. atlanticum are especially frequent along continental slopes. Hence, they may be supposed to have evolved behaviours which allow them to maintain position over suitable seabed depths. In contrast, the other species of present concern are essentially oceanic and, on the scale of ocean basins, planktonic. As a first approximation, we therefore suggest that those species can be supposed to drift passively in horizontal flows and that, having evolved away from the seabed, they lack effective behavioural responses to being swept into a canyon. Directed, diel horizontal migrations of mesopelagic fishes have been observed (e.g., Benoit-Bird et al., 2001; Benoit-Bird and Au, 2006; McManus et al., 2008) but only in an island-associated, boundary community—hence in populations analogous to the three continental-slope species found in The Gully, not the oceanic ones. Given our postulate of passive drift, the known inflow into The Gully (Greenan et al., 2014) must carry a flux of midwater fish biomass into the canyon.
In contrast to their supposed horizontal passivity, each of the 20 dominant fish species has well-developed vertical behaviour, which shapes its depth distribution and, for some species, includes pronounced diel migrations. As passive horizontal drift carries individuals into a canyon with slowly upwelling water, such as The Gully, they will seek to maintain their preferred depths, through active downward movement relative to the rising water. They will thus filter themselves out of the flow, which should lead to their retention in the canyon head, as the water escapes over the top of the walls. That process should operate despite the decreasing seabed depths compelling some individuals upward, to an extent dependent on the vertical behaviour of the particular species (Table 8), while demersal predators take those individuals which swim too close to the bottom.
The combination of passive horizontal drift with active control of depth would, however, result in a concentration of fishes in the canyon head—the reverse of what was seen. We suggest that those mechanisms do operate but that very high loss rates during the month-long drift from the canyon's mouth to its head (Greenan et al., 2014) result in the observed up-canyon decline in numbers and biomass of most species. There are two obvious mechanisms for that loss. Firstly, where diel migration is combined with current shear between water layers in open ocean, migrants will be dispersed but not necessarily transported outside their preferred habitats. In contrast, in The Gully a migrant individual caught by the deep indraught in daylight would be transported to places from which near-surface nocturnal drifts would carry it across the canyon and ultimately over an adjacent bank, where the fish's thwarted attempt at downward migration at dawn would leave it vulnerable to epipelagic and demersal predators. With short summer nights and the estimated three-day crossing time, for surface water passing over much of the canyon (Greenan et al., 2014), diel migrants entering The Gully in the main inflow on the eastern side should average about a week before being swept over the shallows of Sable Island Bank. While those individuals that encounter the sloping flank of the bank at dawn likely have some ability to return to deep water through active down-slope swimming, the potential for large-scale losses is clear.
The observed up-canyon decline in numbers and biomass was not, however, confined to diel migrants but was also seen in the non-migratory species, which are not subject to the cross-canyon surface flows. For most species, that decline was also more pronounced in the smaller individuals, the only confirmed exceptions being E. pelecanoides and L. macdonaldi, the catches of which were particularly confounded by vertical elevation (Kenchington et al., 2018: see Table 8). In the pelagic realm, where predation rates generally fall with increasing body size, that size-differential suggests that the abundance declines were consequences of intense predation on the fish, as they drift up the canyon.
The nature of the predators cannot be a certain. However, elsewhere in the North Atlantic, the northern bottlenose whale is a specialist predator of armhook squid. Available evidence suggests that those are also their principal prey in The Gully, where the whales are known to feed close to the canyon walls at depths of 500–1,500 m, and the presence of actively feeding H. ampullatus indicates a high biomass of Gonatus spp. deep in the canyon (Hooker and Baird, 1999; Hooker et al., 2001, 2002a), though they cannot be observed directly. [Aside from brooding females, subadult and adult Gonatus spp. are very active (Arkhipkin and Bjørke, 1999) and successfully evade midwater trawls. Only juveniles and spent females were taken during the 2007–10 surveys.] Adult G. fabricii are known to eat macroplanktonic crustaceans, fishes (including myctophids), and cephalopods. Stable-isotope analyses of beaks (bulk tissue) have shown an ontogenetic increase in trophic level with individual size, reaching an estimated >5 in the largest (Hooker et al., 2001; Cherel et al., 2009; Jereb et al., 2015; Golikov et al., 2018). Thus, mesopelagic fish are likely an important component of the diet of Gonatus spp. in The Gully and hence of the food chain leading to the whales.
Although northern bottlenose whales are continuously present in The Gully, at least in summer, most individuals divide their time between that canyon and other, smaller ones to the eastward (Wimmer and Whitehead, 2004). Their abundance has been estimated, based on field data from the two summers following the midwater trawl surveys, at 143 individuals in the entire Scotian Shelf population, of which 116 spent time in The Gully (O'Brien and Whitehead, 2013). Gowans et al. (2000) estimated that one third of the Gully individuals are in the canyon at any one time during summer but WO'Brien and hitehead (2013) concluded that more than half of the Scotian Shelf population is present there. Thus, The Gully supports the entire summer feeding of the equivalent of 40–80 whales. Hooker et al. (2001) examined the energy requirements of H. ampullatus, concluding that an average individual eats ≈59 kg of Gonatus spp. daily, implying a population consumption of 2.4–4.8 t.d−1 in The Gully during summer. No estimates of the ecological efficiencies of deep-living squids are available but, if Gonatus spp. approximated to a conventional 10% ecological efficiency, the whales' consumption would indicate that the squid eat between 20 and 50 t.d−1.
The average density of IYGPT-catchable fish biomass on the Deep Station, during the summer surveys and averaged across the water column was ≈0.005 g.m−3 (Table 3). The mean flow through the central canyon below 200 m depth (net of the outflow on the western side) has been estimated as 35,500 m3.s−1 (Greenan et al., 2014) and the inflow through the canyon mouth cannot be less. Thus, the biomass flux through the mouth in late summer would be ≈15 t.d−1–assuming only passive horizontal drift, ignoring net efficiency, and the biomass of other species not included in the present analyses, while setting aside vertical and cross-canyon structuring of both water flow and fish distributions (including diel migrations to the surface layer above the inflow). Under the assumption of passive drift, there is no escape for those fishes and no pool of accumulated biomass where survivors could live for more than a few weeks.
That calculation offers, at best, an order-of-magnitude estimate of the flux of mesopelagic biomass to the canyon's ecosystems through passive drift. It excludes macroplanktonic crustaceans, which are also potential prey of Gonatus spp. (Jereb et al., 2015; Golikov et al., 2018). In the IYGPT catches on the Main Station in summer (MacIsaac et al., 2014), those crustaceans showed a similar water-column biomass density to that estimated here for the fishes. Conversely, some portion of the biomass flux through the canyon's mouth will be lost to Gully ecosystems when vertically migrant fishes are swept over the adjacent banks. Another, and potentially larger error in the 15 t.d−1 estimate arises from net efficiency. There have been recent suggestions that the catchability of mesopelagic fishes in midwater trawls is very low, including one estimate that the density of B. glaciale ahead of a Harstad trawl is two orders of magnitude greater than indicated by the catch of per unit volume of water filtered (Kaartvedt et al., 2012). Those suggestions rely on an untested assumption that observed acoustic backscatter comes from the same organisms as are vulnerable to net capture, while (from differences in net geometry and mesh sizes) an IYGPT would be expected to have higher efficiency for small fish than does a Harstad trawl. Nevertheless, while other uncertainties in the estimated biomass flux into The Gully might outweigh the effects of net efficiency and the exclusion of crustaceans, the true flux is likely considerably larger than is estimated here. Even 15 t.d−1 of fish supply would be of the right order to support the estimated consumption of Gonatus spp.
We therefore suggest that passive drift of meso- and bathypelagic fishes into The Gully, from beyond the shelf break, provides a substantial part of the trophic support of the northern bottlenose whales in the canyon. If that conclusion has merit, it serves to explain the distribution of the whales in terms of canyon bathymetry, its shaping of water flow and hence the availability of prey across two trophic levels. The principal weakness in this explanation of our observations is that it depends on an inference that fish species evolved for life in open ocean lack any means, within their behavioural repertoires, for active avoidance of the inflow into the canyon. While a reasonable first approximation, that supposed inability to escape from The Gully cannot be supported by data.
Elaborations of the model may explain other features of fish distributions in the canyon. A weak gyre appears to form at canyon-rim depth, in summer and in the vicinity of the Main Station (Greenan et al., 2014; Shan et al., 2014a). That alone should serve to retain fishes in the central canyon but it was primarily five species of diel-migrant myctophids that showed higher abundance on the Main Station than the Deep. For them, the combination of current sheer and migration creates, in effect, a stronger, behaviourally mediated gyre–up-canyon on the east side at depth, cross-canyon in the surface flow and down-canyon in the outflow along the western wall—concentrating such species in the central canyon.
The seasonal variation in the fish assemblage may also be partly explained by water movements. Modelling suggests a stronger up-canyon flow at depth in winter, with less of a counter flow to the west (Shan et al., 2014a). Thus, those species which do not withdraw to bathypelagic depths, thereby avoiding much of the inflow, will experience The Gully in early spring with a unidirectional current, rather than the retention effect of the summer's partial gyre.
Implications for MPA Management
Well-designed MPAs, with enforced conservation measures, can sometimes protect the biota within their boundaries from the effects of local deleterious anthropogenic activities. Most cannot, however, protect against the consequences of distant activities, if those consequences are transported across MPA boundaries. For The Gully, Hooker et al. (2002a) noted that conservation of the northern bottlenose whales requires measures to protect an area much larger than the existing MPA, encompassing the sources of the allochthonous energy which supports that signature species. However, those authors could only speculate as to the pathways through which the energy enters the canyon. The present work has shown that passive drift of meso- and bathypelagic fishes is one plausible mechanism for an energy flux large enough to be a principal pathway supporting the whales. We therefore suggest that long-term achievement of the MPA's goals requires effective protection of the sources from which those mesopelagic fishes are drawn, initially as a precautionary measure. Fortunately, the Gully management regulations prohibit anthropogenic activities outside the MPA's boundaries that have deleterious effects on the biota within (Department of Fisheries Oceans, 2008). That authority should be used to protect the whales' supply of prey—though the extent of the area from which the fishes are drawn remains to be determined.
Data Availability Statement
All datasets analysed for this study are included in the article/Supplementary Material.
Ethics Statement
Marine fish surveys conducted at sea present special circumstances regarding euthanasia of the animals caught. Guidelines developed by the American Fisheries Society exempt fish caught by such surveys from standard euthanasia practices because of the numbers of specimens collected at one time (https://fisheries.org/policy-media/science-guidelines/guidelines-for-the-use-of-fishes-in-research/#8.1). As expected during deep sampling, most of the fish caught during the Gully surveys died in the trawls and the remainder expired soon after being brought aboard, while being sorted. The study was carried out under the auspices of Fisheries and Oceans, Canada and the Animal Care Committee of Fisheries and Oceans, Canada, Maritimes Region, approved that approach to euthanization.
The trawling was conducted under authorizations, from the Regional Director, Science Branch, Maritimes Region, of Fisheries and Oceans, Canada, to engage in fishing and related activities on the Atlantic coast of Canada, subject to the provisions of the Fisheries Act and Regulations thereunder. Four of the stations lay within The Gully Marine Protected Area. Trawling and other operations there were conducted under Ministerial Approval (by the Minister of Fisheries and Oceans, Canada) to engage in research activities under Section 6(1) of the Gully MPA Regulations, subject to the provisions of the Fisheries Act and following review of the survey's plans. No protected species were captured by the trawls.
Author Contributions
TK led all scientific aspects of the research program and the survey cruises, supervising the fishing at sea. He coordinated the post-survey work, edited the catch database, interpreted the analytical results, and drafted the paper. DT and SD had primary responsibility for fish identifications, both at sea and ashore. EK secured funding and ship time for the surveys, provided technical staff, and oversaw administration of the program. She also performed the multivariate analyses. All authors contributed to development of the final paper from initial drafts.
Funding
This fieldwork was funded and TK's contributions were partially supported by the Department of Fisheries and Oceans, through its Ocean Ecosystem Sciences and Oceans & Coastal Management divisions, at the Bedford Institute of Oceanography. The other authors received no specific funding for this work.
Conflict of Interest
The authors declare that the research was conducted in the absence of any commercial or financial relationships that could be construed as a potential conflict of interest.
Acknowledgments
The work presented here is one outcome of a program which has been built on the interlinked efforts of many individuals, including scientific and administrative staff, plus the captains, officers, and crews of the research trawlers aboard which the surveys were conducted. All have been named as authors of, or else acknowledged in, the methodological and background reports cited above. The conclusions drawn in this paper could not have been reached without the combined efforts of them all. We further thank Dr. Javier Murillo and Sarah Thompson, of the Department of Fisheries and Oceans, for their reviews of an earlier draft and Cam Lirette, also of the Department, for preparing the maps presented here.
Supplementary Material
The Supplementary Material for this article can be found online at: https://www.frontiersin.org/articles/10.3389/fmars.2020.00181/full#supplementary-material
Abbreviations
CIL, Cold Intermediate Layer; IYGPT, International Young Gadoid Pelagic Trawl; LSW, Labrador Sea Water; MDS, non-metric Multi-Dimensional Scaling; MPA, Marine Protected Area; WSW, Warm Slope Water.
References
Arkhipkin, A. I., and Bjørke, H. (1999). Ontogenetic changes in morphometric and reproductive indices of the squid Gonatus fabricii (Oegopsida, Gonatidae) in the Norwegian Sea. Polar Biol. 22, 357–365. doi: 10.1007/s003000050429
Baker, K. D., Haedrich, R. L., Snelgrove, P. V., Wareham, V. E., Edinger, E. N., and Gilkinson, K. D. (2012). Small-scale patterns of deep-sea fish distributions and assemblages of the Grand Banks, Newfoundland continental slope. Deep Sea Res. Part 1 Oceanogr. Res. Pap. 65, 171–188. doi: 10.1016/j.dsr.2012.03.012
Benoit-Bird, K. J., and Au, W. W. L. (2006). Extreme diel horizontal migration by a tropical nearshore resident micronekton community. Mar. Ecol. Prog. Ser. 319, 1–14. doi: 10.3354/meps319001
Benoit-Bird, K. J., Au, W. W. L., Brainard, R. E., and Lammers, M. O. (2001). Diel horizontal migration of the Hawaiian mesopelagic boundary community observed acoustically. Mar. Ecol. Prog. Ser. 217, 1–14. doi: 10.3354/meps217001
Breeze, H. (2002). Commercial fisheries of the Sable Gully and surrounding region: historical and present activities. Can. MS Rep. Fish. Aquat. Sci. 2612:83.
Cherel, Y., Ridoux, V., Spitz, J., and Richard, P. (2009). Stable isotopes document the trophic structure of a deep-sea cephalopod assemblage including giant octopod and giant squid. Biol. Lett. 5, 364–367. doi: 10.1098/rsbl.2009.0024
Chouinard, P.-M., and Dutil, J.-D. (2011). The structure of demersal fish assemblages in a cold, highly stratified environment. ICES J. Mar. Sci. 68, 1896–1908. doi: 10.1093/icesjms/fsr125
Cogswell, A. T., Kenchington, E. L. R., Lirette, C. G., MacIsaac, K., Best, M. M., Beazley, L. I., et al. (2009). The current state of knowledge concerning the distribution of coral in the Maritime Provinces. Can. Tech. Rep. Fish. Aquat. Sci. 2855:66.
Cook, A. B., Sutton, T. T., Galbraith, J. K., and Vecchione, M. (2013). Deep-pelagic (0–3000 m) fish assemblage structure over the Mid-Atlantic Ridge in the area of the Charlie-Gibbs Fracture Zone. Deep Sea Res. Part 2 Top. Stud. Oceanogr. 98, 279–291. doi: 10.1016/j.dsr2.2012.09.003
Davison, P. C., Checkley, D. M., Koslow, J. A., and Barlow, J. (2013). Carbon export mediated by mesopelagic fishes in the northeast Pacific ocean. Prog. Oceanogr. 116, 14–30. doi: 10.1016/j.pocean.2013.05.013
Department of Fisheries and Oceans (2008). The Gully Marine Protected Area Management Plan. Dartmouth, NS: Department of Fisheries and Oceans.
Dolgov, A. V. (2015). Composition and structure of the mesopelagic fish communities in the Irminger sea and adjacent waters. J. Ichthyol. 55, 53–68. doi: 10.1134/S0032945215010026
Feagans-Bartow, J. N., and Sutton, T. T. (2014). Ecology of the oceanic rim: pelagic eels as key ecosystem components. Mar. Ecol. Prog. Ser. 502, 257–266. doi: 10.3354/meps10707
Gartner, J. V., Sulak, K. J., Ross, S. W., and Necalse, A. M. (2008). Persistent near-bottom aggregations of mesopelagic animals along the North Carolina and Virginia continental slopes. Mar. Biol. 153, 825–841. doi: 10.1007/s00227-007-0855-1
Gjøsaeter, J., and Kawaguchi, K. (1980). A review of the world resources of mesopelagic fish. FAO Fish. Tech. Pap. 193:151.
Golikov, A. V., Ceia, F. R., Sabirov, R. M., Zaripova, Z. I., Blicher, M. E., Kakharov, D. V., et al. (2018). Ontogenetic changes in stable isotope (δ13C and δ15N). values in squid Gonatus fabricii (Cephalopoda) reveal its important ecological role in the Arctic. Mar. Ecol. Prog. Ser. 606, 65–78. doi: 10.3354/meps12767
Gowans, S., Whitehead, H., Arch, J. K., and Hooker, S. K. (2000). Population size and residency patterns of northern bottlenose whales (Hyperoodon ampullatus) using the Gully, Nova Scotia. J. Cetacean Res. Manag. 2, 201–210.
Greenan, B. J. W., Petrie, B. D., and Cardoso, D. A. (2014). Mean circulation and high-frequency flow amplification in the Sable Gully. Deep Sea Res. Part 2 Top. Stud. Oceanogr. 104, 20–34. doi: 10.1016/j.dsr2.2013.07.011
Greenan, B. J. W., Petrie, B. D., Cardoso, D. A., Harrison, W. G., Head, E. J. H., and Li, W. K. W. (2013). Physical, chemical and biological variability of the Sable Gully 2006-07. Can. Tech. Rep. Hydrogr. Ocean. Sci. 293:261.
Harding, G. C. (1998). “Submarine canyons: deposition centres for detrital organic matter?” in The Gully: A Scientific Review of Its Environment and Ecosystem, eds W. G. Harrison and D. G. Fenton (Ottawa, ON: Canadian Stock Assessment Secretariat Research Document 98/83), 105–106.
Hooker, S. K., and Baird, R. W. (1999). Deep-diving behaviour of the northern bottlenose whale, Hyperoodon ampullatus (Cetacea: Ziphiidae). Proc. R. Soc. B Biol. Sci. 266, 671–676. doi: 10.1098/rspb.1999.0688
Hooker, S. K., Iverson, S. J., Ostrom, P., and Smith, S. G. (2001). Diet of northern bottlenose whales inferred from fatty-acid and stable-isotope analyses of biopsy samples. Can. J. Zool. 79, 1442–1454. doi: 10.1139/z01-096
Hooker, S. K., Whitehead, H. W., and Gowans, S. (2002a). Ecosystem consideration in conservation planning: energy demand of foraging bottlenose whales (Hyperoodon ampullatus) in a marine protected area. Biol. Conserv. 104, 51–58. doi: 10.1016/S0006-3207(01).00153-7
Hooker, S. K., Whitehead, H. W., Gowans, S., and Baird, R. W. (2002b). Fluctuations in distribution and patterns of individual range use of northern bottlenose whales. Mar. Ecol. Prog. Ser. 225, 287–297. doi: 10.3354/meps225287
Hudson, J. M., Steinberg, D. K., Sutton, T. T., Graves, J. E., and Latour, R. J. (2014). Myctophid feeding ecology and carbon transport along the northern Mid-Atlantic Ridge. Deep Sea Res. Part 1 Oceanogr. Res. Pap. 93, 104–116. doi: 10.1016/j.dsr.2014.07.002
Jereb, P., Allcock, A. L., Lefkaditou, E., Piatkowski, U., Hastie, L. C., and Pierce, G. J. (2015). Cephalopod biology and fisheries in Europe: II. Species accounts. ICES Coop. Res. Rep. 325:360.
Kaartvedt, S., Staby, A., and Aksnes, D. L. (2012). Efficient trawl avoidance by mesopelagic fishes causes large underestimation of their biomass. Mar. Ecol. Prog. Ser. 456, 1–6. doi: 10.3354/meps09785
Kenchington, T. J., Benjamin, R., Best, M., Cogswell, A., Cook, A., DeVaney, S., et al. (2014a). Field methods of the 2008, 2009 and 2010 surveys of meso- and bathypelagic micronekton in The Gully. Can. Tech. Rep. Fish. Aquatic Sci. 3076:73.
Kenchington, T. J., Best, M., Bourbonnais-Boyce, C., Clement, P., Cogswell, A., MacDonald, B., et al. (2009). Methodology of the 2007 survey of meso- and bathypelagic micronekton of the Sable Gully: Cruise TEM768. Can. Tech. Rep. Fish. Aquatic Sci. 2853:91.
Kenchington, T. J., Cochrane, N. A., Gjerdrum, C., Lirette, C., Greenan, B. J. W., Moors-Murphy, H., et al. (2014b). The environmental background to the 2008, 2009 and 2010 meso- and bathypelagic trawl surveys of The Gully. Can. Tech. Rep. Fish. Aquatic Sci. 3114:251.
Kenchington, T. J., Themelis, D., DeVaney, S., and Kenchington, E. L. (2018). The meso- and bathypelagic fish assemblage in The Gully: Data preparation and species' distributions. Can. Tech. Rep. Fish. Aquatic Sci. 3268:153. doi: 10.13140/RG.2.2.13961.54881
Kepkay, P. E., Harrison, W. G., Bugden, J. B. C., and Porter, C. J. (2002). “Seasonal plankton production in the Gully ecosystem”, in Advances in Understanding the Gully Ecosystem: A Summary of Research Projects Conducted at the Bedford Institute of Oceanography (1999–2001), eds D. C. Gordon and D. G. Fenton (Dartmouth, NS: Fisheries and Oceans Canada), 61–68.
MacIsaac, K. G., Kenchington, T. J., Kenchington, E. L., and Best, M. (2014). The summer assemblage of large pelagic Crustacea in the Gully submarine canyon: major patterns. Deep Sea Res. Part 2 Top. Stud. Oceanogr. 104, 51–66. doi: 10.1016/j.dsr2.2013.08.017
Mann, K. H. (2002). “Overview of results”, in Advances in Understanding the Gully Ecosystem: A Summary of Research Projects Conducted at the Bedford Institute of Oceanography (1999–2001), eds D. C. Gordon and D. G. Fenton (Dartmouth, NS: Fisheries and Oceans Canada), 72–78.
Markle, D. F., and Wenner, C. A. (1979). Evidence of demersal spawning in the mesopelagic zoarcid fish Melanostigma atlanticum with comments on demersal spawning in the alepocephalid fish Xenodermichthys copei. Copeia 1979, 363–366. doi: 10.2307/1443431
May, J. L., and Blaber, S. J. M. (1989). Benthic and pelagic fish biomass of the upper continental slope off eastern Tasmania. Mar. Biol. 101, 11–25. doi: 10.1007/BF00393474
McKelvie, D. S. (1985). The mesopelagic fish fauna of the Newfoundland Basin. Can. J. Zool. 63, 2176–2182. doi: 10.1139/z85-321
McManus, M. A., Benoit-Bird, K. J., and Woodson, C. B. (2008). Behavior exceeds physical forcing in the diel horizontal migration of the midwater sound-scattering layer in Hawaiian waters. Mar. Ecol. Prog. Ser. 365, 91–101. doi: 10.3354/meps07491
Møller, P. R., Nielsen, J., Knudsen, S. W., Poulsen, J. Y., Sünksen, K., and Jørgensen, O. A. (2010). A checklist of the fish fauna of Greenland waters. Zootaxa2378:84.
Moore, J. A., Hartel, K. E., Craddock, J. E., and Galbraith, J. K. (2003a). An annotated list of deepwater fishes from off the New England region, with new area records. Northeast. Nat. 10, 159–248. doi: 10.1656/1092-6194(2003).010[0159:AALODF]2.0.CO;2
Moore, J. A., Vecchione, M., Collette, B. B., Gibbons, R., and Hartel, K. E. (2004). Selected fauna of Bear Seamount (New England Seamount Chain), and the presence of “natural invader” species. Arch. Fish. Mar. Res. 51, 241–250.
Moore, J. A., Vecchione, M., Collette, B. B., Gibbons, R., Hartel, K. E., Galbraith, J. K., et al. (2003b). Biodiversity of Bear Seamount, New England Seamount Chain: results of exploratory trawling. J. Northw. Atl. Fish. Sci. 31, 363–372. doi: 10.2960/J.v31.a28
Moors-Murphy, H. B. (2014). Submarine canyons as important habitat for cetaceans, with special reference to The Gully: a review. Deep Sea Res. Part 2 Top. Stud. Oceanogr. 104, 6–19. doi: 10.1016/j.dsr2.2013.12.016
O'Brien, K., and Whitehead, H. (2013). Population analysis of endangered northern bottlenose whales on the Scotian slope seven years after the establishment of a marine protected area. Endanger. Species Res. 21, 273–284. doi: 10.3354/esr00533
Petrie, B., Pettipas, R. G., Petrie, W. M., and Soukhovtsev, V. V. (2008). Physical oceanographic conditions on the Scotian Shelf and in the Gulf of Maine during 2007. Canadian Scientific Advisory Secretariat Research Document 2008/017.
Potter, D. C., Lough, R. G., Perry, R. I., and Neilson, J. D. (1990). Comparison of the MOCNESS and IYGPT pelagic samplers for the capture of 0-group cod (Gadus morhua) on Georges Bank. J. Cons. Int. Explor. Mer. 46, 121–128. doi: 10.1093/icesjms/46.2.121
Ross, S. W., Rhode, M., and Quattrini, A. M. (2015). Demersal fish distribution and habitat use within and near Baltimore and Norfolk canyons, U.S. Middle Atlantic Slope. Deep Sea Res. Part 1 Oceanogr. Res. Pap. 103, 137–154. doi: 10.1016/j.dsr.2015.06.004
Sameoto, D., Cochran, N., and Kennedy, M. (2002). Seasonal abundance, vertical and geographic distribution of mesozooplankton, macrozooplankton and micronekton in The Gully. Can. Tech. Rep. Fish. Aquat. Sci. 69–71.
Shan, S., Sheng, J., and Greenan, B. J. (2014a). Physical processes affecting circulation and hydrography in the Sable Gully of Nova Scotia. Deep Sea Res. Part 2 Top. Stud. Oceanogr. 104, 35–50. doi: 10.1016/j.dsr2.2013.06.019
Shan, S., Sheng, J., and Greenan, B. J. (2014b). Modelling study of three-dimensional circulation and particle movement over the Sable Gully of Nova Scotia. Ocean Dyn. 64, 117–142. doi: 10.1007/s10236-013-0672-7
Silverberg, N., and Bossé, L. (1994). Additional observations of endobenthic behaviour in the early life history of Melanostigma atlanticum (Zoarcidae) in muddy bottom sediments of the Laurentian Trough, eastern Canada. Environ. Biol. Fishes 39, 43–49. doi: 10.1007/BF00004754
Silverberg, N., Edenborn, H. M., Ouellet, G., and Béland, P. (1987). Direct evidence of a mesopelagic fish, Melanostigma atlanticum (Zoarcidae) spawning within bottom sediments. Environ. Biol. Fishes 20, 195–202. doi: 10.1007/BF00004954
Sutton, T. T., Letessier, T. B., and Bardarson, B. (2013). Midwater fishes collected in the vicinity of the Sub-Polar Front, Mid-North Atlantic ocean, during ECOMAR pelagic sampling. Deep Sea Res. Part 2 Top. Stud. Oceanogr. 98, 292–300. doi: 10.1016/j.dsr2.2013.08.001
Sutton, T. T., Porteiro, F. M., Anderson, C. I. H., Horne, J., Søiland, H., Falkenhaug, T., et al. (2008). Vertical structure, biomass and topographic association of deep-pelagic fishes in relation to a mid-ocean ridge system. Deep Sea Res. Part 2 Top. Stud. Oceanogr. 55, 161–184. doi: 10.1016/j.dsr2.2007.09.013
Themelis, D. E., and Halliday, R. G. (2012). Species composition and relative abundance of the mesopelagic fish fauna in the Slope Sea off Nova Scotia. Northeast. Nat. 19, 177–200. doi: 10.1656/045.019.0204
Thompson, S. E., and Kenchington, T. J. (2017). Distribution and diet of Cyclothone microdon (Gonostomatidae) in a submarine canyon. J. Mar. Biol. Assoc. U.K. 97, 1573–1580. doi: 10.1017/S0025315416000916
Trueman, C. N., Johnston, G., O'Hea, B., and MacKenzie, K. M. (2014). Trophic interactions of fish communities at midwater depths enhance long-term carbon storage and benthic production on continental slopes. Proc. R. Soc. B Biol. Sci. 281:20140669. doi: 10.1098/rspb.2014.0669
Whitehead, H. (2013). Trends in cetacean abundance in the Gully submarine canyon, 1988–2011, highlight a 21% per year increase in Sowerby's beaked whales (Mesoplodon bidens). Can. J. Zool. 91, 141–148. doi: 10.1139/cjz-2012-0293
Keywords: submarine canyon, mesopelagic, bathypelagic, fish, The Gully, Marine Protected Area
Citation: Kenchington TJ, Themelis DE, DeVaney SC and Kenchington EL (2020) The Meso- and Bathypelagic Fishes in a Large Submarine Canyon: Assemblage Structure of the Principal Species in the Gully Marine Protected Area. Front. Mar. Sci. 7:181. doi: 10.3389/fmars.2020.00181
Received: 14 March 2019; Accepted: 06 March 2020;
Published: 27 March 2020.
Edited by:
Anna Metaxas, Dalhousie University, CanadaReviewed by:
Mackenzie E. Gerringer, SUNY Geneseo, United StatesLes Watling, University of Hawaii at Manoa, United States
Steve Barbeaux, Alaska Fisheries Science Center (NOAA), United States
Copyright © 2020 Her Majesty the Queen in Right of Canada. This is an open-access article distributed under the terms of the Creative Commons Attribution License (CC BY). The use, distribution or reproduction in other forums is permitted, provided the original author(s) and the copyright owner(s) are credited and that the original publication in this journal is cited, in accordance with accepted academic practice. No use, distribution or reproduction is permitted which does not comply with these terms.
*Correspondence: Trevor John Kenchington, VHJldm9yLktlbmNoaW5ndG9uQGRmby1tcG8uZ2MuY2E=