 Susanne Menden-Deuer1*
 Françoise Morison1
 Amanda L. Montalbano1
 Gayantonia Franzè1,2†
 Jacob Strock1
 Ewelina Rubin1
 Heather McNair1
 Colleen Mouw1
 Pierre Marrec1
- 1 Graduate School of Oceanography, University of Rhode Island, Narragansett, RI, United States
- 2 Norwegian Institute of Marine Research (IMR), Bergen, Norway
The abundance and size distribution of plankton in the surface ocean are key metrics to understanding primary and export production, food web dynamics, and the optical properties of the water column. Here we quantified cell size and abundance of phytoplankton species from mono-specific laboratory cultures, using optical, electrical, and image-based benchtop instrumentation. Moreover, we combined particle size distribution and size fractionated chlorophyll a (Chl a) analysis with image analysis to estimate phytoplankton community composition and abundance comparing a high and low biomass station in the North Atlantic during springtime. In laboratory cultures, we found generally good agreement in estimates of both particle concentration and particle size among instruments. Image-based approaches (e.g., microscopy, FlowCam) delivered somewhat lower cell abundance estimates, because image-based instruments distinguish cells from non-target particles. Image-based approaches also measured 10–20% greater cell sizes, because measurements were based only on in-focus images of the target species. Compared to image-based instruments, particle counters delivered indistinguishable estimates of size and abundance with much lower effort and technical expertise required; maximum coefficient of variation for cell abundance and size did not exceed 10 and 15%, respectively. Measurement precision was consistent across instrument type and across a cell size spectrum from 3 to >40 μm equivalent spherical diameter (ESD). For whole plankton community analyses from the North Atlantic, combined estimation of Chl a concentration and image-based diversity assessments resolved the dominant phytoplankton species and spatial differences in the size structure of the plankton community. These results provide strong support for using particle counters, that can rapidly process large volumes of samples, to quantify particle size and abundance, including rarer, larger particles. Species identities and community composition can be revealed by supplemental, image-based approaches. Application of this coupled approach can help identify fundamental ecosystem characteristics such as particle size spectra that affect primary production, trophic transfer, and export. Ultimately, the tremendous species diversity of plankton can be leveraged as particle tracking and identification keys, such as near-real time identification of coherent water masses.
Introduction
The abundance and size distribution of particles in the surface ocean, including plankton, are critical determinants of the optical properties of aquatic primary and export production, food web structure, and biogeochemistry (Reynolds et al., 2010; Maranon, 2015). Marine particulates including plankton span orders of magnitude in size, from nanometers to centimeters (10–9 to 10–2 m), which has made their characterization challenging. No one instrument is currently optimized to characterize particle abundance and sizes across this vast size range (Stemmann and Boss, 2011). This mismatch results in limited predictive capacity of important metrics, such as particle sinking rates and thus export production of organic matter from the surface ocean (Siegel et al., 2016). Many phytoplankton have complex shapes that are difficult to express in simple geometric terms, yet size and shape of particles are key properties that affect light absorption and scattering, which are important metrics for satellite measurements and remote sensing of ocean ecosystem properties (Kostadinov et al., 2009; Mouw and Yoder, 2010). This problem is exacerbated by the diverse, taxon-specific cell surface coverings characteristic of phytoplankton (e.g., silica frustules, coccoliths).
Adding to the challenge of quantifying characteristics of individual particles is the fact that particles are embedded in a complex mixture of living, detrital, and abiotic material. The living component, the plankton community composition and its fine scale distribution, is increasingly recognized as important for understanding food web dynamics and large scale ecosystem function (Menden-Deuer and Fredrickson, 2010; Durham and Stocker, 2011; Levy et al., 2015), but our ability to quantify plankton community composition and variability therein is subject to a substantial technological challenge. Overcoming this challenge, however, is critical for a holistic understanding of ocean-atmosphere processes, which rely on near real time assessment of the fine-scale spatial and temporal trends in plankton community structure that can be leveraged for adaptive sampling by an inter-disciplinary team of investigators.
Recent advances in benchtop, in-line, and in situ instrumentation have vastly increased the sampling power and resolution of measurements of surface ocean particle size distributions (PSD). There are several excellent reviews of major instrumentation, which include diverse measurement approaches, including electrical impedance (e.g., Beckman Multisizer), optical (e.g., flow cytometers), and image-based instruments (e.g., FlowCam), some of which can be used on autonomous or remotely operated in situ instrumentation (Reynolds et al., 2010; Lombard et al., 2019). Each instrument type measures different particle properties (e.g., resistivity, fluorescence, light scattering), which result in instrument-specific advantages and disadvantages. For example, measurements of resistivity process samples with densities of 105 particles ml–1 or more within <1 min, but fail to detect key properties, such as distinguishing living from non-living particles.
For decades, analysis of microscope samples by highly trained individuals was necessary to characterize the species composition and abundance of particles in water samples. This approach yields high quality data, but it is labor-intensive and time consuming and thus results in considerable limitations with respect to spatial and temporal resolution. There is also high potential for operator-dependence of the results (Culverhouse et al., 2003). A major breakthrough was the development of image-based particle analyzers that can be operated in in situ or benchtop mode (Sieracki et al., 1998; Olson and Sosik, 2007; Sosik and Olson, 2007; Thyssen et al., 2015). These image-based approaches are further supported by the development of automated classification methods aided by machine-learning tools (e.g., neural networks), which are trained to recognize specific phytoplankton species, and permit extensive quantification of particle characteristics (Luo et al., 2018). Such instruments provide powerful tools to examine the optical and morphological details of particles and species in the surface ocean by distinguishing individual particles with respect to their characteristics such as detritus, lithogenic matter, biological species or fabricated materials (e.g., plastics). One caution to the utility of the image-based approaches is that recent molecular analyses suggest limited utility with respect to morphologically based identification, given that even dominant and keystone taxa are not distinguishable by visual inspection alone and can contain “cryptic species” (Canesi and Rynearson, 2016). Moreover, image-based approaches are most suitable for specimen with sizes >∼5 μm diameter, thus image analysis cannot adequately address important components of the pico- and nanoplankton. Thus, analysis has to be supplemented by additional characteristics, such as optical properties, including scatter and fluorescence.
Many instruments aim to characterize whole seawater PSD, irrespective of their specific characteristics, as these PSD can yield important environmental insights, such as magnitude of ecosystem production (e.g., Kim and Menden-Deuer, 2013 and references therein). A common challenge is the mathematical description of these PSD and the appropriate quantification of the slope of often non-linear PSD distributions (Reynolds et al., 2010 and references therein). For mono-specific laboratory cultures, instrument software provides analysis tools, but these tools are often user selected and not always supported by establishment of a standard operating procedure.
To address these challenges and establish particle characterization tools for the quantification of plankton, we present an instrument inter-comparison by evaluating measurements of cell abundance and cell size, along with reproducible, operator-independent analysis protocols that minimize user-induced biases in selection of the size ranges or particle types to include in analyses. Furthermore, these protocols can be standardized and subjected to sensitivity analyses. Our goal was to compare the precision and size range of each instrument using a best-case scenario of mono-specific phytoplankton cultures that are characterized by uniformity in size (i.e., at most a 2-fold variation) as well as a lack of detrital and non-biogenic particles. Finally, we use data collected at two open-ocean stations from the North Atlantic to demonstrate how combining image-based analyses with automated particle enumeration as well as measurements of size-fractionated Chl a concentration can provide a rapid assessment of whole plankton community composition.
Materials and Methods
Phytoplankton Culture Conditions
Eight phytoplankton species were selected as targets for cross-instrument comparisons. These species were chosen because they represent a size range from pico- to microplankton and vary in their surface properties, including thecate dinoflagellates covered by cellulose plates. All phytoplankton cultures (Table 1) were grown exponentially in F/2-Si medium (Guillard, 1975) and maintained in 250–500 ml PC bottles on a 12:12 light: dark cycle at 15°C, salinity of ∼30 psu, and a light intensity of 70–80 μmol photons m–2 s–1. All species were pigmented and grown phototrophically but not axenically.
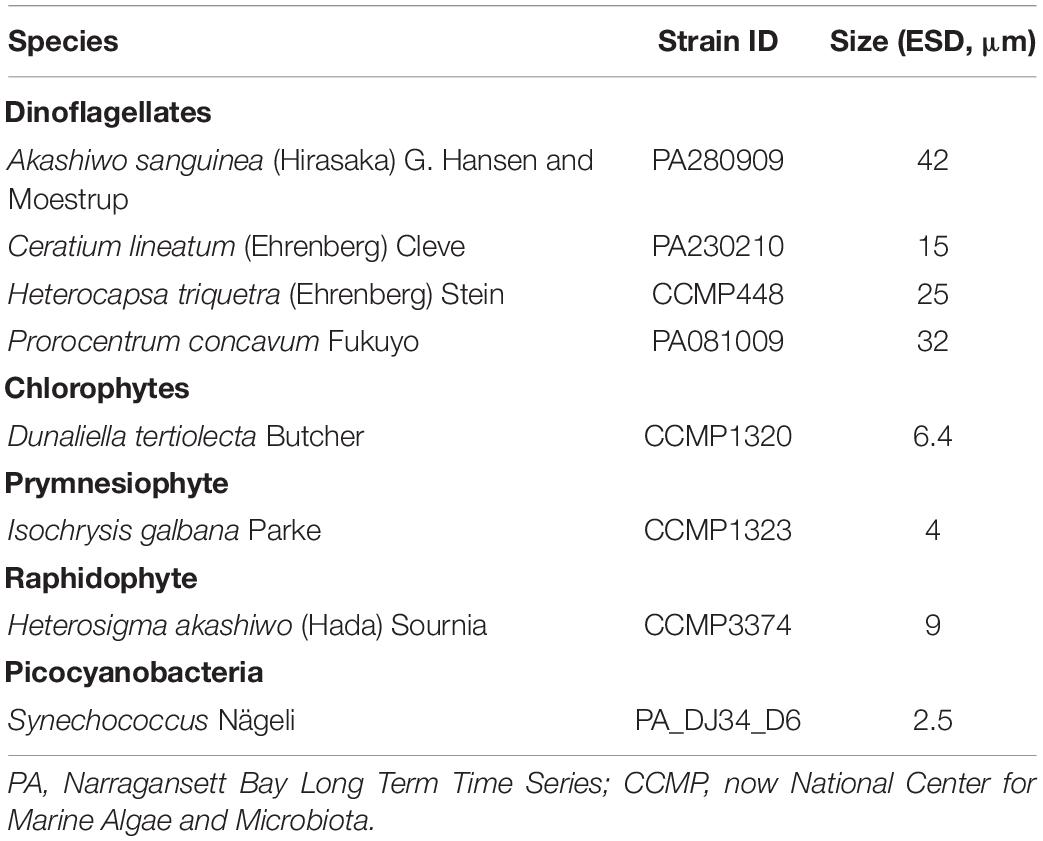
Table 1. Species analyzed in this study.
Laboratory Inter-comparison of Instruments
For the laboratory inter-instrument comparison, special emphasis was placed on three species: Isochrysis galbana, Dunaliella tertiolecta, and Prorocentrum concavum, which were measured with all instruments (Table 2). These three species represent differences in size and surface properties. Additional measurements of species listed in Table 1 were made as possible (Table 2). Constraints included the fact that not all species could be analyzed on all instruments. For example, picoplankton could not be imaged with the FlowCam. Moreover, we restricted the time frame of observation to 3 h, and instrument preparation and sample handling for some instruments was longer, limiting the number of species imaged. Measurements were acquired within 3 h, to ensure comparability of results and avoid changes in the properties of the phytoplankton cultures. Cultures were kept at room temperature and at low ambient light.
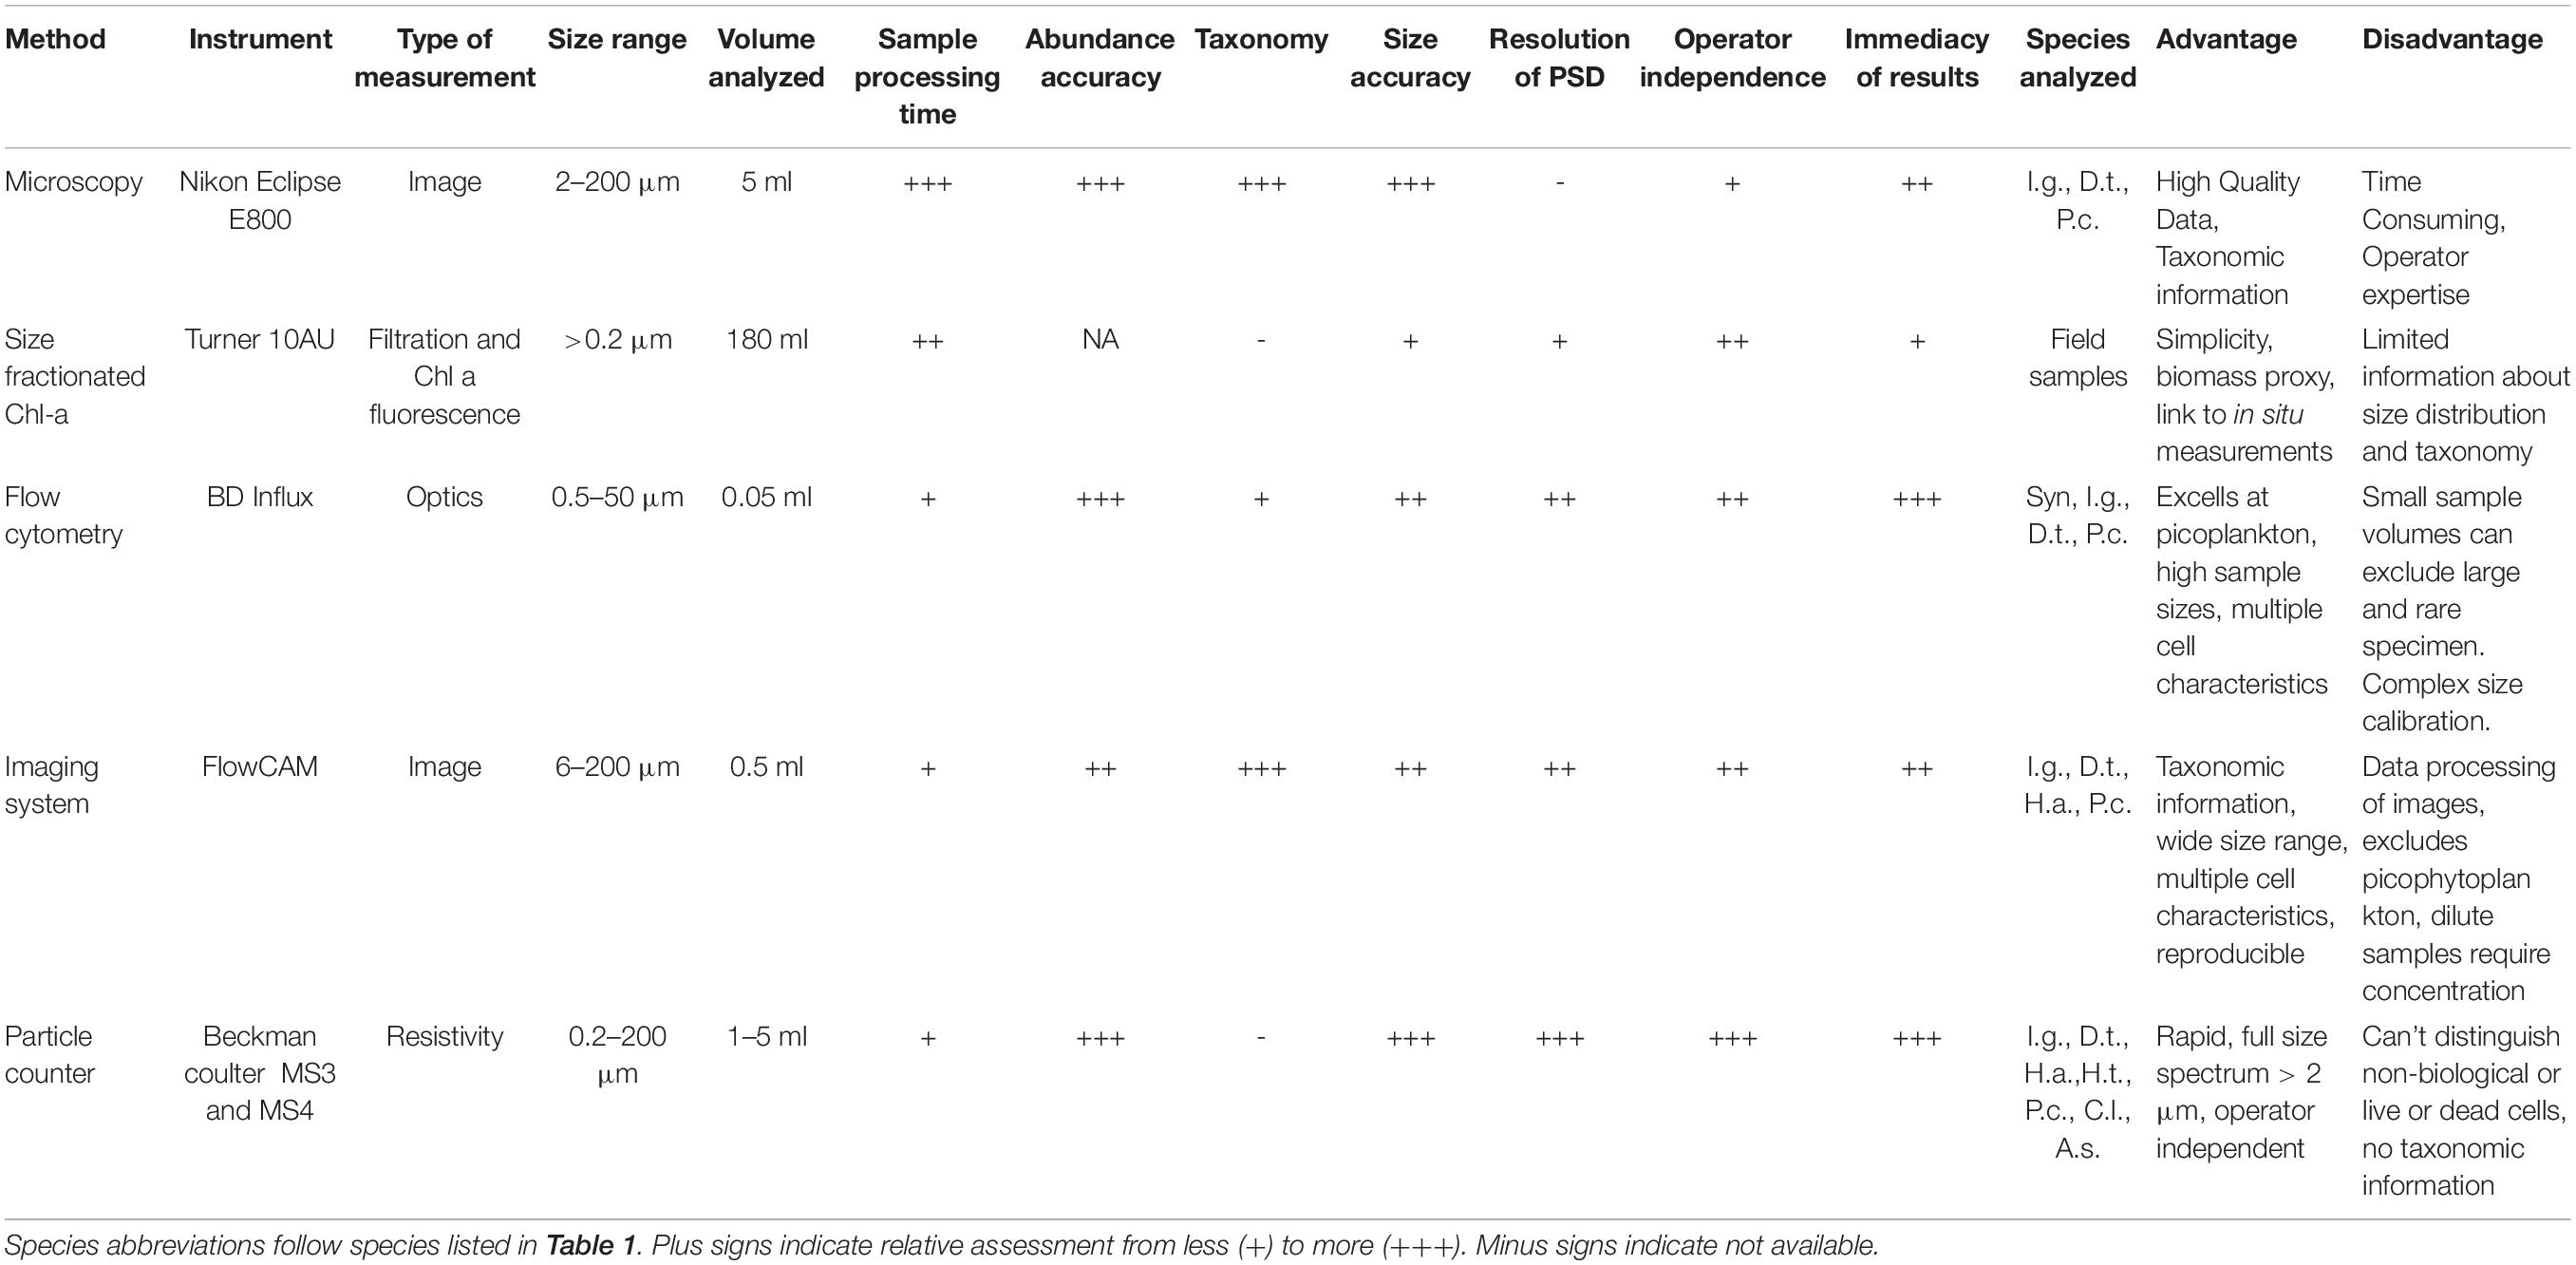
Table 2. Overview of instruments included, their general characteristics and our assessment of instrument utility for size, abundance and particle size distribution estimates.
Instruments used in the inter-comparison of counts and sizing included a microscope, two models of Coulter Counter (MIII and MIV), a FlowCam, and a BD Influx flow cytometer. These instruments were chosen to represent different measurement approaches, including optical and electrical. Details on each instrument and the measurements are given below.
Microscopy analyses
To determine cell counts and cell volume, 5 ml samples were preserved in acid Lugol (2% final conc.) and analyzed using 1 ml aliquots on a Sedgwick-Rafter counting chamber and a Nikon Eclipse E800 light microscope. For low concentration samples with <500 cells ml–1, all cells within the chamber were counted, while a minimum number of 500 cells or those in 20 grids in a Sedgwick-Rafter were counted for high concentration samples (>500 cells ml–1). Microscope counts were not replicated but count variation for the two smaller species was estimated as among field of view abundances. Species-specific cell volume was calculated based on linear dimensions measured from 30 to 100 cells, using an image analysis system consisting of a high-resolution digital camera (Allied Vision, F45) and ImageJ software v1.5i. Both length and width were measured on cells in planar view using a magnification between 100× and 200×.
Coulter Counter Analysis
A Multisizer III (MS3) and a Multisizer IV (MS4) (Beckman Coulter Counter, CC) were used to measure particle numbers and size distribution. Triplicate 10 ml aliquots were withdrawn from each phytoplankton culture and 1 ml of each aliquot was counted using a 100 μm aperture. Aperture diameter determines the theoretical size range of the measurable particle size spectrum, which is 3–65% of the aperture diameter. Data blanks were generated with 0.2 μm Parker string-wound cartridge filtered sterile seawater and used to verify the reliability of the theoretical range. The instrument was regularly calibrated with manufacturer supplied beads of a nominal diameter of 10 μm. The particle size spectrum produced number of counts per size bin between 3 and 65 μm with a bin width of 0.2 μm, the CC default. Coulter counter sizes are expressed as equivalent spherical diameter (ESD).
BD Influx
Cell abundances for four of the phytoplankton cultures (Synechococcus sp., D. tertiolecta, I. galbana, and P. concavum, Table 1) were determined using the BD Influx flow cytometer (BD Biosciences). This flow cytometer is equipped with multiple lasers and photomultiplier tubes for optical signal collection. We used optical pulse shape signals from a blue laser beam (488 nm) and forward scatter (FSC), sideward scatter, orange (580/30 nm) and red (692/40 nm) fluorescence optical parameters to assess culture abundances. Flow rate and analyzed sample volume were calculated from the difference in sample weight between the start and the end of the analysis. Event acquisition and recording times were at least 125 and at most 225 s. The mean flow rate during the analyses was 0.60 μl s–1. Cell abundance was determined from the number of events in a gate for a given cell population divided by the volume of the sample that passed through the instrument during acquisition. SpheroAccuCountTM (7.3 μm, Spherotech) calibration beads, with certified concentration, were analyzed before and after the measurements to monitor the instrument stability and to confirm the calculation of the volume analyzed by the instrument. Ultra Rainbow beads (3 μm, Spherotech) were also analyzed to monitor the instrument stability. Data were collected using the BD FACS Software to acquire, record data and pick gates, and then reanalyzed in Flowing Software1 to obtain the abundances of each culture. Flow cytometry was used as a reference approach to estimate the abundance of phytoplankton species based on their fluorescence emissions. Phytoplankton cell size was estimated from mean single-cell FSC. We used an iterative linear regression approach including both beads and the cultured phytoplankton species of known size (Table 1), and assuming a 0 intercept. The iterative linear regression approach included the mean FSC of the two different beads and mean FSC of three phytoplankton species of known size (Sieracki and Poulton, 2011; Cetinic et al., 2015). The analysis excluded the species under investigation. This approach resulted in significant relationships between size and FSC with r2-values of 0.99, except for Prorocentrum, the largest cells, with a r2 of 0.89. Although we observed reliable linear fits, we caution that prior reports observed a polynomial relationship (Shalapyonok et al., 2001) or a power law function (Jacquet et al., 2001). Future applications of this approach need to resolve the effects of the optical properties of beads and cells on cell size estimates with flow cytometers and determine when linear relationships can be applied.
FlowCam
Samples were analyzed using a benchtop B3 Series FlowCam (Fluid Imaging) with a 50 μm standard flow cell at a 20× magnification. Samples were analyzed in triplicate for all species except Heterosigma sp., for which only one sample could be analyzed within the allotted 3 h time frame. The FlowCam offers three working modes: auto-image, fluorescence or side-scatter trigger modes. In auto-image, images are taken at a constant frame rate, whereas in either trigger modes, the camera is triggered only when particle fluorescence or scattering exceeds a default threshold that can be adjusted. For phytoplankton analyses, the use of the fluorescence trigger mode is the more frequently used mode due to the pigment composition of phototrophic cells. We used the fluorescence trigger mode to support comparison to the BD influx measurement. Samples were run for ∼3 min, corresponding to a processed volume of ∼0.3 ml. In trigger mode, ideally the particle per used image (PPUI) should be kept at <1.2, i.e., only one cell should be present in the field of view when the camera is triggered. Due to the elevated density of the laboratory cultures, average PPUI of triplicates values were 2.2 and 1.37 for I. galbana and D. tertiolecta cultures, respectively. This implies coincident observations of cells and inaccurate estimates of cell concentrations as automatically generated by the instrument software. To overcome the inaccuracy of the system supplied concentration estimates, final concentrations were re-calculated manually (see below in section “Data Analysis”). Cell density for P. concavum was low and auto-image mode was used to avoid potential loss of cells due to low fluorescence. The number of P. concavum cells analyzed was further maximized by running the sample for 10 min, corresponding to a volume of ∼1 ml. After analysis, FlowCam images were processed twice: first to generate abundance estimates after removing non-target species particles (e.g., detrital material), and second to generate size estimates after removing target-species images that were not in planar view or not in focus. Cell abundance and cell ESD of the target species were retrieved using the instrument software. ESD was estimated as the mean value of 36 Feret measurements, i.e. perpendicular distances between parallel tangents across opposite sides of the particle, made at 5° each between −90° and +90°.
Whole Plankton Community Analysis
Source water was collected in May 2016 during the NAAMES second field campaign aboard the R/V Atlantis along a north to south transect (54–44°N, ∼40°W) in the North Atlantic Ocean (Behrenfeld et al., 2019). Here we focus on two stations that represented the extremes of the range of Chl a concentrations encountered during the campaign, Station 3 (50.24°N, 43.86°W) and Station 4 (47.35°N, 38.31°W). The station numbers are identical to the numbering used during the NAAMES cruise to facilitate comparisons with other reports from that campaign. Water for plankton community analyses was collected from a depth of 5 m using a Niskin rosette with 10 L bottles equipped with a SBE911plus (Seabird Electronics) CTD (Conductivity, Temperature and Depth) profiler and gently strained through a 200 μm mesh (see Morison et al., 2019).
Particle counts and size distribution were analyzed onboard using a Coulter Counter Model III, following the protocol described above for the analysis of mono-specific laboratory cultures. Chl a analysis followed the procedure regularly used by our laboratory for Chl a extraction (e.g., Morison et al., 2019). In brief, Chl a concentration was determined from triplicate 180 ml subsamples taken from the same Niskin bottle after filtration on GF/F filters and extraction followed Graff and Rynearson (2011), except that extraction took place in the dark at room temperature for 12 h in 96% ethanol (Jespersen and Christoffersen, 1987). Size fractionated Chl a concentration was also measured on 5, 10, and 20 μm filters. Comparison of extracted Chl a concentration with those obtained from High Performance Liquid Chromatography (HPLC) analysis showed an excellent agreement (r2 = 0.98, p< 0.0001). Based on the good agreement between <200 μm extracted Chl a and unfiltered HPLC Chl a we conclude that the pre-filtering step through 200 μm did not result in any notable loss of phytoplankton cells. HPLC data were obtained from the NASA data repository SeaBASS (Behrenfeld et al., 2019).
FlowCam Analysis largely followed the methods outlined above. Due to generally low abundance of cells within a size range appropriate for the instrument, 2 L volumes were concentrated approximately 3-fold, by gently pouring seawater into a tall 5 μm mesh strainer. Concentration factors were specified before analysis to be taken into account in the software retrieval of cell concentrations. Sample volumes processed varied from 3 to 5 ml and, depending on concentration and size of the target species, were analyzed using either 50 or 100 μm flow cells and corresponding magnifications of 20× and 10×, specifying a minimum FlowCam size filter of 3 and 6 μm (Area Based Diameter), respectively.
Data Analysis
Abundance per species and instrument was averaged across triplicate measurements (where available) to calculate standard deviations and determine instrument specific coefficients of variation (CV = standard deviation/mean, %). Due to the high density of two of the laboratory cultures, the FlowCam analyses performed in trigger-mode resulted in high Particles per used Image and high frame-rates. When this is the case, the instrument functions as if in auto-image mode, and particle concentration can be manually calculated applying the algorithm used in auto-image mode, an approach that has been tested to yield accurate estimates (Fluid Imaging, pers. comm.). Particle concentrations were thus calculated by dividing the counts obtained after removal of unwanted particles (see above) by the volume imaged, the latter retrieved from the software generated run summary.
For microscopy measurements, which provided separate length and width measurements, cell volume was determined using appropriate geometric formulae (e.g., Sun and Liu, 2003). Here we compare plankton mean size based on instrument estimates of ESD. We recognize that estimation of the ESD varies with instrument type, e.g., the Coulter Counter estimates an equivalent volume based on the impedance of the sensing field. Comparison of the type of ESD estimate was not subject to further analysis, since the estimation of ESD was not subject to user selection.
To estimate total particle abundance, the CC requires selection of an operator-defined range of particle sizes, which affects estimates of particle abundance and size distribution. To examine the effect of operator-choice and possible bias, and to develop operator-independent means to estimate the size distribution, we compared particle abundance and mean cell size estimated from a subset of the CC measurements. The comparison was made by determining the mode of the particle size frequency distribution and choosing a series of percentile ranges about the mode that varied from including 20% to 80% of the distribution. Abundance and size estimates derived from these specified percentile ranges were compared to user-selected ranges based on visual inspection of the frequency distribution of counts across particle sizes. The latter is the procedure necessary when using the CC provided software to analyze data. Cell abundance was then calculated as the sum of particles within the included range. Cell size and standard deviation thereof was calculated as the weighted mean across the included range of discrete size bins of 0.2 μm.
Results and Discussion
Abundance
There was generally good agreement (within 2-fold differences) in the abundance measurements generated with the different instrument types, despite the vastly different measurement approaches (Figure 1, left panels). There was no difference in abundance by the two types of CC and counts were similar to those generated by the BD Influx. FlowCam counts tended to be comparable but lower than the other instruments, especially for Prorocentrum concavum. Microscope counts for the three focal species were inconsistent relative to the other methods, including higher, comparable, and lower estimates than the other instruments delivered. It is noteworthy that the use of exponentially growing phytoplankton cultures represents a best case scenario, in which the occurrence of non-target particles is minimized, but co-occurrence of detrital material, precipitate, and other non-biological and biologically derived particulates, which can be species dependent (see below), can lead to contamination of the sample. Thus, even in laboratory cultures there will be some non-target species that will elevate the counts of passive assessments that do not distinguish living cells from other particles. However, such contaminants will be much reduced compared to whole water samples.
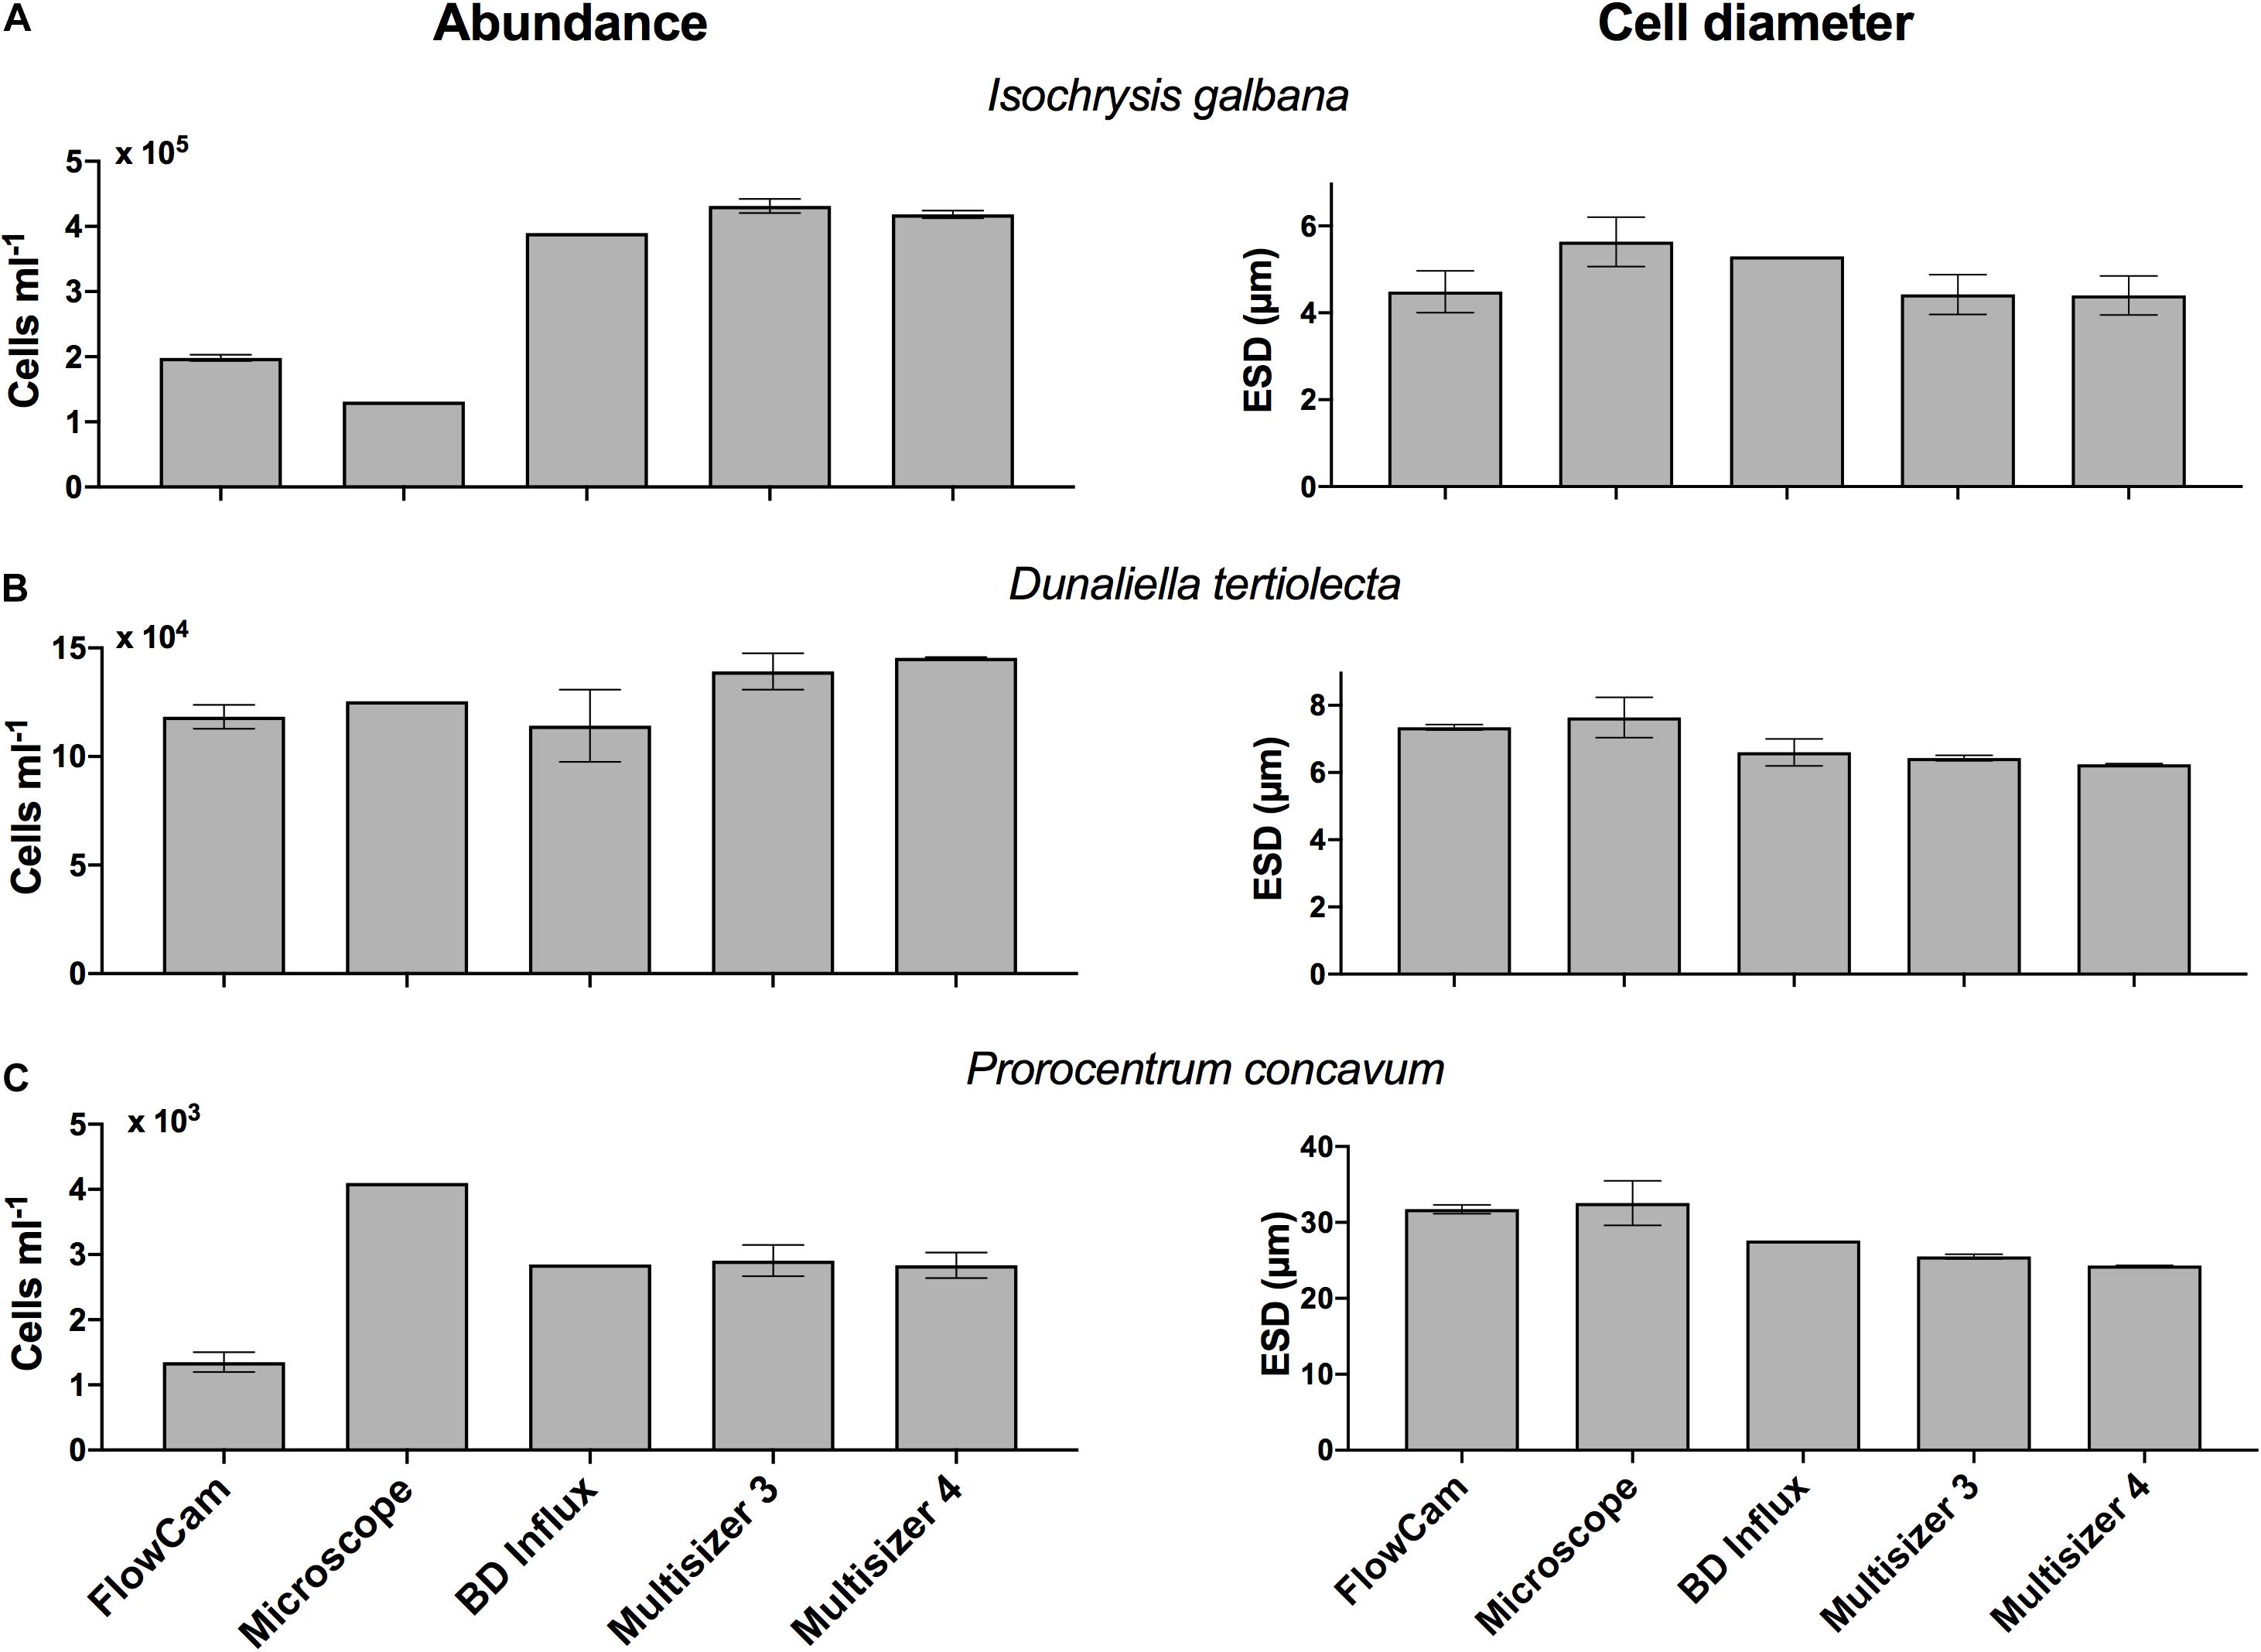
Figure 1. Abundance (cells ml–1, left panels) and cell diameter (ESD, right panels) measured with the FlowCam, Micrscocope, BD Influx, Coulter MultiSizer III and IV, for (top row, A) Isochrysis galbana, (middle row, B) Dunaliella tertiolecta, and (bottom row, C) Prorocentrum concavum. Error bars indicate one standard deviation of the mean.
For all instruments and particle concentrations of up to 20,000 particles ml–1 the variation in count estimates across replicates averaged <10% and did not vary systematically with concentration or instrument. Thus we do not see an instrument specific bias in the precision. Counts in excess of 400,000 cells ml–1 had a lower CV (1–3%). Variation among triplicate abundance counts on the same instrument was <10% for species whose abundance ranged from 102 to 105 cells (or particles for CC) ml–1 (Figure 2, top panel). Replication of microscope counts was not possible due to the restricted time frame of analysis, but replication is of course highly desirable and should be performed if at all possible. To get a sense of variation of microscope counts we estimated among field of view variation for I. galbana and D. tertiolecta, which were 7 and 11%, respectively, and prior examination of among replicate variability for microscope counts in our lab yields about 10% variation. This variation is modest and comparable to all other instrument count variation. One exception was H. triquetra analyzed with the CC (data not shown), which had highly variable replicate abundance measurements and a CV of 37%. The CC has previously been shown to deliver poor abundance estimates of H. triquetra (Kim and Menden-Deuer, 2013), but the reason remains unknown. The BD Influx counts were comparable to the particle counters (Figure 1, left panels). The flow cytometer was the only instrument used to count Synechococcus sp. Although counts could have been obtained on the microscope, the other instruments could not acquire measurements for this pico-cyanobacterium due to non-compatible size ranges measured (see below).
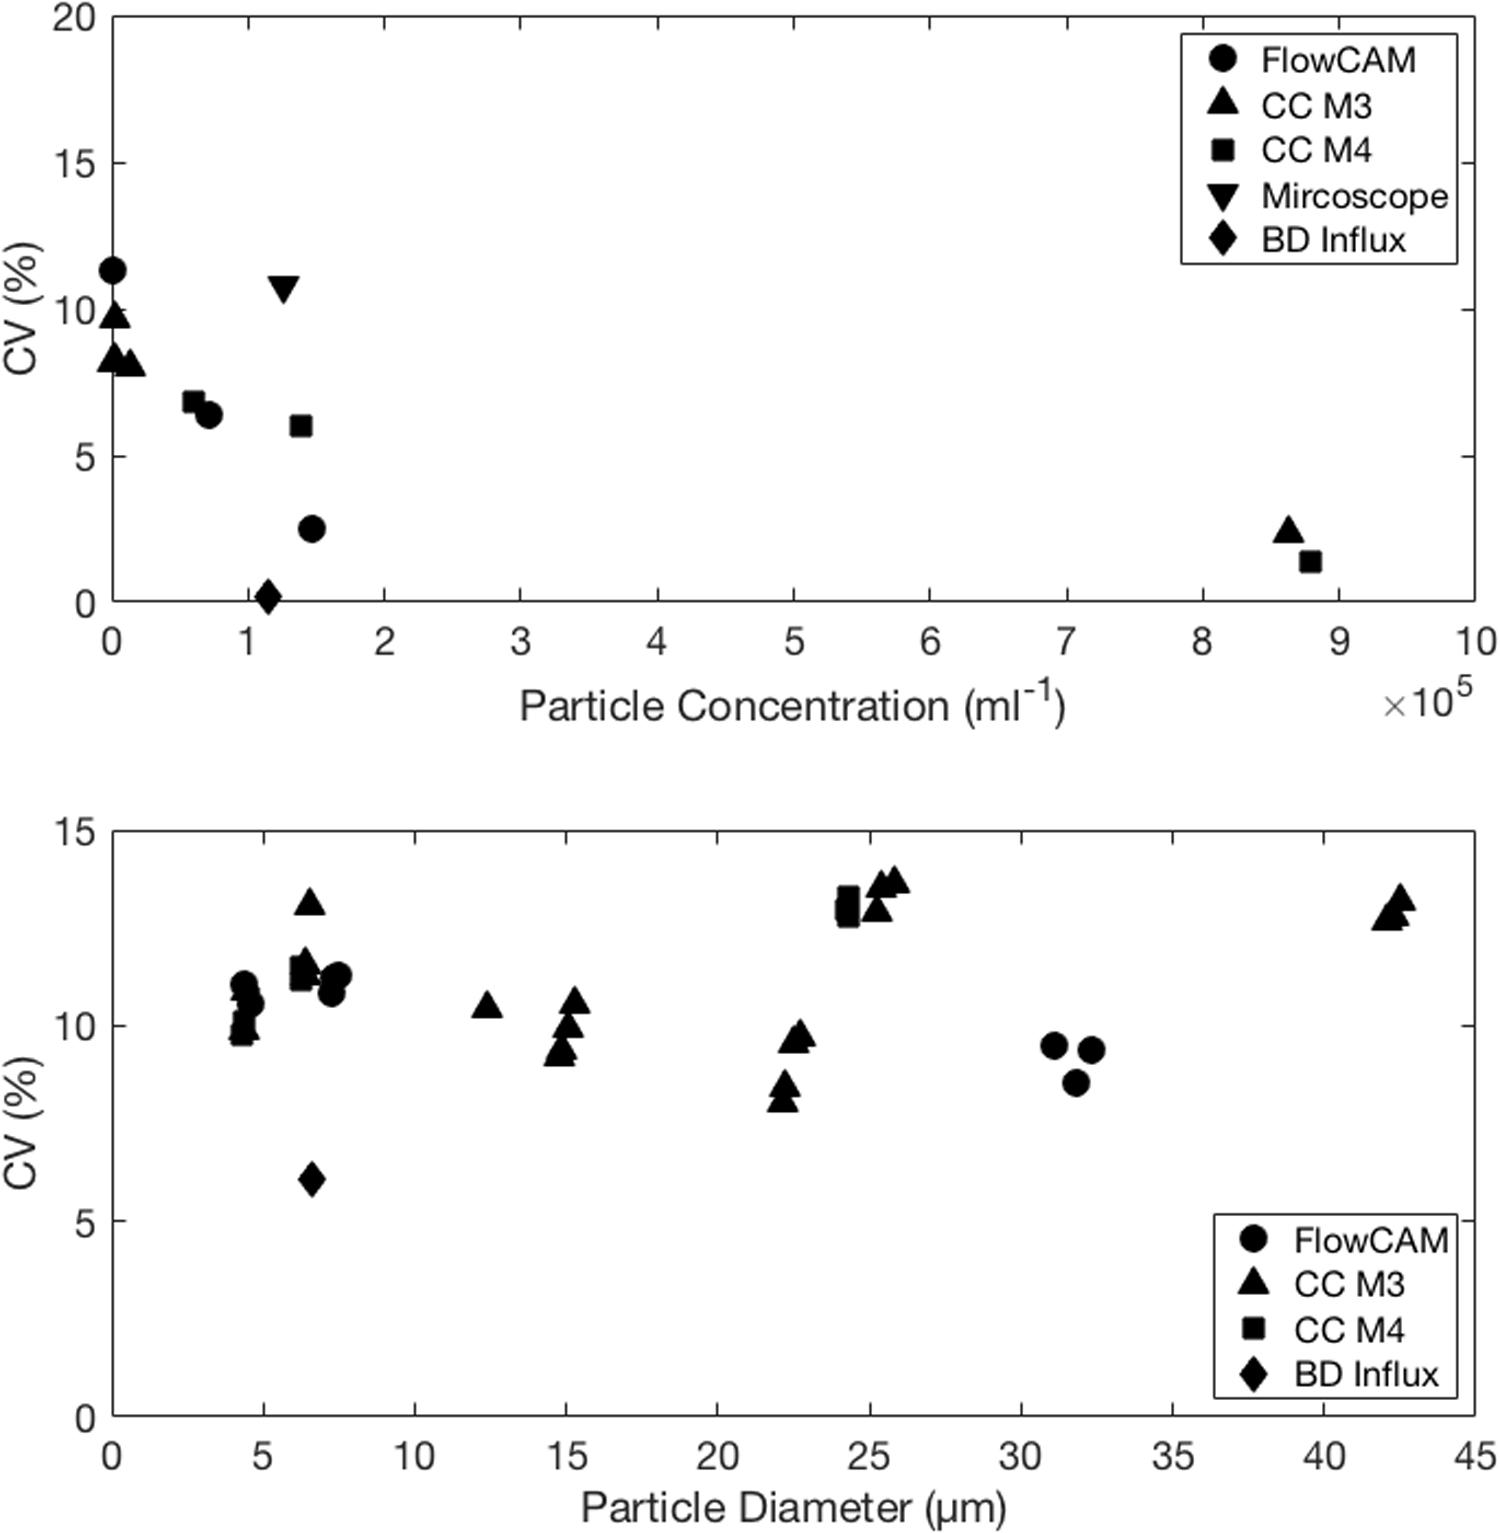
Figure 2. Consistent coefficient of varition (CV, %) among (top) concentration and (bottom) particle size measurements for phytoplankton ranging from <5 to >40 μm in diameter measured with five different instruments. Coefficient of variation did not exceed 10 and 15%, respectively, of the abundance or size measurement and was independent of instrument and particle size. Particle counts in excess of 400,000 ml–1 did have a lower CV but are measured at the risk of high conincident particle passages.
Abundance estimates for I. galbana where lower for both microscopy and FlowCam compared to all other instruments (Figure 1). We suspect that the passive particle counters may be including non-target species events in the total count, but we did not evaluate the contribution of non-cells to the total count with FlowCam or microscopy. Counts for D. tertiolecta were consistent across instrument types, which may be due to the suitability of this particular size of organism across instruments (Figure 1).
Counts for FlowCam were lower than the other methods for P. concavum. The FlowCam data presented were subjected to post-acquisition analyses that included removal of particles, including biologically derived particles that did not represent the target species. Moreover, P. concavum culture contained empty thecae (Figure 3) that were not included in the abundance estimates. In contrast, counts from the particle counters undoubtedly included non-target species particles, including empty thecae, which would elevate the particle counter abundance results. However, the number of empty thecae and other particles that were removed through post-acquisition modifications was 200 particles ml–1, and therefore this analysis step alone would be insufficient to close the gap between the FlowCam and particle counter counts. The reason for the difference is unknown. P. concavum microscopy counts exceeded estimates from all other instruments. The reason why microscopy counts for this species exceeded estimates from all other instruments is unknown but was verified, and counts did not include empty thecae. It suggests that even expert usage of the different instruments can yield substantial differences in abundance estimates and makes establishment of a superior method difficult. Instead, we suggest balancing the method taken with trade-offs of time, accuracy and if possible, to gather multi-instrument measurements (Table 2). Additionally, in order to ensure proper capture of particles in fluorescence-trigger mode, it is important that when a size filter is applied, it is chosen to be broad enough to span the variability of the cells analyzed. A broad, if any, filter avoids scenarios where particles falling outside filter specifications trigger the camera, but are not be included in the counts. It may also be necessary to lower the specified fluorescence threshold. Cells with low pigment concentration and fluorescing at values below the threshold will not trigger the camera, which may result in underestimates of cell abundance. For motile species, samples need to be processed rapidly, ideally including the entire volume of sample inserted in the instrument or applying a continuous mixing of the sample in the intake funnel, unless the sample can be preserved before analysis. Preservation, however, may induce biases both in the cell size and in the types of species preserved (e.g., Menden-Deuer et al., 2001). Overall, given the typically high variability of abundance estimates of plankton, the abundance measurements agreed well across instruments, and positive identification of the target species afforded by microscopy and image based FlowCam analyses may be a useful addition to the analysis.
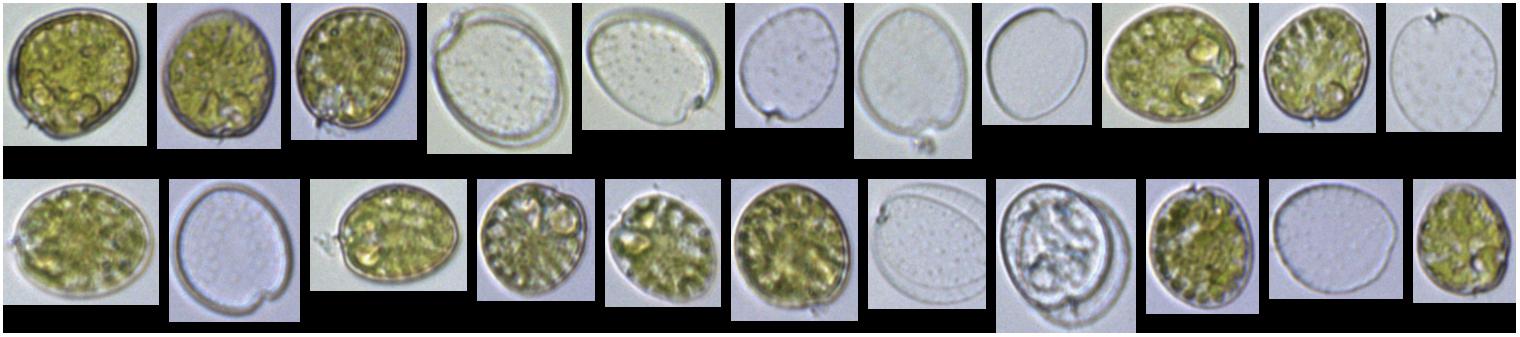
Figure 3. FlowCam collage of P. concavum, which illustrates that even an exponentially growing laboratory culture contains both live cells and accumulated, empty thecae.
Cell Size
There was generally good agreement in the size measurements generated with the four different instrument types, with the image-based approaches delivering the largest ESD estimates (Figure 1, right panels). In case of D. tertiolecta, the ESD for the FlowCam was 1 μm larger than for the particle counters and the FlowCam estimate for P. concavum was 6 μm greater than ESD estimates from the particle counters; a difference of 12–20% in ESD delivered by different instruments. The larger ESD estimates from the FlowCam, which agreed with the microscope except for I. galbana, suggest that an image-based approach that allows processing of images and measurements based on only in focus cells delivers a substantially higher estimate of mean cell size and thus volume. ESD estimates from the BD Influx were in close agreement with the size estimates obtained by the particle counters, despite the limitation of our size estimate approach with the BD Influx, which imposed a linear assumption on the FSC size relationship. Remarkably, measurement variation of ESD, expressed as the coefficient of variation (CV, %), did not show any instrument or size specific bias (Figure 2, bottom panel). This suggests that across the size spectrum from 3 to 45 μm ESD measured here, the instruments delivered, similarly, variable results and that precision was independent of the instrument used. While count data uncertainties were based on triplicate count values, the sample sizes for ESD measurements were vastly greater because ESD variation could be estimated across thousands of cells within a sample. Thus, the ESD variation represents the intrinsic variability in the sizes within the population and the measurement variation represents the achievable technical limit.
Cell-Size and Abundance Estimation
For mono-specific laboratory cultures there appears to be no standard, published, operator-independent analysis to determine mean cell size and total abundance. Standard CC software for example requires users to select the particle size range to include for abundance and size measurements. User bias in selecting a particular size range may alter estimates. To examine the magnitude of that potential bias and quantify the effect of analysis parameters on abundance and size measurement, we subjected the PSD of the mono-specific laboratory cultures measured with the Coulter Counter MultiSizer III to a sensitivity analysis. For all phytoplankton species, particle size distribution was analyzed for abundance and size using either a user defined (“picked”) size range, two a priori chosen size ranges that encompass the mode, as well as four user independent percentile ranges that include increasing fractions of the distribution from 20 to 80% around the mode. None of the species size abundance distributions conformed to normality. For all species (with the exception of the smallest species measured with the CC, I. galbana) a similar picture emerges: Abundance estimates based on user selected size ranges were indistinguishable from one another (Figure 4, left panels). This suggests that even relatively large differences (e.g., 3–5 μm) in the PSD cut-offs do not alter the ultimate concentration estimate. The deviation of I. galbana from the general result is likely due to the fact that small particulates accumulate in the culture medium and were not distinguished from the cells themselves. This is also evident in the difference in FlowCam and microscopy counts relative to the particle counters.
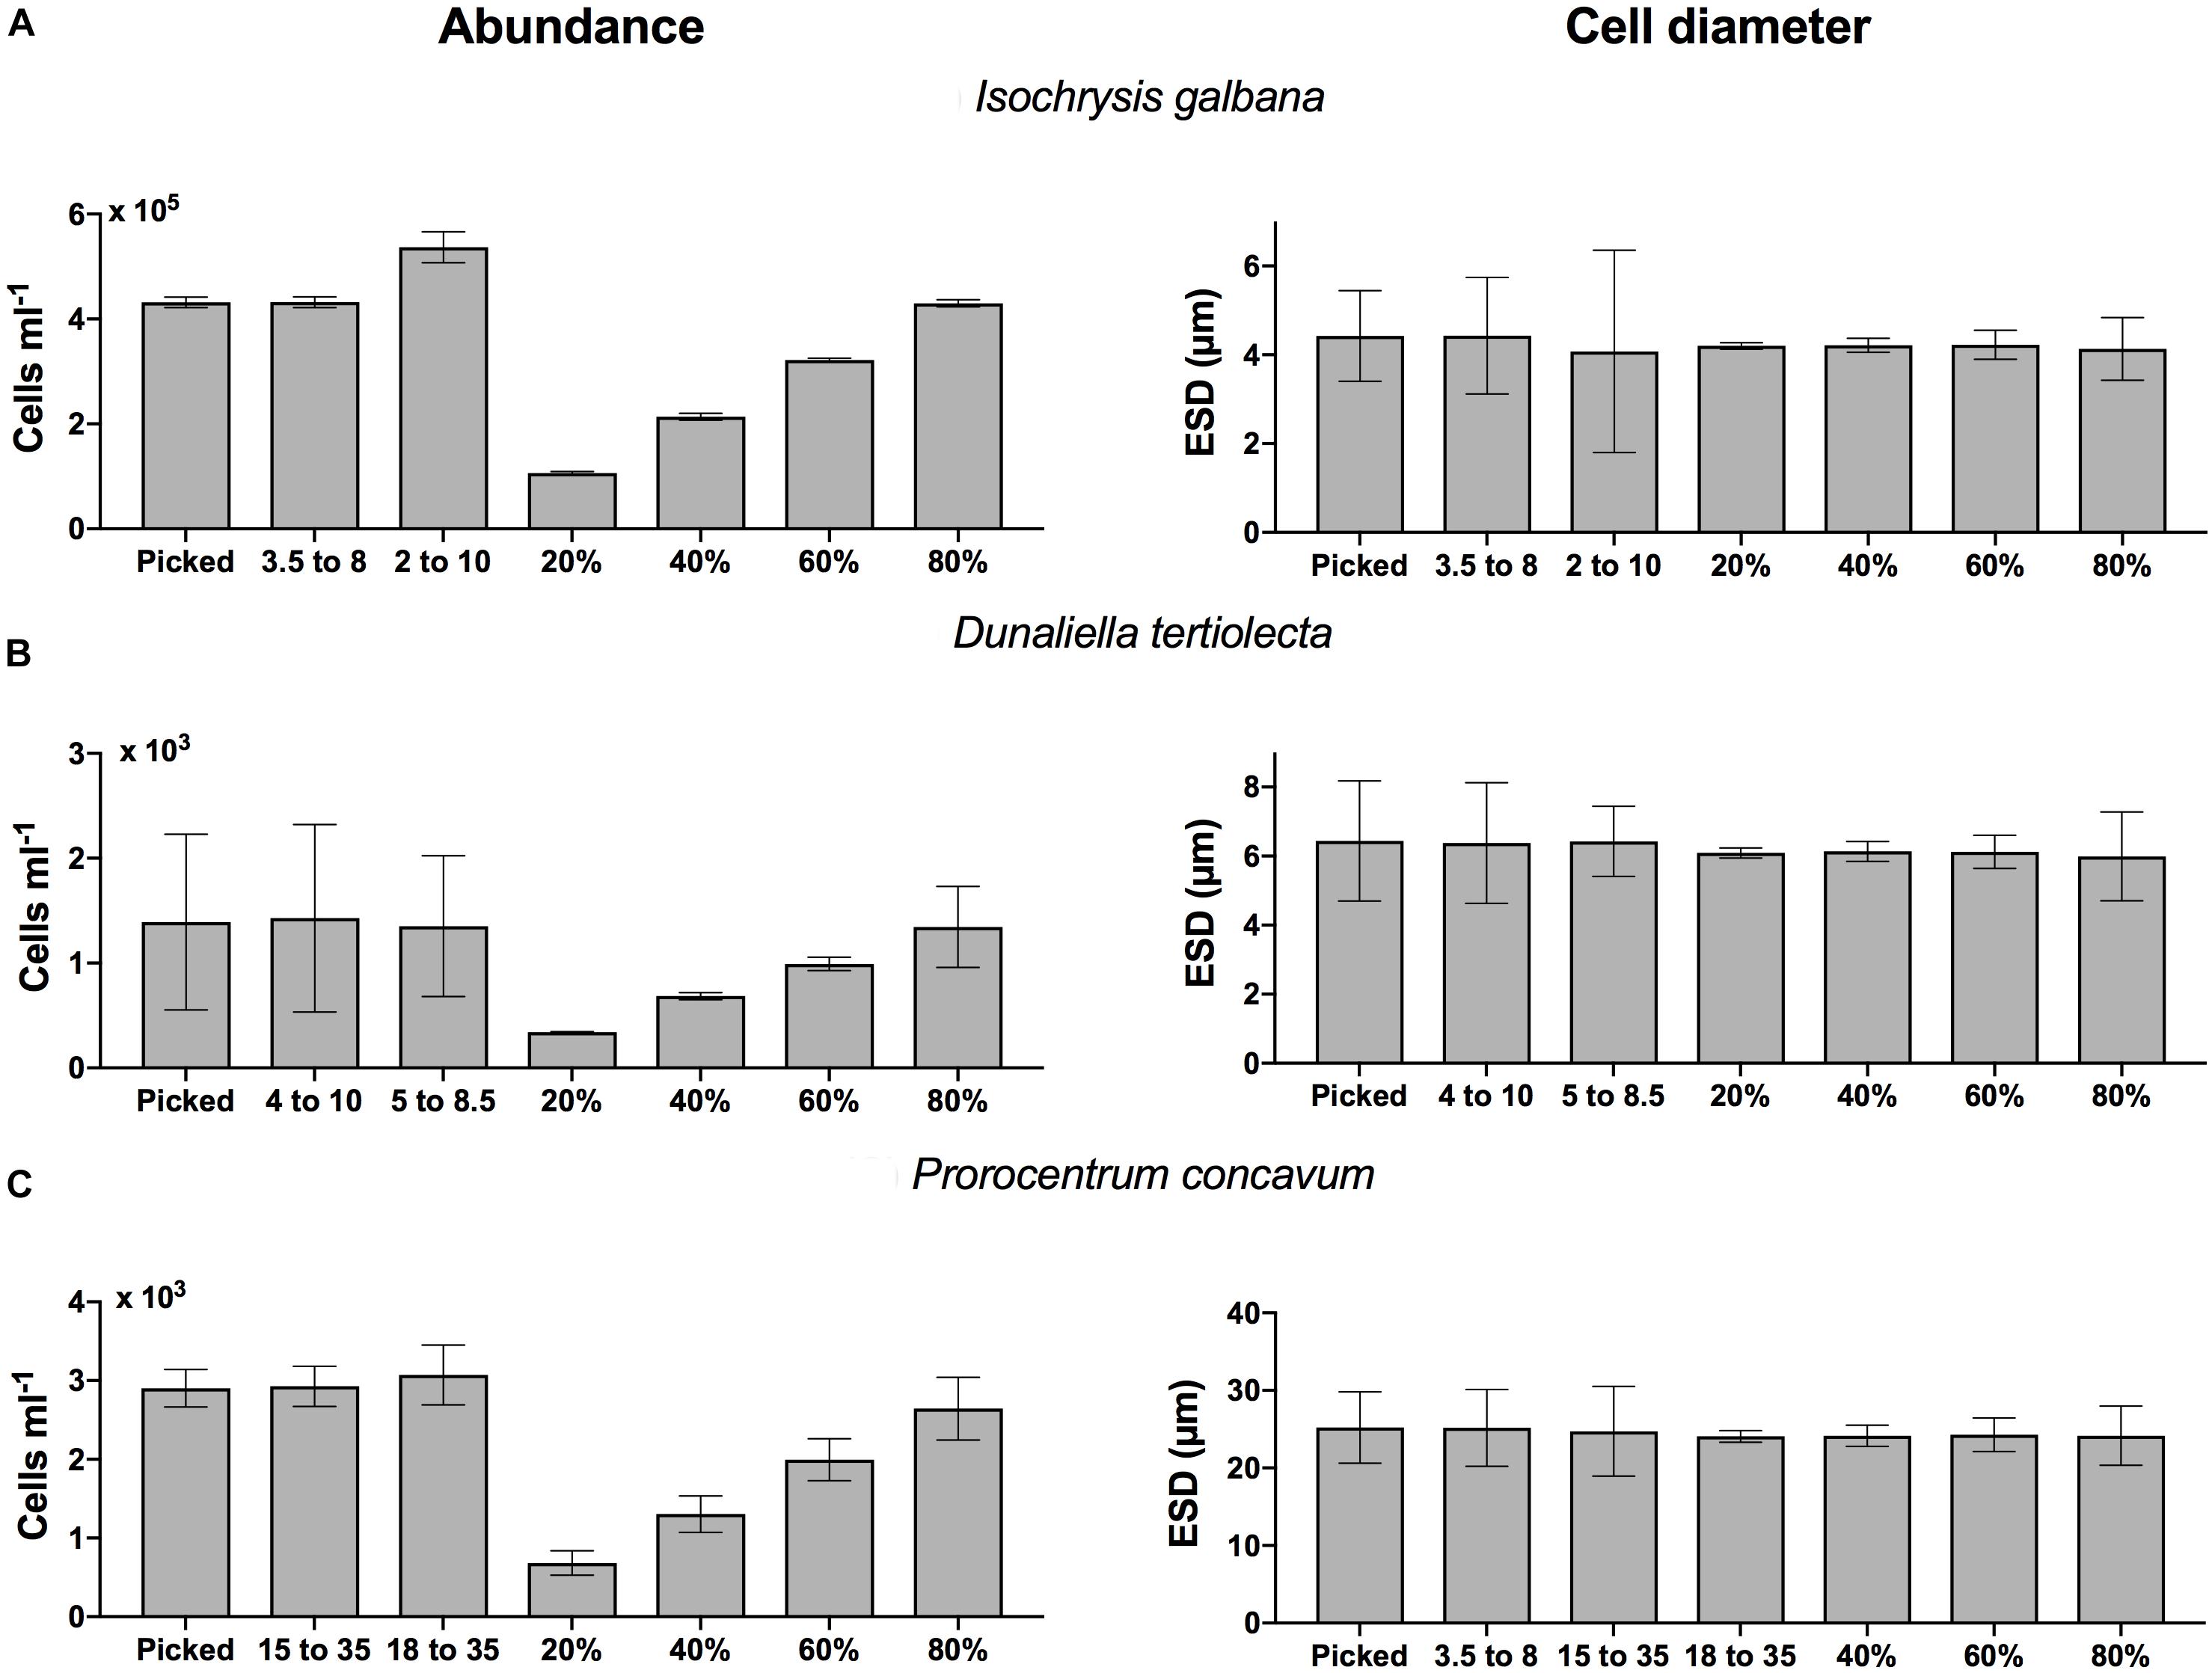
Figure 4. (A–C) Abundance estimates (left panels) and size estimates (right panels) for the three focal phytoplankton species, (top A) Isochrysis galbana, (middle B) Dunaliella tertiolecta, and (bottom C) Prorocentrum concavum, from an electronic particle analyzer (Coulter Counter), based on inclusion of different distribution ranges of the total particle size distributions, as indicated on the x-axis. “Picked” indicates a range as would be operator chosen using the CC software. Units are in μm size range or fractions of the percentile ranges.
The passively selected percentile ranges delivered increasing abundances with increasing percentile ranges considered, with the 80% range delivering the best estimate on total abundance compared to the user selected ranges. One exception to the ideal 80% range was A. sanguinea, which had the largest size range and the lowest blank counts among the species selected (not shown). Thus, nearly the entire signal resulted from cells of this species and excluding 20% of the counts lead to an undercount for that species only; using a passively selected range of the distribution may introduce bias in undercounting larger microplankton.
Mean size estimates based on user selected size ranges were indistinguishable from one another, suggesting that even large differences (e.g., 3–5 μm) in the size cut-offs do not alter the ultimate mean size estimate (Figure 4, right panels). This is likely because the averages were calculated as weighted averages and thus the most frequent observations dominate the results. This result persisted, irrespective if the weighted mean was based on an arithmetic or geometric mean estimation. Moreover, even considerable changes in size distribution range selection by users had no effect on the ultimate estimate. The central fraction (20%) can deliver a similar estimate of mean size, if an entirely user independent approach is desired.
Overall, to achieve a user-independent, reproducible approach to select the particle size distribution to estimate mean cell size and total abundance, the central 20% fraction delivers the best estimate of the mean ESD and the 80% range of the distribution provides the best estimate of the total abundance of cells.
Whole Plankton Community Analysis
We conducted an examination of whole community plankton composition in the <200 μm size range from samples collected during the May 2016 cruise of the NAAMES campaign (Behrenfeld et al., 2019; Morison et al., 2019; Saliba et al., 2019). Particle counts, size-fractionated Chl a, and an image-based approach resolved the dominant species, thus spatial shifts in plankton community composition and particle size distribution could rapidly be identified. The relative duration of data acquisition for the three methods were completed within minutes for the particle counter, 1–2 h for the imaging system, and within 12 h for the Chl a extraction. All three approaches clearly identified communities dominated by small particles (<10 μm). Instrument-specific estimates differ in measurement units, with Chl a extraction delivering a proxy for biomass, whereas the particle counters provide an approximation of particle abundance without positively identifying cells, that can then be converted to biomass, using assumptions of C density, for example. The relative contribution of Chl a < 10 μm (72% at S3 and 91% at S4) and the size distributions of this same size fraction measured by the particle counter (95% at S3 and 99% at S4) were similar (Figure 5). Discrepancy between Chl a size fractions and particle sizes is likely due to smaller particles to be captured on larger pore-sized filters when concentrations are high, or large volumes are filtered and differences in size estimations for the two methods. FlowCam’s lower size limit in our application was 5–6 μm and thus FlowCam did not capture the quantitative contribution of small cells to total abundance. This gap in estimation of the whole particle size spectrum of whole plankton communities would be filled by flow cytometric methods that can deliver excellent, group specific estimation of cell size, fluorescence and scattering properties and abundance, particularly for pico- and nanophytoplankton (Cetinic et al., 2015).
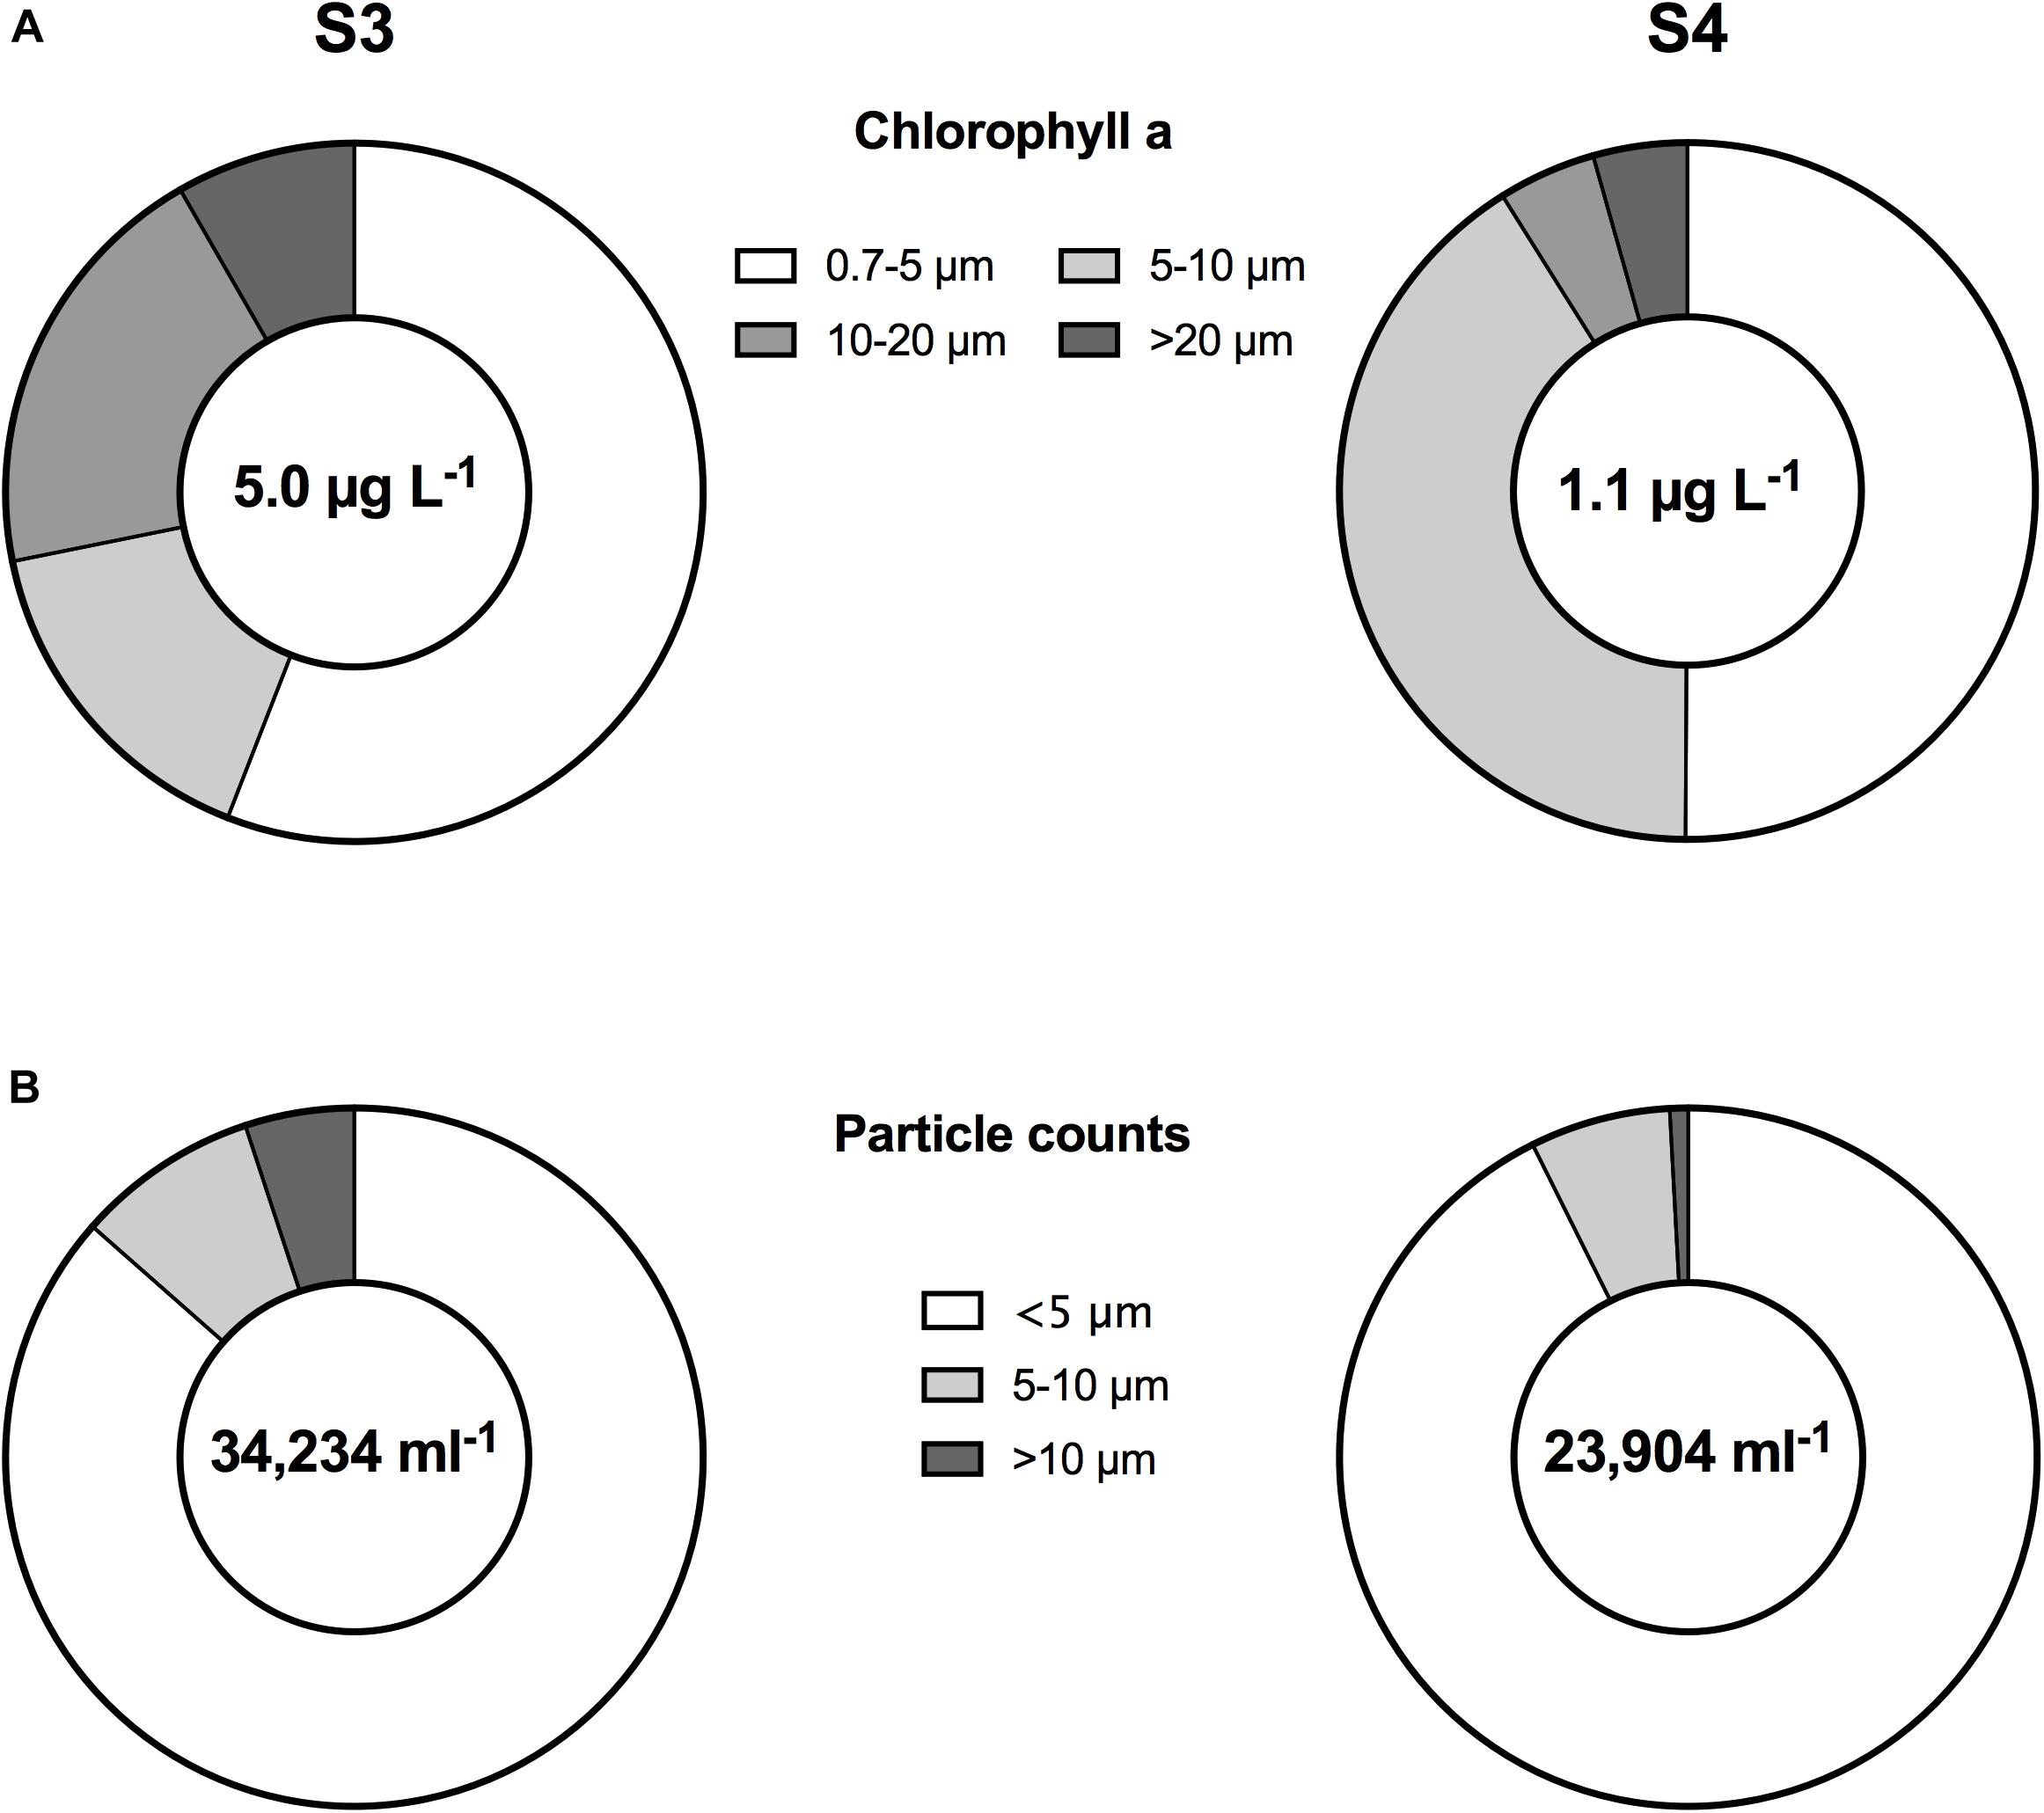
Figure 5. Community structure from size-fractionated Chl a concentration (top, A) and particle counter (bottom, B) at two stations (S3 and S4) in the North Atlantic during May 2016. The dominance of small (<10 μm) particles is revealed, as are shifts in the relative contribution of different size classes. Total Chl a and particle concentration at each station is shown at the center of the pie charts.
Each of the three coupled size/abundance measurements of the whole plankton community provided information that, in combination, created a detailed view of the phytoplankton community. Size fractionated Chl a provided broad characterization of phytoplankton biomass distribution in four size classes. The CC generated a higher resolution distribution of particle abundance and ESD from 2 to 63 μm sized particles. However, the CC distribution is not specific to phytoplankton. While the particles captured by the FlowCam fall within a limited range of the entire size spectrum, imaging of single cells provides a valuable layer of taxonomic information in combination with cell size. By shedding light on the identity of species, particle imaging can expand information gained from molecular analyses of species diversity, where taxonomic resolution is often limited to the class level (e.g., Bolaños et al., 2020). This is exemplified at S3 (Figure 6), where images show that both coccolithophores and the colonial species Corymbellus aureus likely contributed to the molecularly detected Prymnesiophyceae (Bolaños et al., 2020).
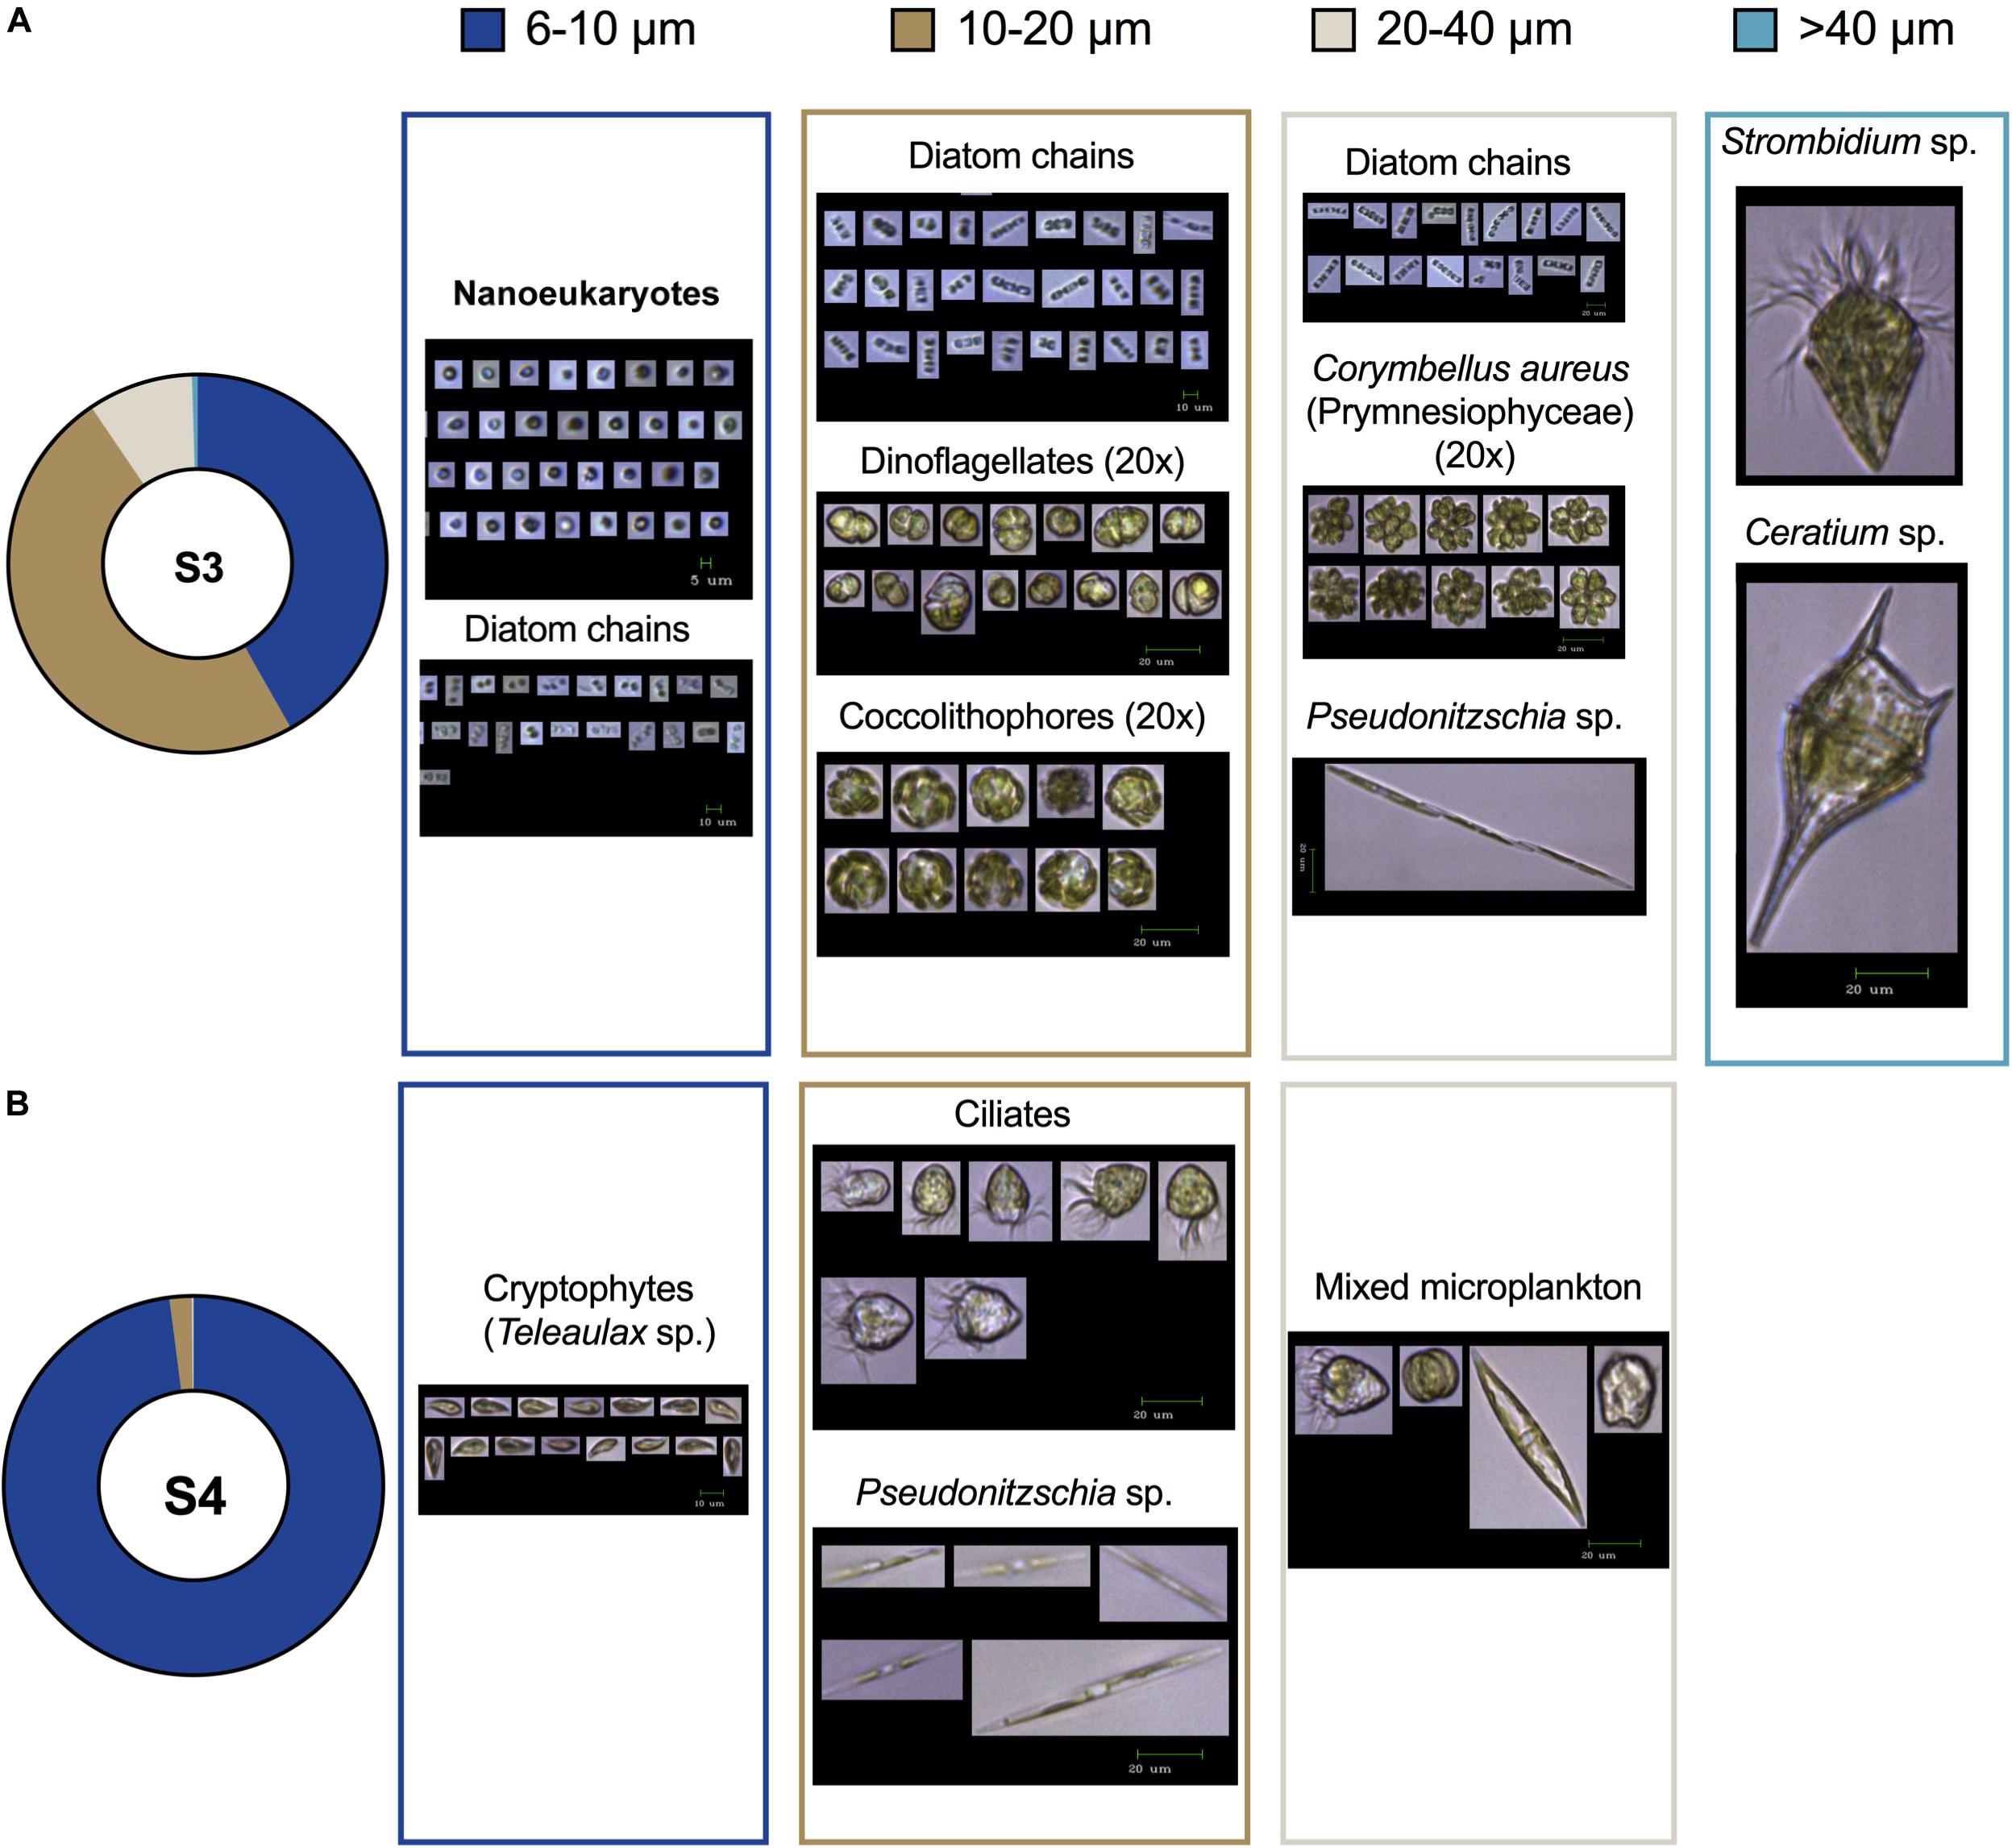
Figure 6. Plankton size composition (left donuts) and image collages showing species composition of >6 μm plankton at Station 3 (A, top) and Station 4 (B, bottom) of the NAAMES May 2016 North Atlantic campaign, corresponding to the particle and size-fractionated Chl a concentrations shown in Figure 5. Within size-class morphological diversity is easily captured with this image based approach. Note different scale bars of 10 and 20 μm are shown for each group of images.
Particles imaged by FlowCam cover the ecologically important size range of microplankton, that despite low numerical abundance often contribute a substantial fraction of total biomass and are important components of marine microbial food webs (Steinberg and Landry, 2017) production and export processes (Siegel et al., 2016) and whose identity is tied to ecosystem states (e.g., Margalef, 1978). FlowCam derived assessment of the species composition reveals that a diverse set of species contributed to the microplankton community composition (Figure 6). Further advantages of the image-based approach are revealed in the within-size-class information that clearly distinguishes pigmented nanoeukaryotes and Cryptophytes in the 6–10 μm size range or shifts in the abundance of dinoflagellates or the species of diatoms, all within the 20–40 μm size range (Figure 6). The combination of Chl a, CC, and FlowCam measurements provides a three-tiered resolution of whole phytoplankton communities. With the coarsest resolution (i.e., Chl a) measurement delivering information and bulk metrics useful for biogeochemical processes, the finer scale assessments (CC and FlowCam) provide critical details for understanding and mapping shifts in community structure.
Conclusion and Recommendations
The instruments included here provide excellent opportunities for the rapid quantification of mono-specific laboratory cultures and characterization of whole plankton communities at sea in terms of particle sizes, abundance and relative contributions of size fractions. Image-based approaches deliver higher quality data on individual particles, as images show particle characteristics that allow elimination of non-living and detrital material and identify species- and cell-cycle specific properties (e.g., parasite infection, Peacock et al., 2014). For field applications, size structure and abundance are revealed through rapid, operator independent methods while image-based approaches provide key information on within-size class morphological diversity that can have ramifications for ecological processes, including food web structure and production. Moreover, image-based estimates were conservative, avoiding false positives, but relative to the particle counter estimates, are far more labor intensive and require greater operator skill and expertise than particle counting techniques. We anticipate that machine learning techniques will advance automated image analysis and reduction in manual classification in coming years (Zheng et al., 2017; González et al., 2019). Image-based classification will also be a fruitful tool to discover non-biogenic particles, including pervasive microplastics (Law, 2017).
Particle counters have the distinct advantage in that they can enumerate large volumes, to reveal the presence and frequency of larger particles. Although particle abundance decreases exponentially with size, ecological and ecosystem importance does not. Large particles may contribute a relatively larger component of the total biomass, where a large diatom (e.g., Coscinodiscus sp.) can hold equivalent biomass of one million picoplankton cells, for example. The strengths and weaknesses of the different measurement approaches are quantified here, which provides users with diverse instrumentation for specific applications. The fundamental challenge of diminishing abundance of particles with increasing size will always require a trade-off between the particle size range accurately represented and the number of particles captured. As measurement variability inversely scales with particle abundance (i.e., sample size), measurement confidence diminishes with increasing particle size for any one instrument. The precision of measurements was remarkably consistent for all instruments, across the entirety of the cell sizes, from pico to microplankton, and concentrations measured here. Larger, rarer particles require either instruments that process larger sampling volumes or concentration of sample volumes during which smaller particles are lost.
Operator independent analyses approaches for plankton characterization and quantification are highly desirable and can enhance reproducibility of results and will be necessary as autonomous and in situ instrumentation is tasked with these types of analyses. Having established the reliability of a common suite of particle counters relative to more labor-intensive approaches opens possibilities for their in situ application, including in conjunction with other instrumentation, such as gliders and floats. Species identities and their abundances can provide near real time information on coherent water masses (e.g., Smetacek et al., 2002; Marrec et al., 2018) transitions in functional groups, or other metrics that would enable a synoptic sampling plan. Such adaptive strategies are essential to enhance spatio-temporal resolution of particle and plankton composition analyses to adequately characterize the importance of environmental and biological heterogeneity that can persist to the meter scale or less. This type of information also aids in post-cruise efforts of optimizing sample analysis. As discussed in a recent review (Lombard et al., 2019) the challenge remains to parse together the strength (i.e., size range covered) of different instruments to provide a holistic and continuous assessment of whole plankton communities. This assessment will need to include often non-pigmented, heterotrophic forms as well as identification of the trophic mode of mixotrophic species. Based on the evidence delivered here, in situ application of large volume particle counters supplemented with image-based approaches can illuminate the relative contribution of pico- to microplankton to overall particle abundance and derived processes. While far from a holistic assessment, the pico- to microplankton size range covers much of the ecologically relevant drivers of marine production processes and thus provides an important near-term goal.
Data Availability Statement
The datasets generated for this study can be found in the SeaBASS at https://seabass.gsfc.nasa.gov/archive/URI/menden-deuer/NAAMES/naames_2/archive.
Author Contributions
SM-D designed this study and conducted the data analysis. SM-D, FM, AM, GF, JS, ER, HM, and PM contributed to the laboratory measurements and data analysis. SM-D and FM conducted the whole plankton community analysis at sea. SM-D wrote the manuscript with input and approval from all co-authors.
Funding
This research was supported by the National Atmospheric and Space Administration, through funding of the field campaigns addressing EXport Processes in the global Ocean from RemoTe Sensing (EXPORTS, grant 80NSSC17K0716 to SM-D and Tatiana Rynearson) and the North Atlantic Aerosol and Marine Ecosystems Study (NAAMES, grant NNX15AL2G to SM-D) and in part through the National Science Foundation under EPSCoR Research Infrastructure Improvement Award OIA-1655221.
Conflict of Interest
The authors declare that the research was conducted in the absence of any commercial or financial relationships that could be construed as a potential conflict of interest.
Acknowledgments
This work was motivated by prior discussions with the Particle Size discussion group within the NASA EXPORTS Campaign. Harry Nelson of FluidImaging Technologies kindly provided advise on the FlowCam analysis. SM-D appreciates discussion with Melissa Omand (URI).
Footnotes
References
Behrenfeld, M. J., Moore, R. H., Hostetler, C. A., Graff, J. R., Gaube, P., Chen, S. C., et al. (2019). The North Atlantic aerosol and marine ecosystem study (NAAMES): science motive and mission overview. Front. Mar. Sci. 6:122. doi: 10.3389/fmars.2019.00122
Bolaños, L. M., Karp-Boss, L., Choi, C. J., Worden, A. Z., Graff, J. R., Haëntjens, N., et al. (2020). Small phytoplankton dominate western North Atlantic biomass. ISME J. doi: 10.1038/s41396-020-0636-0 [Epub of ahead print].
Canesi, K. L., and Rynearson, T. A. (2016). Temporal variation of Skeletonema community composition from a long-term time series in Narragansett Bay identified using high-throughput DNA sequencing. Mar. Ecol. Prog. Ser. 556, 1–16. doi: 10.3354/meps11843
Cetinic, I., Perry, M. J., Asaro, E. D., Briggs, N., Poulton, M. E., Sieracki, C., et al. (2015). A simple optical index shows spatial and temporal heterogeneity in phytoplankton community composition during the 2008 North Atlantic bloom experiment. Biogeosciences 12, 2179–2194. doi: 10.5194/bg-12-2179-2015
Culverhouse, P., Williams, R., Reguera, B., Herry, V., and González-Gil, S. (2003). Do experts make mistakes? A comparison of human and machine identification of dinoflagellates. Mar. Ecol. Prog. Series 247, 17–25. doi: 10.3354/meps247017
Durham, W. M., and Stocker, R. (2011). Thin phytoplankton layers: characteristics, mechanisms, and consequences. Annu. Rev. Mar. Sci. 4, 177–207. doi: 10.1146/annurev-marine-120710-100957
González, P., Castaño, A., Peacock, E. E., Díez, J., Del Coz, J. J., and Sosik, H. M. (2019). Automatic plankton quantification using deep features. J. Plankton Res. 41, 449–463. doi: 10.1093/plankt/fbz023
Graff, J. R., and Rynearson, T. A. (2011). Extraction method influences the recovery of phytoplankton pigments from natural assemblages. Limnol. Oceanogr. Methods 9, 129–139. doi: 10.4319/lom.2011.9.129
Guillard, R. R. L. (1975). “Culture of phytoplankton for feeding marine invertebrates,” in Culture of Marine Invertebrate Animals, eds W. L. Smith and M. H. Chanley (Boston, MA: Springer).
Jacquet, S., Partensky, F., Lennon, J.-F., and Vaulot, D. (2001). Diel patterns of growth and division in marine picoplankton in culture. J. Phycol. 37, 357–369.
Jespersen, A. M., and Christoffersen, K. (1987). Measurements of chlorophyll-a from phytoplankton using ethanol as extraction solvent. Arch. Hydrobiol. 109, 445–454.
Kim, H., and Menden-Deuer, S. (2013). Reliability of rapid, semi-automated assessment of plankton abundance, biomass, and growth rate estimates: coulter counter versus light microscope measurements. Limnol. Oceanogr. Methods 11, 382–393. doi: 10.4319/lom.2013.11.382
Kostadinov, T. S., Siegel, D. A., and Maritorena, S. (2009). Retrieval of the particle size distribution from satellite ocean color observations. J. Geophys. Res. Oceans 114:C09015.
Law, K. L. (2017). Plastics in the marine environment. Annu. Rev. Mar. Sci. 9, 205–229. doi: 10.1146/annurev-marine-010816-060409
Levy, M., Jahn, O., Dutkiewicz, S., Follows, M. J., and d’Ovidio, F. (2015). The dynamical landscape of marine phytoplankton diversity. J. R. Soc. Interface 12:20150481. doi: 10.1098/rsif.2015.0481
Lombard, F., Boss, E., Waite, A. M., Vogt, M., Uitz, J., Stemmann, L., et al. (2019). Globally consistent quantitative observations of planktonic ecosystems. Front. Mar. Sci. 6:196. doi: 10.3389/fmars.2019.00196
Luo, J. Y., Irisson, J.-O., Graham, B., Guigand, C., Sarafraz, A., Mader, C., et al. (2018). Automated plankton image analysis using convolutional neural networks. Limnol. Oceanogr. Methods 16, 814–827. doi: 10.1002/lom3.10285
Maranon, E. (2015). Cell size as a key determinant of phytoplankton metabolism and community structure. Annu. Rev. Mar. Sci. 7, 241–264. doi: 10.1146/annurev-marine-010814-015955
Margalef, R. (1978). Life-forms of phytoplankton as survival alternatives in an unstable environment. Oceanol. Acta 1, 493–509.
Marrec, P., Grégori, G., Doglioli, A. M., Dugenne, M., Della Penna, A., Bhairy, N., et al. (2018). Coupling physics and biogeochemistry thanks to high-resolution observations of the phytoplankton community structure in the northwestern Mediterranean Sea. Biogeosciences 15, 1579–1606. doi: 10.5194/bg-15-1579-2018
Menden-Deuer, S., and Fredrickson, K. (2010). Structure-dependent, protistan grazing and its implication for the formation, maintenance and decline of plankton patches. Mar. Ecol. Prog. Ser. 420, 57–71. doi: 10.3354/meps08855
Menden-Deuer, S., Lessard, E. J., and Satterberg, J. (2001). Effect of preservation on dinoflagellate and diatom cell volume and consequences for carbon biomass predictions. Mar. Ecol. Prog. Ser. 222, 41–50. doi: 10.3354/meps222041
Morison, F., Harvey, E., Franzè, G., and Menden-Deuer, S. (2019). Storm-induced predator-prey decoupling promotes springtime accumulation of North Atlantic phytoplankton. Front. Mar. Sci. 6:608. doi: 10.3389/fmars.2019.00608
Mouw, C. B., and Yoder, J. A. (2010). Optical determination of phytoplankton size composition from global SeaWiFS imagery. J. Geophys. Res. Oceans 115:C12018.
Olson, R. J., and Sosik, H. M. (2007). A submersible imaging-in-flow instrument to analyze nano-and microplankton: Imaging FlowCytobot. Limnol. Oceanogr. Methods 5, 195–203. doi: 10.4319/lom.2007.5.195
Peacock, E. E., Olson, R. J., and Sosik, H. M. (2014). Parasitic infection of the diatom Guinardia delicatula, a recurrent and ecologically important phenomenon on the New England Shelf. Mar. Ecol. Prog. Ser. 503, 1–10. doi: 10.3354/meps10784
Reynolds, R. A., Stramski, D., Wright, V. M., and Woźniak, S. B. (2010). Measurements and characterization of particle size distributions in coastal waters. J. Geophys. Res. Oceans 115:C08024.
Saliba, G., Chen, C.-L., Lewis, S., Russell, L. M., Rivellini, L.-H., Lee, A. K. Y., et al. (2019). Factors driving the seasonal and hourly variability of sea-spray aerosol number in the North Atlantic. Proc. Natl. Acad. Sci. U.S.A. 116:20309. doi: 10.1073/pnas.1907574116
Shalapyonok, A., Olson, R. J., and Shalapyonok, L. S. (2001). Arabian sea phytoplankton during southwest and northeast Monsoons 1995: composition, size structure and biomass from individual cell properties measured by flow cytometry. Deep Sea Res. II Top. Stud. Oceanogr. 48, 1231–1261. doi: 10.1016/s0967-0645(00)00137-5
Siegel, D. A., Buesseler, K. O., Behrenfeld, M. J., Benitez-Nelson, C. R., Boss, E., Brzezinski, M. A., et al. (2016). Prediction of the export and fate of global ocean net primary production: the EXPORTS science plan. Front. Mar. Sci. 3:22. doi: 10.3389/fmars.2016.00022
Sieracki, C., Sieracki, M. E., and Yentsch, C. (1998). An imaging-in-flow system for automated analysis of marine microplankton. Mar. Ecol. Prog. Ser. 168, 285–296. doi: 10.3354/meps168285
Sieracki, M. E., and Poulton, N. (2011). Phytoplankton_Carbon-NAB08. Woods Hole, MA: BCO-DMO Office. Available online at: http://osprey.bcodmo.org/project.cfm?flag=view&id=102&sortby=project
Smetacek, V., Klaas, C., Menden-Deuer, S., and Rynearson, T. A. (2002). Mesoscale distribution of dominant diatom species relative to the hydrographical field along the Antarctic Polar Front. Deep Sea Res. II Top. Stud. Oceanogr. 49, 3835–3848. doi: 10.1016/s0967-0645(02)00113-3
Sosik, H. M., and Olson, R. J. (2007). Automated taxonomic classification of phytoplankton sampled with imaging-in-flow cytometry. Limnol. Oceanogr. Methods 5, 204–216. doi: 10.4319/lom.2007.5.204
Steinberg, D. K., and Landry, M. R. (2017). Zooplankton and the ocean carbon cycle. Annu. Rev. Mar. Sci. 9, 413–444. doi: 10.1146/annurev-marine-010814-015924
Stemmann, L., and Boss, E. (2011). Plankton and particle size and packaging: from determining optical properties to driving the biological pump. Annu. Rev. Mar. Sci. 4, 263–290. doi: 10.1146/annurev-marine-120710-100853
Sun, J., and Liu, D. (2003). Geometric models for calculating cell biovolume and surface area for phytoplankton. J. Plankton Res. 25, 1331–1346. doi: 10.1093/plankt/fbg096
Thyssen, M., Alvain, S., Lefèbvre, A., Dessailly, D., Rijkeboer, M., Guiselin, N., et al. (2015). High-resolution analysis of a North Sea phytoplankton community structure based on in situ flow cytometry observations and potential implication for remote sensing. Biogeosciences 12, 4051–4066. doi: 10.5194/bg-12-4051-2015
Keywords: plankton, marine particles, particle counter, BD Influx, FlowCam, microscope, NAAMES, EXPORTS
Citation: Menden-Deuer S, Morison F, Montalbano AL, Franzè G, Strock J, Rubin E, McNair H, Mouw C and Marrec P (2020) Multi-Instrument Assessment of Phytoplankton Abundance and Cell Sizes in Mono-Specific Laboratory Cultures and Whole Plankton Community Composition in the North Atlantic. Front. Mar. Sci. 7:254. doi: 10.3389/fmars.2020.00254
Received: 26 September 2019; Accepted: 30 March 2020;
Published: 24 April 2020.
Edited by:
Malcolm McFarland, Florida Atlantic University, United StatesReviewed by:
Nicole J. Poulton, Bigelow Laboratory for Ocean Sciences, United StatesAbdiel E. Laureano-Rosario, Florida Atlantic University, United States
Copyright © 2020 Menden-Deuer, Morison, Montalbano, Franzè, Strock, Rubin, McNair, Mouw and Marrec. This is an open-access article distributed under the terms of the Creative Commons Attribution License (CC BY). The use, distribution or reproduction in other forums is permitted, provided the original author(s) and the copyright owner(s) are credited and that the original publication in this journal is cited, in accordance with accepted academic practice. No use, distribution or reproduction is permitted which does not comply with these terms.
*Correspondence: Susanne Menden-Deuer, c21lbmRlbkB1cmkuZWR1
†Present address: Gayantonia Franzè, Institute of Marine Research, Flødevigen, Norway