 Olivia M. Cheriton
 Curt D. Storlazzi
 Kurt J. Rosenberger
- Pacific Coastal and Marine Science Center, U.S. Geological Survey, Santa Cruz, CA, United States
The character and energetics of infragravity (“IG,” 25 s < period < 250 s) and very-low frequency (“VLF,” period > 250 s) waves over coral reef flats can enhance shoreline erosion or accretion, and also govern extreme shoreline events such as runup, overwash, and flooding on coral reef-lined coasts. Here we use in situ wave measurements collected along cross-reef transects at 7 sites on Pacific islands with varying reef geomorphologies to examine under what conditions IG waves occur and what factors enhance their irregularity. In general, a greater fraction of total wave energy was transferred to the IG band on reefs with steeper fore reef slopes and shallower reef flats. The IG wave amplitudes scaled with increasing water levels, but it was primarily at lower water levels when these waves became pitched onshore (negatively asymmetrical) and peaked (positively skewed). However, our results also highlight the importance of reef-flat width and slope as important morphological controls on IG waves, as the most asymmetric, bore-like, IG waves occurred on the wider reef flats, and the most skewed IG waves at the site with the steepest reef-flat. On the wider reef flats, IG wave-wave capture was observed during periods of large offshore wave forcing and enhanced VLF wave energy. Because similar IG wave motions over plane beaches enhance sea-swell (“SS,” period < 25 s) bore-merging in the surf zone, we posit that VLF waves over reef flats may facilitate IG bore merging, and this may lead to larger, more pitched-onshore bores at the shoreline. In addition, greater IG wave heights appear to support the transmission of larger secondary short-period waves over the reef flat, independent of overall water levels. As irregular IG waves may be strong drivers of cross-reef sediment transport as well as runup, understanding the conditions and reef geomorphologies that lead to low-frequency, energetic bores on reef flats is critical to forecasting how coral reef-lined coasts will respond to sea-level rise and climate change.
Introduction
The quality and degree of irregularity in surface gravity waves are considered important factors in sediment transport in shallow coastal environments. A purely symmetrical wave produces symmetric underlying water velocities, such that the positive phase onshore flow is balanced by the negative phase offshore flow and the net transport by the wave is effectively zero. Conversely, non-linear or irregular waves have corresponding asymmetric velocities and accelerations that can lead to a non-zero net transport. But predicting this transport under irregular surface waves is not straightforward, not only because of the non-linear interactions between the different types of fluid motions (e.g., orbital motions, currents, and small-scale turbulence), but also phase-lag effects with bed shear stress, sediment entrainment and settling rates, which all vary with sediment types and seafloor morphology. For example, finer sediment may have opposing net transport to coarser sediment simply owing to the varying time each grain size spends in suspension (i.e., different settling velocities).
The degree of irregularity in surface waves is often evaluated by quantifying the skewness (peaked-ness) and asymmetry (forward or backward pitch) of the waves. As incident, short-period waves approach a shoreline, the shoaling seafloor causes the waves to become peaked (skewed) and pitched forward (asymmetric). Skewed waves have strong onshore velocities associated with the crest and weaker offshore velocities under the troughs. Enhanced bed shear stresses from the strong onshore velocities mobilize sediment from the bed, and the velocity imbalance creates a net transport of the suspended material, that can be either onshore (e.g., Hoefel and Elgar, 2003; Silva et al., 2011) or offshore (Ruessink et al., 2009), depending on the sediment type and background flow. Waves that have no skewness, but are asymmetric are thought to have relatively negligible net transport because, although velocities increase faster (greater acceleration) during the positive phase, this is counteracted by the longer duration of the negative phase tail of the wave. However waves in shallow water typically exhibit both skewness and asymmetry. Skewed, asymmetric waves have been studied for plane beaches, using flume studies (Grasso et al., 2011), field observations (Elgar et al., 2001), and models (Ruessink et al., 2009). These studies found that, due to phase-lag effects, waves dominated by velocity skewness lead to offshore net transport, but with sufficiently large wave asymmetry, this effect diminishes and net transport can be onshore.
Research into irregular waves on coasts fronted by coral reefs is still a relatively emergent field of research. Findings from plane beach investigations are not necessarily transferable to fringing reef-lined coasts for several reasons. First, the bathymetric profiles of reef-lined coasts are starkly different from those of gently sloping beaches; the fore reef slopes tend to be steep, with an abrupt shift at the reef crest to shallow, gentle-sloping reef flat platforms and/or lagoons. Secondly, coral reefs can have much greater bed roughness, as well as greater variations in bed roughness across their profiles, varying between the extremes of relatively smooth “pavement” reefs with little coral coverage to rough regimes with high coral coverage or/and bedrock rugosity. As a result of the high heterogeneity in bathymetric slope and bed roughness, the propagation and transformation of waves from offshore to onshore across reefs differs from that of plane beaches. As offshore sea-swell (“SS,” periods T < 25 s) waves approach a reef-lined coast, a relatively steep fore reef leads to a shallow reef crest, where the waves break and the majority of the sea-swell wave energy is dissipated (Lowe et al., 2005). Through this breakpoint-forced momentum flux (Pomeroy A. et al., 2012) and non-linear wave-wave interactions (Nwogu and Demirbilek, 2010), the waves reform into a mixture of short- and long-period waves that propagate shoreward across the reef, typically leading to the characteristic biomodal wave spectrum over the reef flat (e.g., Lowe et al., 2005; van Dongeren et al., 2013). On certain reefs, these longer-period infragravity (25 s < T < 250 s) and very-low frequency (“VLF,” T > 250 s) waves dominate (Péquignet et al., 2009; Cheriton et al., 2016). In addition, the shallow reef platforms can engender both standing and resonant wave behavior (Péquignet et al., 2009; Nwogu and Demirbilek, 2010; Pomeroy A. W. M. et al., 2012; Gawehn et al., 2016; Buckley et al., 2018).
It is known that waves driven by extreme events such as storms (Stoddart, 1971; Bayliss-Smith, 1988; Scoffin, 1993; Etienne and Terry, 2012) and tsunamis (Kench et al., 2008) can either erode or accrete shorelines of coral reef-lined coasts, but the degree to which chronic exposure to skewed, asymmetrical waves drives sediment transport across reefs remains unclear. A flume study by Pomeroy et al. (2015) found that, compared to bedload and the mean Eulerian flow, IG wave skewness and asymmetry were the strongest drivers of cross-shore sediment transport over the simulated reef flat. Additional laboratory and modeling studies have investigated how different reef morphologies control the resulting IG wave motions and irregularity over reefs. The slope of the fore reef is now understood to be a primary control on infragravity wave generation over reefs, with the most energetic IG motions associated with slopes > 1/6 (Masselink et al., 2019). Although steeper fore reefs may generate larger IG waves, steeper fore-reef slopes may also act to reduce the asymmetry of the reef flat IG waves (Chen et al., 2019). Reef-flat bed roughness also has a small effect, whereby smoother beds lead to more asymmetrical waves, due to decreased dissipation from turbulence and bottom friction (Quiroga and Cheung, 2013; Chen et al., 2019). Interestingly, these factors – the fore-reef steepness and bed roughness – were found to have negligible effects on wave skewness (Chen et al., 2019).
Materials and Methods
Reef Locations
We collected wave observations from 7 cross-shore transects over fringing reefs on the islands of Kwajalein and Roi-Namur in the Republic of the Marshall Islands, as well as the U.S. Hawaiian Islands of Maui and Molokai (Table 1 and Figures 1A,D,G,J). Roi-Namur and Kwajalein are islands at the northern and southern portions of Kwajalein Atoll, located in the Equatorial Pacific. The transects were on the ocean-side perimeter of both islands, which are lined by a relatively horizontal reef flat that is often fully exposed at low tide. At the reef crest, the reef platform abruptly steepens to the fore reef that has higher morphological relief and greater coral coverage. The Lahaina and Ukumehame transects were on the western side of Maui, Hawaii, United States. These reefs have less steep fore reefs, and deeper reef flats, with variable relief. The final transect of Waiakane was on the southwestern coast of Molokai, Hawaii, United States. This site has a broad reef flat characterized by high-relief coral on the fore reef and outer reef flat, transitioning to relatively smooth, muddy substrate by the inner reef flat.
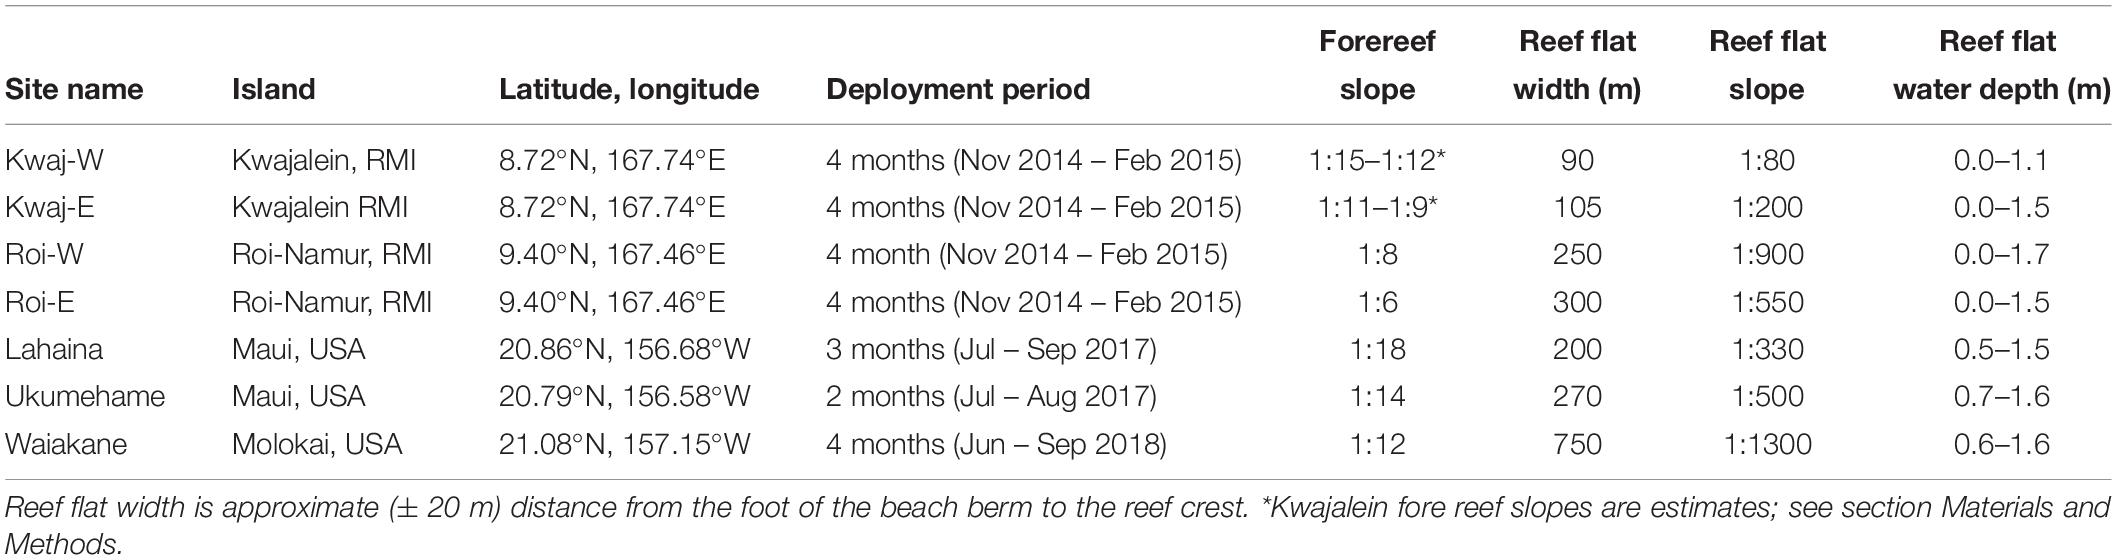
Table 1. List of our 7 study sites, providing locations, latitudes and longitudes, as well as reef characteristics.
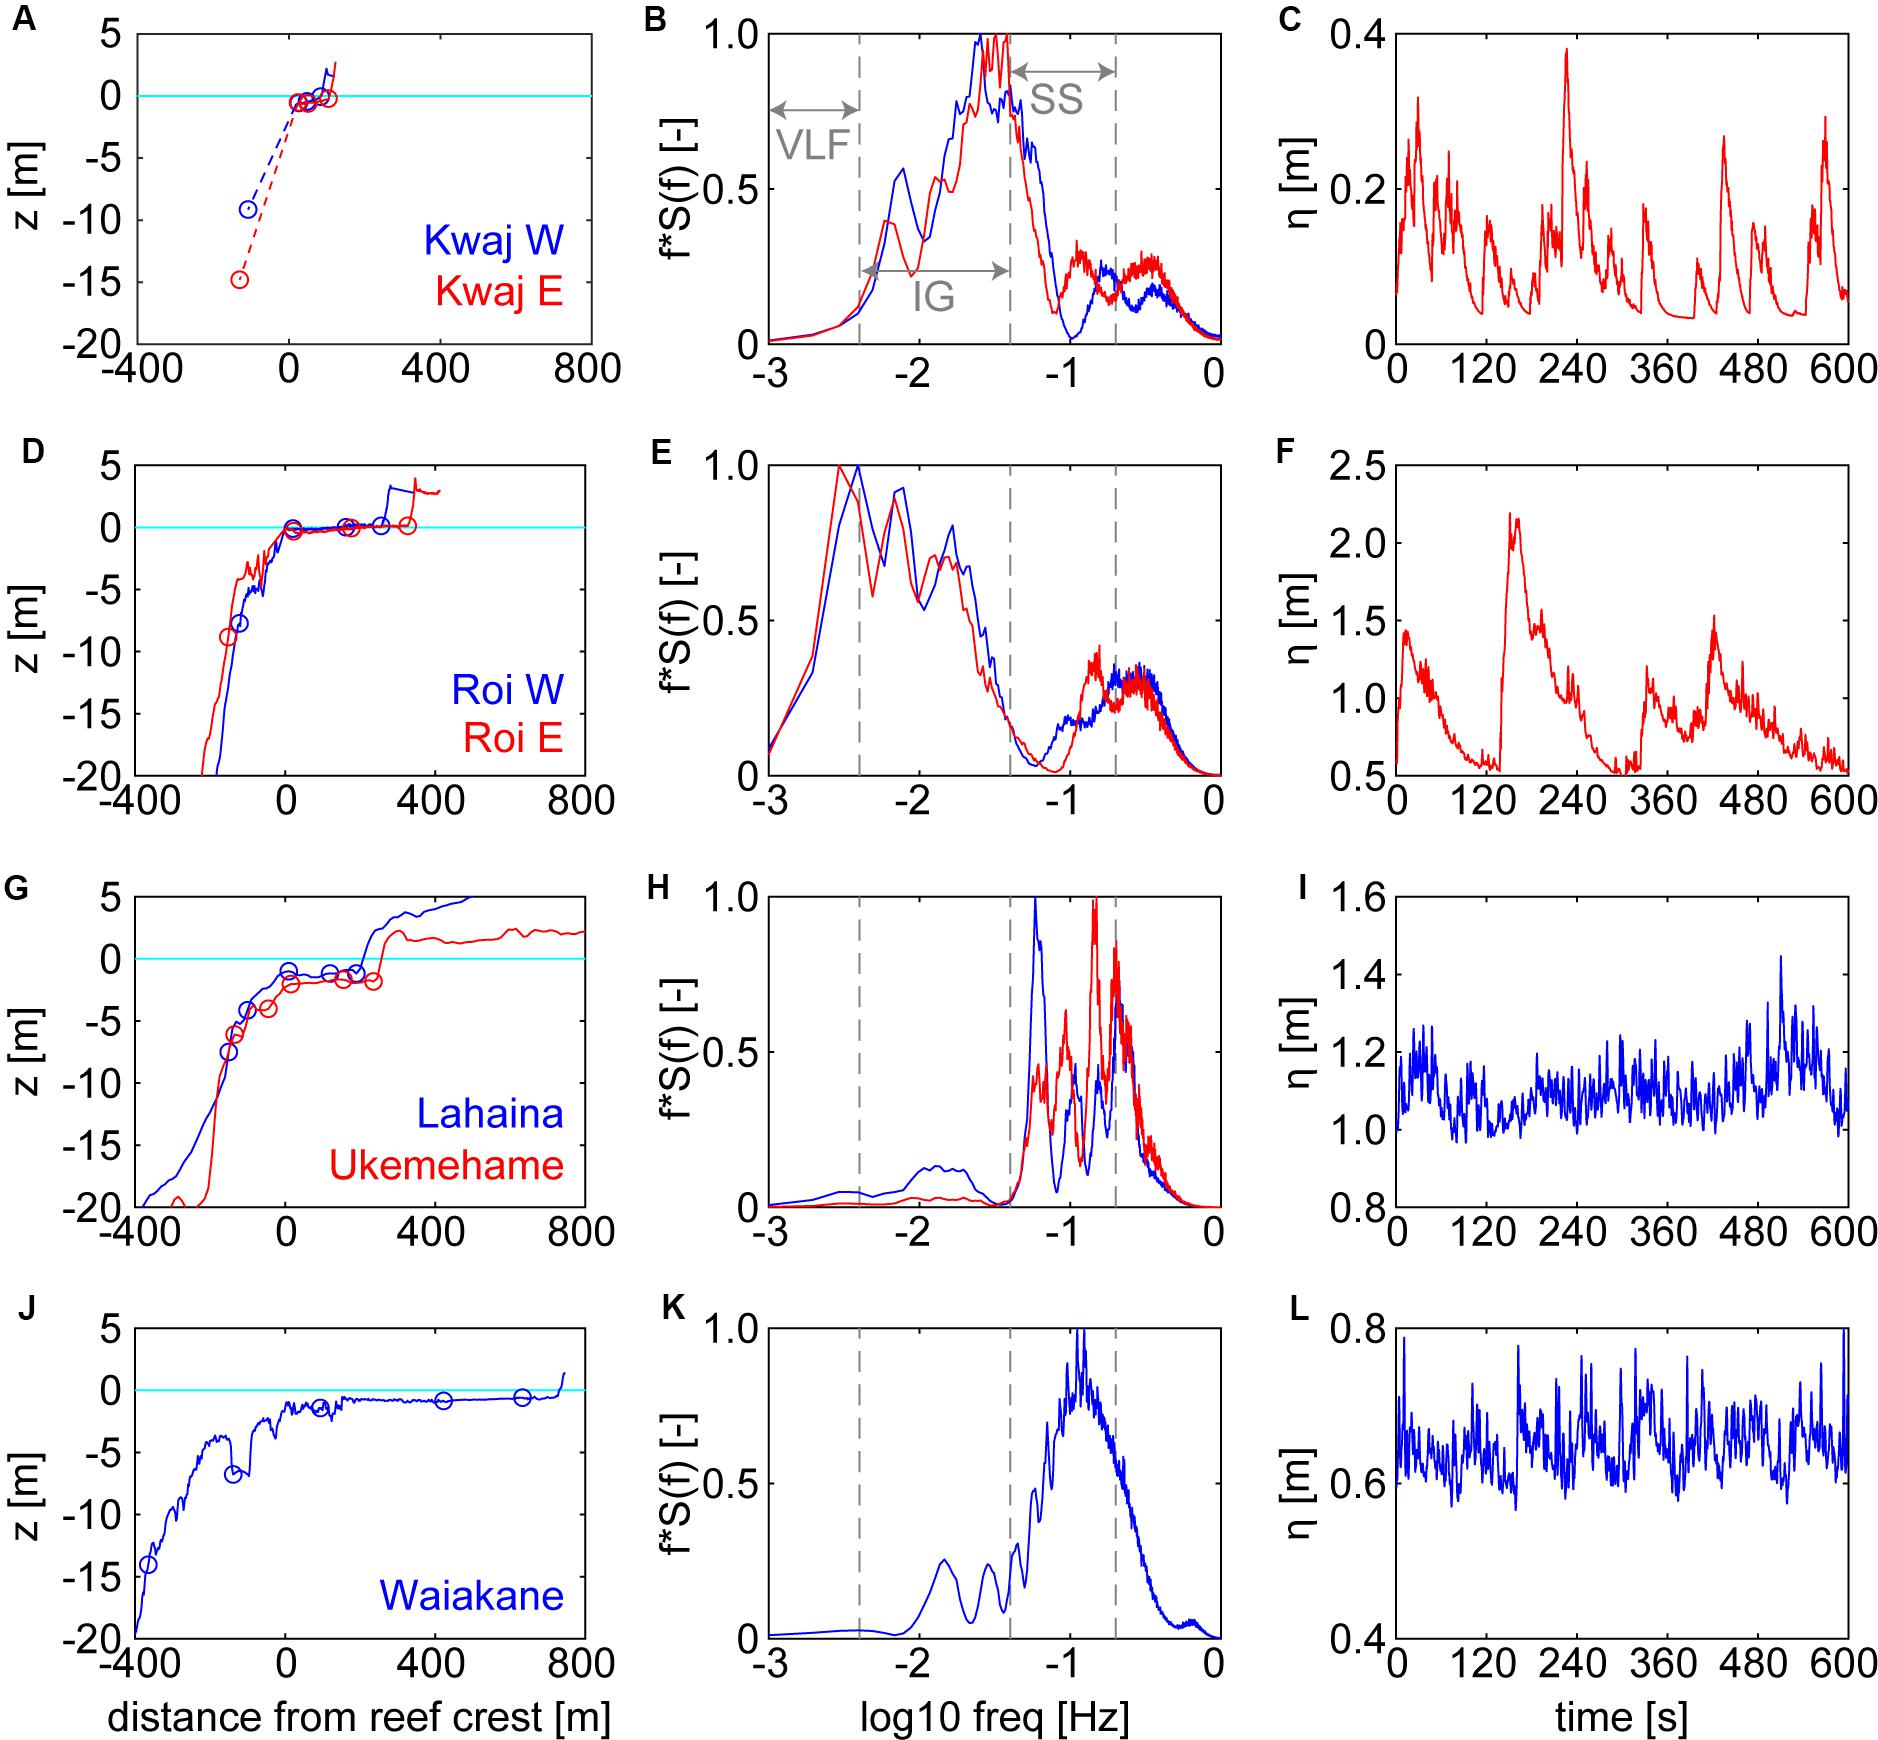
Figure 1. Varying reef geometries, and the subsequent wave energy partitioning and wave characteristics. (A,D,G,J) Reef bathymetric profiles and sensor locations (circles) with distance from the reef crest (positive is toward shore) and colors corresponding to sites. For Kwajalein reefs, the dashed line indicates region where no bathymetry was available. (B,E,H,K) Mean variance-preserved energy density spectra from the inner reef-flat sites, normalized by the maximum mean energy; colors correspond to sites in left-hand column. Gray vertical dashed lines indicate frequency bands of sea-swell (SS), infragravity (IG), and very-low frequency (VLF) waves. (C,F,I,L) examples of 600 s time series for water levels to show the types of irregular waves at each site; for rows that display two sites, only one example is shown for clarity, but it is representative of the wave character at the site not shown.
For all sites except Kwajalein, the fore-reef steepness was determined by the slope between the fore-reef seabed at 20 and 5 m depth. For Kwajalein, since we lack bathymetry for the fore reef, the fore-reef steepness was estimated from the slope of the fore-reef pressure sensor location to the reef crest, using two different reef crest depths: the depth of the outer reef-flat sensor (steeper slope) and the depth given by linear interpolation between the outer reef-flat and the fore-reef pressure sensors (less-steep slope). The resulting fore-reef slope ranges are in accordance with the divers’ visual observations of this site compared to the others. The reef-flat bed slope was determined using the distance and change in bed elevation between the outer and inner reef-flat sites.
Wave Measurements
Each shore-normal transect consisted of 4–5 RBR pressure gages (solo Dwave sensors for Kwajalein W and Roi-Namur W, and Virtuoso Dwave sensors for the other sites), with one or two placed on the fore reef, and three across the reef flat, from the outer reef flat just onshore of the reef crest to the shoreline (Table 1 and Figures 1A,D,G,J). At all sites except for Waiakane, pressure measurements were collected at 2 Hz over a 34 min burst (4,096 samples). At Waiakane, the sensors sampled continuously at 4 Hz; for processing, these records were partitioned into hourly segments (14,400 samples). At Roi-Namur E, the fore-reef pressure sensor was fouled for a portion of the deployment; for these missing data, we used the pressure bursts from a Nortek Acoustic Wave and Current (AWAC) profiler that was deeper on the fore reef at 20 m depth, and ∼670 m to the west off the Roi-Namur E transect line. The AWAC pressure was collected at 1 Hz over a 34 min burst (2,048 samples), but these bursts started 5 min after the RBR pressure gages.
The following method for calculating bulk wave statistics was applied across all pressure sensors. First, each pressure record was corrected for atmospheric pressure using hourly measurements obtained from nearby weather stations: the Kwajalein Bucholz Army Airfield weather station for the Kwajalein and Roi-Namur sites; the National Oceanic and Atmospheric Administration’s (NOAA) Kahului Harbor station (KLIH1)1 for the Lahaina and Ukumehame sites; and, for the Waiakane site, a weather station we installed near the Kaunakakai Harbor, approximately 13 km east of the study site. After subtracting the atmospheric pressure, the resultant sea pressure values were used to find the one-dimensional energy spectra, S(f), using the Welch’s averaged modified periodogram method, which utilizes a Hamming window (length of 1/2 the number of burst samples) with 50% overlap. Pressure response factor corrections were applied to the spectra, which were then partitioned along SS, IG, and VLF frequency bands. Significant wave height was determined as , and the root-mean-squared wave height was computed as , where f1 and f2 are the lower and upper frequency limits for each wave band, and S(f) is the one-dimensional energy spectra, as stated above. The peak period, Tp, was identified as the frequency associated with the peak energy in each band, and the total energy associated with each frequency band was determined as E = 0.5(Hrms/2)2.
The wave envelope for a given fore-reef water level burst record, η, was found using , where ℋ is the Hilbert transform of the high-pass filtered η (SS frequencies), and iH represents the complex conjugate. Resonance periods for the reefs were determined using the open basin approximation for the fundamental mode: , where L is the width of the reef flat, g is gravitational acceleration, and h is the mean water depth across the reef flat.
Infragravity Bore Detection
The IG wave skewness, Sk, and asymmetry, As, were found using the third order moments of the band-pass filtered (IG frequencies) water level, η (after Pomeroy et al., 2015):
Where ⟨⟩ designates the time average over each water level (η) burst, ℋ is the Hilbert transform, and the “∼” indicates the deviation from the burst mean. This formulation assumes that the free-surface elevation can be used as a proxy for velocity patterns under the wave. Overall, the degree of irregularity derived from surface elevation follows the same trend as that from near-bed velocities, but the magnitudes of the skewness and asymmetry tend to be over-predicted when relying on the surface elevation (Michallet et al., 2011). Here, we consider IG waves with As < –0.25 to be bores (pitched onshore), and IG waves with Sk > 0.5 to be strongly peaked.
In addition, each individual IG wave with height > 0.05 m was analyzed to quantify the number and size of the short-period “secondary” waves riding on the IG waves (Figure 2). For each hourly water level burst, a band-pass filter was performed using cut-off frequencies of 0.004 and 0.04 Hz to separate the IG signal. We identified trough-peak pairs with heights > 0.05 m in this band-pass filtered water level. Each waveform’s trailing trough was found by iteratively evaluating the troughs after the peak and, once the vertical distance between the leading and trailing trough was less than twice the standard deviation of the front-facing height, that trailing trough was considered the end point of the waveform. This criterion ensures that the trailing trough is sufficiently close (in vertical distance) to the leading trough, but also allows the trailing trough to be more elevated than the leading one, which was often the case (e.g., Figure 2A).
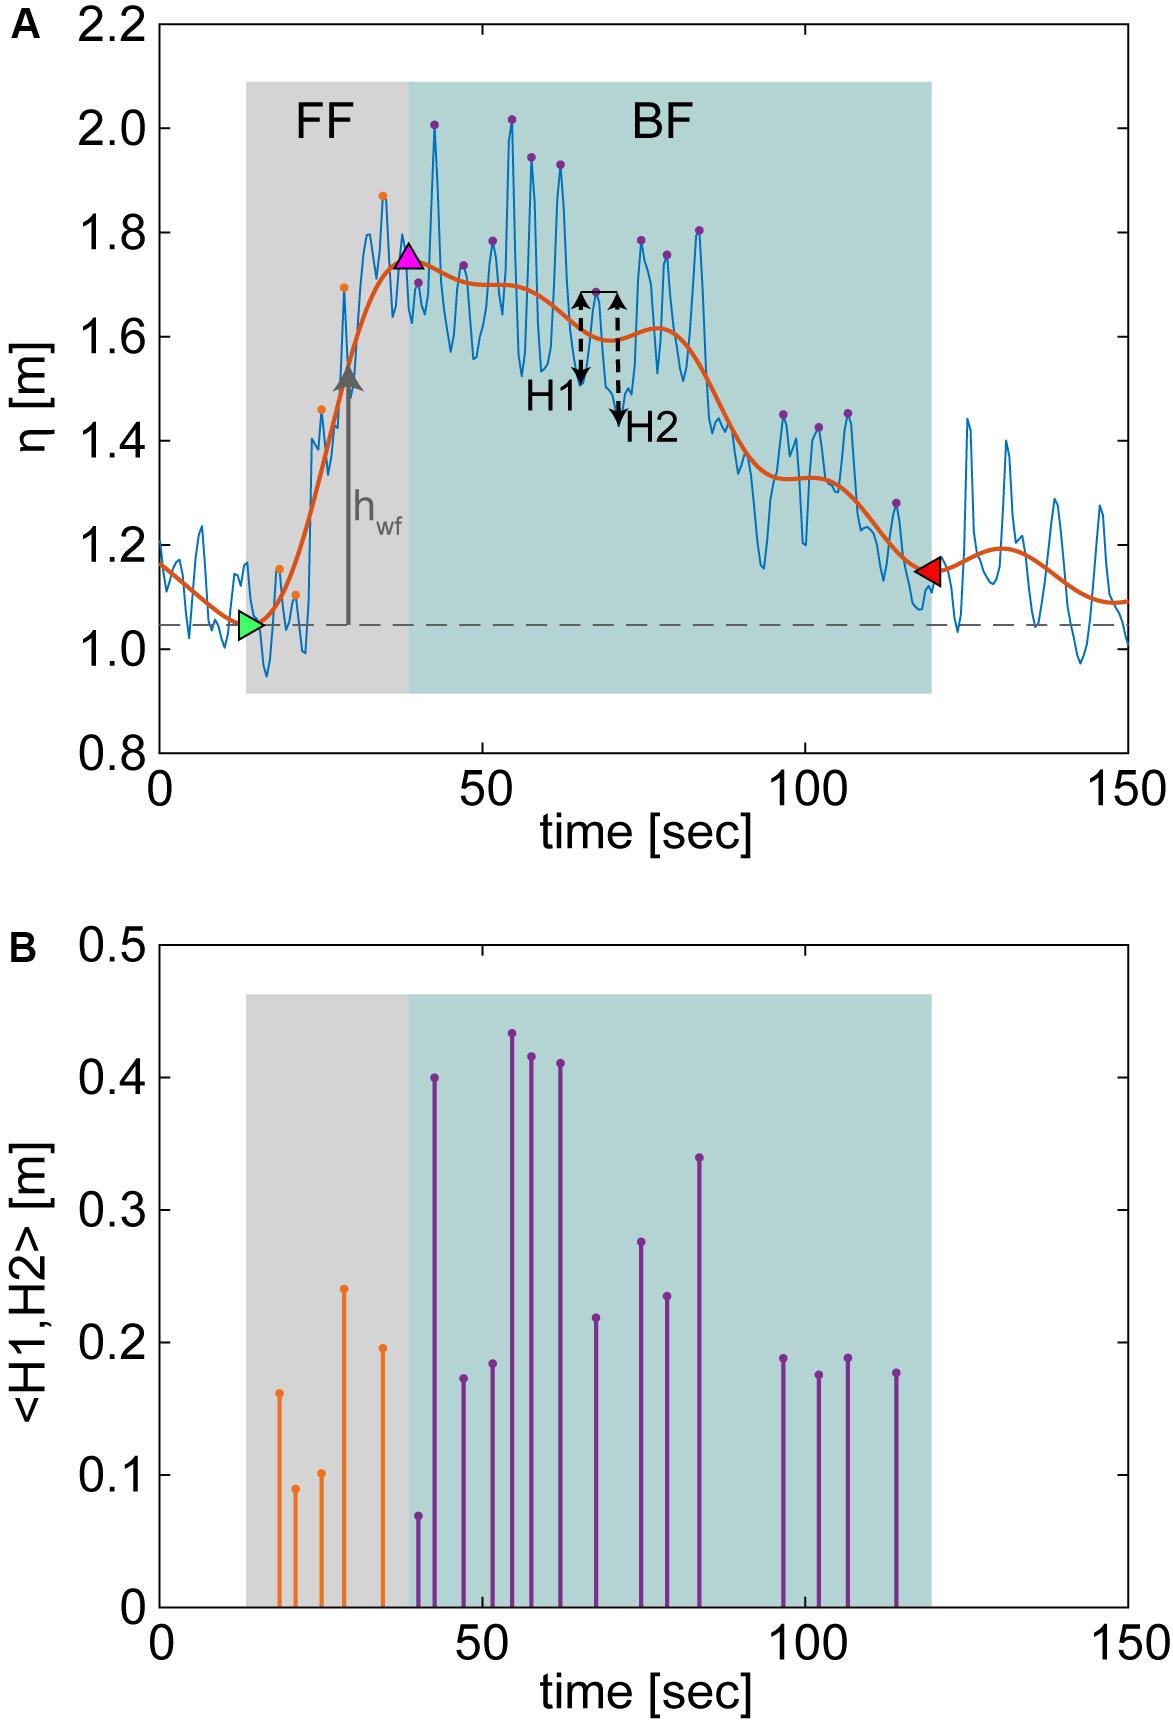
Figure 2. Individual infragravity (IG) waves evaluated for different waveform geometries and characteristics. (A) An example IG wave with full water level (blue line) and the IG waveform (orange line), with the leading trough (green triangle), peak (pink triangle), and trailing trough (red triangle) of the waveform also indicated. For each IG wave over 0.05 m in trough-to-peak height, we cataloged the number and heights of each of the short-period waves riding on the front face (“FF”) and back face (“BF”) sections and the corresponding IG waveform height (hwf, gray arrow) above the leading trough water level (gray dashed line) for each of these secondary waves. The secondary short-period wave heights were found by averaging the vertical distances from the peak to the leading (“H1”) and trailing troughs (“H2”). Only secondary waves with periods > 1.5 s and mean heights > 0.05 m were considered. The resulting secondary wave heights for the example are shown in (B) for both the FF (orange stems) and BF (purple stems).
When IG waves are pitched onshore (negatively asymmetrical), the back face of the wave gradually trails off and it is not always clear what point should mark the true termination of a waveform. As such, our algorithm is conservative and tends to terminate the waveforms earlier than would be done by visual inspection. The portion of the IG wave from the leading trough to peak was considered the front face (“FF”) and the section from the peak to the trailing trough the back face (“BF”). For both the FF and BF sections of the waveform, the unfiltered water level was used to identify the presence and heights of the short-period secondary waves (Figure 2A). The number of secondary waves for the FF and BF wave sections were cataloged, as well as their heights, which we defined as the average between the leading trough-to-peak (“H1”) and trailing trough-to-peak height (“H1” and “H2,” respectively; Figure 2B). We only considered secondary waves that met 3 criteria: (1) mean heights > 0.05 m; (2) periods > 1.5 s; (3) for FF secondary waves, H2/H1 > 0.5, and for BF secondary waves, H1/H2 > 0.5, to account for the changing IG waveform. For each secondary wave, the corresponding IG waveform height above the leading trough, hwf, was recorded (Figure 2A).
Results
General Reef Characteristics
The 7 reef transects were taken from 4 different islands, each with different reef morphologies, in terms of reef flat depth, width, roughness, and fore-reef slope (Figure 1 and Table 1). The Kwajalein reef had the shallowest and narrowest reef flat, which was also a relatively smooth pavement-like substrate (Figure 1A). The majority of incident wave energy was dissipated at the reef crest, with large infragravity waves over the reef flat. Because the reef platform is so narrow, it cannot support VLF motions (Figure 1B). When onshore-pitched, bore-like waves occurred at this site, they tended to have periods in the “high” IG band, ∼50–100 s (Figure 1C). The Roi-Namur reef flat is similarly shallow and smooth, but 2–3x wider than the Kwajalein reef flat and with slightly steeper fore reefs (Figure 1D and Table 1). At these sites, wave energy over the reef flat extended from the IG into the VLF band (Figure 1E). Pitched onshore, highly skewed waves were more common at this site and were generally larger and longer period (∼200–300 s), in the “low” IG band (Figure 1F). The two Maui reefs, Lahaina and Ukumehame are of medium width, but have deeper reef flats and more gently sloping fore reefs (Figure 1G and Table 1). The deeper reef-flat water depths allowed the majority of wave energy to remain in the SS band, with only a small amount of IG wave energy at Lahaina (Figure 1G). At these Maui sites, IG bores were rare and had small amplitudes (Figure 1I). The last site at Waiakane, Molokai, has a relatively gradual fore-reef slope and a moderately deep, but very broad reef flat (more than 2x the width of our other sites; Figure 1J). Again, much of the reef-flat wave energy was condensed into the SS band due to the deeper depths (Figure 1H). Small IG bores occurred at this site, but they were uncommon and smaller than the SS waves (Figure 1L).
Wave Transformation
The majority of incoming wave energy was dissipated at the reef crest and continued to decrease across the reef flat with distance from the reef crest (Figure 3A). The shallower reef flats (Kwajalein and Roi-Namur sites) saw the greatest drop in proportion of SS wave energy, and a corresponding large increase in the fraction of IG energy (Figures 3B,C). The Roi-Namur reef flats were the only sites with a notable increase in VLF wave energy (Figure 3D), due to their shallow water depths, strong offshore waves, and sufficiently broad reef platforms to support standing waves and other VLF patterns (Cheriton et al., 2016; Gawehn et al., 2016). There is considerable scatter in the range of IG and VLF wave energy at the Kwajalein and Roi-Namur innermost reef flat sites (± 1 standard deviation in Figures 3C,D); this arises because these sites were subject to a greater range of offshore wave forcing.
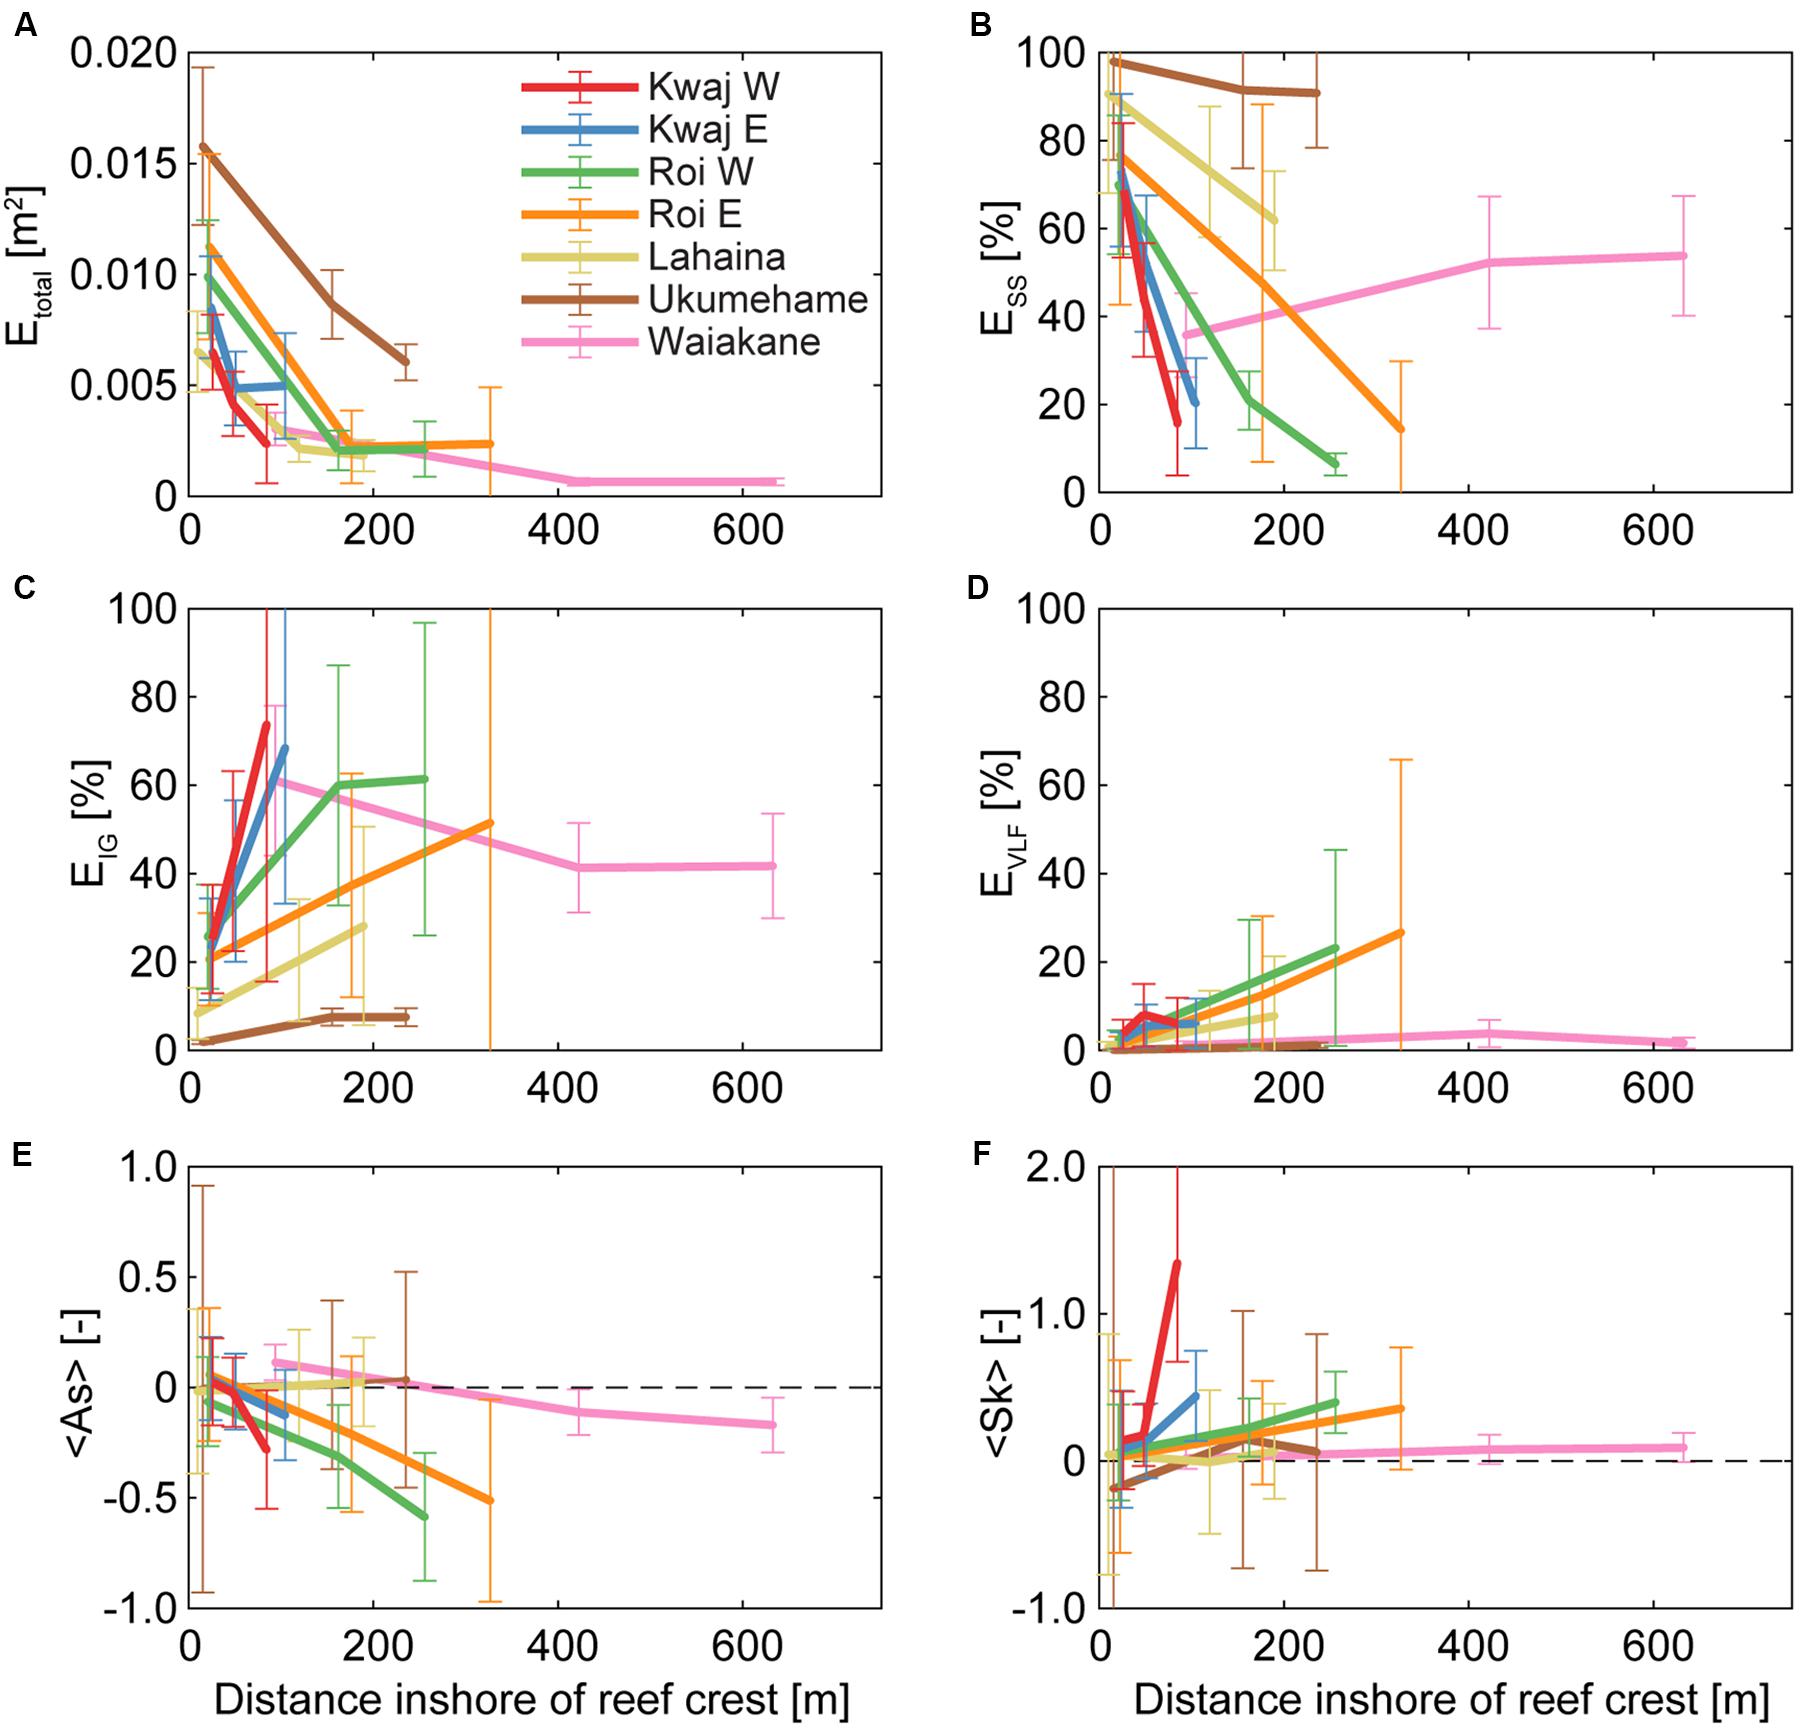
Figure 3. Wave transformation, energy partitioning, and irregularity with distance across the reef flat. For all panels, the error bars indicate the mean ± one standard deviation and the colors correspond to the sites listed in (A). (A) Mean wave energy across all frequencies. The fraction of total wave energy in the (B) sea-swell (SS), (C) infragravity (IG), and (D) very-low-frequency (VLF) bands. The mean (E) asymmetry and (F) skewness are also shown. Results were constrained to mean reef-flat water levels between the (site-specific) 40th and 60th-percentiles, and fore-reef wave power (Hs2*Tp) between 3 and 30 m2 s. There is large scatter in the IG and VLF wave energies because of the range of wave conditions captured. With distance from the reef crest toward shore, overall wave energy decreases, the proportion of IG and VLF wave energy increases, and IG waves generally become increasing pitched forward (negatively asymmetrical) and peaked (positively skewed).
The deeper reef flats of Lahaina and Ukumehame also had a decrease in SS wave energy and an increase in IG energy toward shore, but with less change over the same distance from the reef crest (Figures 3B,C). The broad reef flat of Waiakane exhibited an overall slight decrease in wave energy from the reef crest toward shore, but this site stands out among all our sites for exhibiting an increase in proportional SS wave energy from the outer to the mid reef flat, which is sustained toward shore. We attribute this SS wave energy to wind-generated waves over the reef flat. The Waiakane reef is exposed to strong diurnal wind patterns, and because its broad reef flat provides sufficient fetch, these wind-generated short-period waves contribute to the increase in proportion of short-period wave energy over the outer portion of the reef flat, which is then maintained across the reef flat. These short-period, wind-generated wave heights over the Waiakane reef vary with a diurnal pattern, with maximum reef-flat wave heights coinciding with the peak diurnal winds (data not shown). At both Kwajalein and Roi-Namur, IG wave skewness and (negative) asymmetry increased with distance from the reef crest (Figures 3E,F). The deeper reefs of Lahaina, Ukumehame, and Waiakane had no significant change in IG wave skewness across their reef flats, and Waiakane only had a slight decrease in asymmetry (from positive to ∼0).
Infragravity Asymmetry and Skewness
Reef flat IG wave asymmetry and skewness are strongly controlled by both geomorphic features of the reef as well as reef flat submergence and offshore wave forcing. We defined bores as waves with negative asymmetry (pitched onshore) of As < –0.25, and strongly peaked waves as those with Sk > 0.5. The largest IG waves occurred on the reefs with the steepest fore-reefs: Kwajalein W, Kwajalein E, Roi-Namur W, and Roi-Namur E (Figures 4A–G). The most pitched-onshore IG waves occurred on the Kwajalein and Roi-Namur inner reef flats. But strongly asymmetrical IG bores only coincided with low reef-flat submergence at the Kwajalein reefs, whereas at the Roi-Namur sites, these IG bores occurred across a range of water levels (Figures 4H–K). With increasing reef-flat submergence, greater fore-reef wave heights were required to produce pitched-onshore IG waves at the inner reef flat (Figures 4H–N). At the Kwajalein and Roi-Namur sites, the majority of IG bores (>60%) were strongly peaked as well. Highly skewed (Sk > 0.5) IG waves were most prevalent on the narrow Kwajalein reef flats, also during conditions of low reef submergence (Figures 4O,P). Skewed IG waves also occurred on the Roi-Namur W inner reef during large offshore wave conditions. In general, IG waves on the deeper reefs of Lahaina, Ukumehame, and Waiakane were smaller and were less irregular.
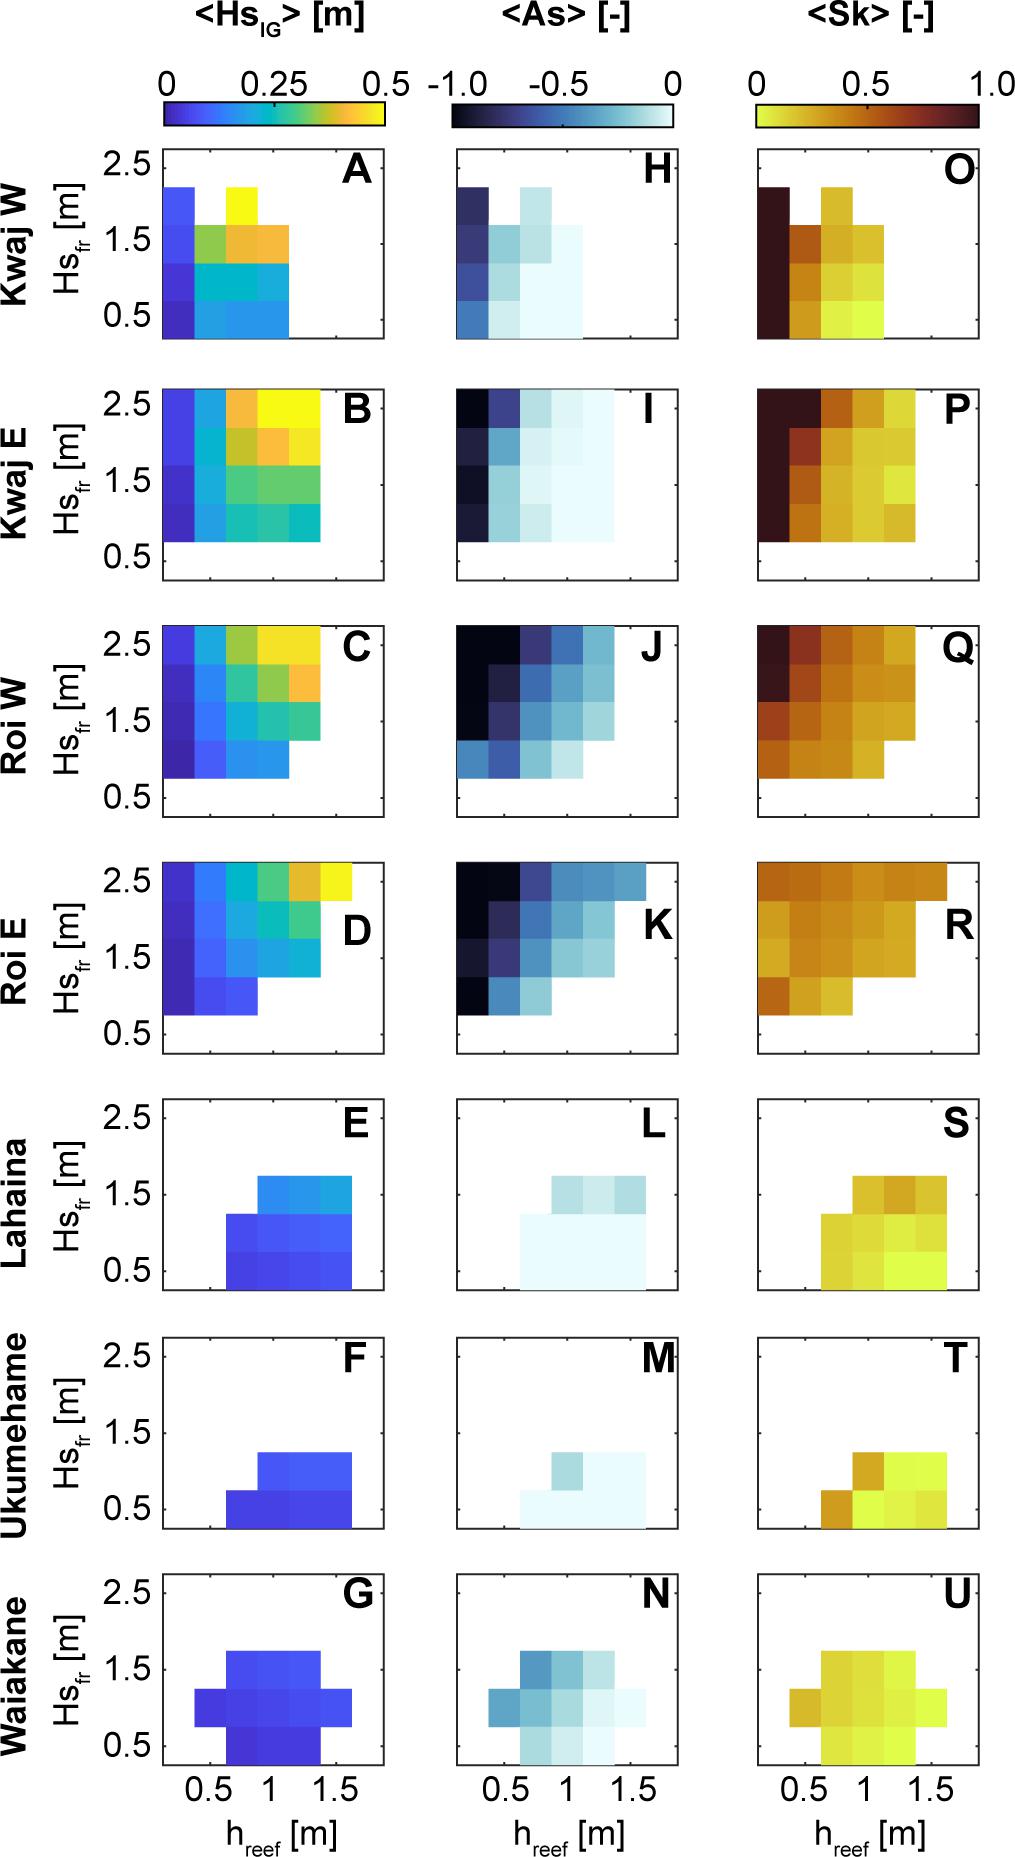
Figure 4. Mean height (HsIG), asymmetry (As), and skewness (Sk) of inner reef-flat infragravity (IG) waves with different reef submergence (hreef) and fore-reef wave heights (Hsfr). Each row is a different site. Values are only displayed if there were at least 10 water level bursts for the given hreef and Hsfr levels. (A–G) Mean IG wave heights. (H–N) Mean asymmetry of the IG waves; darker blue indicate more steep-faced, bore-like waves. (O–U) Mean skewness of the IG waves; darker reds indicate more peaked waves. Lower reef flat submergence and larger offshore waves generally produce the most negatively asymmetrical (pitched onshore) and positively skewed IG waves in the inner reef flat.
The relationship between reef flat submergence and inner reef-flat IG wave heights was examined relative to the fore-reef wave heights, Hsfr, for the four reefs with the largest IG waves: Kwajalein W, Kwajalein E, Roi-Namur W, and Roi-Namur E (Figure 5). To allow comparison to previous laboratory and modeling study results (e.g., Yao et al., 2018; Masselink et al., 2019), an adjusted reef flat submergence of hreef–a was calculated by shifting the fore-reef tide levels according to the hreef when fore-reef tide = 0 (the intercept of a linear fit). Though the absolute IG wave heights were greatest on Roi-Namur, the largest IG waves relative to the fore-reef wave heights, HsIG/Hsfr, occurred on Kwajalein (Figure 5), which is unexpected given the slightly steeper fore-reef at the Roi-Namur sites. The narrow reef platform of Kwajalein also had a fairly linear relationship between HsIG/Hsfr and relative reef submergence, hreef–a/Hsfr, such that greater reef-flat submergence consistently resulted in larger IG waves (Figures 5A,B). This was not the case on Roi-Namur, where, in the absence of energetic offshore wave forcing, greater hreef–a only led to larger IG waves to a certain point (hreef–a/Hsfr ∼ 0.75), after which the relative IG wave heights no longer increased with greater hreef–a (Figures 5C,D).
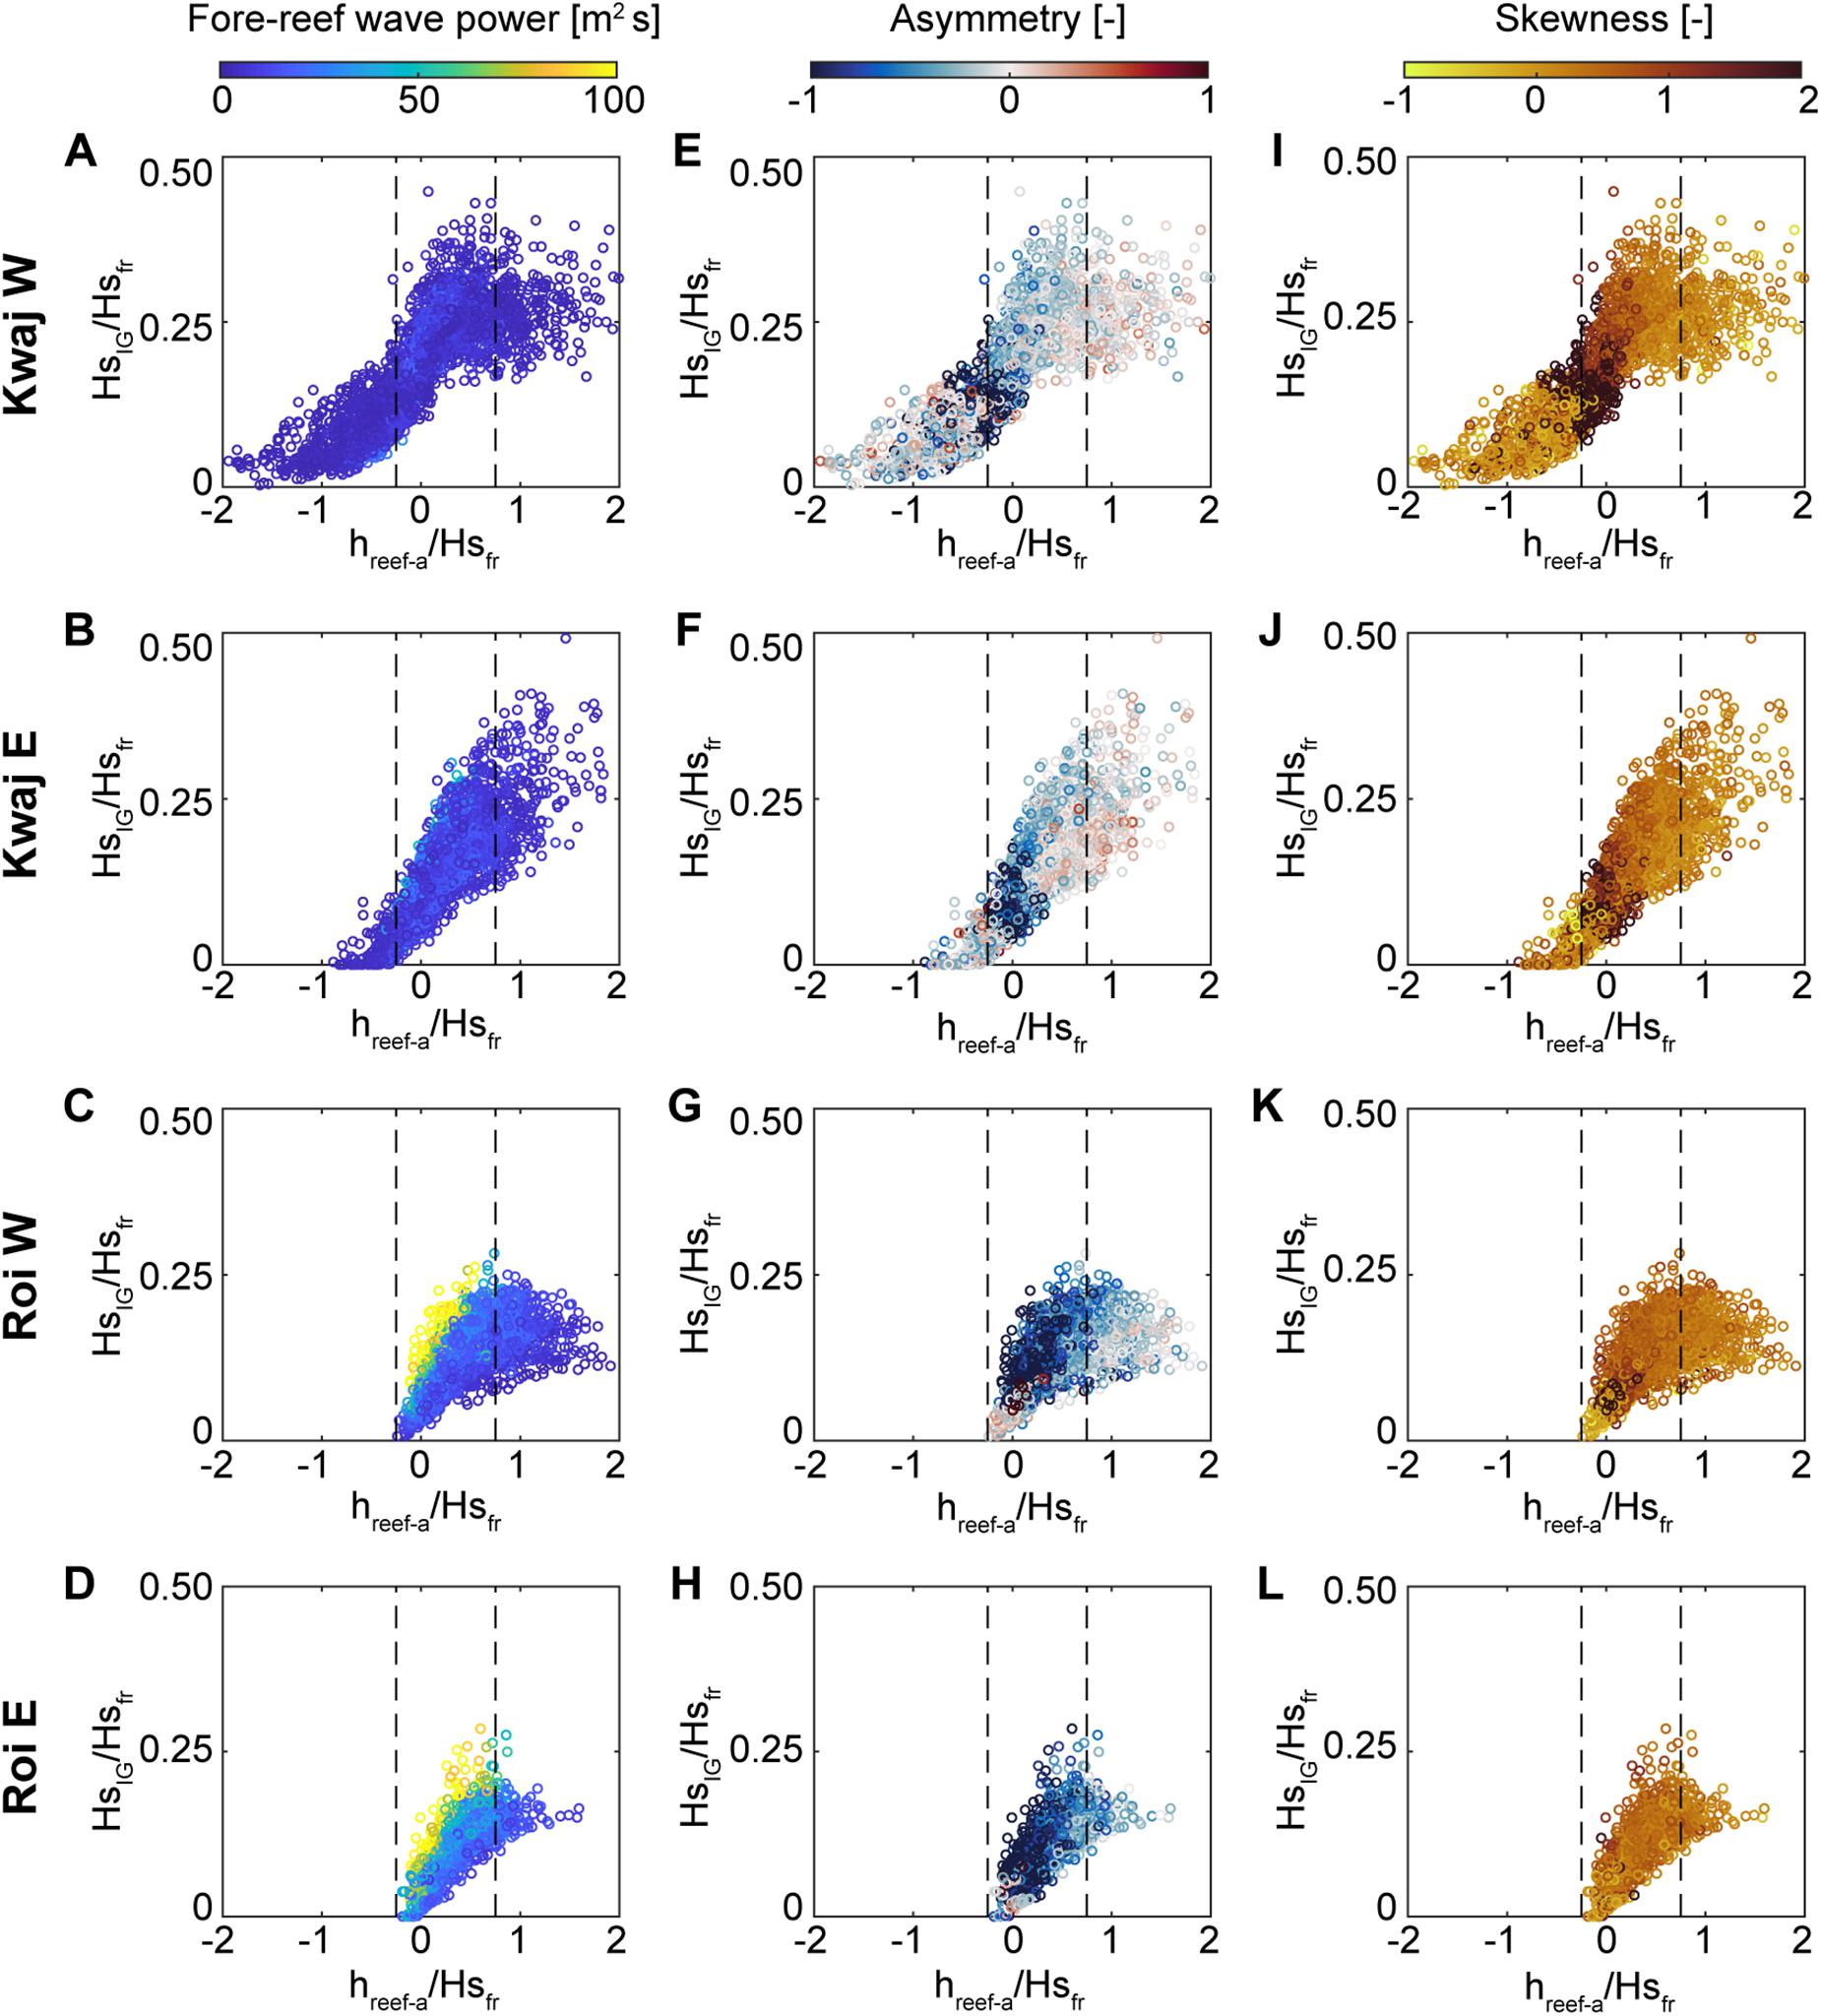
Figure 5. Evaluation of the relationship between mean reef-flat infragravity wave heights (HsIG) and the ratio of the water level relative to the reef flat (hreef–a), normalized by fore-reef wave heights (Hsfr) for the four sites with large infragravity waves: Kwajalein W, Kwajalein E, Roi-Namur W, and Roi-Namur E reefs (each site is a row). The hreef–a is the reef submergence related to fore-reef water levels above and below the mean; this was done in order to allow comparison with previous modeling results from Masselink et al. (2019). (A–D) Color-scale indicates the fore-reef wave power. (E–H) Color-scale indicates asymmetry, with darker blues indicating more pitched-onshore, bore-like IG waves. (I–L) Color-scale indicates skewness, with darker reds indicating more peaked waves. Masselink et al. (2019) reported the largest reef flat IG waves occur when the ratio of hreef–a to Hsfr was between –0.25 and 0.75 (vertical dashed lines). In general, with increasing hreef–a/Hsfr, the relative reef-flat HsIG become larger, and less pitched-onshore (asymmetry is less negative), and skewness lessens. Although we find the –0.25 to 0.75 window to encompass the largest relative IG waves on the Roi-Namur reef flats, the largest IG waves on the Kwajalein reefs extend beyond this window. The prevalence of IG waves with As > 0 (pitched offshore) at the Kwajalein reefs is due to shoreline IG wave reflection.
The degree of negative asymmetry and positive skewness for the reef-flat IG waves generally increases with decreasing relative reef flat water levels (Figures 5E–L), with the majority (90%) of highly skewed IG bores occurring between relative reef-flat submergence levels of –0.3 and 0.3 for Kwajalein W, 0 and 0.4 for Kwajalein E, and between 0 and 0.6 for both Roi-Namur sites. Many of the IG waves at the Kwajalein inner reef flat sites displayed positive asymmetry (pitched offshore), suggesting shoreline reflection of the pitched-onshore IG waves. Using a flume and numerical model, van Dongeren et al. (2007) found a relationship between the proportion of reflected IG waves and a modified surf similar parameter, , where hx is the bed slope and ω is the radial frequency of the IG waves; here, we use the IG wave heights and frequencies from the mid reef-flat sites. A threshold of βH ∼ 1.25 was found to represent the transition from a less-reflective to a more-reflective shoreline regime (van Dongeren et al., 2007). Using the HIG and ω from the mid reef flat sites, only the two Kwajalein reefs had reflection regimes at the shoreline: Kwajalein W had a relatively steep bed slope from the mid to the inner reef flat, and 78% of the time βH > 1.25, while Kwajalein E had a reflection regime 26% of the time; the remainder of the sites only exceeded this threshold < 3% of the time.
Secondary Waves
Large IG waves provide a short-lived increase in water level that could potentially allow for the transmission of larger secondary waves over reef flats. To evaluate the effect of the added water level from the IG wave on the growth of these secondary waves, we focused on the inner reef-flat sites with large IG waves: the four Kwajalein and Roi-Namur reefs. We note that these short-period secondary waves are distinct from SS waves, with nearly all (>99%) cataloged secondary waves having periods < 5 s. In order to minimize the effects of overall reef-flat submergence, we constrained the data to times when the inner reef-flat hreef was within a 0.1 m window, with ranges between 0.2 and 0.8 m investigated; the results from the intermediate hreef window of 0.5–0.6 m are shown in Figure 6. The secondary waves were most prevalent on the lower portion of both the FF and BF of the IG waveform, which is not unexpected because this region of the wave has the longest duration compared to the short-lived peak, allowing for a greater number of individual short-period fluctuations (Figures 6A,B). However, the secondary waves that were higher up on the IG waveform tended to be larger, with a moderate correlation (Figures 6C,D). This effect of larger secondary waves occurring on the higher portions of IG waves was greatest for the Kwajalein reefs, where, for intermediate hreef, the secondary waves would be expected to be 0.1 m larger if they are riding on a 0.6 m waveform elevation, instead of closer to the troughs at 0.2 m elevation. Thus, it appears that large IG waves can support the transmission of larger secondary waves over the reef flat independent of overall water levels, but the effect is small compared to the overall IG wave heights.
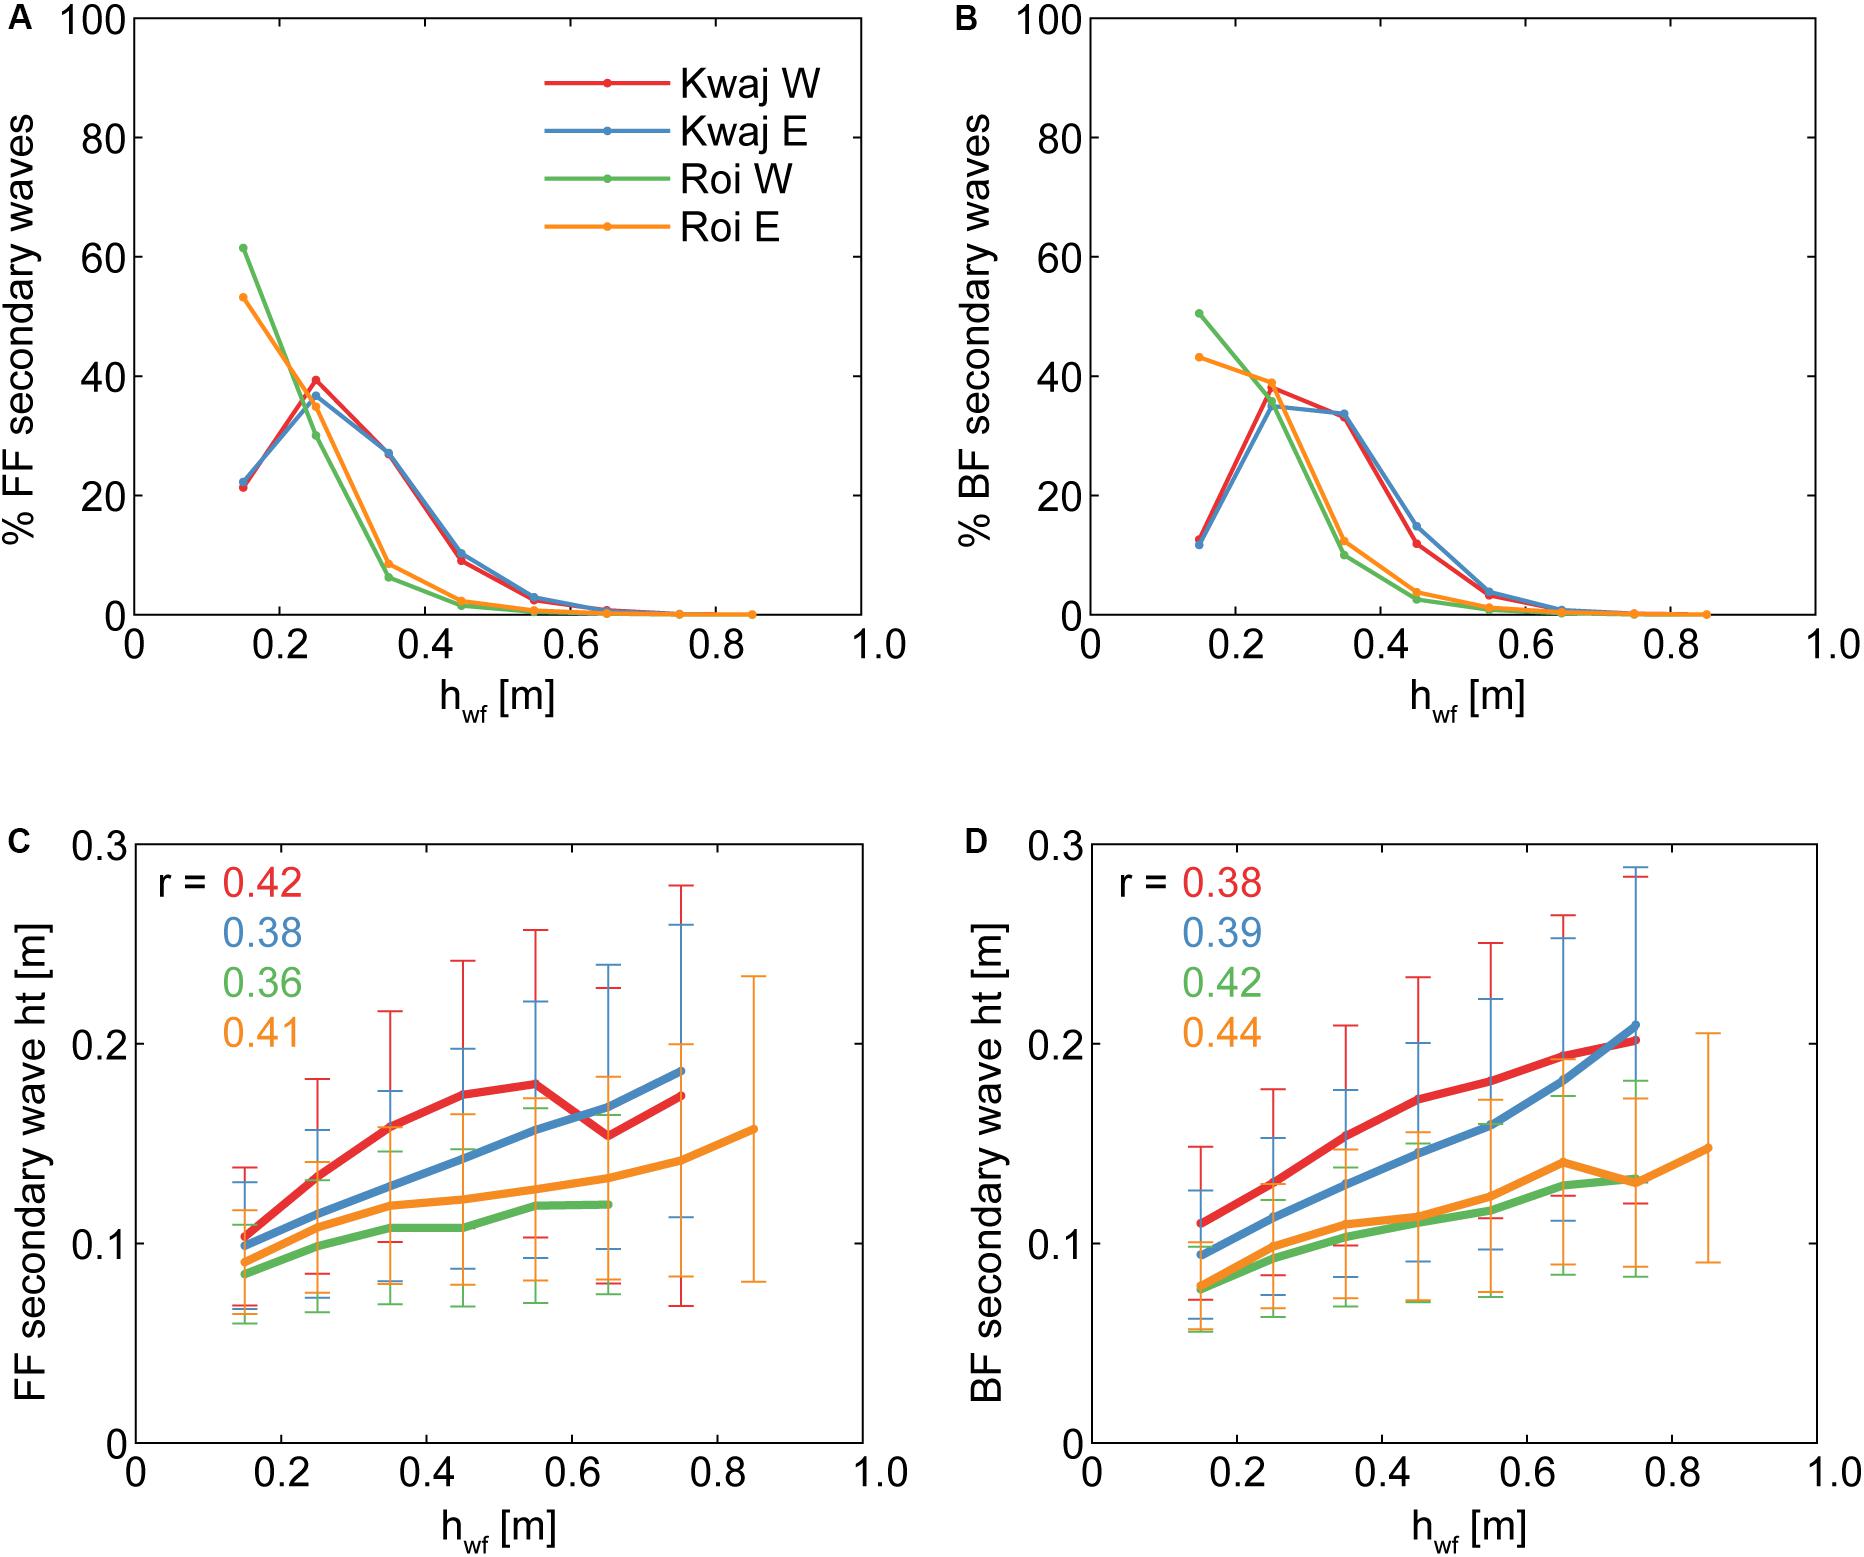
Figure 6. The effects of infragravity (“IG”) waves on the prevalence and heights of secondary short-period waves at the inner reef flat for the four sites with the largest IG waves. For all panels, the colors correspond to sites in (A), and reef-flat water levels were constrained to a 0.1 m window (0.5 < hreef < 0.6 m). The % of all secondary waves that occurred at different heights along the IG waveform, hwf (see Figure 2A), for (A) the front face (“FF”) and (B) the back face (“BF”) of the IG waves. The mean ± one standard deviation of the secondary wave heights according to hwf for (C) the FF and (D) the BF of the IG waves, with correlation coefficient, r, given for each site. The lower portions of the IG waves have the greatest number of secondary SS waves, but the largest ones occur higher up on the IG wave, independent of overall reef-flat water levels.
Discussion
Reef Morphological Controls on Infragravity Waves
Laboratory and modeling work has put forth two dominant morphological controls on reef-flat IG wave regimes: the reef-flat submergence and the slope of the fore reef (Quataert et al., 2015; Pearson et al., 2017; Yao et al., 2018; Chen et al., 2019; Masselink et al., 2019). Although physically or numerically simulated reefs allow for holding certain reef geometries constant while varying others, field-based studies utilizing natural reefs, of course, do not allow for the same level of control and manipulation. Nevertheless, the in situ observations from our 7 reefs generally support the findings that reef flat submergence and the slope of the fore reef are the first-order controls on the resulting IG wave field over the reef flat (Table 2). Our sites could be grouped according to fore-reef slope and reef-flat water depth, with Ukumehame, Lahaina, and Waiakane representing less-steep fore reefs and deeper reef flats and the four Kwajalein and Roi-Namur sites representing reefs with steeper fore reefs and shallower reef flats (Figure 1 and Table 1). These groupings also capture the difference in IG wave energy observed at the sites, with the steep fore-reef and shallow reef-flat sites having much greater IG wave energy over the reef flats that became dominant toward the shoreline (Figures 4A–G). Although Ukumehame and Lahaina were subject to considerably less energetic offshore wave forcing, there were several large wave events at Waiakane (Hsfr > 2 m) and these did not result in reef-flat IG waves of similar magnitude to those on the Kwajalein or Roi-Namur reef flats under similar Hsfr. Interestingly, the Kwajalein reef flats had the largest relative IG waves, despite having slightly less steep fore-reef slopes than Roi-Namur (Figures 4, 5 and Table 1).
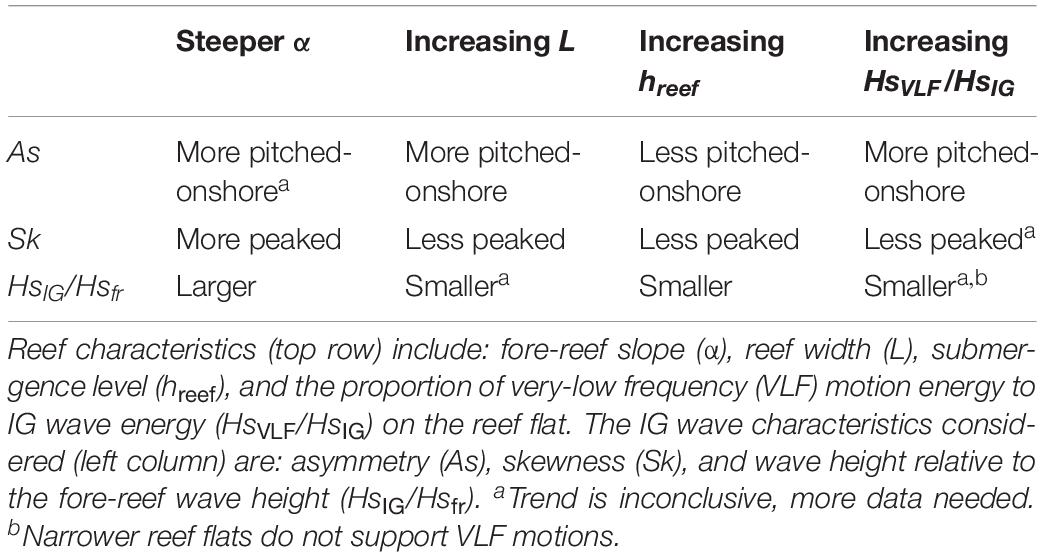
Table 2. Summary of relationships found between reef characteristics and resulting infragravity (IG) waves at the inner reef flat.
A modeling study by Chen et al. (2019) found that steeper fore reefs can reduce the asymmetry of reef-flat IG waves. To evaluate this for our in situ observations, we compared the IG wave asymmetry from the Roi-Namur W and Lahaina sites, which have similar reef-flat widths, but the Roi-Namur W fore-reef slope is approximately twice as steep (Table 1). Taking all the offshore wave power (wpoff = Hs2*Tp) and mean reef-flat water depth (havg) combinations during a large wave event (wpoff > 15 m2 s) at Lahaina, we then found all the corresponding occurrences at Roi-Namur W when wpoff was within 5 m2 s and the havg was within 0.05 m of the Lahaina conditions; for any matches, we averaged the inner reef-flat IG wave As. Under approximately equivalent offshore wave forcing and reef flat water levels, the Roi-Namur W inner reef-flat IG waves were more negatively asymmetrical in 76% of the cases (n = 56). Our results are somewhat confounded by the different bed roughness of the two reefs, which may account for the disagreement with the proposition that steeper fore-reefs produce less asymmetrical IG waves on the reef flat. The Lahaina reef flat has relatively high rugosity, and would be expected to have a bed wave friction factor, fw, on par with those derived for other Hawaiian reefs of ∼ 0.2 (e.g., Falter et al., 2004; Lowe et al., 2005). In contrast, the Roi-Namur W reef flat is relatively smooth, with an estimated fw ∼ 0.1 (Cheriton et al., 2016). It is possible that the smoother reef flat may explain why Roi-Namur W consistently has more asymmetrical IG reef-flat waves than Lahaina, despite its steeper fore reef, but the effects of bed roughness on resulting IG wave asymmetry are reported to be less influential than the fore-reef slope (Quiroga and Cheung, 2013; Chen et al., 2019).
Although fore-reef slope and reef submergence strongly govern the reef-flat IG wave field, the width of the reef flat may also be an important factor (Table 2). The width of a reef flat can vary from tens of meters to more than 1 km (Quataert et al., 2015) and affects both the resonant frequency modes possible over the reef flat (Péquignet et al., 2009), as well as the potential for wave energy dissipation by bottom friction (van Dongeren et al., 2013). At the Kwajalein and Roi-Namur reefs, the fore-reef slope and level of reef submergence were roughly equivalent, but their reef-flat widths varied by a factor of 3 (Table 1). On the narrow Kwajalein reefs, IG waves were larger relative to fore-reef wave heights, and more predominantly skewed compared to those on Roi-Namur (Figures 4, 5). Because the Kwajalein reef flats are so narrow, the longest-period waves that can be supported by the reef platform are in the IG band; thus, with larger incident waves, energy transfer into lower-frequency bands over these narrow reef flats is constrained to the IG band, possibly accounting for the larger IG waves, despite the less steep fore-reef slope.
The most strongly skewed IG waves occurred on Kwajalein W, which had a disproportionately steep reef-flat slope compared to our other sites (Table 1). In contrast, on the wider Roi-Namur reef flats, IG waves were predominantly asymmetrical (pitched onshore) and less peaked. When the leading edge of a bore is large compared to overall water depths (HsIG/hreef > 0.75), the bore is considered to be turbulent (Peregrine, 1966). For the IG bore waves on Kwajalein W and E, 94 and 73%, respectively, of these bores meet this criterion for fully turbulent breaking bores. However, on Roi-Namur W and E, the majority of IG bore waves (81 and 78%, respectively) had HsIG/hreef between 0.28 and 0.75, so they are considered to be in a transitional regime, in which the bores exhibit both turbulent breaking and undular waveforms (Peregrine, 1966). The Kwajalein and Roi-Namur reef flats have similar bed roughness, but the wider reef flats of Roi-Namur allow for greater frictional dissipation of the low-frequency waves as they travel shoreward, which may both dampen the IG wave amplitudes and also enhance asymmetry of the waves. In addition, the Roi-Namur reef flats are sufficiently wide to allow for VLF waves. There, when reef-flat submergence increases, the resonance frequencies of the reef increase to the high-VLF band (500 < T0 < 300 s, for hreef > 0.5 m), becoming more easily excitable by the offshore wave groups, which have dominant periods on the order of minutes (Roi-Namur W mean Tdom,At = 179 ± 142 s; Roi-Namur E mean Tdom,At = 214 ± 178 s). Thus, our results highlight the importance of reef-flat width and bed slope, in addition to fore-reef slope and reef-flat submergence, to the resulting IG wave field on reef flats, supporting previous results that found reef-flat width an important geomorphic control on extreme runup on reef-lined coastlines (Quataert et al., 2015; Pearson et al., 2017).
Infragravity Wave-Wave Capture
Energetic VLF motions on the reef flat may enhance IG wave-wave capture over the reef flat. This phenomenon was observed during large wave events at our two Roi-Namur sites (Figures 7, 8). As the large, incident SS wave groups on the fore reef excited a corresponding fluctuation in VLF motions over the reef flat, the short-period waves riding on the crests of these longer-period fluctuations merged into increasingly tall and pitched-forward IG bores (Figures 7A–D, 8A–D). Energy spectra from the outer, mid, and inner reef flat show maxima centered on the resonance period T0, with amplifications > 1, and strong coherence (Figures 7E–G, 8E–G). The phase between the spectra indicate a phase lag between the outer and mid reef, but near-zero phase lag between the mid and inner reef (Figures 7H, 8H), which is also indicated by the cross-correlation between the fore-reef wave envelope and the reef flat η records (Figures 7I, 8I). As such, the strong VLF motions during these examples were likely standing waves with possible resonant behavior over the reef flat.
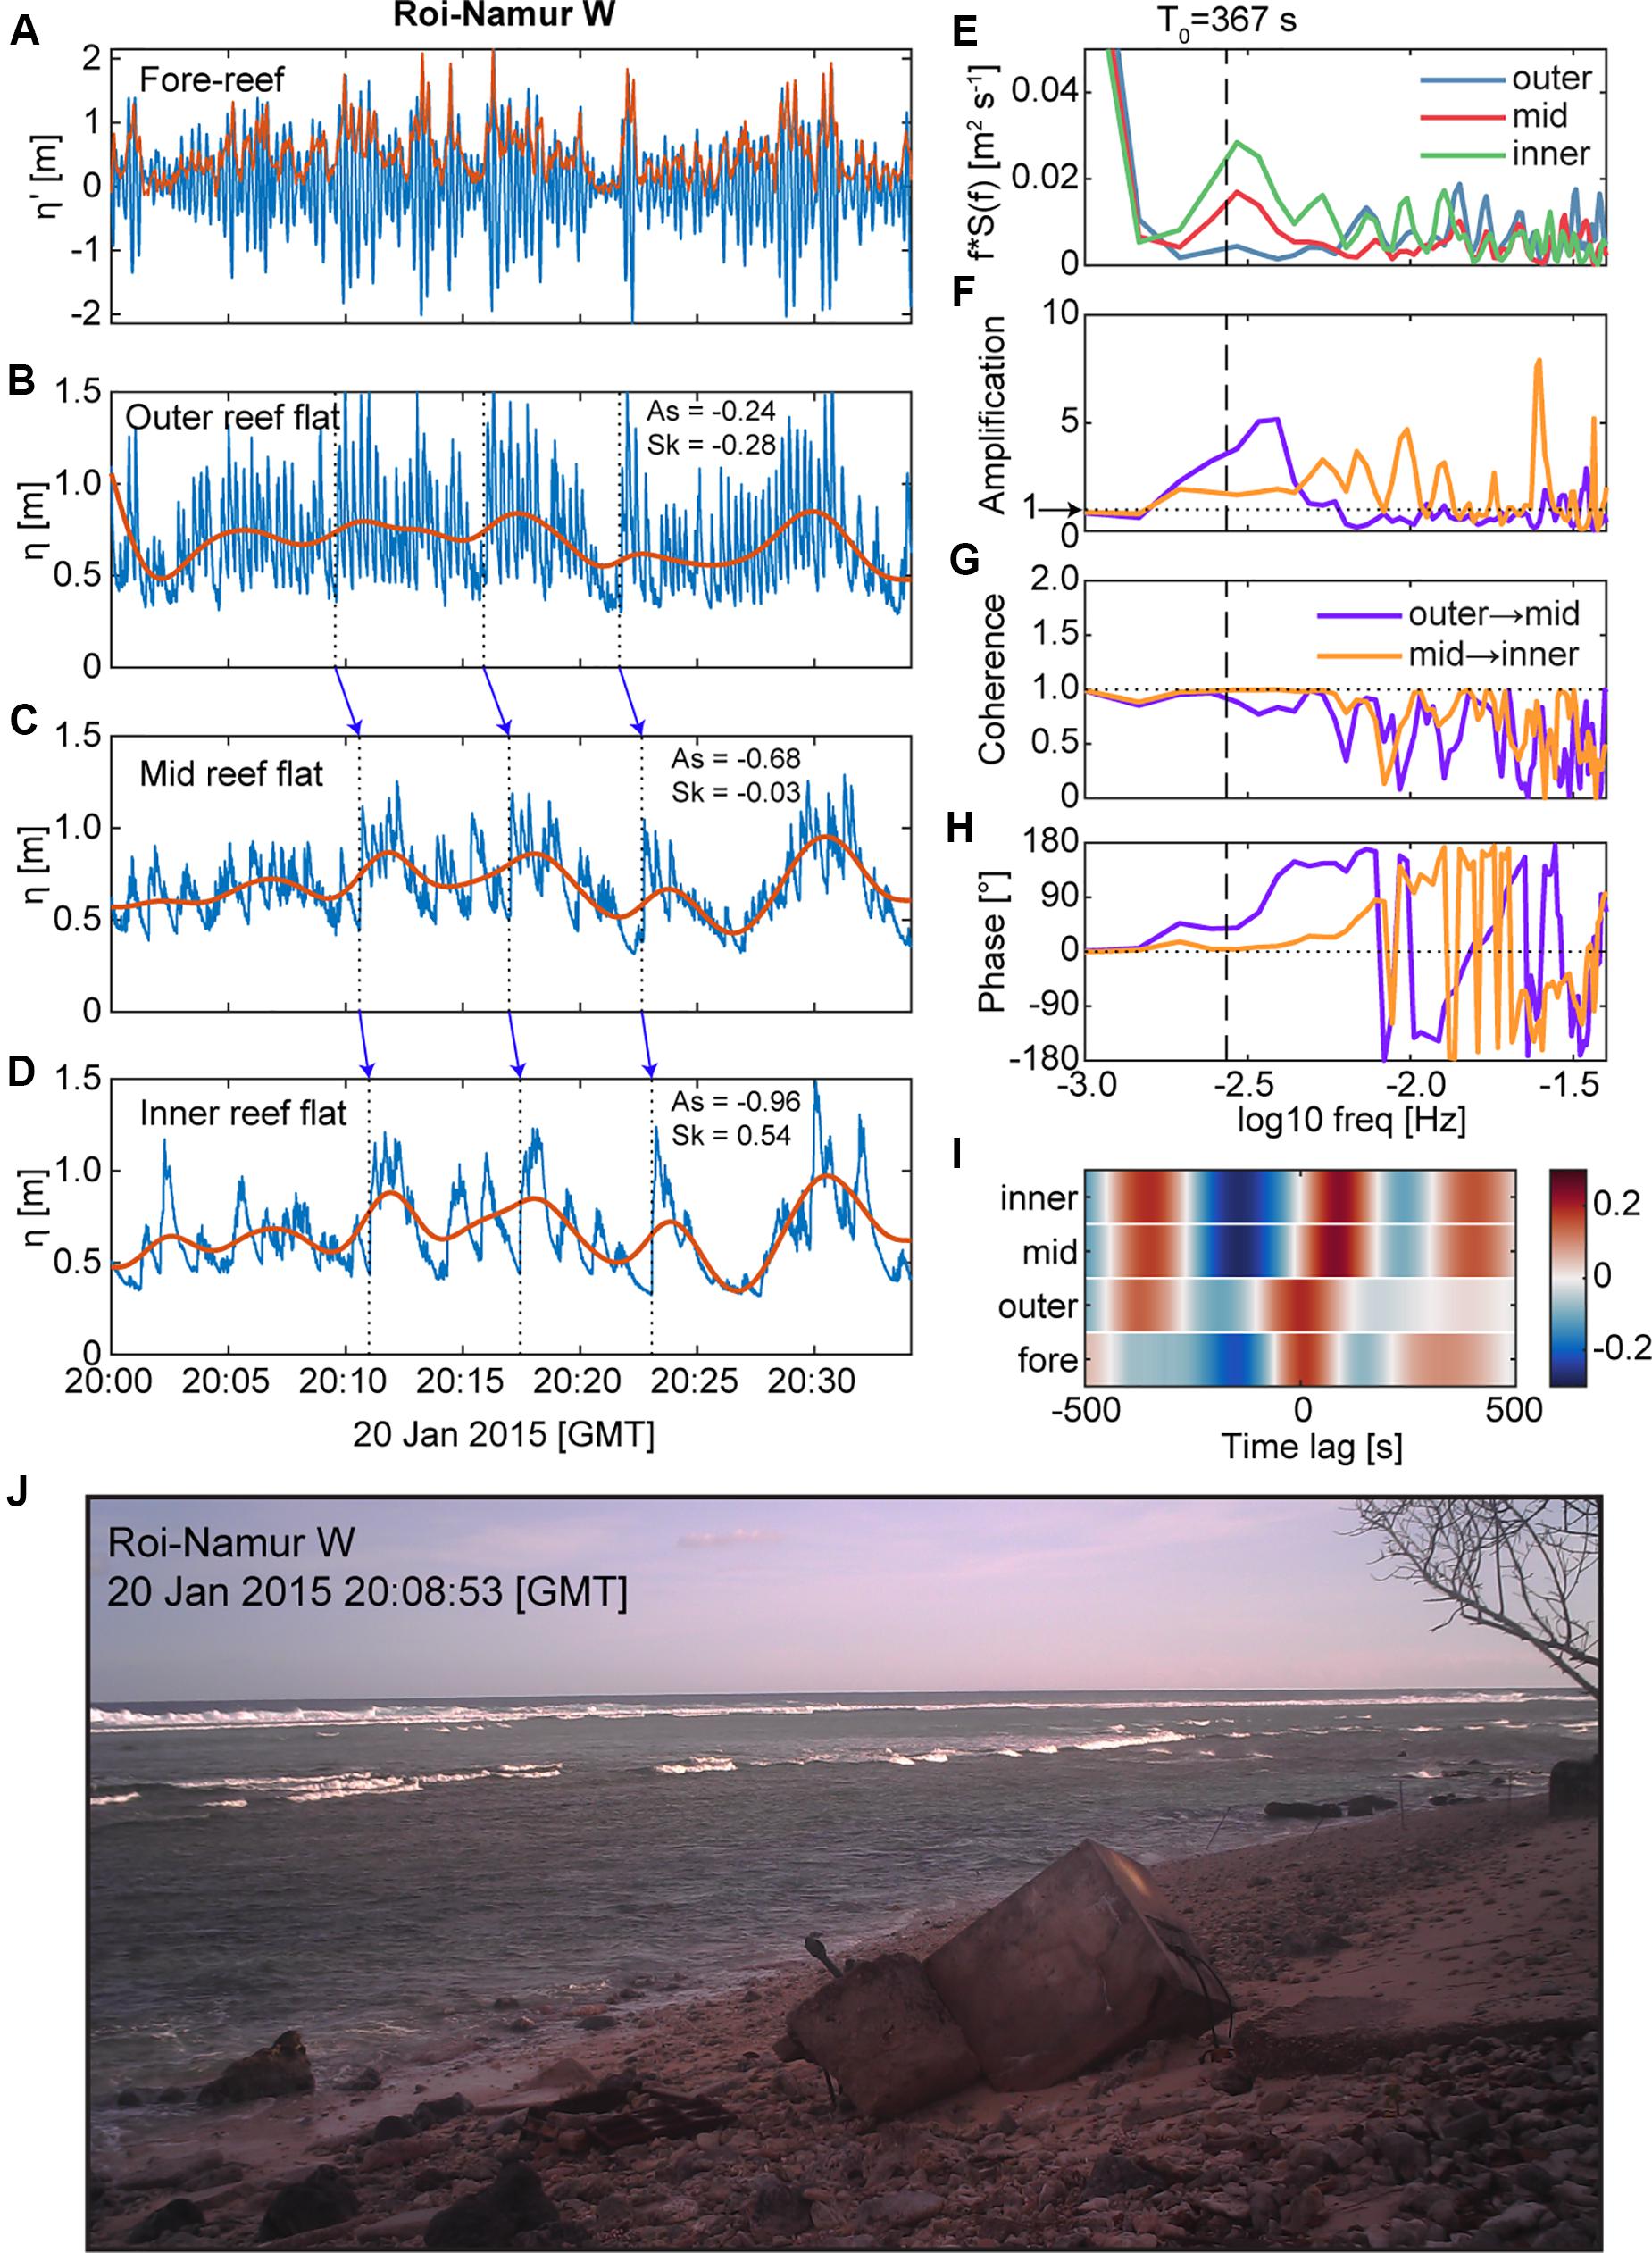
Figure 7. An example of how large very-low frequency (“VLF”) motions can facilitate the growth of large infragravity (“IG”) bores on reef flats, using observations from Roi-Namur W during a large offshore wave event on 20 January 2015. (A) Fore-reef water levels relative to the mean (blue) with the sea-swell (“SS”) wave envelope (red) overlaid. Reef-flat water levels (blue) and the low-pass filtered VLF water levels (red line) shown for the (B) outer, (C) mid, and (D) inner reef flat. Dashed lines and corresponding blue arrows highlight a few selected leading edges of wave packets that transform into steep, asymmetrical IG bores by the inner reef flat. (E) Variance-preserving energy density spectra from the reef flat water levels shown in (B–D) over the IG and VLF bands; the fundamental resonant frequency (T0) is indicated by the dashed line. (F) Amplification in energy across the reef flat. (G) Coherence between the spectra. (H) The phase between the spectra. (I) Cross-correlation between the fore-reef wave envelope shown in (A) and the reef flat water levels for different time lags. (J) Photo taken from a shore-mounted camera during the water level bursts shown in (A–D) showing the shore-parallel crests of large IG bores propagating toward shore. There is strong evidence for VLF resonance or standing wave behavior: the reef flat water levels display amplification and strong coherence near T0, and a near-zero lag and strong cross-correlation between the mid and inner reef flat. The resulting IG bores at the inner reef flat had heights of >0.8 m.
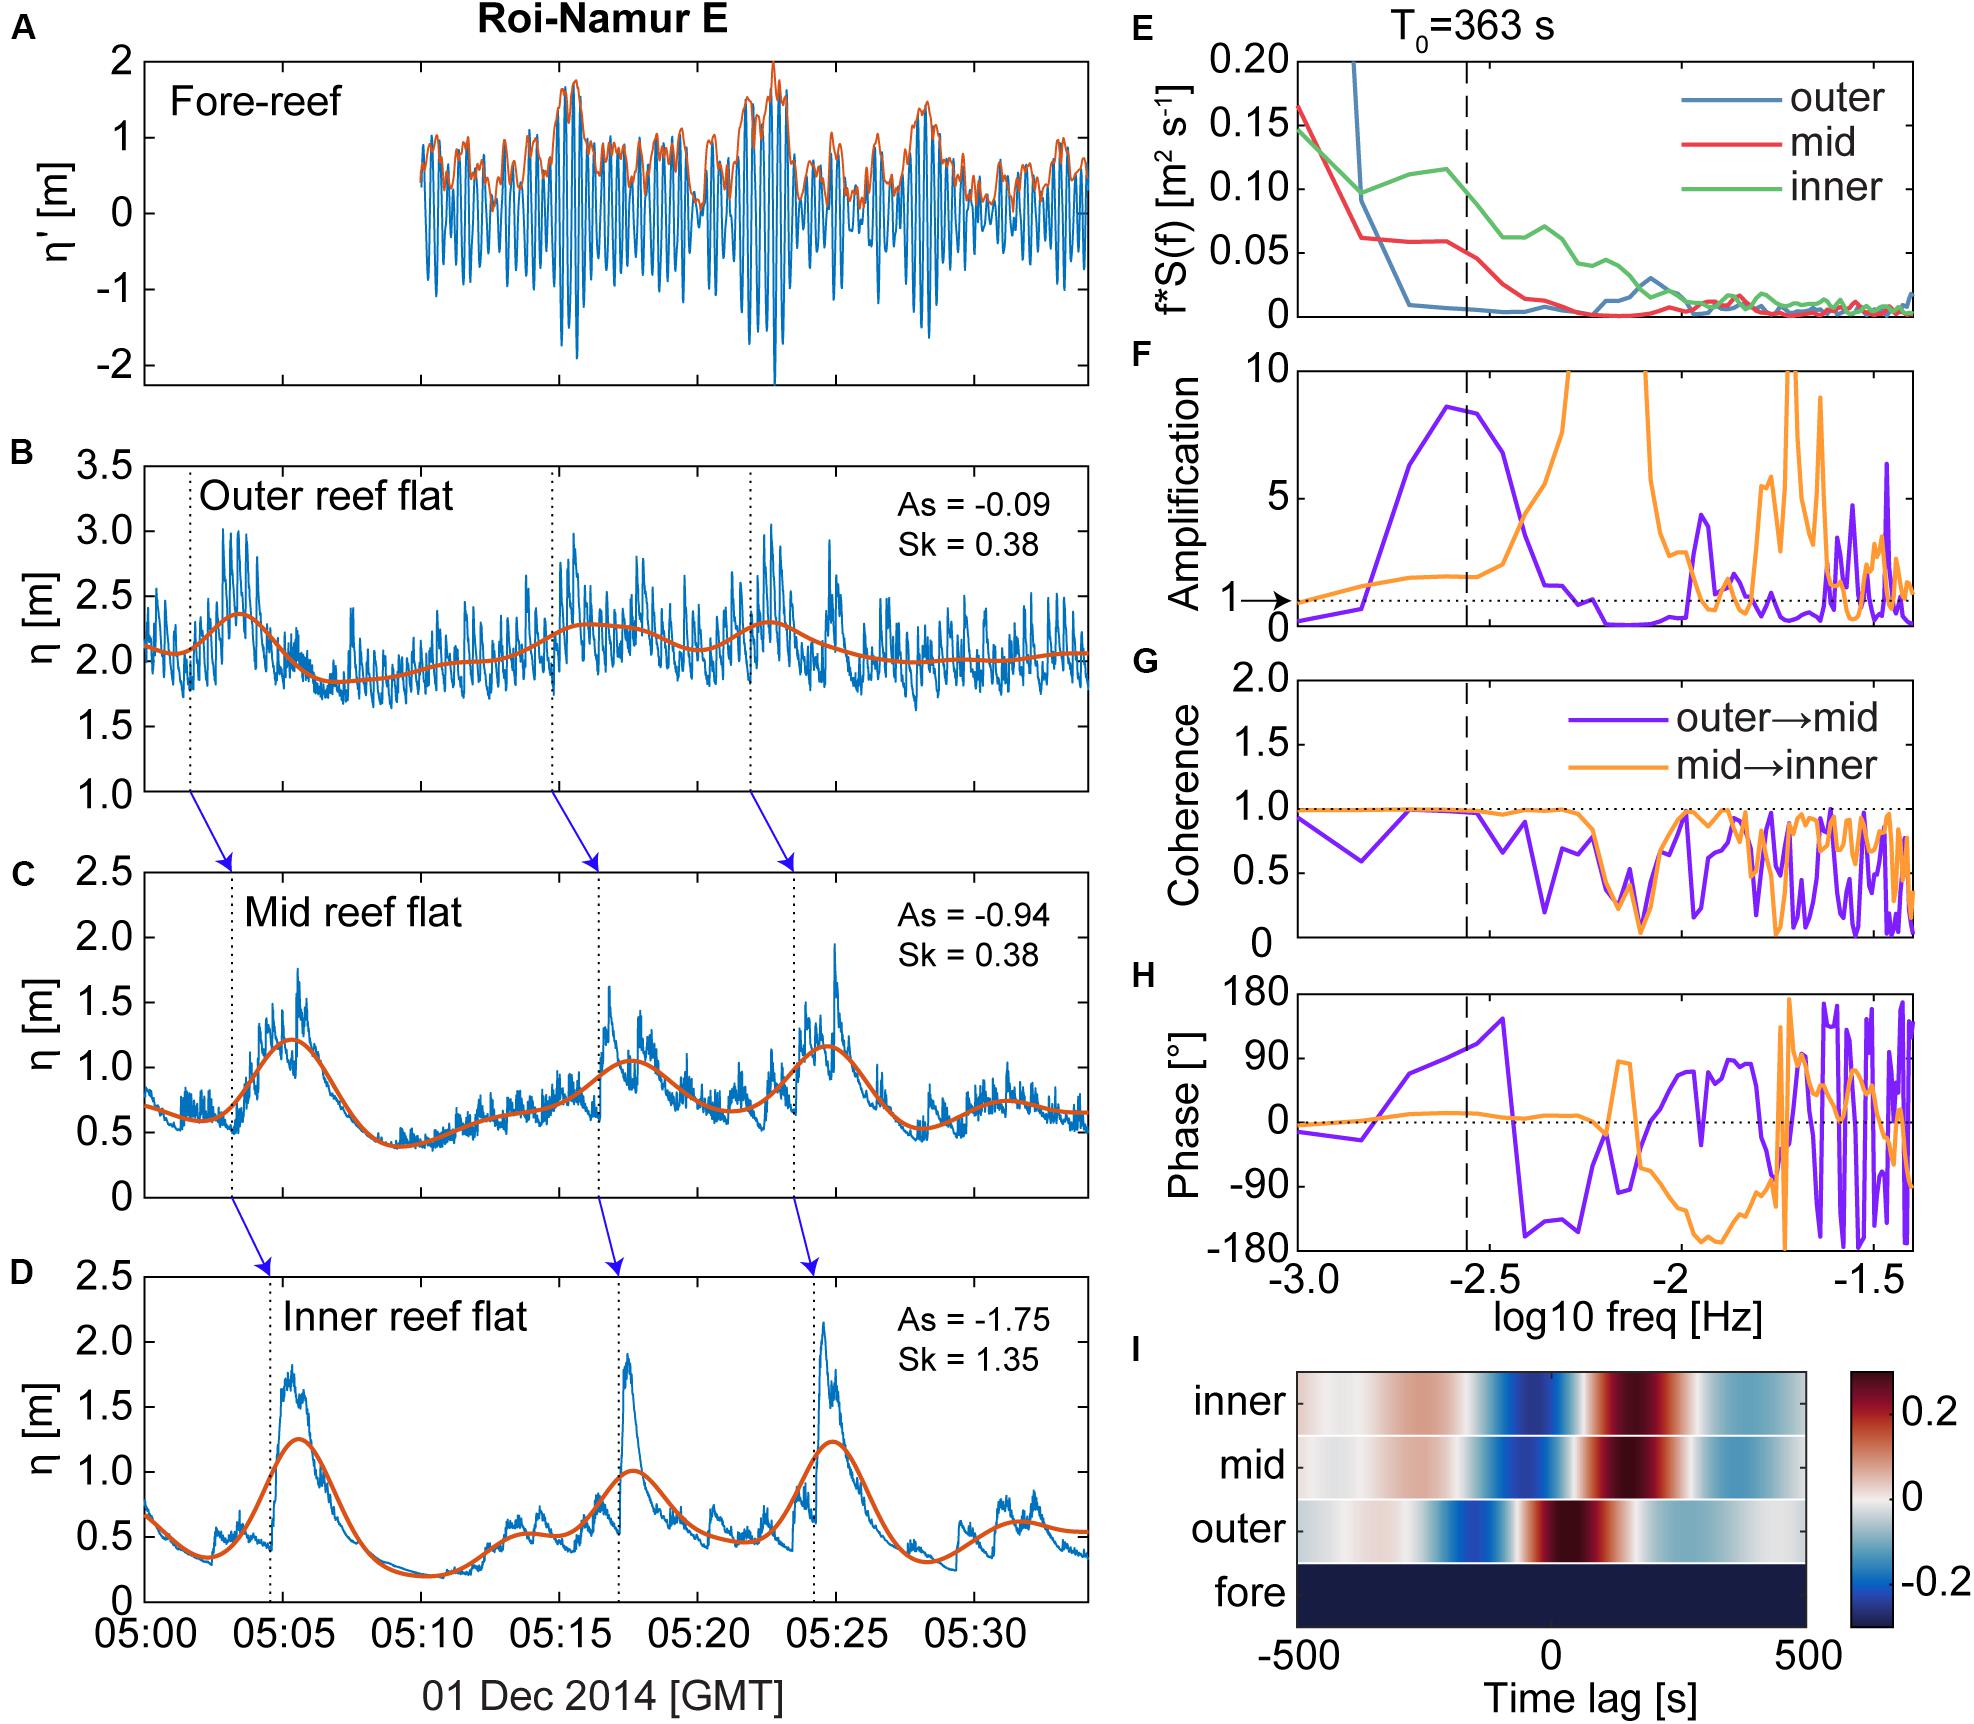
Figure 8. Another example of how large, very-low frequency (“VLF”) motions can facilitate the growth of large infragravity (“IG”) bores on reef flats, using observations from Roi-Namur E during a large offshore wave event on 1 December 2015. (A) Fore-reef water levels relative to the mean (blue) with the sea-swell (“SS”) wave envelope (red) overlaid. Due to data fouling of the Roi-Namur E fore-reef pressure sensor, these fore-reef water levels are taken from the AWAC pressure sensor, which did not begin its burst sampling till 10 min past the hour (see section Materials and Methods). Reef-flat water levels (blue) and the low-pass filtered VLF water levels (red line) shown for the (B) outer, (C) mid, and (D) inner reef flat. Dashed lines and corresponding blue arrows highlight a few selected leading edges of wave packets that transforms into a steep, asymmetrical IG bores by the inner reef flat. (E) Variance-preserving energy density spectra from the reef flat water levels shown in (B–D) over the IG and VLF bands; the fundamental resonant frequency (T0) is indicated by the dashed line. (F) Amplification in energy across the reef flat. (G) Coherence between the spectra. (H) The phase between the spectra. (I) Cross-correlation between the outer reef-flat water level and the mid and inner reef flat water levels for different time lags; the available fore-reef water level did not correlate well with the reef flat water levels. No photo was available for this site. Similar to the example shown in Figure 7, there is strong evidence for VLF resonance or standing wave behavior: the reef flat water levels display amplification and strong coherence near T0, and a near-zero lag and strong cross-correlation between the mid and inner reef flat. The resulting IG bores at the inner reef flat had heights > 1 m.
A shore-mounted camera system captured a photo of the large IG bores propagating across the Roi-Namur W reef flat during the example η record (Figure 7J); the shore-parallel bore wave crests extended across the reef area and appeared to have been breaking in the nearshore. It is possible that not only do VLF waves support IG wave-wave capture, but that the IG wave-wave capture, in turn, enhances energy in lower-frequencies, leading to increasing VLF wave heights toward shore, similar to the SS wave-wave capture facilitating transfer of energy into lower frequencies in plane beach environments (Tissier et al., 2015; Tissier et al., 2017). The heights of the VLF waves in our two examples increase from the outer to the inner reef flat with a ΔHsVLF = 0.17 m for the Roi-Namur W example (Figure 7) and ΔHsVLF = 0.53 m for Roi-Namur E example (Figure 8).
A similar phenomenon of wave-crest merging has been well documented for plane beaches (e.g., Huntley and Bowen, 1975; Sénéchal et al., 2001), but remains poorly understood (Bertin et al., 2018). Wave-wave capture occurs when irregular waves travel at different speeds (celerity) over sufficient distance to catch up to each other. Low-frequency waves can cause modulations in water levels that drive changes in wave celerity in the nearshore (e.g., Longuet-Higgins and Stewart, 1960; Phillips, 1981; Kenyon et al., 1983). Laboratory experiments by Tissier et al. (2015) demonstrated that SS bores riding on the IG wave crests over plane beaches propagate faster than those on the troughs, and the SS wave merging is enhanced at the IG wave crest. Further work by Tissier et al. (2017) found that the initial merging point for the SS waves was located where the ratio of IG to SS wave heights was ∼ 1, indicating that SS bore-bore capture occurs where IG waves already dominate. Extrapolating these results to reef-flat environments, we might expect IG wave-wave capture to be most likely where VLF wave energy begins to equal or exceed IG wave energy, i.e., HsVLF/HsIG ≥ 1.
The HsVLF/HsIG ratio at the outer and inner reef-flat sites are well correlated, increasing and decreasing together (Figures 9A,B), with a similar robust positive correlation between the outer and mid reef-flat sites (not shown). Though the outer reef flat HsVLF/HsIG rarely exceeded 1, by the mid and inner reef flat, this threshold was regularly exceeded, particularly during low hreef. An increasing HsVLF/HsIG ratio is moderately negatively correlated with IG wave asymmetry at the shoreline (Figures 9C,D). No corresponding relationship was found between HsVLF/HsIG and IG wave skewness. When HsVLF/HsIG > 1 at the inner reef flat, the resulting IG waves were pitched-onshore bores (As < –0.25) 98% of the time at Roi W, and 93% of the time at Roi E. Thus, when VLF motions are energetic relative to IG waves, this leads to more negatively asymmetrical IG waves at the shoreline, but the mechanism underlying this connection is unclear.
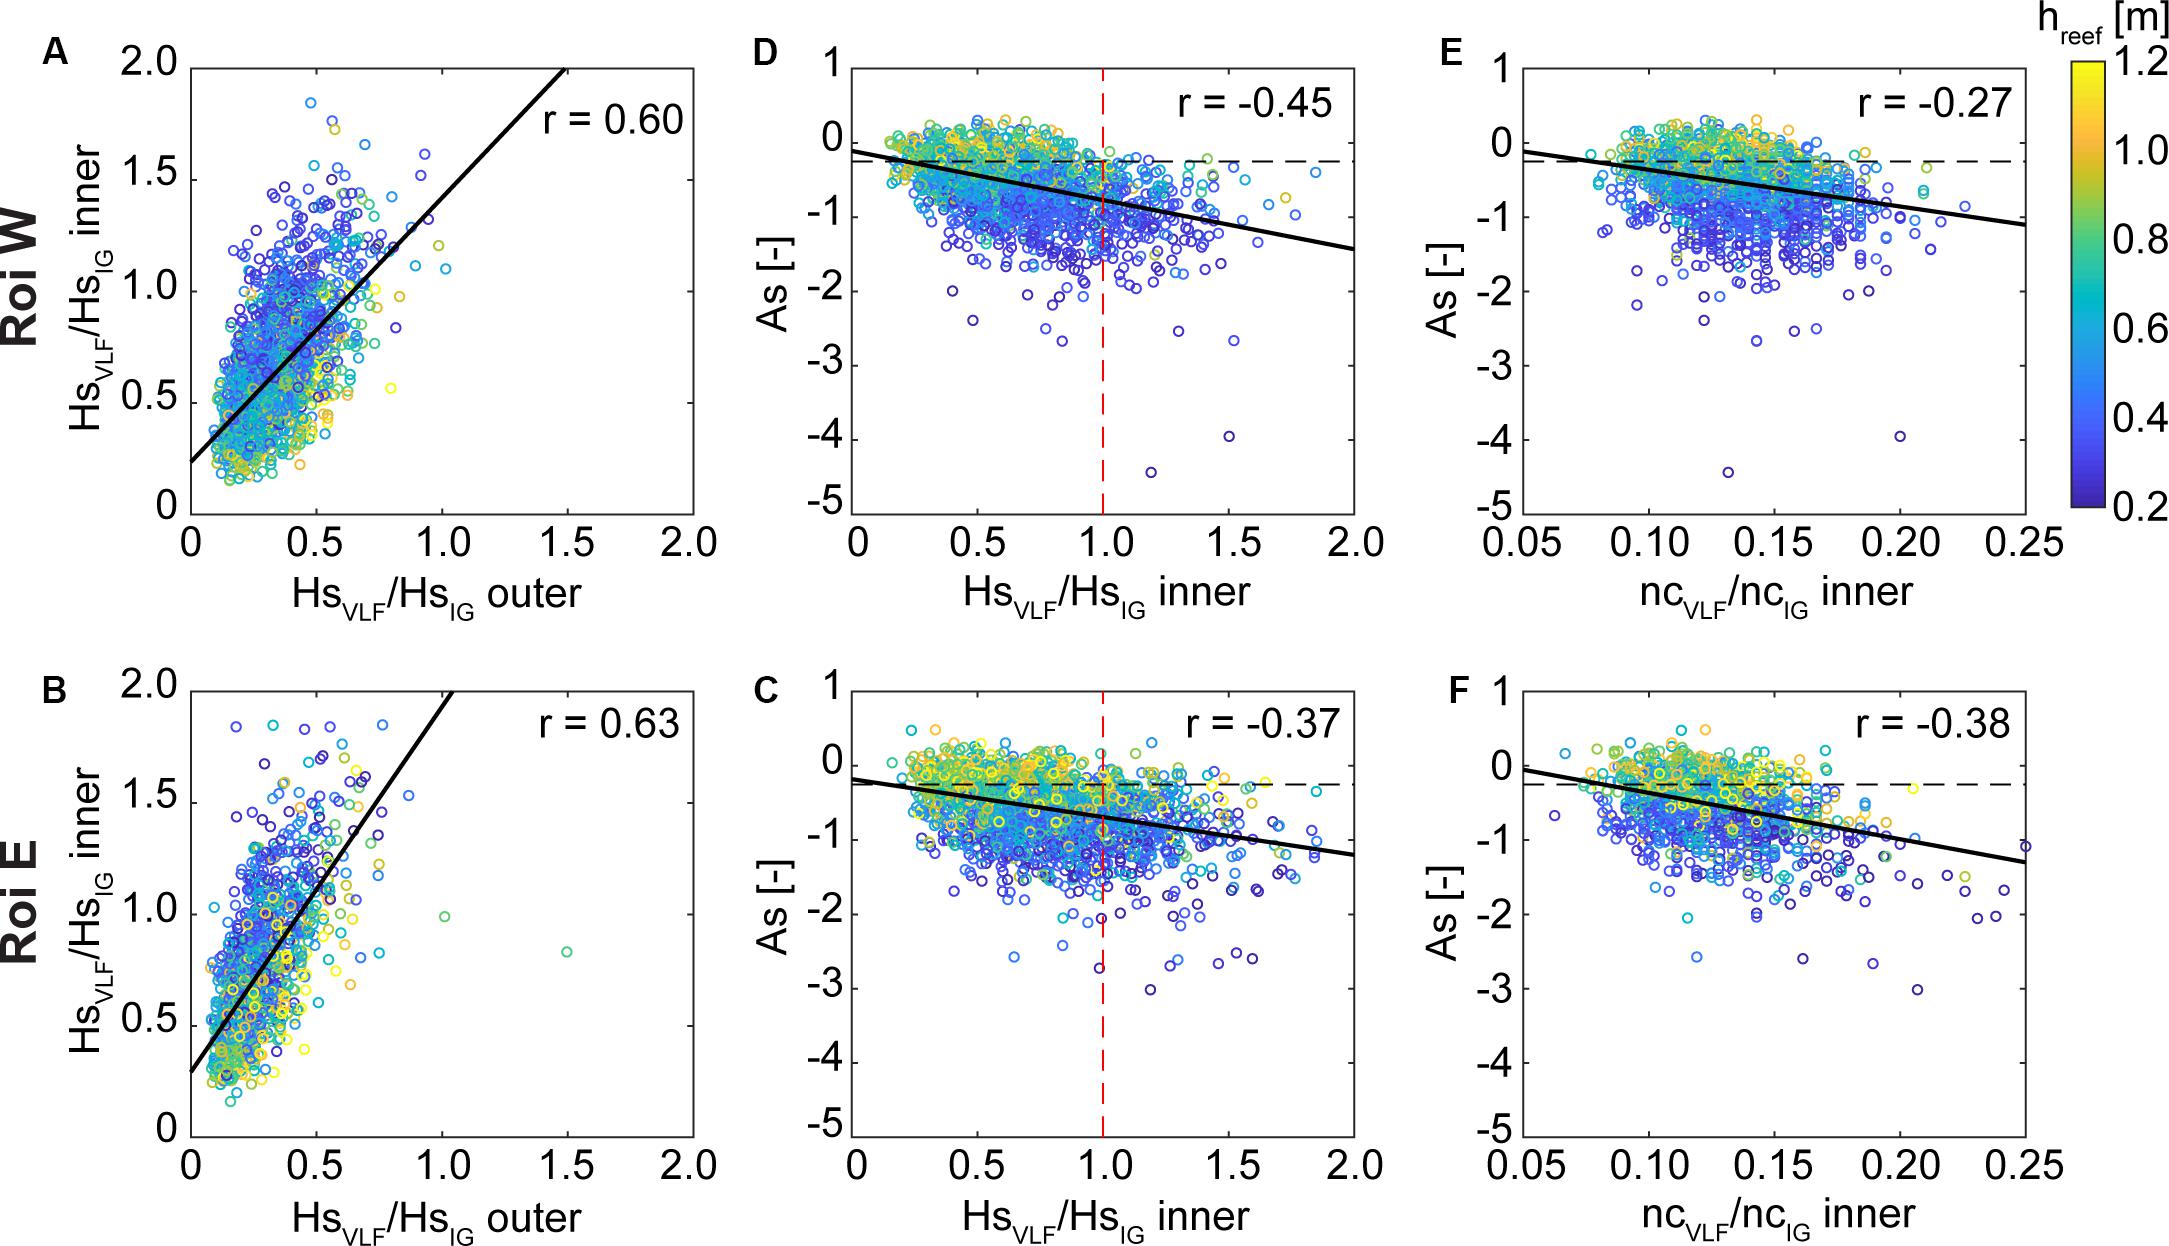
Figure 9. Relationship between very-low-frequency (“VLF”) wave energy and resulting nearshore infragravity (“IG”) wave asymmetry on the Roi-Namur W (Top) and Roi-Namur E (Bottom) reef flats. Color-scale for all panels is the mean reef-flat submergence, hreef. (A,B) Relationship between the VLF and IG wave height ratio (HsVLF/HsIG) on the outer and inner reef flat. (C,D) Inner reef-flat IG wave asymmetry according to VLF and IG wave height ratio. The threshold of HsVLF/HsIG = 1 is indicated by the red dashed line, and the IG bore criterion As = –0.25 is indicated by the black dashed line. (E,F) Inner reef-flat IG wave asymmetry according to ratio of number of VLF wave crests to number of IG wave crests (ncVLF/ncIG), cataloged from each individual burst record. The IG bore criterion As = –0.25 is indicated by the black dashed line. For each panel, the correlation coefficient, r, is given (corresponding p < 0.005 for all; degrees of freedom = 1920 for Roi W and 1,323 for Roi E), as well as a linear regression (black line) using an iteratively reweighted least squares with bisquare weighting, to show the trend.
To quantify IG wave-wave capture, we used the ratio of number of individual VLF wave crests to number of individual IG wave crests, ncVLF/ncIG, within a given burst record; with increasing IG wave merging, the number of IG wave crests approaches the number of VLF wave crests toward shore (e.g., Figures 8B–D, 9B–D). With increasing ncVLF/ncIG, the IG waves on the inner reef flat were increasingly pitched onshore (negatively asymmetrical; Figures 9E,F). This suggests that larger VLF waves result in more bore-like IG waves and also enhance IG wave-wave capture over reef flats, but it is unclear if these two phenomenon are linked. Lower hreef is likely also an important control on the degree of IG wave asymmetry, as greater bottom friction may cause the shoreward-propagating IG wave to rapidly decelerate, resulting in a steepening of the wave leading edge. Lower hreef may also facilitate more frequent wave-wave captures in the nearshore, as has been observed on plane beaches (Stringari and Power, 2019).
Conclusion
In situ wave observations from 7 different fringing reef flats of varying geomorphologies are presented to evaluate under what conditions low-frequency waves occur and what factors influence their asymmetry and skewness (Table 2). Our observations from natural environments demonstrate that fore-reef slope and reef-flat submergence are fundamental controls on subsequent reef flat IG and VLF waves, supporting previous findings from modeling and laboratory studies (Yao et al., 2018; Chen et al., 2019; Masselink et al., 2019). In general, steeper fore-reef slopes and lower reef-flat submergence result in larger IG reef-flat waves that are more pitched onshore (negatively asymmetrical) and peaked (positively skewed). Our results also highlight the importance of reef-flat width and slope as morphological controls on reef-flat IG wave heights, asymmetry, and skewness; these aspects of reef-flat geometries have also been shown to be important in shoreline runup (Quataert et al., 2015; Pearson et al., 2017). Though the Kwajalein reefs had less steep fore-reefs than the Roi-Namur sites, they had the largest IG waves relative to offshore wave forcing and reef flat water levels, and these were also the narrowest reef flats. The Kwajalein reef-flat IG bores were also strongly skewed, which may be due to the steeper reef-flat bed slope. It is unclear if fore-reef slope is important in the resulting irregularity of IG waves. Comparing our two reefs with similar reef-flat widths during approximately equivalent incident waves and reef-flat water levels, the site with a much steeper fore-reef (Roi-Namur W) had more pitched-onshore IG waves in the majority (76%) of cases compared to the site with a gentler fore-reef slope (Lahaina), however, these sites also had different bed roughnesses.
We observed IG wave-wave capture leading to large, asymmetrical bores at the shoreline. Increasing VLF wave energy was associated with more negatively asymmetrical IG waves, particularly at lower reef submergence. In addition, more frequent IG wave-wave capture was correlated with more pitched-onshore IG waves. Although the link between these two phenomena remains unclear, a similar phenomenon has been reported for plane beaches, whereby IG wave motions enhance SS bore-merging in the surf zone. Thus, we posit that VLF waves over reef flats may facilitate IG bore merging, and this may lead to larger, more pitched-onshore bores at the shoreline.
It is important to understand how low-frequency waves propagate and evolve over reef flats, as these waves can not only dominate at the shoreline, but as they evolve into increasingly irregular waveforms, these bores play a critical role in extreme shoreline events such as large runup, island overwash, and subsequent flooding during large wave events (Nwogu and Demirbilek, 2010; Roeber and Bricker, 2015; Shimozono et al., 2015; Ning et al., 2019). There is increasing evidence that bore-bore capture over natural beaches governs the majority of extreme shoreline runup and breaking wave heights (García-Medina et al., 2017; Bergsma et al., 2019; Stringari and Power, 2019). Given our observations, we hypothesize that IG bore-bore capture over reef flats may play an equally important role in shoreline hazards for reef-lined coasts.
Data Availability Statement
The datasets analyzed in this study can be found in the USGS Cross-Reef Wave and Water Level Database at https://doi.org/10.5066/P9RYN5NH.
Author Contributions
OC performed the analyses and wrote the manuscript with CS. KR assisted with data collection, processing, and evaluation.
Funding
This work was funded by the U.S. Geological Survey’s Coastal/Marine Hazards and Resources Program and the U.S. Department of Defense’s Strategic Environmental Research and Development Program.
Conflict of Interest
The authors declare that the research was conducted in the absence of any commercial or financial relationships that could be construed as a potential conflict of interest.
Acknowledgments
We would like to thank the US Army-Kwajalein Atoll and the University of Western Australia for their support of this project. We also thank M. Buckley, C. Johnson, J. Logan, T. Reiss, J. Logan, and Captain Joe Reich for their field work support. We are grateful to J. Logan and K. Cumming for their help with bathymetric profile processing. Any use of trade, firm, or product names is for descriptive purposes only and does not imply endorsement by the U.S. Government.
Footnotes
References
Bayliss-Smith, T. P. (1988). The role of hurricanes in the development of reef islands, Ontong Java Atoll, Solomon Islands. Geogr. J. 154, 377–391. doi: 10.2307/634610
Bergsma, E. W. J., Blenkinsopp, C. E., Martins, K., Almar, R., and Melo de Almeida, L. P. (2019). Bore collapse and wave run-up on a sandy beach. Cont. Shelf Res. 174, 132–139. doi: 10.1016/j.csr.2019.01.009
Bertin, X., de Bakker, A., van Dongeren, A., Coco, G., Andre, G., Ardhuin, F., et al. (2018). Infragravity waves: from driving mechanisms to impacts. Earth Sci. Rev. 177, 774–799.
Buckley, M. L., Lowe, R. J., Hansen, J. E., van Dongeren, A. R., and Storlazzi, C. D. (2018). Mechanisms of wave-driven water level variability on reef-fringed coastlines. J. Geophys. Res. Oceans 123, 3811–3831. doi: 10.1029/2018JC013933
Chen, H., Jiang, D., Tang, Z., and Mao, H. (2019). Evolution of irregular wave shape over a fringing reef flat. Ocean Eng. 192, 106544. doi: 10.1016/j.oceaneng.2019.106544
Cheriton, O. M., Storlazzi, C. D., and Rosenberger, K. J. (2016). Observations of wave transformation over a fringing coral reef and the importance of low-frequency waves and offshore water levels to runup, overwash, and coastal flooding. J. Geophys. Res. Oceans 121, 3121–3140. doi: 10.1002/2015JC011231
Elgar, S., Gallagher, E. L., and Guza, R. T. (2001). Nearshore sandbar migration. J. Geophys. Res. Oceans 106, 11623–11627. doi: 10.1029/2000JC000389
Etienne, S., and Terry, J. P. (2012). Coral boulders, gravel tongues and sand sheets: features of coastal accretion and sediment nourishment by cyclone tomas (March 2010) on Taveuni Island. Fiji. Geomorph. 175-176, 54–65. doi: 10.1016/j.geomorph.2012.06.018
Falter, J. L., Atkinson, M. J., and Merrifield, M. A. (2004). Mass-transferlimitation of nutrient uptake by a wave-dominated reef flat community. Limnol. Oceanogr. 49, 1820–1831. doi: 10.4319/lo.2004.49.5.1820
García-Medina, G., Özkan-Haller, H. T., Holman, R. A., and Ruggiero, P. (2017). Large runup controls on a gently sloping dissipative beach. J. Geophys. Res. Oceans 122, 5998–6010. doi: 10.1002/2017JC012862
Gawehn, M., van Dongeren, A., van Rooijen, A., Storlazzi, C. D., Cheriton, O. M., and Reniers, A. (2016). Identification and classification of very low frequency waves on a coral reef flat. J. Geophys. Res. Oceans 121, 7560–7574. doi: 10.1002/2016JC011834
Grasso, F., Michallet, H., and Barthélemy, E. (2011). Sediment transport associated with morphological beach changes forced by irregular asymmetric, skewed waves. J. Geophys. Res. Oceans 116:C03020. doi: 10.1029/2010JC006550
Hoefel, F., and Elgar, S. (2003). Wave-induced sediment transport and sandbar migration. Science 229, 1885–1887. doi: 10.1126/science.1081448
Huntley, D. A., and Bowen, A. J. (1975). “Comparison of the hydrodynamics of steep and shallow beaches,” in Nearshore Sediment Dynamics and Sedimentation, eds J. R. Hails and A. Carr (London: Wiley), 69–109.
Kench, P. S., Nichol, S. L., Smithers, S. G., McLean, R. F., and Brander, R. W. (2008). Tsunami as agents of geomorphic change in mid-ocean reef islands. Geomorphology 95, 361–383. doi: 10.1016/j.geomorph.2007.06.012
Kenyon, K., Sheres, D., and Bernstein, R. (1983). Short waves on long waves. J. Geophys. Res. 88, 7589–7596. doi: 10.1029/JC088iC12p07589
Longuet-Higgins, M. S., and Stewart, R. W. (1960). Changes in the form of short gravity waves on long waves and tidal currents. J. Fluid Mech. 8, 565–583. doi: 10.1017/S0022112060000803
Lowe, R. J., Falter, J. L., Bandet, M. D., Pawlak, G., Atkinson, M. J., Monismith, S. G., et al. (2005). Spectral wave dissipation over a barrier reef. J. Geophys. Res. Oceans 110:C04001. doi: 10.1029/2004JC002711
Masselink, G., Tuck, M., McCall, R., van Dongeren, A., Ford, M., and Kench, P. (2019). Physical and numerical modeling of infragravity wave generation and transformation on coral reef platforms. J. Geophys. Res. Oceans 124, 1410–1433. doi: 10.1029/2018JC014411
Michallet, H., Cienfuegos, R., Barthélemy, E., and Grasso, F. (2011). Kinematics of waves propagating and breaking on a barred beach. Eur. J. Mech. B 30, 624–634. doi: 10.1016/j.euromechflu.2010.12.004
Ning, Y., Liu, W., Sun, Z., Zhao, X., and Zhang, Y. (2019). Parametric study of solitary wave propagation and runup over fringing reefs based on Boussinesq wave model. J. Marine Sci. 24, 512–525. doi: 10.1007/s00773-018-0571-571
Nwogu, O., and Demirbilek, Z. (2010). Infragravity wave motions and runup over shallow fringing reefs. J. Waterway Port Coast. Ocean Eng. 136, 295–305. doi: 10.1061/(ASCE)WW.1943-5460.0000050
Pearson, S. G., Storlazzi, C. D., van Dongeren, A. R., Tissier, M. F. S., and Reniers, A. J. H. M. (2017). A Bayesian-based system to assess wave-driven flooding hazards on coral reef-lined coasts. J. Geophys. Res. Oceans 122, 10099–10117. doi: 10.1002/2017JC0132304
Péquignet, A. C. N., Becker, J. M., Merrifield, M. A., and Aucan, J. (2009). Forcing of resonant modes on a fringing reef during tropical storm Man-Yi. Geophys. Res. Lett. 36:L03607. doi: 10.1029/2008GL036259
Peregrine, D. H. (1966). Calculations of the development of an undular bore. J. Fluid Mech. 25, 321–330. doi: 10.1017/S0022112066001678
Phillips, O. M. (1981). The dispersion of short wavelets in the presence of a dominant long wave. J. Fluid Mech. 107, 465–485. doi: 10.1017/S0022112081001869
Pomeroy, A., Lowe, R., Symonds, G., van Dongeren, A., and Moore, C. (2012). The dynamics of infragravity wave transformation over a fringing reef. J. Geophys. Res. 117:C11022. doi: 10.1029/2012JC008310
Pomeroy, A. W. M., van Dongeren, A., Lowe, R. J., van Thiel de Vries, J. S. M., and Roelvink, J. (2012). Low frequency wave resonance in fringing reef environments. Proc. Int. Conf. Coastal Eng. 33, 1–10. doi: 10.9753/ice.v33.currents.25
Pomeroy, A. W. M., Lowe, R. J., Dongeren, A. R., Ghisalberti, M., Bodde, W., and Roelvink, D. (2015). Spectral wave-driven sediment transport across a fringing reef. Coast. Eng. 98, 78–94. doi: 10.1016/j.coastaleng.2015.01.005
Quataert, E., Storlazzi, C. D., van Rooijen, A., Cheriton, O. M., and van Dongeren, A. (2015). The influence of coral reefs and climate change on wave-driven flooding of tropical coastlines. Geophys. Res. Lett. 42, 6407–6415. doi: 10.1002/2015GL064861
Quiroga, P. D., and Cheung, K. F. (2013). Laboratory study of solitary-wave transformation over bed-form roughness on fringing reefs. Coast. Eng. 80, 35–48. doi: 10.1016/j.coastaleng.2013.05.002
Roeber, V., and Bricker, J. D. (2015). Destructive tsunami-like wave generated by surf beat over a coral reef during Typhoon Haiyan. Nat. Comm. 6:7854. doi: 10.1038/ncomms8854
Ruessink, B. G., van den Berg, T. J. J., and van Rijn, L. C. (2009). Modeling sediment transport beneath skewed asymmetric waves above a plane bed. J. Geophys. Res. Oceans 114:C11021. doi: 10.1029/2009JC005416
Scoffin, T. (1993). The geological effects of hurricanes on coral reefs and the interpretation of storm deposits. Coral Reefs 12, 203–221. doi: 10.1007/BF00334480
Sénéchal, N., Dupuis, H., Bonneton, P., Howa, H., and Pedreros, R. (2001). Observation of irregular wave transformation in the surf zone over a gently sloping sandy beach on the French Atlantic coastline. Oceanol. Acta 324, 545–556. doi: 10.1016/S0399-1784(01)01171-9
Shimozono, T., Tajima, Y., Kennedy, A. B., Nobuoka, H., Sasaki, J., and Shinji, S. (2015). Combined infragravity wave and sea-swell runup over fringing reefs by super typhoon Haiyan. J. Geophys. Res. Oceans 120, 4463–4486. doi: 10.1002/2015JC010760
Silva, P. A., Abreu, T., van der, A. D., Sancho, F., Ruessink, B. G., van der Werf, J., et al. (2011). Sediment transport in nonlinear skewed oscillatory flows: transkew experiments. J. Hydraul. Res. 49, 72–80. doi: 10.1080/00221686.2011.592681
Stoddart, D. R. (1971). “Coral reefs and islands and catastrophic storms,” in Applied Coastal Geomorphology, ed. J. A. Steers (London: Palgrave Macmillan), 155–197. doi: 10.1007/978-1-349-15424-1_10
Stringari, C. E., and Power, H. E. (2019). Quantifying bore-bore capture on natural beaches. arXiv [Preprint]. Available online at: https://arxiv.org/abs/1909.11279 (accessed October 28, 2019).
Tissier, M., Bonneton, P., and Ruessink, G. (2017). Infragravity waves and bore merging. Proc. Coast. Dyn. 209, 451–460.
Tissier, M. F. S., Bonneton, P., Michallet, H., and Ruessink, B. G. (2015). Infragravity-wave modulation of short-wave celerity in the surf zone. J. Geophys. Res. Oceans 120, 6799–6814. doi: 10.1002/2015JC010708
van Dongeren, A., Battjes, J., Janssen, T., van Noorloos, J., Steenhauer, K., Steenbergen, G., et al. (2007). Shoaling and shoreline dissipation of low-frequency waves. J. Geophys. Res. 112:C02011. doi: 10.1029/2006JC003701
van Dongeren, A., Lowe, R., Pomeroy, A., Trang, D. M., Roelvink, D., Symonds, G., et al. (2013). Numerical modeling of low-frequency wave dynamics over a fringing coral reef. Coast. Eng. 73, 178–190. doi: 10.1016/j.coastaleng.2012.11.004
Keywords: reef flat, infragravity waves, wave asymmetry, wave skewness, bore merging, water levels
Citation: Cheriton OM, Storlazzi CD and Rosenberger KJ (2020) In situ Observations of Wave Transformation and Infragravity Bore Development Across Reef Flats of Varying Geomorphology. Front. Mar. Sci. 7:351. doi: 10.3389/fmars.2020.00351
Received: 18 November 2019; Accepted: 27 April 2020;
Published: 03 June 2020.
Edited by:
Hajime Kayanne, The University of Tokyo, JapanReviewed by:
Charles Alan Jacoby, St. Johns River Water Management District, United StatesAnne-Christine Pequignet, Met Office, United Kingdom
Copyright © 2020 Cheriton, Storlazzi and Rosenberger. This is an open-access article distributed under the terms of the Creative Commons Attribution License (CC BY). The use, distribution or reproduction in other forums is permitted, provided the original author(s) and the copyright owner(s) are credited and that the original publication in this journal is cited, in accordance with accepted academic practice. No use, distribution or reproduction is permitted which does not comply with these terms.
*Correspondence: Olivia M. Cheriton, b2NoZXJpdG9uQHVzZ3MuZ292