 Diva J. Amon1*
 Brian R. C. Kennedy2
 Kasey Cantwell3
 Kelley Suhre3
 Deborah Glickson4
 Timothy M. Shank5
 Randi D. Rotjan2
- 1Department of Life Sciences, Natural History Museum, London, United Kingdom
- 2Department of Biology, Boston University, Boston, MA, United States
- 3NOAA Office of Ocean Exploration and Research, Silver Spring, MD, United States
- 4National Academy of Sciences, Engineering, and Medicine, Washington, DC, United States
- 5Department of Biology, Woods Hole Oceanographic Institution, Woods Hole, MA, United States
Marine debris is a growing problem in the world’s deep ocean. The naturally slow biological and chemical processes operating at depth, coupled with the types of materials that are used commercially, suggest that debris is likely to persist in the deep ocean for long periods of time, ranging from hundreds to thousands of years. However, the realized scale of marine debris accumulation in the deep ocean is unknown due to the logistical, technological, and financial constraints related to deep-ocean exploration. Coordinated deep-water exploration from 2015 to 2017 enabled new insights into the status of deep-sea marine debris throughout the central and western Pacific Basin via ROV expeditions conducted onboard NOAA Ship Okeanos Explorer and RV Falkor. These expeditions included sites in United States protected areas and monuments, other Exclusive Economic Zones, international protected areas, and areas beyond national jurisdiction. Metal, glass, plastic, rubber, cloth, fishing gear, and other marine debris were encountered during 17.5% of the 188 dives from 150 to 6,000 m depth. Correlations were observed between deep-sea debris densities and depth, geological features, and distance from human-settled land. The highest densities occurred off American Samoa and the main Hawaiian Islands. Debris, mostly consisting of fishing gear and plastic, were also observed in most of the large-scale marine protected areas, adding to the growing body of evidence that even deep, remote areas of the ocean are not immune from human impacts. Interactions with and impacts on biological communities were noted, though further study is required to understand the full extent of these impacts. We also discuss potential sources and long-term implications of this debris.
Introduction
The deep ocean is often perceived as a remote wilderness, however, it has been a repository for debris for hundreds of years (Ramirez-Llodra et al., 2011). The intentional disposal of solid non-natural material began in earnest toward the end of the 18th century, progressing to pharmaceuticals, radioactive waste, munitions, and even larger structures including deliberate sinking of wrecks, which ceased in the late 20th century when the London Convention was enacted to control pollution of the ocean caused by dumping (Ramirez-Llodra et al., 2011). Since 2012, the International Convention for the Prevention of Pollution from Ships (MARPOL) Annex 5 has prohibited the discharge of all garbage into the sea from ships (excluding food wastes, identified cargo residues, animal carcasses, and identified non-harmful cleaning agents, additives and cargo residues entrained in washwater). However, debris has continued to accrue in the deep ocean via both illegal intentional means and the accidental influx from rivers, coasts, and vessels (Schmidt et al., 2017).
Despite the remoteness and harsh conditions of the deep ocean, there is a growing literature on the reach and impact of deep macro debris across all ocean basins. For example, in the Atlantic and western Indian Oceans, debris was observed in all deep locations surveyed, even those far from the coast. Indian-Ocean sites were dominated by fishing gear whereas the North Atlantic Ocean hosted a greater variety of marine debris (Pham et al., 2014; Woodall et al., 2015). Similarly, many studies in the Mediterranean deep sea have also documented a diversity of debris, showing that plastic (e.g., bags and bottles), glass, and metal (e.g., tins and cans) were the most prevalent forms (Galil et al., 1995; Galgani et al., 2000; Ramirez-Llodra et al., 2011; Pham et al., 2014; Quattrini et al., 2015; Cau et al., 2018). Even in the Arctic, 86% of bottom trawls contained plastic macros debris (Grøsvik et al., 2018).
An extensive global study, with emphasis on the northwestern Pacific Ocean, found that 33% of macros debris below 2,000 m were plastic, of which 89% were single-use items, and below 6,000 m, this increased to 52% plastic and 92% single-use plastic (Chiba et al., 2018). This study also recorded the deepest observation of marine debris known (10,898 m in the Mariana Trench) (Chiba et al., 2018). Other studies in the Pacific Ocean revealed metal items (including shipping containers), plastics, and miscellaneous items occurring at depth (Keller et al., 2010; Watters et al., 2010; Miyake et al., 2011; Schlining et al., 2013). Additionally, this substantial increase in observations has revealed that debris accumulates on geological seafloor features such as seamounts, submarine canyons, trenches, and depressions (Miyake et al., 2011; Schlining et al., 2013; Pham et al., 2014; Woodall et al., 2015).
While this topic has become more mainstream and the scale of the problem shown to be global, there is still little known about deep-sea macro debris in many ocean areas, including the central and western Pacific Ocean. This includes over 1.9 million km2 of land, coral reef, ocean, and maritime heritage resources that have some degree of protection, such as United States Marine National Monuments and Sanctuaries, and the Phoenix Islands Protected Area (PIPA). There has been little to no deep-sea exploration and research in these areas due to the vastness, remoteness, and lack of financial, technical, and technological capacity. In an effort to remedy this issue, the NOAA Office of Ocean Exploration and Research (NOAA OER) and partners launched the Campaign to Address the Pacific monument Science, Technology, and Ocean Needs (CAPSTONE) in 2015 (Leonardi et al., 2018; Kennedy et al., 2019). This multi-year scientific effort explored the deep-water areas of the central and western Pacific Ocean in and around United States marine protected areas (MPAs) that were of high interest for research and management (Cantwell et al., 2018), and included international partnerships to explore areas near US waters (McKinnie et al., 2018). CAPSTONE provided a foundation of publicly accessible baseline data from the central and western Pacific, including information on anthropogenic impacts encountered in the deep ocean.
In this study, we explored the density and type of benthic macro debris in the deep central and western Pacific Ocean, including in large-scale protected areas. We also tested whether debris density and type were correlated with depth, geological features and distance from settled land. Potential impacts of debris on deep-sea communities were also noted. From the diversity and density of debris encountered, we also hypothesized potential sources of debris. Finally, we discuss long-term implications of deep-sea debris with a view to the effective management and monitoring of these expansive and near-pristine habitats.
Materials and Methods
Remotely Operated Vehicle Surveys From the NOAA Ship Okeanos Explorer
From 2015 to 2017, mission teams onboard the NOAA Ship Okeanos Explorer conducted 12 remotely operated vehicle (ROV) expeditions in the central and western Pacific as part of CAPSTONE (Figure 1 and Supplementary Tables 1–3). During these expeditions, 187 ROV dives conducting exploratory benthic and midwater surveys were conducted (Kennedy et al., 2019). A subsample of 171 ROV surveys, excluding special purpose dives such as exclusively water-column surveys or dives that were aborted before the ROV reached the seafloor, was used for this analysis. These 171 dives were analyzed to assess benthic macro debris over 29.3 km2 of seafloor from 233 to 6,000 m, using the 6,000 m-rated dual-body system, ROV Deep Discoverer (D2), and camera sled, Seirios (Supplementary Table 1). Seirios was tethered to the ship with a standard oceanographic armored, fiber-optic cable (1.73 cm diameter) (Gregory et al., 2016). The ROV D2 was linked to Seirios with a neutrally buoyant tether, isolating the ROV from surface ship’s motion and allowing precise maneuvering in precipitous topography. The ROV D2 used two high-definition (HD) video cameras (Insite Zeus Plus and Mini Zeus) for scientific observations, but there were several additional cameras used for piloting that were not normally recorded. Paired lasers (10 cm apart), mounted on the fixed HD video camera, were used for scaling objects, although these mostly remained switched off. Seirios carried an additional Insite Zeus Plus camera for a wide area view of the seafloor. Both vehicles were equipped with high powered LED lighting systems that provided more than 272,000 lumens of light combined (Gregory et al., 2016). During ROV exploration, the cameras were generally set on wide-angle view, but zooms were frequently conducted to obtain detailed imagery (stills and video) to facilitate taxonomic identification.
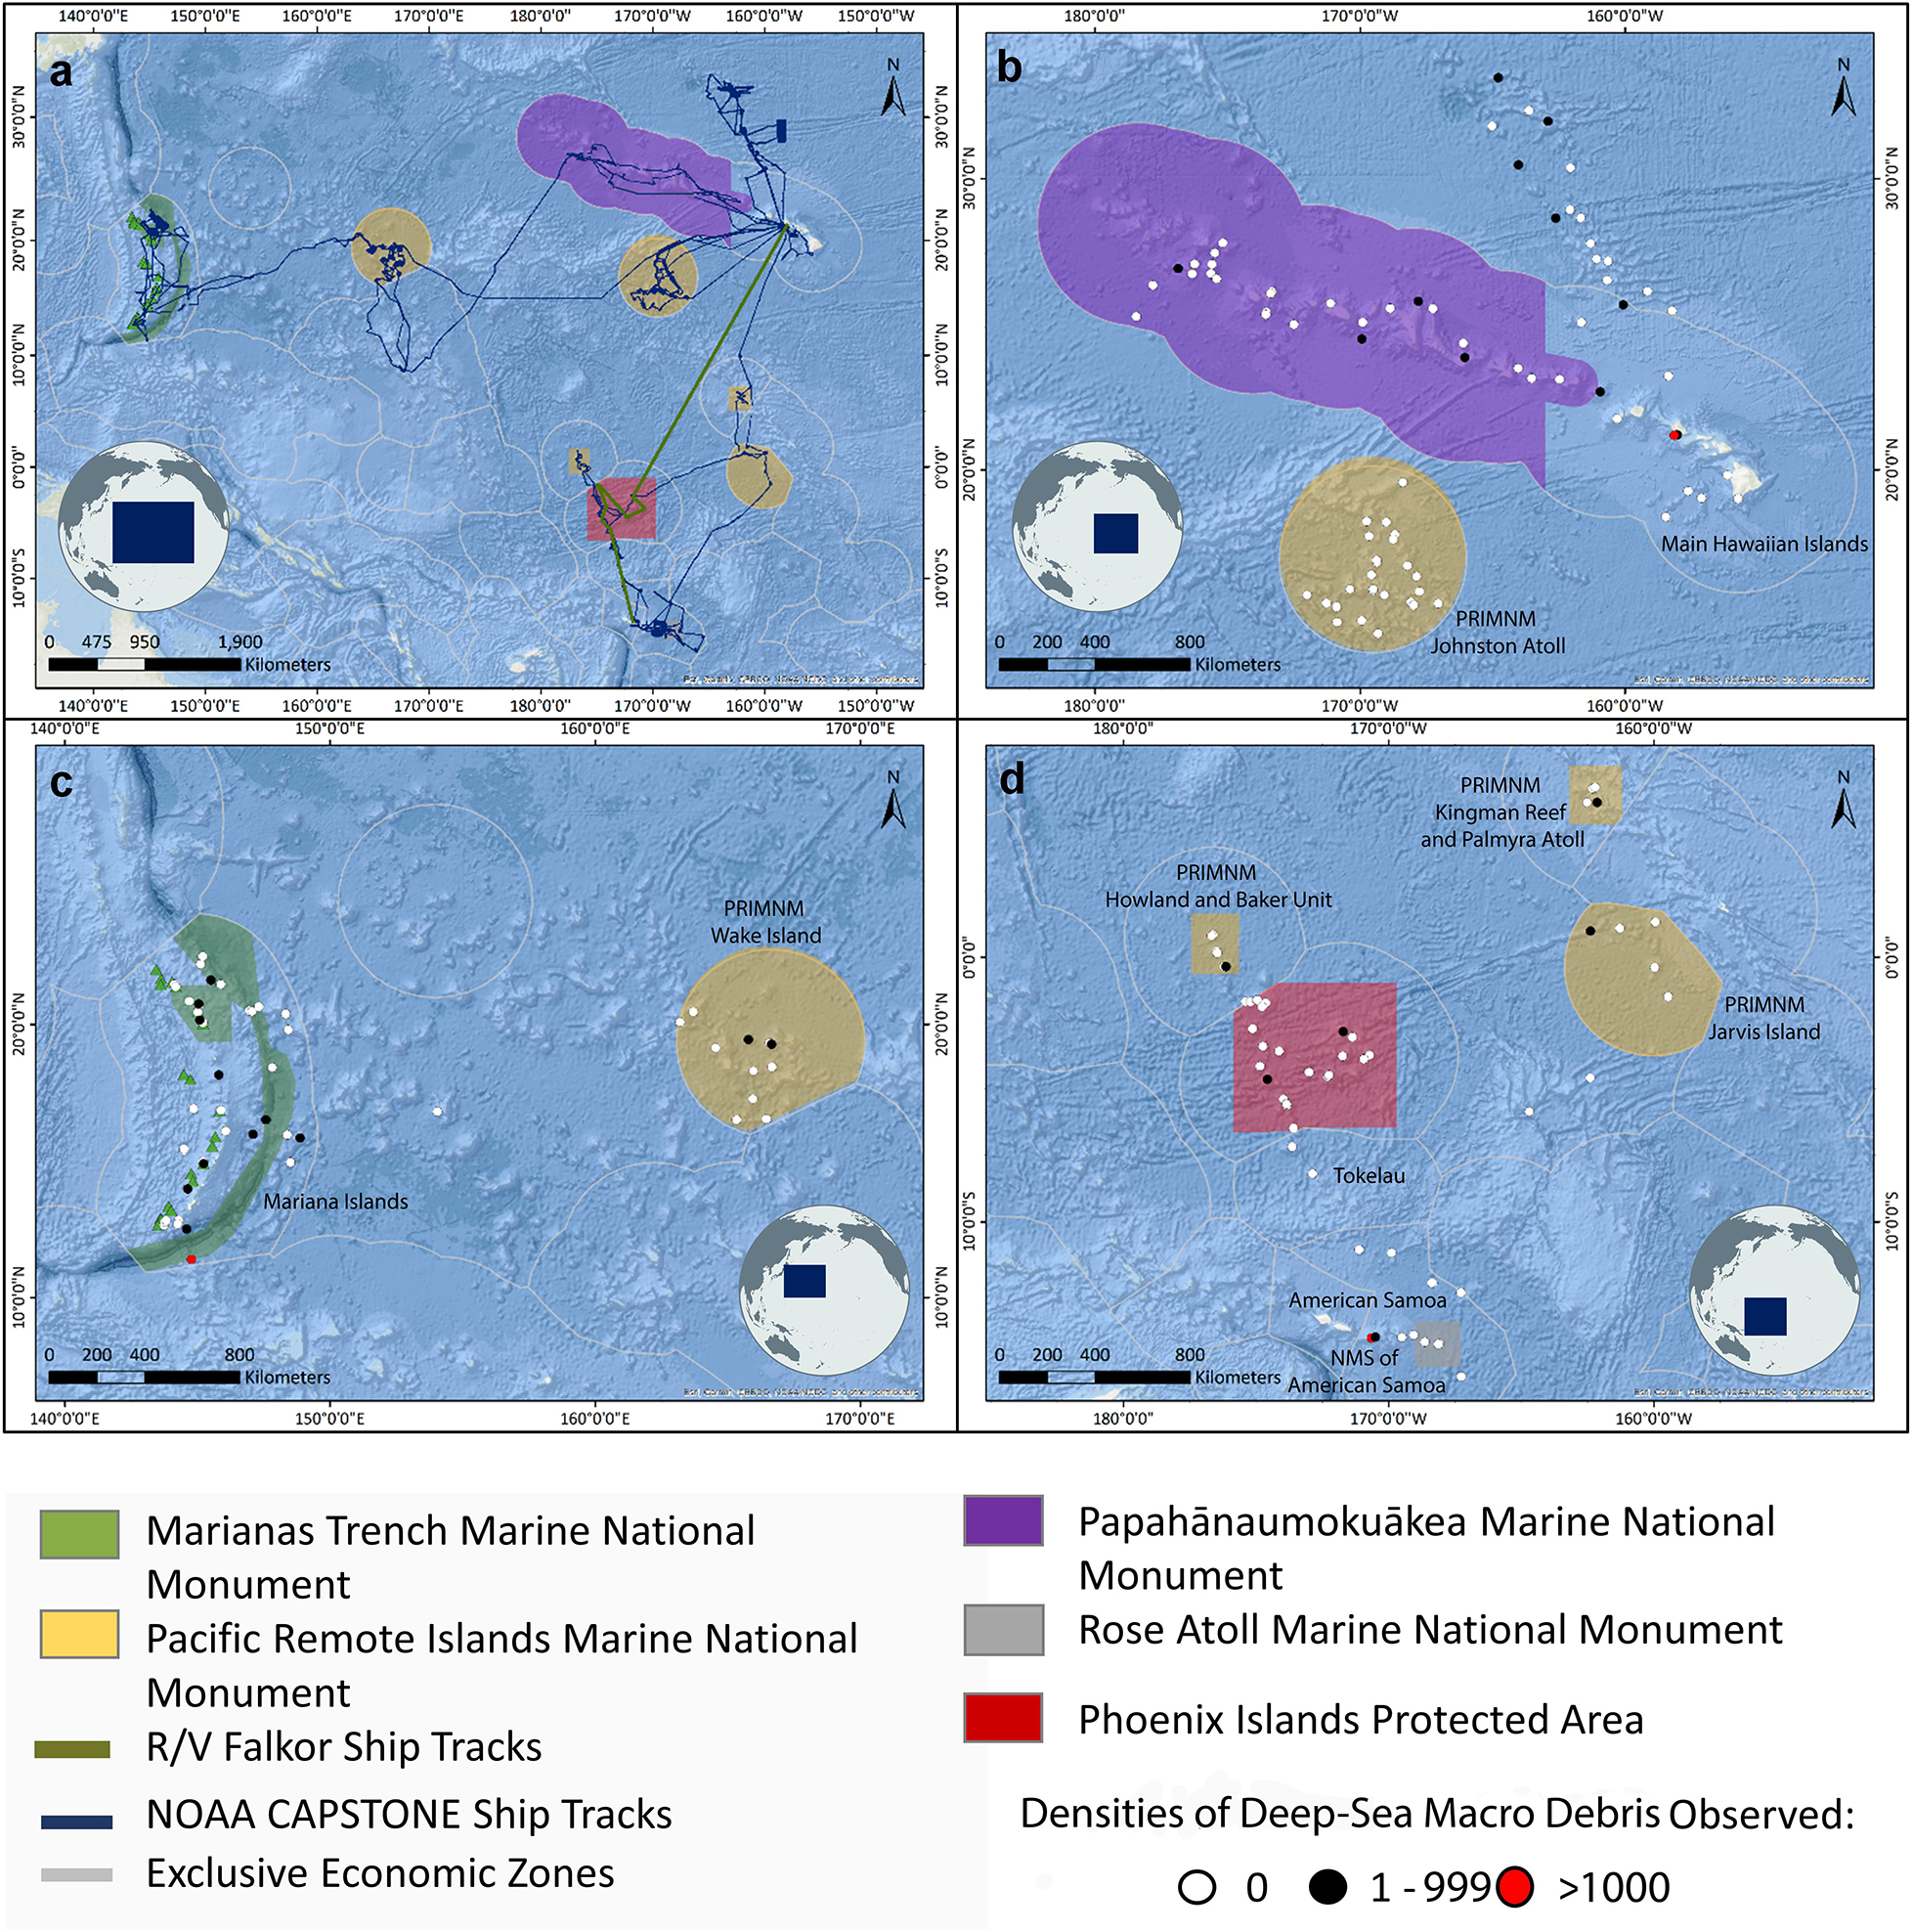
Figure 1. Estimated deep-sea debris densities (items km–2) from observations by ROVs in the central and western Pacific Ocean. (a) General footprint of NOAA Ship Okeanos Explorer cruises, adapted from Kennedy et al., 2019. (b) Estimated deep-sea debris densities in Papahānaumokuākea Marine National Monument, the main Hawaiian Islands, ABNJ, and the Johnston Atoll Unit of PRIMNM; (c) the Mariana Islands, Marianas Trench Marine National Monument, and the Wake Island Unit of PRIMNM; (d) American Samoa, NMS of American Samoa, Phoenix Islands Protected Area, Tokelau, ABNJ, and the Howland and Baker Islands, Kingman Reef and Palmyra Atoll, and Jarvis Island Units of PRIMNM. Green triangles in (c) are the volcanic unit of the Marianas Trench Marine National Monument. PRIMNM, Pacific Remote Islands Marine National Monument; NMS, National Marine Sanctuary.
Throughout the benthic portion of all ROV dives, real-time annotations were made of taxonomic identifications, geological observations, and other objects of interest. For cruises before 2017, annotations were made in a system called the “eventlog.” This telepresence-enabled system consisted of an online chat room that time stamped entry and was available to both shore-based and ship-based science participants through a high bandwidth satellite connection (Kennedy et al., 2016). With the start of the 2017 field season, NOAA transitioned to a more sophisticated real-time annotation system provided by Ocean Networks Canada called SeaScribe (Jenkyns et al., 2013; Malik et al., 2020). Both systems served the same basic function of providing a first level of annotations for the ROV video and a searchable record of what was seen throughout the dive. Internal NOAA quality-control tests did not show a significant difference in the number of annotations made between the two systems. During dive operations, the ROV D2 was operated in “exploration” mode, where the vehicles do not follow a prescribed transect or path but instead the vehicle investigates any seafloor anomalies (observed visually or in the forward-looking sonar) that Science Leads deemed of potential interest. Given that marine debris is relatively rare of the seafloor, anthropogenic items often stood out from the biology and geology, so these items were nearly always focused and zoomed on with the camera. The ROV pilots were also continually scanning for marine debris may posed an entanglement hazard, e.g., fishing gear, to the ROVs. As a result, there was a high degree of confidence that the majority of marine debris in the area that ROV D2 operated in was seen and noted.
Most ROV dives were conducted at sites that had never been explored and each varied in exploration length and depth (Supplementary Table 1). Detailed description of the ROV dive site selection process is available in Kennedy et al. (2019). The ROV D2 traversed the seafloor at a speed of approximately ∼0.1–0.3 knots. Seirios surveyed approximately 10 m above and behind D2, providing background lighting to visualize features, as well as situational awareness for the pilots and scientists. NOAA Ship Okeanos Explorer maintained position with the vehicles using dynamic positioning and tracked vehicle position relative to the ship with an ultra-short baseline tracking (USBL) system. The accuracy of the system was heavily dependent on water depth and, to a lesser degree, sea state and local bathymetry, and ranged from ∼5 to 50 m depending on conditions. Additionally, the vehicles’ motions and directions varied greatly as novel organisms or geological features were investigated, making differentiating between errors in the USBL navigation and rapid changes in vehicle position difficult.
While the ROV seafloor track did not follow a predefined transect for the purpose of this analysis, we treated the seafloor track that was visually covered by the ROV as a non-linear transect. This treatment helps to correct for some of the challenges associated with USBL navigation within the operational paradigm adopted by NOAA, which also make determining the exact area of seafloor imaged difficult. As a result, the minimum and maximum area of seafloor documented during a dive were quantified to provide a range of possible areas visualized (Kennedy et al., 2019). To accomplish this, the linear distance traveled by ROV D2 was measured by manually tracing a line of best fit based on the 1 Hz USBL navigation file provided by NOAA as part of the ROV data collection available via the OER Digital Atlas. When ROV D2 was at an altitude of 1 m, and the angle of the primary HD camera was at a 45° angle, the field of view yielded 2.7 m of seafloor horizontally across the video frame (assuming a consistent ROV heading). The field of view for the cameras on both D2 and Seirios is 65° laterally in water. Because the pilots were nearly continuously changing the heading of the vehicle while scanning the seafloor, as well as flying the vehicle at variable altitudes as the bathymetry dictated, a visual swath width of a minimum of 5 m (2.5 m on either side of the vehicle path over the bottom) and a maximum of 50 m (calculated as twice the effective length of the tether connecting ROV D2 and Seirios) was estimated. The minimum range value of 5 m corrected for the changes of altitude and heading changes. The maximum range value of 50 m estimated the effective length of the neutrally buoyant tether between ROV D2 and Seirios and assumed that D2 never moved more than 50 m quickly without having to move the ship, which controls the movement and placement of Seirios. Any move of more than 50 m was slower and would be obvious in the USBL navigation. Based on these assumptions and estimates, the area surveyed during CAPSTONE dives included the seafloor between 2.5 and 25 m on both sides of the averaged dive track. For the purposes of this study, we used the average between these two edges, hence all area estimates were based on a 25 m transect width. Additional information on CAPSTONE methods is provided in Kennedy et al. (2019).
Remotely Operated Vehicle Surveys From the RV Falkor
In October 2017, the RV Falkor, operated by the Schmidt Ocean Institute, conducted 17 ROV surveys in PIPA (FK171005) (Figure 1 and Supplementary Tables 1, 2). ROV dives were undertaken from 150 to 2,400 m (0.22–2.21 km2 seafloor surveyed) using the 4,500-m rated ROV SuBastian. ROV SuBastian was equipped with an Insite Pacific Mini Zeus HD 1080i CMOS camera for situational awareness and an Insite Zeus Plus or SULIS 4K 12× Zoom camera for science surveys (5.1–51 mm wide angle zoom lens). In addition, the vehicle hosted a Seabird FastCAT CTD Sensor (SBE49), and a Paroscientific 8000 Series Submersible Depth Sensor for measuring depth of observations (Auscavitch et al., 2019).
Similar to operations onboard the NOAA Ship Okeanos Explorer, ROV dives from the RV Falkor followed an exploratory operational paradigm without pre-defined transects resulting in similar issues estimating the range of possible seafloor area visualized, with the minimum and maximum area of seafloor documented as a result. A similar methodology to above was used when measuring the linear distance traveled by ROV SuBastian. When ROV SuBastian was at an altitude of 1 m, and the primary HD camera was at a 45° angle, the field of view yielded 2.47 m of seafloor horizontally across the video frame with an estimated visual swath width of a minimum of ∼5 m (2.5 m on either side of the vehicle path over the bottom) and a maximum of 20 m (10 m on either side of the vehicle path over the bottom). Based on these assumptions and estimates, we assumed that the area surveyed during RV Falkor dives included the seafloor between 2.5 and 10 m on both sides of the averaged dive track.
Analysis of Remotely Operated Vehicle Imagery
Macro-debris annotations, which included metadata (time, location, and depth), from 171 NOAA Ship Okeanos Explorer dives were isolated and enumerated. Marine debris records from NOAA Ship Okeanos Explorer real-time annotations systems were extracted by reviewing the records for each dive. This data was then used to locate the video segments containing debris, which were reviewed to find the debris record. During dives conducted from the RV Falkor, marine debris was not recorded in real time. Instead, all ROV imagery was reviewed post-cruise, explicitly for marine debris. The criteria used for identifying macro debris in ROV video was any items of anthropogenic origin and of a size greater than 2 cm in maximum dimension.
Imagery was then viewed for each debris annotation to (a) confirm the observation and (b) capture a frame (Supplementary Table 3 and Supplementary Debris Occurrences). From this imagery, information on each observation was recorded including the type of material comprising the debris: plastic, glass, metal, rubber, cloth, fishing gear and other, and interactions between debris and surrounding biology: shelter, encrustation, entanglement, and multiple interactions. Plastic debris was further categorized into single-use products and other plastics, following the methodology of Chiba et al. (2018). Observed debris was categorized as either light or heavy based on their relative tendency to float or be transported horizontally before reaching the seafloor. Metal and glass were labeled as heavy items while plastic, fishing gear, cloth, rubber and other types of debris were coded as light. The distance of the debris from human settlement was also noted in order to assess the impact on the density of seafloor marine debris. We defined a settlement as any piece of land with more than 1,000 people in residence at any point since the 1920s. Population numbers were sourced from various publicly available records.
The analysis of NOAA Ship Okeanos Explorer imagery was based solely on real-time annotations that were made during the dives, so it remains possible that some instances of debris were not noted by the real-time annotators, but likely only presents a small under-sampling error. Additionally, we recognize the inherent differences in the limitation of detecting specific types of trash. For example, the ability to see metal (which could be more reflective or less reflective, depending on the extent of rust) is different from plastic (which is inherently also more likely to move in the current than metal). These differences in detection could present sampling biases toward objects that were more brightly colored or reflective making them easier to spot using the ROV cameras, however this would, again, only present a small bias given the attention paid to expressly looking for debris, novel shapes and colors, as well as high-resolution camera zooms on these shapes during exploration-style ROV operations. No marine debris was collected by either ROV, therefore it was not possible to undertake further analyses such as aging or Laser Raman techniques to better characterize the plastics observed.
Statistical Analyses
Analyses of debris by the categorical geological features: islands and atolls, abyssal features (below 4,000 m), hydrothermal areas, seamounts, and banks, were undertaken. Debris occurrences relative to (1) large MPAs – Pacific Remote Islands Marine National Monument (PRIMNM) Johnston Atoll, PRIMNM Howland and Baker Unit, PRIMNM Wake Island, PRIMNM Kingman Reef and Palmyra Atoll, PRIMNM Jarvis Island, as well as Rose Atoll Marine National Monument, Mariana Trench Marine National Monument (MTMNM), Papahānaumokuākea Marine National Monument (PMNM), the National Marine Sanctuary of American Samoa (NMS of American Samoa), and PIPA; (2) Exclusive Economic Zones (EEZs) of Tokelau (New Zealand), as well as the Mariana Islands, the main Hawaiian Islands and American Samoa (United States); and (3) Areas Beyond National Jurisdiction (ABNJ), were analyzed. Non-parametric Kruskal–Wallis comparisons were used to test for significant differences between deep-sea debris densities and depth and geological features. A Mann–Whitney test was used to measure whether there was a significant difference between debris density within and outside of MPAs. We used a Pearson’s Chi-Squared test to determine whether debris observations across distances from human settlements were consistent for both heavy debris (metal and glass) and light debris (plastic, cloth, paper, lumber, and other). A p-value of 0.05 was used throughout as the criterion for statistical significance. These analyses were conducted in SYSTAT version 13.1 (Systat Software, Inc.).
Results
Deep-Sea Debris Locations
During 188 ROV dives across the central and western Pacific, there were 115 observations of marine macro debris (Table 1, Figure 1, and Supplementary Table 3 and Debris Occurrences). Deep-sea debris was encountered on 17.5% of the dives. There were no debris items recorded during dives in the Tokelau EEZ, Rose Atoll Marine National Monument, and PRIMNM Johnston Atoll (Figures 1, 3 and Table 1). The highest estimates of marine debris were observed within the United States EEZ (not within protected areas) around American Samoa and the main Hawaiian Islands (196–1,961 items km–2 and 97–965 items km–2, respectively) (Table 1). Two sites harbored the majority of debris off the main Hawaiian Islands and American Samoa and the highest abundances surveyed: CAIMAN/I-203 (44 items) and Tutaila (20 items), respectively (Supplementary Table 3 and Supplementary Debris Occurrences).
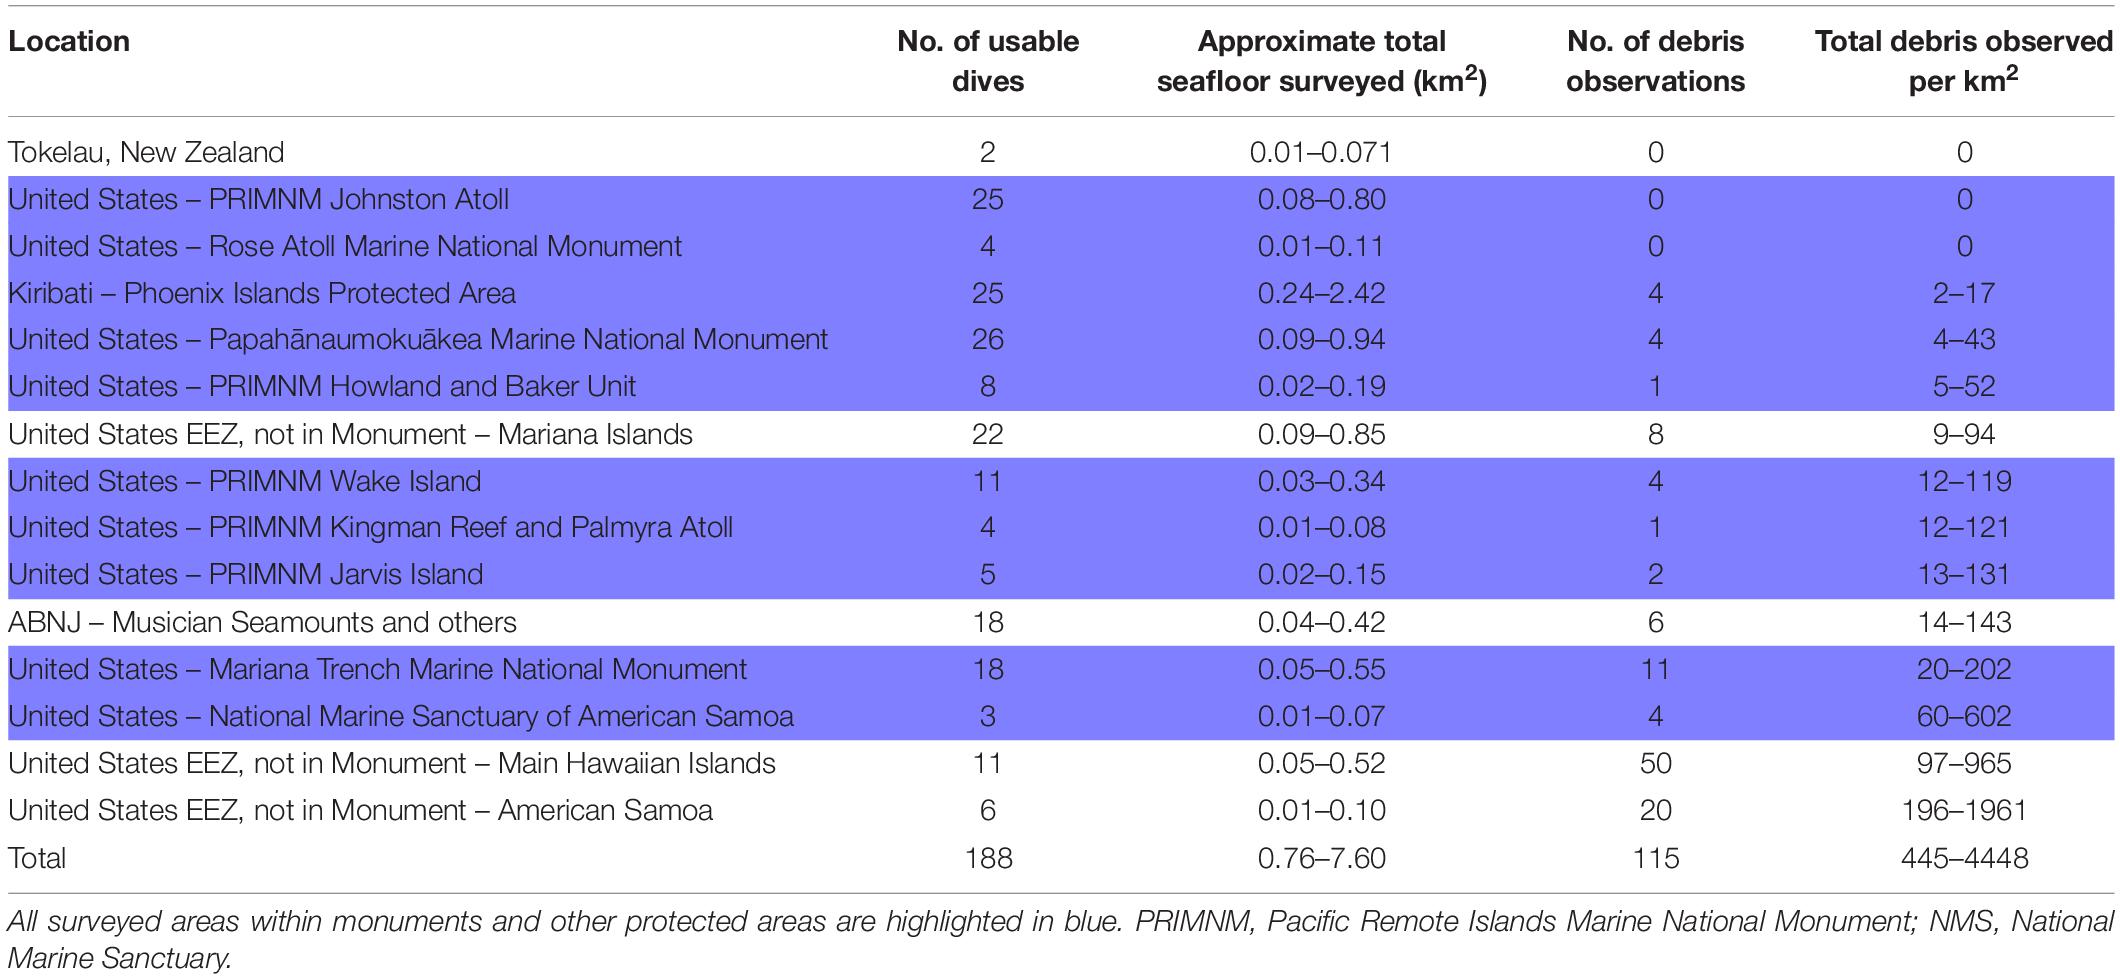
Table 1. Deep-sea debris observed in the central and western Pacific.
Of the total debris found, 28.5% items were observed within the United States Protected Areas (127–1,267 items km–2), whereas the PIPA had only 0.37% of the total debris densities observed (2–17 items km–2), leading to a total of 28.9% of debris observed within protected areas (Table 1). Debris densities in ABNJ were sparse (3.2% or 14–143 items km–2), while areas surveyed within the United States EEZ, not including protected areas, had the highest densities of debris at 302–3,020 items km–2 (67.9%) (Table 1). There was no significant difference between the number of items km–2 found within protected areas and outside (Mann–Whitney: U = 16, η1 = 71 η2 = 49, p = 0.307 two-tailed).
By depth, 71.3% of debris were recorded between 150 and 1,000 m, with decreases in density as depth increased (9.6% at 1,000–2,000 m, 7.0% at 3,000–4,000 m, 6.1% at 2,000–3,000 m, 5.3% at 4,000–5,000 m, and 0.9% at 5,000–6,000 m) (Figures 2, 3). The two sites with the highest debris contributed to this observation with both falling between 150 and 1,000 m depth (CAIMAN anomaly in the “Hawaii” data grouping and Tutaila in the “Central” data grouping (Figure 2 and Supplementary Table 3). The shallowest and deepest records of debris observed within this study were 158 and 5,899 m, respectively (Supplementary Table 3). The highest densities of debris outside of MPAs occurred between 500 and 1,000 m (212 items km–2) and 4,500–5,000 m (254 items km–2) but within MPAs, the highest density was observed between 3,500 and 4,000 m (155 items km–2) (Figure 2). There was a significant difference between the number of items km–2 found within different depth categories across different regions (Kruskal–Wallis = 9.829, p = 0.04, df = 5).
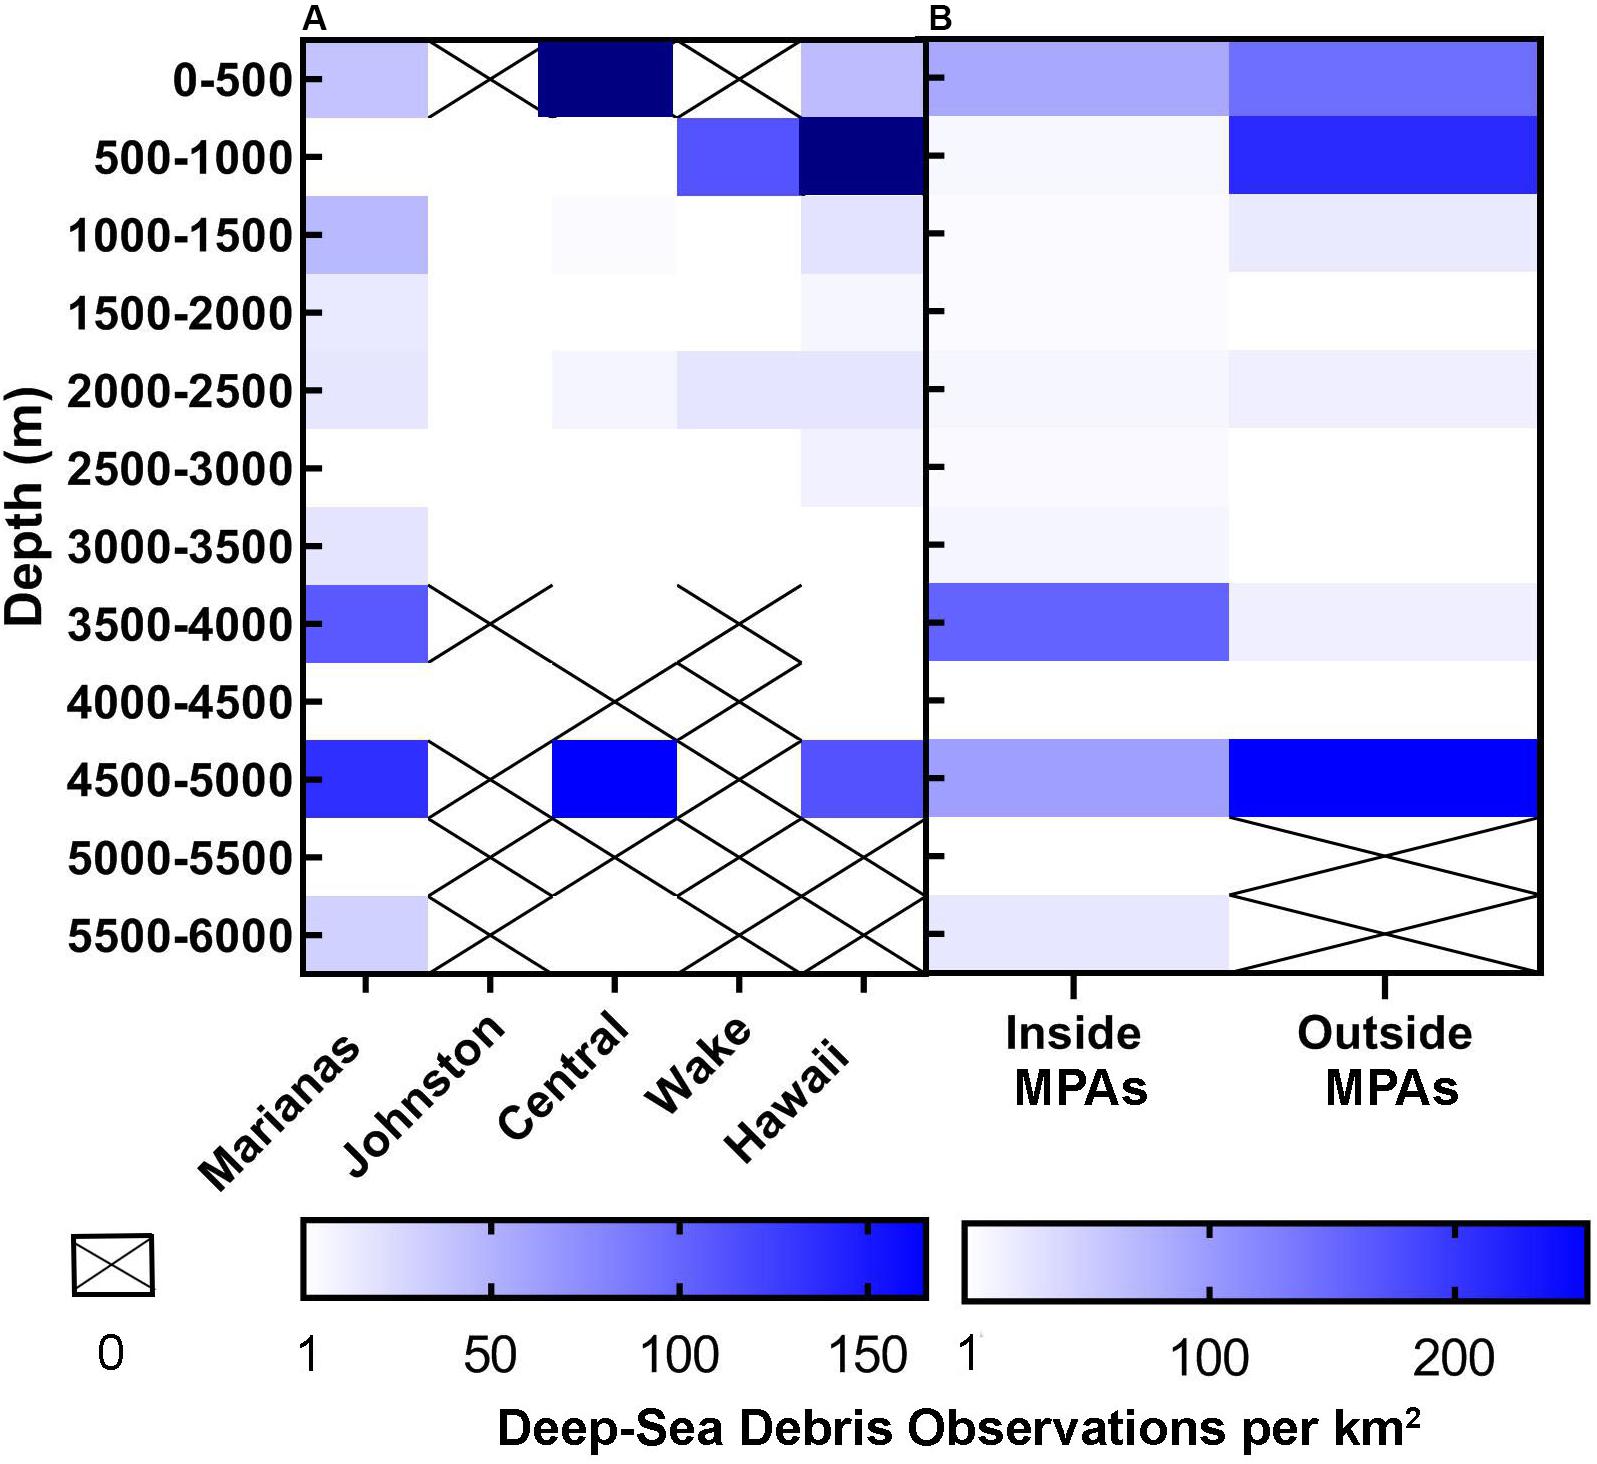
Figure 2. Densities of deep-sea debris by depth observed in the central and western Pacific Ocean. (A) All sites were collapsed into five regions to allow for sufficient data density – “Marianas” (MTMNM and Mariana Islands), “Johnston” (PRIMNM Johnston Atoll only), “Central” (Rose Atoll Marine National Monument, NMS of American Samoa, American Samoa, PIPA, PRIMNM Howland and Baker Unit, PRIMNM Jarvis Island, PRIMNM Kingman Reef, and Palmyra Atoll), “Wake” (PRIMNM Wake Island only), and “Hawaii” (Papahānaumokuākea MNM and main Hawaiian Islands). It should be noted that the densities observed at 0–500 m in “Central” and 500–1,000 m in “Hawaii” exceeded the scale (both were >735 items of debris km–2). (B) Debris observations by depth within and outside of marine protected areas.
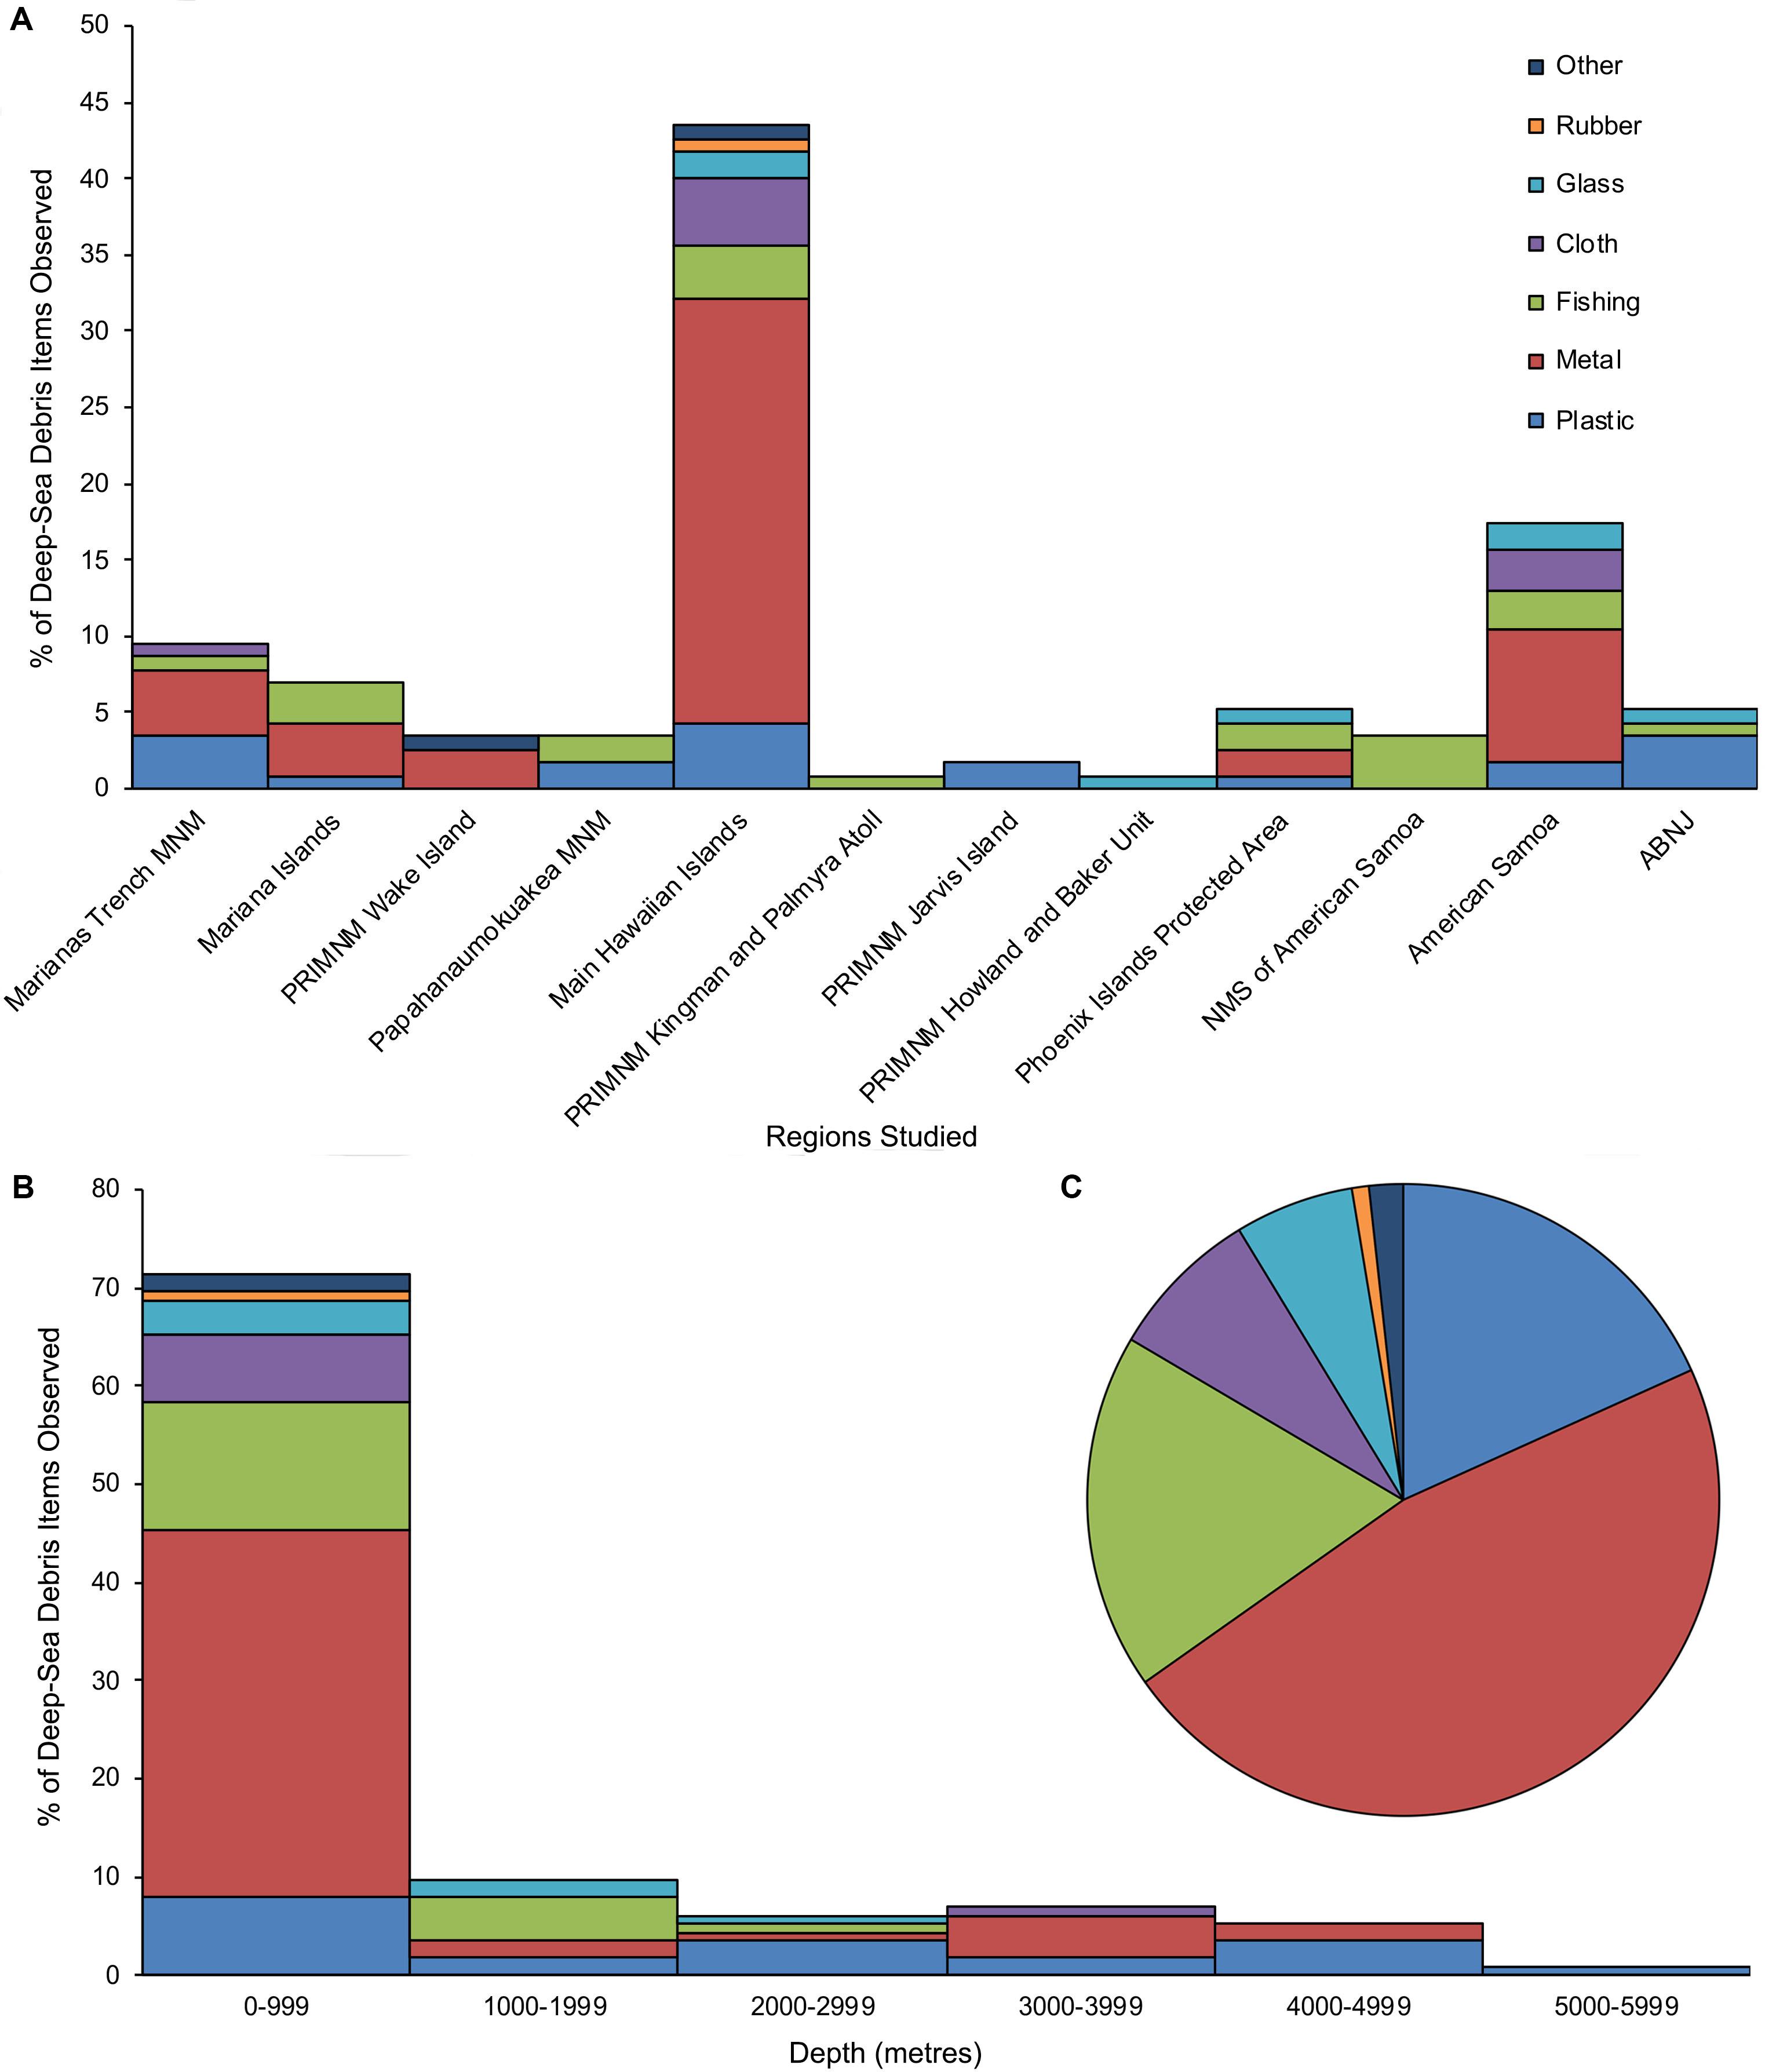
Figure 3. Percentage types of deep-sea debris items observed (A) by region; (B) by depth; and (C) overall. No debris observations were made in PRIMNM Johnston Atoll, Rose Atoll Marine National Monument, and Tokelau. MNM, Marine National Monument; PRIMNM, Pacific Remote Islands Marine National Monument; NMS, National Marine Sanctuary.
Over 50% of deep-sea debris was observed near islands and atolls (37–368 items km–2), with the second highest density found on abyssal features (17–173 items km–2 or 24.84%). Less than 11% of debris was observed on dives exploring hydrothermal areas (10.04%), seamounts (8.50%), and banks (3.89%). Debris observations differed significantly between geological features (Kruskal–Wallis = 11.479, p = 0.022, df = 4). However, no pairwise comparisons were found to be different among features (Dwass Steel Chritchlow Fligner Test for all pairwise comparisons; for all, p < 0.05).
Types of Deep-Sea Debris
Over 80% of the debris consisted of metal (46.96%), derelict fishing gear (18.26%) and plastic debris (18.26%) (Figures 3, 4 and Supplementary Table 3 and Supplementary Debris Occurrences). Cloth, glass, rubber, and other debris made up the remaining 16.52% (Figure 3). Metal debris included cans, tins, cables, and ammunition, while 42.86% of plastic debris was single-use bags or cups. 5.2% of the debris observed was likely related to World War II, including a dock, bombs, and bullets. Fishing debris consisted of line, net, and cable. Cloth consisted mostly of pieces of canvas but also some clothing. The only glass debris encountered were bottles. The only rubber debris observed was a gasket, and other debris types included concrete and ceramic items.
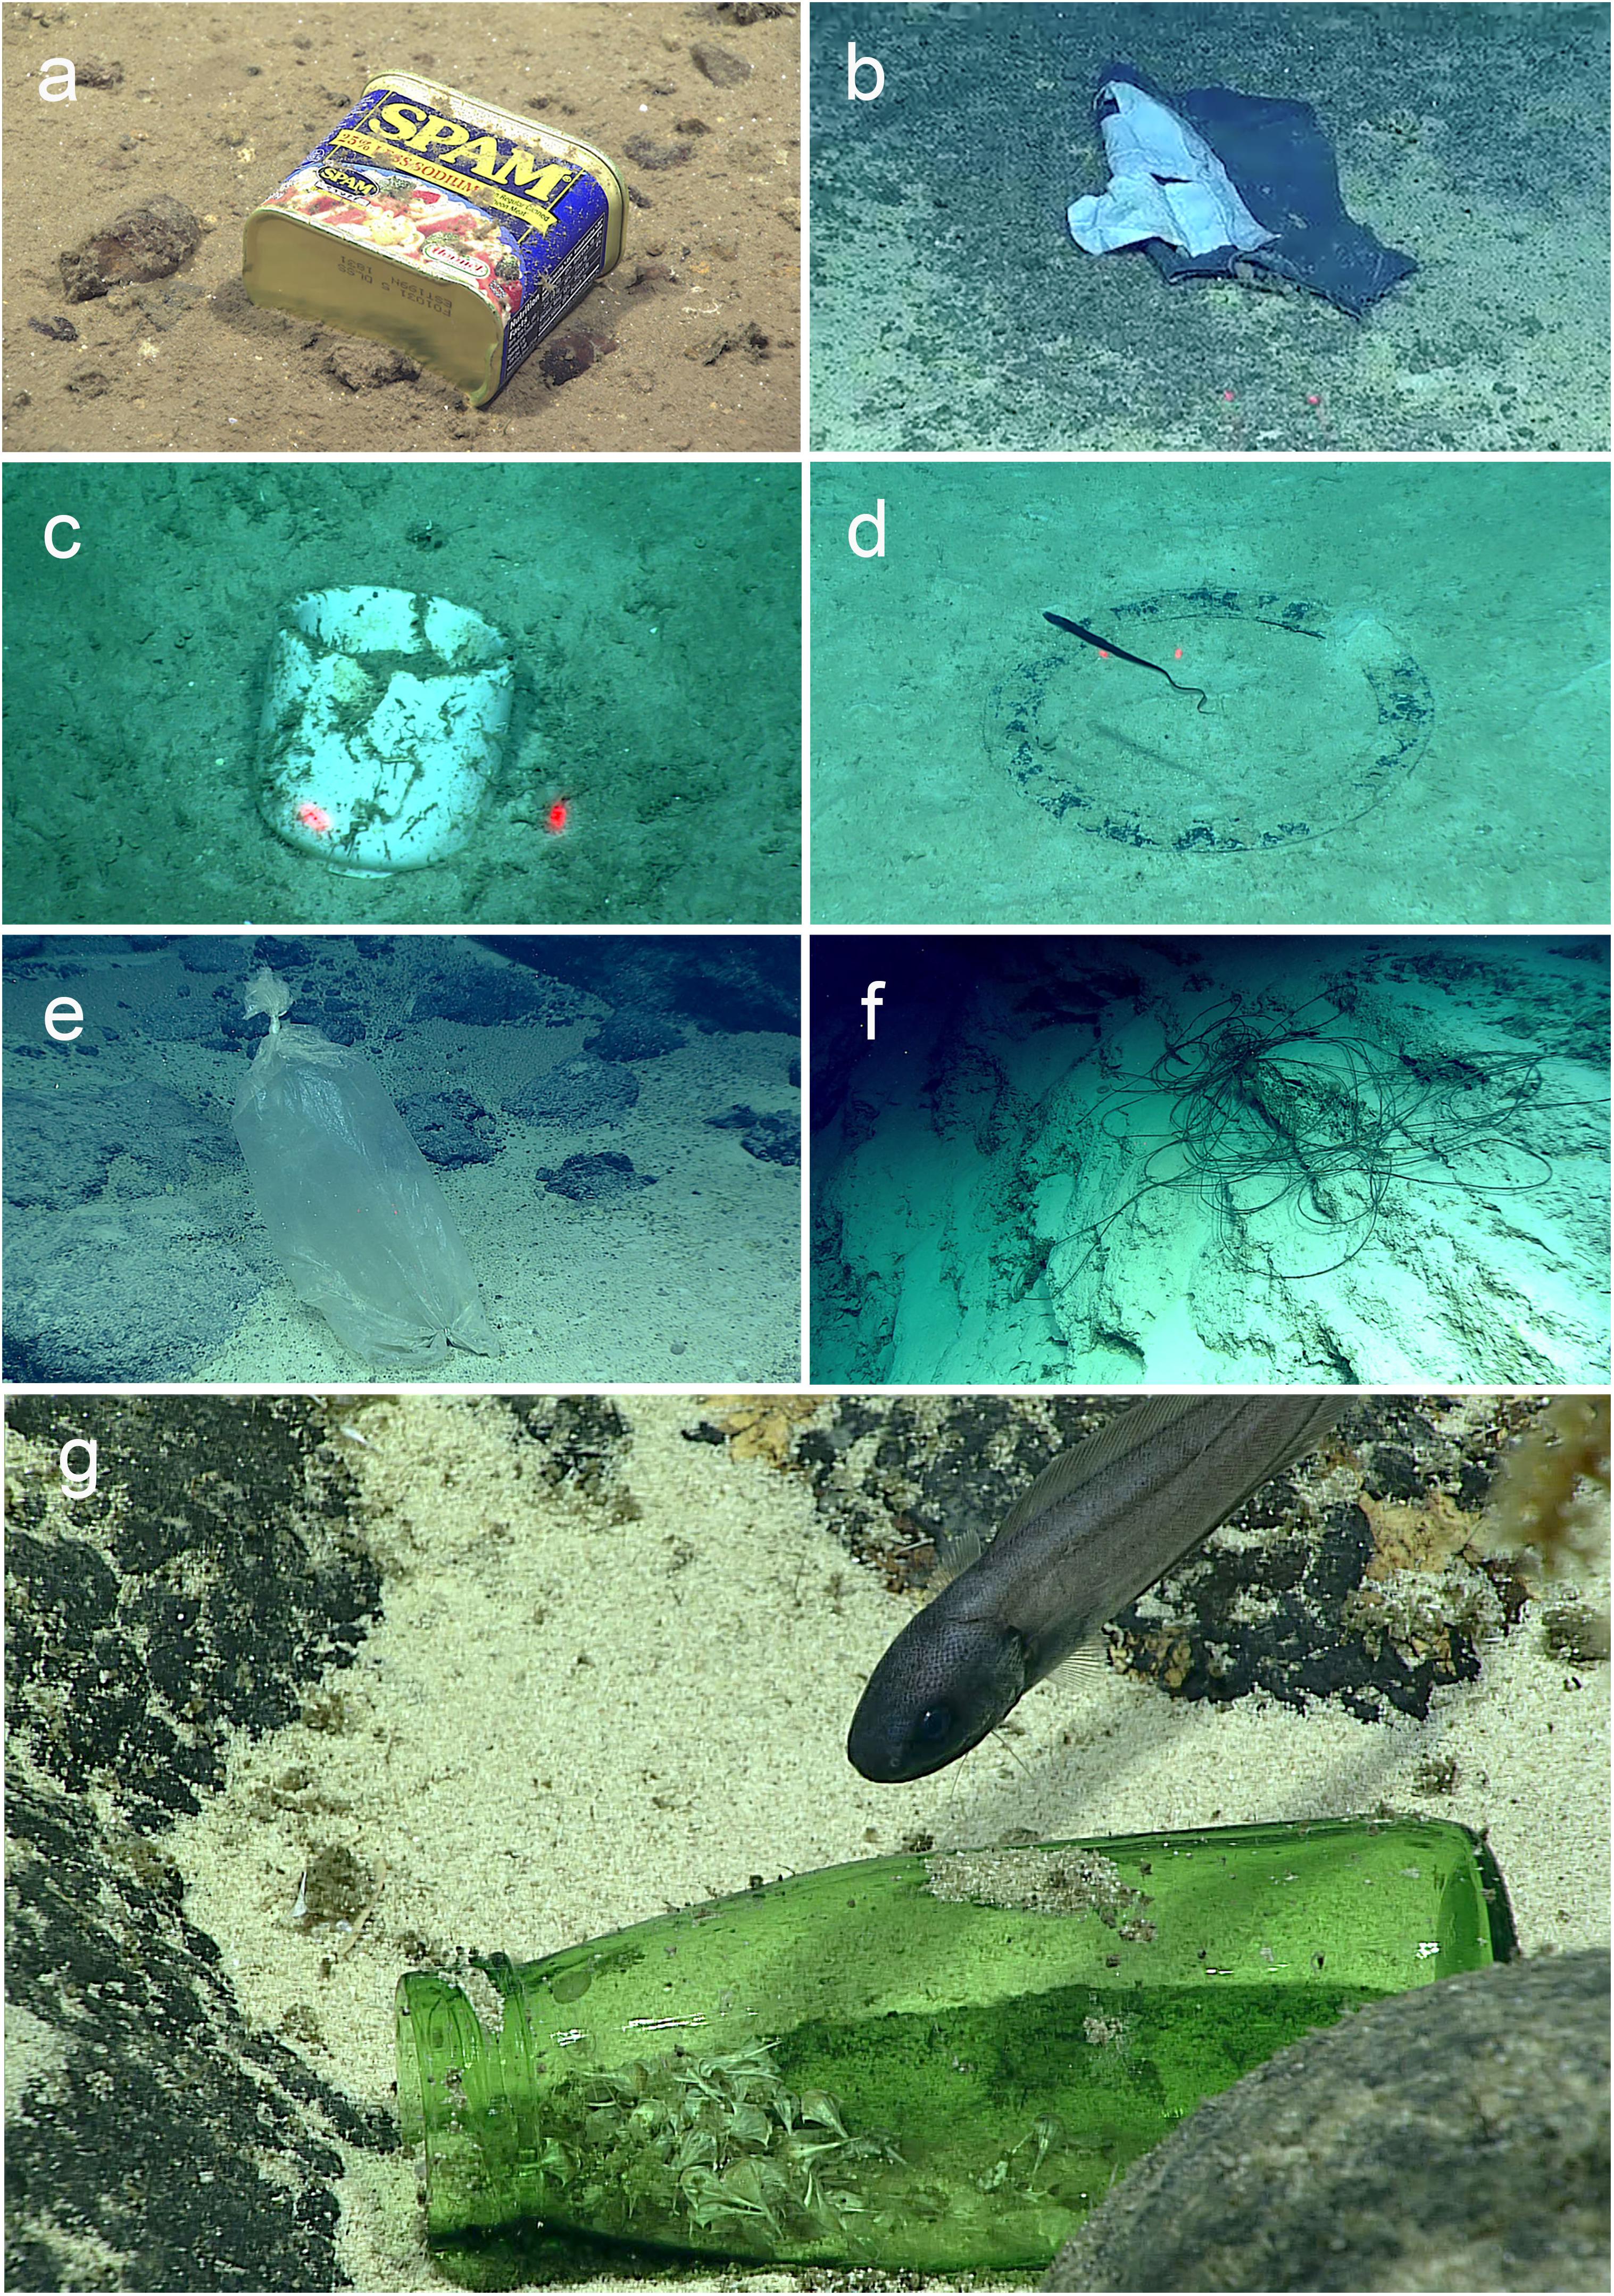
Figure 4. Types of deep-sea debris observed. (a) Metal debris – a food tin at 4,947 m in Sirena Canyon off the Mariana Islands. (b) Cloth debris – a piece of canvas at 3,780 m on Enigma Seamount off the Mariana Islands. (c) Other debris – a ceramic cup at 838 m at CAIMAN/I-203 off the main Hawaiian Islands. (d) Rubber debris – a gasket at 839 m at CAIMAN/I-203 off the main Hawaiian Islands. (e) Plastic debris – a plastic bag at 3,767 m on Enigma Seamount off the Mariana Islands. (f) Fishing debris – fishing line at 453 m on South Palmyra Slope in PRIMNM Kingman Reef and Palmyra Atoll. (g) Glass debris – a glass bottle at 1,152 m at Titov 2 in PRIMNM Howland and Baker Unit. The central red lasers points indicate 10 cm scale in 4b, 4c, 4d, and 4e.
Fishing debris was not found deeper than 2,006 m (Figure 3). Most fishing (76.19%), metal (81.48%), cloth (88.88%), and glass (71.42%) debris were observed off the shores of islands and atolls. Islands and atolls, as well as seamounts, had the highest plastic debris (38.10% each) of any geological feature. Within protected areas, fishing gear and plastic were the most abundant types of debris (32.26% and 29.03%, respectively), with metal debris at 25.81% (Figure 3).
Analysis of deep-sea debris observations by distance from settlement on land showed that debris was not evenly distributed across distance (Figure 5, Pearson’s X2 = 26.491, df = 8, p = 0.0009). In addition, the majority of debris (both heavy and light) was found very near to settlements (within the first 60 km). Although heavy and light debris both show uneven distribution from shore (X2 = 427.69, p < 0.00001; X2 = 199.06, p < 0.00001, respectively), beyond 60 km, the heavy debris was relatively evenly distributed (X2 = 11.497, df = 7, p = 0.1184). The distribution for light debris past 60 km was still uneven (X2 = 47.245, df = 7, p < 0.00001). Within this study, glass debris observed at Shostakovich Seamount was the furthest recorded from settlement on land (1,324 km from Kauai in the main Hawaiian Islands) (Figure 5). A total of 55.6% of sites where debris was found over 500 km from settled land were on seamounts.
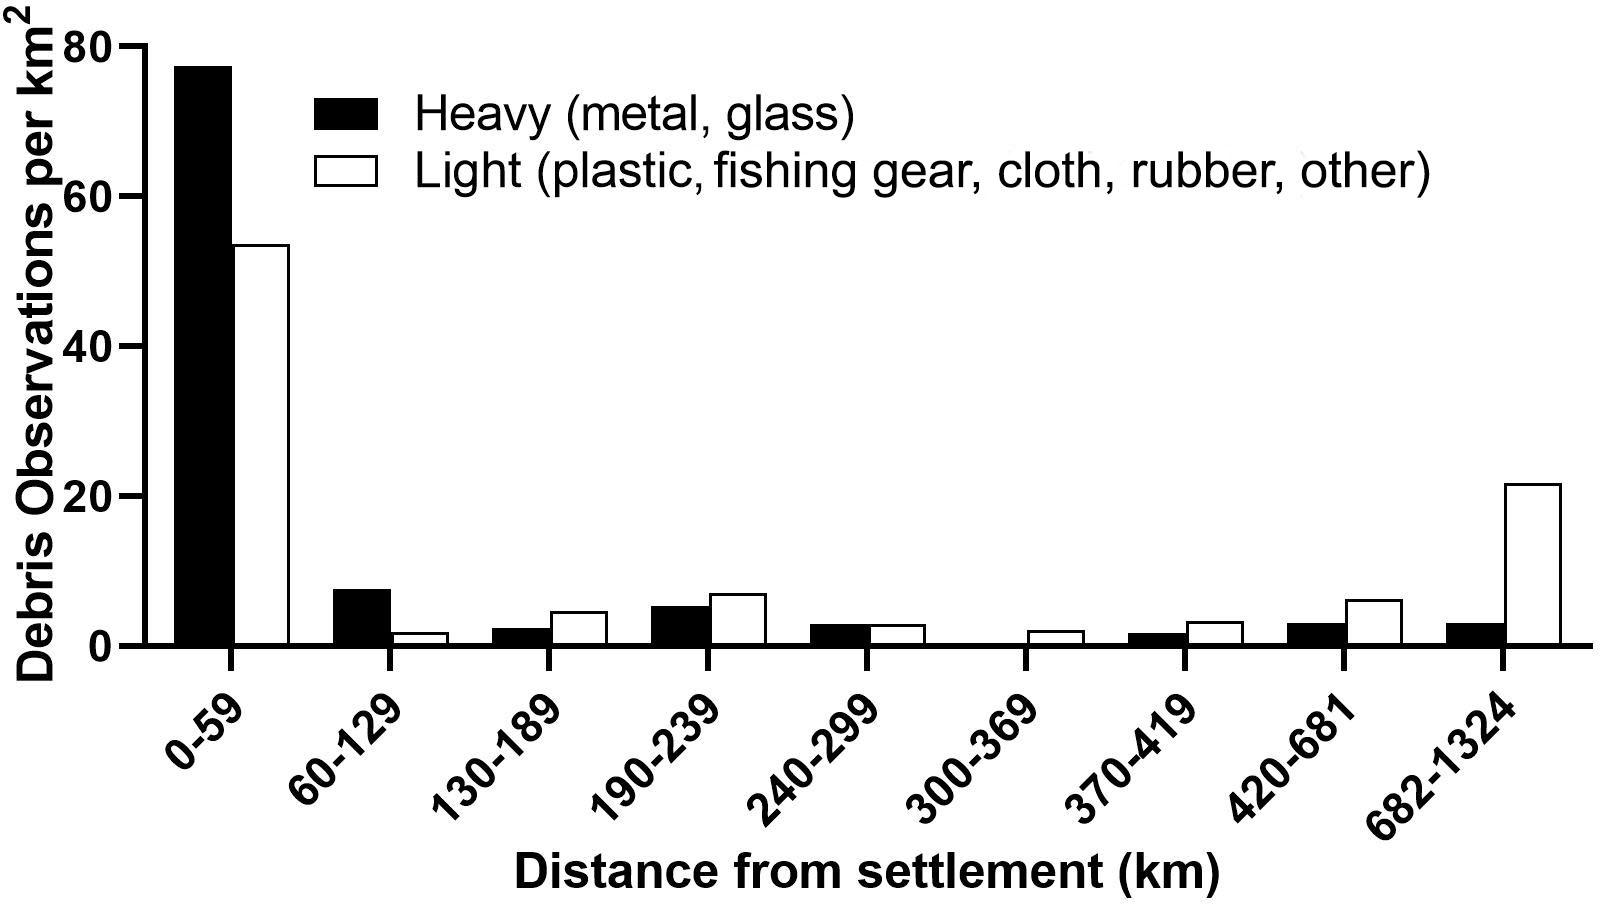
Figure 5. Deep-sea debris density by distance from human settlement (km). In an attempt to standardize sampling effort, each distance category contained 21 deep-sea ROV dives except for the last category, which had 20 dives.
Interactions of Deep-Sea Biological Communities With Debris
Of the debris observed, fauna interacted directly with 39.13% (Table 2, Figure 6, and Supplementary Table 3 and Supplementary Debris Occurrences). Of those, 37.78% were pieces of debris that had been encrusted by fauna, whereas faunal interactions of multiple types were observed on 28.89% of debris. Specifically, 17.78% of debris provided shelter to animals and 15.56% of debris were entangled in coral colonies. Deep-sea organisms noted on or near debris included corals, bryozoans, hydroids, anemones, sponges, serpulids, crinoids, ophiuroids, echinoids, gastropods, cirripeds, squat lobsters, crabs, shrimp, and fish. Of the debris entangled in coral colonies, 42.9% were fishing gear and 57.1% were plastic bags or rope. The corals entangled with fishing gear or plastic included several primnoids, a paragorgiid, a field of large antipatharians and an isidid skeleton (Figure 6). Other notable interactions included an actiniarian attached to a bucket with a crinoid sheltering, a crab sheltering within fishing line encrusted with cirripeds and a plastic bag, and a World War II dock observed in the Main Hawaiian Islands that provided substrate for a range of cnidarians (Figure 6).
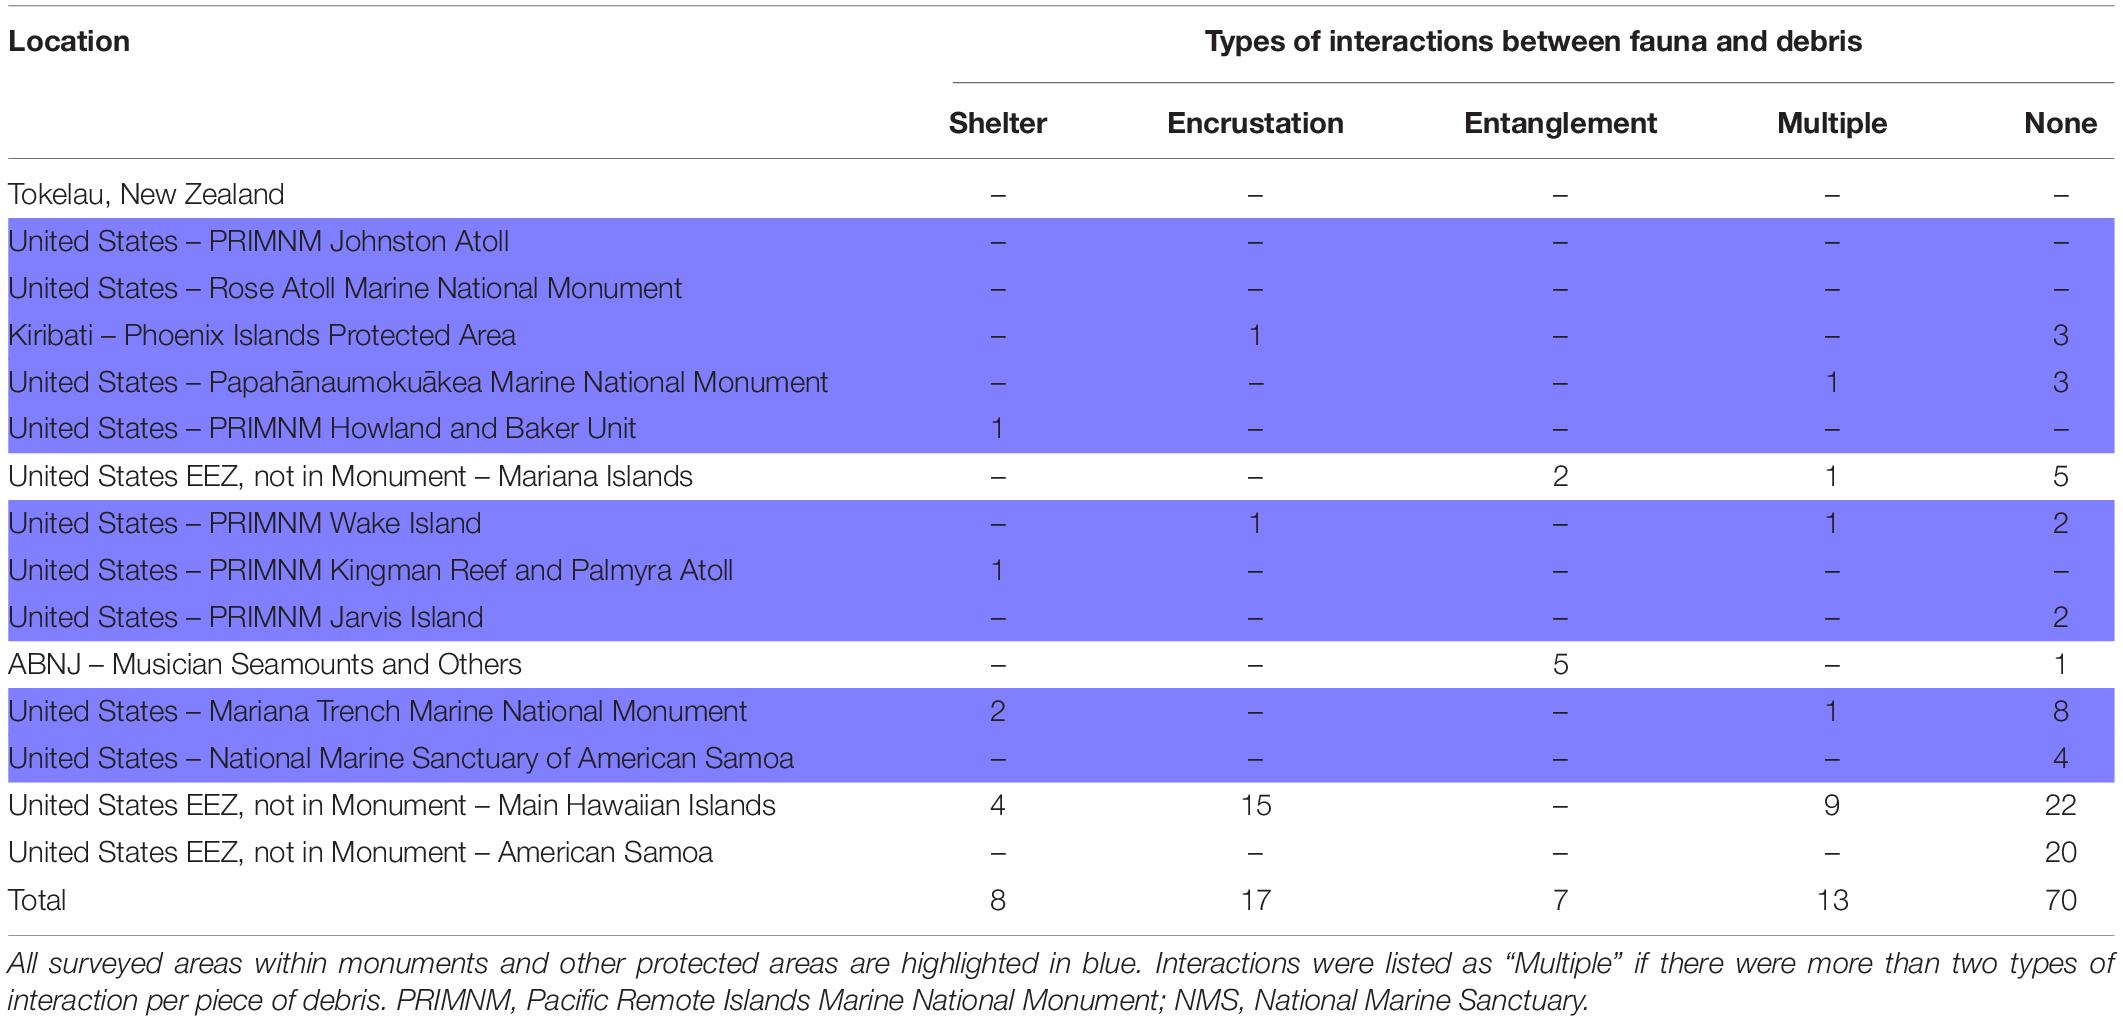
Table 2. Interactions of fauna with deep-sea debris in the central and western Pacific.
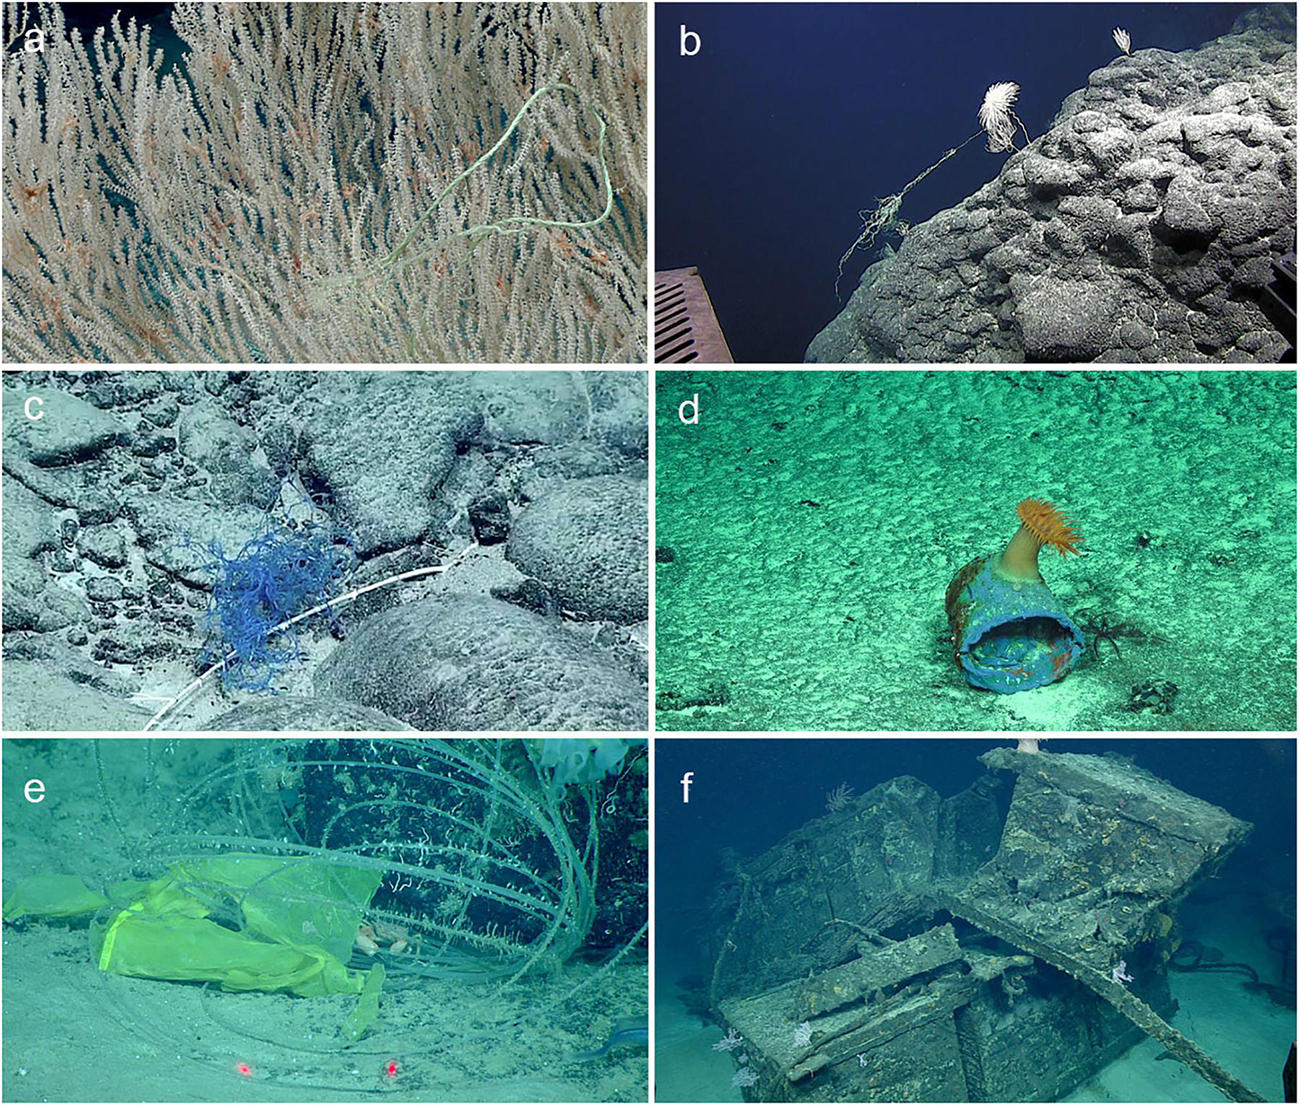
Figure 6. Biological interactions with deep-sea debris. (a) Fishing line entangled in a large primnoid coral at 1,772 m in the Musician Seamounts in ABNJ. (b) Fishing line entangled in a primnoid coral at 1,167 m in the northwestern Hawaiian Islands. (c) The skeleton of an isidid coral entangled in fishing line at 2,005 m on Pigafetta Guyot off the Mariana Islands. This may have contributed to its death. (d) A plastic bucket providing substrate for an actiniarian at 1,025 m in the PIPA. (e) A plastic bag and fishing line providing shelter for a crab and substrate for cirripeds at 791 m at CAIMAN/I-203 off the main Hawaiian Islands. (f) A metal dock from World War II intentionally sunk at 784 m off the main Hawaiian Islands and now providing shelter and substrate for a variety of species including multiple octocorals, crabs, squat lobsters, sponges, barnacles, and anemones. The central red lasers points indicate 10 cm scale in 6e.
Discussion
Patterns and Sources of Debris in the Pacific Deep Ocean
This study was the first to explore marine debris on such a wide scale across the central Pacific, finding that it is present in many deep-sea locations, including within MPAs that are largely devoid of human activity. Marine debris was encountered on 17.5% of the dives undertaken at depths from 158 to 6,000 m and ranged from 0 to 9,524 items km–2. This is in line with other deep-sea debris studies: 200 to 13,000 items km–2 on the Northeast United States continental margin (Quattrini et al., 2015), 4 to >1,300 items km–2 off Sardinia (Cau et al., 2018), and 59 to 1,739 items km–2 on seamounts in the Indian and Atlantic Oceans (Woodall et al., 2015), however, Galgani et al. (2000) recorded much higher densities of 101,000 items km–2 in the Mediterranean Sea. In our study, the highest densities were observed within the United States EEZ around American Samoa and the main Hawaiian Islands, likely due to an anomalous site in each location with notably high densities – a site close to Tutuila, the largest and main island in the American Samoa archipelago, and a site close to Oahu, the most densely populated of the main Hawaiian Islands, showing the patchy nature of deep-sea debris and potential implications of nearby dense human populations. Chiba et al. (2018) found most debris between 1,000 and 2,000 m, but reported that this might have been due to sampling bias. Contrastingly, Schlining et al. (2013) found most debris below 2,000 m, with the highest densities of plastic and metal debris between 2,000 and 4,000 m. Chiba et al. (2018) reported that the relative dominance of plastic debris was larger at depths greater than 6,000 m. In our study, the majority of the debris was observed between 150 and 999 m depth, with decreases in density as depth increased, however, this could have been as a result of sampling bias as survey distance would have been the greatest at shallower depths given the minimal ROV ascent and descent time.
As highlighted by Ramirez-Llodra et al. (2013); Schlining et al. (2013), and Woodall et al. (2015), hydrography, geology, and anthropogenic activity determine the amount, type, and location of debris reaching the deep seafloor. The central and western Pacific supports shipping and other forms of boat traffic. This study shows that debris was not evenly distributed across distance, and that the majority of debris (both heavy and light) was found very near to settlements (within the first 60 km). Heavier debris (metal and glass – 53.04%) rapidly sink close to the site of discard, indicating many of the offshore items observed during this study were likely discarded intentionally or accidentally from marine vessels and that despite strict ocean-wide regulations, enforcement can be problematic. A total of 5.2% of all debris observed were likely related to World War II, serving as a reminder of the history of this region of the Pacific Ocean. Lighter debris may have floated from the sources for some time or been blown out to sea (Pham et al., 2014; Chiba et al., 2018), then eventually sunk, gaining more distance from shore and leaving greater room for speculation on their place of origin, as was seen during this study. However, although we observed light debris in the farthest distances from settlement, the origin of discard is not known: light debris could have been discarded terrestrially, or from an at-sea vessel. Although the furthest occurrence of debris from settled coast during our study was 1,324 km, Pham et al. (2014) observed debris over 2,000 km from land. While the decline of debris density from shore has been previously observed by Schlining et al. (2013) and Pham et al. (2014), this does not appear to be universal. For example, Woodall et al. (2015) did not find that the distance from shore was a good predictor of debris density. Even in our study, we found that light debris increased away from settlements (Figure 5), making it difficult to predict light debris density from shore distance alone.
As with previous studies, debris varied from fishing gear to metal items such as cans, to glass bottles, cloth, plastic bags and more, although proportions varied (Quattrini et al., 2015; Cau et al., 2018). During this study, metal was the most abundant, followed by derelict fishing gear and plastic debris, whereas off Sardinia, plastic accounted for 56% of the total items, followed by glass and metal (Cau et al., 2018). Schlining et al. (2013); Pham et al. (2014), and Galgani et al. (2000) also found plastic to be the most abundant type of debris.
Geologically, most debris (fishing, metal, cloth, and glass) was found off islands and atolls, with the second highest abundance on abyssal features, followed by hydrothermal areas, seamounts, and banks. Additionally, islands, atolls, and seamounts had the highest plastic debris of any geological feature. This is likely due to the inhabitation of islands and atolls as well as proximity to fishing grounds near-shore or on seamounts. Over half of the sites where debris was found over 500 km from settled land were seamounts; this could be related to use for fishing, as these areas are known to have increased productivity (Clark and Koslow, 2007). Pham et al. (2014) and Woodall et al. (2015) commonly observed fishing debris on seamounts, banks, mounds, and ocean ridges around Europe and in the Indian Ocean, respectively.
For the majority of debris, it is not possible to estimate when deposition on the deep seafloor occurred, especially as degradation rates in the deep ocean are slow due to low oxygen levels and a lack of sunlight (Barnes et al., 2009). Apart from ammunition and other items likely from World War II and therefore nearly a century old, the ages of approximately 95% of observed debris are unknown but could be weeks to nearly a century. Unfortunately, the extremely slow rates of degradation in the deep sea combined with increasing use of the deep oceans and quantities of trash entering the ocean, deep-sea debris will likely increase in the future.
Effectiveness of Protected Areas With Regards to Deep-Sea Debris
Marine protected areas are often established as a potentially effective measure to protect ecosystems against the threats of direct resource exploitation and industrialization in order to better conserve areas of importance. These areas can have a significant cultural value, e.g., Papahānaumokuākea Marine National Monument, or contain organisms, communities and habitats of ecological or functional importance, such as vulnerable marine ecosystems (VMEs). This study shows that no region of the world’s ocean is immune from deep-sea debris, including areas conferred with some degree of protection. There were occurrences of debris both within the majority of MPAs surveyed, as well as at VMEs, such as deep-sea coral beds and hydrothermal vents, in both MPAs and unprotected areas. Debris in MPAs likely pre-dates protection, has accumulated pre- or post-protection arriving via currents, and/or was illegally deposited post-protection.
During this study, only 27% of deep-sea debris was observed in MPAs, with 23.5% in United States protected areas. Similar observations were made within MPAs in the Indian Ocean; the Coral Seamount and Atlantis Bank, both Voluntary Benthic Protected Areas, were the two sites with the lowest debris densities (Woodall et al., 2015). Most large MPAs have only been in place for a decade or less and have focused on relatively remote ocean areas (Campbell and Gray, 2019). As such, the relatively low proportion of debris found in these large MPAs may be an artifact of their remoteness rather than their protected status. While this data may not be robust enough to draw conclusions about MPA effectiveness, in part because it was not possible to age the deep-sea debris observed, the slow degradation rates in the deep ocean have ensured that the debris present in many Pacific MPAs showed little sign of breakdown, and as a result, will be present for much longer periods of time. As MPA coverage expands to ABNJ, future research should estimate the likely debris densities in these remote regions.
Of the debris found within MPAs, fishing debris was responsible for 32.26%. PIPA had the second lowest abundance of deep-sea debris of all protected areas surveyed (1.8%), with PRIMNM Johnston Atoll recording no debris. Half of the debris in PIPA (two items at two sites) was attributed to fishing, which may have been deposited prior to the banning of commercial extractive activities in 2015. Three of the four total debris observations were made off Kanton Island, which currently has a small sustainable-use zone for limited activities to support the resident population, but historically has had a significant but ephemeral population, at one time supporting almost a thousand people. Likewise in Papahānaumokuākea Marine National Monument, PRIMNM Kingman Reef and Palmyra Atoll, NMS of American Samoa, and MTMNM, fishing debris may have either been deposited prior to the banning of all commercial fishing, have floated in on currents, or be of an artisanal nature, but again, it is currently impossible to be certain.
Interactions of Deep-Sea Biota With Debris
Interactions of deep-sea life with debris have not been well documented, especially in the central and western Pacific Ocean, but are fast becoming a topic of increased study. This study showed that deep-sea fauna directly interacted with over a third of the debris observed (Table 2 and Supplementary Table 3 and Debris Occurrences). This is in line with other deep-sea debris studies, e.g., 37% off the coast of California (Schlining et al., 2013). However, our observations likely underestimate the instances as, for example, some of the fauna may be too small to be visualized or there may be sub-lethal interactions.
The only readily observable negative interaction was entanglement by plastic or fishing gear occurring in 6.1% of debris observations. During this study, entanglement was observed only on deep-sea corals and resulted in physical damage (Figure 6), however, in other studies, deep-sea fauna have been observed entangled, including chemosynthetic methane-seep communities, fish, sponges and crustacea (Schlining et al., 2013; Quattrini et al., 2015; Woodall et al., 2015; Chiba et al., 2018). Woodall et al. (2015) observed three forms of entanglement: simple, benthic scraping, and ghost fishing. During this study, only simple entanglement was observed (Figure 5). However, this is still of concern as deep-sea corals are slow growing and slow to recover from disturbance (Williams et al., 2010).
This study focused on benthic or bentho-pelagic fauna and macro debris items visible in ROV imagery, but as has been exposed in the last six years, there are unseen threats from microplastics (Van Cauwenberghe et al., 2013; Woodall et al., 2014; Taylor et al., 2016; Courtene-Jones et al., 2017; Wieczorek et al., 2018; Courtene-Jones et al., 2019; Jamieson et al., 2019) and chemical pollution (Jamieson et al., 2017), which are ubiquitous in the deep ocean. Some cold-water corals, such as Lophelia pertusa, are particularly vulnerable to microplastics acting as physical barriers for food supply decreasing prey capture rates (Chapron et al., 2018). While the true knowledge of occurrences in the deep ocean and impacts to deep-sea fauna are only now being unearthed, studies in shallow waters can provide insight (Hall et al., 2015; Barboza et al., 2019a, b; Rotjan et al., 2019).
Additionally, during the degradation of marine macro debris, chemicals can leach into the water and either into animals in direct contact with the debris (e.g., via ingestion or attachment) or indirectly into animals further afield via water currents thereby widening the impact footprint. Multiple types of plastic debris are known to leach endocrine disruptors (e.g., phthalates and benzophenones) resulting in sub-lethal impacts including to reproductive viability, as well as morbidity in shallow-water fauna (Hermabessiere et al., 2017; Windsor et al., 2018). Metals, either dissolved or as particulates, can also disrupt organism physiology and performance leading to severe impacts (Hauton et al., 2017). Toxicants from plastics, metals, and other forms of debris, could lead to reproductive failure in marine organisms at all community levels, and thereby raise the levels of population mortality in the deep ocean, however, this is further complicated by a lack of data on the toxicity of metals and other chemicals under deep-ocean conditions (low temperature, high hydrostatic pressure, and potentially altered pH). Therefore, impacts on shallow-water organisms may not be representative of the toxicity in deep-sea organisms (Hauton et al., 2017). Furthermore, it is challenging to understand not only the specific impacts of marine debris but also cumulative or synergistic impacts arising from increasing exploitation, pollution, and climate change in the global oceans (Laffoley et al., 2019). The true impact of the observed debris, as well as deep-ocean debris globally, is certainly underestimated.
Despite the many known negative impacts of marine debris, there is some potential utility of debris items by deep-sea fauna through the provision of shelter and attachment surfaces, a conclusion shared by Watters et al. (2010); Miyake et al. (2011), and Schlining et al. (2013). Woodall et al. (2015) also observed similar levels of fauna encrusting or sheltering in debris including corals and hydroids, crinoids, anemones, echinoids, and ophiuroids, as well as fauna using deep-sea debris to lay eggs, however, this was not observed during this study. The presence of debris may enable settlement of benthic taxa in novel habitats (e.g., hard-substrate settlers living on debris in otherwise sandy sediments); the resulting ecological impact of these anthropogenically facilitated interactions remains a topic for future investigation.
Slowing the Flow of Marine Debris
This study has provided added evidence that deep-sea debris are present in the central and western Pacific, even within protected areas far removed from settled land. The prevalence of marine debris, including in MPAs, will likely increase given that human use of the ocean, including the deep ocean, is expanding rapidly (Ramirez-Llodra et al., 2011). As indicated by multiple studies, as well as the United Nations’ Sustainable Development Goal 14.1, every opportunity to stem the flow of debris into the ocean, and ultimately into the deep ocean, should be taken as many studies have shown negative impacts to marine life (e.g., Gall and Thompson, 2015; Lamb et al., 2018).
Reducing the production of debris, as well as preventing existing debris from entering the oceans is key and requires a global-level response (Vince and Hardesty, 2016; Laffoley et al., 2019). There is a need to implement and enforce stringent and novel policy actions at multiple levels of social and economic hierarchies, with an emphasis on managing and monitoring explicit pollution sources as point sources of origin, rather than ambiguous non-point sources of pollution (Laffoley et al., 2019). The International Maritime Organisation’s Action Plan To Address Marine Plastics From Ships, adopted in late 2018, is a step in the right direction, however, is limited to one type of debris, which accounted for less than 20% of the deep-sea debris observed during this study. Innovating to replace single-use materials with biodegradable alternatives is also of importance but requires investment and political backing (Laffoley et al., 2019). Education and awareness will also play a role in mitigation. Finally, this study has reaffirmed that there is indeed a paucity of data on the extent of this issue as well as the impact on deep-sea fauna, and thus future studies should be directed to this important and timely cause.
Data Availability Statement
All datasets generated for this study are included in the article/Supplementary Material. Raw data used in this study from CAPSTONE expeditions are publicity available through the NOAA archives. Citations and data access are included in Supplementary Table 2.
Author Contributions
All authors were involved in the fieldwork in the Pacific Ocean and processed the ROV imagery. DA, RR, BK, TS, and KC constructed the figures. DA, RR, TS, and BK analyzed the data. DA wrote the bulk of the manuscript with assistance from all co-authors.
Conflict of Interest
The authors declare that the research was conducted in the absence of any commercial or financial relationships that could be construed as a potential conflict of interest.
Acknowledgments
We wish to thank the Officers and crew of the NOAA Ship Okeanos Explorer for shipboard support, NOAA OER, and the Global Foundation for Ocean Exploration team for their tremendous support during the fieldwork in the Pacific Ocean. We appreciate NOAA’s support for CAPSTONE which was a collaboration between OER, Office of Marine and Aviation Operations, Pacific Island Fisheries Science Center, Pacific Islands Regional Office, Deep Sea Coral Research and Technology Program, Office of National Marine Sanctuaries, National Center for Environmental Information, National Ocean Service, National Environmental Satellite, Data, and Information Service, Oceanic and Atmospheric Research, and National Marine Fisheries Service. We also thank the Schmidt Ocean Institute, the Master and crew, the Master and crew of the RV Falkor, Kiribati Observer Arenteiti Tekiau, and Expedition Chief Scientist Erik Cordes, while working in the Phoenix Islands Protected Area under PIPA Research Permit #4/17, funded by NOAA OER (#NA17OAR0110083 awarded to RR, TS, and Erik Cordes). Further thanks to the scientists on board and on shore during all voyages. DA has received funding from the European Union’s Horizon 2020 Research and Innovation Program under the Marie Skłodowska-Curie grant agreement number 747946. DA would also like to acknowledge TBA21-Academy for providing a space for peaceful writing. CAPSTONE was completed in accordance with all regulations regarding environmental compliance and local permitting including the following permits: Kiribati Phoenix Islands Protected Area permit #1/17, Commonwealth of the Northern Mariana Islands Department of Lands and Natural Resources permit #03345; Hawai‘i Department of Land and Natural Resources permit #SAP-2016-64; Cook Islands Marae Moana Permit #05/17, National Marine Sanctuary of American Samoa permit #NMAS-2017-001; American Samoa Department of Marine and Wildlife Resources permit #2017/001; U.S. Fish and Wildlife Convention on International Trade in Endangered Species (CITES) import permit #17US36207C/9; Papahānaumokuākea Marine National Monument permit #PMN-2015-018; and Marshall Islands Ministry of Foreign Affairs #US/98-15. Any use of trade, product, or firm names is for descriptive purposes only and does not imply endorsement by the United States Government.
Supplementary Material
The Supplementary Material for this article can be found online at: https://www.frontiersin.org/articles/10.3389/fmars.2020.00369/full#supplementary-material
References
Auscavitch, S. R., Deere, M. C., Keller, A. G., Rotjan, R. D., Shank, T. M., and Cordes, E. E. (2019). Oceanographic drivers of deep-sea coral species distribution and community assembly on seamounts, islands, atolls, and reefs within the Phoenix Islands protected area. Front. Mar. Sci. 7:42. doi: 10.3389/fmars.2020.00042
Barboza, L. G. A., Cózar, A., Gimenez, B. C. G., Barros, T. L., Kershaw, P. J., and Guilhermino, L. (2019a). “Chapter 17 – Macroplastics pollution in the marine environment,” in World Seas Volume III: Ecological Issues and Environmental Impacts, ed. C. Sheppard (London: Elsevier), 305–328. doi: 10.1016/b978-0-12-805052-1.00019-x
Barboza, L. G. A., Frias, J. P. G. L., Booth, A. M., Vieira, L. R. J., Baker, J., Foster, G., et al. (2019b). “Chapter 18 – Microplastics pollution in the marine environment,” in World Seas Volume III: Ecological Issues and Environmental Impacts, ed. C. Sheppard (London: Elsevier).
Barnes, D. K. A., Galgani, F., Thompson, R. C., and Morton, B. (2009). Accumulation and fragmentation of plastic debris in global environments. Philos. Trans. R. Soc. B Biol. Sci. 364, 1985–1998. doi: 10.1098/rstb.2008.0205
Campbell, L. M., and Gray, N. J. (2019). Area expansion versus effective and equitable management in international marine protected areas goals and targets. Mar. Policy 100, 192–199. doi: 10.1016/j.marpol.2018.11.030
Cantwell, K., Elliott, K. P., and Kennedy, B. R. C. (2018). Deepwater exploration of the pacific remote islands marine national monument. Oceanography 31:126.
Cau, A., Bellodi, A., Moccia, D., Mulas, A., Pesci, P., Cannas, R., et al. (2018). Dumping to the abyss: single-use marine litter invading bathyal plains of the Sardinian margin (Tyrrhenian Sea). Mar. Pollut. Bull. 135, 845–851. doi: 10.1016/j.marpolbul.2018.08.007
Chapron, L., Peru, E., Engler, A., Ghiglione, J. F., Meistertzheim, A. L., Pruski, A. M., et al. (2018). Macro- and microplastics affect cold-water corals growth, feeding and behaviour. Sci. Rep. 8:15299. doi: 10.1038/s41598-018-33683-6
Chiba, S., Saito, H., Fletcher, R., Yogi, T., Kayo, M., Miyagi, S., et al. (2018). Human footprint in the abyss: 30 year records of deep-sea plastic debris. Mar. Policy 96, 204–212. doi: 10.1016/j.marpol.2018.03.022
Clark, M. R., and Koslow, J. A. (2007). “Impacts of fisheries on seamounts,” in Seamounts: Ecology, Fisheries, and Conservation, eds T. J. Pitcher, T. Morato, P. J. B. Hart, M. R. Clark, N. Haggan, and R. S. Santos (Hoboken, NJ: John Wiley & Sons, Inc), 413–441. doi: 10.1002/9780470691953.ch19
Courtene-Jones, W., Quinn, B., Ewins, C., Gary, S. F., and Narayanaswamy, B. E. (2019). Consistent microplastic ingestion by deep-sea invertebrates over the last four decades (1976–2015), a study from the North East Atlantic. Environ. Pollut. 244, 503–512. doi: 10.1016/j.envpol.2018.10.090
Courtene-Jones, W., Quinn, B., Gary, S. F., Mogg, A. O. M., and Narayanaswamy, B. E. (2017). Microplastic pollution identified in deep-sea water and ingested by benthic invertebrates in the Rockall Trough, North Atlantic Ocean. Environ. Pollut. 231, 271–280. doi: 10.1016/j.envpol.2017.08.026
Galgani, F., Leaute, J. P., Moguedet, P., Souplet, A., Verin, Y., Carpentier, A., et al. (2000). Litter on the Sea Floor Along European Coasts. Mar. Pollut. Bull. 40, 516–527. doi: 10.1016/s0025-326x(99)00234-9
Galil, B., Golik, A., and Turkay, M. (1995). Litter at the bottom of the sea: a sea bed survey in the Eastern Mediterranean. Mar. Pollut. Bull. 30, 22–24. doi: 10.1016/0025-326x(94)00103-g
Gall, S. C., and Thompson, R. C. (2015). The impact of debris on marine life. Mar. Pollut. Bull. 92, 170–179. doi: 10.1016/j.marpolbul.2014.12.041
Gregory, T., Lovalvo, D., Mohr, B., McLetchie, K., and Ryan, M. (2016). Advancing undersea technology. Oceanography 29, 52–55. doi: 10.5670/oceanog.2016.supplement.01
Grøsvik, B. E., Prokhorova, T., Eriksen, E., Krivosheya, P., Horneland, P. A., and Prozorkevich, D. (2018). Assessment of marine litter in the Barents sea, a part of the joint Norwegian–Russian ecosystem survey. Front. Mar. Sci. 5:72. doi: 10.3389/fmars.2018.00072
Hall, N. M., Berry, K. L. E., Rintoul, L., and Hoogenboom, M. O. (2015). Microplastic ingestion by scleractinian corals. Mar. Biol. 162, 725–732. doi: 10.1007/s00227-015-2619-7
Hauton, C., Brown, A., Thatje, S., Mestre, N. C., Bebianno, M. J., Martins, I., et al. (2017). Identifying toxic impacts of metals potentially released during deep-sea mining—a synthesis of the challenges to quantifying risk. Front. Mar. Sci. 4:368. doi: 10.3389/fmars.2017.00368
Hermabessiere, L., Dehaut, A., Paul-Pont, I., Lacrois, C., Jezequel, R., Soudant, P., et al. (2017). Occurrence and effects of plastic additives on marine environments and organisms: a review. Chemosphere 182, 781–793. doi: 10.1016/j.chemosphere.2017.05.096
Jamieson, A. J., Brooks, L. S. R., Reid, W. D. K., Piertney, S. B., Narayanaswamy, B. E., and Linley, T. D. (2019). Microplastics and synthetic particles ingested by deep-sea amphipods in six of the deepest marine ecosystems on Earth. R. Soc. Open Sci. 6:180667. doi: 10.1098/rsos.180667
Jamieson, A. J., Malkocs, T., Piertney, S. B., Fujii, T., and Zhang, Z. (2017). Bioaccumulation of persistent organic pollutants in the deepest ocean fauna. Nat. Ecol. Evol. 1:0051. doi: 10.1038/s41559-016-0051
Jenkyns, R., Gervais, F., and Pirenne, B. (2013). “SeaScribe: an annotation software for Remotely Operated Vehicle dive operations,” in Proceedings of the 2013 OCEANS – San Diego (San Diego, CA: IEEE), doi: 10.23919/OCEANS.2013.6741250
Keller, A., Fruh, E., Johnson, M., Simon, V., and Mcgourty, C. (2010). Distribution and abundance of anthropogenic marine debris along the shelf and slope of the US West Coast. Mar. Pollut. Bull. 60, 692–700. doi: 10.1016/j.marpolbul.2009.12.006
Kennedy, B. R., Cantwell, K., Malik, M., Kelley, C., Potter, J., Elliott, K., et al. (2019). The unknown and the unexplored: insights into the Pacific deep-sea following NOAA CAPSTONE expeditions. Front. Mar. Sci. 6:480. doi: 10.3389/fmars.2019.00480
Kennedy, B. R. C., Elliott, K. P., Cantwell, K., and Mesick, S. (2016). Telepresence-enabled exploration with NOAA ship okeanos explorer. Oceanography 29, 50–51. doi: 10.5670/oceanog.2016.supplement.01
Laffoley, D., Baxter, J. M., Amon, D. J., Currie, D. E., Downs, C. A., Hall-Spencer, J. M., et al. (2019). Eight urgent, fundamental and simultaneous steps needed to restore ocean health, and the consequences for humanity and the planet of inaction or delay. Aquat. Conserv. 30, 194–208. doi: 10.1002/aqc.3182
Lamb, J. B., Willis, B. L., Fiorenza, E. A., Couch, C. S., Howard, R., Rader, D. N., et al. (2018). Plastic waste associated with disease on coral reefs. Science 359, 460–462. doi: 10.1126/science.aar3320
Leonardi, A., Armor, J., Montanio, P., and Werner, C. (2018). CAPSTONE: NOAA’s campaign to address Pacific monument science, technology, and ocean needs. Oceanography 29, 48–52.
Malik, M., Rees, G., Cromwell, M., Robinson, J., and France, S. C. (2020). OER-ONC collaboration to improve video annotations. Oceanography 33:120. doi: 10.5670/oceanog.2020.supplement.01
McKinnie, D., Rotjan, R. D., and Lelei Peau, A. (2018). “Exploring the pacific through international partnerships,” in New frontiers in ocean exploration: The E/V Nautilus, NOAA Ship Okeanos Explorer, and R/V Falkor 2017 Field Season. eds N. A. Raineault, J. Flanders, and A. Bowman. Oceanography, 31:126.
Miyake, H., Shibata, H., and Furushima, Y. (2011). “Deep-sea litter study using deep-sea observation tools,” in Interdisciplinary Studies on Environmental Chemistry-Marine Environmental Modeling and Analysis, eds K. Omori, X. Guo, N. Yoshie, N. Fujii, I. C. Handoh, A. Isobe, et al. (Setagaya-ku: Terrapub), 261–269.
Pham, C. K., Ramirez-Llodra, E., Alt, C. H. S., Amaro, T., Bergmann, M., Canals, M., et al. (2014). Marine litter distribution and density in European seas, from the shelves to deep basins. PLoS One 9:e95839. doi: 10.1371/journal.pone.0095839
Quattrini, A. M., Nizinski, M. S., Chaytor, J. D., Demopoulos, A. W. J., Roark, E. B., France, S. C., et al. (2015). Exploration of the canyon-incised continental margin of the northeastern United States reveals dynamic habitats and diverse communities. PLoS One 10:e0139904. doi: 10.1371/journal.pone.0139904
Ramirez-Llodra, E., Demol, B., Company, J. B., Coll, M., and Sardà, F. (2013). Effects of natural and anthropogenic processes in the distribution of marine litter in the deep Mediterranean Sea. Prog. Oceanogr. 118, 273–287. doi: 10.1016/j.pocean.2013.07.027
Ramirez-Llodra, E., Tyler, P. A., Baker, M. C., Askel Bergstad, O., Clark, M. R., Escobar Briones, E., et al. (2011). Man and the last great wilderness: human impact on the deep sea. PLoS One 6:e22588. doi: 10.1371/journal.pone.0022588
Rotjan, R. D., Sharp, K. H., Gauthier, A. E., Yelton, R., Lopez, E. M. B., Carilli, J., et al. (2019). Patterns, dynamics and consequences of microplastic ingestion by the temperate coral, Astrangia poculata. Proc. R. Soc. B 286:20190726. doi: 10.1098/rspb.2019.0726
Schlining, K., Von Thun, S., Kuhnz, L., Schlining, B., Lundsten, L., Jacobsen Stout, N., et al. (2013). Debris in the deep: using a 22-year video annotation database to survey marine litter in Monterey Canyon, central California, USA. Deep Sea Res. Part I Oceanogr. Res. Pap. 79, 96–105. doi: 10.1016/j.dsr.2013.05.006
Schmidt, C., Krauth, T., and Wagner, S. (2017). Export of plastic debris by rivers into the sea. Environ. Sci. Technol. 51, 12246–12253. doi: 10.1021/acs.est.7b02368
Taylor, M. L., Gwinnett, C., Robinson, L. F., and Woodall, L. C. (2016). Plastic microfibre ingestion by deep-sea organisms. Sci. Rep. 6:33997. doi: 10.1038/srep33997
Van Cauwenberghe, L., Vanreusel, A., Mees, J., and Janssen, C. R. (2013). Microplastic pollution in deep-sea sediments. Environ. Pollut. 182, 495–499. doi: 10.1016/j.envpol.2013.08.013
Vince, J., and Hardesty, B. D. (2016). Plastic pollution challenges in marine and coastal environments: from local to global governance. Restor. Ecol. 25, 123–128. doi: 10.1111/rec.12388
Watters, D., Yoklavich, M., Love, M., and Schroeder, D. (2010). Assessing marine debris in deep seafloor habitats off California. Mar. Pollut. Bull. 60, 131–138. doi: 10.1016/j.marpolbul.2009.08.019
Wieczorek, A. M., Morrison, L., Croot, P. L., Allcock, A. L., Macloughlin, E., Savard, O., et al. (2018). Frequency of microplastics in mesopelagic fishes from the Northwest Atlantic. Front. Mar. Sci. 5:39. doi: 10.3389/fmars.2018.00039
Williams, A., Schlacher, T. A., Rowden, A. A., Althaus, F., Clark, M. R., Bowden, D. A., et al. (2010). Seamount megabenthic assemblages fail to recover from trawling impacts. Mar. Ecol. 31, 183–199. doi: 10.1111/j.1439-0485.2010.00385.x
Windsor, F. M., Ormerod, S. J., and Tyler, C. R. (2018). Endocrine disruption in aquatic systems: up-scaling research to address ecological consequences. Biol. Rev. 93, 626–641. doi: 10.1111/brv.12360
Woodall, L. C., Robinson, L. F., Rogers, A. D., Narayanaswamy, B. E., and Paterson, G. L. J. (2015). Deep sea litter: a comparison of seamounts, banks and a ridge in the Atlantic and Indian Oceans reveals both environmental and anthropogenic factors impact accumulation and composition. Front. Mar. Sci. 2:3. doi: 10.3389/fmars.2015.00003
Keywords: remotely operated vehicle, CAPSTONE, litter, anthropogenic, plastics, fishing gear, marine protected area, national marine monument
Citation: Amon DJ, Kennedy BRC, Cantwell K, Suhre K, Glickson D, Shank TM and Rotjan RD (2020) Deep-Sea Debris in the Central and Western Pacific Ocean. Front. Mar. Sci. 7:369. doi: 10.3389/fmars.2020.00369
Received: 23 October 2019; Accepted: 30 April 2020;
Published: 27 May 2020.
Edited by:
Cristina Gambi, Marche Polytechnic University, ItalyReviewed by:
Kristina M. Gjerde, International Union for Conservation of Nature, SwitzerlandKyle S. Van Houtan, Monterey Bay Aquarium, United States
Copyright © 2020 Amon, Kennedy, Cantwell, Suhre, Glickson, Shank and Rotjan. This is an open-access article distributed under the terms of the Creative Commons Attribution License (CC BY). The use, distribution or reproduction in other forums is permitted, provided the original author(s) and the copyright owner(s) are credited and that the original publication in this journal is cited, in accordance with accepted academic practice. No use, distribution or reproduction is permitted which does not comply with these terms.
*Correspondence: Diva J. Amon, ZGl2YWFtb25AZ21haWwuY29t