 Travis W. Horton1*
 Alexandre N. Zerbini2,3,4,5
 Artur Andriolo4,6
 Daniel Danilewicz4,7,8
 Federico Sucunza4,6,9
- 1Te Kura Aronukurangi – School of Earth and Environment, University of Canterbury, Christchurch, New Zealand
- 2Joint Institute for the Study of the Atmosphere and Ocean (JISAO), University of Washington & Marine Mammal Laboratory, Alaska Fisheries Science Center, National Marine Fisheries Service, NOAA, Seattle, WA, United States
- 3Cascadia Research Collective, Olympia, WA, United States
- 4Instituto Aqualie, Juiz de Fora, Brazil
- 5Marine Ecology and Telemetry Research, Seabeck, WA, United States
- 6Laboratório de Ecologia Comportamental e Bioacústica, ICB, Universidade Federal de Juiz de Fora, Juiz de Fora, Brazil
- 7Grupo de Estudos de Mamiferos Aquaticos do Rio Grande do Sul, Osório, Brazil
- 8Universidade Estadual de Santa Cruz, Jaboticabal, Brazil
- 9Grupo de Estudos de Mamíferos Aquáticos do Rio Grande do Sul (GEMARS), Rua Bento Gonçalves, Torres, Brazil
Understanding how organisms respond to environmental change is one of the most pressing grand challenges of organismal biology. In the vast oceans that cover 71% of Earth’s surface, remote sensing technologies have created unprecedented opportunities to create new knowledge and deliver integrated understandings of marine organism-environment interactions via long-term monitoring. Using historic whaling records and >15 years of satellite-derived data, we show that movement parameters associated with long-distance humpback whale migrations, including utilization of a south-southeast directed migratory corridor, migration path straightness, direction, timing, and velocity, have not significantly changed during a period of dynamic oceanographic and geomagnetic conditions. These findings reveal an apparent paradox: humpback whale migrations do not change in a changing ocean. Geophysical analyses of the same humpback whale movements demonstrate that these whales maintained prolonged migratory fidelity to a limited suite of spatiotemporal trajectories through gravitational coordinates, raising the possibility that migratory decisions are relatively insensitive to changing oceanographic and geomagnetic conditions. Our findings highlight the importance of filling the knowledge gaps that currently limit our ability to understand and anticipate organismal responses to rapidly changing Earth system conditions.
Introduction
Migratory animals face an uncertain future (Cotton, 2003; Wilcove and Wikelski, 2008; Hazen et al., 2013; Hof et al., 2017; Cohen et al., 2018). Global change, climate change, development, resource extraction, habitat fragmentation, and other human-induced perturbations combine to present unprecedented challenges to the sustainability of migratory populations and the ecosystem services they provide (Peñuelas et al., 2002; Harris et al., 2009, 2018; Roman and McCarthy, 2010; Thackeray et al., 2016; van Doren et al., 2017). Ensuring that sustainable populations of migratory animals persist into the future requires knowledge of how migrants respond to Earth system dynamics (Schwenk et al., 2009; Bowlin et al., 2010).
It is widely agreed that addressing the challenges inherent to a dynamic Earth system requires long-term monitoring delivered through integrated interdisciplinary research approaches (Schwenk et al., 2009; Bowlin et al., 2010; Hays et al., 2016; Urban et al., 2016; Miloslavich et al., 2018). At present, models intending to predict the effects of Earth system dynamics on the biosphere suffer from both a lack of data and a limited understanding of the dominant biological mechanisms through which adaptations occur, including: phenology and demography; physiology; range dynamics; evolutionary potential; species interactions; and organismal responses to environmental variability (Urban et al., 2016). Robust prediction of future scenarios requires monitoring of the relevant variables at appropriately matched spatial and temporal scales (Hazen et al., 2013; Pereira et al., 2013; Urban et al., 2016; Miloslavich et al., 2018). Although significant progress in remote monitoring has occurred, relatively few studies integrate long-term datasets of both organismal behavior and the dynamic environments they inhabit (Sprogis et al., 2018; Abrahms et al., 2019). The primary goal of this research was to explore gaps in our knowledge regarding how humpback whale (Megaptera novaeangliae) long-distance migrations respond to oceanographic and geomagnetic change through long-term remote ocean monitoring.
Environmental changes should evoke biological responses, including habitat shifts in marine organisms (e.g., Hoegh-Guldberg and Bruno, 2010; Hazen et al., 2013), and large whales are no exception (Santora et al., 2020). For example, recent research suggests that ocean circulation dynamics in the North Atlantic have forced changes in right whale (Eubalaena glacialis) foraging patterns (Record et al., 2019), and in the North Pacific, humpback whale feeding behavior has been shown to respond to oceanographic conditions, including sea surface temperature, upwelling, and biomass (Fleming et al., 2016). Along the coast of California, habitat compression associated with the 2014–2016 marine heatwave likely contributed to an order of magnitude increase in annual humpback whale entanglement rate (Santora et al., 2020). In the South Pacific, Oceania’s changing climate is predicted to cause distribution shifts in endangered humpback whales (Derville et al., 2019). In the Southwest Atlantic, environmental variables, including ocean currents and sea surface temperatures, were found to be strong predictors of humpback whale distribution in the Abrolhos Bank breeding area (Bortolotto et al., 2017). Ocean water temperature has also been linked to changes in humpback whale foraging behavior in the Southern Ocean (Owen et al., 2019). Although the literature clearly establishes that large whale distribution and behavior are sensitive to environmental conditions in their breeding and feeding areas, the cues and conditions that inform long-distance migratory behavior remain largely unknown.
Current evidence suggests that whale movement decisions are likely informed by some combination of magnetic, oceanographic, and gravitational cues. For example, integrating magnetic cues into whale behavior research has led to novel insights into whale stranding and navigation (Kirschvink et al., 1986; Horton et al., 2017). Oceanographic conditions, including temperature, productivity, and currents, are known to be key variables in whale distribution (e.g., Horton et al., 2011; Hazen et al., 2013; Fleming et al., 2016; Derville et al., 2019; Owen et al., 2019), and gravity is an inescapable driver of whale buoyancy and movement behavior (e.g., Clarke, 1978; Horton et al., 2017).
Yet, oceans are highly dynamic, and in the Southwest Atlantic magnetic and oceanographic cues are anything but constant. Sophisticated long-term analyses of satellite-derived oceanographic observations of the southwest Atlantic’s sub-tropical gyre, where the Malvinas (10–88 Sv) and Brazil (5–22 Sv) currents converge, demonstrate that oceanographic conditions throughout the region, including water transport, eddy kinetic energy, sea height anomaly, sea surface temperature, and ocean current circulation patterns, are extremely variable throughout the region (Goni et al., 2011; Wu et al., 2012; Marcello et al., 2018). With respect to magnetism, the South Atlantic Anomaly (SAA) is the most rapidly changing feature in Earth’s magnetic field over the past 400 years (Hartmann and Pacca, 2009). In marked contrast, latitude and bedrock dependent gravitational cues are relatively stable despite the presence of pronounced gravitational anomalies, like the Rio Grande Rise (Mohriak et al., 2010).
Because the Southwest Atlantic is known to be dynamic with respect to oceanographic and magnetic conditions, but stable with respect to gravity, it is an ideal region in which to explore possible correlations between movement behaviors and oceanographic and geophysical cues, including gravity. By integrating long-term humpback whale satellite tracking and historic whaling datasets with satellite-derived oceanographic, magnetic, and gravitational monitoring and mapping datasets, our research illuminates one of biology’s most pressing questions: How do animal migrants respond, if at all, to environmental dynamics?
Materials and Methods
We present satellite-monitored essential biodiversity and ocean variables during a multi-decadal period of humpback whale migratory route fidelity in the Southwest Atlantic Ocean. Our study integrates published whaling records with several satellite-derived remote sensing datasets, including: (1) the latitude, longitude, and date on which 243 humpback whales were killed by the Soviet Yuri Dologorukiy fleet in the Southwest Atlantic Ocean between 1965 and 1973 (Zemsky et al., 1996; Figure 1A); (2) platform transmitting terminal (PTT) satellite telemetry data that document the spatial and temporal locations of 20 humpback whales as they migrated through a <350 km wide and >3000 km long south-southeast corridor (SSEC) in the South Atlantic Ocean between 2003 and 2018 (Figures 1B,C); (3) magnetic field parameters determined using the Swarm satellite derived Enhanced Magnetic Model (Chulliat et al., 2015); (4) Terra satellite derived Moderate Resolution Imaging Spectroradiometer (MODIS) estimates of near-surface temperature (NASA, 2018) and chlorophyll-a concentrations (NASA, 2018); (5) Ocean Surface Current Analysis Real-time (OSCAR) estimates of near-surface ocean currents based on data collected by Jason-1/Jason-2 and Gravity Recovery and Climate Experiment (GRACE) satellites (ESR, 2009); (6) latitude and bedrock dependent gravitational acceleration data derived, in part, from TOPEX/Poseidon satellite observations (Balmino et al., 2012; Götze, 2014). We integrated these datasets through geospatial and time-series analyses that collectively reveal how humpback whales respond, and fail to respond, to changing Earth system conditions. The specific hypothesis we tested was: Southwest Atlantic humpback whale migratory movements describe systematic and highly reproducible sinusoidal trajectories when plotted in spatiotemporal gravitational coordinates (Horton et al., 2017).
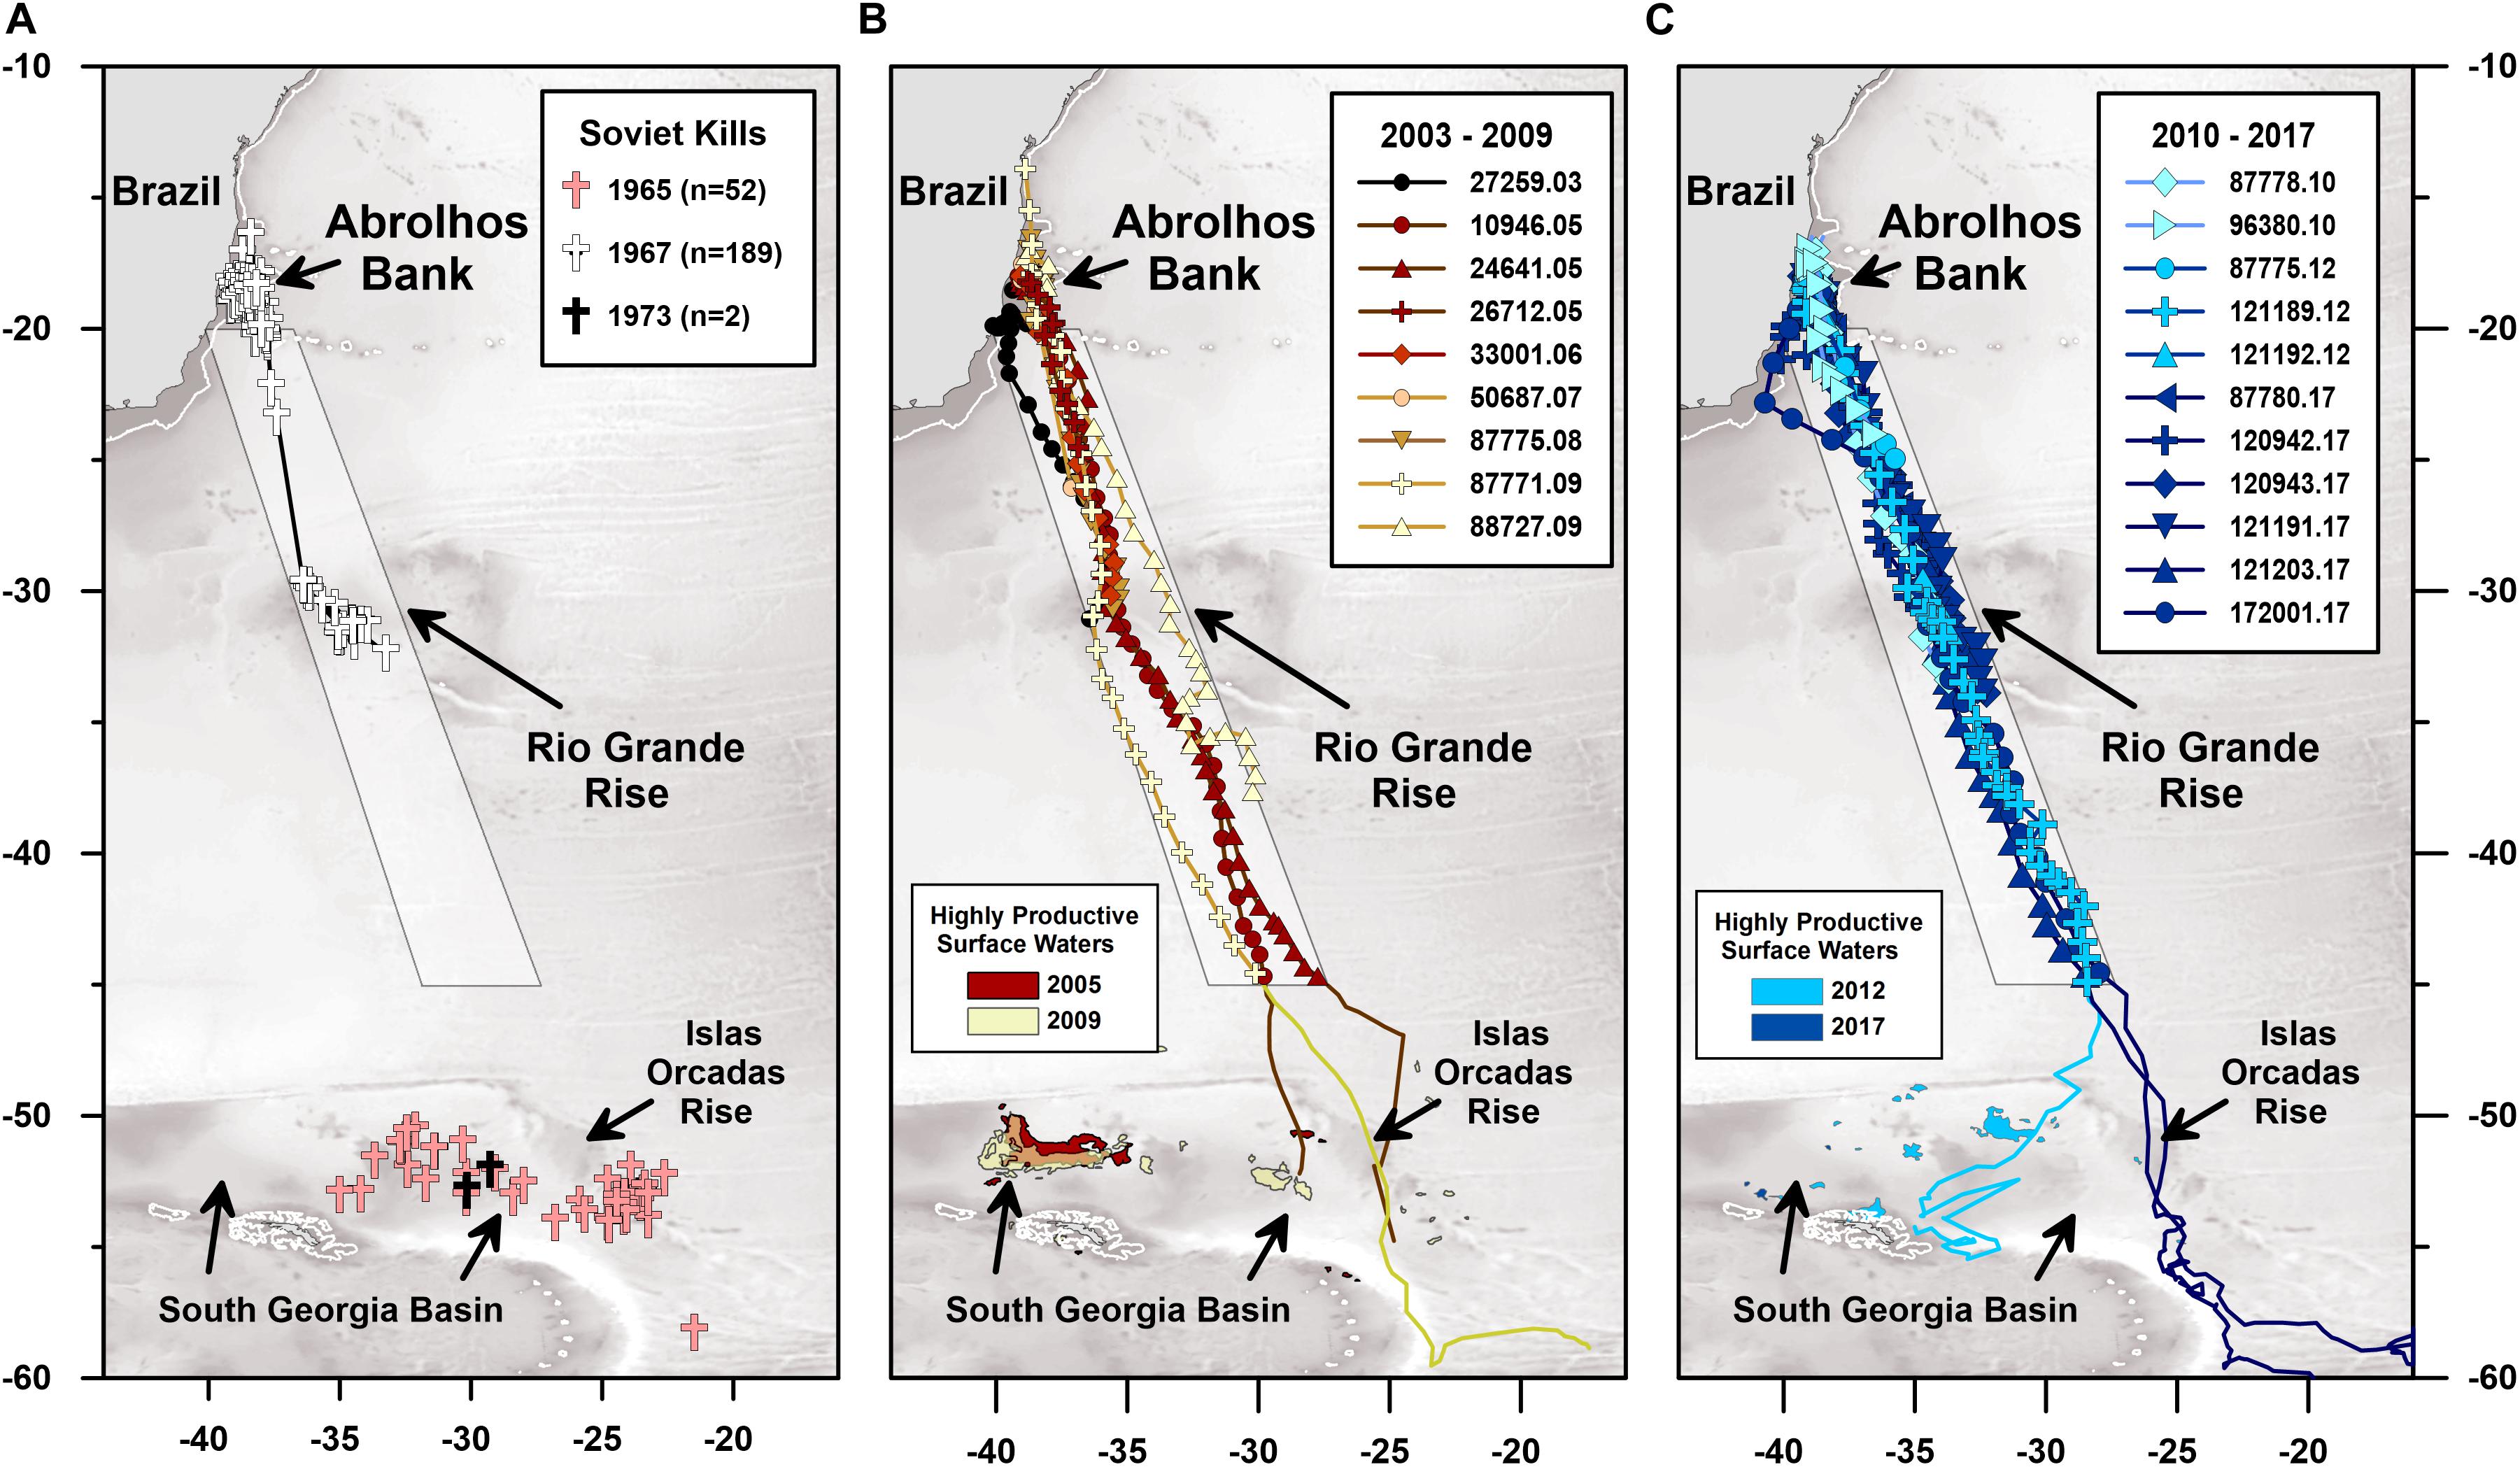
Figure 1. Satellite-monitored movements of 20 humpback whales tagged on Abrolhos Bank, Brazil, between 2003 and 2017. (A) Map showing the location of 243 humpback whales killed by the Soviet Yuri Dologorukyi whaling fleet, including: 52 whales killed in the South Georgia Basin and Islas Orcadas Rise feeding areas during austral winter 1965–1966; 189 whales killed between the Abrolhos Bank calving ground and Rio Grande Rise during austral Spring 1967; and 2 whales killed in South Georgia Basin on February 15–16, 1973 (Zemsky et al., 1996), (B) 2003–2009 tracks of 9 whales (individual platform transmitting terminal numbers as indicated in the legend), (C) 2010–2017 tracks of 11 whales (individual platform transmitting terminal numbers as indicated in the legend). White lines depict the 200 m bathymetric contour. Gray-scale basemap depicts 1 arc-minute resolution (Amante and Eakins, 2009) bathymetry. White shaded polygon corresponds with the 350 km wide south-southeast corridor (SSEC) used by the 20 tracked whales. Highly productive surface waters (i.e., mesotrophic waters with >2.6 g m–3 chlorophyll-a) for the month of December, when the tracked whales first arrived in the South Georgia Basin feeding grounds, are shown as colored polygons as indicated in the legends.
Humpback Whale Locations and Movement Variables
As part of a long-term monitoring program, 138 PTT tags were deployed on humpback whales seasonally residing off the coast of Brazil between 2003 and 2018 (Zerbini et al., 2006, 2011; this study). Humpback whales were tracked using published methods (Zerbini et al., 2006, 2011; Horton et al., 2011, 2017). In brief, SPOT radio-frequency PTT satellite tags (Wildlife Computers, Redmond, WA, United States) were transdermally implanted into the upper flank of each whale near the base of the dorsal fin using a carbon-fiber pole or a modified pneumatic line-thrower. In all references to PTT tag numbers in the current study, the two digits to the right of the decimal point correspond with the abbreviated Julian calendar year in which the tag was deployed.
Raw humpback whale location estimates were assigned a location class (i.e., 3, 2, 1, 0, A, B, Z) by the Argos-CLS system based on the estimated location error and the number of messages received (Argos-CLS, 2016). All locations that passed a 20 km h–1 velocity filter were used in this study. Velocity-filtered locations were combined to determine single average daily locations for each whale using PAST (v. 3.26; Hammer et al., 2001) to ensure that individual tracks were uniformly distributed with respect to time. The humpback whale tracking research we report was performed in accordance with research approvals granted by the Brazilian Environmental Agency (IBAMA), permit #009/02/CMA/IBAMA and process #02001. 000085/02-27.
The date and location of 243 humpback whales killed by the Soviet Yuri Dologorukiy fleet between 1965 and 1973 were derived from the records reported by Zemsky et al. (1996; see also: Zerbini et al., 2006). Our understanding is that the Yuri Dologorukiy fleet humpback whale kills we report were hidden, in hard copy form, in the potato cellar of Dimitry Tomorsov until the end of the Cold War.
Humpback whale movement variables, including movement direction, distance traveled, straightness index, and movement velocity, were determined using the equations (1–4) as reported below. Movement direction was determined by:
where: α is the whale’s movement direction in degrees; λ1 and φ1 are the whale’s longitude and latitude, respectively, in decimal degrees at location 1; λ2 and φ2 are the whale’s longitude and latitude, respectively, in decimal degrees at location 2; e is the eccentricity of the spheroid (i.e., 0.081819791). Distance traveled was determined by:
where: S is the distance traveled between locations; a is the length of the major semiaxis in km (i.e., 6378.137 km); a is the whale’s movement direction in degrees; e is the eccentricity of the spheroid (i.e., 0.081819791); φ1 is the whale’s latitude in decimal degrees at location 1; φ2 is the whale’s latitude in decimal degrees at location 2. Since the Argos-CLS system provides point locations rather than movement paths, the distance traveled data are minimum estimates of the true distance traveled between sequential locations. Straightness index was determined by:
where: SI is the straightness index as defined by Batschelet (1981); D is the finite rhumb line distance between a starting location and an end location; L is the length of path followed between the starting location and the end location. Movement velocity was determined by:
where: v is the velocity; S is the distance traveled (see: equation 2); t2-t1 is the time it took for the whale to travel from location 1 to location 2. Since S is necessarily a minimum estimate of the true distance traveled, the movement velocity values we report will also be minimum estimates of true movement velocity. Kernel density estimation (Silverman, 1986) was used to determine the number of modes present in the humpback whale movement velocity data distribution.
Spatiotemporal, Geophysical, and Astronomical Variables
Spatiotemporal, geophysical, and astronomical variables were determined for the humpback whale locations we report. The time at which each whale initiated its continuous southward migration away from Abrolhos Bank was determined via piecewise linear regression breakpoint analysis (PLR-BPA) using the ‘segmented’ package in [R] (Muggeo and Muggeo, 2017). We used PLR-BPA, rather than state-space switching models, as PLR-BPA enables quantification of the time at which movement behavior likely changed between sequential PTT locations. These piecewise linear regression breakpoint analyses allowed us to determine both when and where major changes in humpback whale movement behavior occurred, including: (1) migratory departures, represented in the tracking data as the time and place where each whale initiated continuous directional movement; (2) migratory stop-overs; (3) migratory re-starts following stop-overs.
Geomagnetic field parameters, including inclination (I) and intensity (F) at each PTT location, were determined using the Enhanced Magnetic Model (Chulliat et al., 2015). Latitude and bedrock dependent gravitational accelerations at each PTT location were determined using the International Gravity Formula (Götze, 2014) and spherical harmonic analysis of the Earth’s topography–bathymetry ETOPO1 (Amante and Eakins, 2009) dataset up to degree and order 10,800 as reported in the International Gravimetric Bureau’s 2 × 2 arc-min (i.e., ∼3.7 × ∼3.7 km) World Gravity Map (Balmino et al., 2012). Astronomical variables, including moon illumination, Earth-moon distance, and lunar declination, were calculated using astronomical algorithms (Meeus, 1991). The magnitude of the tidal gravity vector at the Abrolhos Bank migratory departure site of PTTs 24641.05, 121203.17, and 120942.17 were determined using ETIDE (Fisahn et al., 2012, 2015).
Using these geophysical data we determined the latitude and bedrock dependent gravitational accelerations experienced by each whale. We then normalized the sum of these two spatially dependent gravitational cues to the gravitational acceleration present at the individual humpback whale migratory departure sites identified using PLR-BPA. This departure site normalization was done by:
where: gL is the latitude dependent gravitational acceleration at the whale’s location; gB is the bedrock dependent acceleration (i.e., Bouguer gravity anomaly); gLd is the latitude dependent gravitational acceleration at the whale’s migratory departure site identified by PLR-BPA; gBd is the bedrock dependent gravitational acceleration at the same migratory departure site for which gLd was determined. We plotted these departure site-normalized gravity data against moon illumination, a temporally dependent visual and gravitational cue. We analyzed the resulting migratory trajectories using PAST’s (v. 3.26; Hammer et al., 2001) sinusoidal regression. In this study, we restricted our least-squares regression analyses to a single sinusoid of the general form,
where: a is the amplitude of the sinusoid, which we did not restrict to the natural range in moon illumination values (i.e., 0 to 1); gL, gLd, gB, and gBd are the same as in equation (5); Λ is the sinusoidal period; Φ is the sinusoidal phase. PAST minimizes the residual sum of squares via an ordinary least squares regression process by adjusting the fitted sinusoid’s amplitude, period and phase.
Oceanographic Variables
Oceanographic variables, including sea surface temperatures, ocean currents, and Chlorophyll-a concentrations, were extracted from satellite monitored raster datasets at humpback whale locations using ArcGIS Desktop (ESRI, 2011). Sea surface temperature and chlorophyll-a concentration rasters (4 km pixel size) were obtained from the Goddard Space Flight Center (NASA, 2018); zonal and meridional ocean surface currents (1/3° pixel size) were estimated using the ocean surface current analysis real-time (OSCAR) model provided by JPL Physical Oceanography DAAC and developed by Earth and Space Research (ESR, 2009). In order to determine if any significant trends were present in the oceanographic conditions the tracked whales experienced, we performed Mann-Kendall trend tests (Gilbert, 1987), a non-parametric test for the presence of significant temporal trends in time-series data, on equally spaced sea-surface temperatures in the SSEC, total areal extent of mesotrophic ocean surface waters (i.e., >2.6 g m–3 chlorophyll-a concentration) in the southwest Atlantic/Southern Ocean basin, and ocean surface current direction within the SSEC every December during the 2002–2017 satellite tracking period. Mann-Kendall trend tests were also performed on the 2003–2018 humpback whale movement parameters: straightness, swimming direction, date of migration onset, and swimming velocity.
Results
The data we report include six primary findings. First, the historic Soviet whaling and satellite telemetry data demonstrate that Southwest Atlantic humpback whales have utilized a spatially restricted ∼1.0 million km2 migratory corridor (i.e., SSEC) for >50 years (Figure 1). Second, fidelity to the SSEC manifests as relatively constant movement parameters, including straightness (Batschelet, 1981), movement direction, timing, and velocity when analyzed with respect to time. Third, humpback whale movement velocities in the SSEC was bimodal. Fourth, orientation cues derived from Earth’s magnetic field changed significantly (p << 0.05) during the 2003–2018 monitoring period. Fifth, essential oceanographic variables (Miloslavich et al., 2018), including sea surface temperature, ocean current direction, and productivity, were highly variable during the 2003–2018 monitoring period. Sixth, the humpback whale migrations we report describe highly significant and reproducible sinusoidal gravitational coordinate (i.e., g-space) trajectories.
Soviet Whaling and Humpback Whale Satellite Telemetry
Between 1965 and 1973 the Soviet Yuri Dologorukiy fleet killed 243 humpback whales in the Southwest Atlantic Ocean (Zemsky et al., 1996). Fifty-two of these whales were killed on their feeding grounds in the South Georgia Basin during the austral summer of 1965–1966. Not long after, during a 2-week period between 31 October and 13 November, 1967, the same fleet killed 189 humpback whales on the Abrolhos Bank calving grounds or within the SSEC (Figure 1A). Prolonged utilization of this same south-southeast directed migratory corridor (i.e., SSEC) is confirmed by the 2003–2018 humpback whale tracking dataset reported below.
The humpback whale tracking dataset we analyzed includes 45 PTT tags (i.e., 33% of all tags) that successfully recorded the onset of individual southward migrations away from the continental shelf and migratory movement south of −24°S latitude. Of these 45 migratory movements, 20 whales followed open-ocean paths that fell within the 350 km wide and 3000 km long SSEC located between −20°S and −45°S latitude (Figures 1B,C). Of the 20 whales that utilized the SSEC, only 6 were successfully tracked south of −45°S latitude and into the population’s feeding grounds within and adjacent to the South Georgia Basin (Figures 1B,C). Satellite telemetry tracking data for 5 of these 20 whales (PTTs: 27259.03; 10946.05; 26712.05; 24641.05; 87771.09) have been published previously (Zerbini et al., 2006, 2011; Horton et al., 2011).
The PTT satellite tracking data demonstrate that 44% of migrating whales (i.e., 20 of 45 tracked whales) utilized less than 10% of the available ocean area during a >15 year-long period, consistent with the finding that multiple species of marine megafauna are capable of prolonged spatial and temporal fidelity to well-defined migratory domains (Horton et al., 2017). Movement parameters, including straightness (Figure 2A), swimming direction (Figure 2B), the timing of migratory onset (Figure 2C), and swimming velocity (Figure 2D), for the 20 whales migrating through the SSEC, showed no significant trends through time (p > 0.05; non-parametric Mann-Kendall trend test).
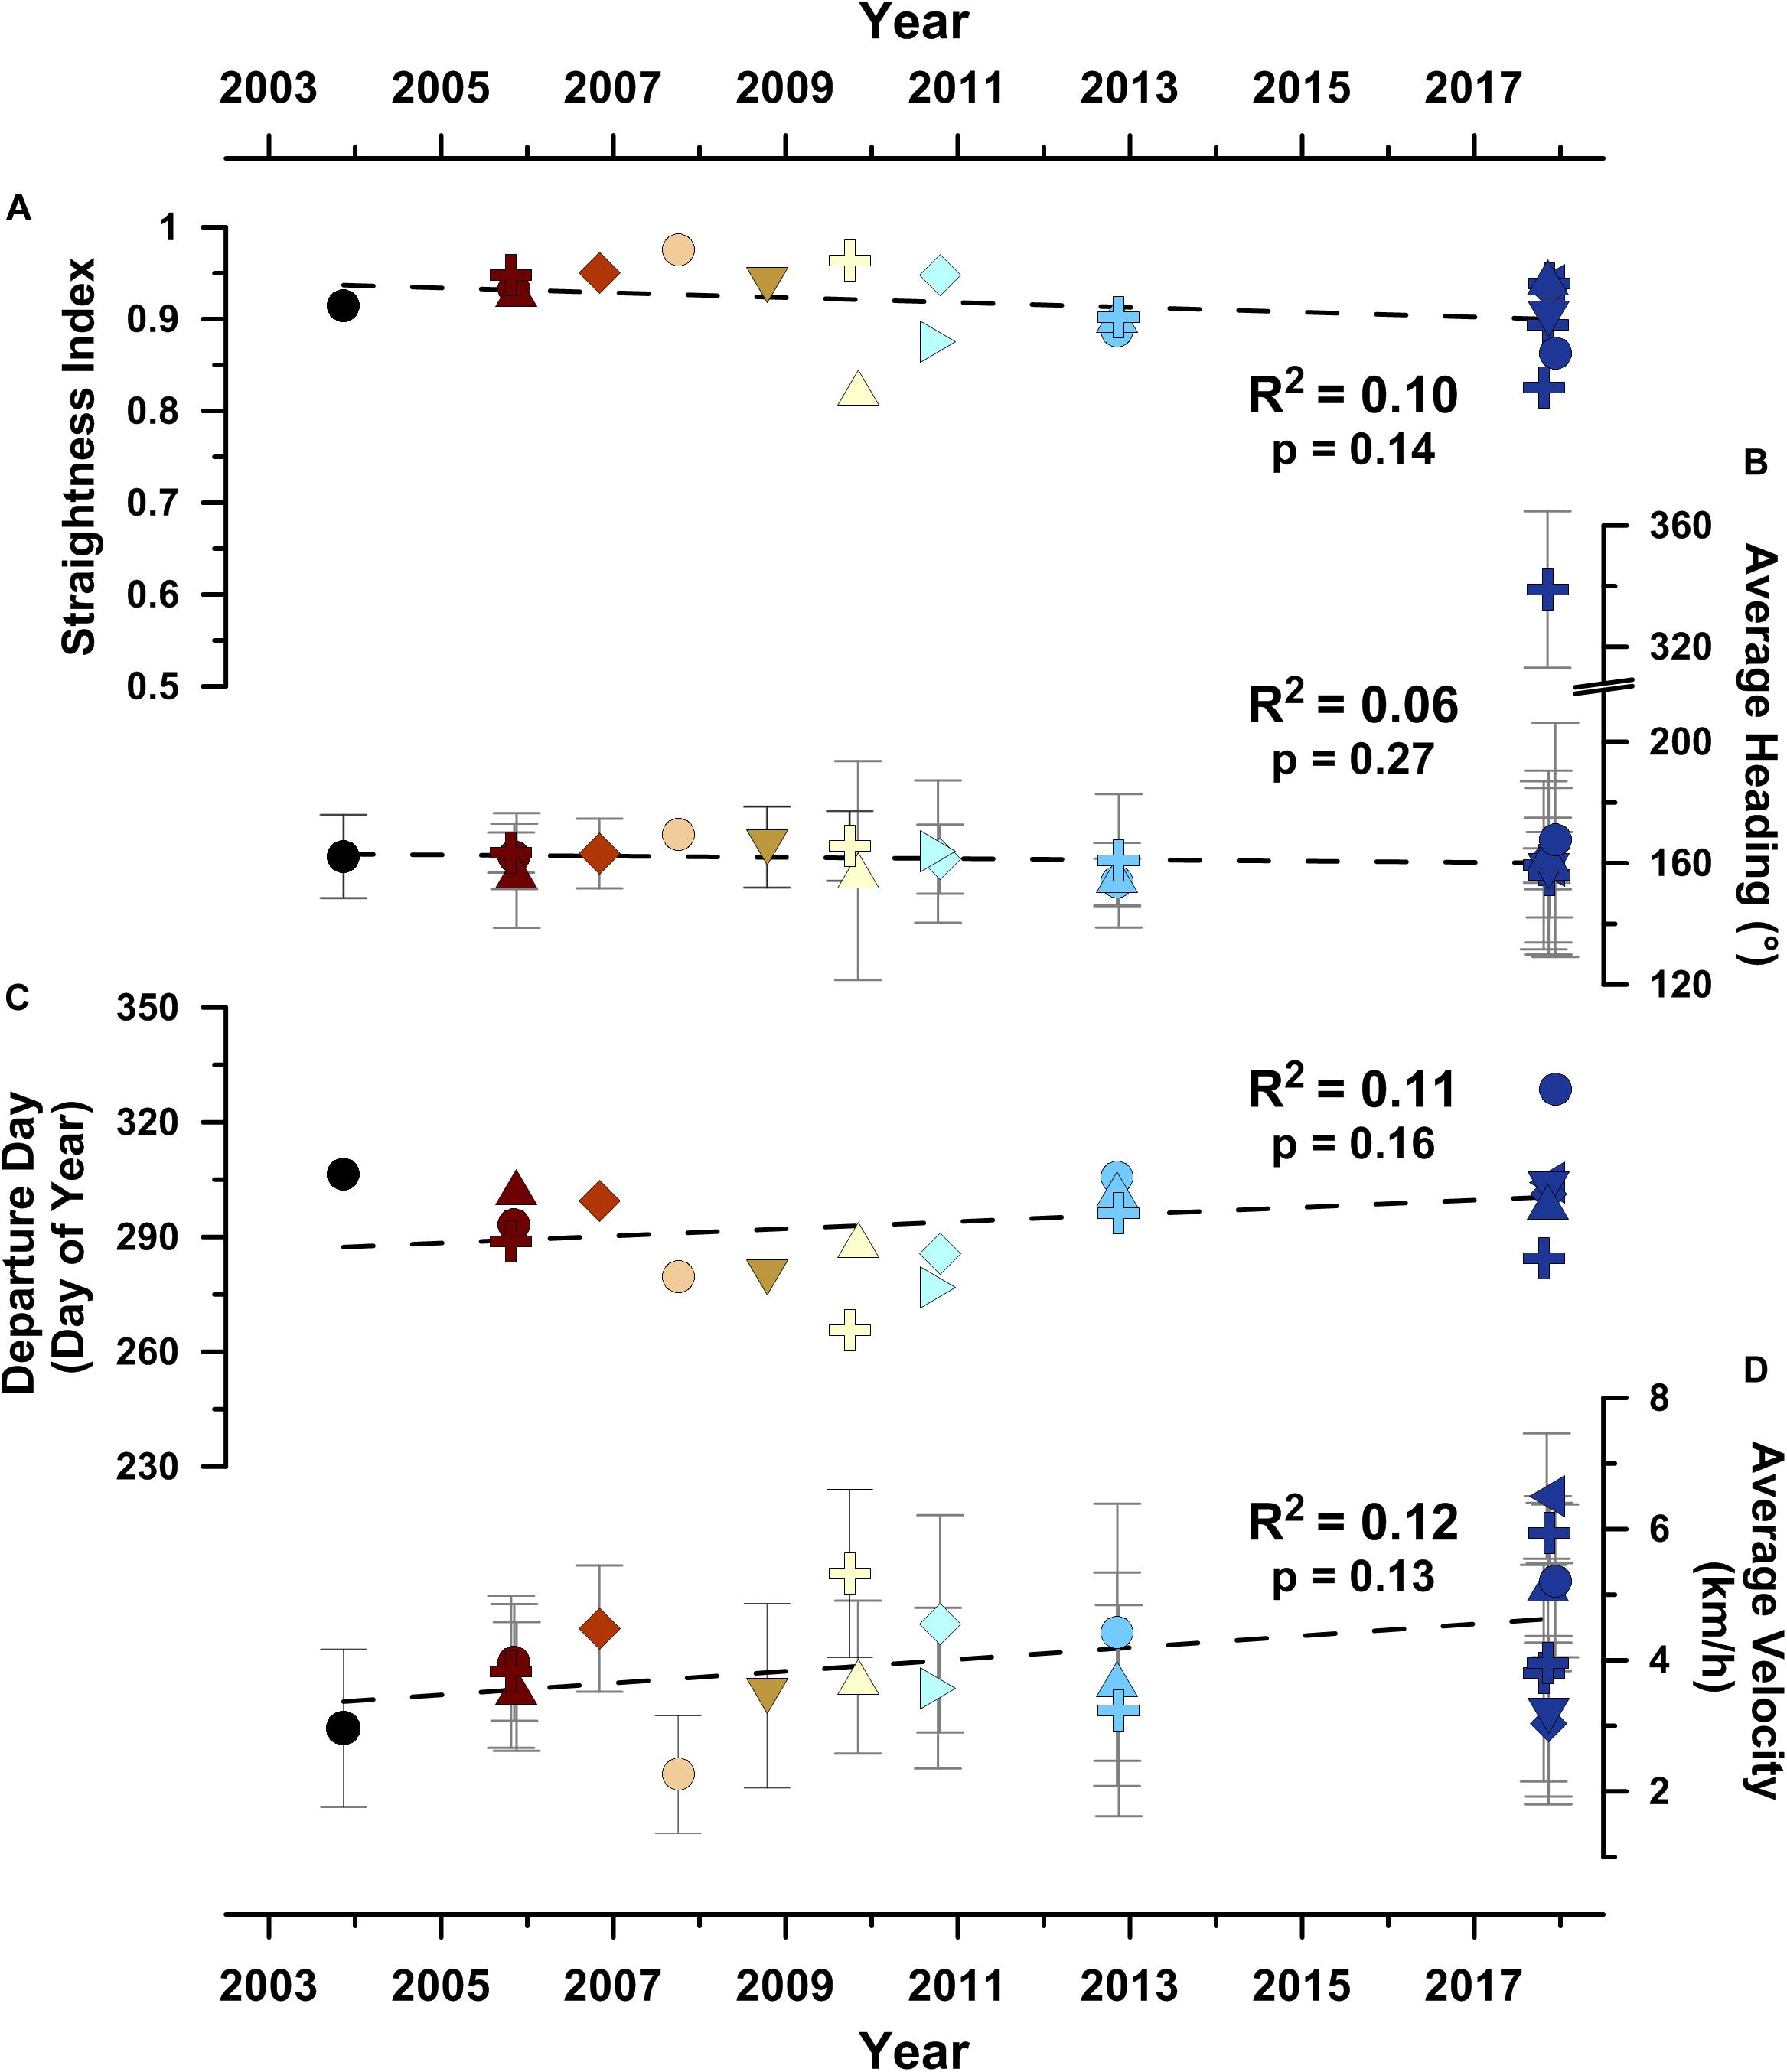
Figure 2. Movement parameters for the 20 humpback whales migrating through the south-southeast migratory corridor (i.e., SSEC) across the 2003–2018 year satellite tracking campaign. (A) Movement straightness index (see section “Materials and Methods”; Batschelet, 1981), (B) average swimming direction heading, (C) day of departure from Abrolhos Bank wintering grounds, and (D) average swimming velocity. Symbols as shown in Figure 1. Gray whiskers show ± 1σ error bars in (B,D). Least-squares linear regression correlation coefficients are shown alongside non-parametric Mann-Kendall trend test (Gilbert, 1987) probabilities (i.e., p-values) that a significant (i.e., p < 0.05) temporal trend is present.
However, kernel density estimation revealed that the swimming velocity data distribution was bimodal (Figure 3), with a slow mode peaking at 3.23 km h–1 and a fast mode peaking at 4.54 km h–1. The swimming velocities we report are consistent with PTT derived humpback whale swimming velocities reported by others, including: (1) 3.4 and 3.6 km h–1 in the Southwest Pacific Ocean (Hauser et al., 2010; Riekkola et al., 2018); (2) 3.6 km h–1 in the Indian Ocean (Trudelle et al., 2016); (3) 4.1 km h–1 in the North Atlantic (Kennedy et al., 2014); (4) 4.5 and 6.25 km h–1 in the North Pacific (Mate et al., 1998). Due to the bimodal distribution we observed, we classified individual whales as either slow (<4.0 km h–1) or fast (≥4.0 km h–1), based on their average migratory swimming velocities (Table 1).
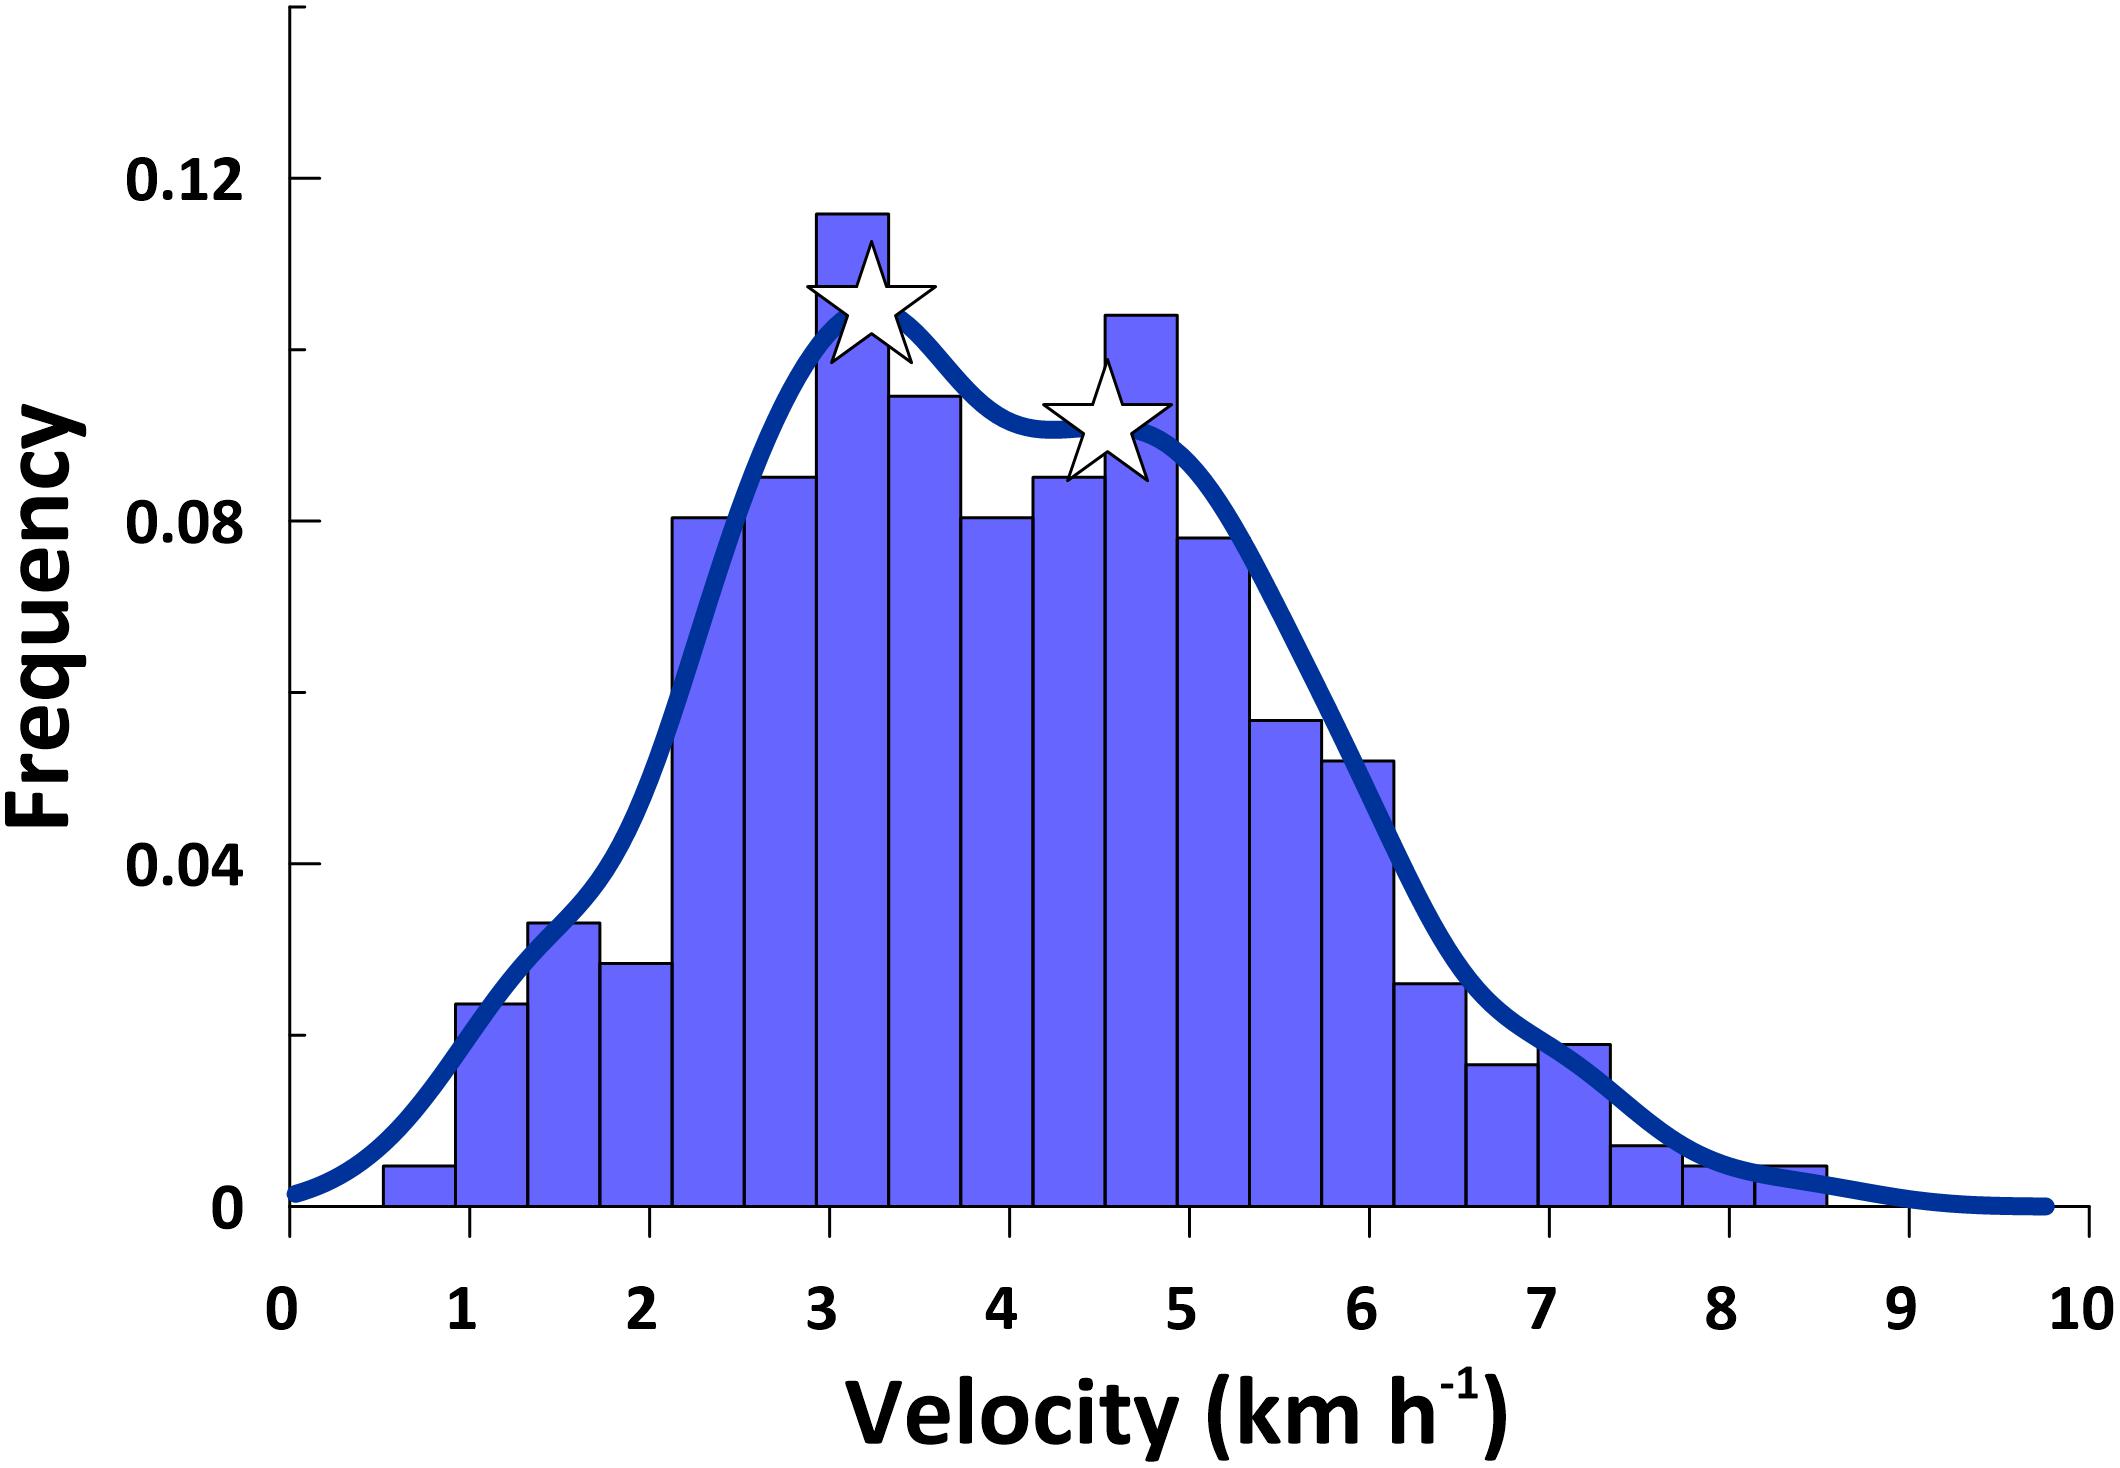
Figure 3. Histogram showing the frequency of humpback whale swimming velocities between interpolated average daily locations (n = 424) in the south-southeast directed migratory corridor. Blue curve shows the bimodal humpback whale swimming velocity kernel density estimation. Peaks in the swimming velocity distribution are shown by the two white stars and occur at 3.23 km h–1 (slow mode) and 4.55 km h–1 (fast mode).
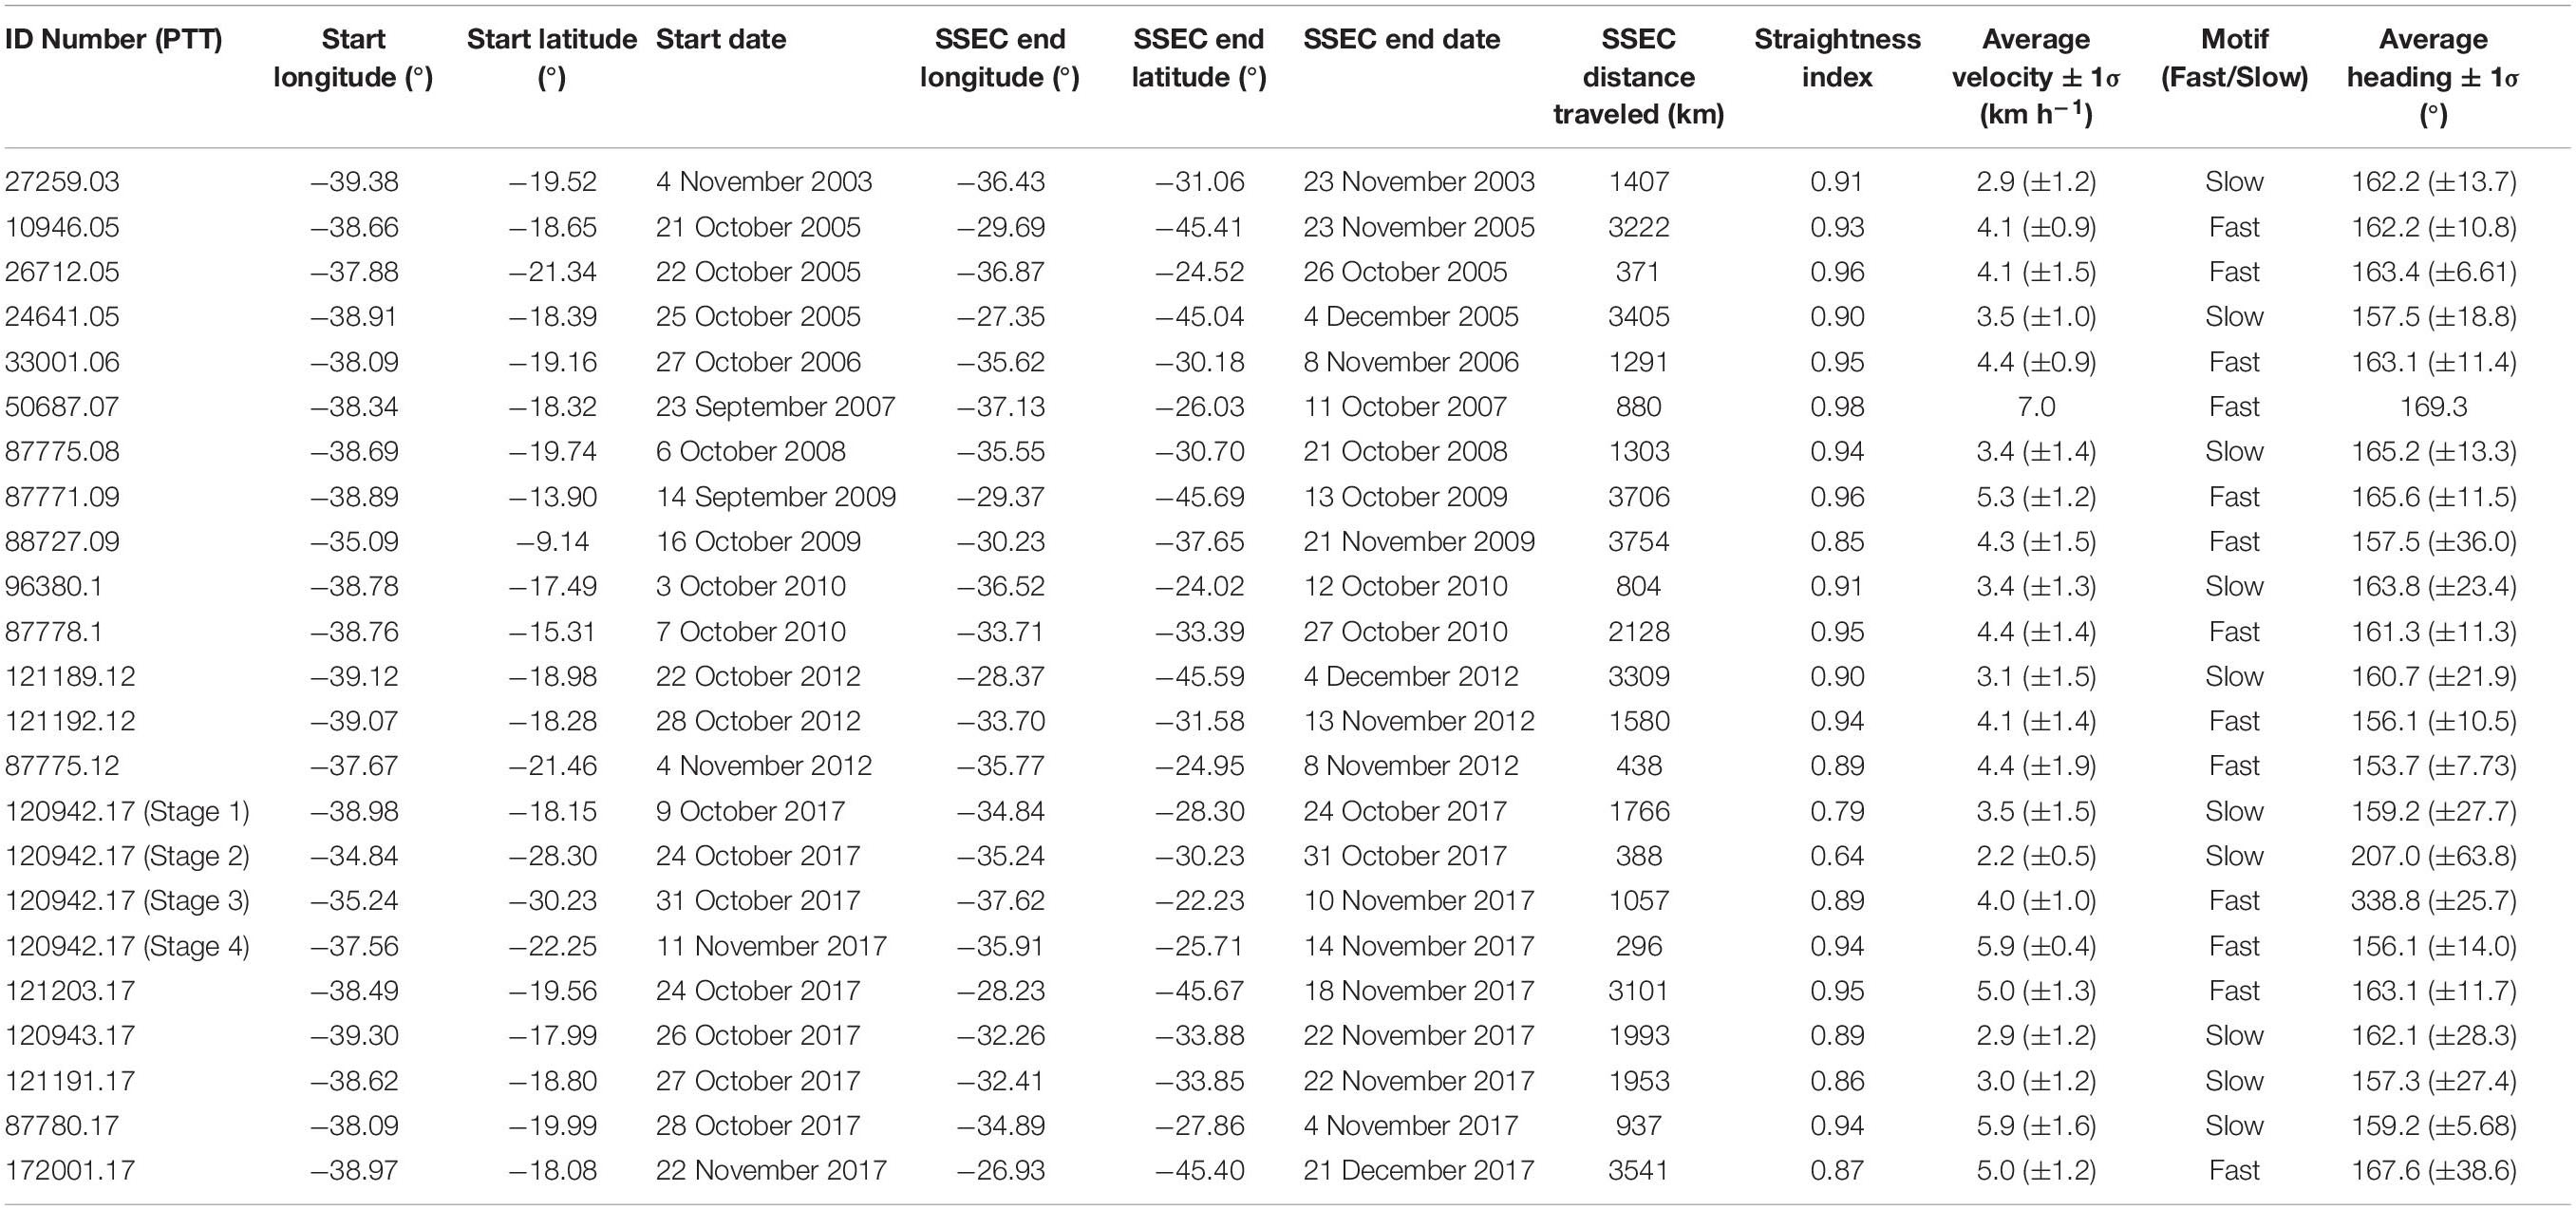
Table 1. Satellite telemetry data summary.
The bimodal swimming velocity distribution is likely real, and not an artifact of the potential PTT underestimation of true swimming velocity, because of the straightness of the migratory paths followed by these whales (Table 1 and Figures 1, 4). To demonstrate this point, we calculated the cumulative migratory distance traveled, using both raw Argos PTT location estimates and our interpolated whale locations, for both a slow (PTT 87775.08) and a fast (PTT 121203.17) whale during the first ∼1000 km of their southward migrations (Figure 4C). As expected, the more frequent Argos PTT location estimates yielded higher cumulative distances traveled at any point in time during the satellite monitored migratory movements. However, there is an extremely significant difference (p < 0.05; t-test on the linear regression slopes) between the fast and the slow swimming velocities for both the raw Argos PTT data and the interpolated daily locations. Although interpolation of higher temporal resolution PTT location estimates minimizes movement distances and velocities, these effects do not obscure significant differences in movement parameters in directional long-distance migration data. Noad and Cato (2007) demonstrate that singing humpbacks swim significantly slower than non-singing humpbacks during long-distance migration, suggesting a potential sex-related or behavioral driver for the bimodal swimming velocity distribution we report, and further investigation of the role acoustics play in long-distance movement behaviors is warranted.
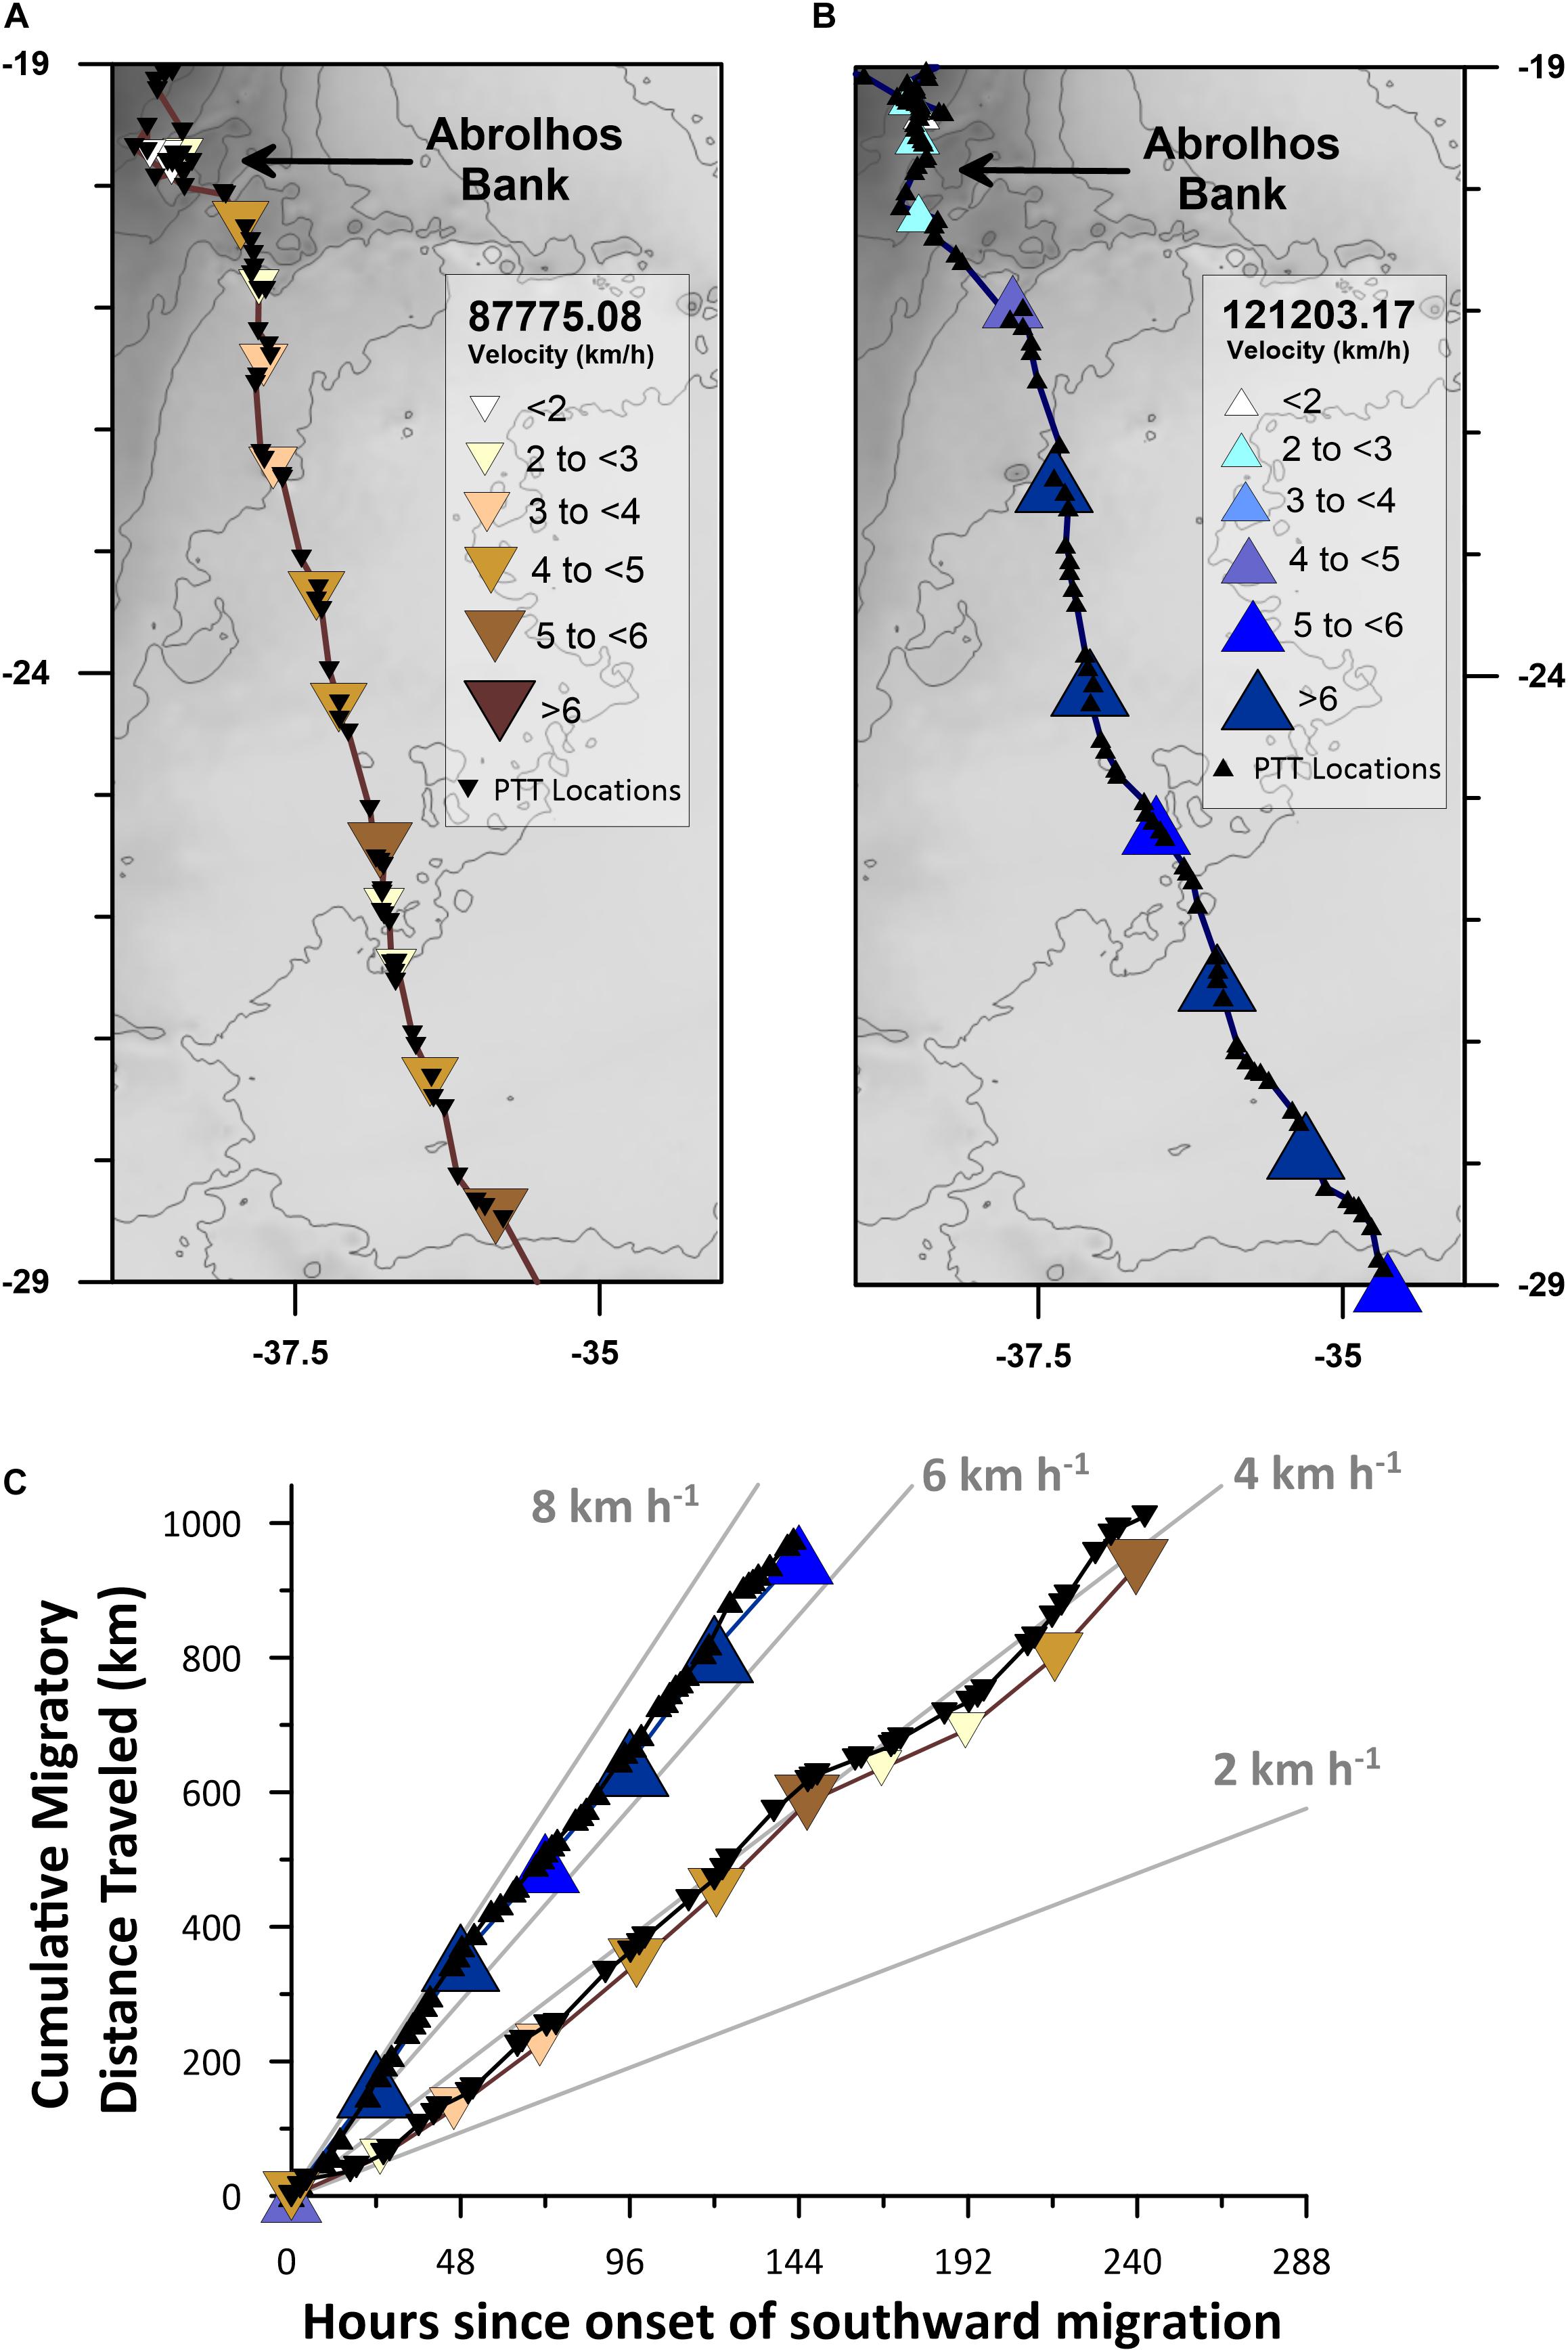
Figure 4. Satellite track maps and cumulative migratory distance traveled time-series for the first ∼1000 km of a slow (PTT 87775.08) and a fast (PTT 121203.17) humpback whale’s directional long-distance migrations. (A) Raw Argos PTT location estimates (black inverted triangles) and interpolated daily location estimates (colored inverted triangles classified by velocity; see legend) for humpback whale PTT 87775.08. (B) Raw Argos PTT location estimates (black triangles) and interpolated daily location estimates (colored triangles classified by velocity; see legend) for humpback whale PTT 121203.17. (C) Cumulative migratory distance traveled time-series plot of the raw Argos PTT and interpolated daily location estimates shown in (A,B). Gray-scale basemap depicts contoured (50 mGal interval) bedrock derived Bouguer Gravity Anomaly values (Balmino et al., 2012).
Piecewise linear regression breakpoint analysis identified significant breakpoints associated with migratory departures for 15 of the whales that migrated through the SSEC (Figure 5A). The satellite tracking data for the remaining 5 whales that used the SSEC did not include significant breakpoints associated with the onset of southward migration because either: (1) the whale was already migrating southward when its PTT tag was deployed (e.g., Figure 5B); or (2) the PTT dataset included a >3 day-long gap spanning the onset of continuous southward movement (e.g., Figure 5C).
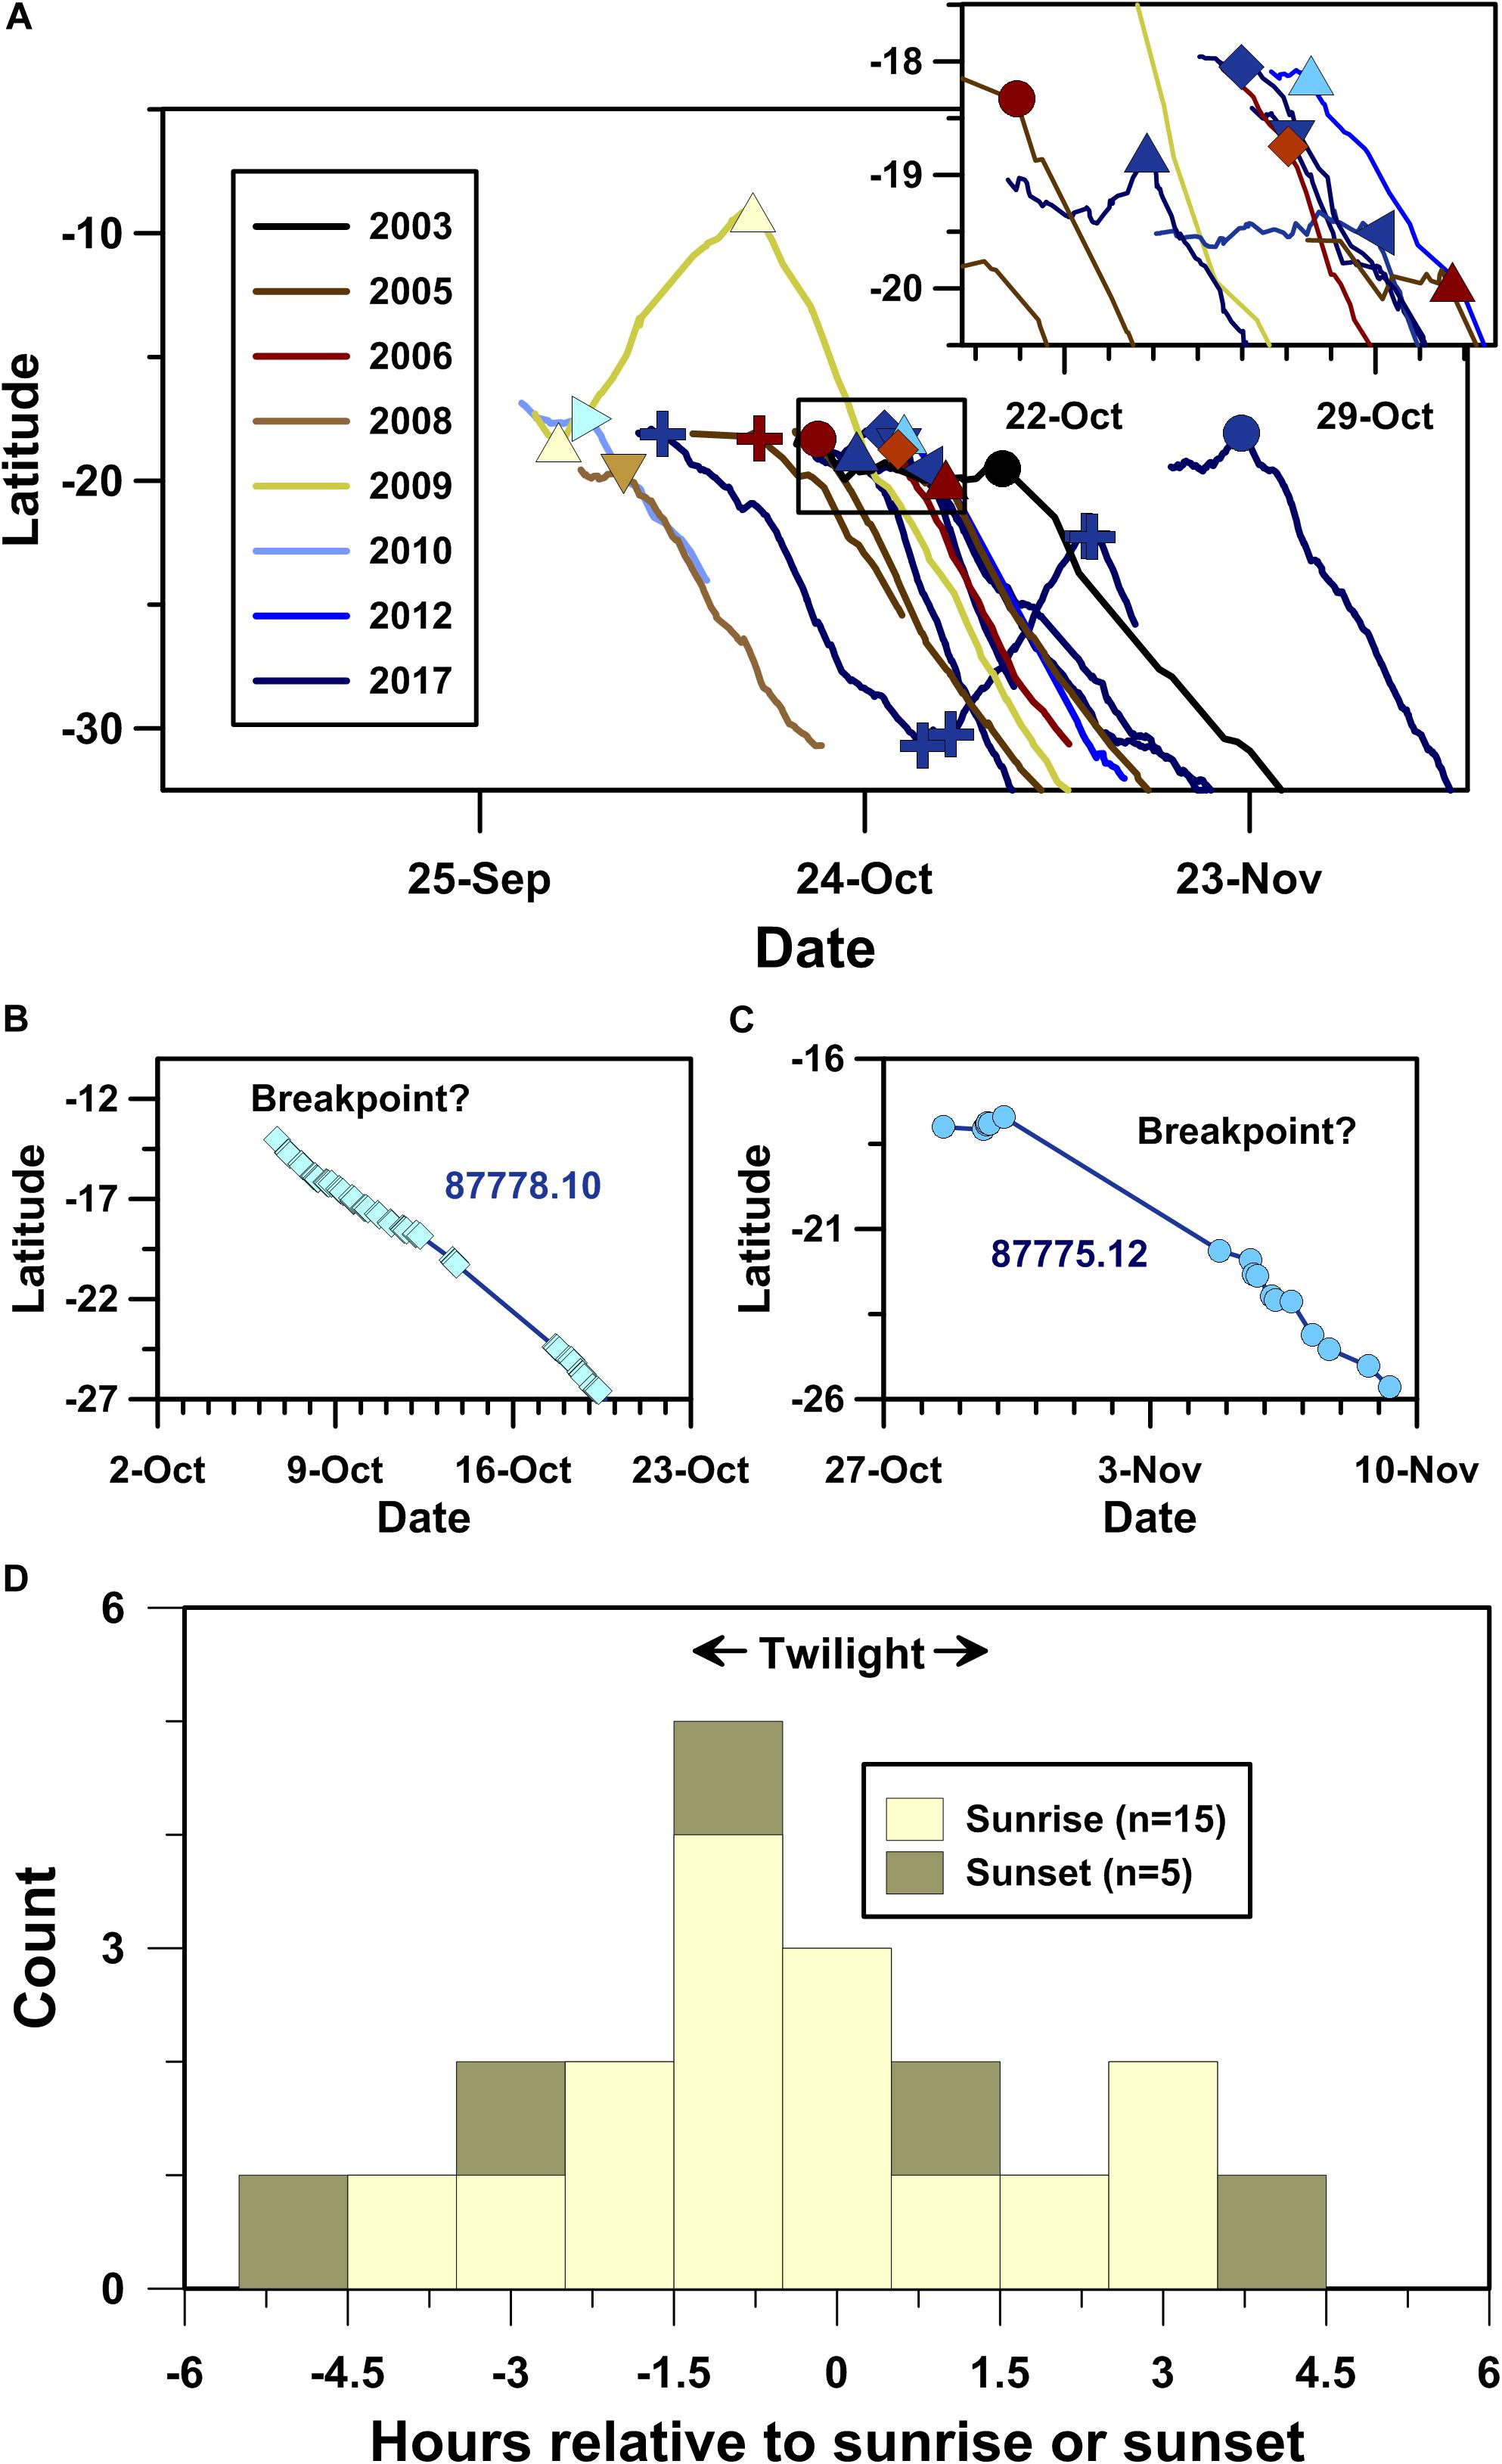
Figure 5. Timing of humpback whale movement decisions identified using piecewise-linear regression breakpoint analysis (PLR-BPA). (A) Latitude time-series plot showing locations of migratory departure points identified using PLR-BPA (symbols as in Figure 1), (B) humpback whale PTT 87778.10’s latitude time-series profile, wherein no significant breakpoint was detected due to continuous southward movement, (C) humpback whale 87775.12’s latitude time-series profile, wherein no significant breakpoint was detected due to a multi-day gap in the satellite telemetry dataset, and (D) histogram showing the temporal distribution of the 20 significant breakpoints identified using PLR-BPA relative to sunrise (light shading) and sunset (dark shading).
Humpback whale PTT 120942.17 was the only whale to perform a multi-day stop-over with associated decisions to stop and (re)start directed migratory movements (Figure 5A). The complexity of 120942.17’s track is noteworthy as it demonstrates spatiotemporal fidelity to a well-defined migratory path at the ecological expense of both time and energy. Following ∼15 days and >1700 km of continuous south-southeast (159°) directed swimming away from Abrolhos Bank, 120942.17 stopped over above Rio Grande Rise. Unexpectedly, 120942.17 resumed continuous directed swimming several days later along an overall north-northwest bearing (339°), antithetical to its initial south-southeast directed movement (Figure 2B and Table 1). Following ∼10 days and ∼1000 km of swimming along this “reverse” trajectory, 120942.17 again stopped its directed swimming for a single overnight period, only to return to its original south-southeast directed migration 2 h (±1 h) before sunrise on 11 November, 2017.
In total, PLR-BPA identified 20 significant changes in latitudinal time-series for the 20 whales migrating through the SSEC. Of these significant changes in movement behavior, 15 occurred within ±4.5 h of sunrise and 5 occurred within ±5 h of sunset (Figure 5D). A significant local peak in the data distribution (p = 0.0007, two-tailed exact binomial probability), centered on dawn twilight, includes nine of the twenty breakpoints identified. Our breakpoint analyses demonstrate that crepuscular navigation is a common component of humpback whale movement behavior.
Geomagnetic and Oceanographic Conditions
In contrast to the prolonged stability of the humpback whale movement parameters, the magnetic field these whales swam through changed significantly during the study period. For example, geomagnetic inclination (I) significantly changed (p < 0.05; non-parametric Mann-Kendall trend test) by >12.5% at the humpback whale wintering grounds on Abrolhos Bank between October 2003 and October 2017 (Figure 6A).
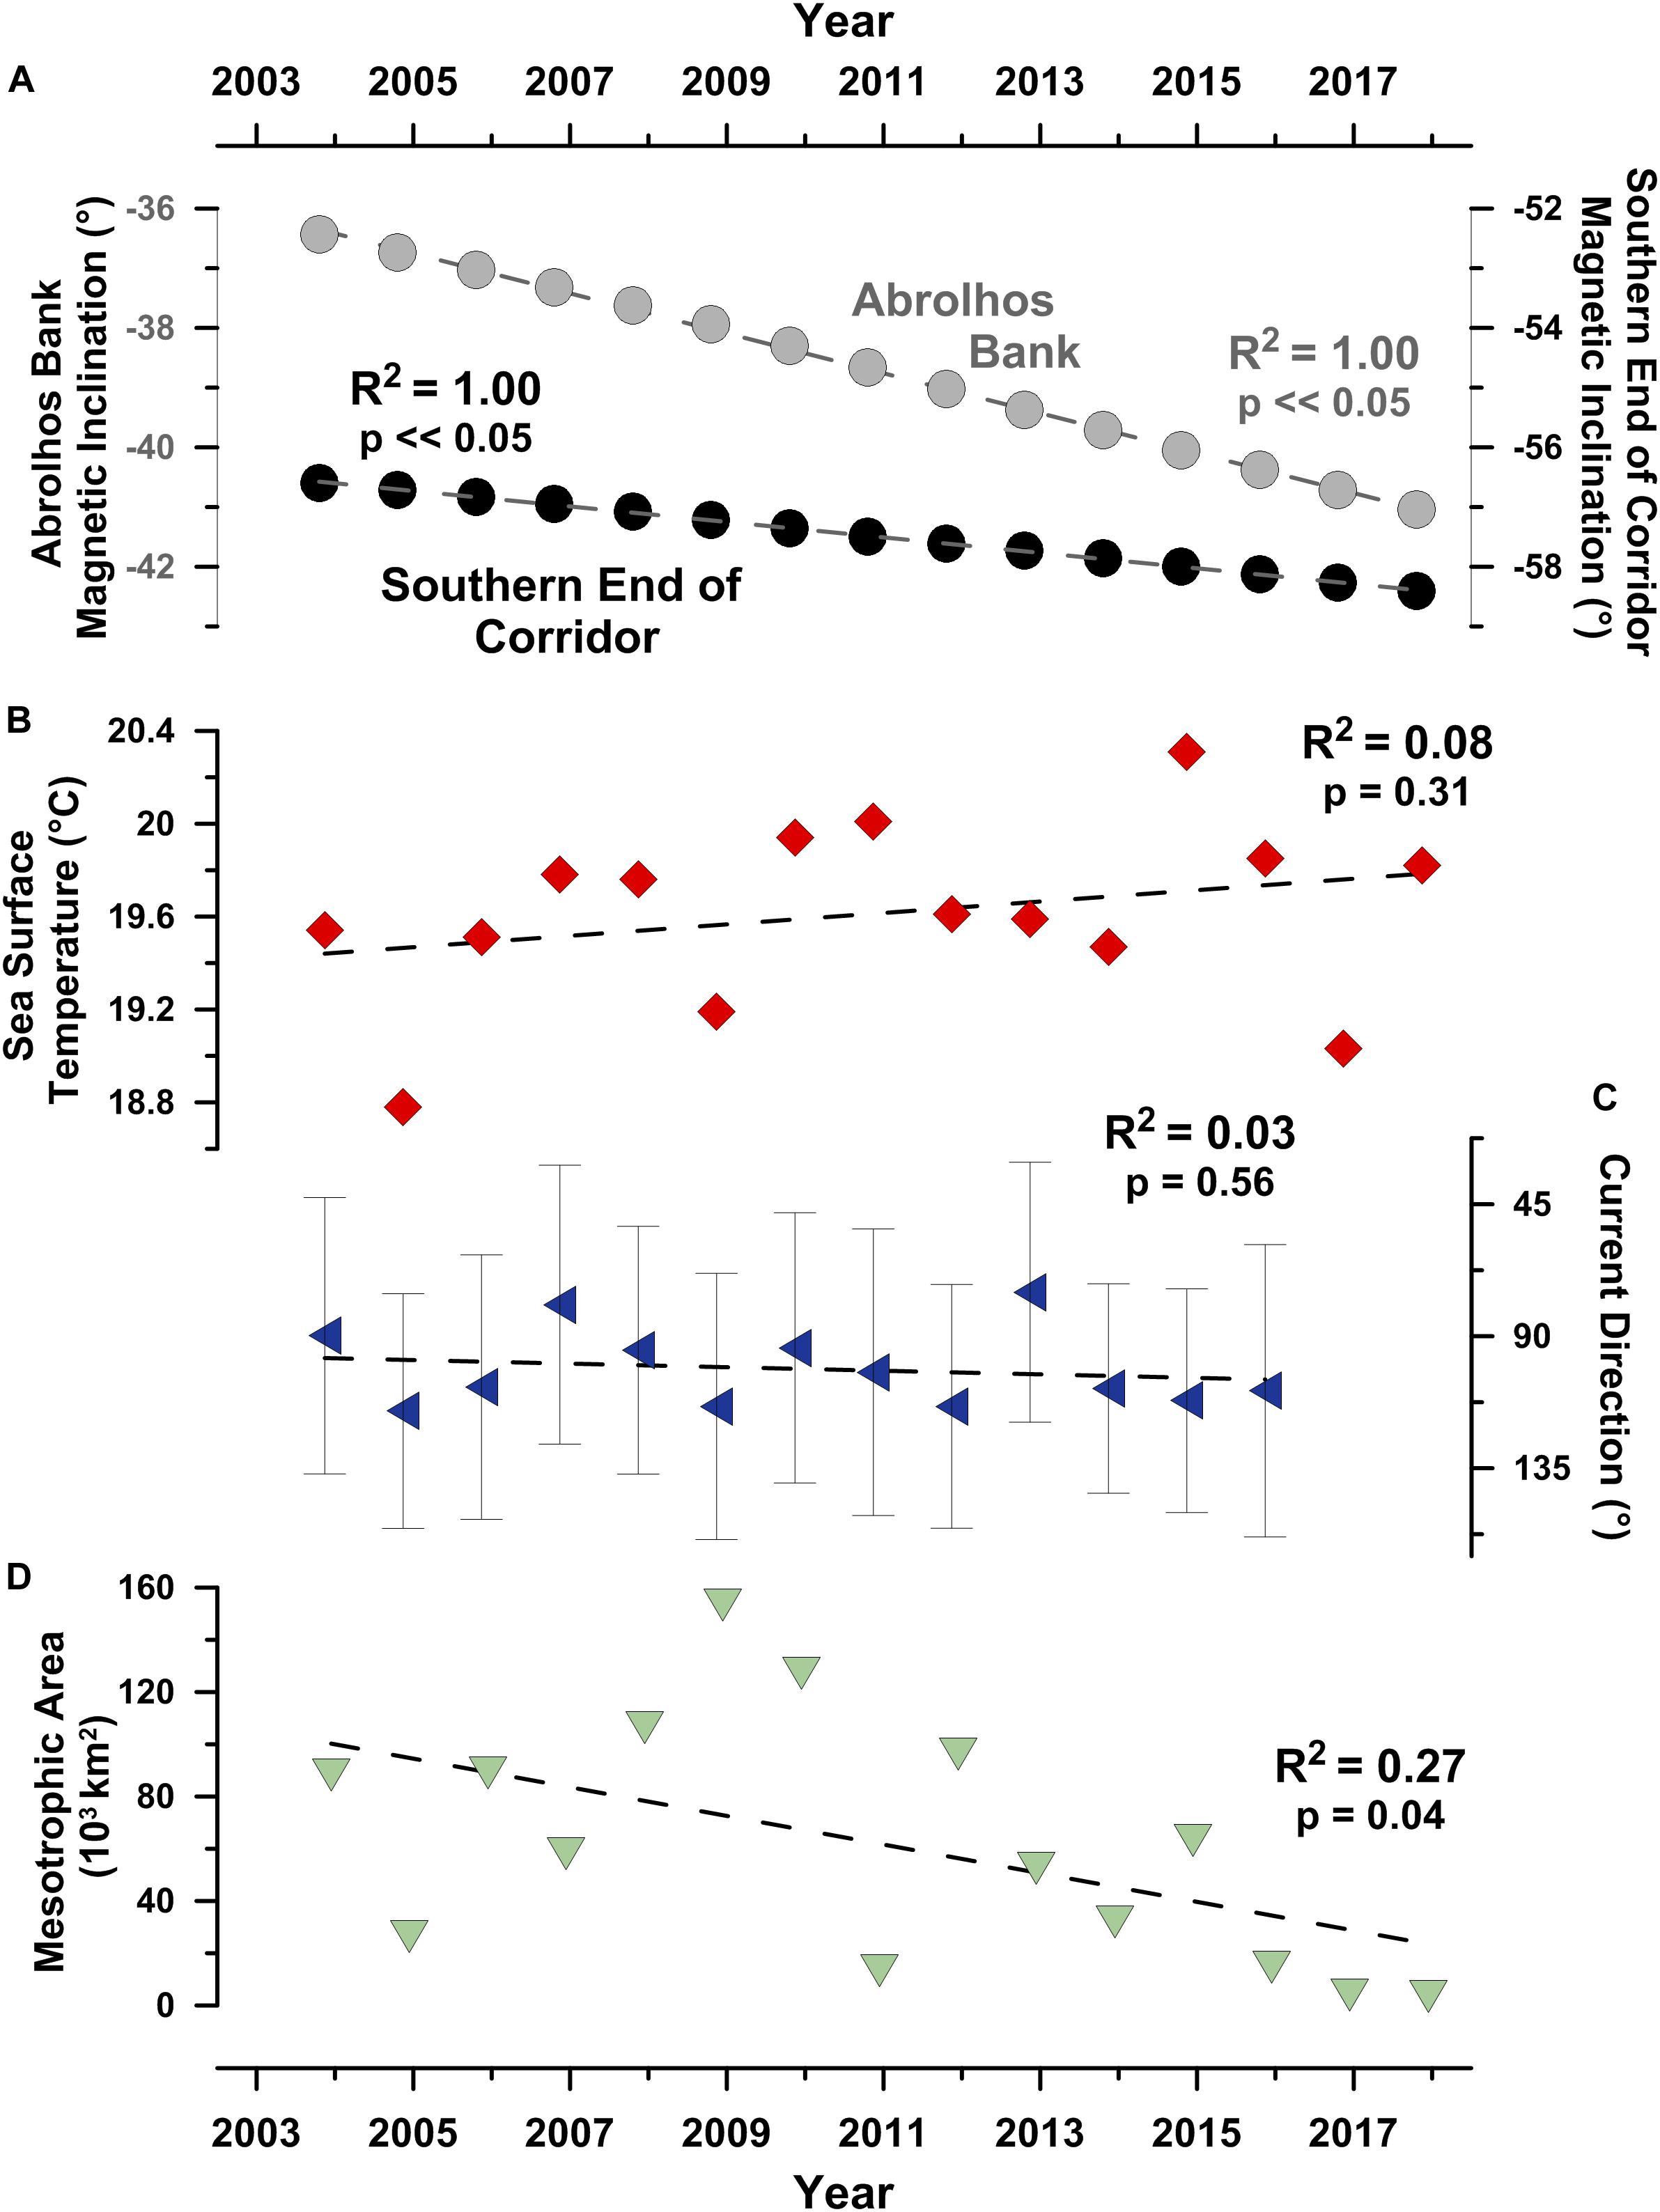
Figure 6. Geomagnetic and oceanographic conditions the 20 tracked humpback whales experienced during their south-southeast directed migrations. (A) Geomagnetic inclination angles at the northern and southern ends of the south-southeast migratory corridor (i.e., SSEC), (B) average sea surface temperature in the SSEC, (C) average ocean surface current direction in the SSEC, and (D) total area of highly productive mesotrophic surface water (i.e., chlorophyll-a concentration > 2.6 g m–3) in the southwest Atlantic/Southern Ocean basin during the month of December. Gray whiskers in (C) show ± 1σ error bars.
The relationship between this significant change in geomagnetic coordinates and geographic coordinates is notable. Magnetic inclination angles, equivalent to those present at Abrolhos Bank in 2003, were located >340 km to the northwest and >130 km inland of the Brazil coast by 2017.
Secular variation in magnetic orientation cues were more severe at the southern end of the SSEC where equivalent magnetic inclinations (I) shifted >400 km to the west between 2003 and 2017. Equivalent magnetic field intensity-inclination polar bi-coordinate locations (Lohmann et al., 1999; Brothers and Lohmann, 2018) present in 2003 no longer existed in 2017. The severity of these temporal changes in the magnetic field are due to the South Atlantic Anomaly (SAA), the most rapidly changing feature in Earth’s magnetic field over the past 400 years (Hartmann and Pacca, 2009).
In addition to a changing magnetic field, the whales we tracked also experienced dynamic oceanographic conditions. Although no significant trend was detected (p > 0.05; non-parametric Mann-Kendall trend test), between November 2003 and November 2017, average sea surface temperatures in the SSEC increased by approximately 0.3°C (Figure 6B), roughly three times larger than the contemporaneous global trend (Hausfather et al., 2017).
It is not surprising that the humpback whales we tracked through the SSEC experienced dynamic ocean surface currents, annually varying across a >90° range of predominantly head-currents during late austral spring humpback whale migration period (Figure 6C). Such considerations are important as animals moving through a flowing medium, such as air or ocean, are affected by the direction and magnitude of currents, and these currents have the potential to impact animal movement trajectories (Gaspar et al., 2006; Chapman et al., 2011). To consider this possibility, we analyzed both uncorrected and current-corrected (Gaspar et al., 2006) humpback whale tracks. Our analyses demonstrate that: 1) uncorrected and current-corrected humpback whale locations were not significantly different (average drift = 9.2 km day–1; paired two-tailed t-test, p > 0.05; see: Supplementary Figures S1, S2), there is no significant difference between uncorrected and current-corrected humpback whale movement trajectories (two-tailed paired t-test, p > 0.05; see: Supplementary Figure S2). Despite the dynamic nature of near-surface ocean currents in the SSEC, our analyses demonstrate that these currents have relatively minor effects on migrating humpback whale trajectories due to the factor 10 difference between average current velocity (0.43 km h–1) and average whale movement velocity (4.6 km h–1).
With respect to feeding, the primary motivation of poleward humpback whale migrations, the areal extent of highly productive (i.e., >2.6 g m–3 chlorophyll-a) surface water decreased significantly (p < 0.05; non-parametric Mann-Kendall trend test) over the past decade from a high of ∼160,000 km2 in December 2008 to lows of < 15,000 km2 in December 2015, 2016, and 2017 (Figure 6D).
Movements in Gravitational Coordinates
A central goal of this research was to test the hypothesis that humpback whale migratory movements describe highly significant sinusoidal gravitational coordinate (i.e., g-space) trajectories. The results of these analyses demonstrate that humpback whales utilizing the SSEC followed a limited range of temporally modulated gravitational coordinate trajectories (Figure 7). These highly significant sinusoidal correlations (sinusoidal regression; F-test; α = 0.05; p < 0.05) support the hypothesis as posed and suggest that the observed g-space trajectories are a non-random consequence of navigational behavior (Figure 7). Although the twenty whales that migrated through the SSEC followed distinct geographic-Julian calendar coordinate paths (e.g., Figure 5A), these same movements describe overlapping temporally phased trajectories when plotted in gravitational coordinates (Figure 7). Yet, two different motifs, consistent with the two modes in the humpback whale movement velocity distribution, are apparent in the g-space trajectories: a slow motif (Figure 7A) and a fast motif (Figure 7B).
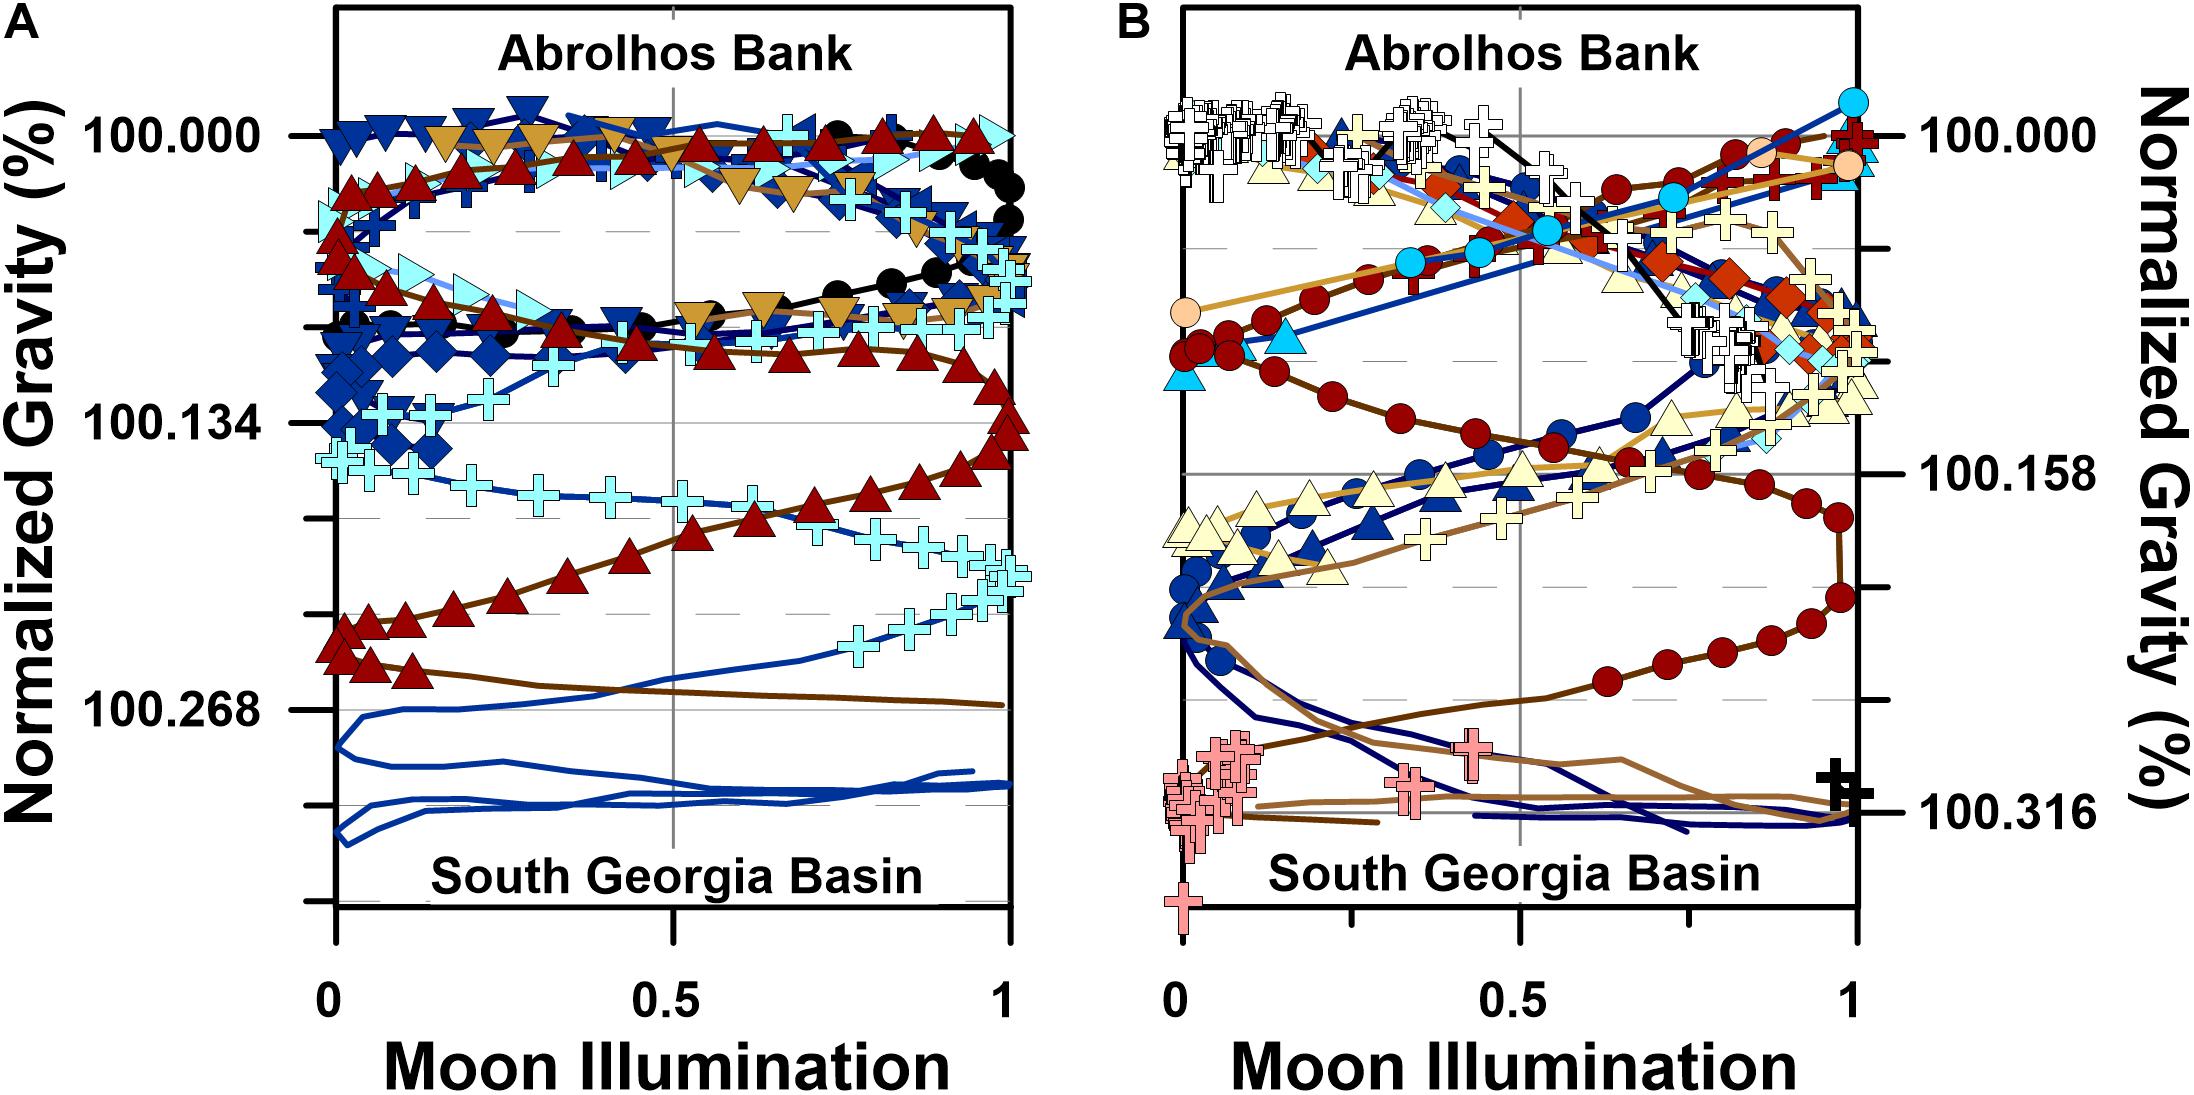
Figure 7. Humpback whale movements in gravitational coordinates (i.e., g-space). (A) g-space trajectories for slow swimming (i.e., <4 km h–1) humpback whales (n = 9, symbols as in Figure 1), (B) g-space trajectories for fast swimming (i.e., >4 km h–1) humpback whales (n = 11) and the 243 Southwest Atlantic humpback whales killed by the Soviet Yuri Dologorukyi fleet (Zemsky et al., 1996) between 1965 and 1973 (symbols as in Figure 1). Normalized gravity values in (A,B) were determined by dividing the sum of the latitude dependent gravity (Götze, 2014) and the bedrock dependent gravity (Balmino et al., 2012) at each whale location by the value present at each individual’s Abrolhos Bank migratory departure site. Moon illumination depends solely on time, and it cyclically evolves from no illumination (i.e., New Moon, 0) to full illumination (i.e., Full Moon, 1) to no illumination (i.e., New Moon, 0) over a 29.5 day average period (i.e., synodic month).
The slow motif includes 9 whales that swam through the SSEC at an average swimming velocity of 3.6 ± 0.9 km h–1, whereas the 11 whales in the fast motif swam significantly faster (p = 0.008; two-tailed t-test), at an average velocity of 4.8 ± 0.9 km h–1 (Table 1). The data demonstrate that eight of nine whales in the slow motif initiated their southward migrations in the days immediately prior to first-quarter or last-quarter moons (Figure 7A), while the ninth whale in the slow motif, PTT 27259.03, initiated its migration 2 days after first-quarter moon. In contrast, the eleven whales in the fast motif initiated their southward migrations near full or new moons (Figure 7B). Both the slow and fast motifs include significant in-phase and out-of-phase sinusoidal correlations between departure site-normalized gravitational acceleration and moon illumination (Figure 7), similar to significant correlations present in the g-space trajectories followed by diverse megafaunal species, including white sharks (Carcharodon carcharias) and northern elephant seals (Mirounga angustirostris) (Horton et al., 2017). Based on these results, we accept the hypothesis that humpback whale migratory movements describe highly significant sinusoidal g-space trajectories.
The results we report demonstrate that, despite changing oceanographic and geomagnetic conditions, humpback whale long-distance migrations in the Southwest Atlantic Ocean are characterized by prolonged (i.e., >50 years) fidelity to a heavily utilized south-southeast directed migratory corridor connecting calving grounds on the Abrolhos Bank to feeding grounds in the South Georgia Basin. When analyzed in spatiotemporal gravitational coordinates, these same humpback whale migratory movements describe richly patterned and highly reproducible trajectories in either a fast or a slow motif. Thus, the historic Soviet whaling and humpback whale satellite telemetry data we report reveal an apparent paradox: humpback whale long-distance migrations do not change in a changing ocean.
Discussion
Understanding organismal responses to environmental change remains one of the most pressing challenges in ecology (Schwenk et al., 2009), and as relatively high trophic level predators, it is particularly important to determine how large whales respond to dynamic oceanographic conditions given the role cetaceans play in circulating marine nutrients, trophic architecture, trophic cascades, and carbon turn-over rates (e.g., Croll et al., 2006; Roman and McCarthy, 2010; Witteveen and Wynne, 2016). In this context, it is somewhat surprising that Southwest Atlantic humpback whale movements do not appear to have responded to a significant decrease in the areal extent of mesotrophic surface waters and dynamic oceanographic and geomagnetic conditions over a period of several years. This paradox of migratory fidelity despite environmental change raises important questions, including: (1) How do humpback whales maintain migratory stability despite oceanographic and geomagnetic change? (2) What cues and rules inform humpback whale migratory decisions? One possible answer to both questions invokes the spatially and temporally dependent, yet stable, gravitational cues ubiquitous to the Earth system (Horton et al., 2017).
The recurrent pattern of phased gravitational coordinate trajectories in our long-term satellite tracking dataset supports the interpretation that humpback whale migrations are both stable and non-randomly distributed in space and time (e.g., Figure 7). In the following sections, we discuss three separate examples from our tracking dataset that describe the conditions under which different humpback whales were able to maintain migratory fidelity to a limited range of spatiotemporal trajectories through gravitational coordinates.
Slow Migration: PTT 24641.05
Humpback whale PTT 24641.05’s south-southeast directed migration was relatively slow, averaging 3.5 ± 1.0 km h–1 (Table 1 and Figure 8). Like other slow motif whales, 24641.05 started its migration when the lunar disk was ∼50% illuminated (i.e., last quarter moon on 25 October 2005), and it continued its non-stop and highly directional (straightness index = 0.90; average heading 157 ± 18.8°; Table 1) swimming for ∼3400 km over ∼1.5 months, ending its migration around 7 December 2005 within 24 h of first-quarter moon (Table 1 and Figure 8C).
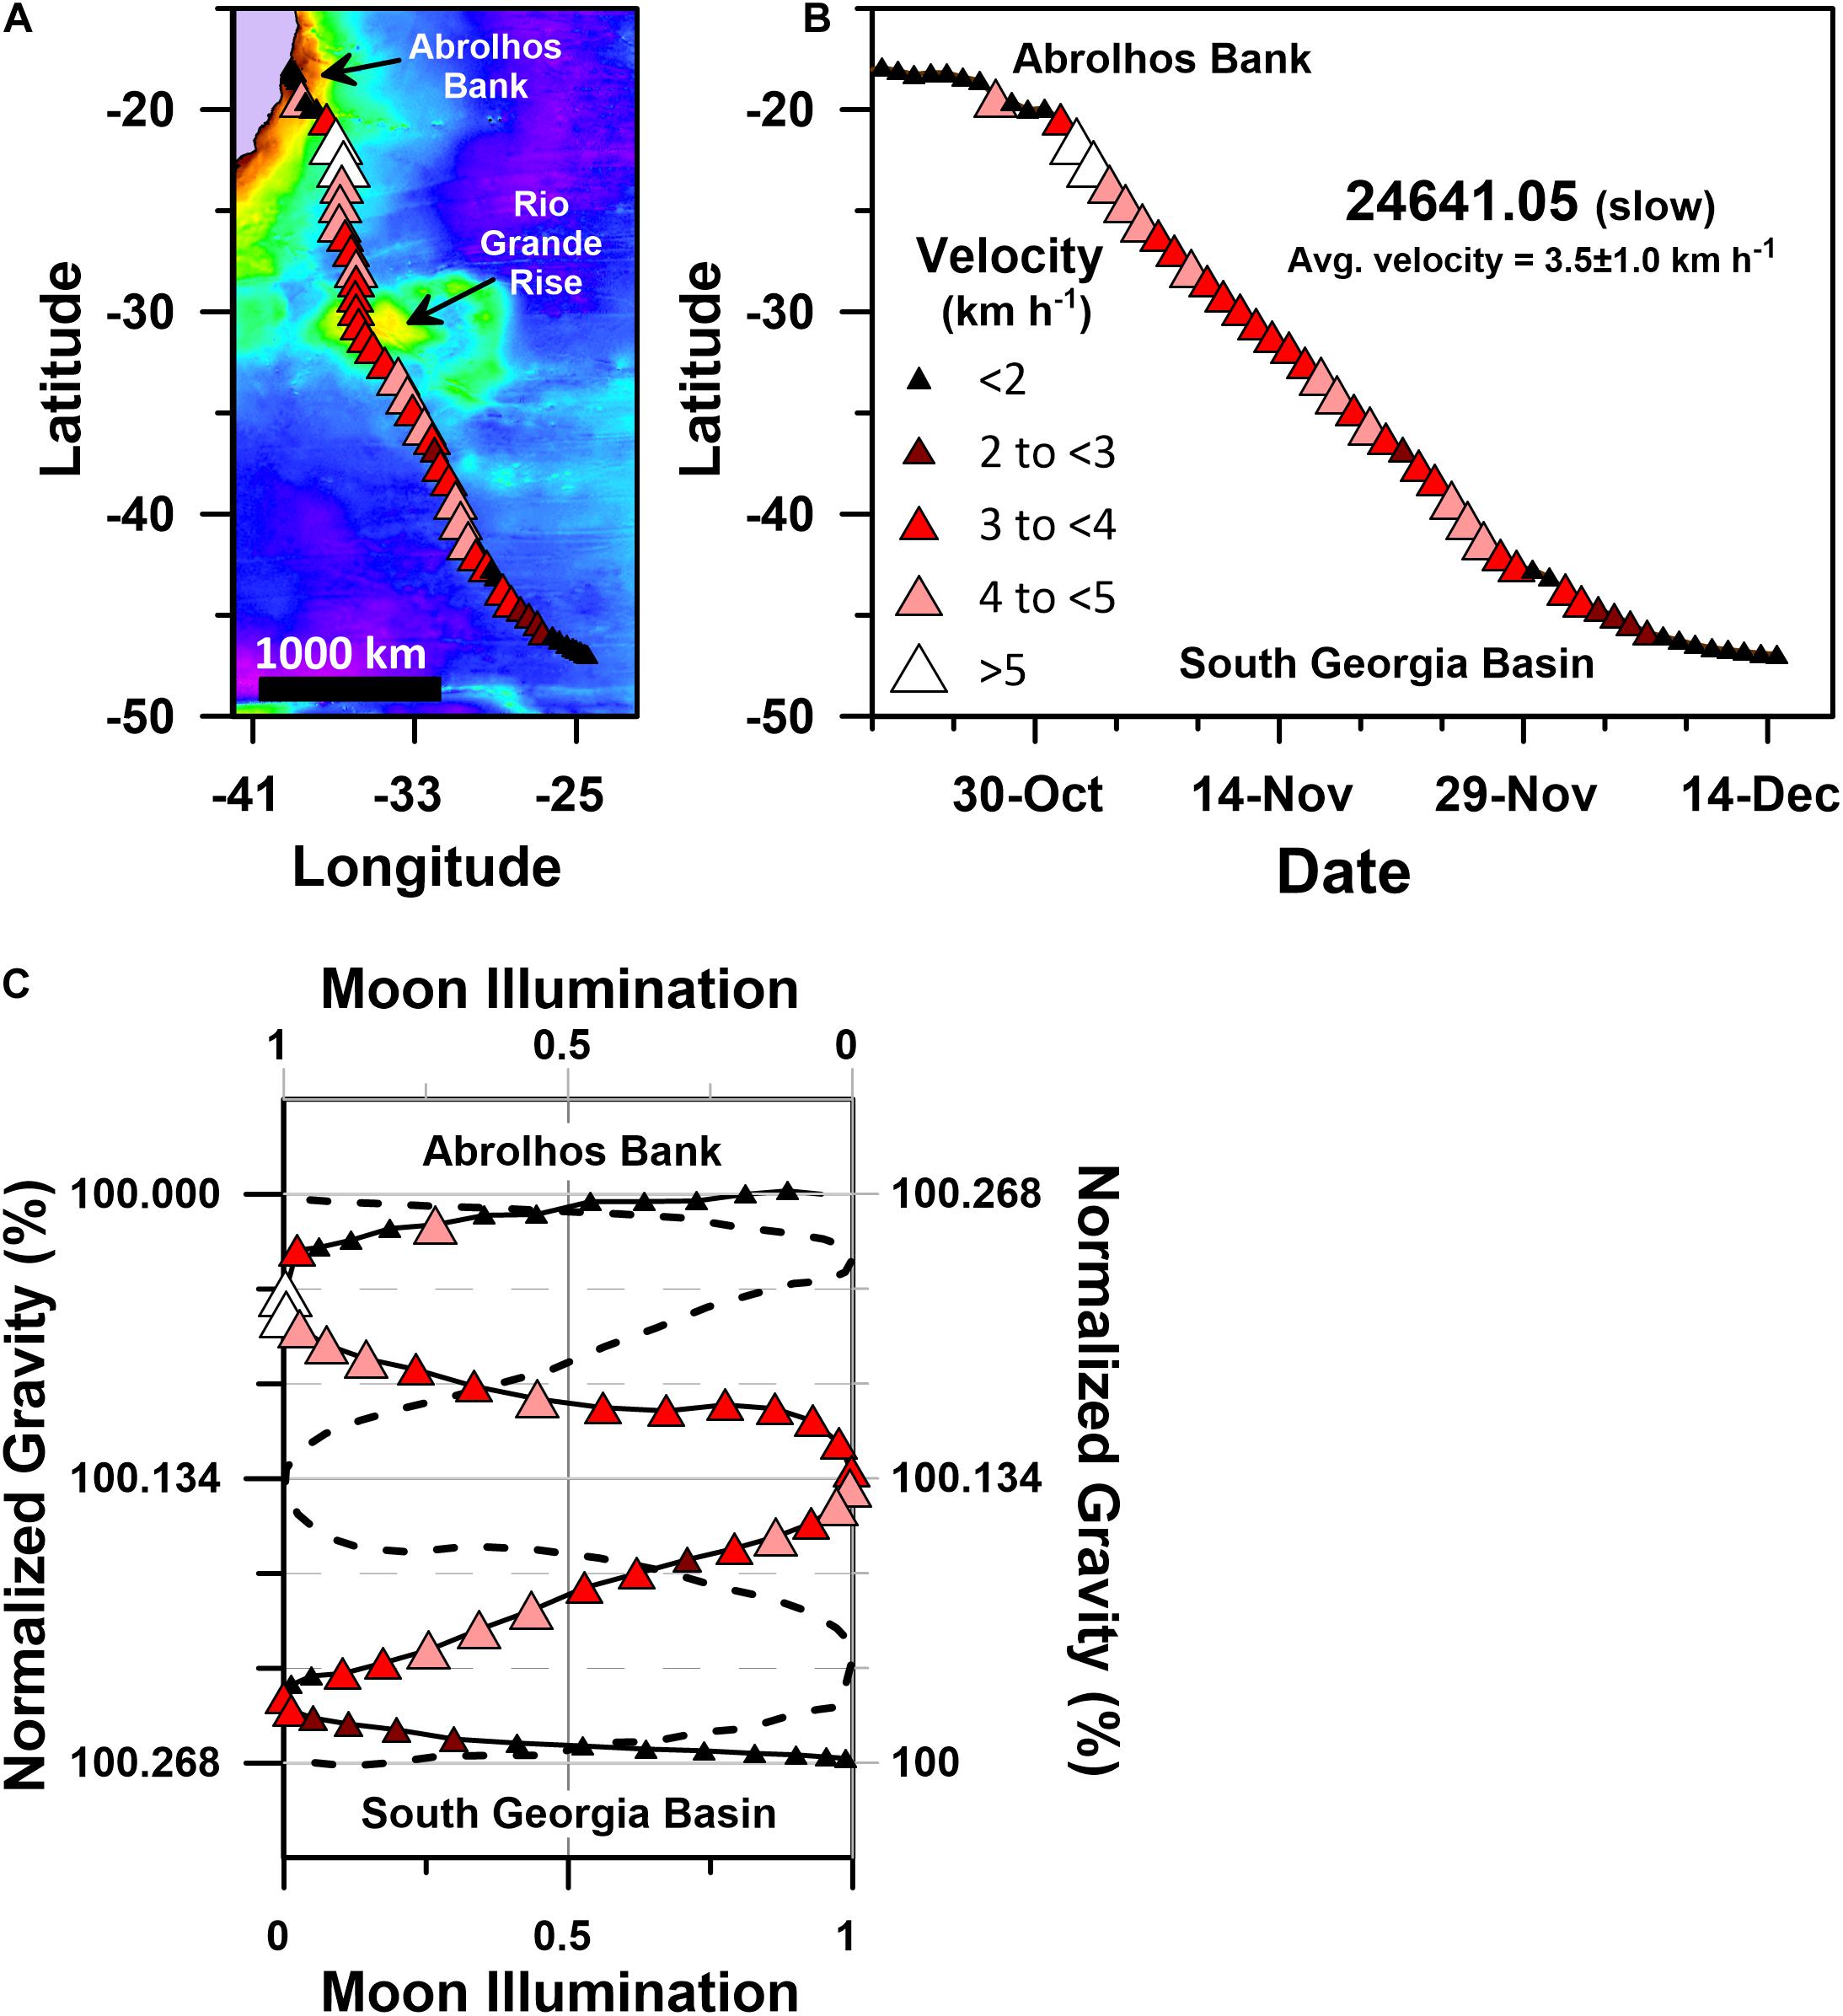
Figure 8. Geographic and gravitational coordinate migratory trajectories of PTT 24641.05’s slow motif humpback whale migration (average migratory velocity = 3.5 ± 1.0 km h–1). (A) Geographic coordinate (plate-carée projection) track map of 24641.05’s single stage south-southeast directed migration, (B) latitude time-series plot for 24641.05’s geographic coordinate Julian calendar migratory trajectory, (C) g-space trajectory of 24641.05’s migration track, including the actual and mirror image g-space trajectories. The mirrored trajectory (dashed black curve) is plotted on the reverse direction moon illumination and normalized gravity axes. Actual migratory trajectories in (A–C) are shown as red-hued triangles that are color-coded and sized according to 24641.05’s average daily velocity as shown in the legend. Normalized gravity values in (C) were determined by dividing the sum of the latitude dependent gravity (Götze, 2014) and the bedrock dependent gravity (Balmino et al., 2012) at each average daily location by the value present at 24641.05’s Abrolhos Bank migratory departure site. Colored basemap in (A) depicts bedrock gravity anomalies across a 150 to 660 mGal range.
Several rare conditions were met during 24641.05’s migration that collectively determined the gravitational accelerations it experienced. First, 24641.05 initiated its migration away from Abrolhos Bank on a quarter moon neap tide, when: (1) the tidal gravity vector achieved an anomalously low daily range in acceleration values (∼100 μGal; Supplementary Figure S3); (2) the moon was within 72 h of its quasi-monthly (i.e., the 27.32 day duration lunar sidereal month; Supplementary Figure S3) lunar declination maximum of ∼28°; (3) the moon was within 24 h of its quasi-monthly (i.e., the 27.55 day duration anomalistic month; Supplementary Figure S3) apogee of ∼404,000 km. Second, 24641.05’s migration describes a highly symmetrical gravitational coordinate trajectory with mirror planes through both the gravitational midpoint of its migration (i.e., 100.134% of its departure site’s gravitational acceleration; Figure 8C) and the 29.5 day duration synodic month’s 50% moon illumination position. Maintenance of this highly symmetrical trajectory required 24641.05 to swim both faster and slower when it experienced relatively higher or lower bedrock derived gravity anomalies, respectively (Figure 8A). Third, 24641.05 ended its south-southeast migration, on a neap tide first-quarter moon, as it approached 46°S latitude in the end of the first week of December, 2005. Similar patterns are present in the gravitational coordinate trajectories of all 9 slow motif humpback whales (Figure 7A), irrespective of the year in which the migration occurred or the prevailing geomagnetic and oceanographic conditions (Figure 6).
Fast Migration: PTT 121203.17
Humpback whale PTT 121203.17’s south-southeast directed migration was relatively fast, averaging 5.0 ± 1.3 km h–1 (Table 1 and Figure 9). Like the 10 other fast motif whales, 121203.17 started its migration in the days surrounding new or full moon, and it continued its non-stop and highly directional (straightness index = 0.95; average heading 161 ± 11.7°; Table 1) swimming for ∼3900 km during a ∼1.25 month long period. Humpback whale 121203.17 ended its migration on 26 November 2017 within 24 h of first-quarter moon (Figure 9C) as it approached 54°S latitude (Figure 9B).
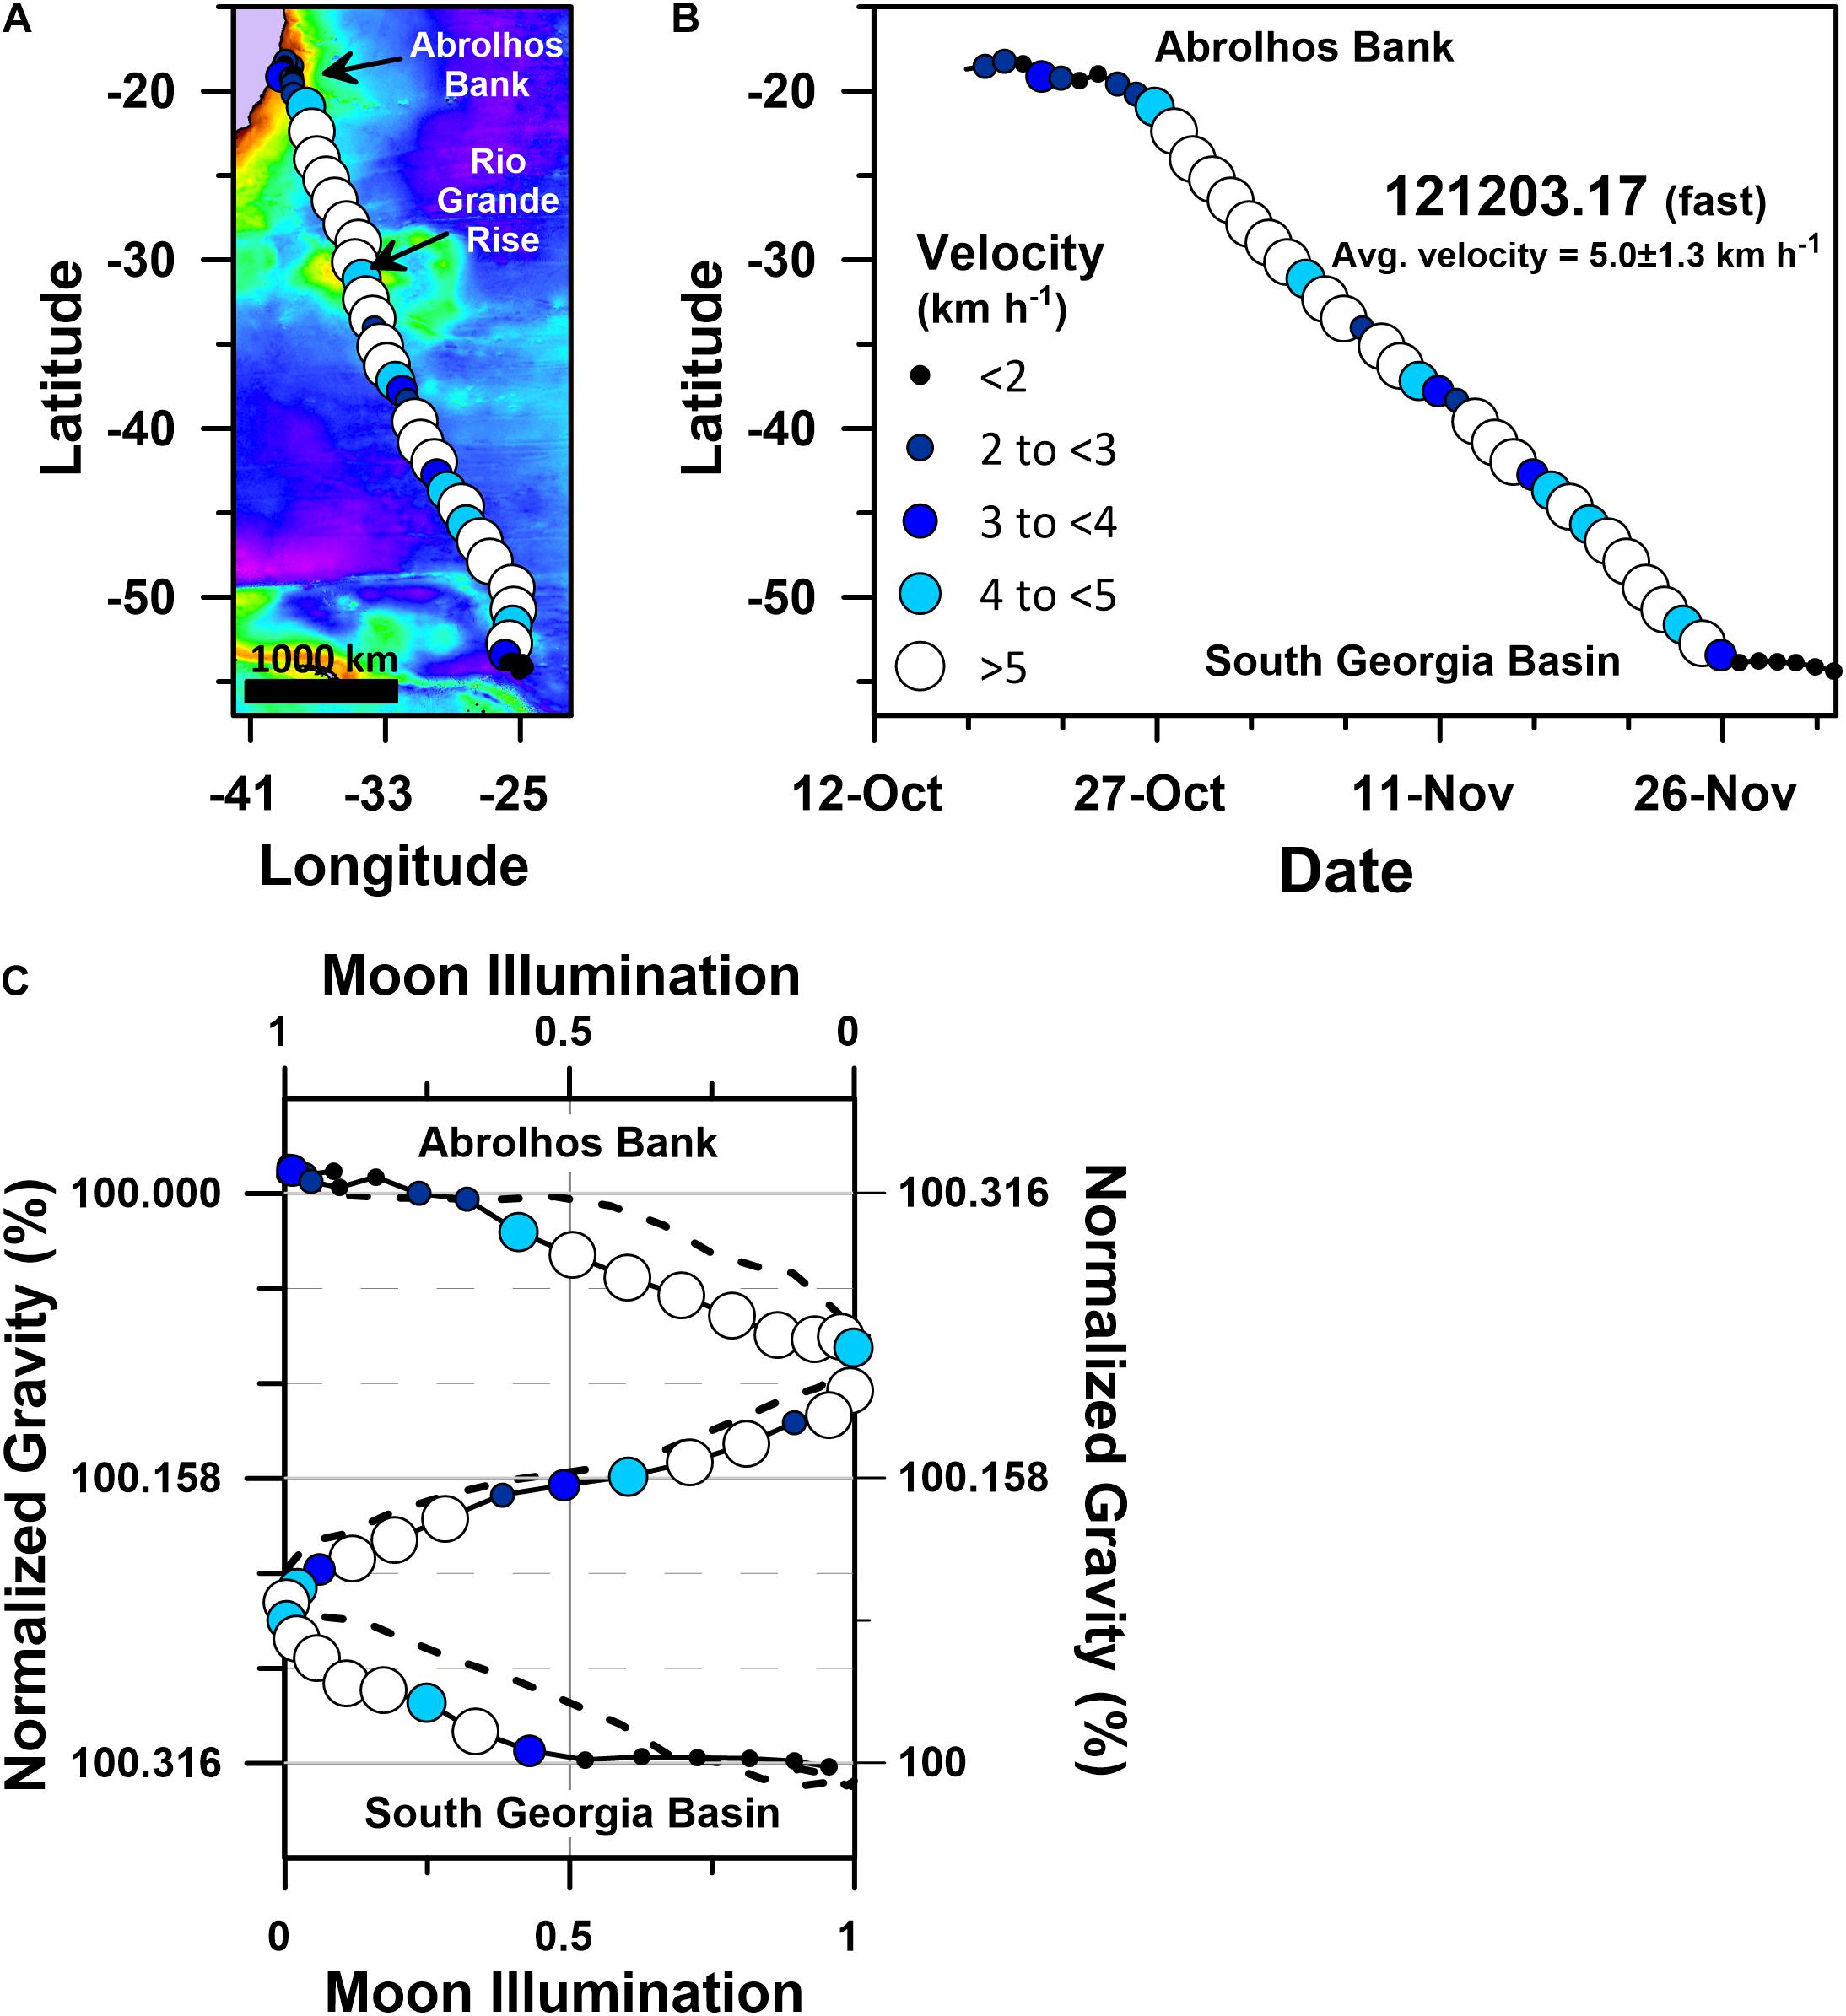
Figure 9. Geographic and gravitational coordinate migratory trajectories of PTT 121203.17’s fast motif humpback whale migration (average migratory velocity = 5.0 ± 1.3 km h–1). (A) Geographic coordinate (plate-carée projection) track map of 121203.17’s single stage south-southeast directed migration, (B) latitude time-series plot for 121203.17’s geographic coordinate Julian calendar migratory trajectory, (C) g-space trajectory of 121203.17’s migration track, including the actual and mirror image g-space trajectories. The mirrored trajectory (dashed black curve) is plotted on the reverse direction moon illumination and normalized gravity axes. Actual migratory trajectories in (A–C) are shown as blue-hued triangles that are color-coded and sized according to 121203.17’s average daily velocity as shown in the legend. Normalized gravity values in (C) were determined by dividing the sum of the latitude dependent gravity (Götze, 2014) and the bedrock dependent gravity (Balmino et al., 2012) at each average daily location by the value present at 121203.17’s Abrolhos Bank migratory departure site. Colored basemap in (A) depicts bedrock gravity anomalies across a 150 to 660 mGal range.
As was the case for PTT 24641.05, several rare conditions were met during 121203.17’s relatively fast and highly directional migration that collectively determined the gravitational accelerations 121203.17 experienced. First, PLR-BPA suggests 121203.17 initiated its migration on 24 October 2017: (1) when the moon was <25% illuminated and the tidal gravity vector achieved a relatively moderate ∼180 μGal daily range (Supplementary Figure S4); (2) within 24 h of the sidereal month’s lunar declination minimum of −19.4° (Supplementary Figure S4); (3) within 24 h of the moon’s anomalistic month’s apogee (i.e., ∼405,000 km; Supplementary Figure S4). Second, 121203.17’s migration describes a highly symmetrical gravitational coordinate trajectory with mirror planes through both the gravitational midpoint of its migration (i.e., 100.158% of its departure site’s gravitational acceleration; Figure 9C) and the synodic month’s 50% moon illumination (i.e., neap tide) position. As was the case with 24641.05, maintenance of this highly symmetrical trajectory required 121203.17 to swim both faster and slower when it experienced relatively higher or lower bedrock derived gravity anomalies, respectively (Figure 9A). Similar patterns are present in the gravitational coordinate trajectories followed by all 11 whales in the fast motif (Figure 7B), irrespective of the year in which the migration occurred or the prevailing geomagnetic and oceanographic conditions (Figure 6).
Dynamically Paced Migration: PTT 120942.17
The migratory movements of one of the whales we tracked, PTT 120942.17, were particularly anomalous. Our results indicate that 120942.17 was the only whale in our PTT dataset to both: (1) perform a multiple day-long migratory stop-over; and (2) retrace its migration route with north-northwest swimming over a ∼10 day-long period (Figure 10). PTT 120942.17 is also the only whale to clearly shift from one velocity motif (slow) to the other (fast) during its staged southward migration (Table 1).
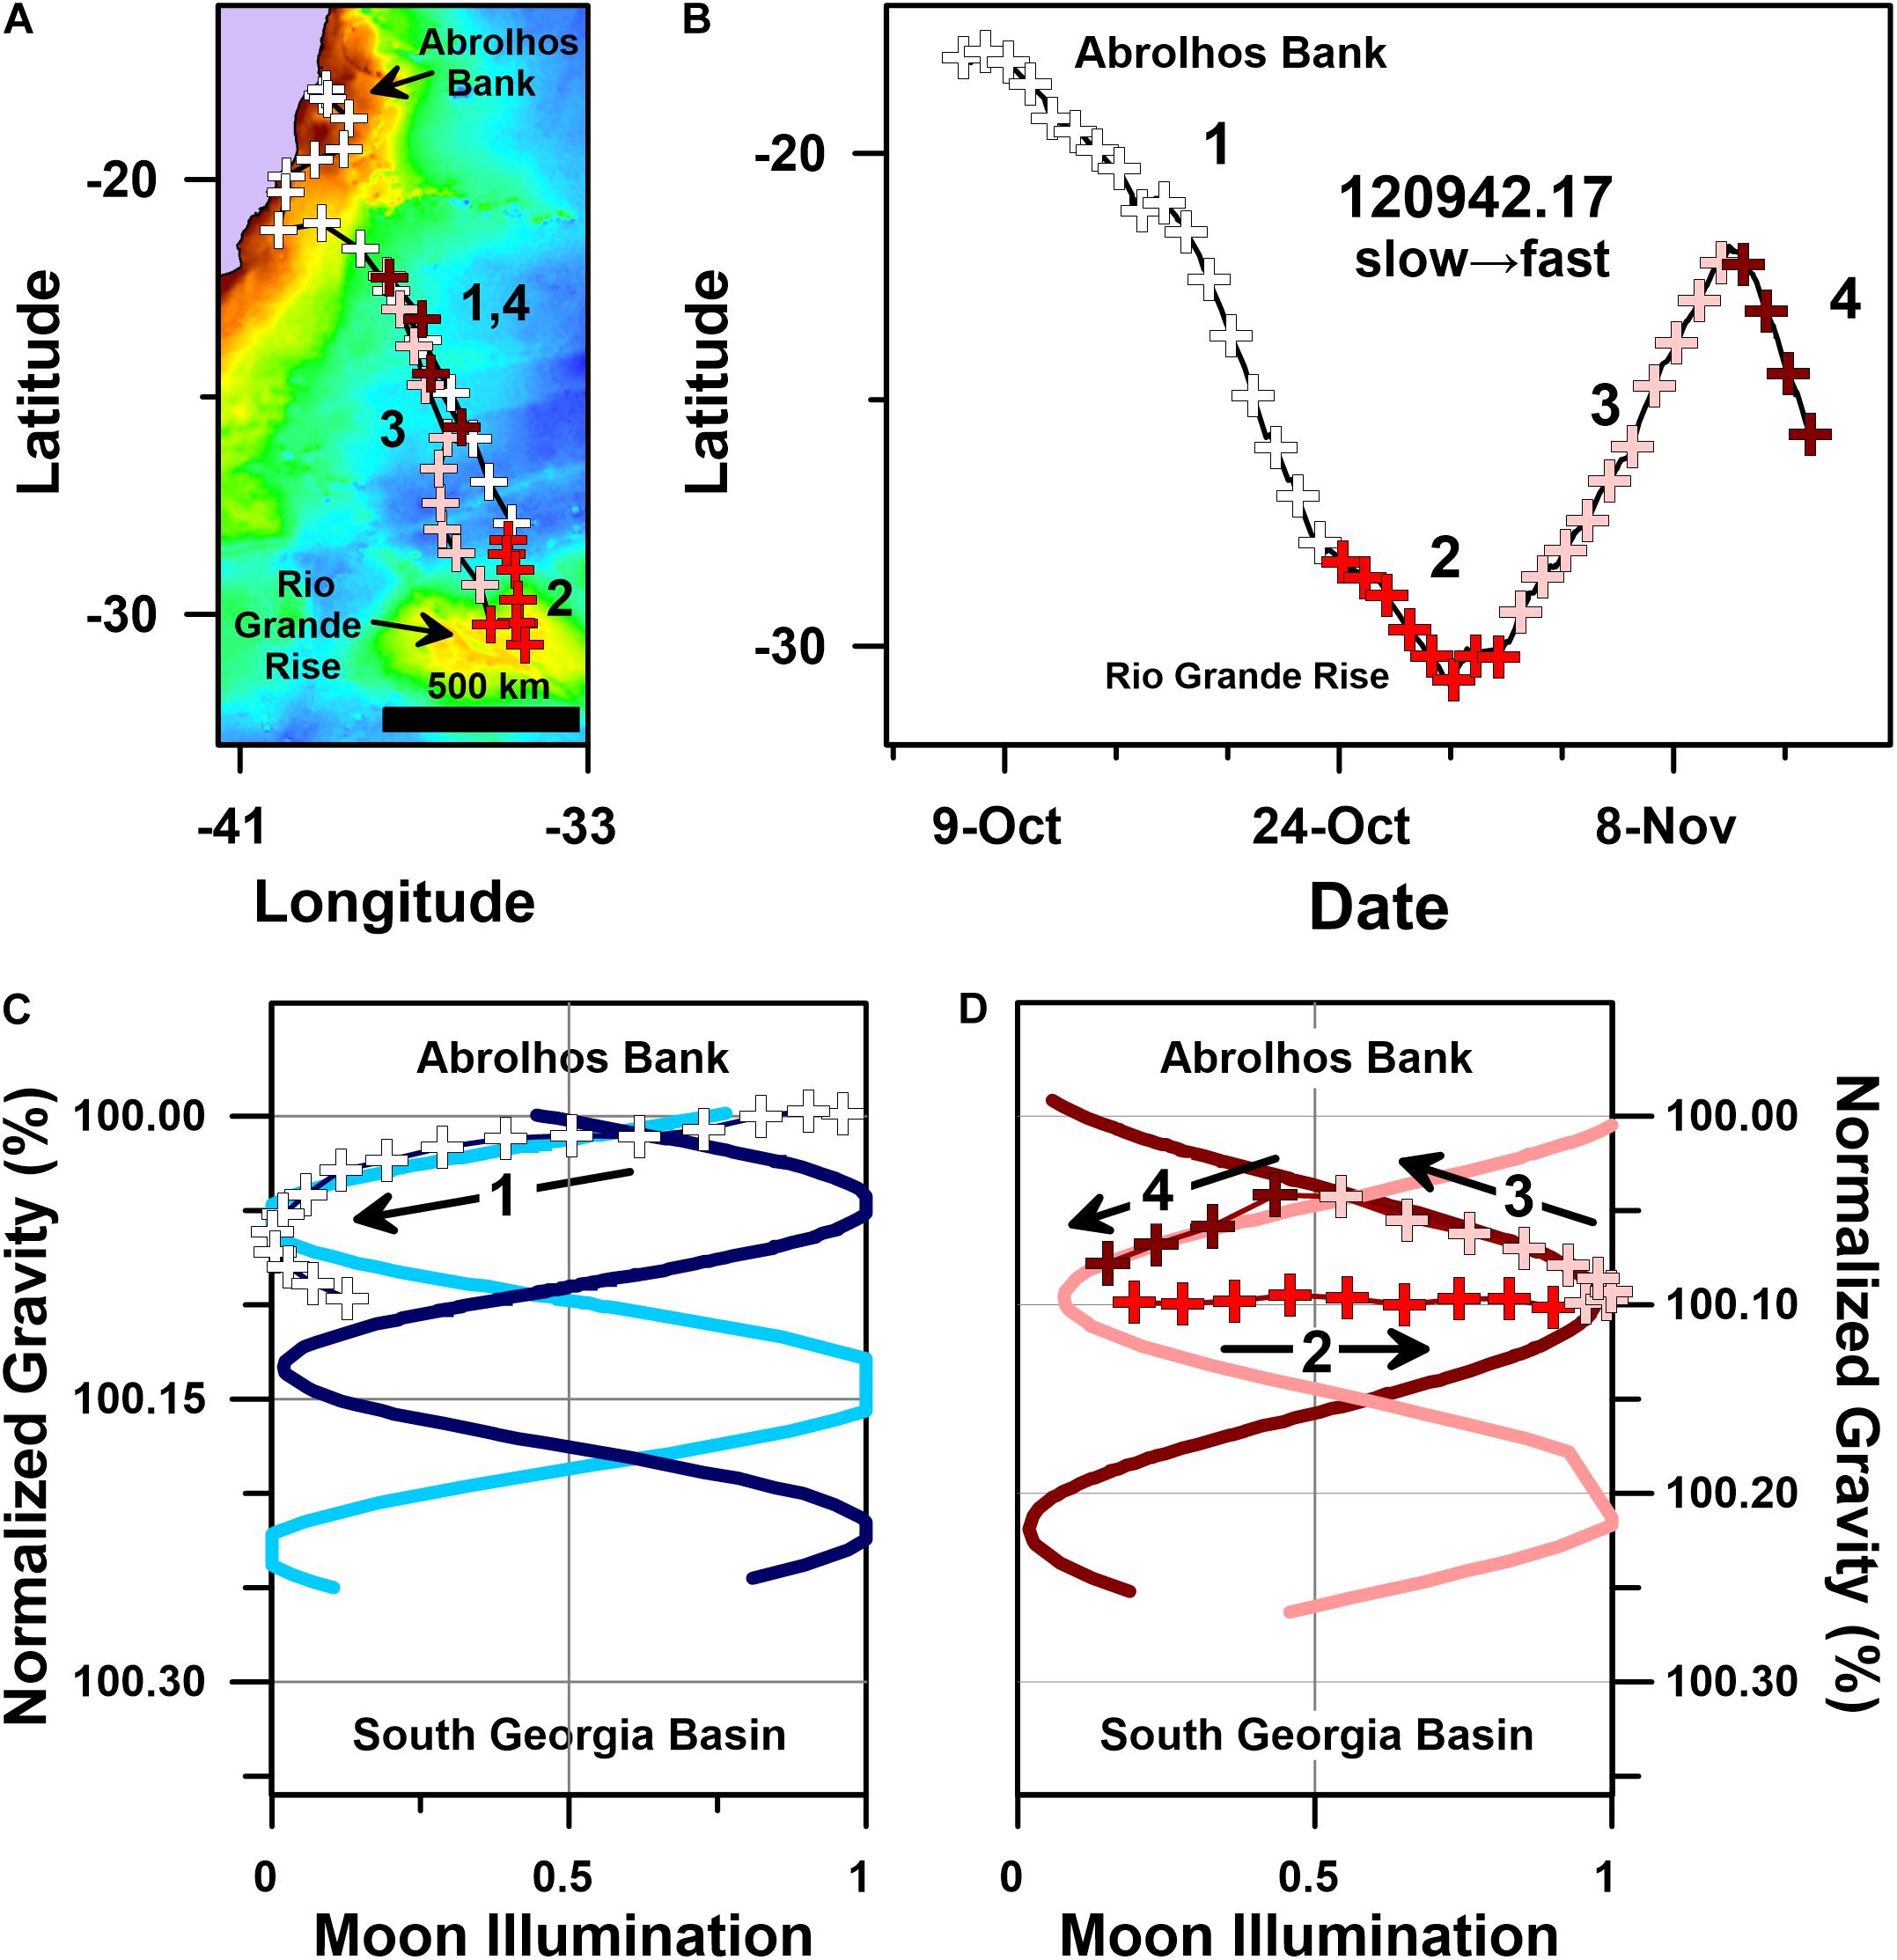
Figure 10. Geographic and gravitational coordinate migratory trajectories of a dynamically paced humpback whale migration (PTT 120942.17). (A) Geographic coordinate (plate-carée projection) track map of whale 120942.17’s multi-stage migration, (B) latitude time-series plot for 120942.17’s geographic coordinate Julian calendar migratory trajectory (bold numbers correspond with stages 1–4 of 120942.17’s migration, see text), (C) g-space trajectory for stage 1 (white addition symbols) of humpback whale 120942.17’s migration track (black arrow indicates trajectory direction through time), and (D) g-space trajectory for stage 2 (red addition symbols), stage 3 (pink addition symbols) and stage 4 (dark red addition symbols) of whale 120942.17’s migration track (black arrows indicate the movement trajectory through time). Colored basemap in (A) depicts bedrock gravity anomalies across a 150 to 660 mGal range. Blue sinusoids in (C), and red sinusoids in (D), depict sinusoidal regression fits to the satellite tracking data presented in Figure 6A (i.e., 9 slow motif whales) and Figure 6B (i.e., 11 fast motif whales), respectively. All four sinusoidal regression fits are highly significant (i.e., p << 0.05).
Humpback whale PTT 120942.17’s movements can be divided into four separate stages (Figure 10). Stage 1 includes its initial south-southeast directed migration from Abrolhos Bank to the northern flank of Rio Grande Rise (Figures 10A,C). Stage 2 includes its stop-over above Rio Grande Rise, where ocean floor altitudes ∼550 m below sea level are ∼4000 m higher than adjacent abyssal plains (Amante and Eakins, 2009). Stage 3 includes 120942.17’s reverse north-northwest directed migration back toward Abrolhos Bank (Figures 10B,D), and stage 4 includes 120942.17’s recovery of its initial south-southeast directed migration path (Figures 10B,D).
Despite the anomalous and staged structure of 120942.17’s movements, the g-space trajectories described by these movements coincide with the phased sinusoidal trajectories followed by several other whales that also migrated through the SSEC at distinctly different times between 2003 and 2017 (Figures 7, 10). Specifically, stage 1 of 120942.17’s migration (Figure 10C) initially coincides with the phased movements of other whales in the slow motif (Figure 7A), including the g-space trajectory followed by PTT 24641.05, approximately 12 years earlier (Figure 8C). Despite initially following a g-space trajectory similar to the one followed by PTTs 24641.05 and 96380.10 (Figure 7A), 120942.17 subsequently departs from this slow motif trajectory as it approaches Rio Grande Rise and transitions into stage 2 of its migration (Figures 10A–C).
Importantly, PTT 120942.17 continued in an overall southward direction during stage 2 of its migration (Figure 10A). Yet, the gravitational acceleration 120942.17 experienced during this ∼10 day period did not change (Figure 10D). This apparent discrepancy between 120942.17’s geographic and gravitational coordinate movements is easily explained. Although 120942.17 continued swimming southward (Figure 10B), the gravitational effects of this continued southward movement were counter balanced by local changes in gravity associated with the bedrock underlying Rio Grande Rise (Figure 10A). These facts resulted in 120942.17 experiencing a constant gravitational acceleration throughout stage 2 of its migration (Figure 10D). As a direct consequence of its movement behavior during stage 2 of its migration, 120942.17 is moving in geographic coordinates, but not moving in gravitational coordinates for precisely one-half of a tidal gravity cycle (i.e., from new moon to full moon; Figure 10D).
Stage 3 of 120942.17’s migration includes an anomalous north-northwest directed ‘reverse’ migration back toward Abrolhos Bank (Figures 10A,B). When plotted in g-space, this north-northwest directed stage 3 movement coincides with the phased sinusoidal trajectory followed by 6 other southward migrating whales in the fast motif (PTTs: 33001.06, 87771.09, 88727.09, 87778.10, 121203.17, 172001.17; Figures 7B, 10D).
Finally, stage 4 of 120942.17’s migration begins in the dawn twilight on a last-quarter moon. The associated g-space trajectory for stage 4 coincides with the phased sinusoidal trajectories followed by the remaining 5 whales in the fast motif (PTTs: 10946.05, 26712.05, 50687.07, 87775.12, 121192.12; Figures 7B, 10D).
Despite making multiple movement decisions that both delayed its southward migration by more than 24 days and added more than 2000 km of swimming distance, 120942.17’s migration describes highly symmetrical and phased gravitational coordinate trajectories that coincide with segments of the g-space trajectories followed by 13 of the other 19 whales that migrated through the SSEC. The symmetrically patterned and reproducible structure of these gravitational coordinate trajectories implies that the benefits of swimming through a well-defined and heavily utilized spatiotemporal corridor outweigh the energetic and temporal costs of swimming farther for longer periods. The risks associated with such a strategy are not minor and include exposure to changing oceanographic conditions, shifts in prey availability (e.g., Figures 1, 6), heightened competition, and predictability.
Indeed, the predictability of the humpback whale migrations we report may have already hurt the population (Rosenbaum et al., 2009). The fact that Soviet whale ships killed humpback whales at the southeast corner of Abrolhos Bank, within the SSEC, and above Rio Grande Rise but crucially not elsewhere, over a 2-week period suggests there has been >50 years of spatiotemporal fidelity to the migratory corridor revealed by our satellite tracking research despite dynamic oceanographic and geomagnetic conditions. Plotting the time and location of the Western South Atlantic Soviet humpback whale kills in gravitational coordinates supports this interpretation: the 1967 Soviet whaling kills coincide with the sinusoidal gravitational trajectories followed by the humpback whales we tracked between 2003 and 2018 (Figure 7B).
Conclusion
Using long-term satellite remote sensing data, our research provides empirical support for what several models have predicted: changes in Earth system conditions will challenge the sustainability of some populations of marine megafauna (MacLeod, 2009; Barbraud et al., 2011; Hazen et al., 2013; Silber et al., 2017). The prolonged spatiotemporal fidelity of humpback whale movements, despite contemporaneous oceanographic and geomagnetic change, suggests humpback whale movement decisions include mechanistic responses to stable and predictable exogenous cues, including gravity. The relative stability of gravitationally derived cues helps explain the apparent paradox of humpback whale migratory fidelity despite pronounced oceanographic and geomagnetic change. Yet, the extent to which dynamic oceanographic conditions evoke changes in marine megafaunal long-distance migratory movement decisions, and the environmental and biogeophysical thresholds that trigger specific movement behaviors, remain unknown. Navigation during long-distance migration is likely to be informed by a diverse suite of cues, and if we are to ever truly know how whales navigate, all reasonable mechanisms must be considered as part of inclusive and integrated research on diverse species across a variety of environmental and biogeophysical contexts over prolonged periods. Documenting the extent to which animal migration routes, destinations, and movement decisions change, or perhaps fail to change, in a changing environment is essential to preserving biodiversity and sustainably managing diverse ecosystems and the services they provide.
Data Availability Statement
All datasets generated for this study are included in the article/Supplementary Material.
Ethics Statement
Humpback whale tracking was performed in accordance with approvals granted by the Brazilian Environmental Agency (IBAMA), permit #009/02/CMA/IBAMA and process #02001.000085/02-27.
Author Contributions
TH conceived the study, compiled all satellite remote-sensing data, prepared the figures, performed the geophysical, astronomical, and statistical analyses, and wrote the initial manuscript. AZ, AA, DD, and FS performed all of the field research, including satellite tag preparation, deployment, and data management. All authors contributed to the writing and revision of the initial manuscript. The scientific results and conclusions, as well as any views or opinions expressed herein, are those of the author(s) and do not necessarily reflect those of NOAA or the US Department of Commerce.
Funding
Funding from Shell Brasil and CGG Brasil supported collection of the humpback whale satellite telemetry data we report.
Conflict of Interest
The authors declare that the research was conducted in the absence of any commercial or financial relationships that could be construed as a potential conflict of interest.
Supplementary Material
The Supplementary Material for this article can be found online at: https://www.frontiersin.org/articles/10.3389/fmars.2020.00414/full#supplementary-material
References
Abrahms, B., Hazen, E. L., Aikens, E. O., Savoca, M. S., Goldbogen, J. A., Bograd, S. J., et al. (2019). Memory and resource tracking drive blue whale migrations. Proc. Natl. Acad. Sci. U.S.A. 116:201819031. doi: 10.1073/pnas.1819031116
Amante, C., and Eakins, B. W. (2009). ETOPO1 1 Arc-Minute Global Relief Model: Procedures, Data Sources and Analysis. NOAA Technical Memorandum NESDIS NGDC-24. Silver Spring, MA: NOAA.
Balmino, G., Vales, N., Bonvalot, S., and Briais, A. (2012). Spherical harmonic modelling to ultra-high degree of Bouguer and isostatic anomalies. J. Geodesy 86, 499–520. doi: 10.1007/s00190-011-0533-4
Barbraud, C., Rivalan, P., Inchausti, P., Nevoux, M., Rolland, V., Weimerskirch, H., et al. (2011). Contrasted demographic responses facing future climate change in Southern Ocean seabirds. J. Anim. Ecol. 80, 89–100. doi: 10.1111/j.1365-2656.2010.01752.x
Bortolotto, G. A., Danilewicz, D., Hammond, P. S., Thomas, L., and Zerbini, A. N. (2017). Whale distribution in a breeding area: spatial models of habitat use and abundance of western South Atlantic humpback whales. Mar. Ecol. Prog. Ser. 585, 213–227. doi: 10.3354/meps12393
Bowlin, M. S., Bisson, I. A., Shamoun-Baranes, J., Reichard, J. D., Sapir, N., Marra, P. P., et al. (2010). Grand challenges in migration biology. Integrat. Comp. Biol. 50, 261–279.
Brothers, J. R., and Lohmann, K. J. (2018). Evidence that magnetic navigation and geomagnetic imprinting shape spatial genetic variation in sea turtles. Curr., Biol. 28, 1325–1329.
Chapman, J. W., Klaassen, R. H., Drake, V. A., Fossette, S., Hays, G. C., Metcalfe, J. D., et al. (2011). Animal orientation strategies for movement in flows. Curr. Biol. 21, R861–R870.
Chulliat, A., Alken, P., Nair, M., Woods, A., and Maus, S. (2015). The enhanced Magnetic Model 2015-2020. Asheville, CA: National Centers for Environmental Information.
Clarke, M. R. (1978). Buoyancy control as a function of the spermaceti organ in the Sperm Whale. J. Mar. Biol. Assoc. U. K. 58, 27–71. doi: 10.1017/s0025315400024395
Cohen, J. M., Lajeunesse, M. J., and Rohr, J. R. (2018). A global synthesis of animal phenological responses to climate change. Nat. Clim. Change 8, 224–228. doi: 10.1038/s41558-018-0067-3
Cotton, P. A. (2003). Avian migration phenology and global climate change. Proc. Natl. Acad. Sci. U.S.A. 100, 12219–12222. doi: 10.1073/pnas.1930548100
Croll, D. A., Kudela, R., and Tershy, B. R. (2006). “Ecosystem impact of the decline of large whales in the North Pacific,” in Whales, Whaling and Ocean Ecosystems, eds A. James, J. A. Estes, D. P. DeMaster, D. F. Doak, R. L. Brownell, and T. M. Williams (Berkeley, CA: University of California Press), 202–214. doi: 10.1525/california/9780520248847.003.0016
Derville, S., Torres, L. G., Albertson, R., Andrews, O., Baker, C. S., Carzon, P., et al. (2019). Whales in warming water: assessing breeding habitat diversity and adaptability in Oceania’s changing climate. Global Change Biol. 25, 1466–1481. doi: 10.1111/gcb.14563
ESR (2009). OSCAR third Degree Resolution Ocean Surface Currents. Avaliable at: http://dx.doi.org/10.5067/OSCAR-03D01 (accessed May 22, 2018)
ESRI (2011). ArcGIS Desktop.“Release 10.” Documentation Manual. Redlands, CA: Environmental Systems Research Institute.
Fisahn, J., Klingelé, E., and Barlow, P. (2015). Lunar gravity affects leaf movement of Arabidopsis thaliana in the International Space Station. Planta 241, 1509–1518. doi: 10.1007/s00425-015-2280-x
Fisahn, J., Yazdanbakhsh, N., Klingelé, E., and Barlow, P. (2012). Arabidopsis thaliana root growth kinetics and lunisolar tidal acceleration. New Phytol. 195, 346–355. doi: 10.1111/j.1469-8137.2012.04162.x
Fleming, A. H., Clark, C. T., Calambokidis, J., and Barlow, J. (2016). Humpback whale diets respond to variance in ocean climate and ecosystem conditions in the California Current. Global Change Biol. 22, 1214–1224. doi: 10.1111/gcb.13171
Gaspar, P., Georges, J. Y., Fossette, S., Lenoble, A., Ferraroli, S., and Le Maho, Y. (2006). Marine animal behaviour: neglecting ocean currents can lead us up the wrong track. Proc. R. Soc. B Biol. Sci. 273, 2697–2702. doi: 10.1098/rspb.2006.3623
Gilbert, R. O. (1987). Statistical Methods for Environmental Pollution Monitoring. New York, NY: Van Nostrand Reinhold.
Goni, G. J., Bringas, F., and DiNezio, P. N. (2011). Observed low frequency variability of the Brazil Current front. J. Geophys. Res. Oceans 116:C10037.
Götze, H.-J. (2014). “International gravity formula,” in Encyclopedia of Solid Earth Geophysics, ed. H. K. Gupta (Dordrecht: Springer), 611–612. doi: 10.1007/978-90-481-8702-7_102
Hammer, Ø, Harper, D. A. T., and Ryan, P. D. (2001). PAST: paleontological statistics software package for education and data analysis. Palaeontol. Electron. 4, 1–9.
Harris, G., Thirgood, S., Hopcraft, J. G. C., Cromsigt, J. P. G. M., and Berger, J. (2009). Global decline in aggregated migrations of large terrestrial mammals. Endanger. Species Res. 7, 55–76. doi: 10.3354/esr00173
Harris, L. R., Nel, R., Oosthuizen, H., Meÿer, M., Kotze, D., Anders, D., et al. (2018). Managing conflicts between economic activities and threatened migratory marine species toward creating a multiobjective blue economy. Conserv. Biol. 32, 411–423. doi: 10.1111/cobi.12992
Hartmann, G. A., and Pacca, I. G. (2009). Time evolution of the South Atlantic magnetic anomaly. Anais Acad. Brasil. Ciên. 81, 243–255. doi: 10.1590/s0001-37652009000200010
Hauser, N., Zerbini, A. N., Geyer, Y., Heide-Jørgensen, M. P., and Clapham, P. (2010). Movements of satellite-monitored humpback whales, Megaptera novaeangliae, from the Cook Islands. Mar. Mamm. Sci. 26, 679–685.
Hausfather, Z., Cowtan, K., Clarke, C. D., Jacobs, P., Richardson, M., Rohde, R., et al. (2017). Assessing recent warming using instrumentally homogeneous sea surface temperature records. Sci. Adv. 3:e1601207. doi: 10.1126/sciadv.1601207
Hays, G. C., Ferreira, L. C., Sequeira, A. M. M., Meekan, M. G., Duarte, C. M., Bailey, H., et al. (2016). Key questions in marine megafauna movement ecology. Trends Ecol. Evol. 31, 463–475.
Hazen, E. L., Jorgensen, S., Rykaczewski, R. R., Bograd, S., Foley, D. G., Jonsen, I. D., et al. (2013). Predicted habitat shifts of Pacific top predators in a changing climate. Nat. Clim. Change 3:234. doi: 10.1038/nclimate1686
Hoegh-Guldberg, O., and Bruno, J. F. (2010). The impact of climate change on the world’s marine ecosystems. Science 328, 1523–1528. doi: 10.1126/science.1189930
Hof, A. R., Rodríguez-Castañeda, G., Allen, A. M., Jansson, R., and Nilsson, C. (2017). Vulnerability of subarctic and arctic breeding birds. Ecol. Appl. 27, 219–234. doi: 10.1002/eap.1434
Horton, T. W., Hauser, N., Zerbini, A., Francis, M. P., Domeier, M. L., Andriol, A., et al. (2017). Route fidelity during marine megafauna migration. Front. Mar. Sci. 4:422.
Horton, T. W., Holdaway, R. N., Zerbini, A. N., Hauser, N., Garrigue, C., Andriolo, A., et al. (2011). Straight as an arrow: humpback whales swim constant course tracks during long-distance migration. Biol. Lett. 7, 674–679. doi: 10.1098/rsbl.2011.0279
Kennedy, A. S., Zerbini, A. N., Vásquez, O. V., Gandilhon, N., Clapham, P. J., and Adam, O. (2014). Local and migratory movements of humpback whales (Megaptera novaeangliae) satellite-tracked in the North Atlantic Ocean. Can. J. Zool. 92, 9–18. doi: 10.1139/cjz-2013-0161
Kirschvink, J. L., Dizon, A. E., and Westphal, J. A. (1986). Evidence from strandings for geomagnetic sensitivity in cetaceans. J. Exp. Biol. 120, 1–24.
Lohmann, K. J., Hester, J. T., and Lohmann, C. M. F. (1999). Long-distance navigation in sea turtles. Ethol. Ecol. Evol. 11, 1–23. doi: 10.1080/08927014.1999.9522838
MacLeod, C. D. (2009). Global climate change, range changes and potential implications for the conservation of marine cetaceans: a review and synthesis. Endanger. Species Res. 7, 125–136. doi: 10.3354/esr00197
Marcello, F., Wainer, I., and Rodrigues, R. R. (2018). South Atlantic subtropical gyre late twentieth century changes. J. Geophys. Res. Oceans 123, 5194–5209. doi: 10.1029/2018jc013815
Mate, B. R., Gisiner, R., and Mobley, J. (1998). Local and migratory movements of Hawaiian humpback whales tracked by satellite telemetry. Can. J. Zool. 76, 863–868. doi: 10.1139/z98-008
Miloslavich, P., Bax, N. J., Simmons, S. E., Klein, E., Appeltans, W., Aburto-Oropeza, O., et al. (2018). Essential ocean variables for global sustained observations of biodiversity and ecosystem changes. Global Change Biol. 2416–2433.
Mohriak, W. U., Nóbrega, M., Odegard, M. E., Gomes, B. S., and Dickson, W. G. (2010). Geological and geophysical interpretation of the rio grande rise, south-eastern Brazilian margin: extensional tectonics and rifting of continental and oceanic crusts. Petrol. Geosci. 16, 231–245. doi: 10.1144/1354-079309-910
NASA (2018). Goddard Space Flight Center, Ocean Ecology Laboratory, Ocean Biology Processing Group. Moderate-resolution Imaging Spectroradiometer (MODIS) Aqua {Aqua MODIS Sea Surface Temperature, Monthly, 4 km} Data. Greenbelt, MD: NASA.
Noad, M. J., and Cato, D. H. (2007). Swimming speeds of singing and non-singing humpback whales during migration. Mar. Mamm. Sci. 23, 481–495. doi: 10.1111/j.1748-7692.2007.02414.x
Owen, K., Jenner, K. C. S., Jenner, M. N. M., McCauley, R. D., and Andrews, R. D. (2019). Water temperature correlates with baleen whale foraging behaviour at multiple scales in the Antarctic. Mar. Freshw. Res. 70, 19–32.
Peñuelas, J., Filella, I., and Comas, P. (2002). Changed plant and animal life cycles from 1952 to 2000 in the Mediterranean region. Global Change Biol. 8, 531–544. doi: 10.1046/j.1365-2486.2002.00489.x
Pereira, H. M., Ferrier, S., Walters, M., Geller, G. N., Jongman, R. H. G., Scholes, R. J., et al. (2013). Essential biodiversity variables. Science 339, 277–278.
Record, N., Runge, J., Pendleton, D., Balch, W., Davies, K., Pershing, A., et al. (2019). Rapid climate-driven circulation changes threaten conservation of endangered north atlantic right whales. Oceanography 32, 162–169.
Riekkola, L., Zerbini, A., Andrews, Andrews-Goff, V., Baker, C. S., and Childerhouse, S. (2018). Application of a multi-disciplinary approach to reveal population structure and Southern Ocean feeding grounds of humpback whales. Ecol. Indicat. 89, 455–465. doi: 10.1016/j.ecolind.2018.02.030
Roman, J., and McCarthy, J. J. (2010). The whale pump: marine mammals enhance primary productivity in a coastal basin. PLoS One 5:e13255. doi: 10.1371/journal.pone.0013255
Rosenbaum, H. C., Pomilla, C., Mendez, M., Leslie, M. S., Best, P. B., Findlay, K. P., et al. (2009). Population structure of humpback whales from their breeding grounds in the South Atlantic and Indian Oceans. PLoS One 4:e7318. doi: 10.1371/journal.pone.0007318
Santora, J. A., Mantua, N. J., Schroeder, I. D., Field, J. C., Hazen, E. L., Bograd, S. J., et al. (2020). Habitat compression and ecosystem shifts as potential links between marine heatwave and record whale entanglements. Nat. Commun. 11, 1–12.
Schwenk, K., Padilla, D. K., Bakken, G. S., and Full, R. J. (2009). Grand challenges in organismal biology. Integrat. Comp. Biol. 49, 7–14. doi: 10.1093/icb/icp034
Silber, G. K., Lettrich, M. D., Thomas, P. O., Baker, J. D., Baumgartner, M., Becker, E. A., et al. (2017). Projecting marine mammal distribution in a changing climate. Front. Mar. Sci. 4:413. doi: 10.3389/fmars.2017.00413
Silverman, B. W. (1986). Density Estimation for Statistics and Data Analysis. London: Chapman & Hall.
Sprogis, K. R., Christiansen, F., Wandres, M., and Bejder, L. (2018). El Niño Southern Oscillation influences the abundance and movements of a marine top predator in coastal waters. Global change Biol. 24, 1085–1096.
Thackeray, S. J., Henrys, P. A., Hemming, D., Bell, J. R., Botham, M. S., Burthe, S., et al. (2016). Phenological sensitivity to climate across taxa and trophic levels. Nature 535, 241–245. doi: 10.1038/nature18608
Trudelle, L., Cerchio, S., Zerbini, A. N., Geyer, Y., Mayer, F.-X., Jung, J.-L., et al. (2016). Influence of environmental parameters on movements and habitat utilization of humpback whales (Megaptera novaeangliae) in the Madagascar breeding ground. R. Soc. Open Sci. 3:160616. doi: 10.1098/rsos.160616
Urban, M. C., Bocedi, G., Hendry, A. P., Mihoub, J. B., Pe’er, G., Singer, A., et al. (2016). Improving the forecast for biodiversity under climate change. Science 353:aad8466.
van Doren, B. M., Horton, K. G., Dokter, A. M., Klinck, H., Elbin, S. B., Farnsworth, A., et al. (2017). High-intensity urban light installation dramatically alters nocturnal bird migration. Proc. Natl. Acad. Sci. U.S.A. 114, 11175–11180. doi: 10.1073/pnas.1708574114
Wilcove, D. S., and Wikelski, M. (2008). Going, going, gone: is animal migration disappearing. PLoS Biol. 6:e188. doi: 10.1371/journal.pbio.0060188
Witteveen, B. H., and Wynne, K. M. (2016). Trophic niche partitioning and diet composition of sympatric fin (Balaenoptera physalus) and humpback whales (Megaptera novaeangliae) in the Gulf of Alaska revealed through stable isotope analysis. Mar. Mamm. Sci. 32, 1319–1339. doi: 10.1111/mms.12333
Wu, L., Cai, W., Zhang, L., Nakamura, H., Timmermann, A., Joyce, T., et al. (2012). Enhanced warming over the global subtropical western boundary currents. Nat. Clim. Change 2, 161–166. doi: 10.1038/nclimate1353
Zemsky, V. A., Berzin, A. A., Mikhaliev, Y. A., and Tormosov, D. D. (1996). Soviet Antarctic whaling Data (1947–1972), 2nd Edn. Moscow: Center for Russian Environment Policy.
Zerbini, A. N., Andriolo, A., Heide-Jørgensen, M. P., and Moreira, S. (2011). Migration and summer destinations of humpback whales (Megaptera novaeangliae) in the western South Atlantic Ocean. J. Cetacean Res. Manag. 3, 113–118.
Keywords: satellite telemetry, remote sensing, humpback whale, migration, navigation, South Atlantic Ocean, geomagnetism, environmental change
Citation: Horton TW, Zerbini AN, Andriolo A, Danilewicz D and Sucunza F (2020) Multi-Decadal Humpback Whale Migratory Route Fidelity Despite Oceanographic and Geomagnetic Change. Front. Mar. Sci. 7:414. doi: 10.3389/fmars.2020.00414
Received: 13 April 2019; Accepted: 12 May 2020;
Published: 24 June 2020.
Edited by:
Eric Delory, Oceanic Platform of the Canary Islands, SpainReviewed by:
Peter Corkeron, New England Aquarium, United StatesJan Straley, University of Alaska Southeast, United States
Copyright © 2020 Horton, Zerbini, Andriolo, Danilewicz and Sucunza. This is an open-access article distributed under the terms of the Creative Commons Attribution License (CC BY). The use, distribution or reproduction in other forums is permitted, provided the original author(s) and the copyright owner(s) are credited and that the original publication in this journal is cited, in accordance with accepted academic practice. No use, distribution or reproduction is permitted which does not comply with these terms.
*Correspondence: Travis W. Horton, dHJhdmlzLmhvcnRvbkBjYW50ZXJidXJ5LmFjLm56