 Richard Grainger
 Victor M. Peddemors
 David Raubenheimer
 Gabriel E. Machovsky-Capuska
- 1Charles Perkins Centre, The University of Sydney, Sydney, NSW, Australia
- 2School of Life and Environmental Sciences, The University of Sydney, Sydney, NSW, Australia
- 3New South Wales Department of Primary Industries (Fisheries), Sydney Institute of Marine Science, Mosman, NSW, Australia
Establishing diets and dietary generalism in marine top predators is critical for understanding their ecological roles and responses to environmental fluctuations. Nutrition plays a key mediatory role in species-environment interactions, yet descriptions of marine predators’ diets are usually limited to the combinations of prey species consumed. Here we combined stomach contents analysis (n = 40), literature prey nutritional data and a multidimensional nutritional niche framework to establish the diet and niche breadths of white sharks (Carcharodon carcharias; mean ± SD precaudal length = 187.9 ± 46.4 cm, range = 123.8–369.0 cm) caught incidentally off New South Wales (NSW), Australia. Our nutritional framework also facilitated the incorporation of existing literature diet information for South African white sharks to further evaluate nutritional niches across populations and sizes. Although teleosts including pelagic eastern Australian salmon (Arripis trutta) were the predominant prey for juvenile white sharks in NSW, the diversity of benthic and reef-associated species and batoids suggests regular benthic foraging. Despite a small sample size (n = 18 and 19 males and females, respectively), there was evidence of increased batoid consumption by males relative to females, and a potential size-based increase in shark and mammal prey consumption, corroborating established ontogenetic increases in trophic level documented elsewhere for white sharks. Estimated nutritional intakes and niche breadths did not differ among sexes. Niche breadths were also similar between juvenile white sharks from Australia and South Africa. An increase in nutritional niche breadth with shark size was detected, associated with lipid consumption, which we suggest may relate to shifting nutritional goals linked with expanding migratory ranges.
Introduction
Marine top predators shape their ecosystems through diet and nutrition (Machovsky-Capuska and Raubenheimer, 2020). Despite their ecological importance, population declines and foraging-associated conflicts with humans are also widespread among marine predators, posing significant management challenges (Heithaus et al., 2008; Guerra, 2019). Although critical for contextualising broader aspects of their ecology (e.g. movements, habitat use) which are relevant for addressing these management challenges, the diet of many top predators remains poorly characterised (Ramos and Gonzalez-Solis, 2012; Machovsky-Capuska et al., 2016a).
Our understanding of the drivers of foraging in marine predators will remain limited if diets are described solely, on a taxonomic basis, as the combination of prey species that a predator consumes. The literature provides abundant evidence that prey, themselves, are complex and variable combinations of macro- (e.g. proteins, lipids) and micro-nutrients (e.g. vitamins and minerals) with diverse functional implications for the consumer (Simpson and Raubenheimer, 2012). Yet dominant frameworks in foraging and community ecology are largely conceptualised around energetic value (e.g. calorific content of prey) as the sole currency that determines foraging decisions (Lindeman, 1942; Stephens and Krebs, 1986). Rather, a nutritionally explicit approach that distinguishes between multiple functional food components (nutrients) and links physiology, behaviour and ecology can enable a better understanding of animals’ responses to their environment (del Rio and Cork, 1997; Raubenheimer et al., 2009).
To provide such a platform, the nutritional geometry framework (NGF) was developed (Raubenheimer and Simpson, 1993; Simpson and Raubenheimer, 1995; Simpson et al., 2004; Raubenheimer, 2011). The NGF models foods and diets as mixtures of macro- (e.g. proteins, lipids and carbohydrates) and micro-nutrients (e.g. vitamins, minerals), thereby allowing the influence of specific nutritional components, as well as their interactions, on foraging decisions to be tested (Raubenheimer et al., 2009). Proportions-based NGF models were developed to overcome the logistical constrains of field-based research, enabling a graphical representation of the relationships among nutrients, prey, meals and diets (Raubenheimer, 2011). Laboratory and field-based studies using NGF in terrestrial (Hewson-Hughes et al., 2013; Erlenbach et al., 2014; Felton et al., 2016; Coogan et al., 2017) and marine systems (Raubenheimer et al., 2005; Ruohonen et al., 2007; Rowe et al., 2018) have since provided consistent evidence that food selection is likely driven by specific mixtures of nutrients, rather than energy per se.
Proportions-based NGF was recently applied in a novel development of niche theory, establishing a new multidimensional nutritional niche framework (MNNF) for assessing dietary generalism (Machovsky-Capuska et al., 2016d). Under this framework, dietary classification along a generalist-specialist spectrum might differ at the levels of prey eaten (‘prey composition niche’) and the nutrient content of the diet given ecological constraints (‘realised nutritional niche’). Species’ classifications as generalists or specialists can predict their success across environmental contexts (Slatyer et al., 2013; Machovsky-Capuska et al., 2016d; Senior et al., 2016). Certainly, knowledge of predator nutritional niche breadths and requirements could assist in understanding their responses to variations in prey availability and composition (Machovsky-Capuska et al., 2016d). Several studies on marine predators, including seabirds (Tait et al., 2014; Machovsky-Capuska et al., 2016b, c; Miller et al., 2017), cetaceans (Denuncio et al., 2017), fish, sharks and pinnipeds (Machovsky-Capuska and Raubenheimer, 2020) have now drawn from the MNNF to provide fresh insights into their nutritional ecology.
Machovsky-Capuska et al. (2018) incorporated a standardised metric (standard ellipse area, SEA) and statistical framework utilising Bayesian multivariate ellipses (sensu Jackson et al., 2011) to quantify and compare nutritional niche breadths. The authors showed how the nutritional composition of prey and diets, niche breadths, foraging behaviour and habitat use in marine predators are shaped by environmental fluctuations. Such approaches can assist in exploring the movements of species (Simpson et al., 2006; Nie et al., 2015) and foraging patterns that lead to human-predator conflict (Coogan et al., 2014; Coogan and Raubenheimer, 2016).
White sharks (Carcharodon carcharias) are large marine predators found globally in temperate and sub-tropical coastal and open ocean regions (Domeier, 2012). Listed as vulnerable by the IUCN (Rigby et al., 2019), white sharks are protected across much of their range, including Australian waters (Malcom et al., 2001). Despite the challenges inherent to studying these large, mobile and threatened marine predators, a variety of techniques have been employed to investigate their foraging ecology including direct observation (Tricas and McCosker, 1984; Klimley, 1994) and biologging (Jorgensen et al., 2015; Jewell et al., 2019; Watanabe et al., 2019a, b), fatty acid (Pethybridge et al., 2014; Meyer et al., 2019) and stable isotope signatures (Estrada et al., 2006; Carlisle et al., 2012; Hussey et al., 2012; Kim et al., 2012; French et al., 2018; Tamburin et al., 2019), and to a lesser extent stomach contents analysis (Tricas and McCosker, 1984; Bruce, 1992; Hussey et al., 2012). These studies broadly characterise white sharks as generalist top predators of teleosts, elasmobranchs and cephalopods which undergo an ontogenetic increase in tropic level and dietary inclusion of marine mammals as they transition from juveniles (<3 m total length; TL) to sub-adults and adults (>3 m TL) (Estrada et al., 2006; Hussey et al., 2012; Kim et al., 2012). Evidence for ontogenetic variation in foraging habitat use has also been identified, with an apparent predominance of nearshore prey resources in the diet of juveniles and greater exploitation of offshore food webs among adults (Carlisle et al., 2012; French et al., 2018; Tamburin et al., 2019).
In eastern Australia, white sharks predominantly inhabit coastal and neritic regions between southern Queensland (∼22°S) and northern Tasmania (∼40°S), exhibiting seasonal latitudinal movements that might relate to local prey distributions (Bruce et al., 2006, 2019). While larger individuals occasionally inhabit this region, the majority of those encountered are juveniles (<3 m TL; Reid et al., 2011; Bruce and Bradford, 2012; Bruce et al., 2013). White sharks are also the primary shark species responsible for bites on humans in eastern Australia (West, 2011). However, despite efforts to conserve and manage this species, their diet this region has not been characterised.
Here, stomach content analyses (SCA) were combined with prey composition data, MNNF and Bayesian multivariate ellipses to provide the first dietary and nutritional assessment for white sharks in eastern Australia. Given the relative abundance of smaller individuals within the study area, as discussed above, the majority of stomach samples were from sharks <3 m TL (∼2.35 m precaudal length; PCL) and thus our SCA data should be considered representative of juvenile white sharks (Bruce and Bradford, 2012). To extend our exploration of variability in the nutritional niche of white sharks more broadly across populations and sizes, we also integrate literature stomach content data for South African white sharks (Hussey et al., 2012) using our MNNF approach. Observational evidence for nutrient-specific foraging in white sharks exists (e.g. selective feeding on body parts and lipid-rich tissues of whales; Fallows et al., 2013; Tucker et al., 2019), and sex-specific variation in foraging behaviour and habitat use have also been observed (Bruce and Bradford, 2015; Bruce et al., 2019). Building on these previous studies, our specific objectives were to: (1) establish the diet composition and key prey species of juvenile white sharks in eastern Australia, (2) examine whether shark sex or size predicts the prey consumed, (3) determine if sex or size influences the nutritional composition of prey, diets and niche breadths of white sharks from eastern Australia and (4) compare nutritional niche breadths of juvenile white sharks between eastern Australia and South Africa, and between juveniles, subadults and adults within South Africa.
Materials and Methods
Ethics Statement
All stomachs were collected from deceased white sharks caught in the New South Wales Shark Meshing (Bather Protection) Program (NSW SMP), operated by the NSW Department of Primary Industries (NSW DPI), or from other incidental mortalities. No animals were killed specifically for this research. Collection of samples was conducted under NSW DPI permit # P01/0059(A)-4.0.
Stomach Sampling
Between 2008 and 2019, a total of 52 white shark stomach samples were obtained through the NSW SMP (n = 47), which operates annually over the Austral summer (September to April), and from incidental mortalities (entanglements, beached carcasses) near Ballina (northern NSW, n = 4) and Jervis Bay (southern NSW, n = 1) (Figure 1 and Supplementary Table S1). Sharks were transported to Sydney, Australia, and stored frozen (−20°C) for subsequent necropsy. During necropsy, a range of biological data and morphometrics were recorded including sex (based on presence/absence of claspers), precaudal length (PCL, cm), fork length (FL, cm) and total length (TL, cm), and stomachs (oesophagus to pyloric sphincter) were removed, sealed with cable ties and refrozen (−20°C) in polyethylene bags until analysis.
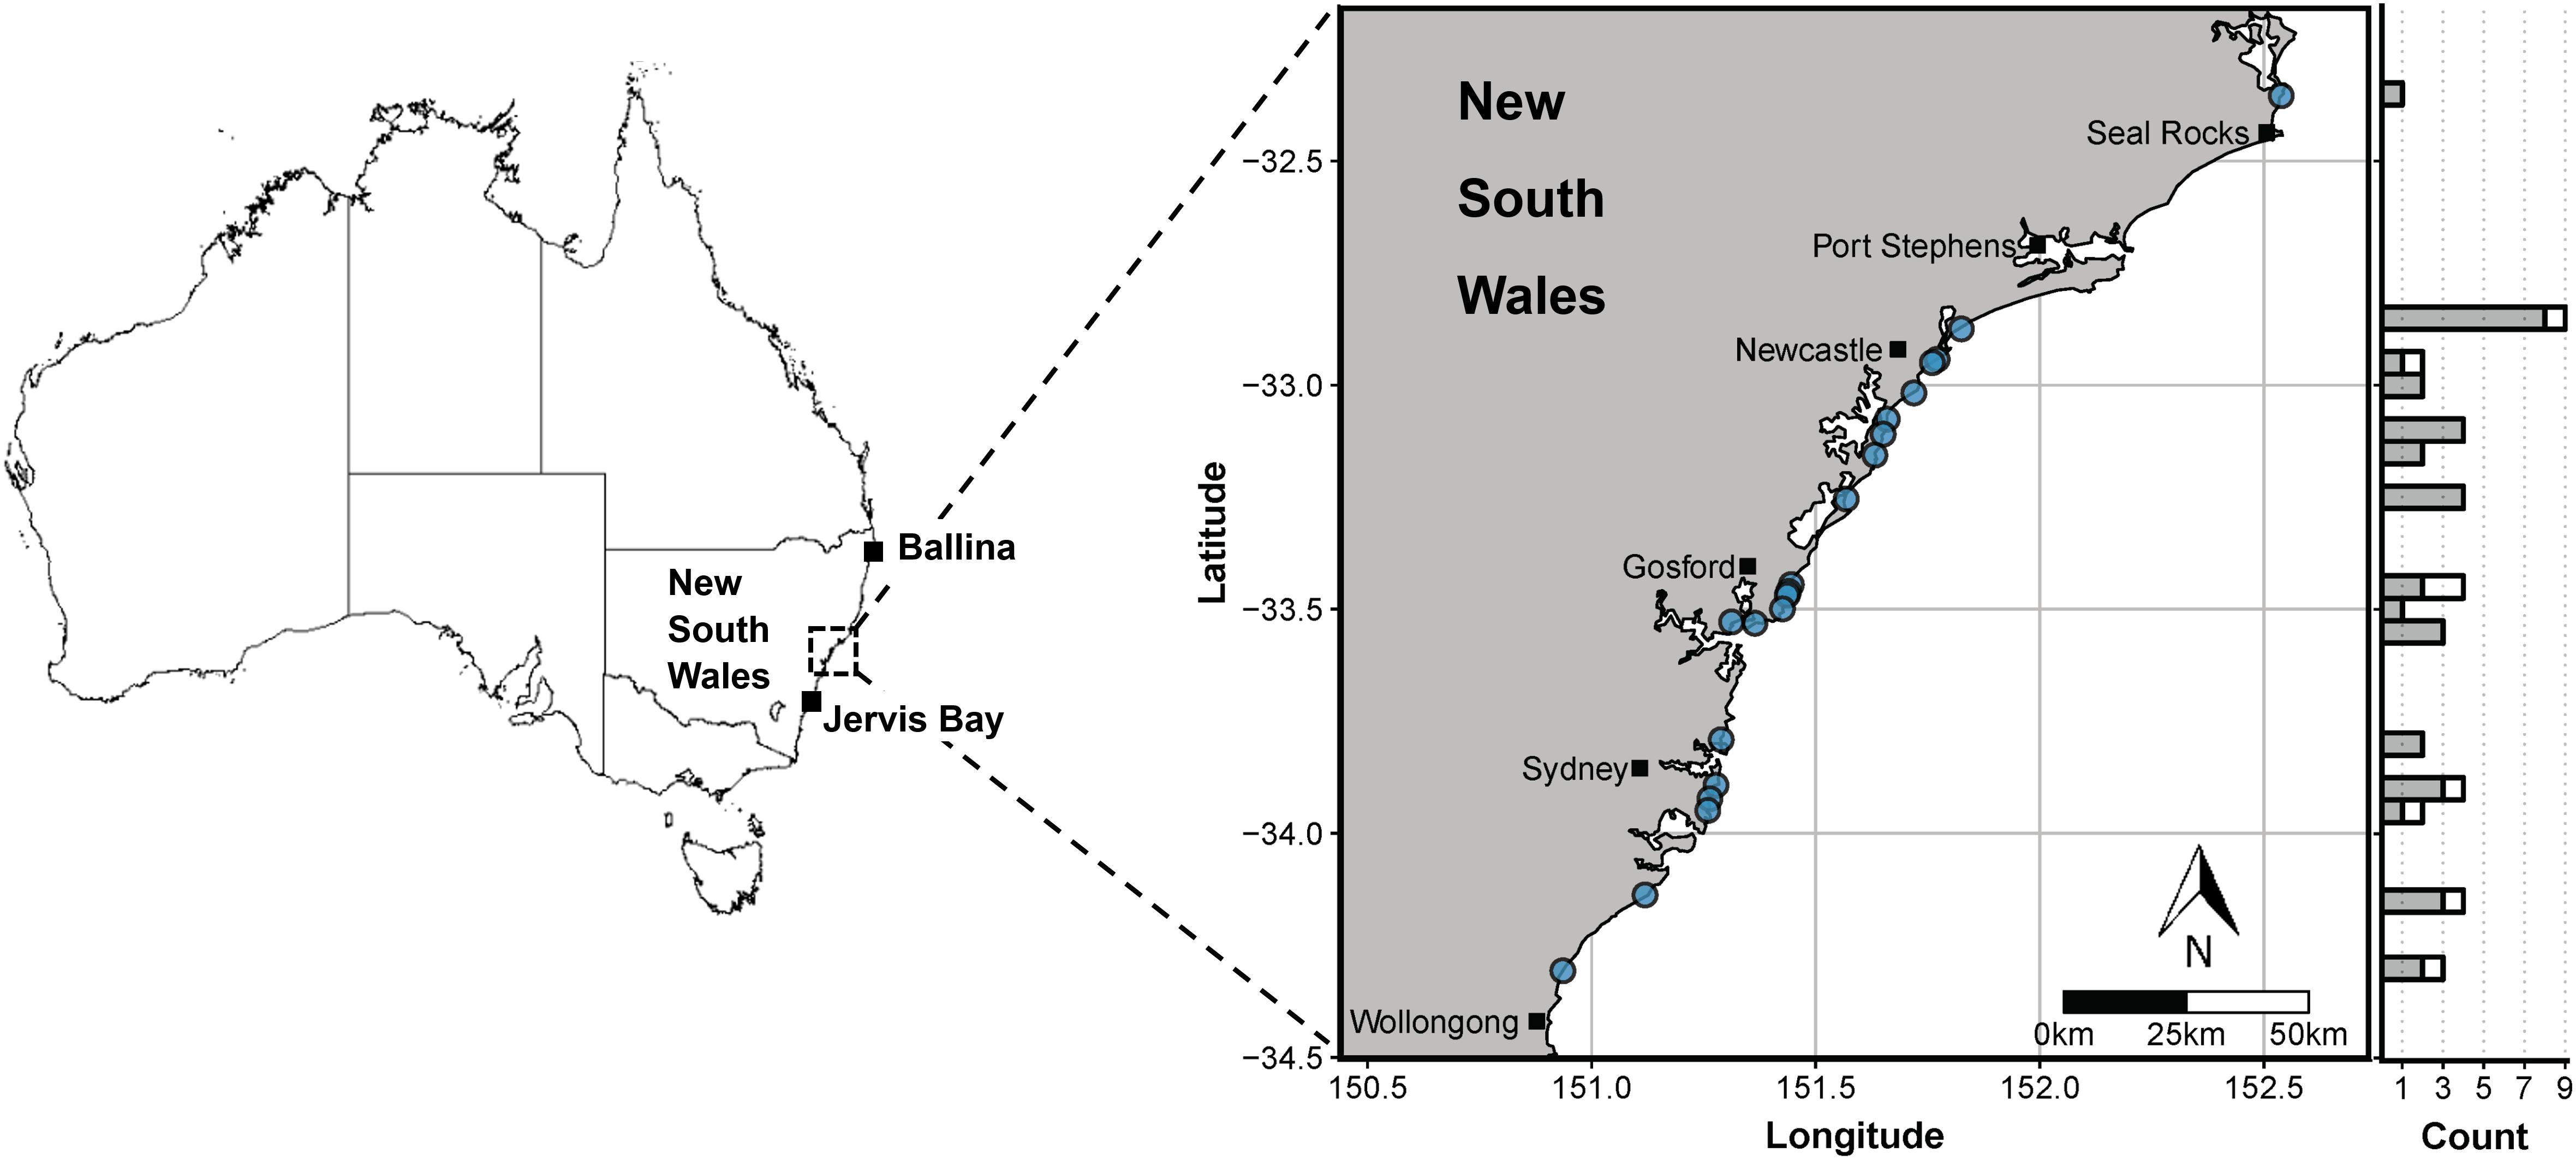
Figure 1. Sampling locations for white sharks in this study through the New South Wales Shark Meshing (Bather Protection) Program (map on right) and incidental mortalities (Ballina and Jervis Bay). Blue dots denote the beaches at which sharks were sampled and the marginal histogram shows the latitudinal distribution of non-empty (grey) and empty stomachs (white). Map shapefile source: Geoscience Australia (http://pid.geoscience.gov.au/dataset/ga/60804).
Stomach Contents Analysis
Stomachs were thawed, intact prey were removed, and remaining contents (loose bones, otoliths, beaks) were washed through nested mesh sieves (2, 1, 0.5 mm) with water. Prey were identified to the lowest possible taxonomic level using published guides (Smale et al., 1995; Lu and Ickeringill, 2002; Furlani et al., 2007; Last and Stephens, 2009; Reid, 2016; Froese and Pauly, 2019) and reference collections at the Australian Museum (otoliths) and the University of Sydney/Australian National University (teleost bones)1.
Prey were counted and weighed (to 0.1 or 0.00001 g for cephalopod beaks and otoliths), with enumeration of digested items based on the minimum number of individuals by otoliths (maximum number of left or right otoliths), jaw bones (maximum number of left or right dentaries/premaxillae) or cephalopod beaks (maximum number of upper or lower beaks). Where possible, prey lengths were measured (nearest mm) using FL for fish, sharks and small rays (where FL = TL for species without a forked tail), disc width (DW) for eagle rays (Last and Stephens, 2009), total body length (TBL; tip of upper rostrum to tail notch, Norris, 1961) for dolphins and mantle length (ML) for cephalopods (Reid, 2016). Other body morphometrics (e.g. eagle ray tooth plate width, dentary length), otolith diameter (Smale et al., 1995), lower beak crest length (cuttlefish) and lower beak rostrum length (squid) (Lu and Ickeringill, 2002) were also measured to the nearest 0.01 mm using either ImageJ software or digital callipers (iGaging OriginCal©), depending on size. These measurements were used to calculate reconstructed lengths and masses of prey using length-weight relationships from the literature (Supplementary Table S2) to help address potential biases in the wet mass data associated with an advanced digestive state. Where relevant below, counts and lengths of prey are expressed as means ± SD.
Indices of Dietary Importance and Statistical Analyses
Objective 1: Establish the Diet Composition and Key Prey Species of White Sharks in Eastern Australia
To quantify the relative dietary importance of prey items to white sharks, standard indices of percent frequency of occurrence (%F; the percentage of stomachs containing a particular prey species), percentage number (%N; the number of individuals of a particular prey species as a percentage of all prey individuals identified across all stomachs), percentage mass (%M) and percentage index of relative importance (%IRI) using non-reconstructed mass were calculated (Hyslop, 1980; Cortés, 1997). For comparison, %M and %IRI were also calculated using reconstructed mass (denoted %MR and %IRIR, respectively). These indices were calculated separately for each sex, and for all sharks combined.
Objective 2: Examine Whether Sex or Size Influences the Prey Consumed by White Sharks in Eastern Australia
For statistical comparisons of the diet, prey species were grouped into seven functional groups defined by taxonomy and habitat using FishBase (Froese and Pauly, 2019): pelagic teleosts, reef-associated teleosts, demersal teleosts, sharks, batoids, mammals and cephalopods (Table 1). Teleosts and elasmobranchs that were unable to be identified were excluded from analyses. To examine whether sex or size influenced the frequency of occurrence (presence/absence) or number (count) of prey, binomial and Poisson/negative binomial generalised linear models (GLMs), respectively, were fitted separately for each prey functional group. We used GLMs to test for dietary differences for the following reasons: (1) the number of prey groups was relatively small; (2) they allowed individual sharks to be used as samples (traditional distance-based multivariate approaches usually necessitate random pooling of multiple stomachs into ‘dietary samples’, requiring larger sample sizes; see Sommerville et al., 2011); (3) shark length could be modelled as a continuous predictor; (4) competing hypotheses about the effect of sex and size on prey consumption could be evaluated using small-sample corrected Akaike information criterion (AICc) which examines the trade-off between model fit and complexity/overfitting (Symonds and Moussalli, 2011). One male with missing length data was excluded so that the same samples were considered across all candidate models during AICc selection (AIC is only comparable across models based on the same sample set; Symonds and Moussalli, 2011) and subsequent corrections for multiple comparisons (Benjamini and Hochberg, 1995). One female containing unidentified prey was also excluded. Therefore, a total of 18 males and 19 females with known lengths were used in these analyses. Although the samples used for statistical analyses comprised individuals caught between 2008 and 2019, the majority were caught between 2014 and 2018 (92%), and in the Austral spring (Supplementary Figure S1). Given generally low sample sizes for any one year (n ≤ 8), and particularly for seasons other than spring (Supplementary Figure S1), sampling year and season were not included in models. The proportion of male and female stomachs was similar across seasons (Supplementary Figure S1) and thus season is unlikely to confound sex-based comparisons.
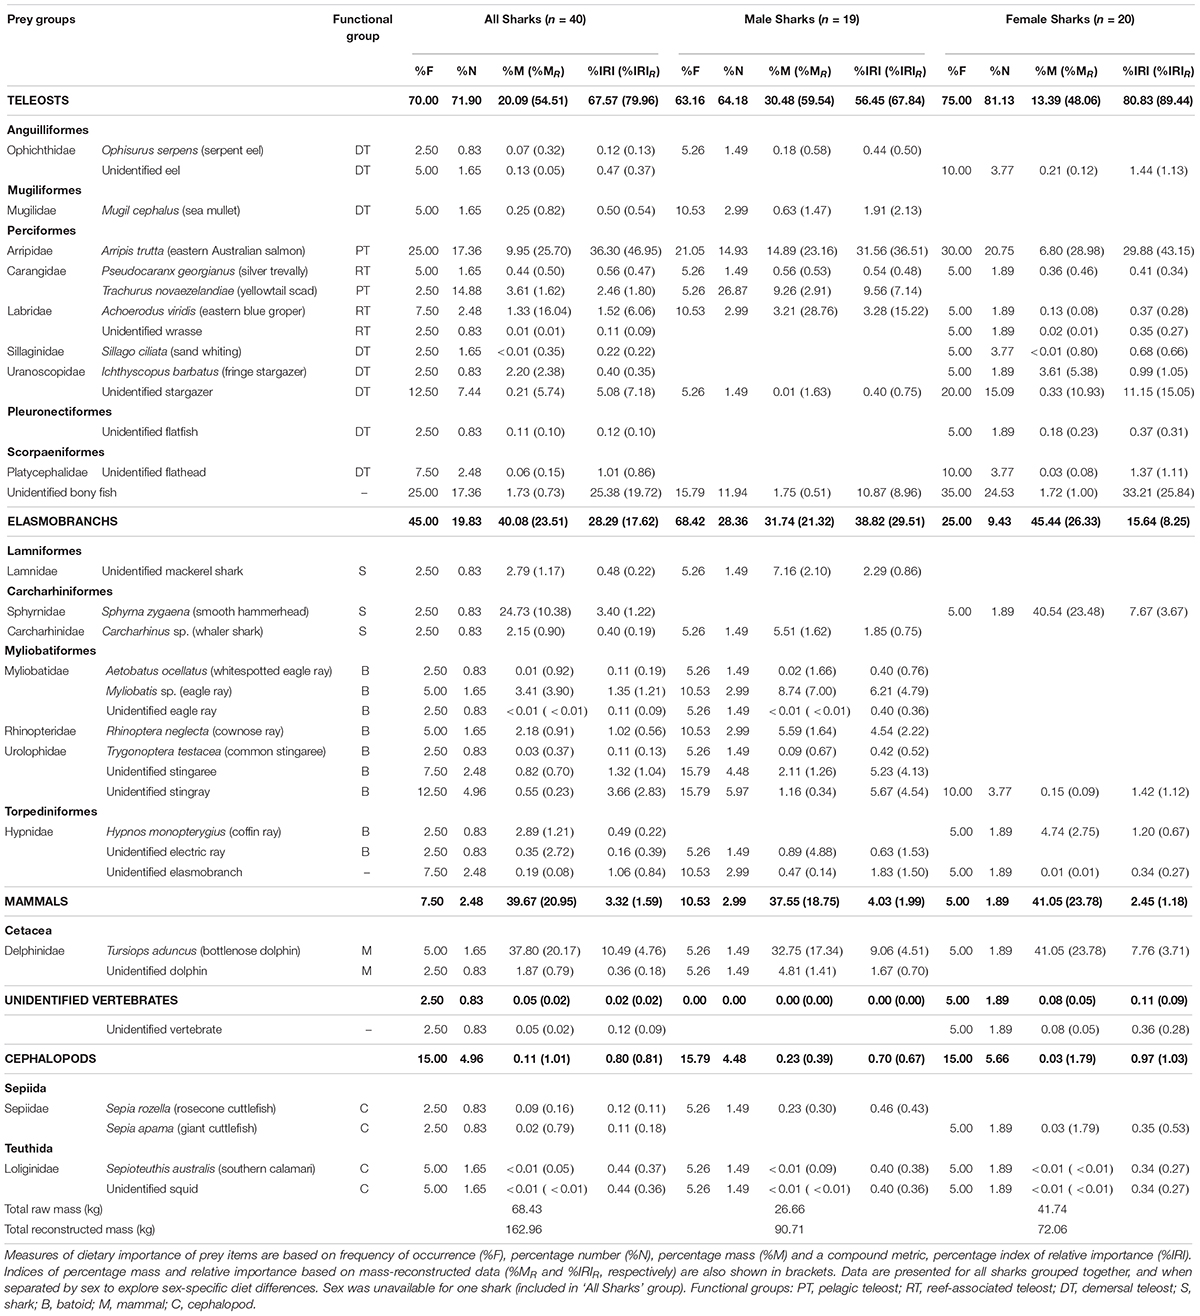
Table 1. Dietary importance of prey items, identified to the lowest possible taxonomic level, from analyses of stomach contents of white sharks (Carcharodon carcharias) sampled off Australia’s east coast.
For binomial GLMs, several prey groups were relatively rare (more absences than presences), where a clog-log link may be preferable to logit (Zuur et al., 2009). Therefore, initial models with predictors sex + PCL and either a logit or clog-log link were fitted for each prey group and the link giving the lowest AICc was favoured. Following Denuncio et al. (2017), several candidate binomial GLMs were then fitted within each prey functional group using the predictors sex, PCL, sex + PCL, and a null model with no predictors (intercept only) to investigate whether sex and PCL did not influence prey occurrences. The model with the lowest AICc was selected for each prey functional group. After Benjamini and Hochberg (1995), a false discovery rate (FDR) adjusted significance level of p < 0.0375 was used to account for multiple comparisons in the models where the null was not favoured (Supplementary Tables S3, S4; 4 p-values/tests).
Poisson or negative binomial GLMs (log link) were also fitted to test whether the numerical abundance of each functional group was influenced by sex or PCL. Over- or under-dispersion was assessed using the ratio of residual deviance/residual degrees freedom (>1 = overdispersion, <1 = underdispersion; Zuur et al., 2009). Where evidence of overdispersion was present, GLMs fit with Poisson and negative binomial error distributions (glm.nb function from MASS package; Venables and Ripley, 2002) were compared using a likelihood ratio test (lrtest function from lmtest package; Zeileis and Hothorn, 2002) to determine if fit was improved using a negative binomial error (Zuur et al., 2009). Candidate models including the predictors sex, PCL, sex + PCL and a null model were then compared using AICc and the model with the lowest AICc was selected for each prey functional group. As above, the FDR was controlled among models where the null was not selected (Supplementary Tables S5, S6; 5 p-values/tests) using a significance level of p < 0.01 (Benjamini and Hochberg, 1995). Analyses were conducted in R-3.6.0 (R Core Team, 2019).
Objective 3: Determine if Sex or Size Predicts the Nutritional Composition of Prey, Diets and Niche Breadths of White Sharks From Eastern Australia
To compare whether dietary nutrient intake and nutritional niche breadths vary with sex or size, data on the proximate composition of prey species of white sharks in eastern Australia were extracted from the literature (Supplementary Table S7). Compositions of prey were expressed as wet mass percentages of protein (%P), lipid (%L) and water (%W), given that carbohydrate content is negligible in most marine prey (Craig et al., 1978). When possible, we extracted prey compositions from studies conducted in geographical proximity to the present study (Supplementary Table S7; Tait et al., 2014). If nutritional information was unavailable for a prey species, average values for closely related taxa (same genus or family) with similar ecological attributes were used (Supplementary Table S7; Eder and Lewis, 2005). To estimate the composition of the diet, the nutritional composition of each stomach content sample (%P, %L, %W) was calculated using the proximate composition of the prey species present, multiplied by their proportional contribution to the total reconstructed mass of the stomach sample (Machovsky-Capuska et al., 2016c). To calculate the energy density of each stomach sample (Edensity, kJ g–1 reconstructed wet mass stomach content), macronutrients were converted to metabolisable energy using conversion factors of 17 and 37 kJ g–1 for protein and lipid, respectively (NRC, 1989). An estimate of mass-specific energy consumption (Eshark, kJ kg–1 shark mass) was also calculated using the total energy content of each stomach sample divided by total shark mass (excluding stomach content weight). Shark mass was measured directly (most individuals) or estimated using a PCL-mass relationship [mass (kg) = 1 × 10⁻⁸ PCL(mm)3.30394, n = 41, r2 = 0.92; Supplementary Table S1]. Diet compositions are expressed as mean ± SD, where relevant.
Prey and diet compositions were then visualised using proportions-based NGF models (Raubenheimer, 2011). These models facilitate plotting of three proportional dietary components in two dimensions whereby those three components sum to 100% such that knowing the values for the components on the x- and y-axes (here %P and %L) implies the value for the third component (%W) which increases towards the origin (as %P and %L decrease).
To explore whether sex or size influenced dietary nutritional components, separate linear models (LM) were fitted to each of %P, %L, %W, P:L (protein to lipid ratio), Edensity and Eshark (Machovsky-Capuska et al., 2016c). Prior to analysis, %P, %L and %W were logit transformed and P:L was natural log transformed. As for GLMs above, LMs for each nutritional component were fitted with the predictors sex, PCL, sex + PCL and a null, and the model favoured by AICc was selected. Stomach samples from 18 males and 19 females were used from these comparisons with 1 male with missing length data and 1 female containing unidentified prey excluded, as for GLM analyses on prey functional groups above.
The influence of sex and size on the niche breadth of prey and diet compositions consumed was explored following Machovsky-Capuska et al. (2018). Proportions-based NGF modelling was combined with Bayesian standard ellipses (Jackson et al., 2011) to produce estimates of prey composition and realised nutritional niche breadths as SEA (%2). Small-sample corrected SEA (SEAc; Syvaranta et al., 2013) were calculated for the prey and diet compositions consumed by each sex (n = 19 males and females; 1 female containing unidentified prey excluded), and for two size classes of sharks based on those used in Hussey et al. (2012); class 1:<185 cm PCL (n = 20 sharks), class 2: 185–234.9 cm PCL (n = 14 sharks). An additional male for which length data were unavailable was included here because effects of sex and size on nutritional niche breadth (SEAc) were investigated using separate analyses, unlike for GLM and LM analyses above where model selection and multiple comparison corrections required the exclusion of this male (Benjamini and Hochberg, 1995; Symonds and Moussalli, 2011). Larger size classes from Hussey et al. (2012) were not included in comparisons for eastern Australian white sharks due to low sample size. To evaluate if SEAc differed among groups (sexes or sizes), Bayesian inference with Markov chain Monte Carlo (MCMC) simulations was used to produce a range of possible posterior estimates for SEA (SEAb). MCMC simulations were performed using 2 × 10⁴ iterations with 2 chains, a burn-in of 1 × 10³ and thinning of 10. Differences among groups (sizes and sexes) were determined by comparing the resulting posterior distributions for SEAb probabilistically (Jackson et al., 2011). Analyses were conducted using the SIBER package in R (Jackson et al., 2011).
Objective 4: Compare Nutritional Niche Breadths of Juvenile White Sharks Between Eastern Australia and South Africa, and Between Juveniles, Subadults and Adults Within South Africa
To place our results from eastern Australia in a broader context, we combined data on prey nutritional compositions from the literature with the diet of white sharks from KwaZulu-Natal (KZN), South Africa (RSA), based on Hussey et al. (2012) (Supplementary Table S8), enabling further exploration of nutritional niche breadths across populations and sizes. Prey composition niches were modelled for four size classes (classes 1 and 2 as above, class 3 = 235–284.9 cm PCL, class 4 = ≥285 cm PCL) using proportions-based NGF and SEAc. Comparisons of nutritional niche breadths were then made using SEAb as above. Low sample size in classes 3 and 4 for Australian white sharks limited our inter-population comparisons of SEAb to juveniles (classes 1 and 2). However, within RSA, SEAb could be compared across all four size classes to investigate how nutritional generalism (prey composition niche breadth) varies across a broader ontogenetic range (juveniles to adults).
Results
Objective 1: Establish the Diet Composition and Key Prey Species of White Sharks in Eastern Australia
Of the 52 white shark stomachs analysed, 40 (76.9%) contained identifiable prey remains. The size of sharks with non-empty stomachs ranged from 123.8 cm PCL (162.0 cm TL) to 369.0 cm PCL (465.0 cm TL) (Figure 2). However, prey data were mostly from juveniles <235 cm PCL (∼300 cm TL), with similar size distributions for male and female sharks (Figure 2).
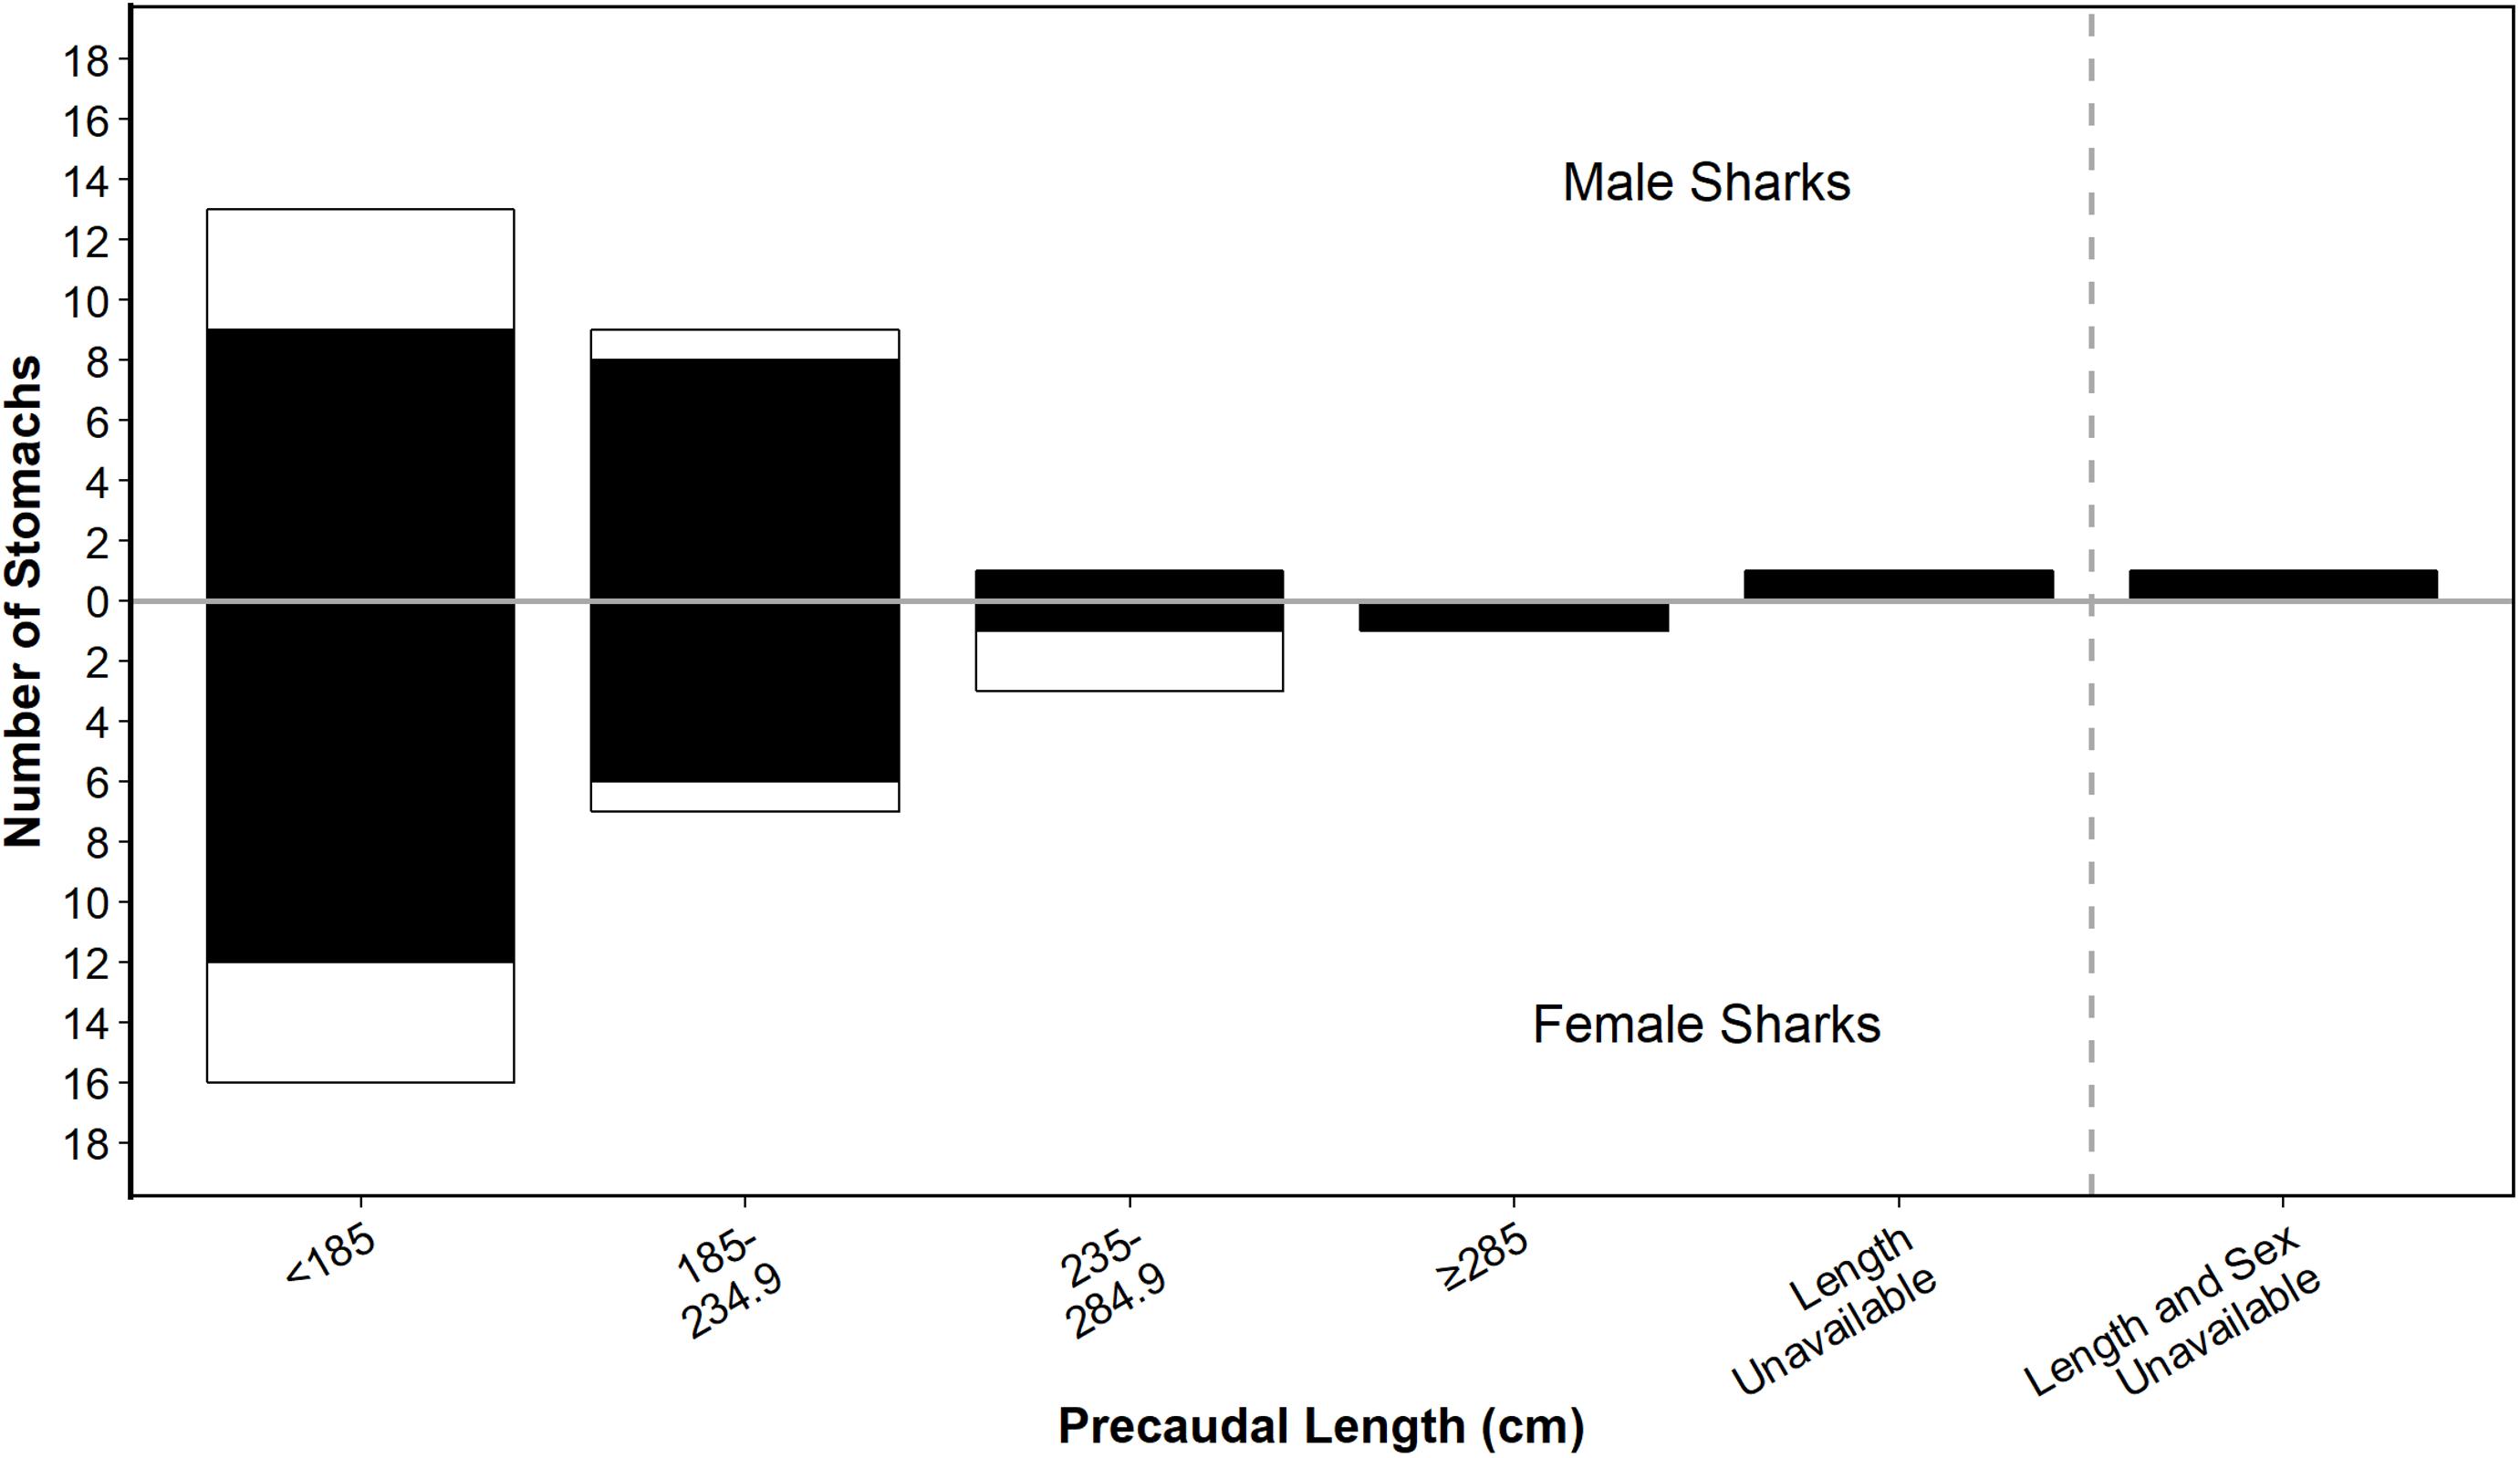
Figure 2. Size distribution of male and female white sharks from which stomachs were sampled for this study. Shading shows stomachs that were empty (white) or had prey (black). Size class bins are based on those used in Hussey et al. (2012) for comparison.
A total of 121 prey items were found across 40 stomachs, with the numbers of prey individuals per stomach (3.0 ± 3.5 individuals) and prey species per stomach (1.9 ± 1.2) being generally low. Across all white sharks, teleost fishes were the most important prey group (%IRIR), followed by elasmobranchs, mammals and then cephalopods (Table 1).
Eastern Australian salmon (Arripis trutta, a pelagic-neritic teleost) was the most important prey species by all measures of dietary importance (excluding non-reconstructed mass, %M; Table 1). Remaining identified teleosts were mostly composed of demersal (e.g. stargazers) and reef-associated species (e.g. eastern blue groper), leading to a relatively high diversity of non-pelagic species compared to pelagic (Table 1). The mean reconstructed FL for all teleosts was 38.9 ± 17.4 cm (range 21.0-97.1 cm, n = 59) while for the most prevalent individual prey species, eastern Australian salmon, it was 50.3 ± 8.3 cm (range 35.8–66.8 cm, n = 20).
For elasmobranchs, batoids generally had greater dietary importance (%F, %N, %IRI, %IRIR) than sharks, with some variation by sex (Table 1). Batoids consisted mostly of benthopelagic eagle and cownose rays (DW = 50.2 ± 15.5 cm, range = 39.6–68.0 cm, n = 3) and small benthic rays (stingarees; TL = 34.9 ± 6.1 cm, range = 27.9–40.2 cm, n = 4).
Cephalopods and marine mammals had low dietary importance (%IRIR) due to low %M, and low %F and %N contributions, respectively (Table 1). The reconstructed ML of squid and cuttlefish was 14.1 ± 9.2 cm (range 3.8–26.2 cm, n = 4). The only mammal prey observed in stomachs was dolphin, including the tail stock and fluke of an unidentified dolphin and two whole bottlenose dolphin (Tursiops aduncus) calves (101.4 and 111.4 cm TBL). The smallest shark that consumed dolphin measured 173.4 cm PCL (221.0 cm TL).
Objective 2: Examine Whether Sex or Size Influences the Prey Consumed by White Sharks in Eastern Australia
A detailed sex-based breakdown of the dietary importance of prey functional groups to male and female white sharks suggested some differences in prey consumption (Table 1) which was supported by results from binomial and Poisson/negative binomial GLMs (see Supplementary Tables S3, S5 for AICc model rankings, and Supplementary Tables S4, S6 for full GLM outputs). For occurrence data, noting an FDR-adjusted critical level of p < 0.0375, males consumed batoids significantly more frequently than females (est.SexMale = 1.6740 ± 0.7862, z = 2.129, p = 0.0332, Figure 3A). Significant positive relationships were also observed between PCL and the occurrence of shark (est.PCL ± SE = 0.0039 ± 0.0018, z = 2.091, p = 0.0365) and mammal prey (est.PCL ± SE = 0.0022 ± 0.0008, z = 2.526, p = 0.0115) in the diet (Figures 3B,C), with no significant effect of sex on either group (Supplementary Tables S3, S4). For all other prey groups (pelagic teleosts, reef-associated teleosts, demersal teleosts and cephalopods), AICc favoured a null model (Supplementary Table S3) suggesting that neither sex nor PCL influenced occurrences of these prey in the diet of white sharks over the size range assessed here.
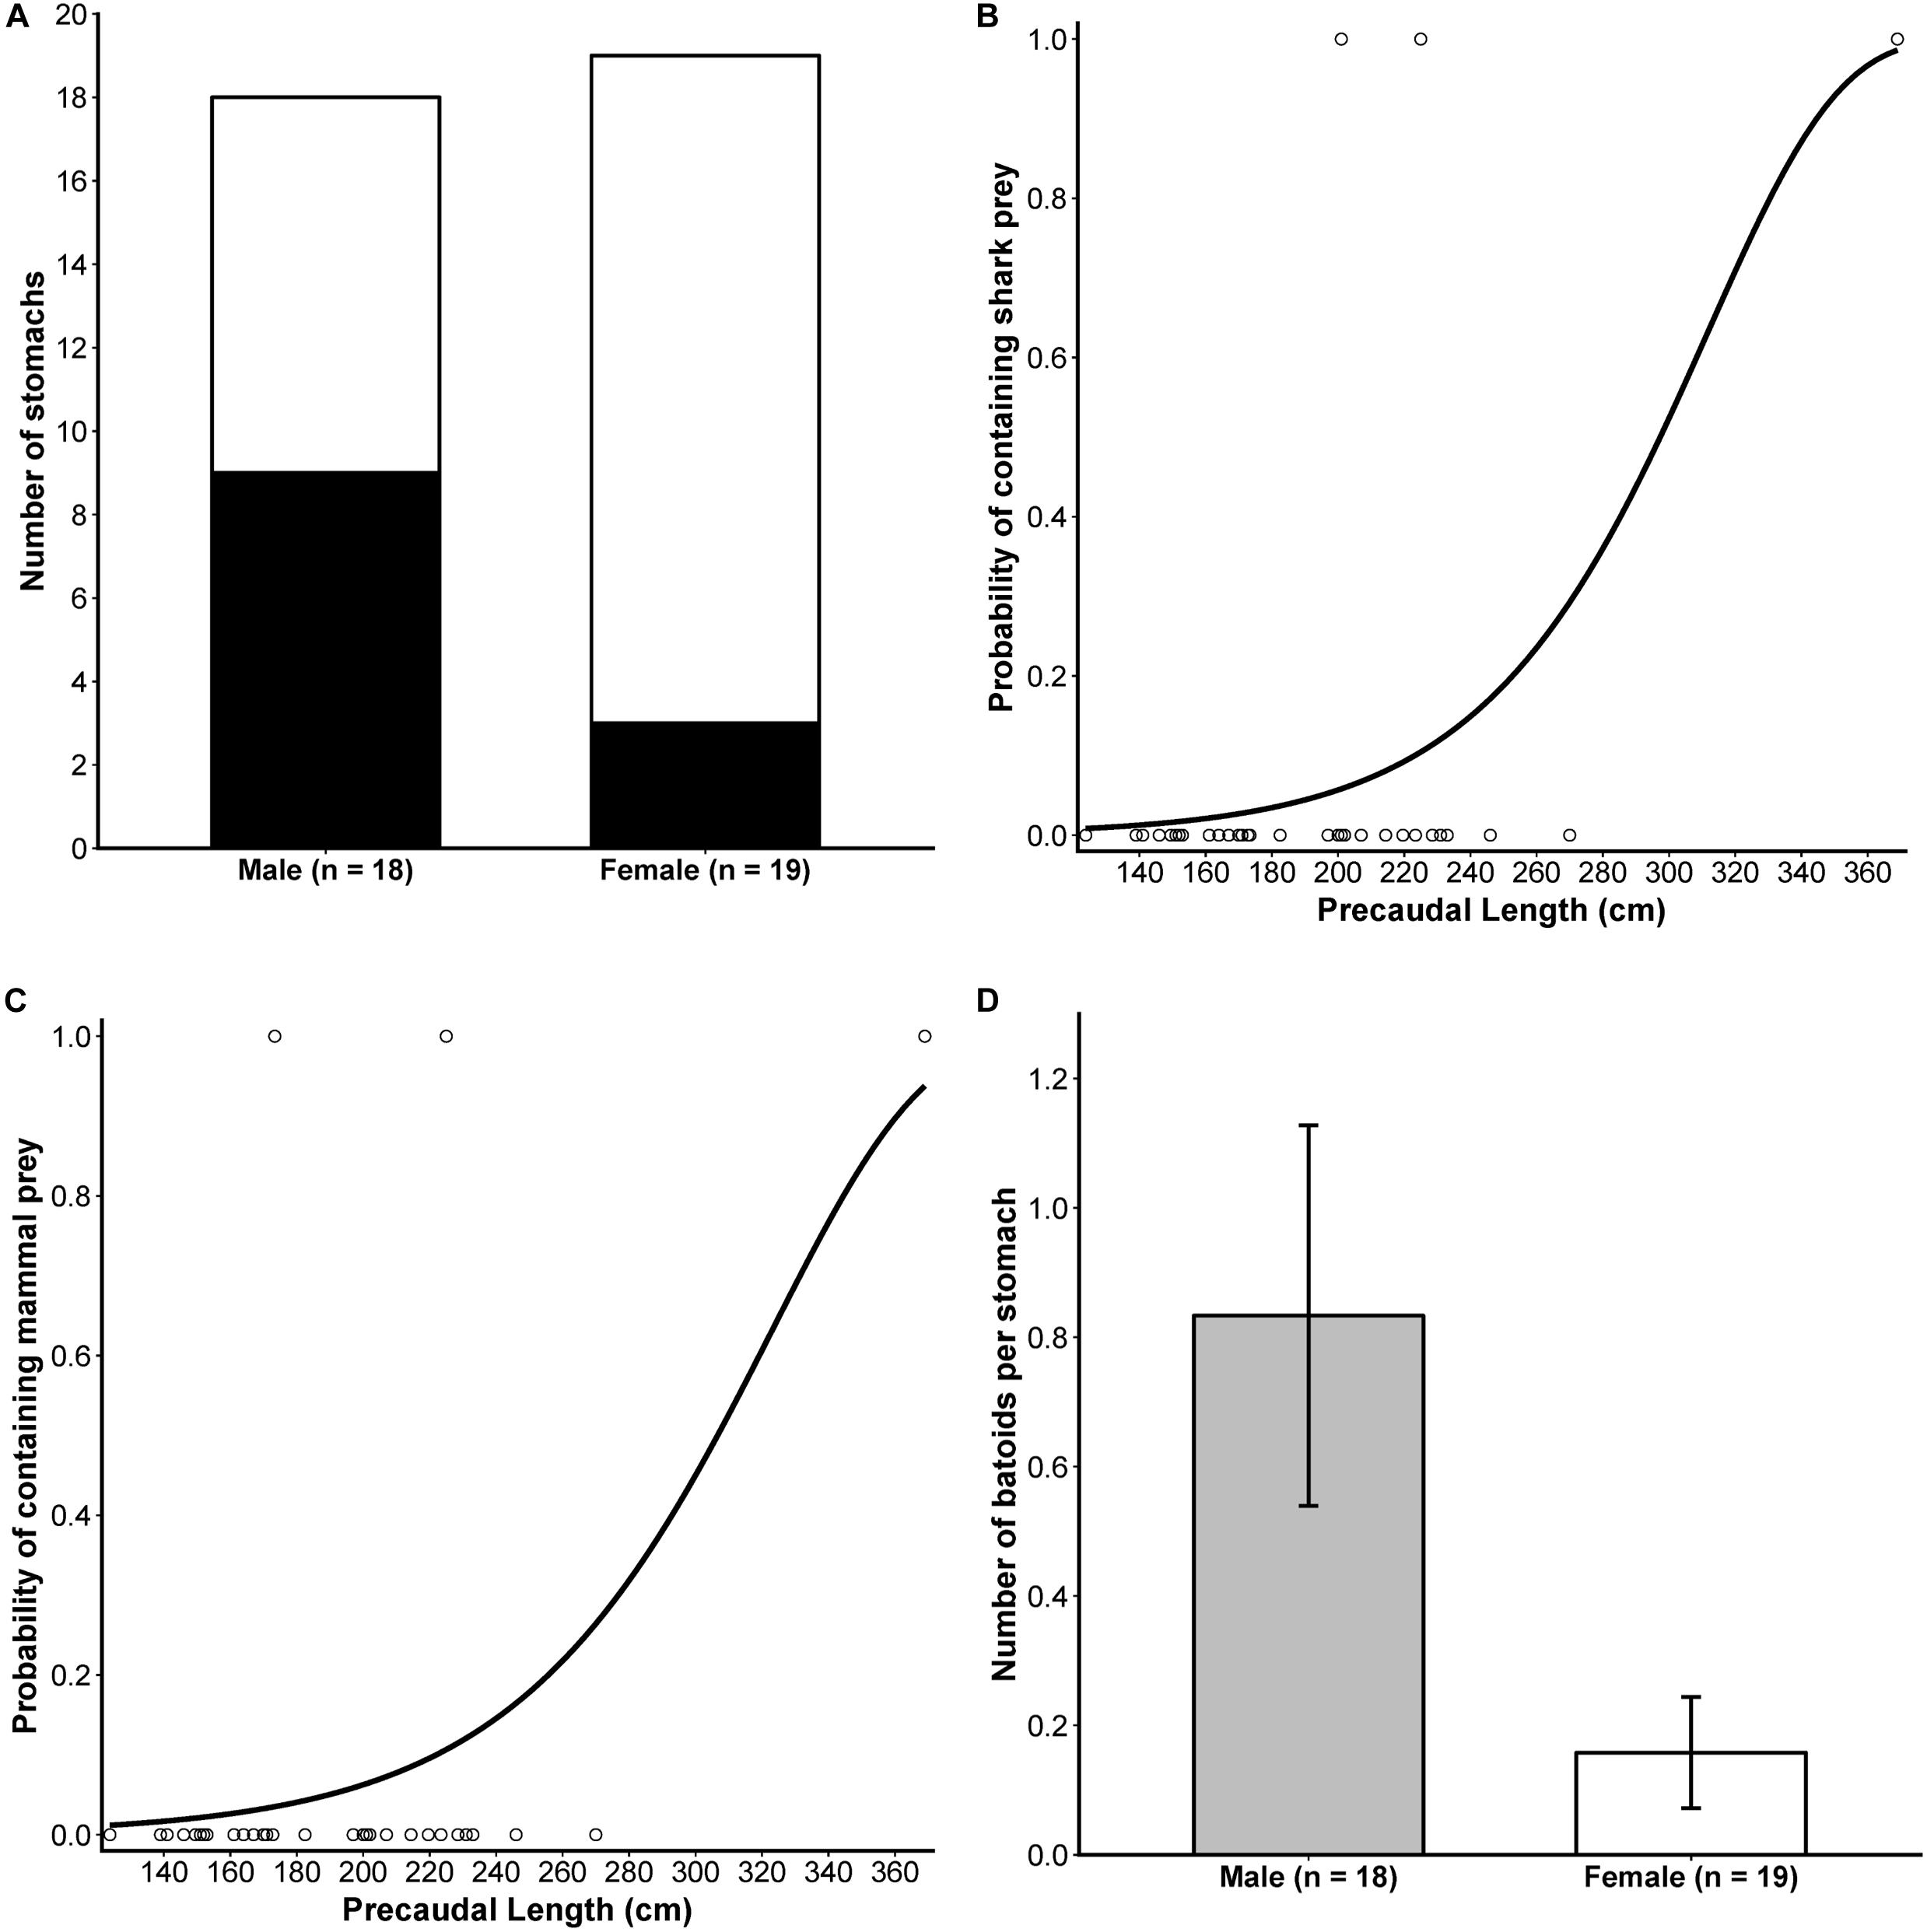
Figure 3. Results from significant sex- and size-based analyses of the occurrence and numerical abundance of functional prey groups in the diet of white sharks. (A) Stacked bar plot comparing presence (black) and absence (white) of batoids in stomachs of each sex. The predicted probabilities of the occurrence of shark (B) and mammal (C) prey by precaudal length, with points showing the size of individual white sharks included in the analysis (n = 37) and the occurrence of these prey groups in stomachs (1 = present, 0 = absent). (D) The mean (±SE) number of batoids per stomach for male and female white sharks. For (A,D), sample sizes included in the analysis are indicated in the x-axis labels.
For abundance data, males consumed significantly greater numbers of batoids than females (Figure 3D and Table 1; est.SexMale ± SE = 1.6635 ± 0.6325, z = 2.630, p = 0.0085). Model rankings with AICc favoured GLMs including PCL for mammals, sex + PCL for sharks, and sex only for demersal teleosts (Supplementary Table S5). However, these were not significant at an FDR-adjusted critical level of p < 0.01 (Supplementary Table S6). There was no significant effect of sex or PCL on the numerical abundance of the other prey groups (Supplementary Tables S5, S6).
Objective 3: Determine if Size or Sex Predicts the Nutritional Composition of Prey, Diets and Niche Breadths of White Sharks From Eastern Australia
Proportions-based NGF models showed that white sharks consumed prey varying broadly in their nutritional composition between maximum P:L ratios of 62.9:1.0 and 37.3:1.0 for females and males, respectively, to a minimum P:L of 0.7:1.0 for both sexes (Figure 4A). General clustering in the compositions of prey functional groups was also evident, with elasmobranchs showing high %P and low %L, cephalopods having high %W and low %P and %L, and teleosts having moderate %P and variable %L (Figure 4A). The SEAc for the prey composition niche of male and female sharks was 54.0 and 64.2, respectively, with Bayesian modelling indicating no significant difference (probability SEAb male < SEAb female = 0.70, <0.95; Figure 4B).
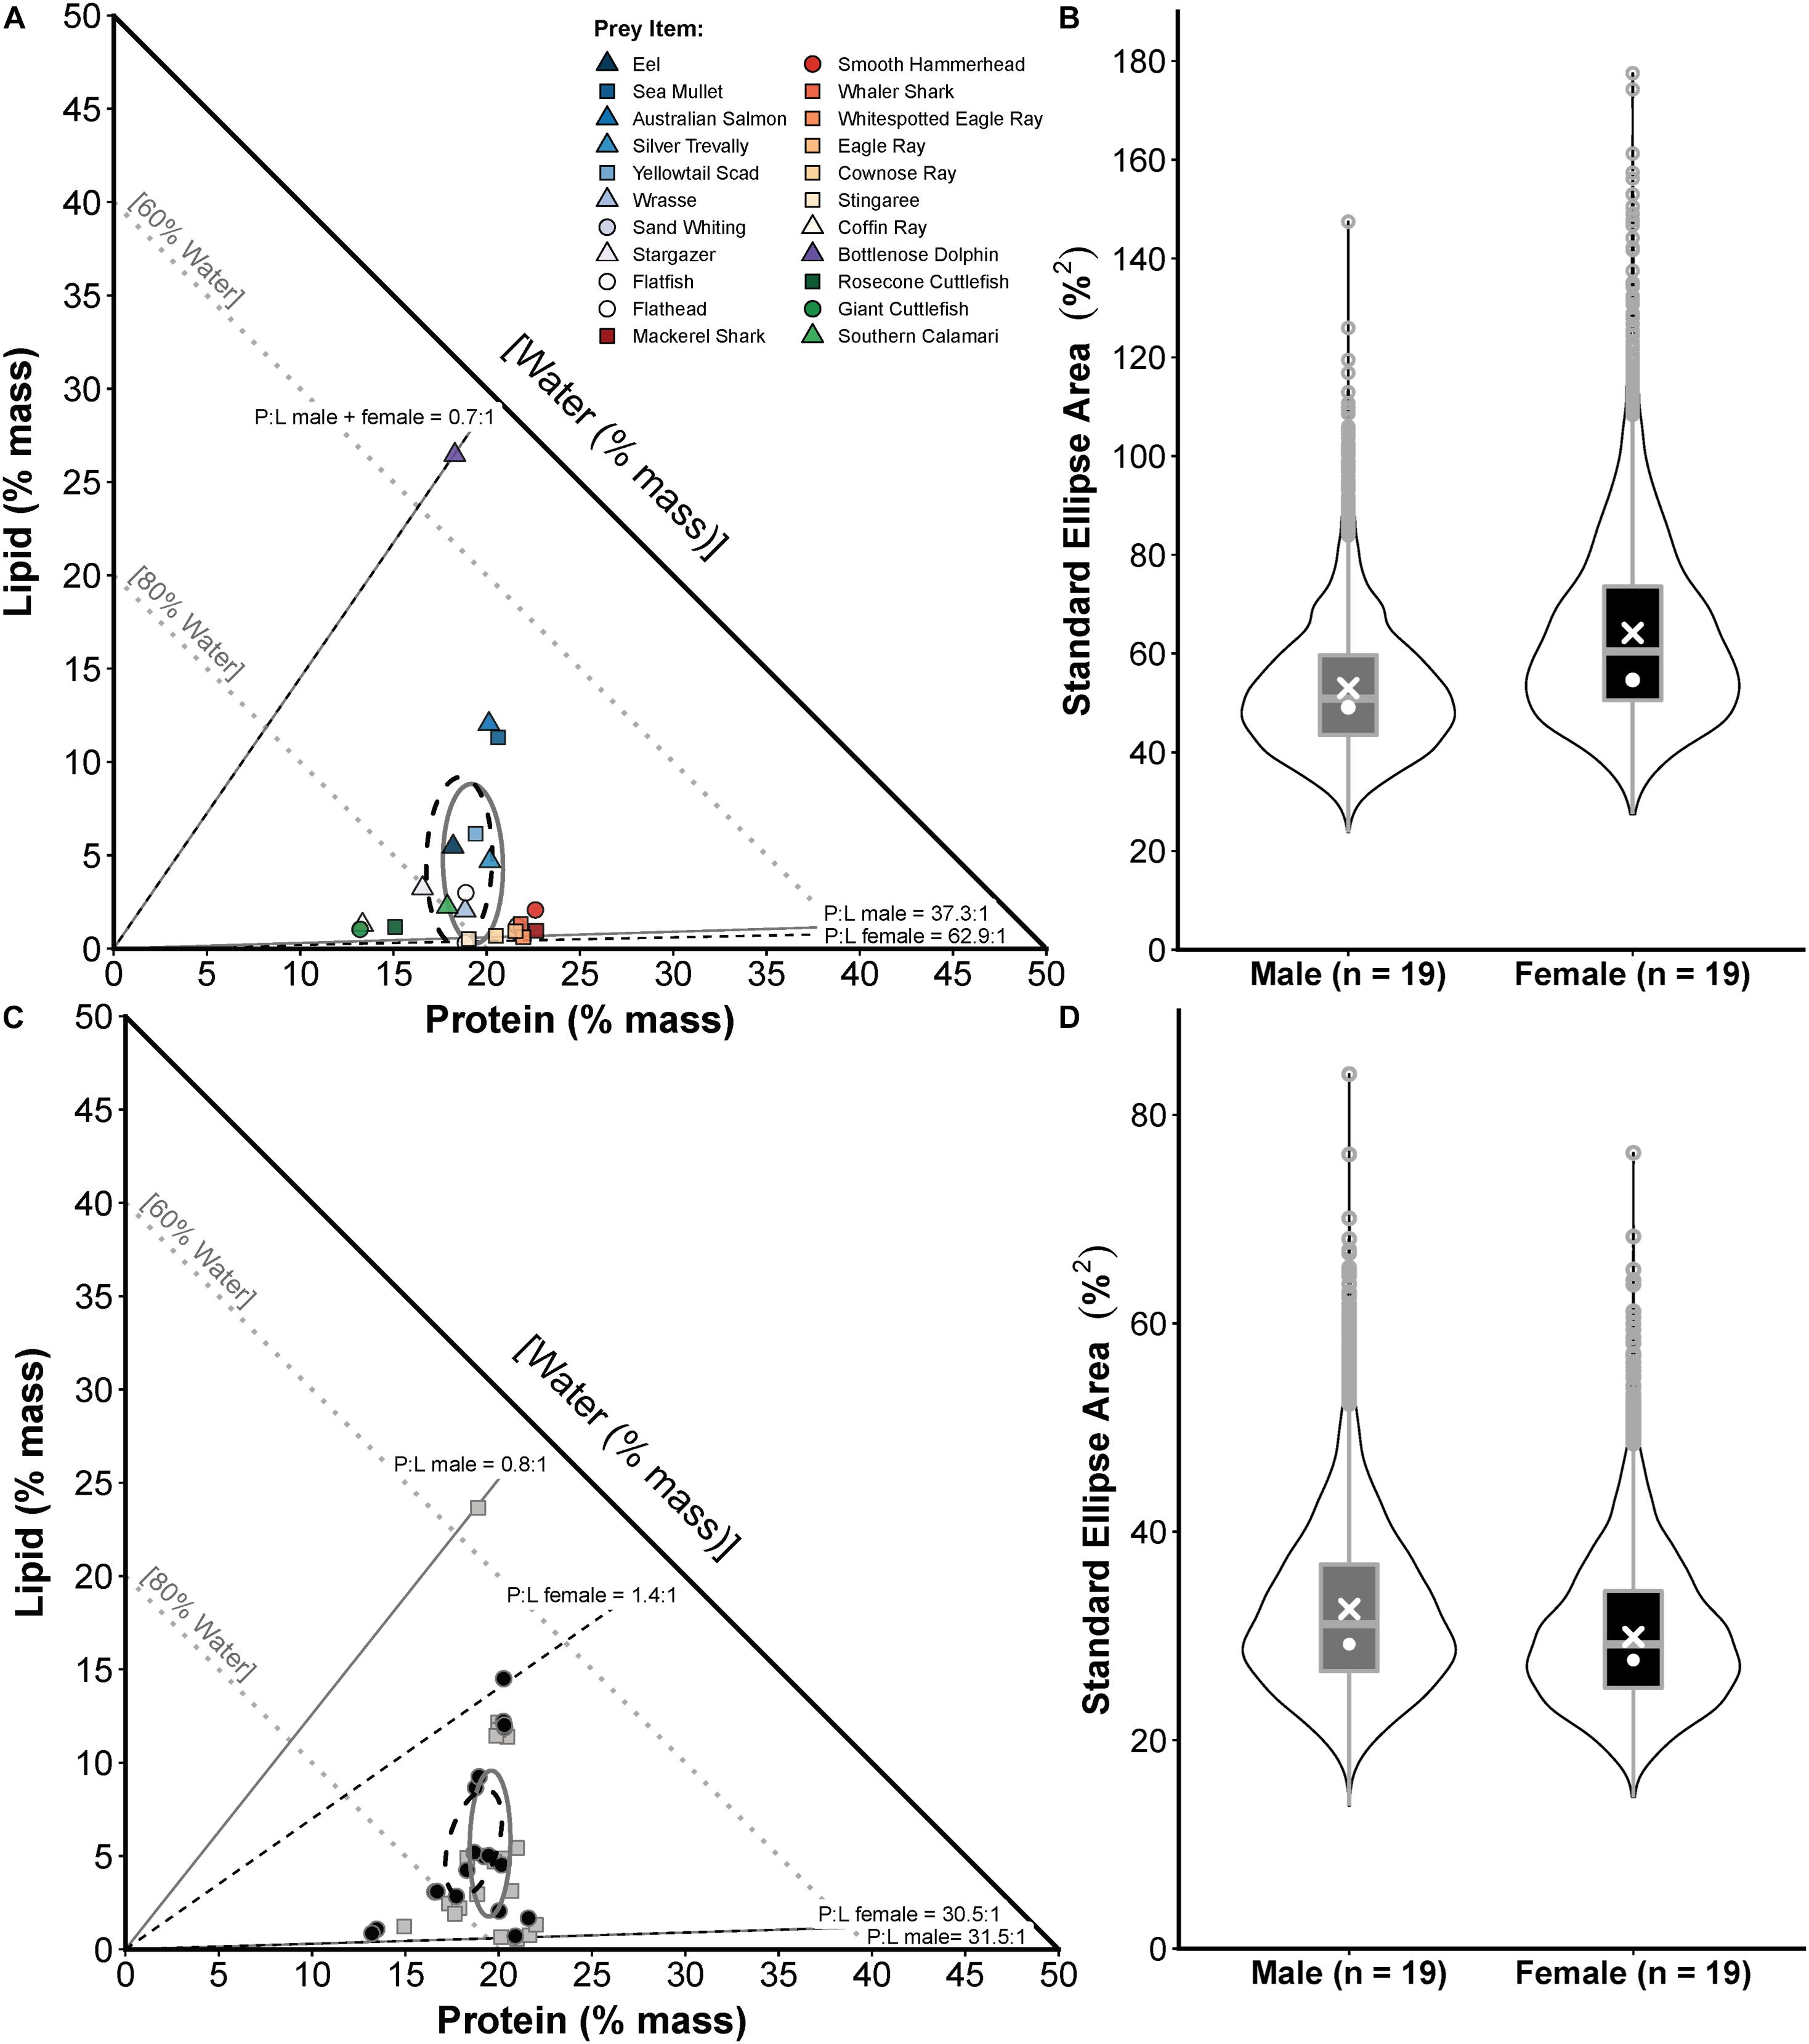
Figure 4. Prey composition and realised nutritional niche comparisons for male and female white sharks in eastern Australia. (A) Proportions-based NGF model showing the nutritional compositions of prey species consumed by males only (squares), females only (circles) or both sexes (triangles) and small-sample corrected standard ellipse areas (SEAc) as measures of the prey composition niche breadth for each sex (males = grey ellipse, females = black ellipse). (B) Violin plots (box plot combined with a mirrored kernel density trace) comparing the full posterior distributions of Bayesian SEA estimates (SEAb) for the prey composition niche of each sex. White crosses and dots indicate maximum-likelihood estimated SEAc and the mode of SEAb, respectively. (C) The calculated nutritional compositions of stomach samples (males = grey squares, females = black circles) and SEAc for the realised nutritional niche of each sex (males = grey ellipse, females = black ellipse). (D) Violin plots comparing posterior distributions of SEAb for the realised nutritional niche, with SEAc and mode of SEAb indicated as in (B). Sample sizes (numbers of male and female sharks) used for these comparisons are shown in the x-axis labels in (B,D).
White sharks (sexes pooled) consumed a diet with an estimated composition of 75.2 ± 5.9% water, 19.1 ± 2.0% protein, 5.7 ± 5.1% lipid, a P:L of 7.9 ± 8.3, Edensity of 5.3 ± 2.0 kJ g–1 diet mass and Eshark of 210.1 ± 285.1 kJ kg–1 shark mass, with protein content being relatively constant and lipids being more variable (Figure 4C). For %P, sex only had the lowest AICc, %L, P:L and Edensity included PCL only, and an null model had the lowest AICc for the variables %W and Eshark (Supplementary Table S9). However, there was no significant effect of sex on dietary %P (est.SexMale ± SE = 0.0789 ± 0.0430, t = 1.836, p = 0.0749) or PCL on %L (est.PCL ± SE = 0.0006 ± 0.0004, t = 1.574, p = 0.1250), P:L (est.PCL ± SE = −0.0005 ± 0.0003, t = −1.615, p = 0.1153) or Edensity (est.PCL ± SE = 0.0011 ± 0.0007, t = 1.595, p = 0.1196) at the level of p < 0.05 (see Supplementary Table S10 for full LM outputs). The SEAc for the realised nutritional niche breadth of males and females was 32.6 and 29.9, respectively, with Bayesian modelling indicating no significant difference (probability SEAb female < SEAb male = 0.60, <0.95; Figure 4D).
A comparison of two size classes of white sharks from eastern Australia showed similar prey composition niches (Figure 5A) with P:L ranging from 62.9:1.0 to 0.7:1.0 (both classes) and SEAc of 53.8 and 57.8 for classes 1 and 2 sharks, respectively, which was not significantly different (probability SEAb class 1 < SEAb class 2 = 0.57, <0.95; Figure 5B). However, larger sharks had a significantly broader realised nutritional niche (probability SEAb class 2 > SEAb class 1 = 0.96, >0.95), with SEAc of 24.2 and 46.0 for classes 1 and 2 sharks, respectively (Figures 5C,D).
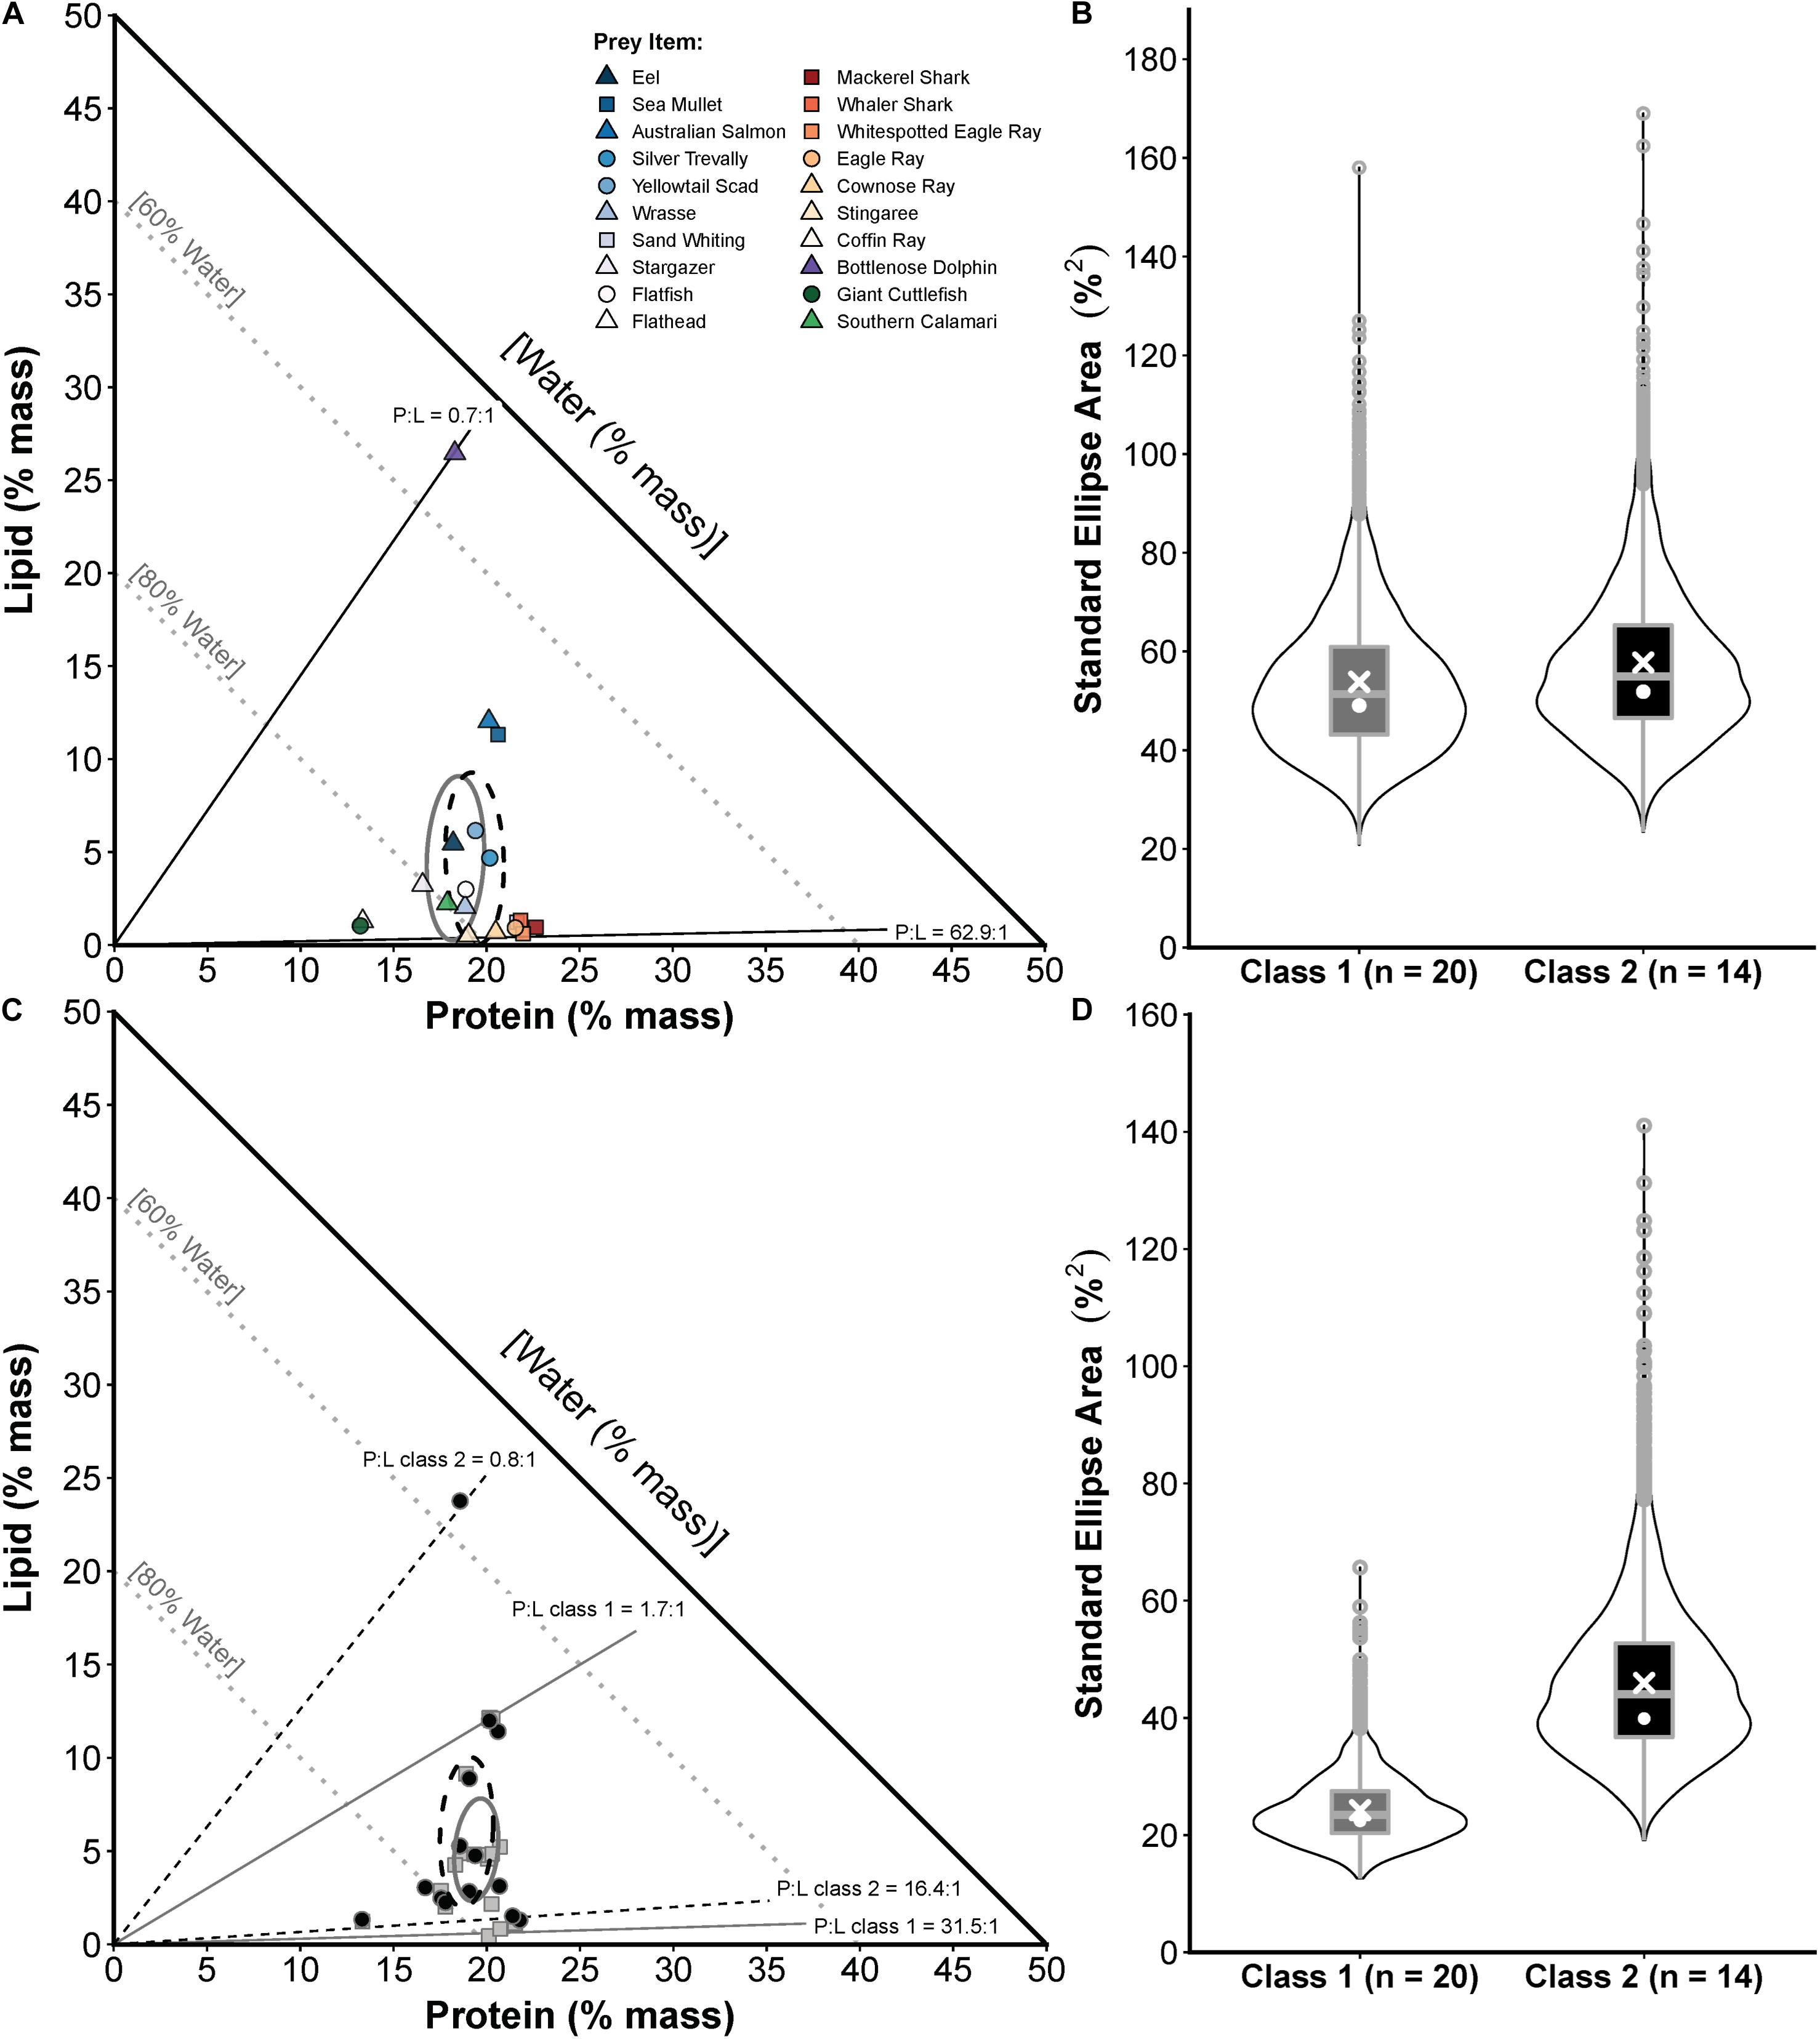
Figure 5. Prey composition and realised nutritional niche comparisons for two sizes of white sharks in eastern Australia (class 1 = <185 cm PCL, class 2 = 185–234.9 cm PCL). (A) Proportions-based NGF model showing the nutritional compositions of prey species consumed by class 1 only (circles), class 2 only (squares) or both size classes (triangles) and small-sample corrected standard ellipse areas (SEAc) as measures of the prey composition niche breadth for each size (class 1 = grey ellipse, class 2 = black ellipse). (B) Violin plots (box plot combined with a mirrored kernel density trace) comparing the full posterior distributions of Bayesian SEA estimates (SEAb) for the prey composition niche of each size class. White crosses and dots indicate maximum-likelihood estimated SEAc and the mode of SEAb, respectively. (C) The calculated nutritional compositions of stomach samples (class 1 = grey squares, class 2 = black circles) and SEAc for the realised nutritional niche of each size class (class 1 = grey ellipse, class 2 = black ellipse). (D) Violin plots comparing posterior distributions of SEAb for the realised nutritional niche, with SEAc and mode of SEAb indicated as in (B). Sample sizes (numbers of sharks in each size class) used for these comparisons are shown on x-axis labels in (B,D).
Objective 4: Compare Nutritional Niche Breadths of Juvenile White Sharks Between Eastern Australia and South Africa, and Between Juveniles, Subadults and Adults Within South Africa
Classes 1 and 2 white sharks from Australia and RSA had similar prey composition niches with high degrees of overlap (Figures 6A,B), and there was no significant difference in niche breadth between regions for class 1 (probability SEAb Australian sharks > SEAb RSA sharks = 0.90, <0.95) or class 2 sharks (probability SEAb Australian sharks < SEAb RSA sharks = 0.77, <0.95) (Figure 7). In RSA sharks, prey composition niche breadth increased sequentially with size, with SEAc of 32.1, 72.1, 179.1 and 272.5 for classes 1 to 4 sharks, respectively (Figure 7). Bayesian modelling showed that this increase was significant from classes 1 to 2 (probability SEAb class 1 < SEAb class 2 = 0.98, >0.95) and classes 2 to 3 (probability SEAb class 2 < SEAb class 3 = 0.99, >0.95), but not between classes 3 and 4 sharks (probability SEAb class 3 < SEAb class 4 = 0.76, <0.95) (Figure 7).
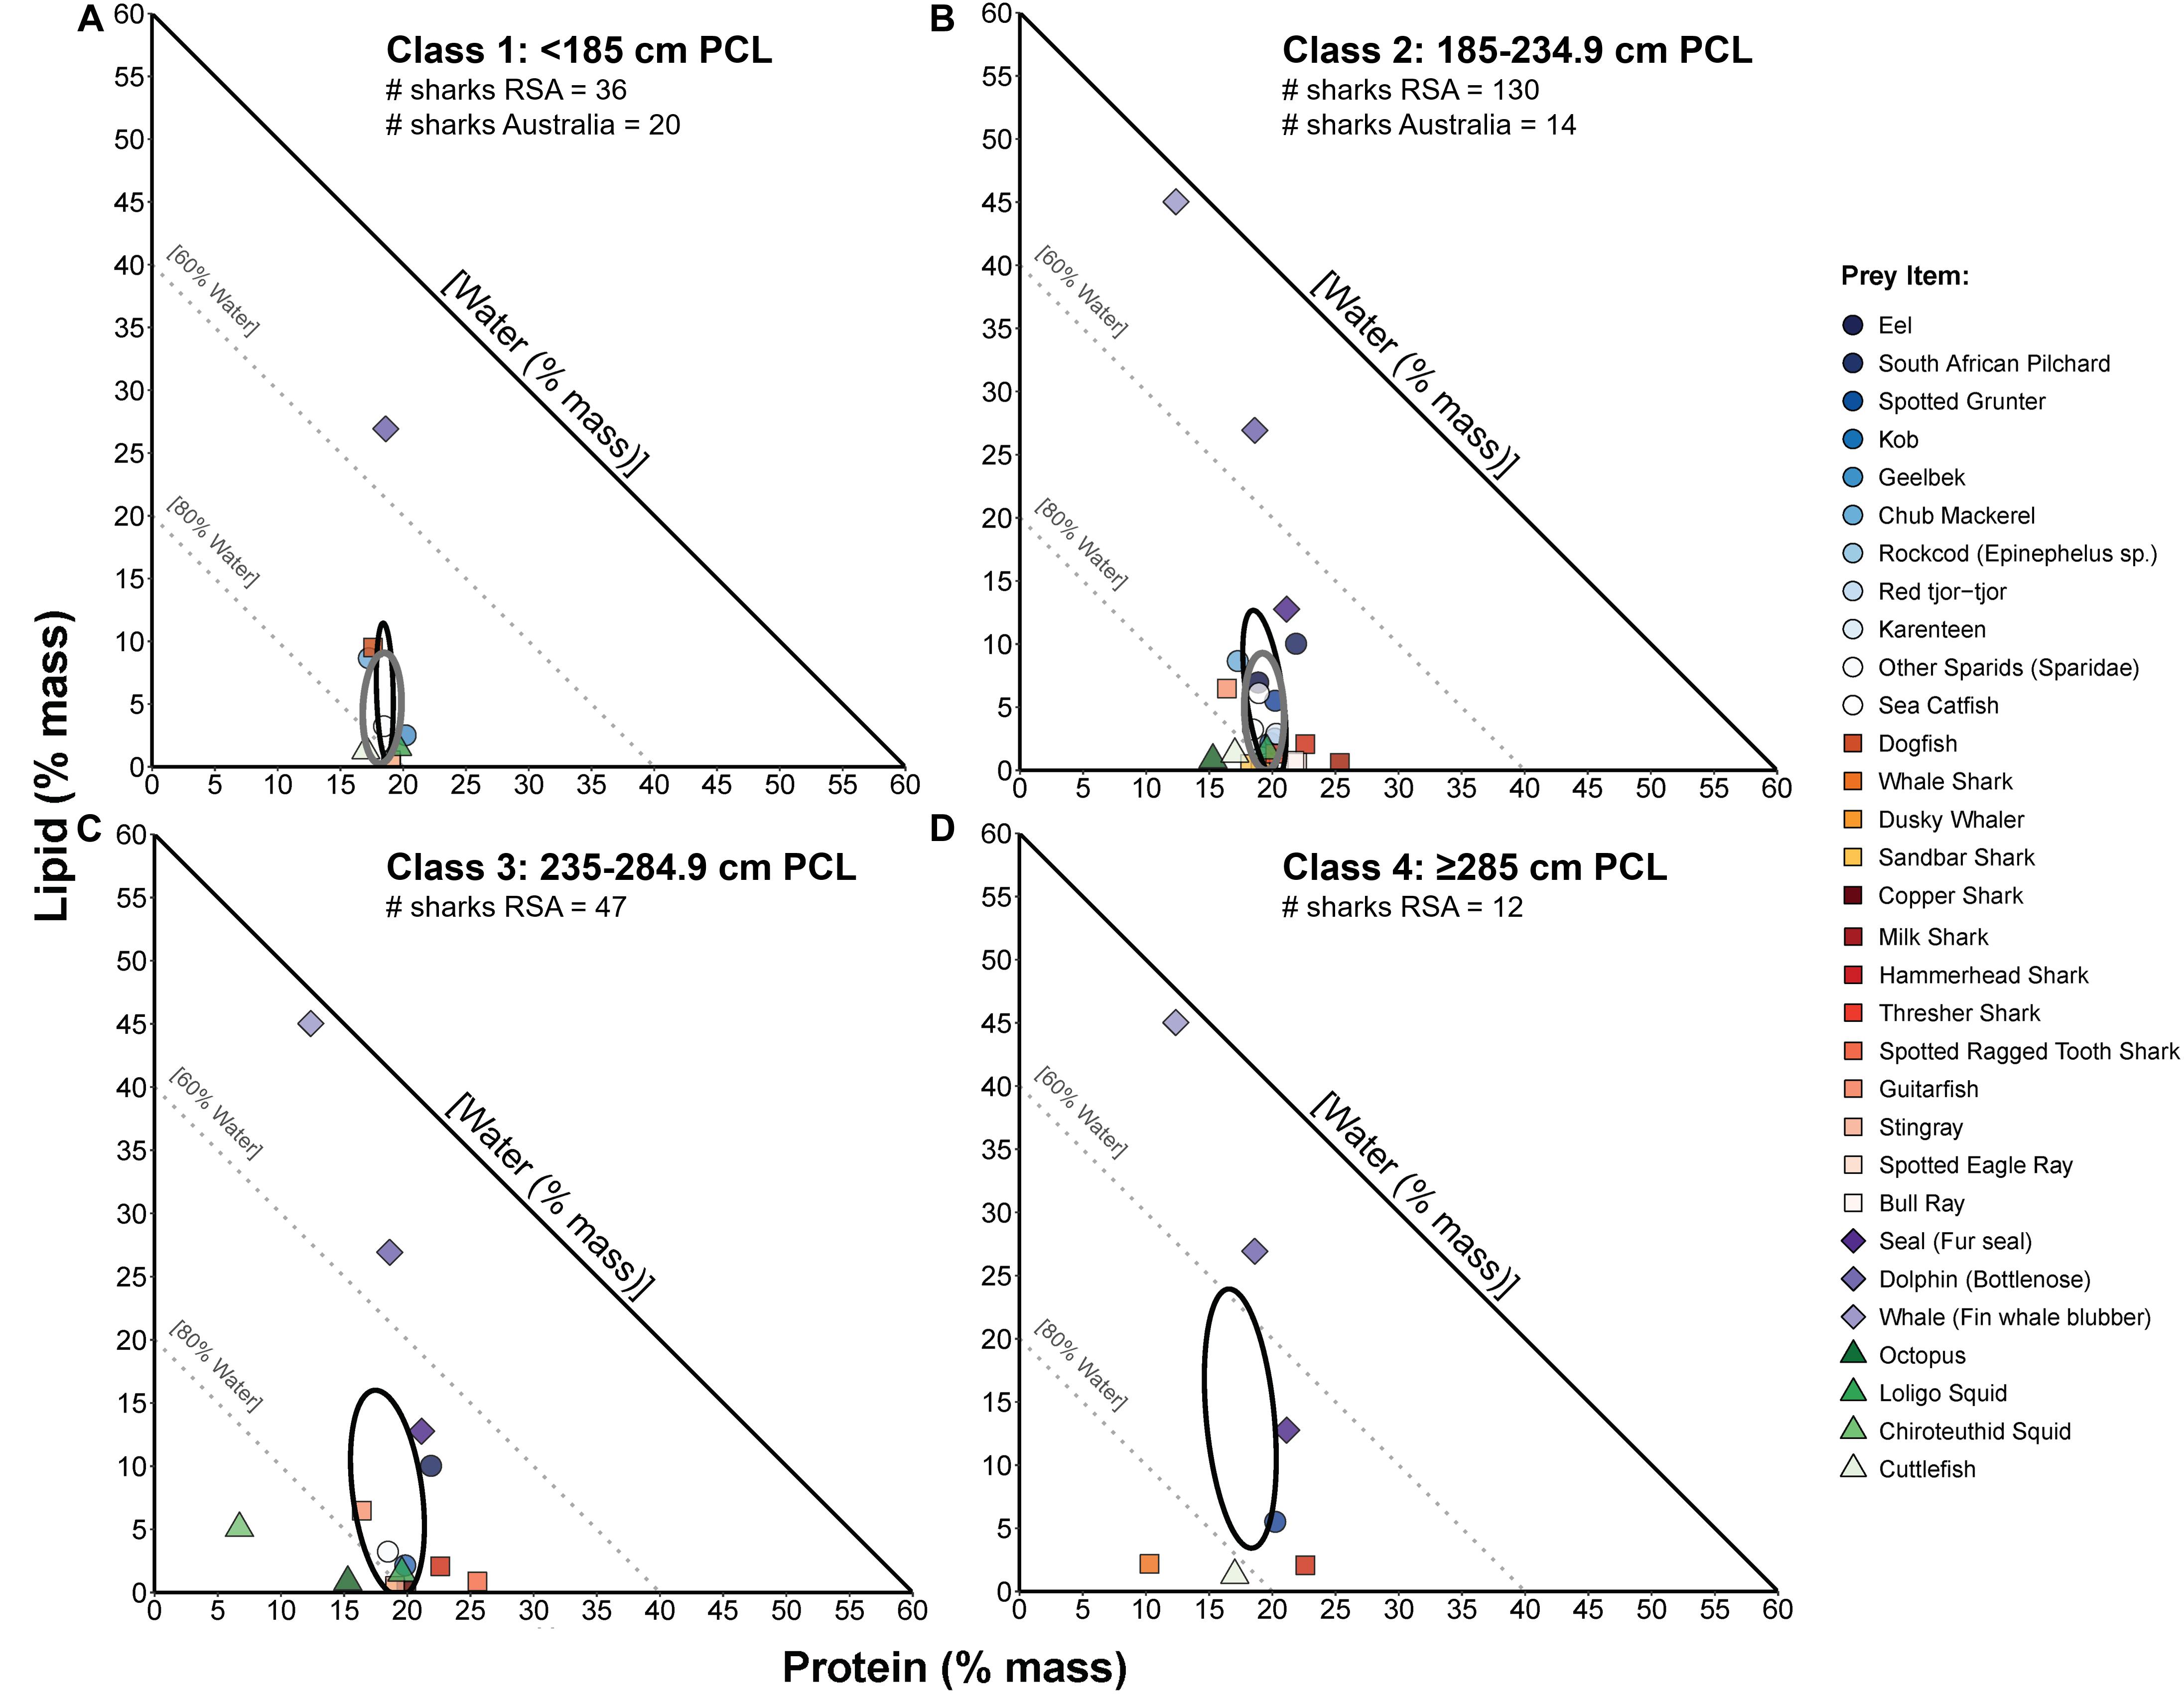
Figure 6. Proportions-based NGF models comparing the nutritional compositions of prey species consumed by four sizes classes of white sharks (A–D, respectively) from South Africa (RSA; from Hussey et al., 2012) and small-sample corrected standard ellipse areas (SEAc) as measures of the prey composition niche of each size class (black ellipses). For comparison of niche width and overlap between populations, the prey composition SEAc for eastern Australian white sharks (present study, grey ellipses, from Figure 5A) is also overlayed for size classes 1 (A) and 2 (B). The number of Australian and RSA sharks on which these prey comparisons are based is indicated below the size class title in each panel.
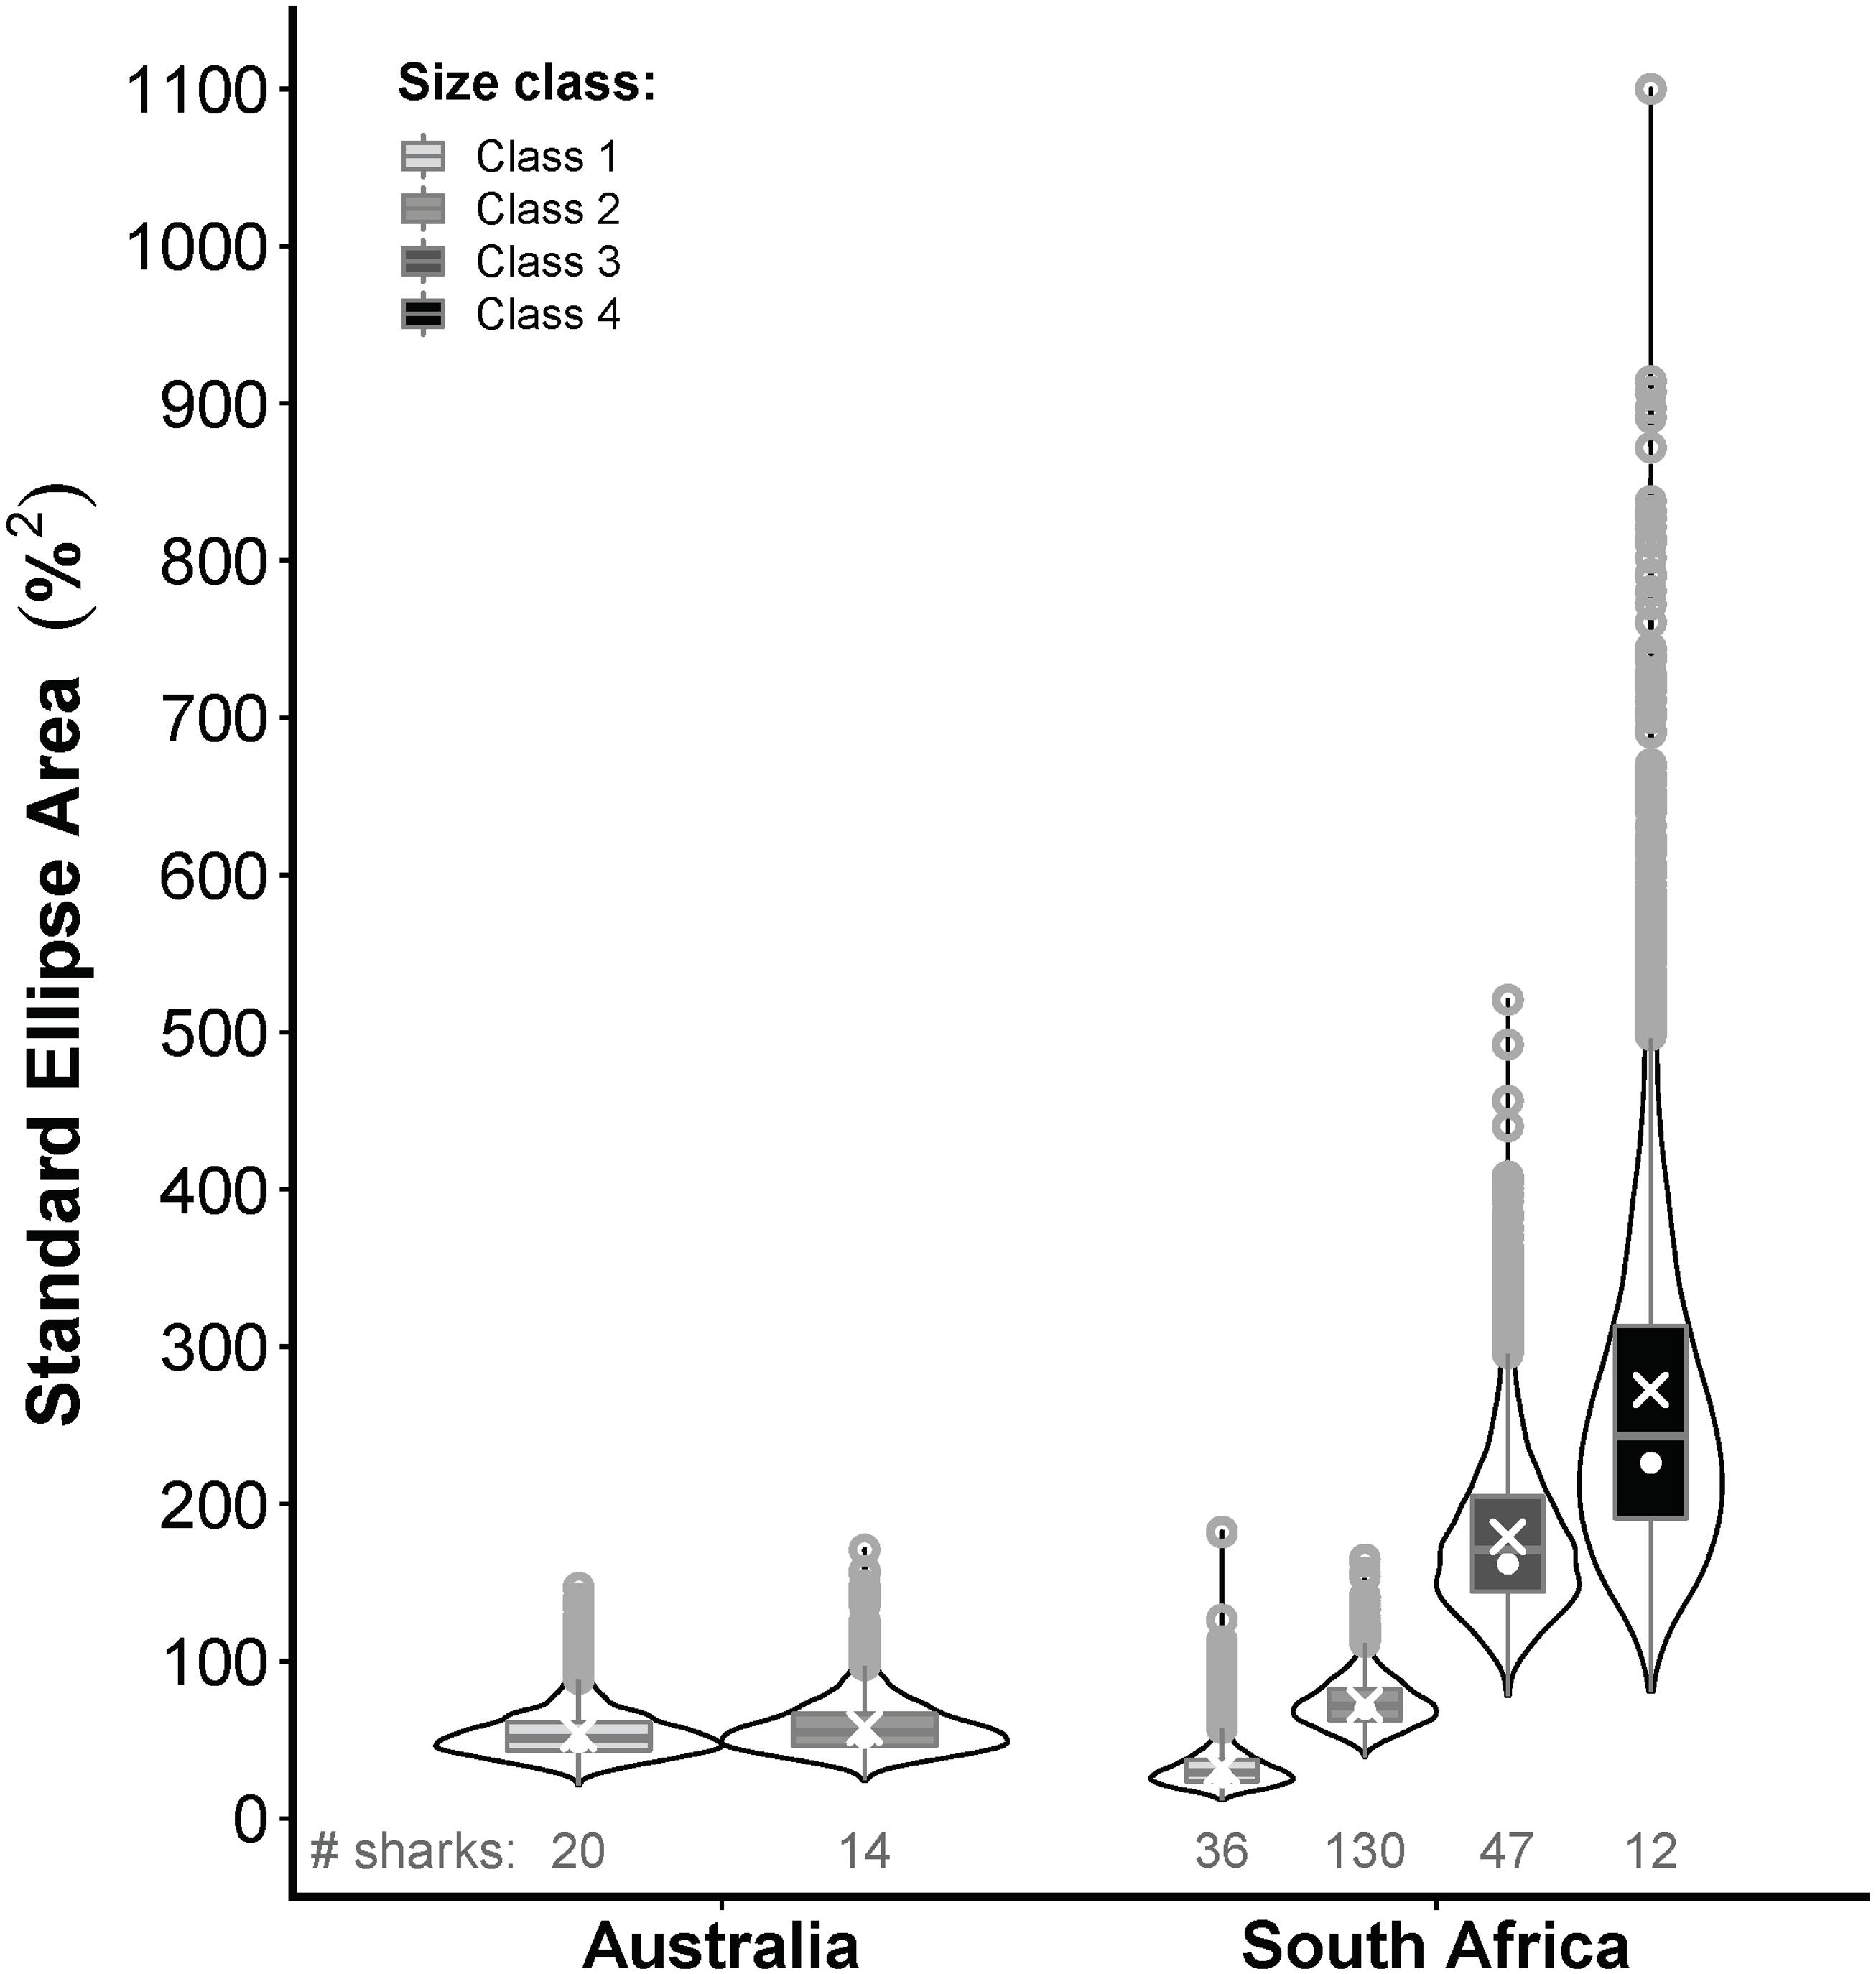
Figure 7. Violin plots comparing the posterior distributions of Bayesian estimates for standard ellipse areas (SEAb) of the prey composition niches of white sharks from eastern Australia (this study) and South Africa (RSA; Hussey et al., 2012) across 4 size classes (only 2 for Australia); class 1 = <185 cm precaudal length (PCL), class 2 = 185–234.9 cm PCL, class 3 = 235–284.9 cm PCL, class 4 = ≥285 cm PCL. White crosses and dots represent maximum-likelihood estimated small-sample corrected standard ellipse areas (ellipses shown in Figure 6) and the mode of SEAb, respectively. The number of Australian and RSA sharks on which these comparisons are based is indicated below each violin plot.
Discussion
We have provided the first detailed description of the diet of juvenile white sharks in eastern Australia, revealing the importance of both benthic and pelagic prey resources, with evidence for possible sex-based dietary variation. Our nutritional framework, a novel application in elasmobranch diet studies, also enabled us to establish the macronutrient compositions of prey, diets and the nutritional niches in which white sharks forage, and how niche breadth may vary with shark size. These findings help to further our understanding of the nutritional ecology of white sharks.
White Shark Diet Variation Among Sexes, Sizes and Populations
Stomach contents analysis provides a unique and important opportunity to understand the diets of large, cryptic marine predators with high taxonomic resolution (Young et al., 2015). Our first detailed diet assessment for juvenile white sharks in eastern Australia revealed that teleosts, particularly pelagic eastern Australian salmon but also an array of demersal and reef-associated species, were the main prey consumed in this region. A similar pattern has also been observed in juvenile and sub-adult white sharks (185–285 cm PCL) from South Africa whereby teleost prey consisted predominantly of pelagic South African pilchards (Sardinops sagax) and included a high diversity of reef-associated and demersal species, suggesting regular feeding on non-pelagic prey sources (Hussey et al., 2012).
In addition to non-pelagic teleosts, benthic and benthopelagic batoids such as stingarees and eagle rays also comprised a significant dietary component for juvenile white sharks in eastern Australia, albeit with some apparent variation by sex. A predominance of batoid prey is consistent with prior findings for white sharks (193–511 cm TL) in California (Tricas and McCosker, 1984), but differs from South Africa where various other sharks, particularly carcharhinids, were the main elasmobranch prey across juvenile to adult life stages (Hussey et al., 2012). The KZN region in South Africa contains nursery habitat for carcharhinid sharks, possibly accounting for their dietary importance as suggested by Hussey et al. (2012). Supporting this regional variation in potential prey abundance, carcharhinids comprise a significant proportion of the KZN shark control program’s catch (Cliff and Dudley, 2011), whereas batoids are relatively more common in the NSW SMP (Krogh and Reid, 1996; DPI, 2019). Furthermore, Pethybridge et al. (2014) found high levels of fatty acid (FA) markers associated with benthic coastal food sources in the tissues of white sharks from NSW and South Australia and identified the possible importance of benthic elasmobranchs (e.g. Port Jackson sharks, Heterodontus portusjacksoni, or other ecologically similar species) as regular prey. This is consistent with the prevalence of benthic and bentho-pelagic batoids we observed, which have similar feeding ecologies to Port Jacksons (Marshall et al., 2008; Powter et al., 2010; Sommerville et al., 2011; Frost et al., 2017). Juvenile white sharks are known to frequent shallow estuarine environments in eastern Australia which contain a variety of habitats and substrata (e.g. reefs, seagrass beds, sand flats), providing access to a range of potential non-pelagic prey (Harasti et al., 2017). Overall, the prevalence of batoids and non-pelagic teleosts in stomachs suggests that benthic foraging is common in white sharks and is consistent with extended periods of bottom-swimming observed in tagged sharks (Bruce et al., 2006; Weng et al., 2007).
Ontogenetic variations in diet are well documented for many shark species (Dicken et al., 2017; Nielsen et al., 2019), including white sharks (Estrada et al., 2006; Hussey et al., 2012; Kim et al., 2012). Here, we found evidence for increased occurrence of dolphin and shark prey with size among white sharks in eastern Australia. The overall rarity of these prey items across stomachs and our limited sample size of subadult and adult sharks (>235 cm PCL, ∼3 m TL; Bruce and Bradford, 2012) necessitates caution in interpreting this pattern. However, consistencies with prior observations add support to our findings (Hussey et al., 2012; Kim et al., 2012). For instance, although SCA in South African white sharks suggests that mammals comprise a relatively high proportion of the subadult and adult diet (>235 cm PCL and ∼3 m TL), significant increases in mammal consumption first occurs during the juvenile stage (>185 cm PCL; Hussey et al., 2012), over the size range represented by most of our samples (Figures 3B,C). Stable isotope analyses (δ15N) have also identified increases in trophic level within the juvenile stage (e.g. 0–5 years of age), and in larger sharks (Estrada et al., 2006; Kim et al., 2012). Some variation in isotope-derived foraging profiles is evident, although this likely arises from factors including concurrent shifts in foraging habitat use (and thus baseline δ15N), maternal influences, or possibly inter-individual diet specialisation (Carlisle et al., 2012; Kim et al., 2012; Tamburin et al., 2019). Our results suggest that eastern Australian white sharks may start including mammals and higher trophic prey as juveniles (around 173 cm PCL, 220 cm TL) which is consistent with findings from South Africa (177 cm PCL; Hussey et al., 2012). Nevertheless, juveniles are primarily generalist piscivores, and occasionally consume mammals (Hussey et al., 2012; Pethybridge et al., 2014). Furthermore, the presence of small marine mammal prey (dolphin calves) corroborates prior findings in juveniles (Hussey et al., 2012) and investigations suggesting that their jaw mineralisation and muscle architecture should favour softer tissues over tougher ones (e.g. whale blubber; Dicken, 2008; Ferrara et al., 2011).
While ontogenetic dietary variation is widespread among sharks, sex-specific prey consumption is less common (McElroy et al., 2006; Abrantes and Barnett, 2011; Preti et al., 2012; Dicken et al., 2017). Nonetheless, some SCA studies have identified sex-based variation, such as a differing predominance of teleost and elasmobranch prey between large male and female dusky whalers (Carcharhinus obscurus; Hussey et al., 2011). Although we found no significant sex differences for most prey groups, increased consumption of batoids by males was detected. Sex differences in various aspects of white sharks’ foraging ecology have been identified previously, including tooth anatomy (French et al., 2017), food web exploitation (e.g. nearshore/offshore; French et al., 2018), habitat use and hunting strategies (Kock et al., 2013; Bruce and Bradford, 2015; Towner et al., 2016; Bruce et al., 2019), which may lead to potential differences in prey consumption. In eastern Australia, female juvenile white sharks tend to inhabit inshore waters more than males and thus might consume different prey (Bruce et al., 2019). However, this pattern warrants further exploration given the limitations of SCA and sample sizes (detailed below).
Although SCA enabled the establishment of key prey species of white sharks in NSW with good taxonomic resolution, a valuable opportunity for threatened marine predators, we acknowledge its well-established limitations (Chipps and Garvey, 2007). Firstly, digestion can differentially influence the identification of various prey groups, and estimates of their relative importance, since smaller, soft-bodied organisms will degrade faster than harder prey (Sekiguchi and Best, 1997; Tollit et al., 1997). Further studies could utilise genetic techniques (e.g. DNA metabarcoding) which are becoming increasingly popular albeit underutilised in taxa such as sharks (de Sousa et al., 2019). Such techniques can enable species-level prey identification, even with heavily digested samples (e.g. Hardy et al., 2017), although evaluations of relative prey importance based on DNA analyses alone are generally limited to %F (Amundsen and Sánchez-Hernández, 2019). Secondly, individual stomachs provide only spatiotemporal snapshots of recent prey consumption (e.g. hours to days) which may not represent the overall diet (Chipps and Garvey, 2007). While our broad findings (e.g. predominance of piscivory, dietary inclusion of mammals as juveniles, importance of benthic prey such as batoids) were corroborated by previous studies (Hussey et al., 2012; Pethybridge et al., 2014), a larger sample size combined with spatiotemporally-integrated biochemical tracer methods (e.g. stable isotopes, FA) will help to further establish the relative importance of prey groups and investigate potential sex- and size-based variation identified here. For example, Bayesian stable isotope mixing models can evaluate the dietary contributions of prey groups over varying spatiotemporal scales, defined by the isotopic turnover rate of the shark tissue analysed (Stock et al., 2018; Raoult et al., 2019). This approach would also help to establish the dietary importance of opportunistic or seasonal prey such as whales (Fallows et al., 2013; Tucker et al., 2019) which were not observed in our stomachs but are of significant interest in the management of white shark-human interactions in eastern Australia (Tucker et al., 2018).
White Shark Macronutrient Foraging and Its Ecological Consequences
Evaluating the nutritional compositions of prey, diets and nutritional niche breadths is a key first step towards establishing the broader influence of nutrition in the lives of marine predators (Machovsky-Capuska et al., 2016d). Our MNNF provided several new insights into the nutritional ecology of white sharks.
Firstly, despite an observed higher consumption of batoids by males, and batoids having low %L and high P:L relative to other prey species, no difference in dietary nutritional composition, prey composition or realised nutritional niche breadths was observed. Thus, each sex consumed nutritionally complementary prey which could be mixed to achieve similar dietary intakes (Raubenheimer, 2011). For example, batoids and Australian salmon would enable similar high %P intake for both males and females, respectively, albeit with different %L, which could be moderated by mixing with other complementary prey species that were lower in %P and %L. Variation in growth rates, size at maturity and reproduction (Francis, 1996; Pratt, 1996; Hamady et al., 2014; Natanson and Skomal, 2015) likely impose different physiological demands for male and female white sharks, a condition where sex-specific macronutrient foraging might be expected (Machovsky-Capuska et al., 2016c). Indeed, such physiological differences are a proposed driver behind sex-specific occurrences of sub-adult and adult white sharks at pinniped colonies (Bruce and Bradford, 2015). However, our data suggest similar nutritional goals among sexes for juvenile white sharks. Given this, it appears more likely that the observed difference in batoid consumption would arise from other factors (e.g. prey availability) related to habitat segregation (Bruce et al., 2019), rather than prey selection to meet different nutritional requirements. Nonetheless, despite allowing us to address the challenges of collating proximate compositions for the wide variety of prey consumed (Machovsky-Capuska et al., 2016a), the use of literature prey data and inherent variability of stomach contents does introduce uncertainties to our estimates. Thus, further exploration of potential factors influencing the observed difference in batoid consumption is warranted.
A second insight provided by our nutritional niche framework was an increase in estimated realised nutritional niche breadths with size among juvenile eastern Australian white sharks, although this occurred without a concomitant increase in the prey composition niche. Therefore, it is likely that similar prey compositions were mixed differently by each size class, producing a larger realised niche. In South African white sharks, the prey composition niche expanded with size, up to a certain length (∼235–285 cm PCL; Figures 6, 7). Broadly, these analyses suggest increasing macronutritional generalism with size in white sharks. Niche breadth expansion largely occurred along the lipid axis. Despite our low sample size, this conclusion is logical given the expected increase in the consumption of high-lipid prey (e.g. mammals) with size for white sharks, including among juveniles (Hussey et al., 2012).
An array of niche breadth measures relate positively with other ecological attributes such as geographic ranges (Slatyer et al., 2013). For juvenile white sharks in eastern Australia, the latitudinal range of migrations expands with age (Bruce et al., 2019). Thus, increasing macronutritional generalism, especially relating to the consumption of high-lipid prey, could reflect the adjustment of nutritional priorities to broader movement patterns (Machovsky-Capuska et al., 2016d). Indeed, lipids are physiologically important to white sharks as an energy source for long-distance migrations and while inhabiting oligotrophic environments offshore (Del Raye et al., 2013). Gallagher et al. (2019) identified increases in blood plasma FA associated with blubber consumption (Waugh et al., 2014; Meyer et al., 2019), and the utilisation of stored energy with size for juvenile white sharks in NSW. This further highlights the likely importance of body lipid stores for powering metabolism and movements in larger juvenile white sharks, even in coastal (less oligotrophic) settings (Gallagher et al., 2019). Alternatively, rather than adjusting nutritional intakes to facilitate broader geographic ranges, increasing latitudinal range could allow greater access to different prey (Bruce et al., 2019), or more high-lipid prey (e.g. seal colonies in Victoria, Tasmania and Bass Strait; Shaughnessy, 1999; McIntosh et al., 2018) which could in turn satisfy potential size-based shifts in nutritional goals. Under such a hypothesis, the observed nutritional niche expansion might also be expected as it could be predicted that larger juveniles, across their geographic range, would attempt to mix the prey available to meet any variation in nutritional priorities with size.
A third insight provided by our nutritional framework was that, despite the likely importance of lipids, white sharks feed regularly on low-lipid prey across a range of sizes, and the mean dietary composition in eastern Australian sharks was relatively low in lipid (∼6%). Interestingly, nonetheless, South African pilchard and eastern Australian salmon (important prey of white sharks in each region) had similar proximate compositions, high in lipid and protein. While lipid content is a key determinant of overall prey energy density, which is often the metric by which prey ‘quality’ is judged (Spitz et al., 2010a, b), many recent studies in a range of organisms (herbivores, omnivores and carnivores) suggest that food preferences are driven by specific macronutrient content and balance, rather than simply overall energy content (Hewson-Hughes et al., 2013; Erlenbach et al., 2014; Felton et al., 2016; Coogan et al., 2017; Rowe et al., 2018). The specific mixture of macronutrients required depends on the physiological, functional and life history attributes of an animal such that optimal foraging may be achieved by regulating multiple nutrients simultaneously, not just maximising net energy gain (Simpson et al., 2004). Therefore, it is important to consider foraging from a macronutritionally explicit perspective (Raubenheimer et al., 2009). Lipids are also important to white sharks (and other sharks) for functions not directly related to energy metabolism, such as buoyancy control (Del Raye et al., 2013). Furthermore, large white sharks often mouth whale carcasses prior to feeding and repeatedly regurgitate chunks of blubber, which is variable in both protein and lipid content (Lockyer et al., 1985), before returning to feed (Fallows et al., 2013). This suggests some capabilities in sensing and differentiating among prey based on composition (Fallows et al., 2013). The relative importance of specific macronutrients and/or energy density in white sharks’ feeding preferences is an important question to resolve. While we acknowledge limitations in using literature prey data (e.g. potential spatiotemporal effects on prey proximate composition affecting comparisons; Tait et al., 2014), this has presented a valuable opportunity for integrating nutrition with existing knowledge of white sharks’ diets and spurs interesting questions about the influence of prey compositions in broader white shark ecology.
Improving our understanding of white sharks’ diets to infer drivers of movements has been identified as a key research objective for this species (Huveneers et al., 2018). Fluctuations in prey availability and nutritional quality due to seasonal and environmental factors (e.g. temperature, nutrient upwelling) can produce complex nutritional environments which predators must navigate to achieve nutritional goals (Vollenweider et al., 2011; Machovsky-Capuska et al., 2018). Juvenile white sharks exhibit seasonal latitudinal movements throughout eastern Australia, and periods of temporary residency in coastal nursery regions such as Port Stephens (central NSW) and Corner Inlet (eastern Victoria; Bruce et al., 2006, 2019), which can lead to interactions with humans (West, 2011). Occupancy of each nursery region has been noted to coincide with a local seasonal peak in chlorophyll A concentrations resulting from nutrient upwelling associated with bathymetric and oceanographic features, which could in turn affect prey abundance and/or nutritional quality (Bruce and Bradford, 2012; Machovsky-Capuska et al., 2018). How might white sharks’ nutritional requirements interact with variability in the abundance and quality of prey species (arising from abiotic and biotic factors) to influence their movements? Nutrient availability (the product of both food abundance and nutritional composition) has been shown to drive migrations elsewhere (Simpson et al., 2006; Nie et al., 2015). Coogan and Raubenheimer (2016) linked experimentally-derived nutritional targets, variations in seasonal food compositions and nutrient limitations to explain grizzly bears’ (Ursus arctos) urban habitat use, and potential areas of overlap with humans. Under this framework, information on the prey composition and realised nutritional niches of white sharks provided herein, combined with spatiotemporal characterisation of nutrient availability and acquisition in the form of nutritional landscapes (sensu Machovsky-Capuska et al., 2018) will provide a foundation for our knowledge on how nutrition shapes white shark movements, and cast new light on potential drivers of human-shark conflicts.
Through a combination of stomach contents and proportions-based nutritional geometry framework modelling, we provided the first diet assessment for juvenile white sharks in eastern Australian waters, and new insights into this species’ nutritional ecology. Consistent with previous studies, juvenile white sharks in eastern Australia were predominantly generalist piscivores consuming a broad variety of prey, notably eastern Australian salmon, benthic teleosts and batoids, with dietary inclusion of dolphins also observed during the juvenile stage (∼170–180 cm PCL). There was evidence for sex-based dietary variation with an increase in batoid consumption by males detected. However, this conclusion requires further validation through biochemical approaches (stable isotopes and FA). Estimated nutritional niches and requirements appear similar for male and female juvenile white sharks in eastern Australia. However, we found evidence for increasing macronutritional generalism with size in white sharks, even among juveniles, which might relate to shifts in nutritional goals, lipid consumption and expanding geographic ranges. Further exploration of the interactions between white shark nutritional requirements and the dynamics of prey quality and availability will likely enhance management and conservation strategies for this top predator.
Data Availability Statement
The datasets generated for this study are available on request to the corresponding author.
Ethics Statement
Ethical review and approval was not required for the animal study because all samples were obtained from deceased white sharks caught in the NSW Shark Meshing (Bather Protection) Program, operated by the NSW Department of Primary Industries (NSW DPI), or from other incidental mortalities. No animals were killed specifically for this research. Collection of samples was conducted under NSW DPI permit # P01/0059(A)-4.0.
Author Contributions
RG, GM-C, and DR conceptualised the study. VP coordinated the sampling. VP and RG collected the stomachs. RG analysed the stomach contents and the data. RG, VP, DR, and GM-C wrote the manuscript.
Funding
Project funding and support was provided by the New South Wales Department of Primary Industries through the New South Wales Shark Management Strategy (NSW SMS). RG is supported by an Australian Government Research Training Program Stipend and supplementary scholarship from the NSW SMS/University of Sydney.
Conflict of Interest
The authors declare that the research was conducted in the absence of any commercial or financial relationships that could be construed as a potential conflict of interest.
Acknowledgments
We thank New South Wales Department of Primary Industries staff and Shark Meshing Program observers including Cameron Doak, Stephen Chilcott, Sean Blake, Isabelle Thiebaud, Steve Kay, Euan Provost, Matt Broadhurst and Paul Butcher, and Shark Meshing Program contractors for their help coordinating and collecting sharks and conducting necropsies. Without their assistance this work would not have been possible. Thanks to Mark McGrouther and Amanda Hay at the Australian Museum for access to their otolith reference collection which greatly assisted in the identification of prey items. We thank the three anonymous reviewers whose comments also greatly improved this manuscript. This is contribution number 247 to the Sydney Institute of Marine Science.
Supplementary Material
The Supplementary Material for this article can be found online at: https://www.frontiersin.org/articles/10.3389/fmars.2020.00422/full#supplementary-material
Footnotes
References
Abrantes, K. G., and Barnett, A. (2011). Intrapopulation variations in diet and habitat use in a marine apex predator, the broadnose sevengill shark Notorynchus cepedianus. Mar. Ecol. Prog. Ser. 442, 133–148. doi: 10.3354/meps09395
Amundsen, P. A., and Sánchez-Hernández, J. (2019). Feeding studies take guts – critical review and recommendations of methods for stomach contents analysis in fish. J. Fish Biol. 95, 1364–1373. doi: 10.1111/jfb.14151
Benjamini, Y., and Hochberg, Y. (1995). Controlling the false discovery rate: a practical and powerful approach to multiple testing. J. R. Stat. Soc. Ser. B Methodol. 57, 289–300. doi: 10.1111/j.2517-6161.1995.tb02031.x
Bruce, B., and Bradford, R. (2015). Segregation or aggregation? Sex-specific patterns in the seasonal occurrence of white sharks Carcharodon carcharias at the Neptune Islands, South Australia. J. Fish Biol. 87, 1355–1370. doi: 10.1111/jfb.12827
Bruce, B., Harasti, D., Lee, K., Gallen, C., and Bradford, R. (2019). Broad-scale movements of juvenile white sharks Carcharodon carcharias in eastern Australia from acoustic and satellite telemetry. Mar. Ecol. Prog. Ser. 619, 1–15. doi: 10.3354/meps12969
Bruce, B. D. (1992). Preliminary observations on the biology of the white shark, Carcharodon carcharias, in South Australian waters. Aust. J. Mar. Freshw. Res. 43, 1–11. doi: 10.1071/MF9920001
Bruce, B. D., and Bradford, R. W. (2012). “Habitat use and spatial dynamics of juvenile white sharks, Carcharodon carcharias, in Eastern Australia,” in Global Perspectives on the Biology and Life History of the White Shark, ed. M. L. Domeier (Boca Raton, FL: CRC Press), 225–254. doi: 10.1201/b11532-20
Bruce, B. D., Bradford, R. W., Hughes, B., Carraro, R., Gallen, C., Harasti, D., et al. (2013). Acoustic Tracking and Aerial Surveys of White Sharks in the Hunter Central Rivers Catchment Management Authority Region. Hobart, TAS: CSIRO.
Bruce, B. D., Stevens, J. D., and Malcolm, H. (2006). Movements and swimming behaviour of white sharks (Carcharodon carcharias) in Australian waters. Mar. Biol. 150, 161–172. doi: 10.1007/s00227-006-0325-1
Carlisle, A. B., Kim, S. L., Semmens, B. X., Madigan, D. J., Jorgensen, S. J., Perle, C. R., et al. (2012). Using stable isotope analysis to understand the migration and trophic ecology of Northeastern Pacific White Sharks (Carcharodon carcharias). PLoS One 7:e30492. doi: 10.1371/journal.pone.0030492
Chipps, S., and Garvey, J. (2007). “Assessment of diets and feeding patterns,” in Analysis and Interpretation of Freshwater Fisheries Data, eds C. S. Guy and M. L. Brown (Bethesda, MD: American Fisheries Society), 473–514.
Cliff, G., and Dudley, S. F. J. (2011). Reducing the environmental impact of shark-control programs: a case study from KwaZulu-Natal, South Africa. Mar. Freshw. Res. 62, 700–709. doi: 10.1071/mf10182
Coogan, S. C. P., Machovsky-Capuska, G. E., Senior, A. M., Martin, J. M., Major, R. E., and Raubenheimer, D. (2017). Macronutrient selection of free-ranging urban Australian white ibis (Threskiornis moluccus). Behav. Ecol. 28, 1021–1029. doi: 10.1093/beheco/arx060
Coogan, S. C. P., and Raubenheimer, D. (2016). Might macronutrient requirements influence grizzly bear-human conflict? Insights from nutritional geometry. Ecosphere 7:e01204. doi: 10.1002/ecs2.1204
Coogan, S. C. P., Raubenheimer, D., Stenhouse, G. B., and Nielsen, S. E. (2014). Macronutrient optimization and seasonal diet mixing in a large omnivore, the grizzly bear: a geometric analysis. PLoS One 9:e97968. doi: 10.1371/journal.pone.0097968
Cortés, E. (1997). A critical review of methods of studying fish feeding based on analysis of stomach contents: application to elasmobranch fishes. Can. J. Fish. Aquat. Sci. 54, 726–738. doi: 10.1139/cjfas-54-3-726
Craig, J. F., Kenley, M. J., and Talling, J. F. (1978). Comparative estimations of the energy content of fish tissue from bomb calorimetry, wet oxidation and proximate analysis. Freshw. Biol. 8, 585–590. doi: 10.1111/j.1365-2427.1978.tb01480.x
de Sousa, L. L., Silva, S. M., and Xavier, R. (2019). DNA metabarcoding in diet studies: unveiling ecological aspects in aquatic and terrestrial ecosystems. Environ. DNA 1, 199–214. doi: 10.1002/edn3.27
Del Raye, G., Jorgensen, S. J., Krumhansl, K., Ezcurra, J. M., and Block, B. A. (2013). Travelling light: white sharks (Carcharodon carcharias) rely on body lipid stores to power ocean-basin scale migration. Proc. R. Soc. B Biol. Sci. 280:20130836. doi: 10.1098/rspb.2013.0836
del Rio, C. M., and Cork, S. (1997). Exploring nutritional biodiversity: a society is born. Trends Ecol. Evol. 12, 9–10. doi: 10.1016/s0169-5347(96)30060-8
Denuncio, P., Viola, M. N. P., Machovsky-Capuska, G. E., Raubenheimer, D., Blasina, G., Machado, R., et al. (2017). Population variance in prey, diets and their macronutrient composition in an endangered marine predator, the Franciscana dolphin. J. Sea Res. 129, 70–79. doi: 10.1016/j.seares.2017.05.008
Dicken, M. L. (2008). First observations of young of the year and juvenile great white sharks (Carcharodon carcharias) scavenging from a whale carcass. Mar. Freshw. Res. 59, 596–602. doi: 10.1071/mf07223
Dicken, M. L., Hussey, N. E., Christiansen, H. M., Smale, M. J., Nkabi, N., Cliff, G., et al. (2017). Diet and trophic ecology of the tiger shark (Galeocerdo cuvier) from South African waters. PLoS One 12:e0177897. doi: 10.1371/journal.pone.0177897
Domeier, M. L. (2012). Global Perspectives on the Biology and Life History of the White Shark. Boca Raton, FL: CRC Press.
DPI (2019). Shark Meshing (Bather Protection) Program 2018/19 Annual Performance Report. Sydney, NSW: NSW Department of Primary Industries.
Eder, E. B., and Lewis, M. N. (2005). Proximate composition and energetic value of demersal and pelagic prey species from the SW Atlantic Ocean. Mar. Ecol. Prog. Ser. 291, 43–52. doi: 10.3354/meps291043
Erlenbach, J. A., Rode, K. D., Raubenheimer, D., and Robbins, C. T. (2014). Macronutrient optimization and energy maximization determine diets of brown bears. J. Mammal. 95, 160–168. doi: 10.1644/13-mamm-a-161
Estrada, J. A., Rice, A. N., Natanson, L. J., and Skomal, G. B. (2006). Use of isotopic analysis of vertebrae in reconstructing ontogenetic feeding ecology in white sharks. Ecology 87, 829–834. doi: 10.1890/0012-9658(2006)87[829:uoiaov]2.0.co;2
Fallows, C., Gallagher, A. J., and Hammerschlag, N. (2013). White Sharks (Carcharodon carcharias) scavenging on whales and its potential role in further shaping the ecology of an apex predator. PLoS One 8:e60797. doi: 10.1371/journal.pone.0060797
Felton, A. M., Felton, A., Raubenheimer, D., Simpson, S. J., Krizsan, S. J., Hedwall, P. O., et al. (2016). The nutritional balancing act of a large herbivore: an experiment with captive moose (Alces alces L). PLoS One 11:e0150870. doi: 10.1371/journal.pone.0150870
Ferrara, T. L., Clausen, P., Huber, D. R., McHenry, C. R., Peddemors, V., and Wroe, S. (2011). Mechanics of biting in great white and sandtiger sharks. J. Biomech. 44, 430–435. doi: 10.1016/j.jbiomech.2010.09.028
Francis, M. P. (1996). “Observations on a pregnant White Shark with a review of reproductive biology,” in Great White Sharks: The Biology of Carcharodon Carcharias, eds A. P. Klimley and D. G. Ainley (San Diego, CA: Academic Press), 157–172. doi: 10.1016/b978-012415031-7/50016-1
French, G. C. A., Rizzuto, S., Sturup, M., Inger, R., Barker, S., van Wyk, J. H., et al. (2018). Sex, size and isotopes: cryptic trophic ecology of an apex predator, the white shark Carcharodon carcharias. Mar. Biol. 165:102. doi: 10.1007/s00227-018-3343-x
French, G. C. A., Sturup, M., Rizzuto, S., Van Wyk, J. H., Edwards, D., Dolan, R. W., et al. (2017). The tooth, the whole tooth and nothing but the tooth: tooth shape and ontogenetic shift dynamics in the white shark Carcharodon carcharias. J. Fish Biol. 91, 1032–1047. doi: 10.1111/jfb.13396
Froese, R., and Pauly, D. (2019). FishBase. Available online at: www.fishbase.org (accessed June 2019)Google Scholar
Frost, A. M., Jacobsen, I. P., and Bennett, M. B. (2017). The diet of the coffin ray, Hypnos monopterygius (Shaw, 1795), and predation mode inferred from jaw, dentition and electric organ morphology. Mar. Freshw. Res. 68, 1193–1198. doi: 10.1071/mf16200
Furlani, D., Gales, R., and Pemberton, D. (2007). Otoliths of Common Australian Temperate Fish: A Photographic Guide. Melbourne, VIC: CSIRO Publishing.
Gallagher, A. J., Meyer, L., Pethybridge, H. R., Huveneers, C., and Butcher, P. A. (2019). Effects of short-term capture on the physiology of white sharks Carcharodon carcharias: amino acids and fatty acids. Endanger. Spec. Res. 40, 297–308. doi: 10.3354/esr00997
Guerra, A. S. (2019). Wolves of the sea: managing human-wildlife conflict in an increasingly tense ocean. Mar. Policy 99, 369–373. doi: 10.1016/j.marpol.2018.11.002
Hamady, L. L., Natanson, L. J., Skomal, G. B., and Thorrold, S. R. (2014). Vertebral bomb radiocarbon suggests extreme longevity in white sharks. PLoS One 9:e84006. doi: 10.1371/journal.pone.0084006
Harasti, D., Lee, K., Bruce, B., Gallen, C., and Bradford, R. (2017). Juvenile white sharks Carcharodon carcharias use estuarine environments in south-eastern Australia. Mar. Biol. 164:14. doi: 10.1007/s00227-017-3087-z
Hardy, N., Berry, T., Kelaher, B. P., Goldsworthy, S. D., Bunce, M., Coleman, M. A., et al. (2017). Assessing the trophic ecology of top predators across a recolonisation frontier using DNA metabarcoding of diets. Mar. Ecol. Prog. Ser. 573, 237–254. doi: 10.3354/meps12165
Heithaus, M. R., Frid, A., Wirsing, A. J., and Worm, B. (2008). Predicting ecological consequences of marine top predator declines. Trends Ecol. Evol. 23, 202–210. doi: 10.1016/j.tree.2008.01.003
Hewson-Hughes, A. K., Hewson-Hughes, V. L., Colyer, A., Miller, A. T., McGrane, S. J., Hall, S. R., et al. (2013). Geometric analysis of macronutrient selection in breeds of the domestic dog, Canis lupus familiaris. Behav. Ecol. 24, 293–304. doi: 10.1093/beheco/ars168
Hussey, N. E., Dudley, S. F. J., McCarthy, I. D., Cliff, G., and Fisk, A. T. (2011). Stable isotope profiles of large marine predators: viable indicators of trophic position, diet, and movement in sharks? Can. J. Fish. Aquat. Sci. 68, 2029–2045. doi: 10.1139/f2011-115
Hussey, N. E., McCann, H. M., Cliff, G., Dudley, S. F. J., Wintner, S. P., and Fisk, A. T. (2012). “”Size-based analysis of diet and trophic position of the white shark, Carcharodon carcharias, in South African Waters,” in Global Perspectives on the Biology and Life History of the White Shark, ed. M. L. Domeier (Boca Raton, FL: CRC Press), 27–50. doi: 10.1201/b11532-5
Huveneers, C., Apps, K., Becceri-Garcia, E. E., Bruce, B., Butcher, P. A., Carlisle, A. B., et al. (2018). Future research directions on the ‘elusive’ white shark. Front. Mar. Sci. 5:455. doi: 10.3389/fmars.2018.00455
Hyslop, E. J. (1980). Stomach contents analysis - a review of methods and their application. J. Fish Biol. 17, 411–429. doi: 10.1111/j.1095-8649.1980.tb02775.x
Jackson, A. L., Inger, R., Parnell, A. C., and Bearhop, S. (2011). Comparing isotopic niche widths among and within communities: SIBER – stable isotope bayesian ellipses in R. J. Anim. Ecol. 80, 595–602. doi: 10.1111/j.1365-2656.2011.01806.x
Jewell, O. J. D., Gleiss, A. C., Jorgensen, S. J., Andrzejaczek, S., Moxley, J. H., Beatty, S. J., et al. (2019). Cryptic habitat use of white sharks in kelp forest revealed by animal-borne video. Biol. Lett. 15:5. doi: 10.1098/rsbl.2019.0085
Jorgensen, S. J., Gleiss, A. C., Kanive, P. E., Chapple, T. K., Anderson, S. D., Ezcurra, J. M., et al. (2015). In the belly of the beast: resolving stomach tag data to link temperature, acceleration and feeding in white sharks (Carcharodon carcharias). Anim. Biotelem. 3:52.
Kim, S. L., Tinker, M. T., Estes, J. A., and Koch, P. L. (2012). Ontogenetic and among-individual variation in foraging strategies of Northeast Pacific white sharks based on stable isotope analysis. PLoS One 7:e45068. doi: 10.1371/journal.pone.0045068
Kock, A., O’Riain, M. J., Mauff, K., Meyer, M., Kotze, D., and Griffiths, C. (2013). Residency, habitat use and sexual segregation of white sharks, Carcharodon carcharias in False Bay, South Africa. PLoS One 8:e55048. doi: 10.1371/journal.pone.0055048
Krogh, M., and Reid, D. (1996). Bycatch in the protective shark meshing programme off south-eastern New South Wales, Australia. Biol. Conserv. 77, 219–226. doi: 10.1016/0006-3207(95)00141-7
Last, P. R., and Stephens, J. D. (2009). Sharks and Rays of Australia. Collingwood, VIC: CSIRO Publishing.
Lindeman, R. L. (1942). The trophic−dynamic aspect of ecology. Ecology 23, 399–417. doi: 10.2307/1930126
Lockyer, C. H., McConnell, L. C., and Waters, T. D. (1985). Body condition in terms of anatomical and biochemical assessment of body fat in North Atlantic Fin and Sei whales. Can. J. Zool. 63, 2328–2338. doi: 10.1139/z85-345
Lu, C. C., and Ickeringill, R. (2002). Cephalopod Beak Identification and Biomass Estimation Techniques: Tools for Dietary Studies of Southern Australian Finfishes. Melbourne, VIC: Museum Victoria.
Machovsky-Capuska, G. E., Coogan, S. C. P., Simpson, S. J., and Raubenheimer, D. (2016a). Motive for killing: what drives prey choice in wild predators? Ethology 122, 703–711. doi: 10.1111/eth.12523
Machovsky-Capuska, G. E., Miller, M. G. R., Silva, F. R. O., Amiot, C., Stockin, K. A., Senior, A. M., et al. (2018). The nutritional nexus: linking niche, habitat variability and prey composition in a generalist marine predator. J. Anim. Ecol. 87, 1286–1298. doi: 10.1111/1365-2656.12856
Machovsky-Capuska, G. E., Priddel, D., Leong, P. H. W., Jones, P., Carlile, N., Shannon, L., et al. (2016b). Coupling bio-logging with nutritional geometry to reveal novel insights into the foraging behaviour of a plunge-diving marine predator. N. Z. J. M. Freshw. Res. 50, 418–432. doi: 10.1080/00288330.2016.1152981
Machovsky-Capuska, G. E., and Raubenheimer, D. (2020). The nutritional ecology of marine apex predators. Annu. Rev. Mar. Sci. 12, 361–387. doi: 10.1146/annurev-marine-010318-095411
Machovsky-Capuska, G. E., Senior, A. M., Benn, E. C., Tait, A. H., Schuckard, R., Stockin, K. A., et al. (2016c). Sex-specific macronutrient foraging strategies in a highly successful marine predator: the Australasian gannet. Mar. Biol. 163:75. doi: 10.1007/s00227-016-2841-y
Machovsky-Capuska, G. E., Senior, A. M., Simpson, S. J., and Raubenheimer, D. (2016d). The multidimensional nutritional niche. Trends Ecol. Evol. 31, 355–365. doi: 10.1016/j.tree.2016.02.009
Malcom, H., Bruce, B. D., and Stevens, J. D. (2001). “A review of the biology and status of white sharks in Australian waters,” in Report to Environment Australia, Marine Species Protection Program, (Hobart, TAS: CSIRO Div. of Marine Research).
Marshall, A. D., Kyne, P. M., and Bennett, M. B. (2008). Comparing the diet of two sympatric urolophid elasmobranchs (Trygonoptera testacea Muller & Henle and Urolophus kapalensis Yearsley & Last): evidence of ontogenetic shifts and possible resource partitioning. J. Fish Biol. 72, 883–898. doi: 10.1111/j.1095-8649.2007.01762.x
McElroy, W. D., Wetherbee, B. M., Mostello, C. S., Lowe, C. G., Crow, G. L., and Wass, R. C. (2006). Food habits and ontogenetic changes in the diet of the sandbar shark, Carcharhinus plumbeus, in Hawaii. Environ. Biol. Fishes 76, 81–92. doi: 10.1007/s10641-006-9010-y
McIntosh, R. R., Kirkman, S. P., Thalmann, S., Sutherland, D. R., Mitchell, A., Arnould, J. P. Y., et al. (2018). Understanding meta-population trends of the Australian fur seal, with insights for adaptive monitoring. PLoS One 13:e0200253. doi: 10.1371/journal.pone.0200253
Meyer, L., Pethybridge, H., Beckmann, C., Bruce, B., and Huveneers, C. (2019). The impact of wildlife tourism on the foraging ecology and nutritional condition of an apex predator. Tourism Manag. 75, 206–215. doi: 10.1016/j.tourman.2019.04.025
Miller, M. G., Silva, F. R., Machovsky-Capuska, G. E., and Congdon, B. C. (2017). Sexual segregation in tropical seabirds: drivers of sex-specific foraging in the Brown Booby Sula leucogaster. J. Ornithol. 159, 425–437. doi: 10.1007/s10336-017-1512-1
Natanson, L. J., and Skomal, G. B. (2015). Age and growth of the white shark, Carcharodon carcharias, in the western North Atlantic Ocean. Mar. Freshw. Res. 66, 387–398. doi: 10.1071/mf14127
Nie, Y. G., Zhang, Z. J., Raubenheimer, D., Elser, J. J., Wei, W., and Wei, F. W. (2015). Obligate herbivory in an ancestrally carnivorous lineage: the giant panda and bamboo from the perspective of nutritional geometry. Funct. Ecol. 29, 26–34. doi: 10.1111/1365-2435.12302
Nielsen, J., Christiansen, J. S., Gronkjaer, P., Bushnell, P., Steffensen, J. F., Kiilerich, H. O., et al. (2019). Greenland shark (Somniosus microcephalus) stomach contents and stable isotope values reveal an ontogenetic dietary shift. Front. Mar. Sci. 6:125. doi: 10.3389/fmars.2019.00125
Norris, K. S. (1961). Standardized methods for measuring and recording data on the smaller cetaceans. J. Mammal. 42, 471–476. doi: 10.2307/1377364
Pethybridge, H. R., Parrish, C. C., Bruce, B. D., Young, J. W., and Nichols, P. D. (2014). Lipid, fatty acid and energy density profiles of white sharks: insights into the feeding ecology and ecophysiology of a complex top predator. PLoS One 9:e97877. doi: 10.1371/journal.pone.0097877
Powter, D. M., Gladstone, W., and Platell, M. (2010). The influence of sex and maturity on the diet, mouth morphology and dentition of the Port Jackson shark, Heterodontus portusjacksoni. Mar. Freshw. Res. 61, 74–85. doi: 10.1071/mf09021
Pratt, H. L. (1996). “Reproduction in the male white shark,” in Great White Sharks: The Biology of Carcharodon Carcharias, eds A. P. Klimley and D. G. Ainley (San Diego, CA: Academic Press), 131–138. doi: 10.1016/b978-012415031-7/50014-8
Preti, A., Soykan, C. U., Dewar, H., Wells, R. J. D., Spear, N., and Kohin, S. (2012). Comparative feeding ecology of shortfin mako, blue and thresher sharks in the California Current. Environ. Biol. Fishes 95, 127–146. doi: 10.1007/s10641-012-9980-x
R Core Team (2019). R: A Language and Environment for Statistical Computing. Vienna: R Foundation for Statistical Computing.
Ramos, R., and Gonzalez-Solis, J. (2012). Trace me if you can: the use of intrinsic biogeochemical markers in marine top predators. Front. Ecol. Environ. 10:140. doi: 10.1890/110140
Raoult, V., Broadhurst, M. K., Peddemors, V. M., Williamson, J. E., and Gaston, T. F. (2019). Resource use of great hammerhead sharks (Sphyrna mokarran) off eastern Australia. J. Fish Biol. 95, 1430–1440. doi: 10.1111/jfb.14160
Raubenheimer, D. (2011). Toward a quantitative nutritional ecology: the right-angled mixture triangle. Ecol. Monogr. 81, 407–427. doi: 10.1890/10-1707.1
Raubenheimer, D., and Simpson, S. J. (1993). The geometry of compensatory feeding in the locust. Anim. Behav. 45, 953–964. doi: 10.1006/anbe.1993.1114
Raubenheimer, D., Simpson, S. J., and Mayntz, D. (2009). Nutrition, ecology and nutritional ecology: toward an integrated framework. Funct. Ecol. 23, 4–16. doi: 10.1111/j.1365-2435.2009.01522.x
Raubenheimer, D., Zemke-White, W. L., Phillips, R. J., and Clements, K. D. (2005). Algal macronutrients and food selection by the omnivorous marine fish Girella tricuspidata. Ecology 86, 2601–2610. doi: 10.1890/04-1472
Reid, A. (2016). Cephalopods of Australia and Sub-Antarctic Territories. Melbourne, VIC: CSIRO Publishing.
Reid, D. D., Robbins, W. D., and Peddemors, V. M. (2011). Decadal trends in shark catches and effort from the New South Wales, Australia, shark meshing program 1950-2010. Mar. Freshw. Res. 62, 676–693. doi: 10.1071/mf10162
Rigby, C. L., Barreto, R., Carlson, J., Fernando, D., Fordham, S., Francis, M. P., et al. (2019). Carcharodon carcharias. The IUCN Red List of Threatened Species 2019. Available: https://dx.doi.org/10.2305/IUCN.UK.2019-3.RLTS.T3855A2878674.en (accessed December 25, 2019).
Rowe, C. E., Figueira, W., Raubenheimer, D., Solon-Biet, S. M., and Machovsky-Capuska, G. E. (2018). Effects of temperature on macronutrient selection, metabolic and swimming performance of the Indo-Pacific Damselfish (Abudefduf vaigiensis). Mar. Biol. 165:178. doi: 10.1007/s00227-018-3435-7
Ruohonen, K., Simpson, S. J., and Raubenheimer, D. (2007). A new approach to diet optimisation: a re-analysis using European whitefish (Coregonus lavaretus). Aquaculture 267, 147–156. doi: 10.1016/j.aquaculture.2007.02.051
Sekiguchi, K. S., and Best, P. B. (1997). In vitro digestibility of some prey species of dolphins. Fish. Bull. 95, 386–393.
Senior, A. M., Grueber, C. E., Machovsky-Capuska, G., Simpson, S. J., and Raubenheimer, D. (2016). Macronutritional consequences of food generalism in an invasive mammal, the wild boar. Mammal. Biol. 81, 523–526. doi: 10.1016/j.mambio.2016.07.001
Shaughnessy, P. D. (1999). The Action Plan for Australian Seals. Canberra, ACT: Environment Australia.
Simpson, S. J., and Raubenheimer, D. (1995). The geometric analysis of feeding and nutrition: a user’s guide. J. Insect Physiol. 41, 545–553. doi: 10.1016/0022-1910(95)00006-g
Simpson, S. J., and Raubenheimer, D. (2012). The nature of nutrition: a unifying framework. Aust. J. Zool. 59, 350–368. doi: 10.1071/zo11068
Simpson, S. J., Sibly, R. M., Lee, K. P., Behmer, S. T., and Raubenheimer, D. (2004). Optimal foraging when regulating intake of multiple nutrients. Anim. Behav. 68, 1299–1311. doi: 10.1016/j.anbehav.2004.03.003
Simpson, S. J., Sword, G. A., Lorch, P. D., and Couzin, I. D. (2006). Cannibal crickets on a forced march for protein and salt. Proc. Natl. Acad. Sci. U.S.A. 103, 4152–4156. doi: 10.1073/pnas.0508915103
Slatyer, R. A., Hirst, M., and Sexton, J. P. (2013). Niche breadth predicts geographical range size: a general ecological pattern. Ecol. Lett. 16, 1104–1114. doi: 10.1111/ele.12140
Smale, M. J., Watson, G., and Hecht, T. (1995). Otolith Atlas of Southern African Marine Fishes. Grahamstown, EC: J.L.B Smith Institute of Ichthyology.
Sommerville, E., Platell, M. E., White, W. T., Jones, A. A., and Potter, I. C. (2011). Partitioning of food resources by four abundant, co-occurring elasmobranch species: relationships between diet and both body size and season. Mar. Freshw. Res. 62, 54–65. doi: 10.1071/mf10164
Spitz, J., Mourocq, E., Leaute, J. P., Quero, J. C., and Ridoux, V. (2010a). Prey selection by the common dolphin: fulfilling high energy requirements with high quality food. J. Exp. Mar. Biol. Ecol. 390, 73–77. doi: 10.1016/j.jembe.2010.05.010
Spitz, J., Mourocq, E., Schoen, V., and Ridoux, V. (2010b). Proximate composition and energy content of forage species from the Bay of Biscay: high- or low-quality food? ICES J. Mar. Sci. 67, 909–915. doi: 10.1093/icesjms/fsq008
Stephens, D. W., and Krebs, J. R. (1986). Foraging Theory. Princeton, NJ: Princeton University Press.
Stock, B. C., Jackson, A. L., Ward, E. J., Parnell, A. C., Phillips, D. L., and Semmens, B. X. (2018). Analyzing mixing systems using a new generation of Bayesian tracer mixing models. PeerJ 6:e5096. doi: 10.7717/peerj.5096
Symonds, M. R. E., and Moussalli, A. (2011). A brief guide to model selection, multimodel inference and model averaging in behavioural ecology using Akaike’s information criterion. Behav. Ecol. Sociobiol. 65, 13–21. doi: 10.1007/s00265-010-1037-6
Syvaranta, J., Lensu, A., Marjomaki, T. J., Oksanen, S., and Jones, R. I. (2013). An empirical evaluation of the utility of convex hull and standard ellipse areas for assessing population niche widths from stable isotope data. PLoS One 8:e56094. doi: 10.1371/journal.pone.0056094
Tait, A. H., Raubenheimer, D., Stockin, K. A., Merriman, M., and Machovsky-Capuska, G. E. (2014). Nutritional geometry and macronutrient variation in the diets of gannets: the challenges in marine field studies. Mar. Biol. 161, 2791–2801. doi: 10.1007/s00227-014-2544-1
Tamburin, E., Kim, S. L., Elorriaga-Verplancken, F. R., Madigan, D. J., Hoyos-Padilla, M., Sánchez-González, A., et al. (2019). Isotopic niche and resource sharing among young sharks (Carcharodon carcharias and Isurus oxyrinchus) in Baja California, Mexico. Mar. Ecol. Prog. Ser. 613, 107–124. doi: 10.3354/meps12884
Tollit, D. J., Steward, M. J., Thompson, P. M., Pierce, G. J., Santos, M. B., and Hughes, S. (1997). Species and size differences in the digestion of otoliths and beaks: implications for estimates of pinniped diet composition. Can. J. Fish. Aquat. Sci. 54, 105–119. doi: 10.1139/cjfas-54-1-105
Towner, A. V., Leos-Barajas, V., Langrock, R., Schick, R. S., Smale, M. J., Kaschke, T., et al. (2016). Sex-specific and individual preferences for hunting strategies in white sharks. Funct. Ecol. 30, 1397–1407. doi: 10.1111/1365-2435.12613
Tricas, T. C., and McCosker, J. E. (1984). Predatory behavior of the white shark (Carcharodon carcharias), with notes on its biology. Proc. California Acad. Sci. 43, 221–238.
Tucker, J. P., Santos, I. R., Crocetti, S., and Butcher, P. (2018). Whale carcass strandings on beaches: management challenges, research needs, and examples from Australia. Ocean Coast. Manag. 163, 323–338. doi: 10.1016/j.ocecoaman.2018.07.006
Tucker, J. P., Vercoe, B., Santos, I. R., Dujmovic, M., and Butcher, P. A. (2019). Whale carcass scavenging by sharks. Glob. Ecol. Conserv. 19:e00655. doi: 10.1016/j.gecco.2019.e00655
Venables, W. N., and Ripley, B. D. (2002). Modern Applied Statistics with S. New York, NY: Springer.
Vollenweider, J. J., Heintz, R. A., Schaufler, L., and Bradshaw, R. (2011). Seasonal cycles in whole-body proximate composition and energy content of forage fish vary with water depth. Mar. Biol. 158, 413–427. doi: 10.1007/s00227-010-1569-3
Watanabe, Y. Y., Payne, N. L., Semmens, J. M., Fox, A., and Huveneers, C. (2019a). Hunting behaviour of white sharks recorded by animal-borne accelerometers and cameras. Mar. Ecol. Prog. Ser. 621, 221–227. doi: 10.3354/meps12981
Watanabe, Y. Y., Payne, N. L., Semmens, J. M., Fox, A., and Huveneers, C. (2019b). Swimming strategies and energetics of endothermic white sharks during foraging. J. Exp. Biol. 222:9. doi: 10.1242/jeb.185603
Waugh, C. A., Nichols, P. D., Schlabach, M., Noad, M., and Nash, S. B. (2014). Vertical distribution of lipids, fatty acids and organochlorine contaminants in the blubber of southern hemisphere humpback whales (Megaptera novaeangliae). Mar. Environ. Res. 94, 24–31. doi: 10.1016/j.marenvres.2013.11.004
Weng, K. C., O’Sullivan, J. B., Lowe, C. G., Winkler, C. E., Dewar, H., and Block, B. A. (2007). Movements, behavior and habitat preferences of juvenile white sharks Carcharodon carcharias in the eastern Pacific. Mar. Ecol. Prog. Ser. 338, 211–224. doi: 10.3354/meps338211
West, J. G. (2011). Changing patterns of shark attacks in Australian waters. Mar. Freshw. Res. 62, 744–754. doi: 10.1071/mf10181
Young, J. W., Hunt, B. P. V., Cook, T. R., Llopiz, J. K., Hazen, E. L., Pethybridge, H. R., et al. (2015). The trophodynamics of marine top predators: current knowledge, recent advances and challenges. Deep Sea Res. Part II Top. Stud. Oceanogr. 113, 170–187. doi: 10.1016/j.dsr2.2014.05.015
Zeileis, A., and Hothorn, T. (2002). Diagnostic checking in regression relationships. R News 2, 7–10.
Keywords: diet, stomach contents, nutritional geometry, multidimensional nutritional niche framework, Bayesian standard ellipse, marine predators, conservation
Citation: Grainger R, Peddemors VM, Raubenheimer D and Machovsky-Capuska GE (2020) Diet Composition and Nutritional Niche Breadth Variability in Juvenile White Sharks (Carcharodon carcharias). Front. Mar. Sci. 7:422. doi: 10.3389/fmars.2020.00422
Received: 04 February 2020; Accepted: 14 May 2020;
Published: 07 June 2020.
Edited by:
Mark Meekan, Australian Institute of Marine Science (AIMS), AustraliaReviewed by:
Yannis Peter Papastamatiou, Florida International University, United StatesTaylor Chapple, Oregon State University, United States
Charlie Huveneers, Flinders University, Australia
Copyright © 2020 Grainger, Peddemors, Raubenheimer and Machovsky-Capuska. This is an open-access article distributed under the terms of the Creative Commons Attribution License (CC BY). The use, distribution or reproduction in other forums is permitted, provided the original author(s) and the copyright owner(s) are credited and that the original publication in this journal is cited, in accordance with accepted academic practice. No use, distribution or reproduction is permitted which does not comply with these terms.
*Correspondence: Richard Grainger, cmljaGFyZC5ncmFpbmdlckBzeWRuZXkuZWR1LmF1