 Alexandra Kinnby1*
 Per R. Jonsson1,2
 Olga Ortega-Martinez1
 Mats Töpel1
 Henrik Pavia1
 Ricardo T. Pereyra1
 Kerstin Johannesson1
- 1Department of Marine Sciences, Tjärnö Marine Laboratory, University of Gothenburg, Strömstad, Sweden
- 2Environmental and Marine Biology, Åbo Akademi University, Turku, Finland
Climate change-related effects threaten species worldwide; within-species populations may react differently to climate-induced stress due to local adaptation and partial isolation, particularly in areas with steep environmental gradients. Populations of the marine foundation seaweed Fucus vesiculosus are established over a steep salinity gradient at the entrance of the brackish water in the Baltic Sea (NE Atlantic). First, we analyzed the genetic differentiation among populations using thousands of genetic markers. Second, we measured the physiological tolerance to reduced salinity, a predicted effect of climate change in the study area, by measuring growth, phlorotannin (defense compounds) content, and maximum photochemical yield in tissue of the same individuals exposed to both current and projected future salinities. Our results show that despite short geographic distances (max 100 km), most populations were genetically well separated. Furthermore, populations responded very differently to a salinity decrease of four practical salinity units (psu) corresponding to projected future salinity. At the high salinity end of the gradient, some populations maintained growth at the cost of reduced phlorotannin production. However, at the low salinity end, mortality increased and growth was strongly reduced in one population, while a second population from similar salinity instead maintained growth and phlorotannin production. Among genetic markers that appeared as outliers (showing more genetic differentiation than the majority of loci), we found that four were associated with genes that were potential candidates for being under selection. One of these, a calcium-binding protein gene, also showed a significant genotype–phenotype relationship in the population where this genetic marker was variable. We concluded that local selection pressure, genetic affinity, and possibly also population history could explain the very different responses to reduced salinity among these populations, despite being from the same geographic area. Our results highlight the importance of local perspective in the management of species.
Introduction
Coastal ecosystems are variable environments and so naturally stressful, which places adaptive demands on the species that live there. If the environmental variation is within an organism’s tolerance range and occurs over a short term, pre-existing physiological responses will cope with the stress (Bennett et al., 2015). However, recurrent environmental stress outside the tolerance limit of some individuals will induce a selective pressure removing individuals of low fitness, and potentially adapting the population to the new conditions. However, adaptation may only take place if there is sufficient genetic diversity in heritable traits influencing the fitness of individuals (Pigliucci, 2001). The degree of the genetic variation, in turn, is shaped by the demographic history of the population and its connectivity to other populations (Hewitt, 1999; Van Belleghem et al., 2018).
One key variable that affects coastal populations of marine organisms is salinity, as it has great effects on physiological processes involved in metabolic stress (Tomanek, 2011). Salinity can change dramatically over short spatial and/or temporal scales (Gagnaire et al., 2006), due to, e.g. rainfall, tidal currents, upwelling, and freshwater input from rivers (Kirwan and Megonigal, 2013). In some areas, these changes are short-lived, while in others they can be permanent indicators of a new regime. Changes may occur either to saltier and cooler conditions, as observed in Mediterranean regions (Schroeder et al., 2016), or warmer and fresher as in the semi-enclosed Baltic Sea (Björck, 1995). At the entrance of the Baltic Sea, one of the largest brackish waterbodies in the world, deep water of high salinity from the North Sea meets a surface layer of brackish water exiting the Baltic Sea (Snoeijs-Leijonmalm and Andrén, 2017). In this entrance area around the Danish straits with strong horizontal and vertical gradients, relatively small changes in wind forcing and currents can rapidly change surface salinity at local scales (Bendtsen et al., 2009; Maar et al., 2011).
Under global warming, increased precipitation in the Baltic Sea drainage area is expected to decrease salinity further in this brackish water basin (Saraiva et al., 2019). These climate-related effects have already led to a 1 psu decrease in sea surface salinity in the southern Baltic Sea from 1977 to 2007 (Vuorinen et al., 2015). In addition to a gradual decrease in mean salinity, surface water is expected to show higher frequency of short-term, extreme events of heat waves and high precipitation (Lehmann et al., 2015; Meier et al., 2019). Such a decrease together with more extreme events is expected to severely increase the stress of marine populations in the area, not least sessile species such as fucoid seaweeds. In temperate shallow hard-bottom ecosystems, these are the predominant, foundational seaweeds, providing shelter and food for various invertebrate and fish species (Råberg and Kautsky, 2007; Wikström and Kautsky, 2007).
Recent modeling studies show that Fucus vesiculosus will shift its distribution in this area during the next century as a consequence of the projected decrease in salinity (Jonsson et al., 2018; Kotta et al., 2019). This species is remarkably plastic and tolerant to a large range of salinities, but experimental studies have shown that growth rate will be negatively affected when individuals from full marine salinity (North Sea) are moved to Baltic Sea salinities (Bäck et al., 1992b; Johansson et al., 2017). Interestingly, in these experiments, Baltic Sea individuals showed higher growth in extremely low salinity (<4 psu) than in full salinity, indicating local adaptation of Baltic Sea populations to low salinity. Populations of F. vesiculosus from this low salinity area contain 50% higher phlorotannin levels than North Sea individuals (Nylund et al., 2012). Phlorotannins are polyphenolic metabolites in brown seaweeds with multiple roles at both cellular and organismal levels, including deterring grazing, however phlorotannins are costly to produce (Pavia et al., 1999).
Öresund, the strait separating Sweden and Denmark at its narrowest point, is right at the opening of the Baltic Sea to the North Sea, and over a geographic distance of ∼100 km, a steep salinity gradient is established from 10 psu in the south to 18 psu in the north. In this area, populations of F. vesiculosus might be under divergent selection and locally adapted to different ambient salinities, and potentially also different in their tolerance to shifts in salinity. In addition, more general genetic differences among populations might be due to different degrees of connectivity to populations outside Öresund or to different demographic histories as found in other organisms in this area (Nikula et al., 2007; Le Moan et al., 2019).
We combined a common garden approach with genome-wide DNA sequencing to test for the presence of genetic differences that correlated with tolerance to an immediate decrease in salinity. The decrease was chosen to correspond to short-term variations in salinity in this area that are expected to increase in frequency and intensity with climate change. The experimental treatment further corresponds to the projected average salinity in the year 2100, although in our experimental situation it represents an acute stress to decreased salinity rather than a gradual accumulated climate-induced stress. We assessed the response of decreased salinity by measuring the performance of three phenotypic traits (growth, phlorotannin content, and maximum photochemical yield) in new-grown parts of thalli of individuals of F. vesiculosus. In order to test the same genotype in both its original average salinity (control) and its decreased salinity (4 psu lower than control), each original thallus was divided in two parts, one grown under control conditions and the other under treatment conditions. All three traits can be susceptible to stress, and we expected them to react to the immediate and sublethal stress levels caused by the salinity decrease. We used the sequencing data to guide our interpretation with respect to population relatedness and the potential of local adaptation.
Materials and Methods
Projection of Future Salinity
Future mean salinity in the transition between the Baltic Sea and the Kattegat was projected using the coupled physical-biogeochemical model RCO-SCOBI (the Swedish Coastal and Ocean Biogeochemical model coupled to the Rossby Centre Ocean circulation model; Eilola et al., 2009). In this study, we focused on the higher end of projected salinity change, and we assumed the A1B emission scenario (similar to scenario RCP 6.0 in IPCC, 2013) for the atmospheric forcing of the three-dimensional circulation model. RCO-SCOBI with a horizontal resolution of 3.7 km (2 NM) was forced by regionalized atmospheric data from the global climate model ECHAM5 (Roeckner et al., 2006) using an atmospheric horizontal grid of 25 km. The A1 scenario group assumes a future world of rapid economic growth, a global population that peaks in mid-century, and the introduction of new and more efficient technologies (Nakićenović et al., 2000). Salinity fields were projected for the period 2070–2099 and compared to the reference period 1978–2007 (Meier et al., 2012). During the season June–August, we used the maximum decrease in salinity in surface water (0–12 m) to guide the selection of the experimental treatment of a 4 psu reduction in salinity. Climate change is also expected to increase the frequency and intensity of extreme events in both temperature and precipitation (Lehmann et al., 2015; Meier et al., 2019). A decreasing surface salinity in the Baltic Sea with a steeper gradient toward the North Sea together with extreme events may lead to more dramatic short-term variations in salinity along the Danish straits.
Sampling and Experimental Set-Up
Individuals of F. vesiculosus were collected, all at least 2 m apart, from six sites in the Öresund strait; three sites on the eastern side (Nyhamnsläge, Landskrona, and Falsterbo in Sweden, from here on referred to as populations S1, S2, and S3, respectively) and three sites on the western side (Hornbæk, Humlebæk, and Dragør in Denmark, from here on referred to as populations D1, D2, and D3, respectively; Supplementary Table S1). The six sites were selected to represent high, medium, and low salinities of the area, from north to south, and the eastern and western sites as natural replicates for similar salinities (Figure 1). At each site, 24 individuals were collected and transported to the lab, wrapped in newspaper soaked in seawater and placed in a cooler (transportation took approximately 24 h on June 16–17th, 2017). All individuals were approximately 20 cm long, had 15–20 apical tips, and showed no signs of receptacle formation. Five apical tips were cut from each individual directly in the field and transported cold and stored in −80°C before DNA extraction and genotyping were done.
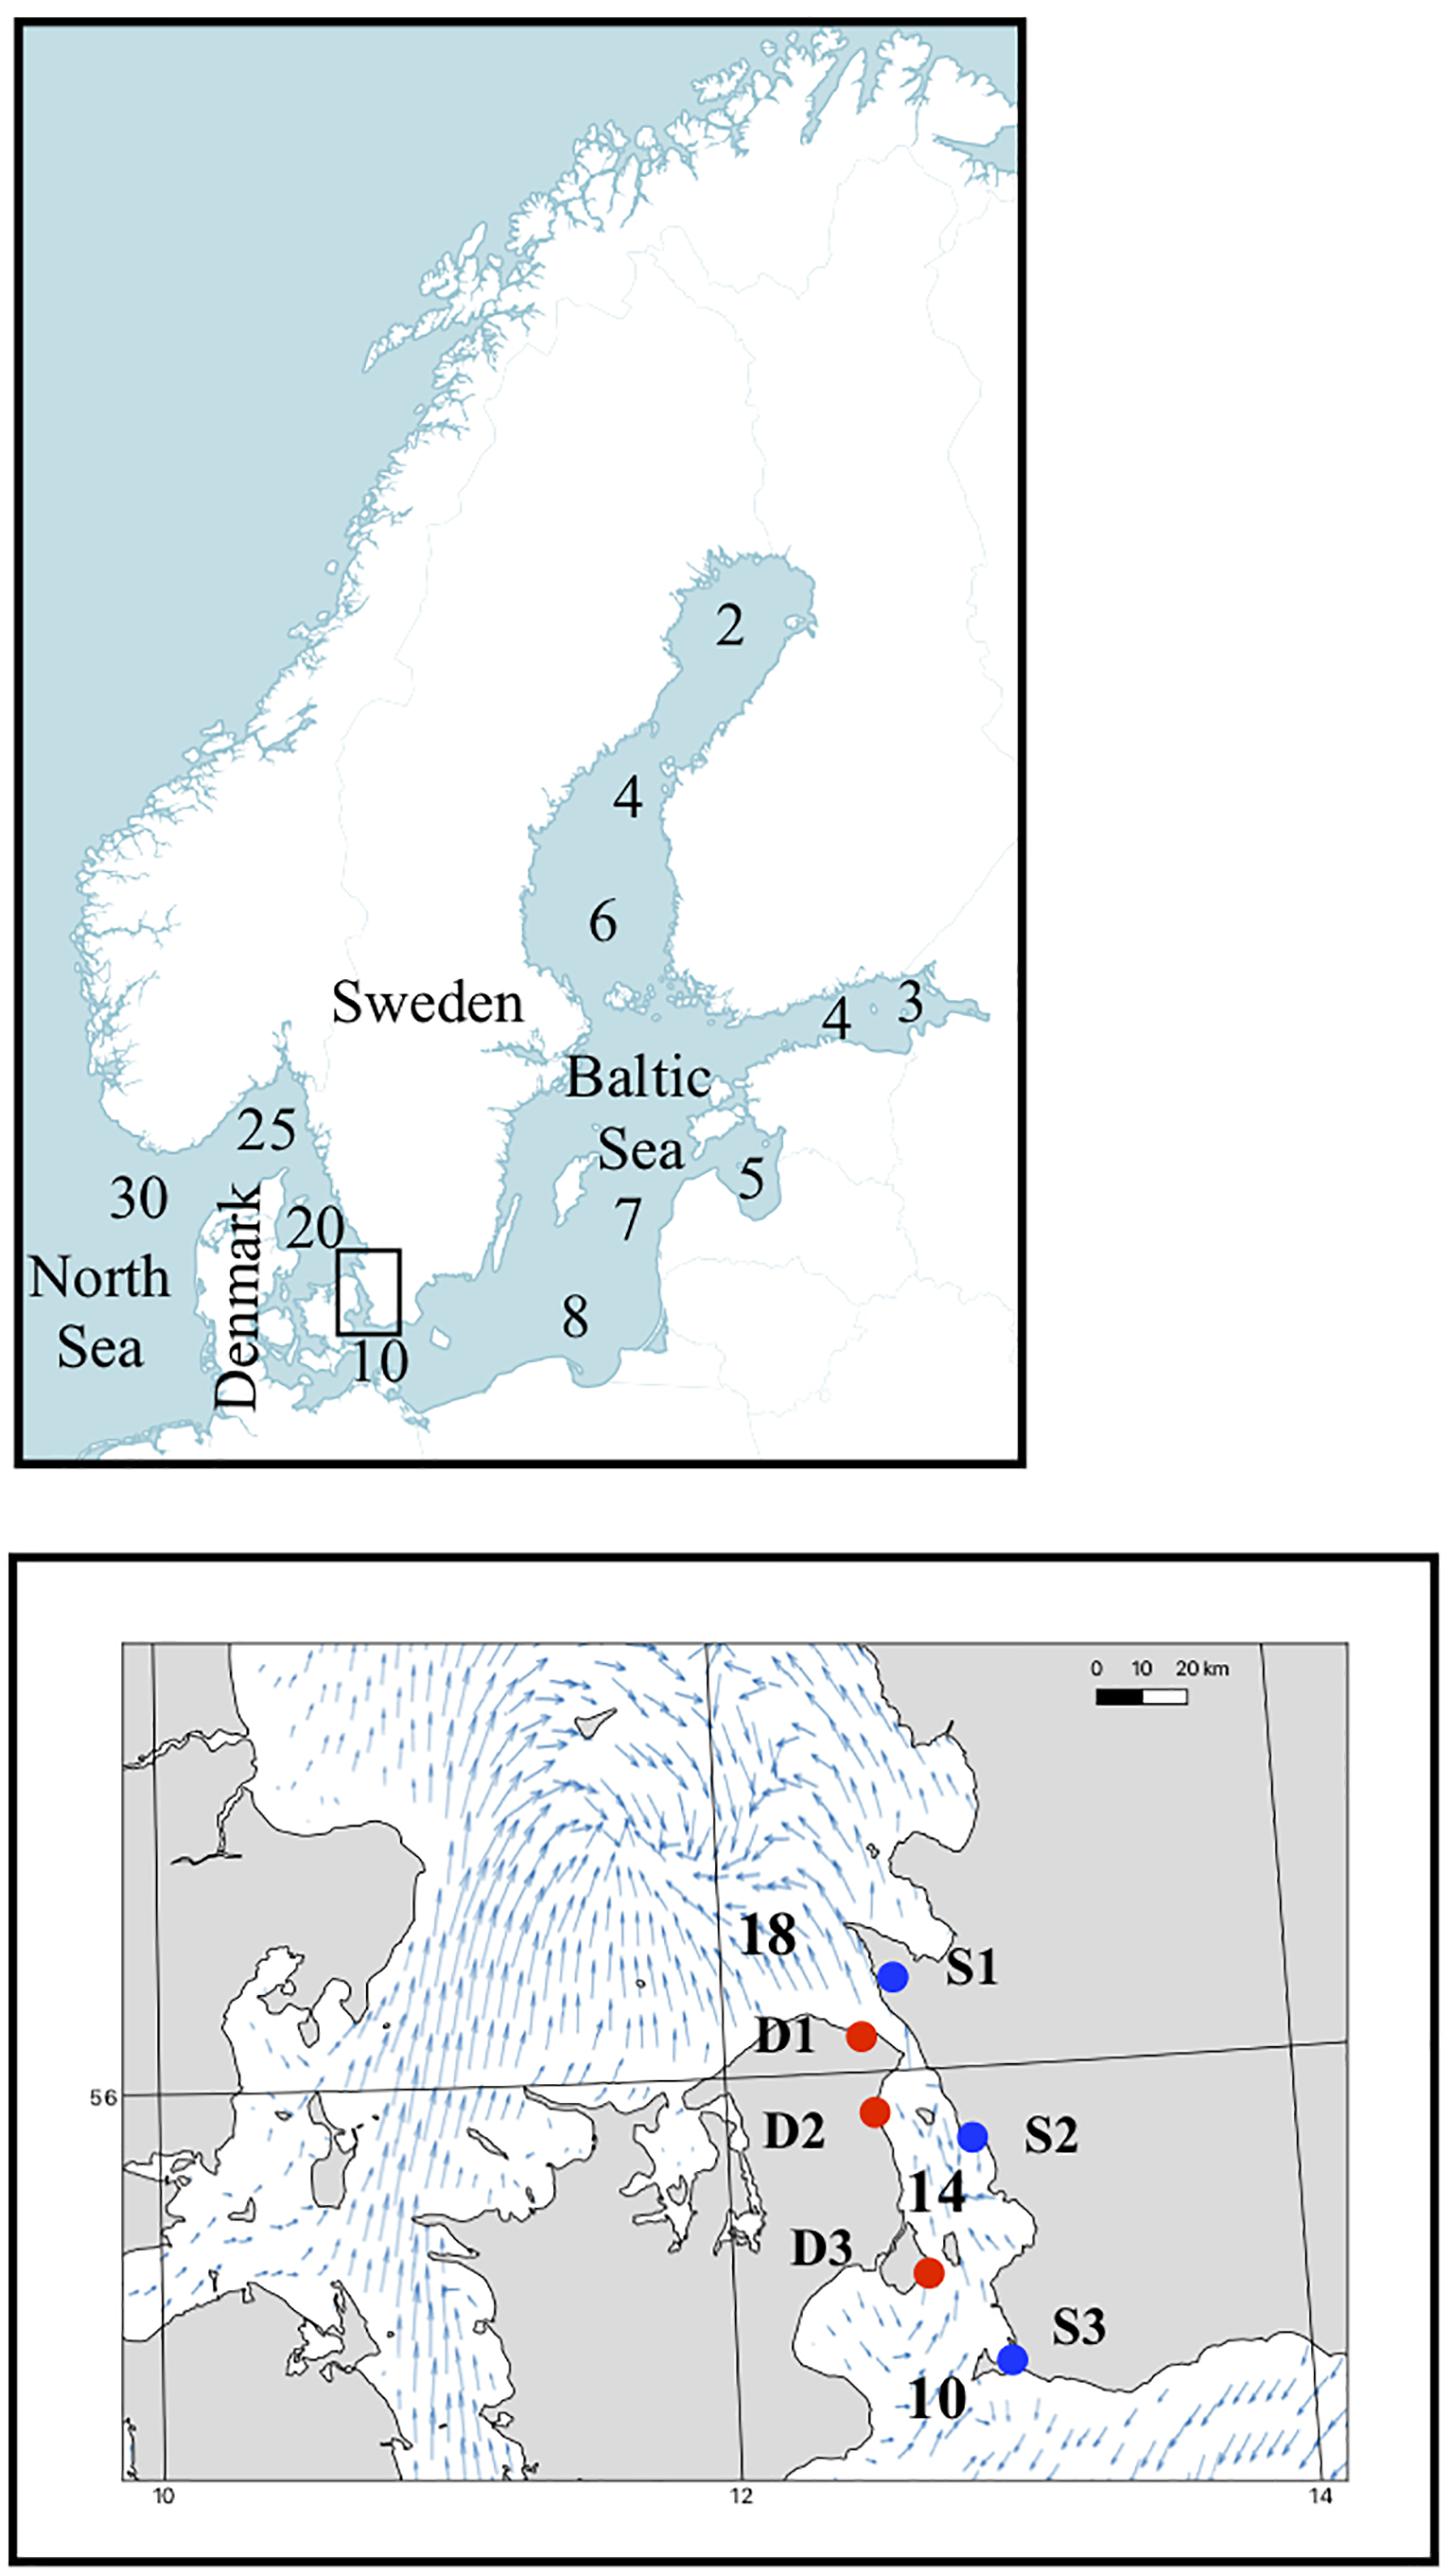
Figure 1. Map of the study area and salinity gradient. Red dots represent the sites on the Danish side of the Öresund strait and the blue dots represent the Swedish sites, numbers on the map are average salinity values. Mean velocity field of modeled surface currents in southern Kattegat and the Öresund strait. Based on the circulation model NEMO-Nordic (Hordoir et al., 2019), currents in the surface layer (0–3 m) for the months June, July, and August were averaged for the years 1995–2002.
For the experiment, each algal thallus was split into two parts; one half was put in water with the current average salinity from the sample site (“control”) and the other at 4 psu lower salinity (“treatment”). The holdfast of each thallus was attached to a weight, and due to positive buoyancy from floating bladders, each thalli was kept in an upright position in a separate 12-L plastic bag. Each bag had a continuous flow-through (0.5 L/min) of sea water, and ventilation and turbulence was continuously generated through an air stone. Experimental salinities in the bags were controlled by AQUA MEDIC Conductivity monitor and controller, regulating a solenoid valve system. The salinity in the bags was continuously measured, and when it rose above the set value, the solenoid valves opened to increase the freshwater input to the system until the salinity dropped to the listed experimental value. The plastic bags were submerged, with sufficient space so there was no shading of neighboring algae, in a larger tank with a flow through of ambient temperature (17°C ± 1°C) water to ensure the same temperature in all experimental bags. The large tank was placed outside and partially shaded to mimic the conditions at 1 m depth; all thalli were exposed to the same ambient light conditions (approximately 600 μmol m–2s–1 average peak daily value) during the 45-day experimental period (June 19 to August 3, 2017). As the same genotype was exposed to both control and treatment salinities, phenotypic values represented the reaction norms of the individual genotypes (n = 24).
Phenotypic Traits
In each thallus, split in halves, a thread was sewn into three apical tips making it possible to measure the increase in tip length (Johannesson et al., 2012) from photographs taken at the beginning and at the end of the experiment using ImageJ (Schneider et al., 2012). The growth for each thallus was taken as the average of these three estimates (all raw data presented in Supplementary Table S2). Data were analyzed using a paired t-test to detect any differences in growth between the halves of the same individual exposed to present and future salinity.
At the end of the experimental period, the maximum photochemical yield (Fv/Fm – variable fluorescence/maximum fluorescence) was measured in the tissue that had been formed during the experiment. The tissue was dark-adapted for 10 min, the fiber optics were held at a fixed 10 mm distance from the algae, and measurements were taken with a PAM (pulse amplitude-modulated fluorometer; Walz, Effeltrich, Germany). To test for differences in photosynthetic performance, data were analyzed using a paired t-test between the halves of the same individual exposed to current and future salinity.
Apical tips (i.e., the tissue formed during the experiment) were cut from each thallus half at the end of the experiment and immediately frozen at −60°C for phlorotannin analysis. The tips were freeze-dried and homogenized to a powder. From each sample, 10 mg of the powder was used for extraction in 60% acetone, and the phlorotannin content in each was quantified colorimetrically using the Folin–Ciocalteu method (van Alstyne, 1995). Phloroglucinol (1,3,5-trihydroxybenzene, art. 7086; Merck, Darmstadt, Germany) was used as a standard, and the absorbance was measured at 725 nm after 2 h of incubation in the dark. Phlorotannin content in the respective halves was analyzed using a paired t-test to detect any differences.
For analysis of the phenotypical traits, the Benjamini–Hochberg procedure was used for correction of multiple testing (Benjamini and Hochberg, 1995).
Correlation Among Traits
In order to study whether the phenotypic traits that we measured were inherited independently or not, we analyzed the net changes in the various phenotypic expressions between sample halves placed in the treatment salinity and current salinity, i.e., the net change in phenotypic expression of each genetic individual using correlation analyses within each population.
Local Adaptation
Our experimental design with co-occurring salinities between control and treatment between different populations allowed us to evaluate the possibility of local adaptation in the phenotypic response variables (i.e., growth rate, phlorotannin content, and maximal photochemical yield). Thus, we compared thalli of different origin grown under the same conditions, that is, in the same salinity. For example, thalli originating in 10 psu and grown in their native salinity were compared to thalli originating in 14 psu but grown in 10 psu salinity using t-tests; the Benjamini–Hochberg procedure was used for correction of multiple testing (Benjamini and Hochberg, 1995).
DNA Extraction and Genotyping
Genomic DNA was extracted following Panova et al. (2016). Algal apical tissue was ground and washed with 100% acetone twice previous to digestion in CTAB buffer. DNA was precipitated and washed using the DNA Plant II Extraction Kit (Qiagen). The eluted DNA was further cleaned up using the DNA Clean and Concentrator Kit-25 (Zymo). DNA quality and integrity were assessed using Nanodrop on a 1% agarose gel. DNA quantification was performed with a Qubit dsDNA Broad Range Assay Kit (Invitrogen-ThermoFisher Scientific). DNA of 20 individuals from each locality was extracted, from which four individuals from each locality were also used as technical replicates (i.e., replicated extraction, library preparation and sequencing). Individual 2b-RAD libraries (Wang et al., 2012) were prepared following a laboratory protocol from Galina Aglyamova and Mikhail Matz available at https://github.com/z0on/2bRAD_denovo. Briefly, the 2b-RAD libraries were prepared individually, and DNA from each sample was digested using a 2b-type enzyme that targets two restriction sites that encompass a 36-bp DNA fragment. The libraries were individually barcoded, and the fragment selection was performed by excising the amplicon band from an agarose gel. Gel fragments were cleaned using a MinElute Gel Extraction Cleaning Kit (Qiagen) and pooled equimolarly into 20 individual population sets (plus technical replicates) per sequencing lane. The pooled libraries were then sequenced on the Illumina HiSeq2500 platform, generating 50 bp single-end sequences, at the Science for Life Laboratory (SciLifeLab)—Genomics, SNP&SEQ Technology Platform in Uppsala University, Sweden.
The bioinformatic analysis was performed using the computer cluster “Albiorix” at the University of Gothenburg, Sweden. The analysis followed a modified de novo pipeline available at https://github.com/crustaceana/TheFucusProject, originally developed by Mikhail Matz1. Sequences were trimmed and quality filtered before clustered into RAD tags with a minimum depth of 20 reads. Genotype calling was performed with a minimum depth of 5 to call homozygotes, a maximum acceptable proportion of 0.8 for heterozygotes at a locus, and minimum 20 observations for each allele across all samples. The technical replicates were used for non-parametric quantile-based recalibration of variants. Loci exceeding 75% heterozygotes were removed. The data were preliminarily thinned to retain one SNP per RAD fragment, where each fragment had <50% of missing data. Technical replicates were subsequently removed from the dataset. Further thinning was performed using Poppr (Kamvar et al., 2014) to remove loci or genotypes with >5% missing data and to only retain informative loci with at least two differing observations. The samples from population D2 showed unusually large heterozygosity deviations, possibly produced by sample contamination, and were therefore removed from further analysis.
Genetic Diversity and Population Differentiation
Observed (Ho) and expected (He) heterozygosity, as well as inbreeding coefficients (FIS), were calculated across sites using the R package radiator (Gosselin et al., 2020). To get an overview of the diversity distribution, Adegenet R (Jombart and Ahmed, 2011) was used to transform the data into principal components and partition the variance using multivariate discriminant analysis (DAPC, Jombart et al., 2010). This method maximizes the discrimination between groups to identify genetic clusters, and this was cross-validated using Poppr. Individually-based Bayesian clustering was further used to identify individual proportions of genetic ancestry using STRUCTURE (Pritchard et al., 2000) with a burn-in length of 10,000 and 50,000 Markov Chain Monte Carlo (MCMC) chains. CLUMPAK (Kopelman et al., 2015) was used to plot the STRUCTURE results and STRUCTURE HARVESTER (Earl and Von Holdt, 2012) to identify the most likely number of K genetic clusters that best describe the data.
Detection of Putative Loci Under Selection
Arlequin 3.5.2.2 (Excoffier and Lischer, 2010) was first used to identify putative loci under selection given the possibility of a hierarchical population structure over the sampled salinity gradient. This method, however, has been shown to produce high error rates and relatively high number of false positives (Narum and Hess, 2011). Therefore, a Bayesian analysis of outliers was also performed with Bayescan 2.1 (Foll and Gaggiotti, 2008) using 20 pilot runs of 5,000 iterations each, a burn-in period of 50,000 and 50,000 MCMC chains. Loci were considered outliers with a highest posterior density interval (HPDI) of >95%. Only those overlapping loci from the two methods were used for subsequent analyses. These loci were mapped to an unpublished reference draft genome of F. vesiculosus which is available on NCBI (BioProject accession number: PRJNA629489). Annotation of the putative loci under selection was performed by Blastx match to the NCBI protein database and UniProtKB search. While excluding outliers from population structure analysis may illustrate the effects of ongoing gene flow among populations as opposed to the demography and population history shown with the inclusion of these loci, the main patterns of our results remained fundamentally unchanged without the outlier loci, and thus, the results presented include all loci.
Tests of Phenotypic Effects Linked to Outlier Genotypes
In the four outlier SNP loci that we were able to functionally annotate (see section “Results”), we compared phenotypic performance in current and future salinities by estimating net growth as (net growth) = (growth in future salinity) − (growth in current salinity), and in a similar way, we estimated net content of phlorotannins among individuals of different genotype (homozygotes for the major allele, heterozygotes, and homozygotes for the minor allele).
Results
Phenotypic Traits
Phenotypic performance in F. vesiculosus from the study region was different between current and future salinities in at least 8 of 18 tests. In future salinities, growth was lower in three populations (S2, D2, and D3), phlorotannin content was lower in four populations (S1, S2, D1, and D3), and maximum photochemical yield was lower in one population (D3) (Figure 2 and Supplementary Table S3).
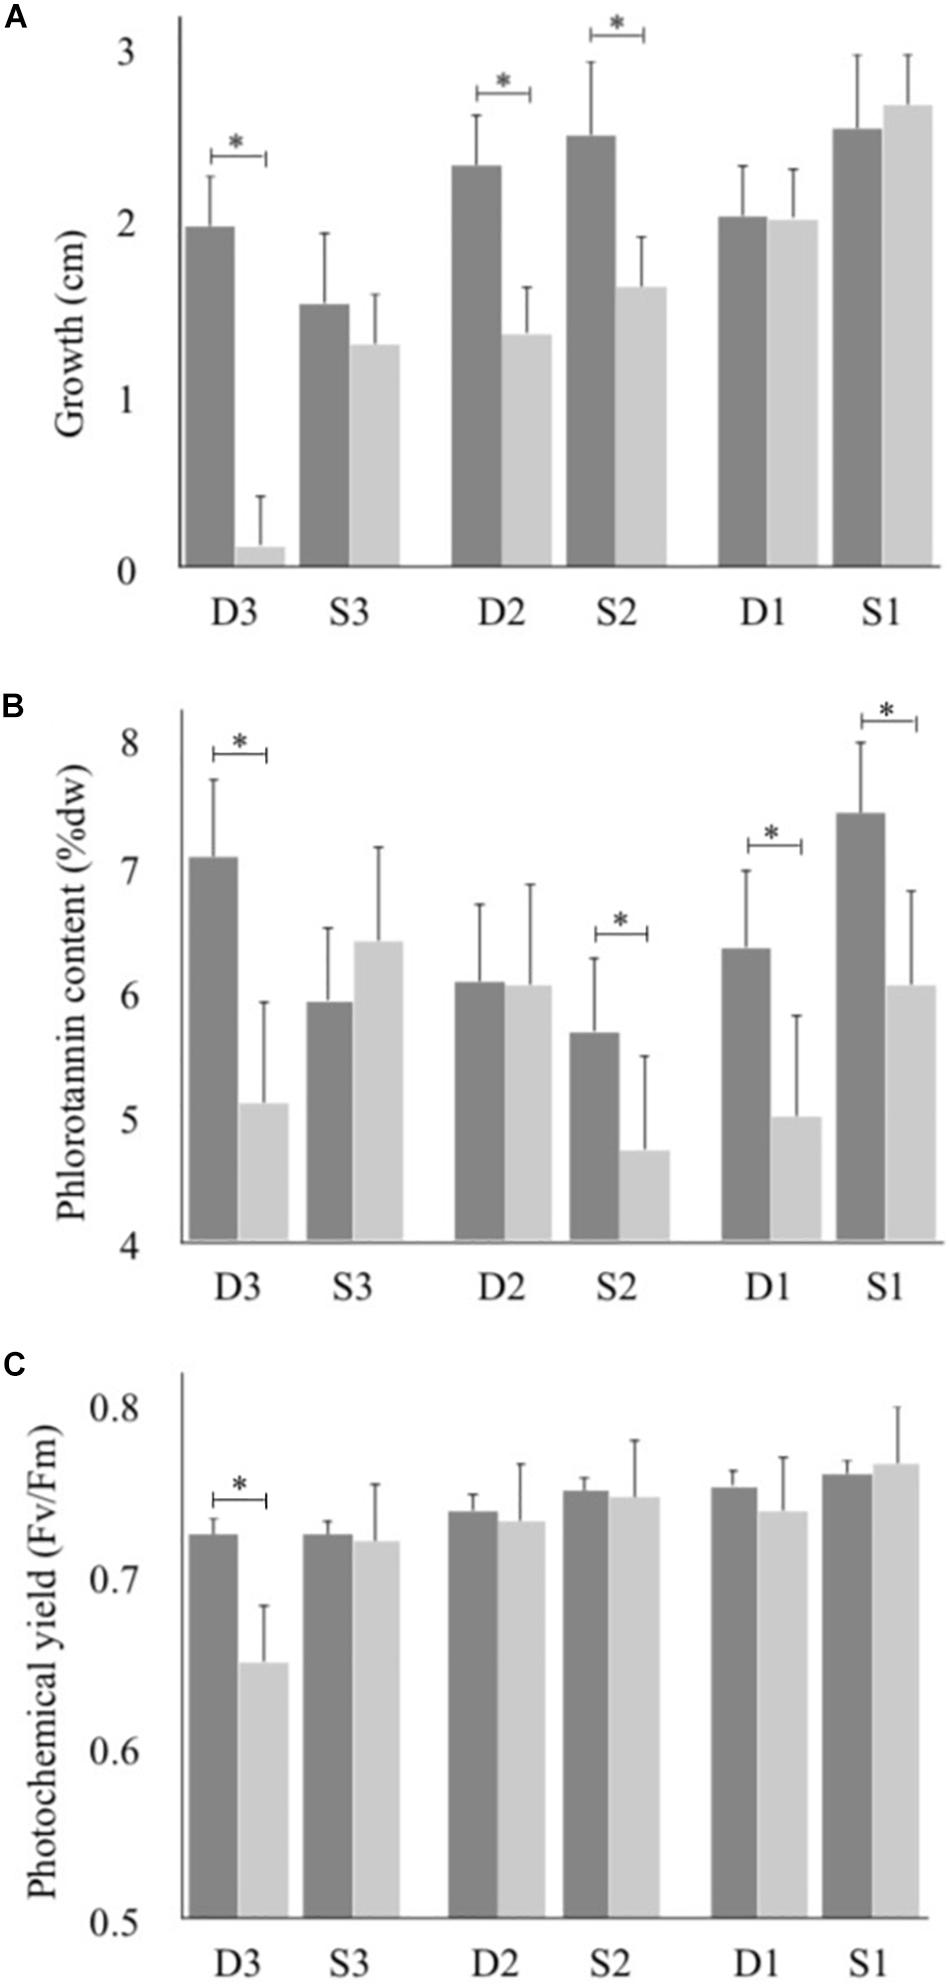
Figure 2. (A) Growth measured as increase in length, (B) Phlorotannin content, (C) Efficiency of photosystem I (Fv/Fm). Dark bars represent current conditions and light bars represent future conditions, values are means ± 95% CI, n = 24. Data analyzed with paired t-tests for effect of treatment within populations of Fucus vesiculosus grown in ambient and future salinities under 45 days; statistical differences within populations are denoted with asterisk.
Correlation Among Traits
Growth and photochemical yield were strongly correlated in population D3, and phlorotannin content and photochemical yield were correlated in the population S1 (Supplementary Table S4). No significant correlations were found for the remaining traits and populations, suggesting that in most cases, traits were independently affected by the decrease in salinity.
Local Adaptation
Phenotypic performance differed in half of the comparisons between populations grown in the same salinities during the experiment (Supplementary Table S5). In three of these cases, the populations originating from a higher salinity than the treatment salinity had a lower phlorotannin content than the populations originating from the same salinity [D1 (future salinity) – D2 (current salinity); S2 (future salinity) – S3 (current salinity); D2 (future salinity) – D3 (current salinity)]. In one case, the population from a higher salinity grew less than the population kept in its native salinity [D2 (future salinity) – D3 (current salinity)]. In two other comparisons, the photochemical yield was higher in the treatment populations than in the populations maintained in their native salinity [S1 (future salinity) – S2 (current salinity); S2 (future salinity) – S3 (current salinity)]. As all the measurements were done on tissue that was formed during the experimental period, these results suggest various types of local adaptation among the populations.
Genotyping Summary and Genetic Population Structure
Individual RAD libraries produced 1.5–18.7 (median: 10.4) million reads per individual. Technical replicates rendered 8,011 SNPs that were used as “true” SNP dataset for recalibration of variants. The dataset resulted in 23,209 SNPs that comprised a final set of 18,148 final loci and 94 individuals after filtering, with 6 individuals removed due to poor genotyping. Genome-wide individuals’ mean observed heterozygosity as well as missing data are shown in Supplementary Figure S1. The genetic diversity within populations was similar across all populations (Ho range 0.184–0.190) with non-significant negative FIS values (Supplementary Table S6).
The analysis of genetic differentiation showed that populations were clearly separated. The DAPC analysis showed cohesive groups corresponding to the geographic sampling localities (Figure 3) and a separation of the southernmost populations (D3 and S3) from the rest. These results were corroborated by the individually based assignment tests that also showed two groups with the highest likelihood of ancestry (K = 2 the most likely number of clusters), again clearly grouping the southernmost populations together, although K = 3 also revealed further separation of the remaining populations (Figure 4). Thus, the overall pattern appears as if there are gradual increasing differences among populations either reflecting weak stepping-stone gene flow or historical demographic patterns.
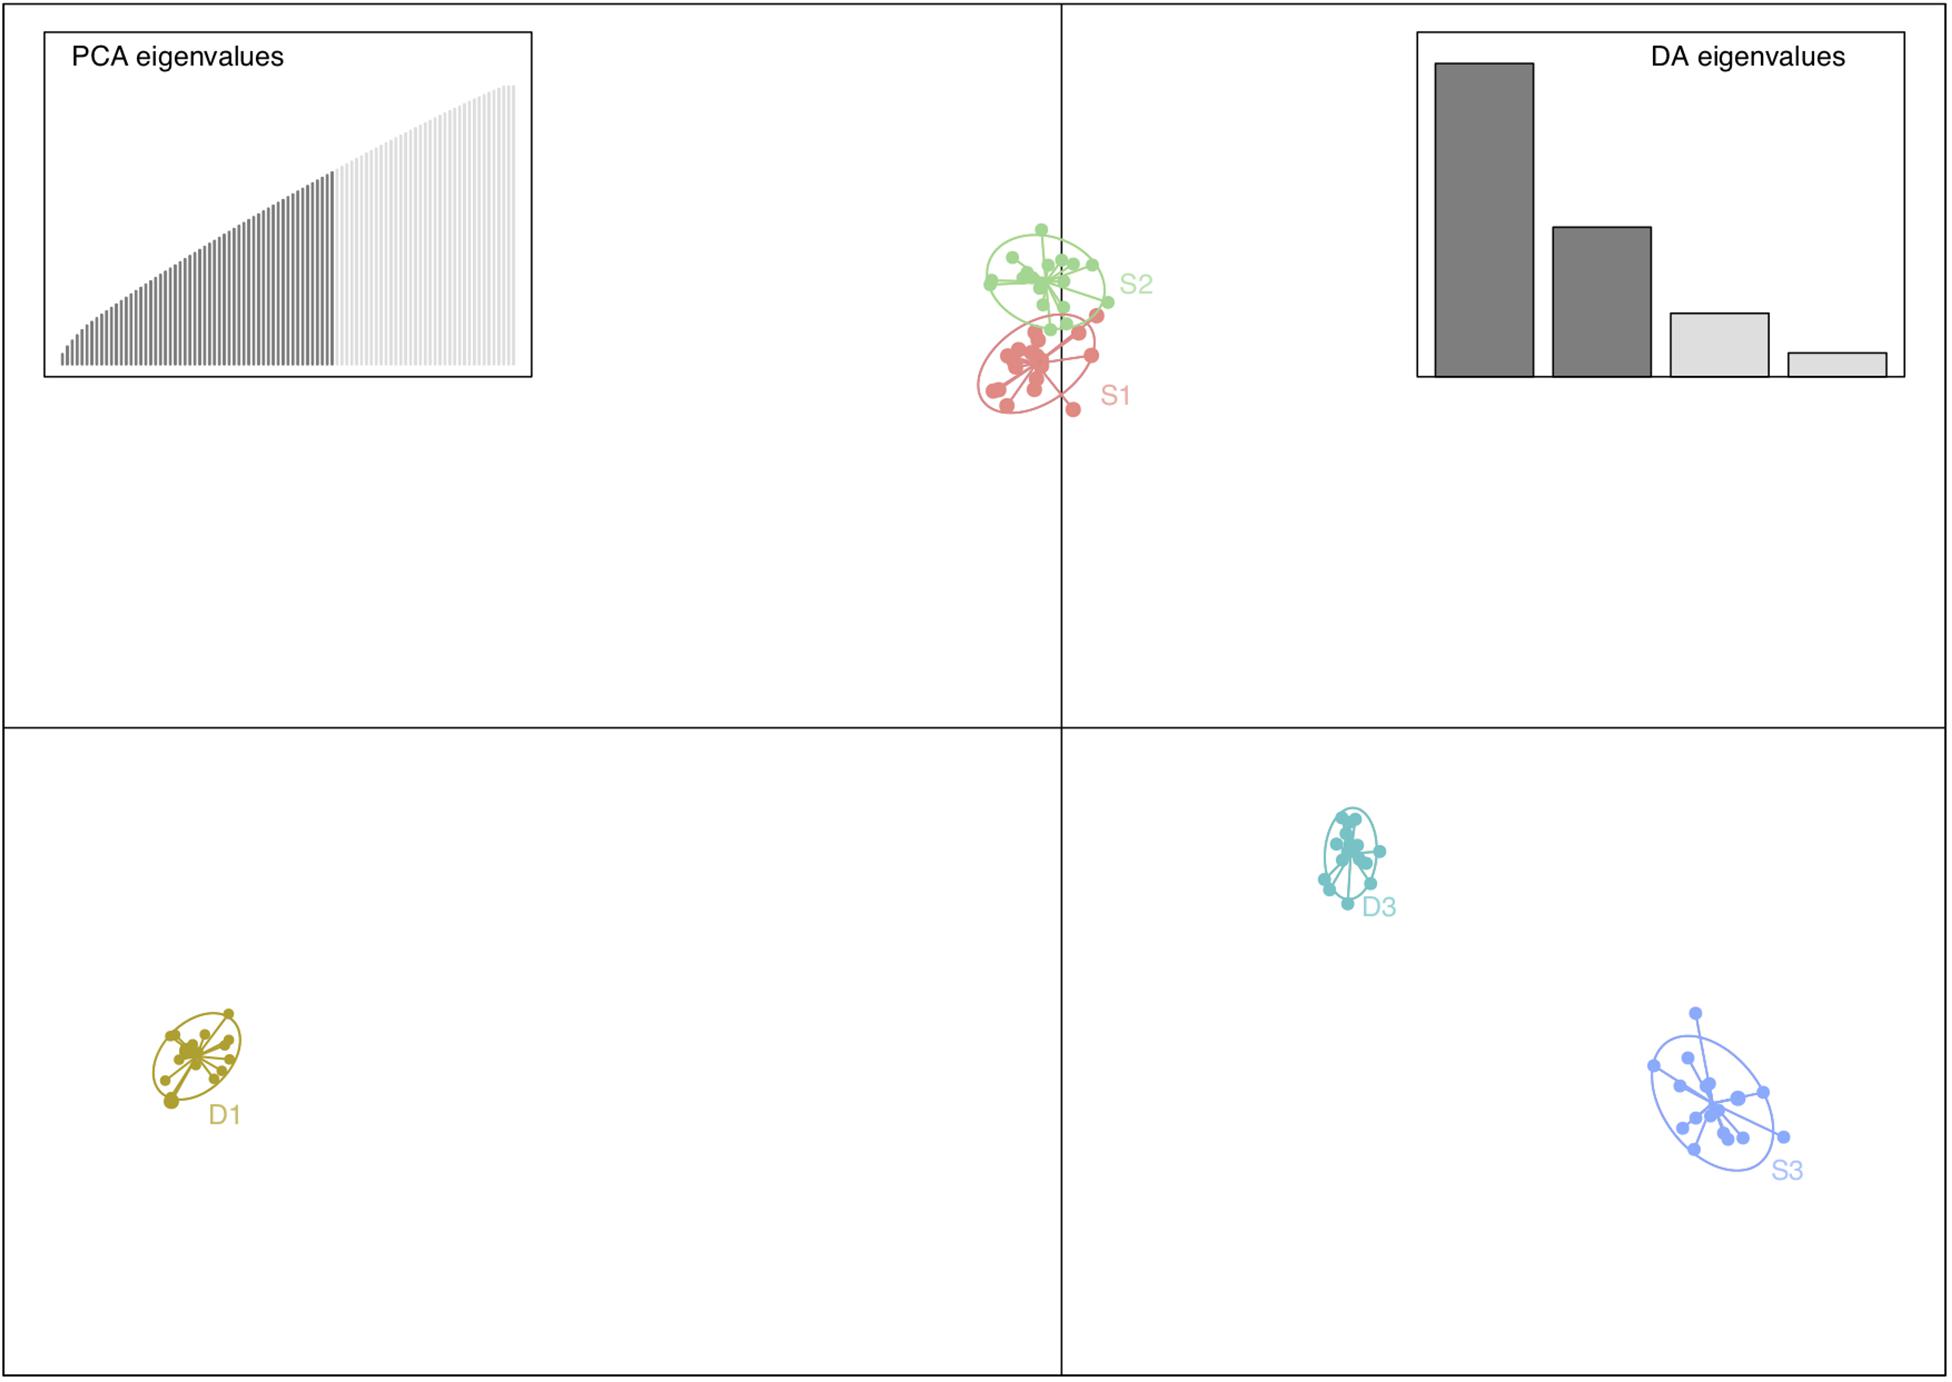
Figure 3. Discriminant analysis of principal components (DAPC) showing that populations of Fucus vesiculosus, from the Öresund region, were clearly separated. The axes represent the first two linear discriminants. Colors indicate different populations, S indicates populations from the Swedish side of the strait, and D indicates populations from the Danish side. The subscripts 1–3 indicate populations from north to south (see Figure 1). The subplots show the number of principal components (PCA) and discriminant eigenvalues (DA) retained.
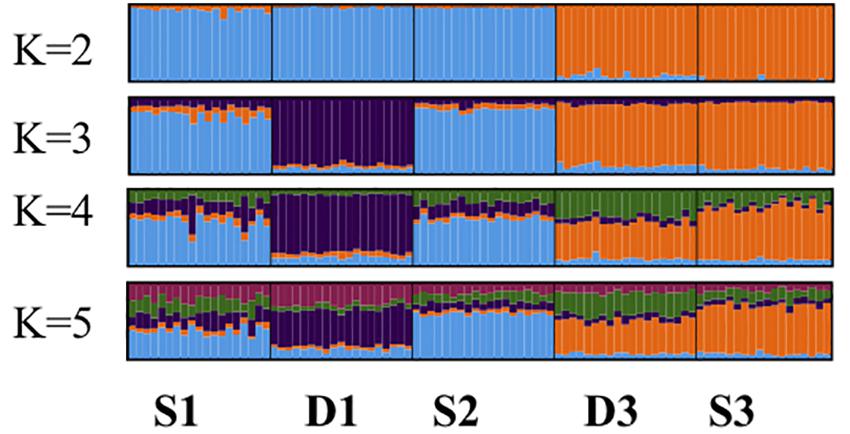
Figure 4. STRUCTURE analyses of five populations of Fucus vesiculosus from the Öresund strait. K = 2 is the most likely number of clusters. S indicates populations from the Swedish side of the strait and D indicates populations from the Danish side. The subscripts 1–3 indicate populations from north to south (see Figure 1).
Putative Loci Under Selection
Fifty-one loci were detected with Arlequin over the 0.99 FST null distribution quantile and 74 loci above the 95% HDPI using Bayescan. In total, 33 loci overlapped from the two approaches which were used for annotation (Supplementary Figure S2). From those loci, 25 were identified in the draft genome assembly of F. vesiculosus, with 11 hits in NCBI and four of these with annotated matches also in the NCBI- and/or the UniProtKB databases, the remaining 7 being hypothetical unknown proteins at large. These four were calcium-binding protein 1, Tyrosyl-DNA phosphodiesterase 1 (TDP1), protein LONGIFOLIA 1-like mRNA, and PAS/PAC sensor hybrid histidine kinase (Supplementary Table S7). The allele frequency of the TDP1 gene showed a homogeneous pattern across all populations except the northernmost population on the Danish side of Öresund (D1) which was polymorphic in this locus (Table 1). The LONGIFOLIA allele frequencies showed more variability across populations, with a well-defined north-south cline with one allele increasing and the other decreasing from north to south on both sides of Öresund (Table 1). In contrast, the frequency variation of the PAS/PAC gene indicated a west-east (Denmark–Sweden) differentiation with the most common or even dominant allele in the three Swedish sites showing the opposite pattern in all Danish sites (Table 1). The frequency of the calcium-binding protein gene showed that population S3 is rather different from the other five populations with a dominant allele that was never dominant in any other population (Table 1).
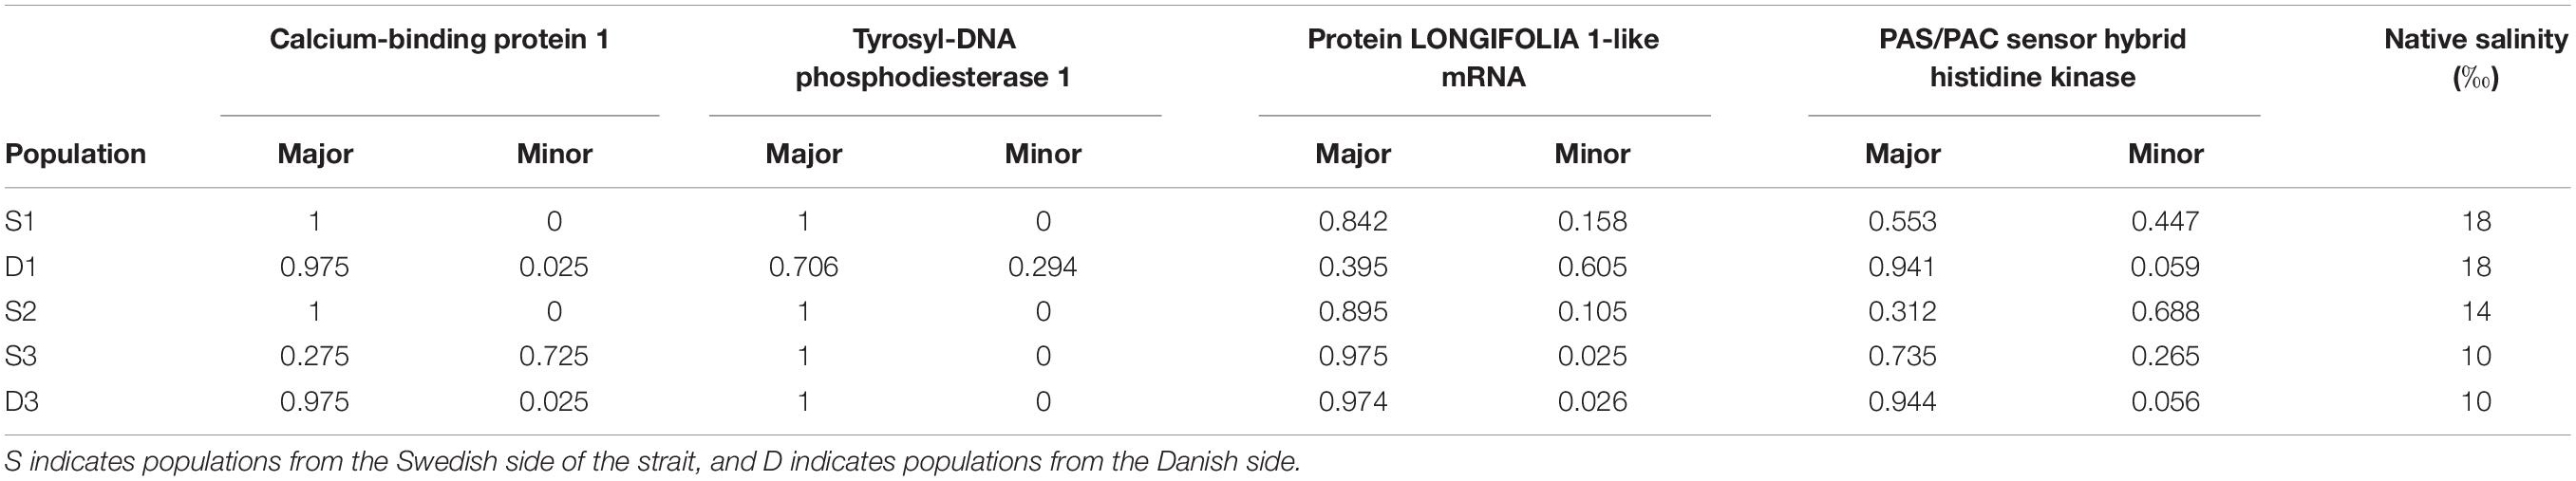
Table 1. Allele frequency of the four outlier loci of Fucus vesiculosus populations from Öresund.
We also compared phenotypic traits (net growth rate and net phlorotannin content) among groups of individuals of different genotypes (homozygotes for major alleles, heterozygotes and homozygotes for the minor alleles) for the four loci from the same population. We found one significant effect in population S3, where individuals that are heterozygote for the SNP associated with the calcium-binding protein grew faster than individuals that were homozygote for either the major or the minor alleles (Figure 5 and Supplementary Table S8). Notably, population S3 was the only population in which this locus was highly polymorphic, and the dominant allele in S3 was the overall minor allele at this locus (Table 1).
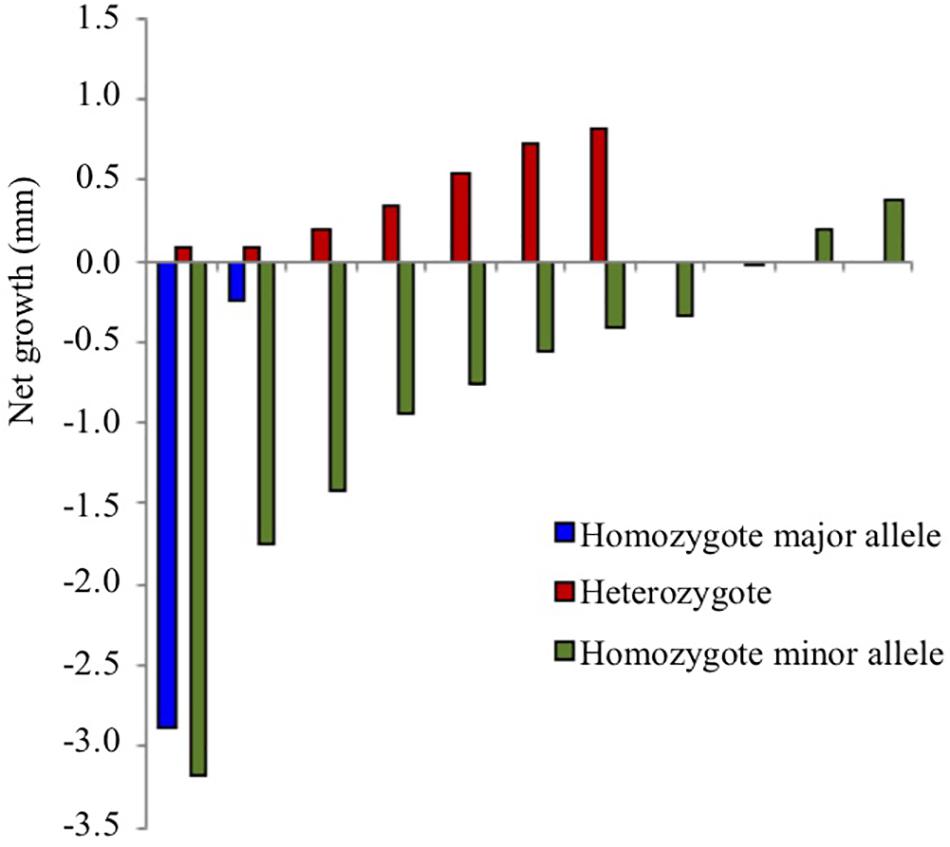
Figure 5. Growth reduction (growth in future salinity minus growth in current salinity) over 45 days in population S3 in individuals of different genotype for the SNP marker annotated to calcium-binding protein 1. Positive values indicate increased growth under 4 psu decreased salinity and negative values indicate decreased growth. Individuals of the same genotype are ordered along the x-axis according to net growth (for statistic evaluation see Supplementary Table S8).
Discussion
By focusing on a relatively small marine area overlapping a steep natural salinity gradient (Öresund, one of the Danish straits, 100 × 20 km), we show here that a large-scale stress (coastal salinity decrease) might affect populations within a small geographic area differently. A general pattern across phenotypic traits and populations was that performance decreased when individuals were exposed to lower salinities, however, with different specific responses among populations. For example, while two of the populations (D3 and S2) responded with both decreased growth and reduced phlorotannin content, one population (D2) only reduced in growth, and two other populations (D1 and S1) only reduced in phlorotannin content (Figure 2). Previous findings show that strongly reduced salinities negatively affect growth in F. vesiculosus; for example, a reduction from 20 to 10 psu (Nygård and Dring, 2008) or from 35 to 15 psu (Connan and Stengel, 2011a) had a negative effect on growth. Connan and Stengel (2011b) also showed reduced phlorotannin levels in F. vesiculosus tips exposed to low salinity (15 psu) compared to ambient salinity (35 psu) which is in line with previous research (review by Ragan and Glombitza, 1986). We found lower levels of phlorotannins in four of the six populations (S1, S2, D1, and D3) when exposed to lower salinity. In contrast, studies of F. vesiculosus in natural salinities have shown higher phlorotannin content in lower salinities, most likely due to a naturally higher grazing pressure (Nylund et al., 2012). Also, quantum yield and photosynthesis in F. vesiculosus have previously been found to decrease in experimentally lowered salinities (e.g., Nygård and Dring, 2008; Connan and Stengel, 2011b, respectively).
Overall, our results show decreased growth and reduced phlorotannin production caused by a much less dramatic decrease in salinity treatment than in earlier studies (e.g., Connan and Stengel, 2011b), which could be due to the naturally higher variability in salinity in this study area. Additionally, while some populations reduce growth, others reduce the costly production of phlorotannins, with the exception of population D3 that reduces both growth and phlorotannins and also was the only population with a negative response in photochemical yield (Figure 2). Indeed, the southernmost Danish population (D3) was the most heavily affected of all populations. This population was taken from 10 psu and exposed to the projected salinity of 6 psu. However, the southernmost population from the Swedish side (S3) was also sampled at 10 psu and treated with 6 psu, but maintained both growth and photochemical yield under the lower salinity (Figure 2). Optimal salinity for photosynthesis for F. vesiculosus from the Baltic Sea is 6 psu but 11–35 psu for populations from the Atlantic (Bäck et al., 1992a). It is known that ionic composition and osmotic regulation become problematic in many marine organisms below 7 psu due to a changed Ca2+/Cl– ratio which induces stress (Schubert et al., 2017). Thus, the shift from 10 to 6 psu might be more problematic for a population of more saline origin. The northbound current out of the Baltic Sea tends to be strongest along the Swedish coast, and the proximity of the most southern Swedish site (S3) to the Baltic populations of F. vesiculosus suggests that this population is more influenced by gene flow from Baltic populations than is the D3 site. Indeed, the high frequency in S3 of the otherwise very rare allele of the SNP locus in the Ca-binding protein corroborates such a difference. Interestingly, the high frequency of this “minor” allele in S3 might even suggest an adaptation to the skewed Ca2+ balance inside the Baltic Sea for this locus.
Local adaptation in phenotypic traits was most obvious in the two southernmost populations (D3 and S3) and in population D2. These populations responded more favorably in one or two phenotypic traits when compared to thalli transferred to the same salinity from a higher native salinity. These differences, combined with the differences in responses between populations visible in the phenotypic data, suggest that different populations may perform very differently under future decreased salinities. This calls for caution when generalizing experimental results across broad ranges, either geographic or genetic. Instead, detailed data must be collected in order to make reasonable predictions on population level effects.
Population S3 was the only population where no negative effects of decreased salinity were observed on the performance of the phenotypic traits. As mentioned above, the genetic analysis revealed that this population was an outlier for calcium binding protein 1 with a high frequency of an otherwise rare allele. Calcium has been recognized to be an important signal under abiotic stress, including salinity (Pandey et al., 2002). In terrestrial plants, overexpression of calcium-binding proteins leads to an enhanced tolerance to salinity stress (Deswal and Sopory, 1999; Veena et al., 1999). Our results suggest that this locus may also influence salinity stress tolerance in F. vesiculosus.
In the TDP1 (tyrosyl-DNA phosphodiesterase 1) locus, we found the major allele to be fixed in all populations except the most northern Danish population (D1). In terrestrial plants, it has been reported that this gene is upregulated in response to osmotic stress (Macovei et al., 2010), and so this locus might also be a candidate for selection under salinity stress, with population D1 being more connected to full-saline conditions than the other populations.
The allele frequencies of the SNP locus located in the gene coding for the protein LONGIFOLIA revealed a north-south cline parallel to the salinity gradient. In terrestrial plants, LONGIFOLIA is highly induced when salinity increases in salinity-tolerant genotypes, but repressed in salinity-sensitive genotypes (Kaashyap et al., 2018). This suggests that the variation in this SNP might also relate to adaptation over the salinity gradient.
In contrast, the variation in the SNP positioned in the PAS/PAC histidine kinase gene, a putative blue light receptor, indicated a west-east (Denmark–Sweden) differentiation with the allele dominant in the three Swedish sites being less common in the Danish sites. PAS domains have been identified in proteins from a variety of phyla and include, e.g., chemoreceptors, photoreceptors, and voltage-activated ion channels (Taylor et al., 1999). Lagarias et al. (1995) showed that the green alga Mesotaenium caldariorum contains a small family of phytochrome genes (of which the PAS/PAC gene observed here is a member) that are closely related to those in terrestrial vascular plants. Phytochromes are photoreceptors that mediate light-initiated adaptive physiological changes in terrestrial plants and can regulate light responses in different life-cycle stages (Lagarias et al., 1995). It has previously been shown that PAS/PAC histidine kinase is a putative blue-light photoreceptor and is both over-represented in F. vesiculosus males (Martins et al., 2013) and upregulated in F. vesiculosus sperm (Martins et al., 2013). A speculative hypothesis is that the irradiation climate of the water is different on the Danish and Swedish sides of the area, with somewhat less turbid water in the incoming North Sea water on the Danish side, and that the genetic difference we see in this gene may be related to differential selection across the strait.
All of these genetic and adaptive differences could also be explained by other factors; however, the study area was selected based on its relatively small geographic scope and similarity in most respects. Salinity is the single environmental factor with the broadest range in this region and hence is the most likely explanatory variable for the results we see.
Conclusion
We combined an experimental and a genomic approach to assess the variation in stress response among local populations of a common seaweed species, Fucus vesiculosus, all from the same small geographic area. Under exposure to an immediate decrease in salinity mirroring an increasing frequency of extreme events concomitant with a projected decrease in the area over the coming 80 years, populations reacted very differently. A few were only marginally affected, some moderately affected, and one showed severe stress and ceased growth. Our genome scan identified both overall genetic differences among populations and a few trends in outlier loci. These results suggest each population being locally adapted while also affected by genetic affinity to nearby populations, such as illustrated by the intriguing difference between the two most southern populations exposed to the same salinity. This illustrates how intraspecific variation and local adaptation among populations over relatively small geographic distances contribute to resilience to environmental changes in a widespread species. Importantly, it shows the strengths of combining ecological experiments with genome-scans in non-model species in order to elucidate the eco-evolutionary processes that shape species and populations.
Data Availability Statement
The datasets generated for this study can be found in the NCBI – PRJNA629489.
Author Contributions
AK, KJ, RP, and HP conceived the study. AK and OO-M executed fieldwork and/or processing of samples. AK, KJ, RP, PJ, and MT analyzed and modeled the data. AK, KJ, and RP wrote the manuscript with input from all authors.
Conflict of Interest
The authors declare that the research was conducted in the absence of any commercial or financial relationships that could be construed as a potential conflict of interest.
Funding
Funding was provided by the Swedish Research Council VR through a Linnaeus grant to the Centre for Marine Evolutionary Biology (CeMEB; https://cemeb.science.gu.se) and through the 2015–2016 BiodivERsa COFUND call for MarFor, with funding from FORMAS project 2016-01930. Apart from funding the study, the funding bodies have not had any influence on the design, collection, analysis, interpretation of the data, or the writing of the manuscript.
Acknowledgments
The authors gratefully acknowledge Joel White for help with the fieldwork and throughout the experiment and Gunnar Cervin for help with the experimental set-up. They also thank Matthew Pinder for his assistance in the data submission to NCBI.
Supplementary Material
The Supplementary Material for this article can be found online at: https://www.frontiersin.org/articles/10.3389/fmars.2020.00470/full#supplementary-material
Footnotes
References
Bäck, S., Collins, J. C., and Russel, G. (1992a). Comparative ecophysiology of Baltic and Atlantic Fucus vesiculosus. Mar. Ecol. Prog. Ser. 84, 71–82. doi: 10.3354/meps084071
Bäck, S., Collins, J. C., and Russell, G. (1992b). Effects of salinity on growth of Baltic and Atlantic Fucus vesiculosus. Br. Phycol. J 27, 39–47. doi: 10.1080/00071619200650061
Bendtsen, J., Gustafsson, K. E., Söderkvist, J., and Hansen, J. L. S. (2009). Ventilation of bottom water in the North Sea-Baltic Sea transition zone. J. Mar. Syst. 75, 138–149. doi: 10.1016/j.jmarsys.2008.08.006
Benjamini, Y., and Hochberg, Y. (1995). Controlling the false discovery rate: a practical and powerful approach to multiple testing. J. R. Stat. Soc. B 57, 289–300. doi: 10.1111/j.2517-6161.1995.tb02031.x
Bennett, S., Wernberg, T., De Bettignies, T., Kendrick, G. A., Anderson, R. J., Bolton, J. J., et al. (2015). Canopy interactions and physical stress gradients in subtidal communities. Ecol. Lett. 18, 677–686. doi: 10.1111/ele.12446
Björck, S. (1995). A review of the history of the Baltic Sea, 13.0–8.0 ka BP. Quart. Inter. 27, 19–40. doi: 10.1016/1040-6182(94)00057-C
Connan, S., and Stengel, D. B. (2011a). Impacts of ambient salinity and copper on brown algae: 1. Interactive effects on photosynthesis, growth, and copper accumulation. Aquat. Toxicol. 104, 94–107. doi: 10.1016/j.aquatox.2011.03.015
Connan, S., and Stengel, D. B. (2011b). Impacts of ambient salinity and copper on brown algae: 2. Interactive effects on phenolic pool and assessment of metal binding capacity of phlorotannin. Aquat. Toxicol. 104, 1–13. doi: 10.1016/j.aquatox.2011.03.016
Deswal, R., and Sopory, S. K. (1999). Glyoxalase I from Brassica juncea is a calmodulin stimulated protein. BBA Mol. Cell Res. 1450, 460–467. doi: 10.1016/S0167-4889(99)00047-6
Earl, D. A., and Von Holdt, B. M. (2012). STRUCTURE HARVESTER: a website and program for visualizing STRUCTRE output and implementing the Evanno method. Conserv. Genet. Resour. 4, 359–361. doi: 10.1007/s12686-011-9548-7
Eilola, K., Meier, H. E. M., and Almroth, E. (2009). On the dynamics of oxygen, phosphorous and cyanobacteria in the Baltic Sea: a model study. J. Mar. Syst. 75, 163–184. doi: 10.1016/j.jmarsys.2008.08.009
Excoffier, L., and Lischer, H. E. (2010). Arlequin suite ver 3.5: a new series of programs to perform population genetics analyses under Linux and Windows. Mol. Ecol. Resour. 10, 564–567. doi: 10.1111/j.1755-0998.2010.02847.x
Foll, M., and Gaggiotti, O. E. (2008). A genome scan method to identify selected loci appropriate for both dominant and codominant markers: a bayesian perspective. Genetics 180, 977–993. doi: 10.1534/genetics.108.092221
Gagnaire, B., Frouin, H., Moreau, K., Thomas-Guyon, H., and Renault, T. (2006). Effects of temperature and salinity on haemocyte activities of the Pacific oyster. Crassostrea gigas (Thunberg). Fish Shellfish Immun. 20, 536–547. doi: 10.1016/j.fsi.2005.07.003
Gosselin, T., Lamothe, M., Devloo-Delva, F., and Grewe, P. (2020). radiator: RADseq Data Exploration, Manipulation and Visualization Using R. Available online at: https://thierrygosselin.github.io/radiator/.
Hewitt, G. M. (1999). Post-glacial re-colonization of European biota. Biol. J. Linn. Soc. 68, 87–112. doi: 10.1111/j.1095-8312.1999.tb01160.x
Hordoir, R., Axell, L., Höglund, A., Dieterich, C., Fransner, F., Gröger, M., et al. (2019). Nemo-Nordic 1.0: a NEMO-based ocean model for the Baltic and North seas – research and operational applications. Geosci. Model Dev. 12, 363–386. doi: 10.5194/gmd-12-363-2019
IPCC (2013). “Climate change 2013: the physical science basis,” in Contribution of Working Group I to the Fifth Assessment Report of the Intergovernmental Panel on Climate Change, eds T. F. Stocker, D. Qin, G.-K. Plattner, M. Tignor, S. K. Allen, J. Boschung, et al. (Cambridge: Cambridge University Press).
Johannesson, K., Forslund, H., Capetillo, N. Å, Kautsky, L., Johansson, D., Pereyra, R. T., et al. (2012). Phenotypic variation in sexually and asexually recruited individuals of the Baltic Sea endemic macroalga Fucus radicans: in the field and after growth in a common-garden. BMC Ecol. 12:2. doi: 10.1186/1472-6785-12-2
Johansson, D., Pereyra, R. T., Rafajlović, M., and Johannesson, K. (2017). Reciprocal transplants support a plasticity-first scenario during colonisation of a large hyposaline basin by a marine macro alga. BMC Ecol. 17:14. doi: 10.1186/s12898-017-0124-1
Jombart, T., and Ahmed, I. (2011). adegenet 1.3-1: new tools for the analysis of genome-wide SNP data. Bioinformatics 27, 3070–3071. doi: 10.1093/bioinformatics/btr521
Jombart, T., Devillard, S., and Balloux, F. (2010). Discriminant analysis of principal components: a new method for the analysis of genetically structured populations. BMC Genet. 11:94. doi: 10.1186/1471-2156-11-94
Jonsson, P. R., Kotta, J., Andersson, H. C., Herkul, K., Virtanen, E., Nyström Sandman, A., et al. (2018). High climate velocity and population fragmentation may constrain climate-driven range shift of the key habitat former Fucus vesiculosus in the Baltic Sea. Divers Distrib. 24, 892–905. doi: 10.1111/ddi.12733
Kaashyap, M., Ford, R., Kudapa, H., Jain, M., Edwards, D., Varshney, R., et al. (2018). Differential regulation of genes involved in root morphogenesis and cell wall modification is associated with salinity tolerance in chickpea. Sci. Rep. 8, 1–19. doi: 10.1038/s41598-018-23116-9
Kamvar, Z. N., Tabima, J. F., and Grünwald, N. J. (2014). Poppr: an R package for genetic analysis of populations with clonal, partially clonal, and/or sexual reproduction. PeerJ 2:e281. doi: 10.7717/peerj.281
Kirwan, M. L., and Megonigal, J. P. (2013). Tidal wetland stability in the face of human impacts and sea-level rise. Nature 504, 53–60. doi: 10.1038/nature12856
Kopelman, N. M., Mayzel, J., Jakobsson, M., Rosenberg, N. A., and Mayrose, I. (2015). CLUMPAK: a program for identifying clustering modes and packaging population structure inferences across K. Mol. Ecol. Resour. 15, 1179–1191. doi: 10.1111/1755-0998.12387
Kotta, J., Vanhatalo, J., Jänes, H., Orav-Kotta, H., Rugiu, L., Jormalainen, V., et al. (2019). Integrating experimental and distribution data to predict future species patterns. Sci. Rep. 9:1821. doi: 10.1038/s41598-018-38416-3
Lagarias, D. M., Wu, S. H., and Lagarias, J. C. (1995). Atypical phytochrome gene structure in the green alga Mesotaenium caldariorum. Plant Mol. Biol. 29, 1127–1142. doi: 10.1007/BF00020457
Le Moan, A., Gaggiotti, O., Henriques, R., Martinez, R., Bekkevold, D., and Hemmer-Hansen, J. (2019). Beyond parallel evolution: when several species colonize the same environmental gradient. bioRxiv [Preprint]. doi: 10.1101/662569
Lehmann, J., Coumou, D., and Frieler, K. (2015). Increased record-breaking precipitation events under global warming. Clim. Change 132, 501–515. doi: 10.1007/s10584-015-1434-y
Maar, M., Møller, E. F., Larsen, J., Madsen, K. S., Wan, Z., She, J., et al. (2011). Ecosystem modelling across a salinity gradient from the North Sea to the Baltic Sea. Ecol. Model 222, 1696–1711. doi: 10.1016/j.ecolmodel.2011.03.006
Macovei, A., Balestrazzi, A., Confalonieri, M., and Carbonera, D. (2010). The tyrosyl-DNA phosphodiesterase gene family in Medicago truncatula Gaertn.: bioinformatic investigation and expression profiles in response to copper-and PEG-mediated stress. Planta 232, 393–407. doi: 10.1007/s00425-010-1179-9
Martins, M. J. F., Mota, C. F., and Pearson, G. A. (2013). Sex-biased gene expression in the brown alga Fucus vesiculosus. BMC Genomics 14:294. doi: 10.1186/1471-2164-14-294
Meier, H. E. M., Dieterich, C., Eilola, K., Gröger, M., Höglund, A., Radtke, H., et al. (2019). Future projections of record-breaking sea surface temperature and cyanobacteria bloom events in the Baltic Sea. Ambio 48, 1362–1376. doi: 10.1007/s13280-019-01235-5
Meier, H. E. M., Hordoir, R., Andersson, H. C., Dieterich, C., Eilola, K., Gustafsson, B. G., et al. (2012). Modeling the combined impact of changing climate and changing nutrient loads on the Baltic Sea environment in an ensemble of transient simulations for 1961–2099. Clim. Dyn. 39, 2421–2441. doi: 10.1007/s00382-012-1339-7
Nakićenović, N., Alcamo, J., Davis, G., DeVries, B., Fenhann, J., Gaffin, S., et al. (2000). Special Report on Emissions Scenarios: a Special Report of Working Group III of the Intergovernmental Panel on Climate Change. Cambridge: Cambridge University Press.
Narum, S. R., and Hess, J. E. (2011). Comparison of FST outlier tests for SNP loci under selection. Mol. Ecol. Resour. 11, 184–194. doi: 10.1111/j.1755-0998.2011.02987.x
Nikula, R., Strelkov, R., and Väinölä, R. (2007). Diversity and trans-Arctic invasion history of mtDNA lineages in the North Atlantic Macoma balthica complex (Bivalvia: Tellinidae). Evolution 61, 928–941. doi: 10.1111/j.1558-5646.2007.00066.x
Nygård, C. A., and Dring, M. J. (2008). Influence of salinity, temperature, dissolved inorganic carbon and nutrient concentration on the photosynthesis and growth of Fucus vesiculosus from the Baltic and Irish Seas. Eur. J. Phycol. 43, 253–262. doi: 10.1080/09670260802172627
Nylund, G. M., Pereyra, R. T., Wood, H. L., Johannesson, K., and Pavia, H. (2012). Increased resistance towards generalist herbivory in the new range of a habitat-forming seaweed. Ecosphere 3, 1–13. doi: 10.1890/ES12-00203.1
Pandey, G. K., Reddy, V. S., Reddy, M. K., Deswal, R., Bhattacharya, A., and Sopory, S. K. (2002). Transgenic tobacco expressing Entamoeba histolytica calcium binding protein exhibits enhanced growth and tolerance to salt stress. Plant Sci. 162, 41–47. doi: 10.1016/S0168-9452(01)00530-1
Panova, M., Aronsson, H., Cameron, R. A., Dahl, P., Godhe, A., Lind, U., et al. (2016). “DNA extraction protocols for whole-genome sequencing in marine organisms,” in Marine Genomics, ed. S. Bourlat (New York, NY: Humana Press), 13–44. doi: 10.1007/978-1-4939-3774-5_2
Pavia, H., Toth, G., and Åberg, P. (1999). Trade-offs between phlorotannin production and annual growth in natural populations of the brown seaweed Ascophyllum nodosum. J. Ecol. 87, 761–771. doi: 10.1046/j.1365-2745.1999.00397.x
Pigliucci, M. (2001). Phenotypic Plasticity: Beyond Nature and Nurture. Baltimore: The Johns Hopkins University Press.
Pritchard, J. K., Stephens, M., and Donnelly, P. (2000). Inference of population structure using multilocus genotype data. Genetics 155, 945–959.
Råberg, S., and Kautsky, L. (2007). A comparative biodiversity study of the associated fauna of perennial fucoids and filamentous algae. Estuar. Coast. Shelf S 73, 249–258. doi: 10.1016/j.ecss.2007.01.005
Ragan, M. A., and Glombitza, K. W. (1986). Phlorotannins, brown algal polyphenols. Prog. Phycol. Res. 4, 130–230.
Roeckner, E., Brokopf, R., Esch, M., Giorgetta, M., Hagemann, S., Kornblueh, L., et al. (2006). Sensitivity of simulated climate to horizontal and vertical resolution in the ECHAM5 atmosphere model. J. Clim. 19, 3771–3791. doi: 10.1175/JCLI3824.1
Saraiva, S., Meier, H. E. M., Andersson, H., Höglund, A., Dieterich, C., Gröger, M., et al. (2019). Baltic Sea ecosystem response to various nutrient load scenarios in present and future climates. Clim. Dyn. 52, 3369–3387. doi: 10.1007/s00382-018-4330-0
Schneider, C. A., Rasband, W. S., and Eliceiri, K. W. (2012). NIH Image to ImageJ: 25 years of image analysis. Nat. Methods 9, 671–675. doi: 10.1038/nmeth.2089
Schroeder, K., Chiggiato, J., Bryden, H. L., Borghini, M., and Ismail, S. B. (2016). Abrupt climate shift in the western mediterranean Sea. Sci. Rep. 6:23009. doi: 10.1038/srep23009
Schubert, H., Telesh, I., Nikinmaa, M., and Skarlato, S. (2017). “Physiological adaptations,” in Biological Oceanography of the Baltic Sea, eds P. Snoeijs-Leijonmalm, H. Schubert, and T. Radziejewska (Dordrecht: Springer Science & Business Media), 260.
Snoeijs-Leijonmalm, P., and Andrén, E. (2017). “Why is the Baltic Sea so special to live in?,” in Biological Oceanography of the Baltic Sea, eds P. Snoeijs-Leijonmalm, H. Schubert, and T. Radziejewska (Dordrecht: Springer Science & Business Media), 23–84. doi: 10.1007/978-94-007-0668-2_2
Taylor, B. L., Zhulin, I. B., and Johnson, M. S. (1999). Aerotaxis and other energy-sensing behavior in bacteria. Annu. Rev. Microbiol. 53, 103–128. doi: 10.1146/annurev.micro.53.1.103
Tomanek, L. (2011). Environmental proteomics: changes in the proteome of marine organisms in response to environmental stress, pollutants, infection, symbiosis, and development. Annu. Rev. Mar. Sci. 3, 373–399. doi: 10.1146/annurev-marine-120709-142729
van Alstyne, K. L. (1995). Comparison of three methods for quantifying brown algal polyphenolic compounds. J. Chem. Ecol. 21, 45–58. doi: 10.1007/BF02033661
Van Belleghem, S. M., Vangestel, C., De Wolf, K., De Corte, Z., Möst, M., Rasras, P., et al. (2018). Evolution at two time frames: polymorphisms from an ancient singular divergence event fuel contemporary parallel evolution. PLoS Genet. 14:e1007796. doi: 10.1371/journal.pgen.1007796
Veena, Reddy, V. S., and Sopory, S. K. (1999). Glyoxalase I from Brassica juncea: molecular cloning, regulation and its over-expression confer tolerance in transgenic tobacco under stress. Plant J. 17, 385–395. doi: 10.1046/j.1365-313X.1999.00390.x
Vuorinen, I., Hänninen, J., Rajasilta, M., Laine, P., Eklund, J., Montesino-Pouzols, F., et al. (2015). Scenario simulations of future salinity and ecological consequences in the Baltic Sea and adjacent North Sea areas–implications for environmental monitoring. Ecol. Indic. 50, 196–205. doi: 10.1016/j.ecolind.2014.10.019
Wang, S., Meyer, E., McKay, J. K., and Matz, M. V. (2012). 2b-RAD: a simple and flexible method for genome-wide genotyping. Nat. Methods 9, 808–810. doi: 10.1038/nmeth.2023
Keywords: climate change, macroalga, freshening, Fucus vesiculosus, adaptation
Citation: Kinnby A, Jonsson PR, Ortega-Martinez O, Töpel M, Pavia H, Pereyra RT and Johannesson K (2020) Combining an Ecological Experiment and a Genome Scan Show Idiosyncratic Responses to Salinity Stress in Local Populations of a Seaweed. Front. Mar. Sci. 7:470. doi: 10.3389/fmars.2020.00470
Received: 11 March 2020; Accepted: 27 May 2020;
Published: 19 June 2020.
Edited by:
Christopher Edward Cornwall, Victoria University of Wellington, New ZealandReviewed by:
Inka Bartsch, Alfred Wegener Institute for Polar and Marine Research, GermanyHeidi L. Burdett, The Lyell Centre, United Kingdom
Copyright © 2020 Kinnby, Jonsson, Ortega-Martinez, Töpel, Pavia, Pereyra and Johannesson. This is an open-access article distributed under the terms of the Creative Commons Attribution License (CC BY). The use, distribution or reproduction in other forums is permitted, provided the original author(s) and the copyright owner(s) are credited and that the original publication in this journal is cited, in accordance with accepted academic practice. No use, distribution or reproduction is permitted which does not comply with these terms.
*Correspondence: Alexandra Kinnby, YWxleGFuZHJhLmtpbm5ieUBtYXJpbmUuZ3Uuc2U=