 Shuhao Liu1
 Yang Liu1,2,3*
 Irene D. Alabia4
 Yongjun Tian1,2,3*
 Zhenjiang Ye1
 Haiqing Yu1
 Jianchao Li1Jiahua Cheng5
- 1Laboratory of Fisheries Oceanography, College of Fisheries, Ocean University of China, Qingdao, China
- 2Pilot National Laboratory for Marine Science and Technology (Qingdao), Qingdao, China
- 3Institute for Advanced Ocean Study, Ocean University of China, Qingdao, China
- 4Arctic Research Center, Hokkaido University, Sapporo, Japan
- 5East China Sea Fisheries Research Institute, Chinese Academy of Fishery Sciences, Shanghai, China
The distribution and fluctuations in abundance of small pelagic species such as anchovy are largely affected by climate change. We hypothesized that the future projected rise in temperature will result to a northward shift of Japanese anchovy (Engraulis japonicus) habitat and a subsequent increase in relative abundance. To test this hypothesis, we explored the link between Japanese anchovy abundance and environmental conditions using machine-learning and statistical models. The models were fitted with catch per unit effort (CPUE) as the response variable and remotely sensed data of sea surface temperature (SST), sea surface chlorophyll-a (Chl-a), assimilated information of sea surface salinity (SSS), meridional and zonal ocean currents, and depth as environmental covariates. Our results showed that the abundance of E. japonicus was significantly influenced by environmental factors. In particular, salinity front and SST highlight strong relationships with winter CPUE distribution. Based on these models, the results reinforced our hypothesis and showed that the warming ocean will drive a substantial shift in Japanese anchovy habitat in the China seas. SST and CPUE showed negative correlations with the El Niño Southern Oscillation (ENSO) index. These findings underpin ramifications of the climate-driven habitat shift of small pelagic fish species on the regional marine ecosystem in the China seas.
Introduction
Climate change is considered as one of the major drivers of the fluctuations in abundance and distributions of small pelagic fish resources such as anchovy (Lecomte et al., 2004). For instance, European anchovy in the northern British waters is expected to shift northward in response to climate change (Pinnegar et al., 2017). In the China seas, Japanese anchovy is also highly susceptible to climate change (Ma et al., 2019a). One of the climate phenomena that impacts fish resources is the El Niño Southern Oscillation (ENSO), which is a coupled atmosphere-ocean variability in the tropical Pacific Ocean. This event is also defined by indices such as the Niño1 + 2, which better captures the ENSO signal in winter (Trenberth and Stepaniak, 2001; Hanley et al., 2003; Gen et al., 2010; Yan et al., 2017). During an El Niño, the surface temperature changes in the Yellow Sea (Wei et al., 2010), and the increase in precipitation enhances the riverine discharge from the Yangtze River, thus leading to salinity changes (Park et al., 2015). Many studies have found that fishery resource variations are closely linked to ENSO events. For instance, ENSO is shown to affect the hotspots and distributions of chub mackerel in the East China Sea (Yasuda et al., 2014) and also causes regional changes in the density of young Bluefin tuna in the East China Sea (Kitagawa et al., 2006). Fluctuation in abundance between the sardine and anchovy is influenced by ENSO (Brierley and Kingsford, 2009). Few studies to date have explored the relationship between climate change and the distribution of Japanese anchovy, specifically in the climate-sensitive waters of the China seas where ENSO was shown to affect its early life history (Tian et al., 2004; Kim et al., 2005). Thus, the impact of present and future marine environmental changes to fish resources deserves our attention. We proposed a hypothesis that a climate-driven temperature rise will result in the northward shift of anchovy habitat and increase of anchovy relative abundance. We tested this hypothesis using the climate projections from the IPCC (Intergovernmental Panel on Climate Change)–RCP (Representative Concentration Pathway) scenarios. The IPCC forecasts future climate change and discusses the impacts of climate change, future risks, and adaptation strategies. The R of the IPCC project global mean surface temperatures describe four scenarios (RCP 2.6, RCP4.5, RCP6.0, and RCP8.5) based on different greenhouse gas emissions (Nurdin et al., 2017; Silva et al., 2019). By the end of the 21st century (2081–2100), the IPCC-RCP scenarios projected that the global surface temperature would rise between 1.0°C and 3.7°C compared to the 1986–2005 baseline (IPCC, 2014b). Thus, this raises the urgent need to study the impacts of future climate change on fisheries. Using the Japanese anchovy as a model species to study this topic is likely to disclose processes and mechanisms similar to other small pelagic fisheries across the globe.
Japanese anchovy (Engraulis japonicus) is a widely distributed species and is particularly abundant in the northwestern Pacific region. It is a small pelagic fish that undergoes diurnal vertical migration and is considered a key species linking lower and upper trophic components of the food web (Zhao et al., 2008). Japanese anchovy is a forage fish that moves between its spawning, feeding, and wintering grounds (Figure 1). The separate stocks of Japanese anchovy do not exist in the Yellow Sea and East China Sea (Zheng et al., 2015). During the onset of its spawning migration in late March, Japanese anchovy migrates north and northwest of the basin and spawns from June to August. After spawning, E. japonicus commences its feeding migration and shifts south from November toward its wintering grounds in the Yellow Sea and the East China Sea, where it has the most concentrated and stable stock in winter (December to March) (Zhao, 2006). Therefore, our analyses are focused on the wintering ground of Japanese anchovy in these waters, and it exists in the eastern and southern regions of the Yellow Sea. It is also concentrated in the northern East China Sea and around Jeju Island, with the most considerable wintering ground in the central waters of the southern Yellow Sea (Kwon et al., 2012; Huang et al., 2014; Niu et al., 2014). We delineated the regions of the eastern and southern Yellow Sea and northern East China Sea as the winter fishing grounds (WFG). The monthly averaged CPUE within the winter fishing ground was calculated as the WFG CPUE index (ton h–1). Chinese industrial trawl vessels catch Japanese anchovy, and the government implemented the summer fishing moratorium for protecting fishery resources (Jiang et al., 2009). Since the 1990s, the stock biomass of Japanese anchovy in the Yellow Sea has significantly declined from 4.12 million tons in 1993 to 1.75 million tons in 2000 based on acoustic surveys (Zhao et al., 2003). The fishing yield of Japanese anchovy declined from 1.26 million tons in 2001 to 0.52 million tons in 2009, which then increased to 0.95 million tons in 2015; the Japanese anchovy catch accounts for 10.56% concerning the total fish catches in China (Yuan and Zhao, 2016).
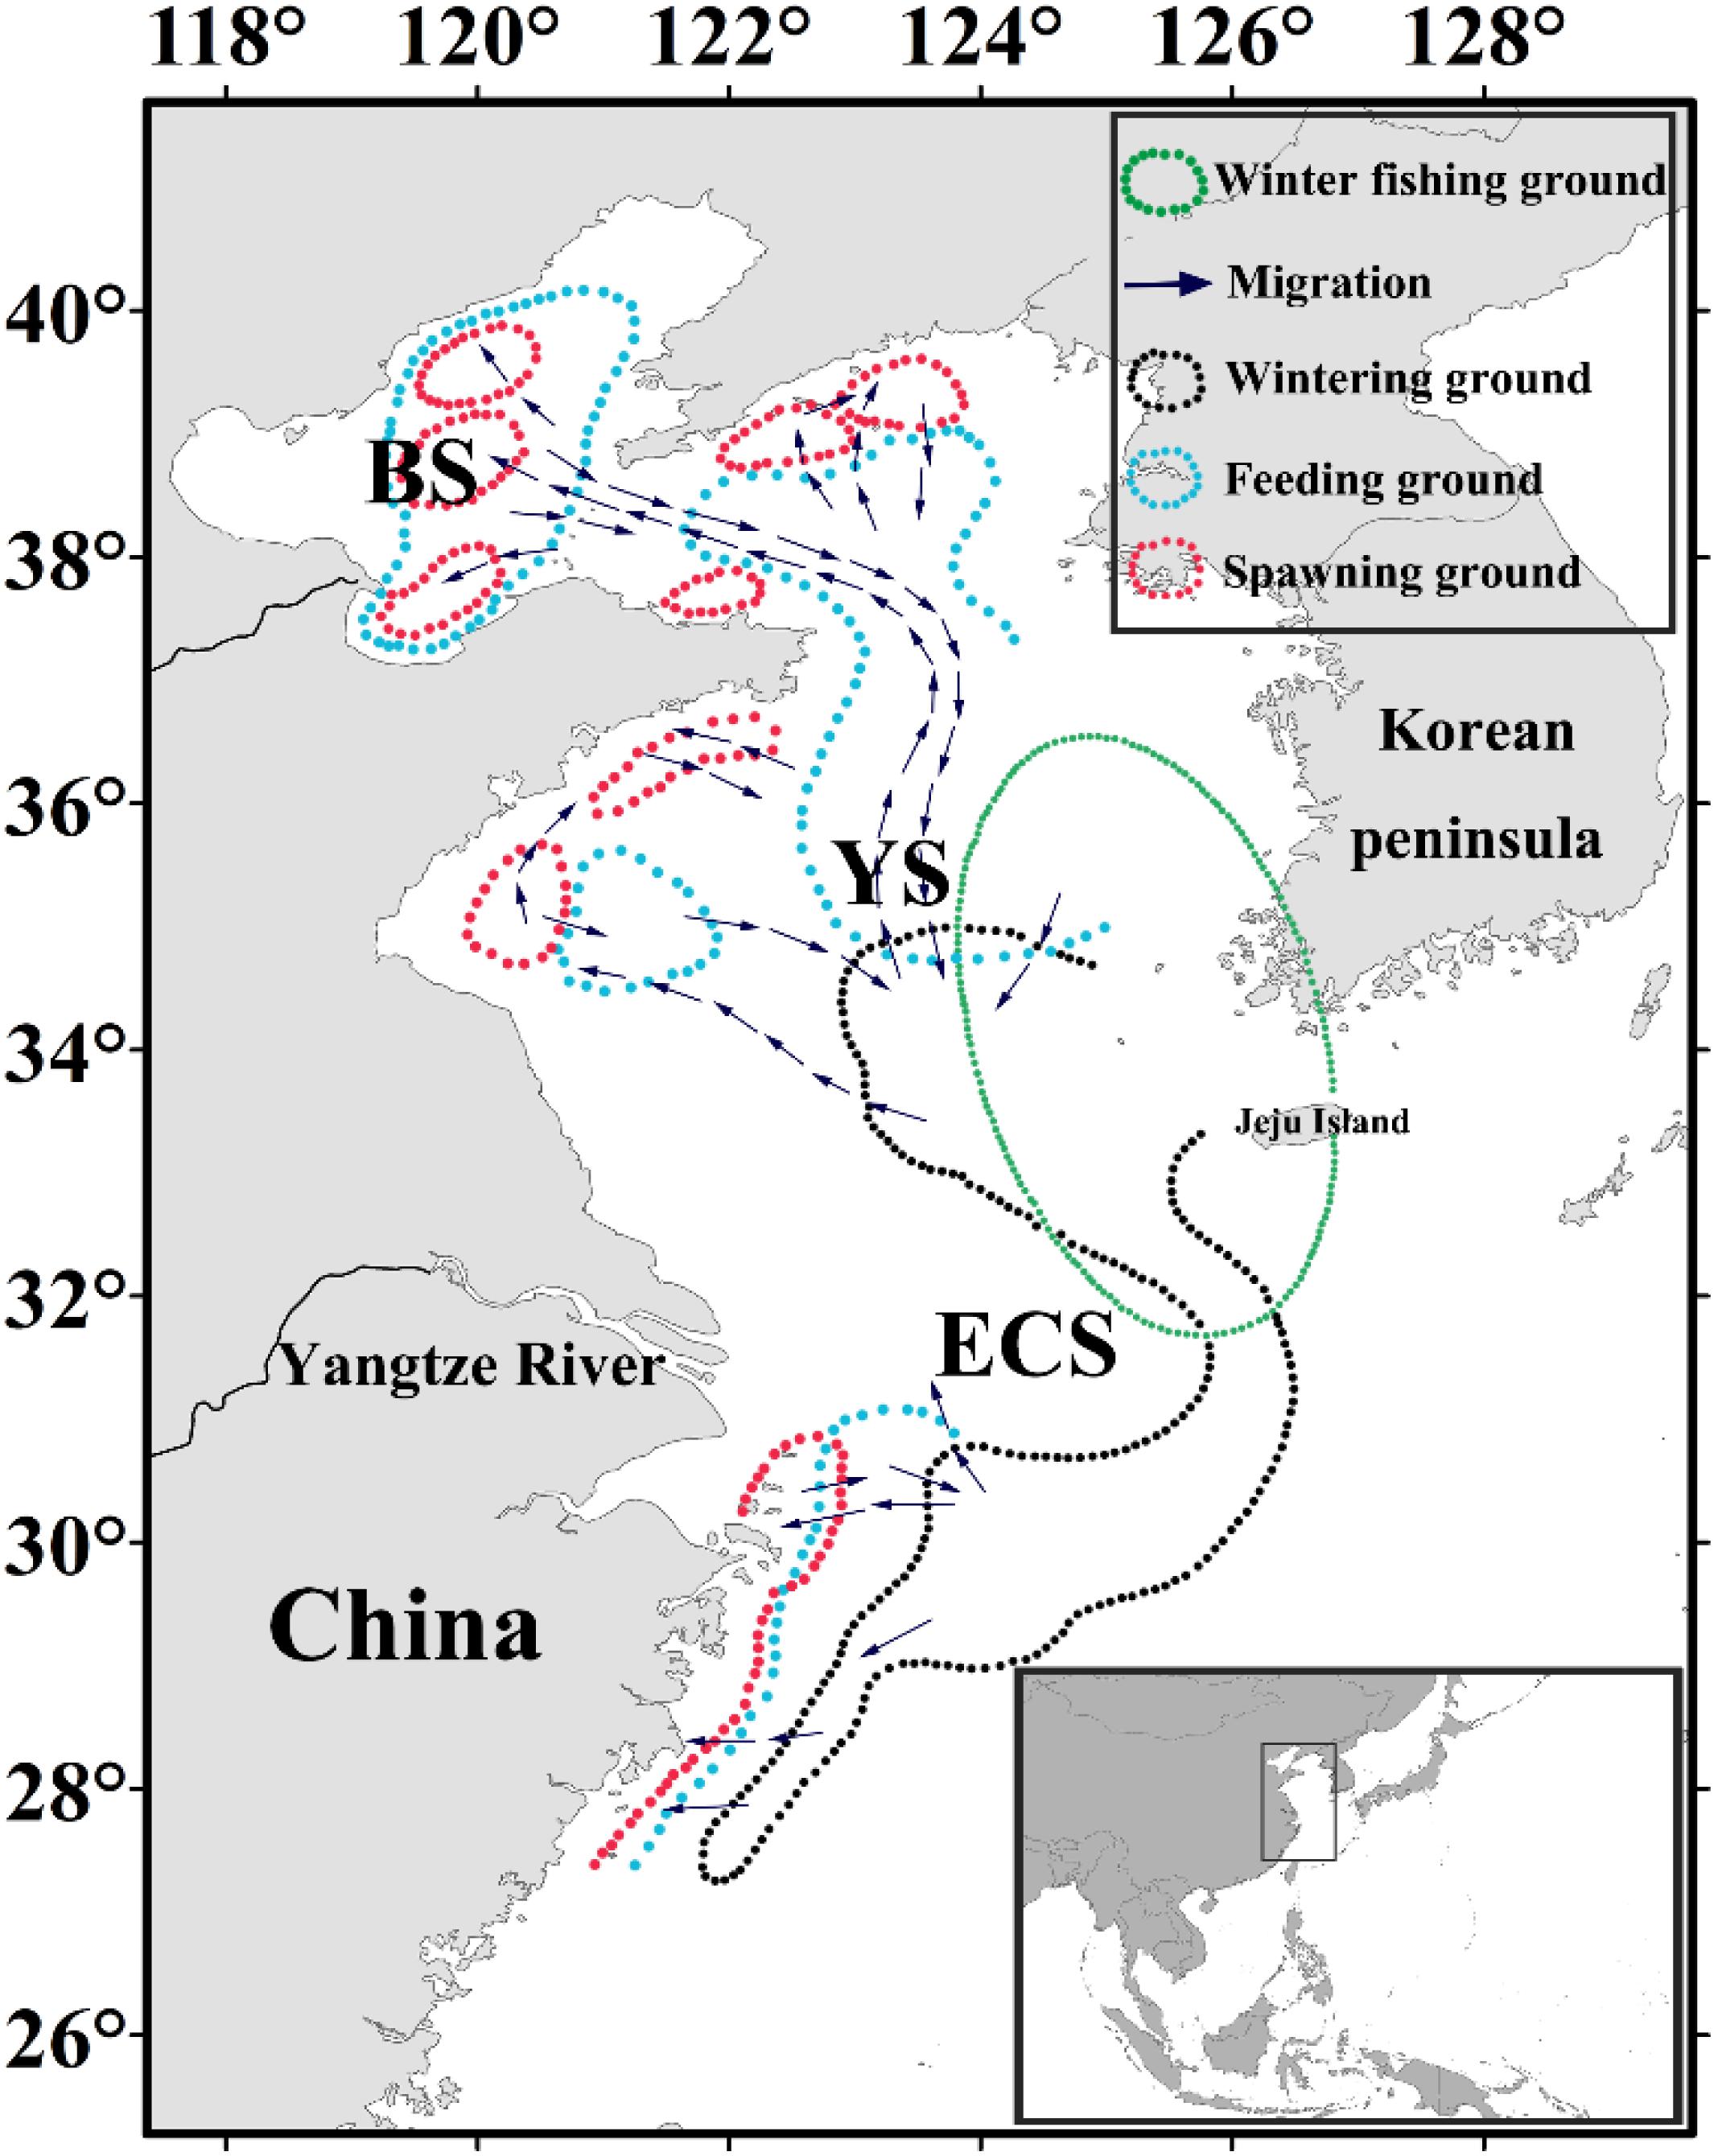
Figure 1. Map showing the Japanese anchovy migration route modified from Zhu (1990) and Zhao (2006). The different regions comprising the China seas are indicated on the map, and overlain are the migration route (purple arrows), spawning (red), feeding (blue), wintering (black), and winter fishing (green) grounds.
In order to effectively monitor and manage the fishery for making sustainable utilization of marine resources, a number of geospatial statistical methods have been used to explore the relationships between environmental factors and species distributions. Among these statistical tools are machine learning methods such as random forest (RF) (Smoliñski and Radtke, 2017), generalized linear models (GLM) (Zhang et al., 2017), and generalized additive models (GAM) (Murase et al., 2009). As the applicability of models is dependent on the target species and regional differences, we constructed all three models to identify the best suited model for projecting the abundance and distribution of wintering Japanese anchovy in the northwestern Pacific region. Remote sensing technology could provide environmental information of suitable temporal and spatial resolution (Klemas, 2012). Moreover, Geographic Information Systems (GIS) technology provides analytical tools to extract environmental ranges from the spatial surveys and map the essential species habitats (Valavanis et al., 2008). Likewise, Simple Ocean Data Assimilation provides numerical model-derived data for comprehensive and accurate oceanographic information continuously corrected through the assimilation of observational data (Carton and Giese, 2008). It can be used complementary to remote sensing data for species-environment studies. Thus, the combination of GIS, remote sensing technology, and statistical models can provide scientific information for marine resource management (Mugo et al., 2011) and the design of appropriate policies to protect fishery resources.
The objectives of this study are (1) to elucidate wintering ground distributions of Japanese anchovy using multiple models; (2) to analyze the impacts of various environmental factors on Japanese anchovy, and (3) to investigate the effect of projected climate scenarios on its spatial and temporal distributions.
Materials and Methods
Study Area and Target Species
The China seas consist of the waters of the Bohai Sea (BS), Yellow Sea (YS), East China Sea (ECS), and the South China Sea, and this study was conducted in regions of the Yellow Sea and East China Sea (26–42°N and 118–128°E) (Figure 1). The YS is a semi-enclosed shelf between China and the Korean Peninsula while the East China Sea is located south of the Yellow Sea (Dong et al., 2011) and links Chinese, Korean, and Japanese waters. The Yellow Sea and the East China Sea are affected by the tides and monsoon winds and influenced by the intrusion of the Kuroshio current (Xing et al., 2020). The China seas are also among the most productive fishery areas in the word (Ma et al., 2019b), which represent 66.10% of the total catch of the Japanese anchovy in the northern Pacific (FAO, 2017).
Fishery Data
Daily catch data of Japanese anchovy in China seas based on the double trawl surveys were provided by the East China Sea Fisheries Research Institute, Chinese Academy of Fishery Sciences. These data were digitized and compiled into a monthly database from 2009 to 2015 (Table 1), which comprised the daily fishing locations (latitude and longitude), fishing dates, and catch per unit effort (CPUE), expressed in terms of tons/hour-boat day (ton/fishing boat-hours). We preprocessed the fishery data and averaged the CPUE when fishing activities were operated in the same location for many consecutive days within a month. An abnormally high CPUE or an abnormally low CPUE during a short fishing interval at the same fishing location were considered to be outliers. We then matched the fishery information with the environmental data at each specific date to obtain the database for fishing location and environmental data.
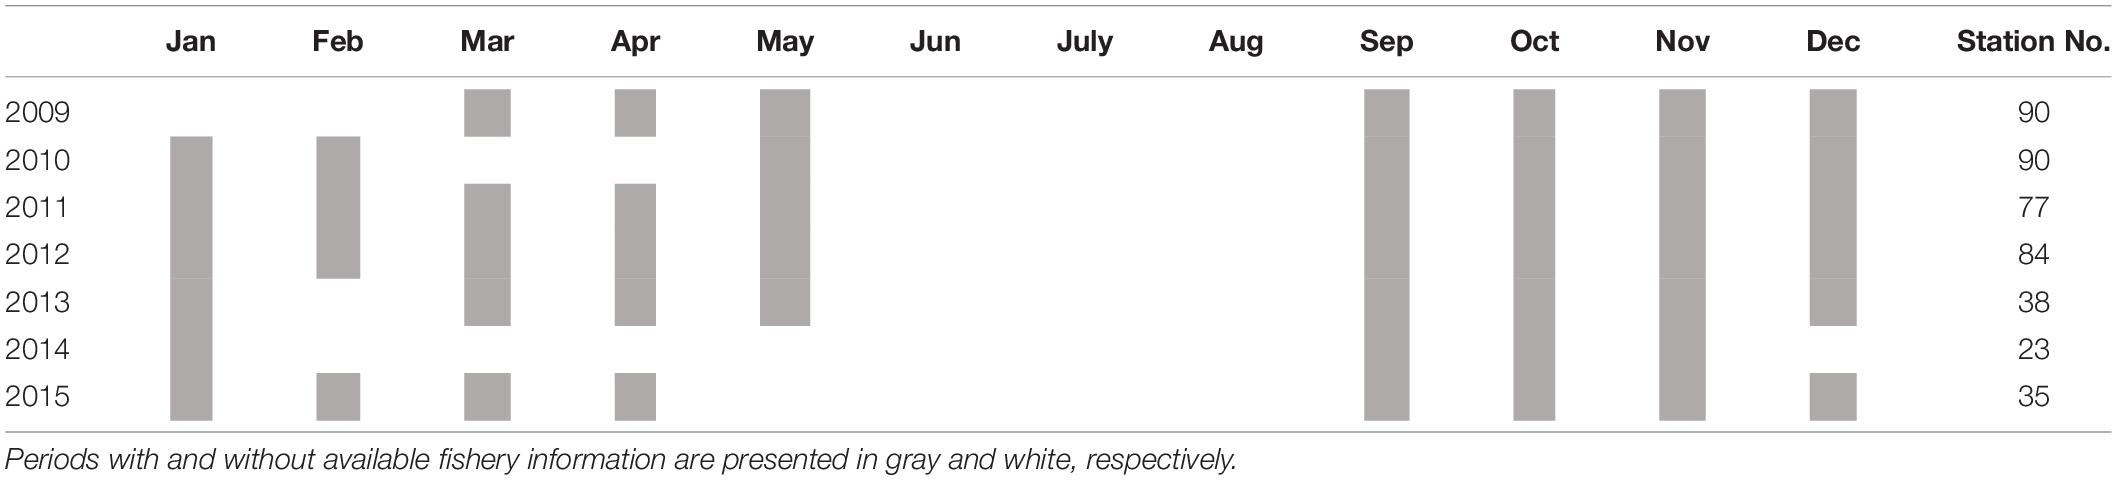
Table 1. Summary information on the fishery data used for the analyses between January and December 2009–2015.
Environmental Variables
Remotely sensed Level 3 sea surface temperature (SST) and sea surface chlorophyll-a (Chl-a) were derived from the Moderate Resolution Imaging Spectroradiometer (MODIS) satellite data from 2009 to 20151 (Table 2). However, the numerical model-derived sea surface salinity (SSS), meridional (V) and zonal (U) current velocities from Simple Ocean Data Assimilation (SODA) v3.3.1 were downloaded from the APDRC data repository2. From the SSS data, salinity fronts were identified based on Cayula and Cornillon single-image edge detection algorithm (Cayula and Cornillon, 1992). Bathymetric data were also downloaded from the online database3. All data were resampled into a 0.01° spatial resolution.
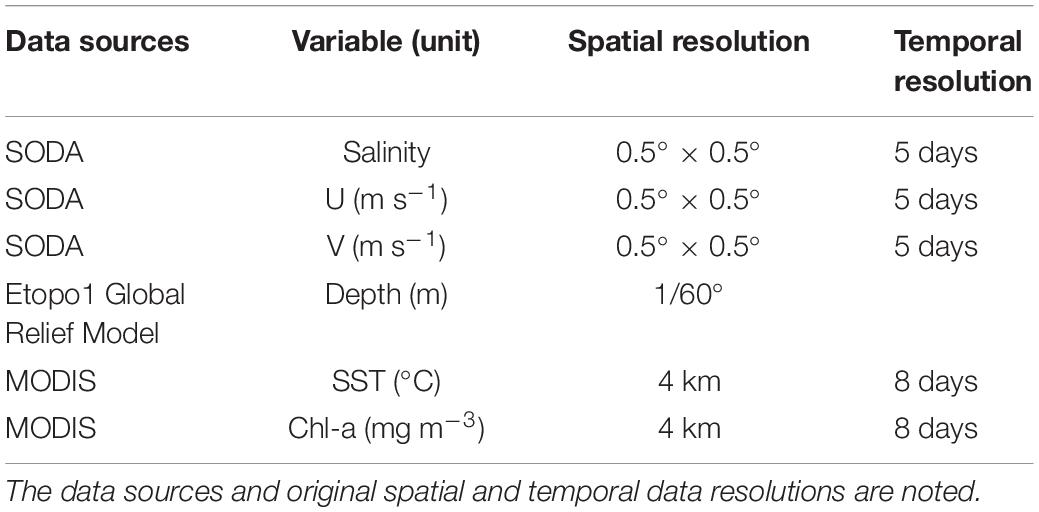
Table 2. Summary of environmental data used for model construction and subsequent analyses.
Future Projections and Climate Index
The projection was based on different IPCC-RCP scenarios with temperature increases at 1.0°C, 1.8°C, 2.2°C, 3.7°C, for RCPs 2.6, 4.5, 6.0, and 8.5, respectively, at the end of the 21st century. The CPUE distributions of Japanese anchovy were predicted based on the temperature increases for different scenarios at the end of the 21st century. The anomalies were calculated as the difference between predicted CPUE based on different scenarios and the predicted CPUE in 2015. The index of Niño1 + 2 was used to represent the ENSO events (Hanley et al., 2003) and was downloaded from the online data repository4. The wintering fishing ground CPUE index was used to analyze the relationship with mean SST in China seas and the Niño1 + 2 index.
Model Construct
We constructed a total of 63 GLMs, 31 GAMs, and 6 RF models using the stepwise add variable approach, and the intermediate results were shown in Supplementary Material. Here, environmental data (SSS, Depth, Chl-a, SST, U, and V) were used as the predictor variables in all models to predict the CPUE distribution of the Japanese anchovy. Marine Geospatial Ecology Tool (MGET) of ArcGIS 10.5, an add-in program for applying advanced analytical methods (Roberts et al., 2010), was used to detect the frontal features.
Generalized linear models generalizes the traditional linear models, which is an expansion of the maximum likelihood estimation in probit analysis that combines both systematic and random components in the model (Nelder and Wedderburn, 1972). GAM is a semi-parametric extension of a GLM and assumes that the functions are additive and the components are smooth. GAMs can deal with highly non-linear and non-monotonic relationships between the response and predictor variables (Guisan et al., 2002). Here, GAM is constructed using the “mgcv” package (Wood, 2006). The collinearity of all predictor variables was examined using the variable inflation factor (VIF) (Supplementary Material 1), where factors without collinearity have VIF values less than 5 (Cornic and Rooker, 2018). As all predictor variables have VIF below the cut-off, they were all used for constructing the models. In the construction of GAMs, the smoothing function used was the thin plate regression spline with “shrinkage” to get poorly performing predictor variables. Due to the low model contribution of V, this factor was disregarded to improve the model’s predictive performance (Roberts et al., 2010). The CPUE follows a continuous distribution, logarithmic transformation was used to normalize the asymmetrical distribution, and a factor of 0.1 is commonly used in CPUE standardizations (Supplementary Material 2.1). GAM is modeled using the Gaussian distribution family (Solanki et al., 2017). The GAM Equation (1) and the GLM Equation (2) implemented were presented as follows:
Where g is the link function, Y is the response variable (CPUE), Xi is the predictor variables (SSC, Depth, Chl-a, SST, U, V), fi is a spline smoothing function for each model predictor Xi, a, and β are model constants, and ε is a random error (Wood, 2006).
Finally, RF model is a classification method that uses multiple decision trees, which are used as statistical classifiers composed of tree predictors. RF generates decision trees based on predictor variables from the original database, and decision trees provide classification by a majority vote from trees (Breiman, 2001). The RF model is constructed using the “Random Forest” package (Liaw and Wiener, 2002).
Model Selection Method
Pearson’s correlation coefficient was used to test the linear relationship between two variables by using a t-test; the tests of statistical significance levels used were 0.05 and 0.01 (Liu et al., 2014, 2018). In GLM and GAM, the addition of different predictor variables leads to changes in the deviance explained and Akaike’s Information Criterion (AIC). Model selection was based on the contribution of the predictor variable, the highest values of deviance explained, and the lowest values of AIC (Johnson and Omland, 2004). For the RF models, the chi-square test and AIC results were not computed. Instead, the model selection was only based on the increases in deviance explained. Finally, the databases were used to construct RF, GLM, and GAM for the period between 2009 and 2014, and the best models of RF, GLM, and GAM were used to predict CPUE using monthly raster composites of environmental predictors in 2015. Model performance was evaluated by comparing the predicted and actual fishing CPUE in 2015.
Results
Comparison of RF, GLM, and GAM
The final selected models for GLM, GAM, and RF (model, predictor variable, AIC, p-value, and deviance explained) are shown in Table 3. In GAM, the best-performing model has five predictor variables (SSS, Depth, Chl-a, SST, U) that were highly significant (p < 0.01) with the lowest AIC (217.53) and the highest deviance explained (36.7%). For GLM, the final selected model with three significant predictors (SSS, Chl-a, V; p < 0.01) had the lowest AIC (303.84) and a high explained variance (9.30%). In RF, the addition of predictor variables resulted in an increased deviance explained; hence, the model with six variables (SSS, Depth, Chl-a, SST, U, and V) was the selected model.
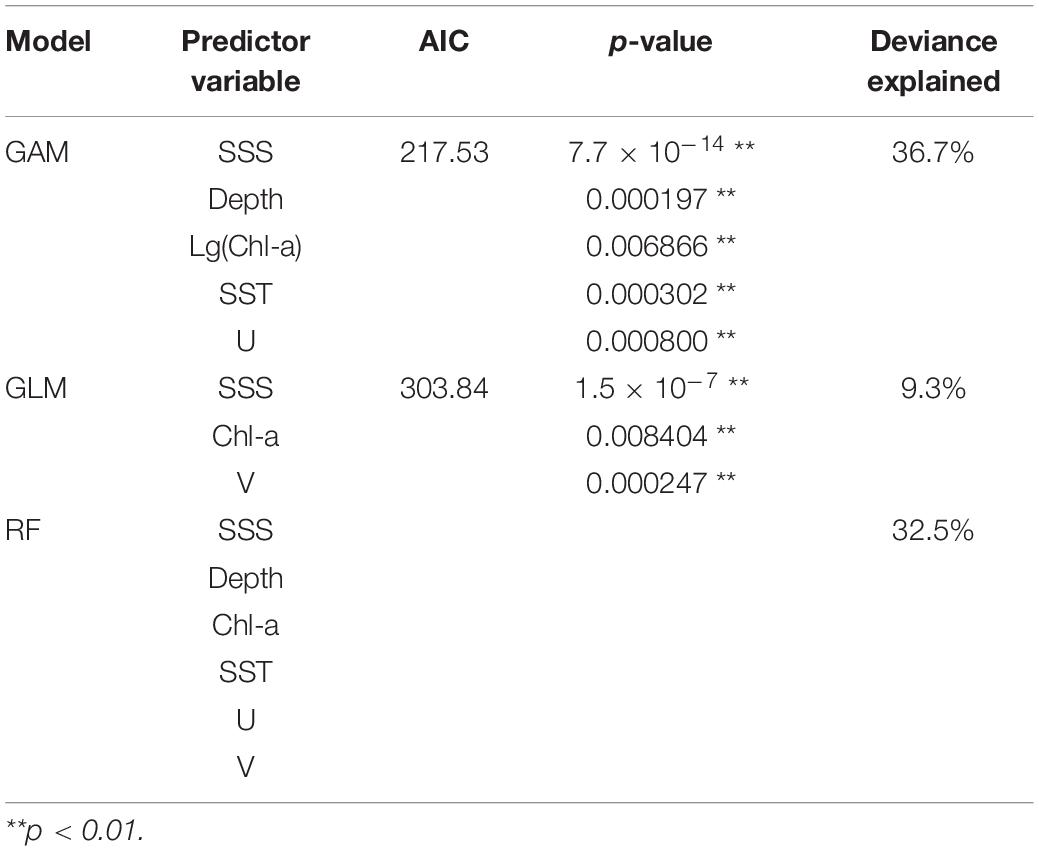
Table 3. List of the final selected models for GLM, GAM, and RF, with their predictor variables, AIC, p-value, and deviance explained (RF did not provide chi-square test and AIC results).
The predicted CPUE ranged from 0 to 2 tons per hour (ton h–1) using the selected models for RF, GLM, and GAM. A histogram of residuals and normal quantile-quantile plots indicated that the distribution of residuals of GAM adequately conformed to the application of Gaussian distribution (Supplementary Material 2.2). Figure 2 shows GAM was the best model by comparing the relationships between the predicted and actual CPUEs for each of the selected models. The GAM-based model showed the highest correlation (R2 = 0.72, p < 0.01), which was greater than those from RF (R2 = 0.19, p < 0.01) and GLM (R2 = 0.15, p < 0.05).
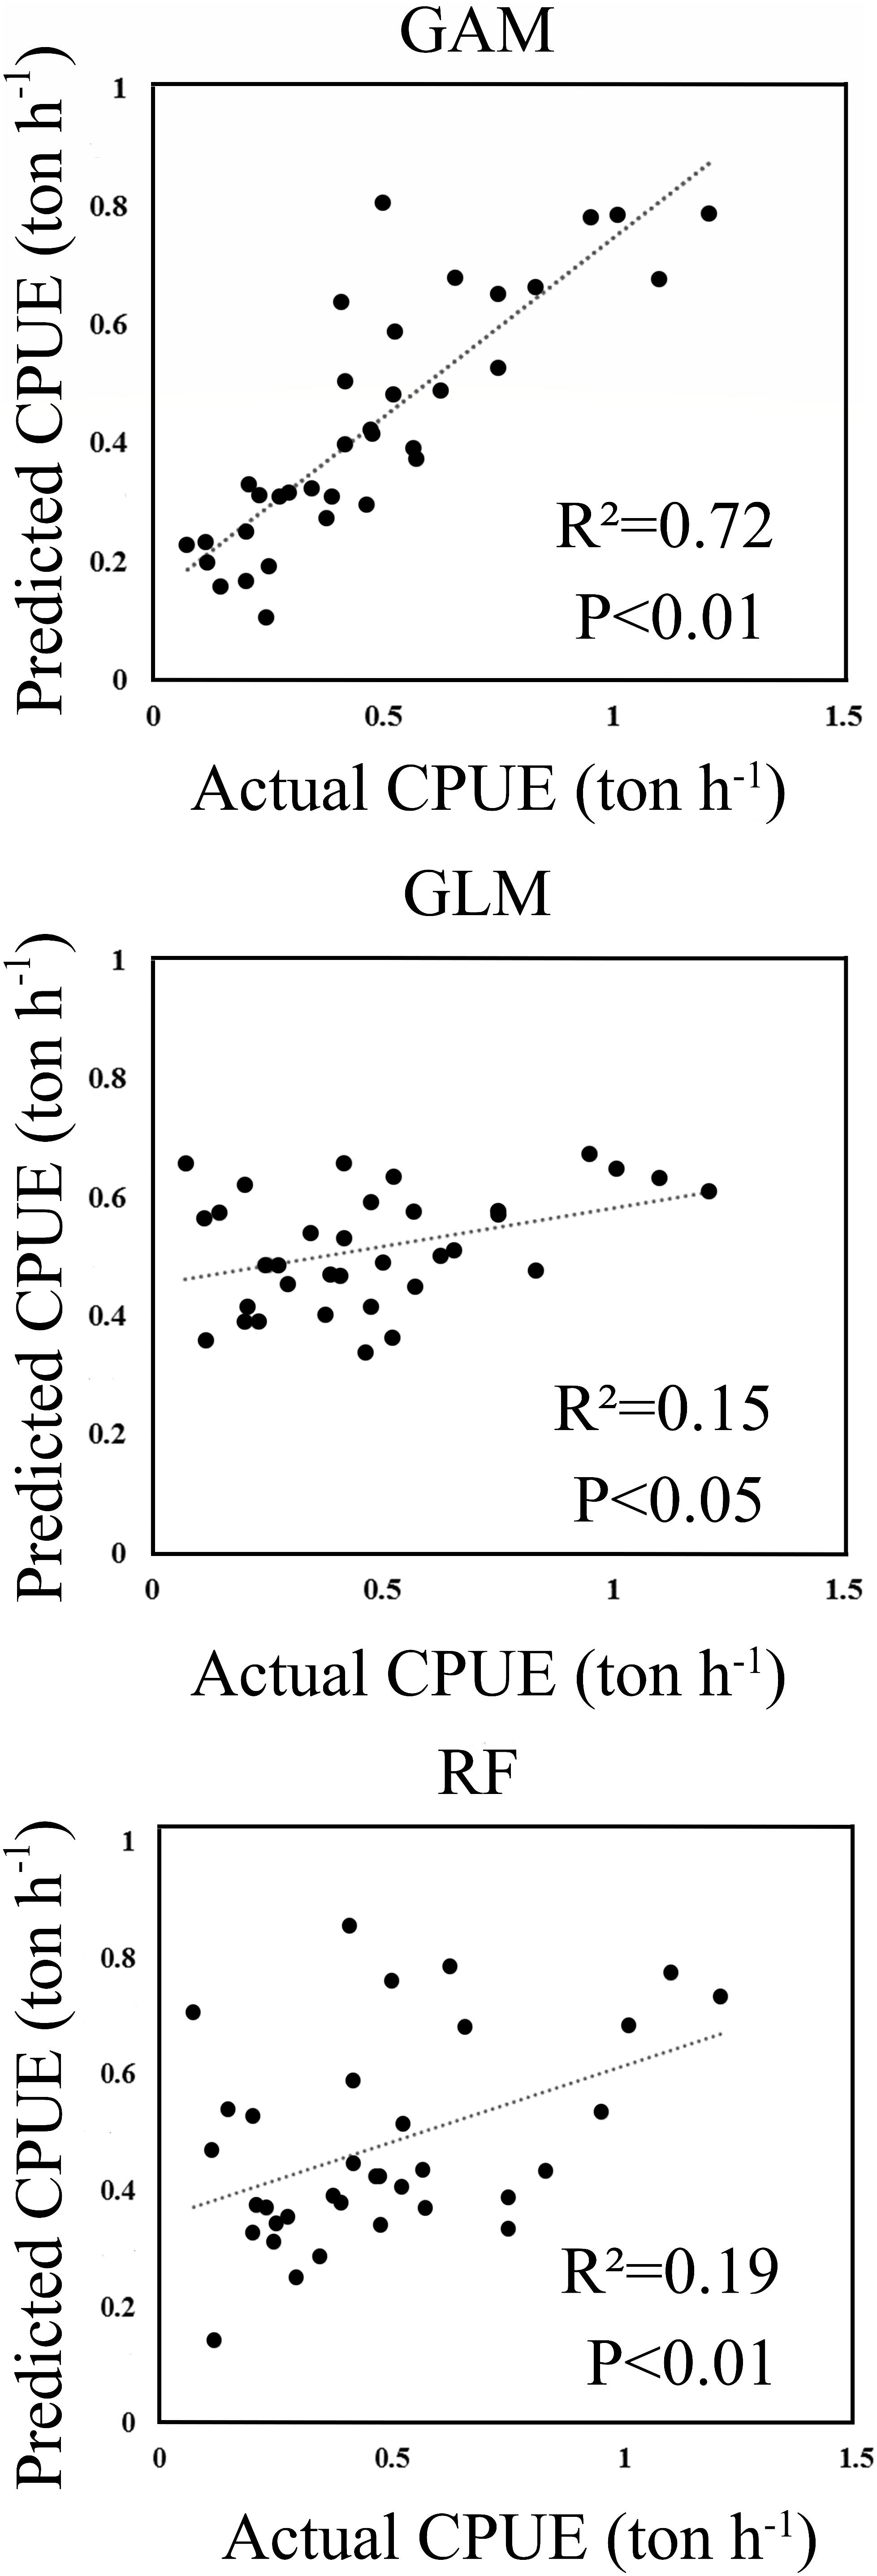
Figure 2. The scatter plots of actual versus predicted CPUE computed within the wintering grounds in 2015.
Preferred Oceanographic Conditions for Japanese Anchovy
Generalized additive models analysis indicated that five variables such as SSS, Depth, Chl-a, SST, and U significantly influenced CPUE of Japanese anchovy (p < 0.01). The importance of each variable was ranked based on the deviance explained and AIC (Table 4).
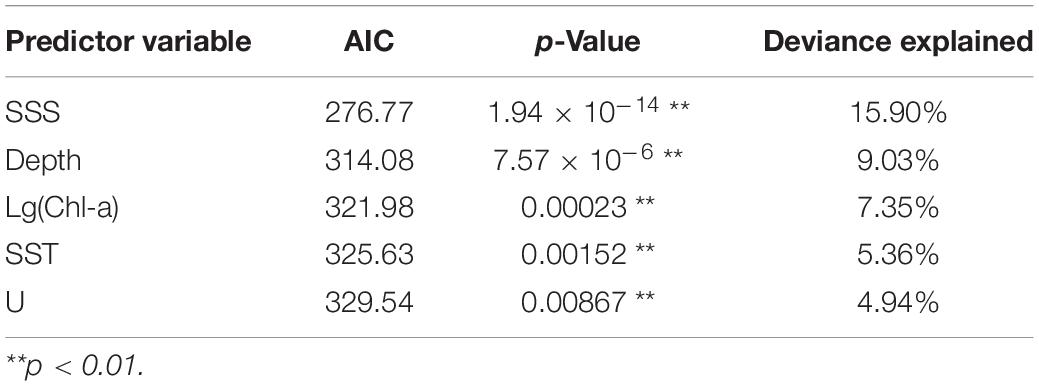
Table 4. GAM single parameter models.
The non-linear relationship between environment variables and CPUE is shown in Figure 3. GAM plots can be interpreted as the effect of each environmental variable on the CPUE. A narrow confidence interval represents high relevance. The positive effect of SSS on the CPUE was observed between 28 and 33. From 18.5 to 28 and 33 to 34.5 (Figure 3A), there were negative effects on the fish CPUE and the density of the data points within the former was lower with a wider confidence interval relative to the latter. A positive effect of depth on CPUE was observed between −50 and −110 m, while negative effects were noted from −30 to −50 m (Figure 3B). For Chl-a (Figure 3C), a positive effect on the CPUE is evident from 0.71 to 1.25 mg m–3, and a negative effect was observed between 1.25 and 3.16 mg m–3. The plot highlighted a positive effect on CPUE beyond 3.16 mg m–3, but with a wide confidence interval. Considering the confidence interval and the fitted curve, a positive SST effect on CPUE was observed for ranges between 8–14°C and 19–22.5°C (Figure 3D). The positive effects of U on CPUE were captured between −0.09 and −0.02 m s–1, between 0.01 and 0.04 m s–1 (Figure 3E).
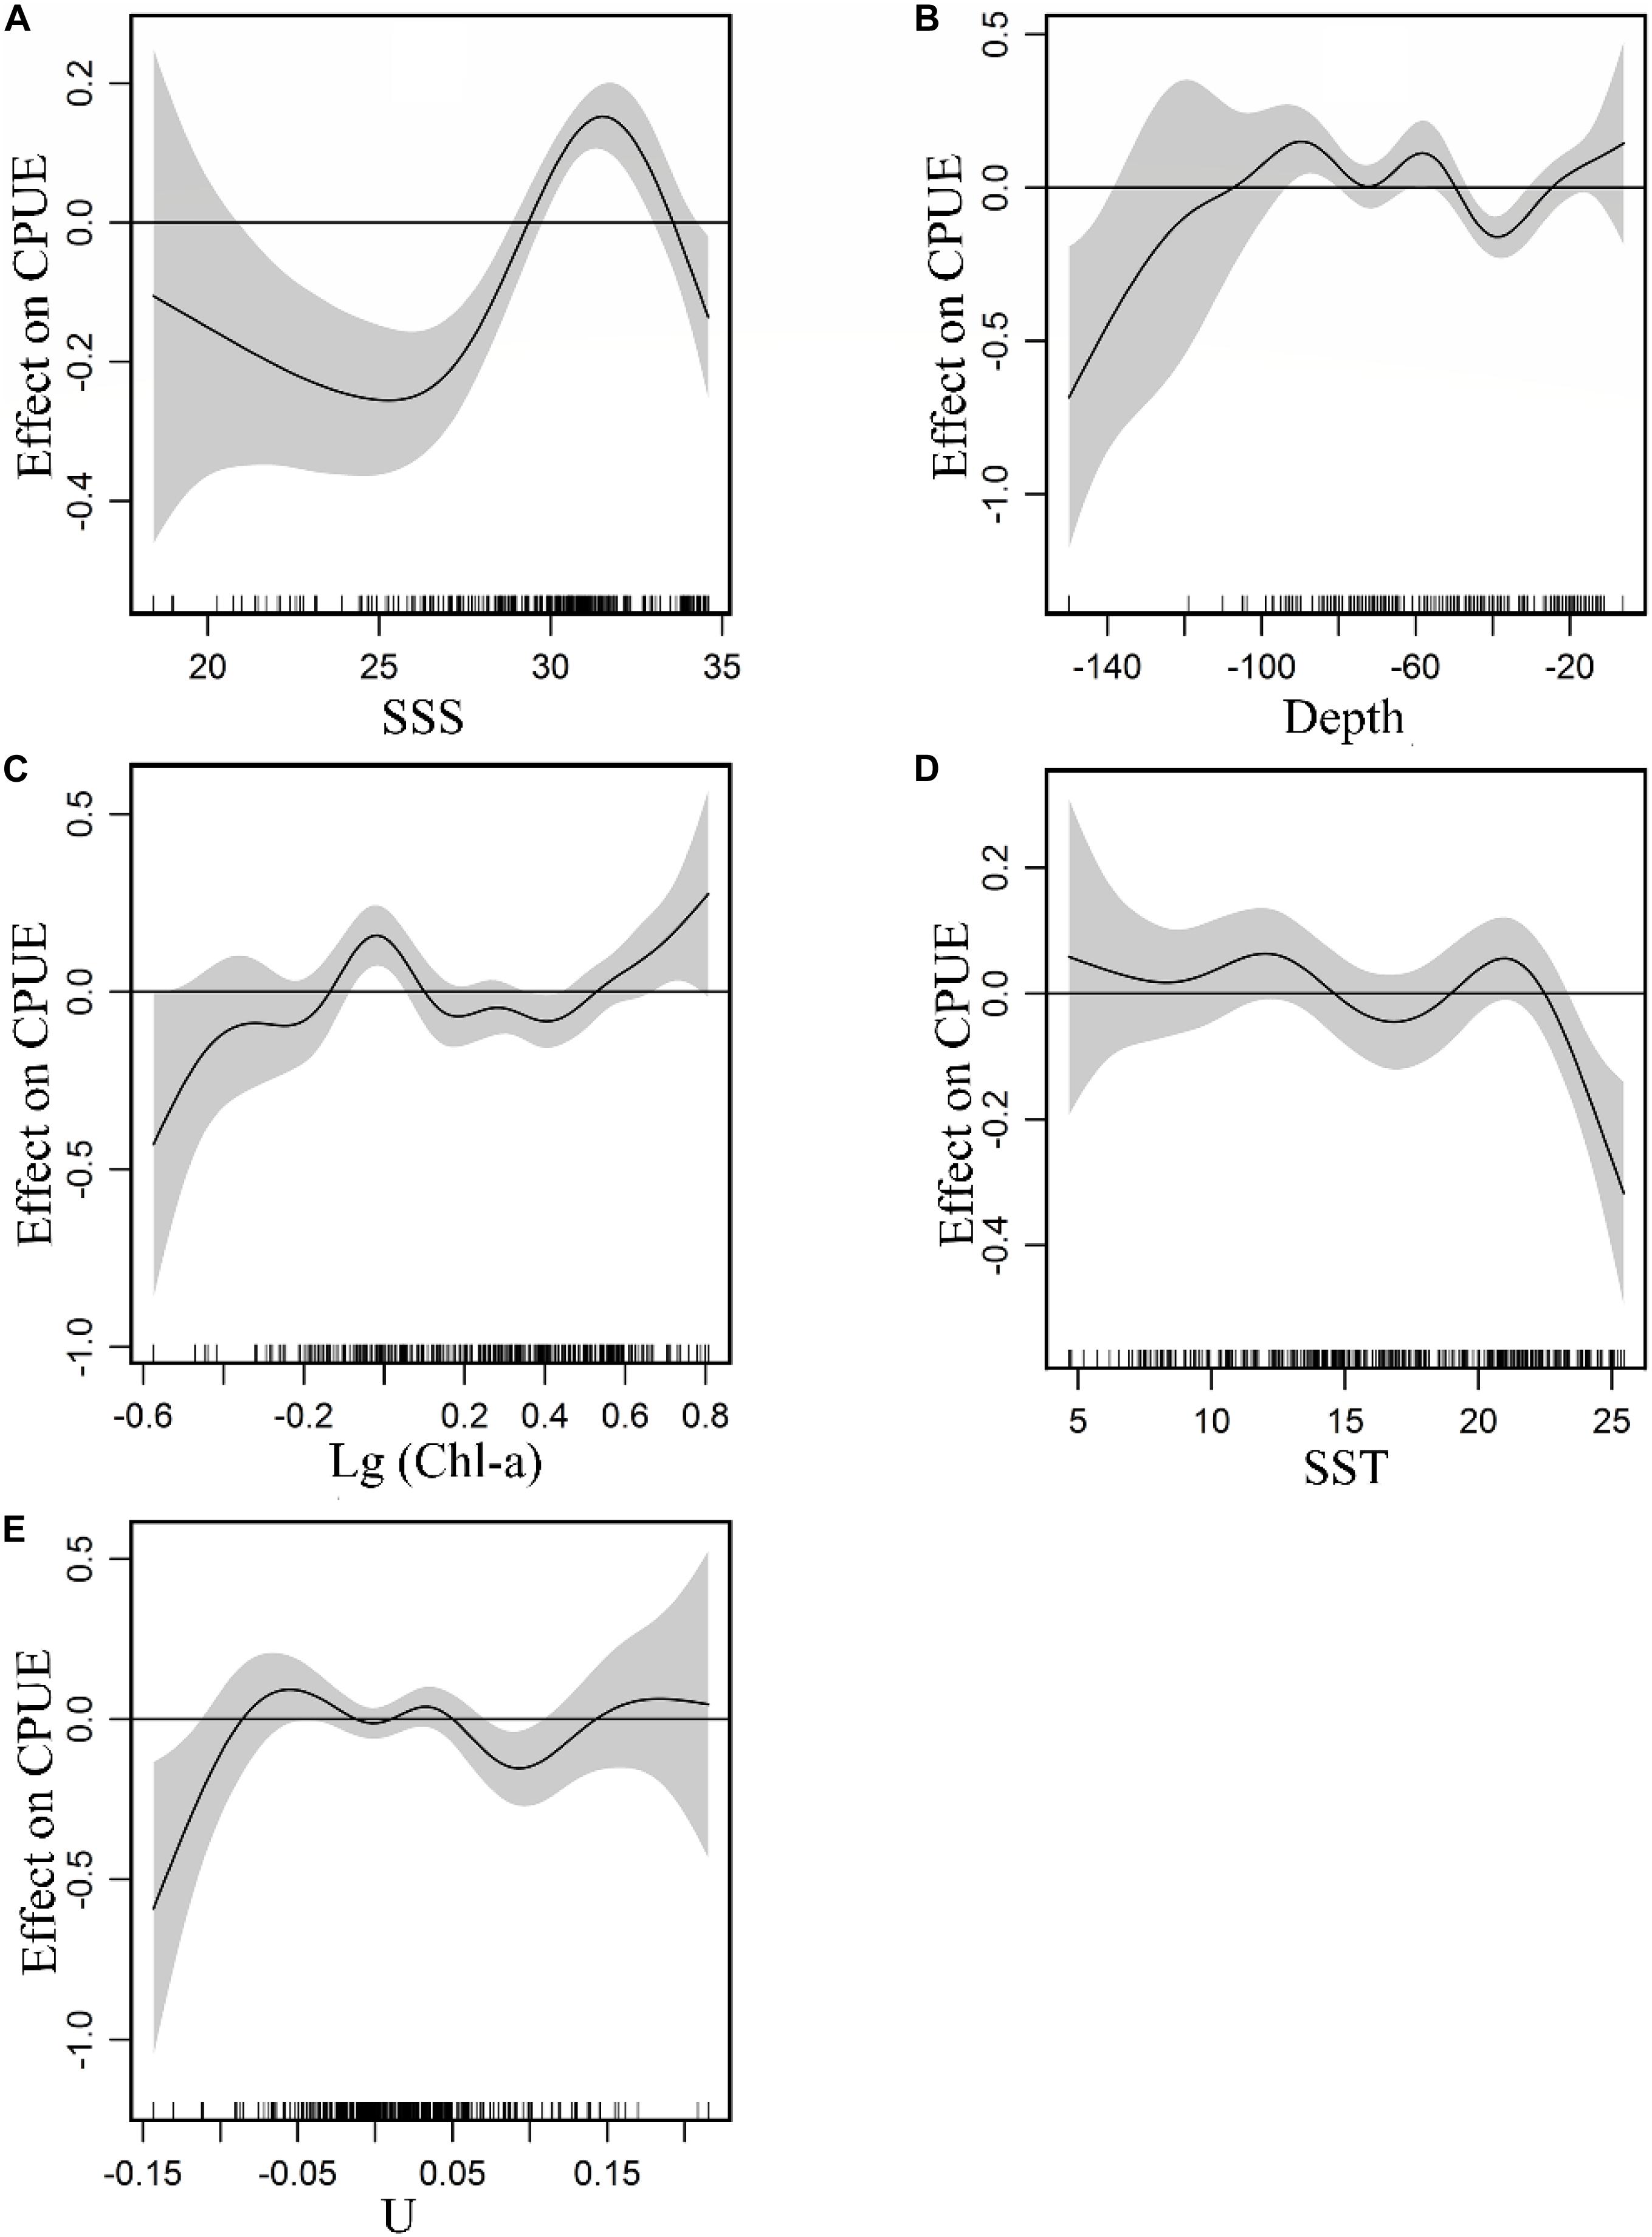
Figure 3. Effect of environmental variables on CPUE: (A) SSS, (B) Depth, (C) Chl-a, (D) SST, (E) U. Gray-shaded areas representing 95% confidence intervals with rug plot on the x-axis representing actual fishing data points, and the solid curve shows fitted GAM functions that describe the effect of environmental variables on response variables (CPUE). GAM indicates that the environmental variable had a positive effect on CPUE when the fitted solid curve of the GAM function was above the zero axis.
The Distribution of Japanese Anchovy Prediction Wintering Ground CPUE
The distribution of monthly CPUE (ton h–1) of Japanese anchovy predicted during the wintering period (2009–2015) using the GAM model is shown in Figure 4. Japanese anchovy was distributed in the eastern and southern parts of the Yellow Sea and the northern waters of the East China Sea. Its distribution also extended near the Yangtze River estuary and the Jeju Island. The black dots correspond to the actual fishing CPUE; the size of the symbol increases as the actual CPUE increases. The actual fishing locations coincided with regions of high predicted CPUE. The values of CPUE were predominantly highest in December and lowest in March. Generally, the CPUEs decreased in the Yellow Sea and increased in the East China Sea from December to March.
Figure 4. Predicted Japanese anchovy CPUE (ton h–1) overlaid with actual fishing CPUE (black dots) from December to March in 2009–2015.
The Effect of Climate Change on the CPUE of Japanese Anchovy Stock in Winter
As shown in Figures 5a–d, the changes in CPUE are significantly different from under the four climate scenarios. We found that CPUE increased by 0.02, 0.03, 0.05, and 0.11 in the Yellow Sea for RCP 2.6, RCP 4.5, RCP 6.0, and RCP 8.5 scenarios, respectively, but decreased by 0.01 for RCP 8.5 and a slight change in other scenarios in the East China Sea. The center of gravity of predicted CPUE moved northward (Supplementary Material 2.3) with a corresponding northward movement of winter habitat under increasing SST.
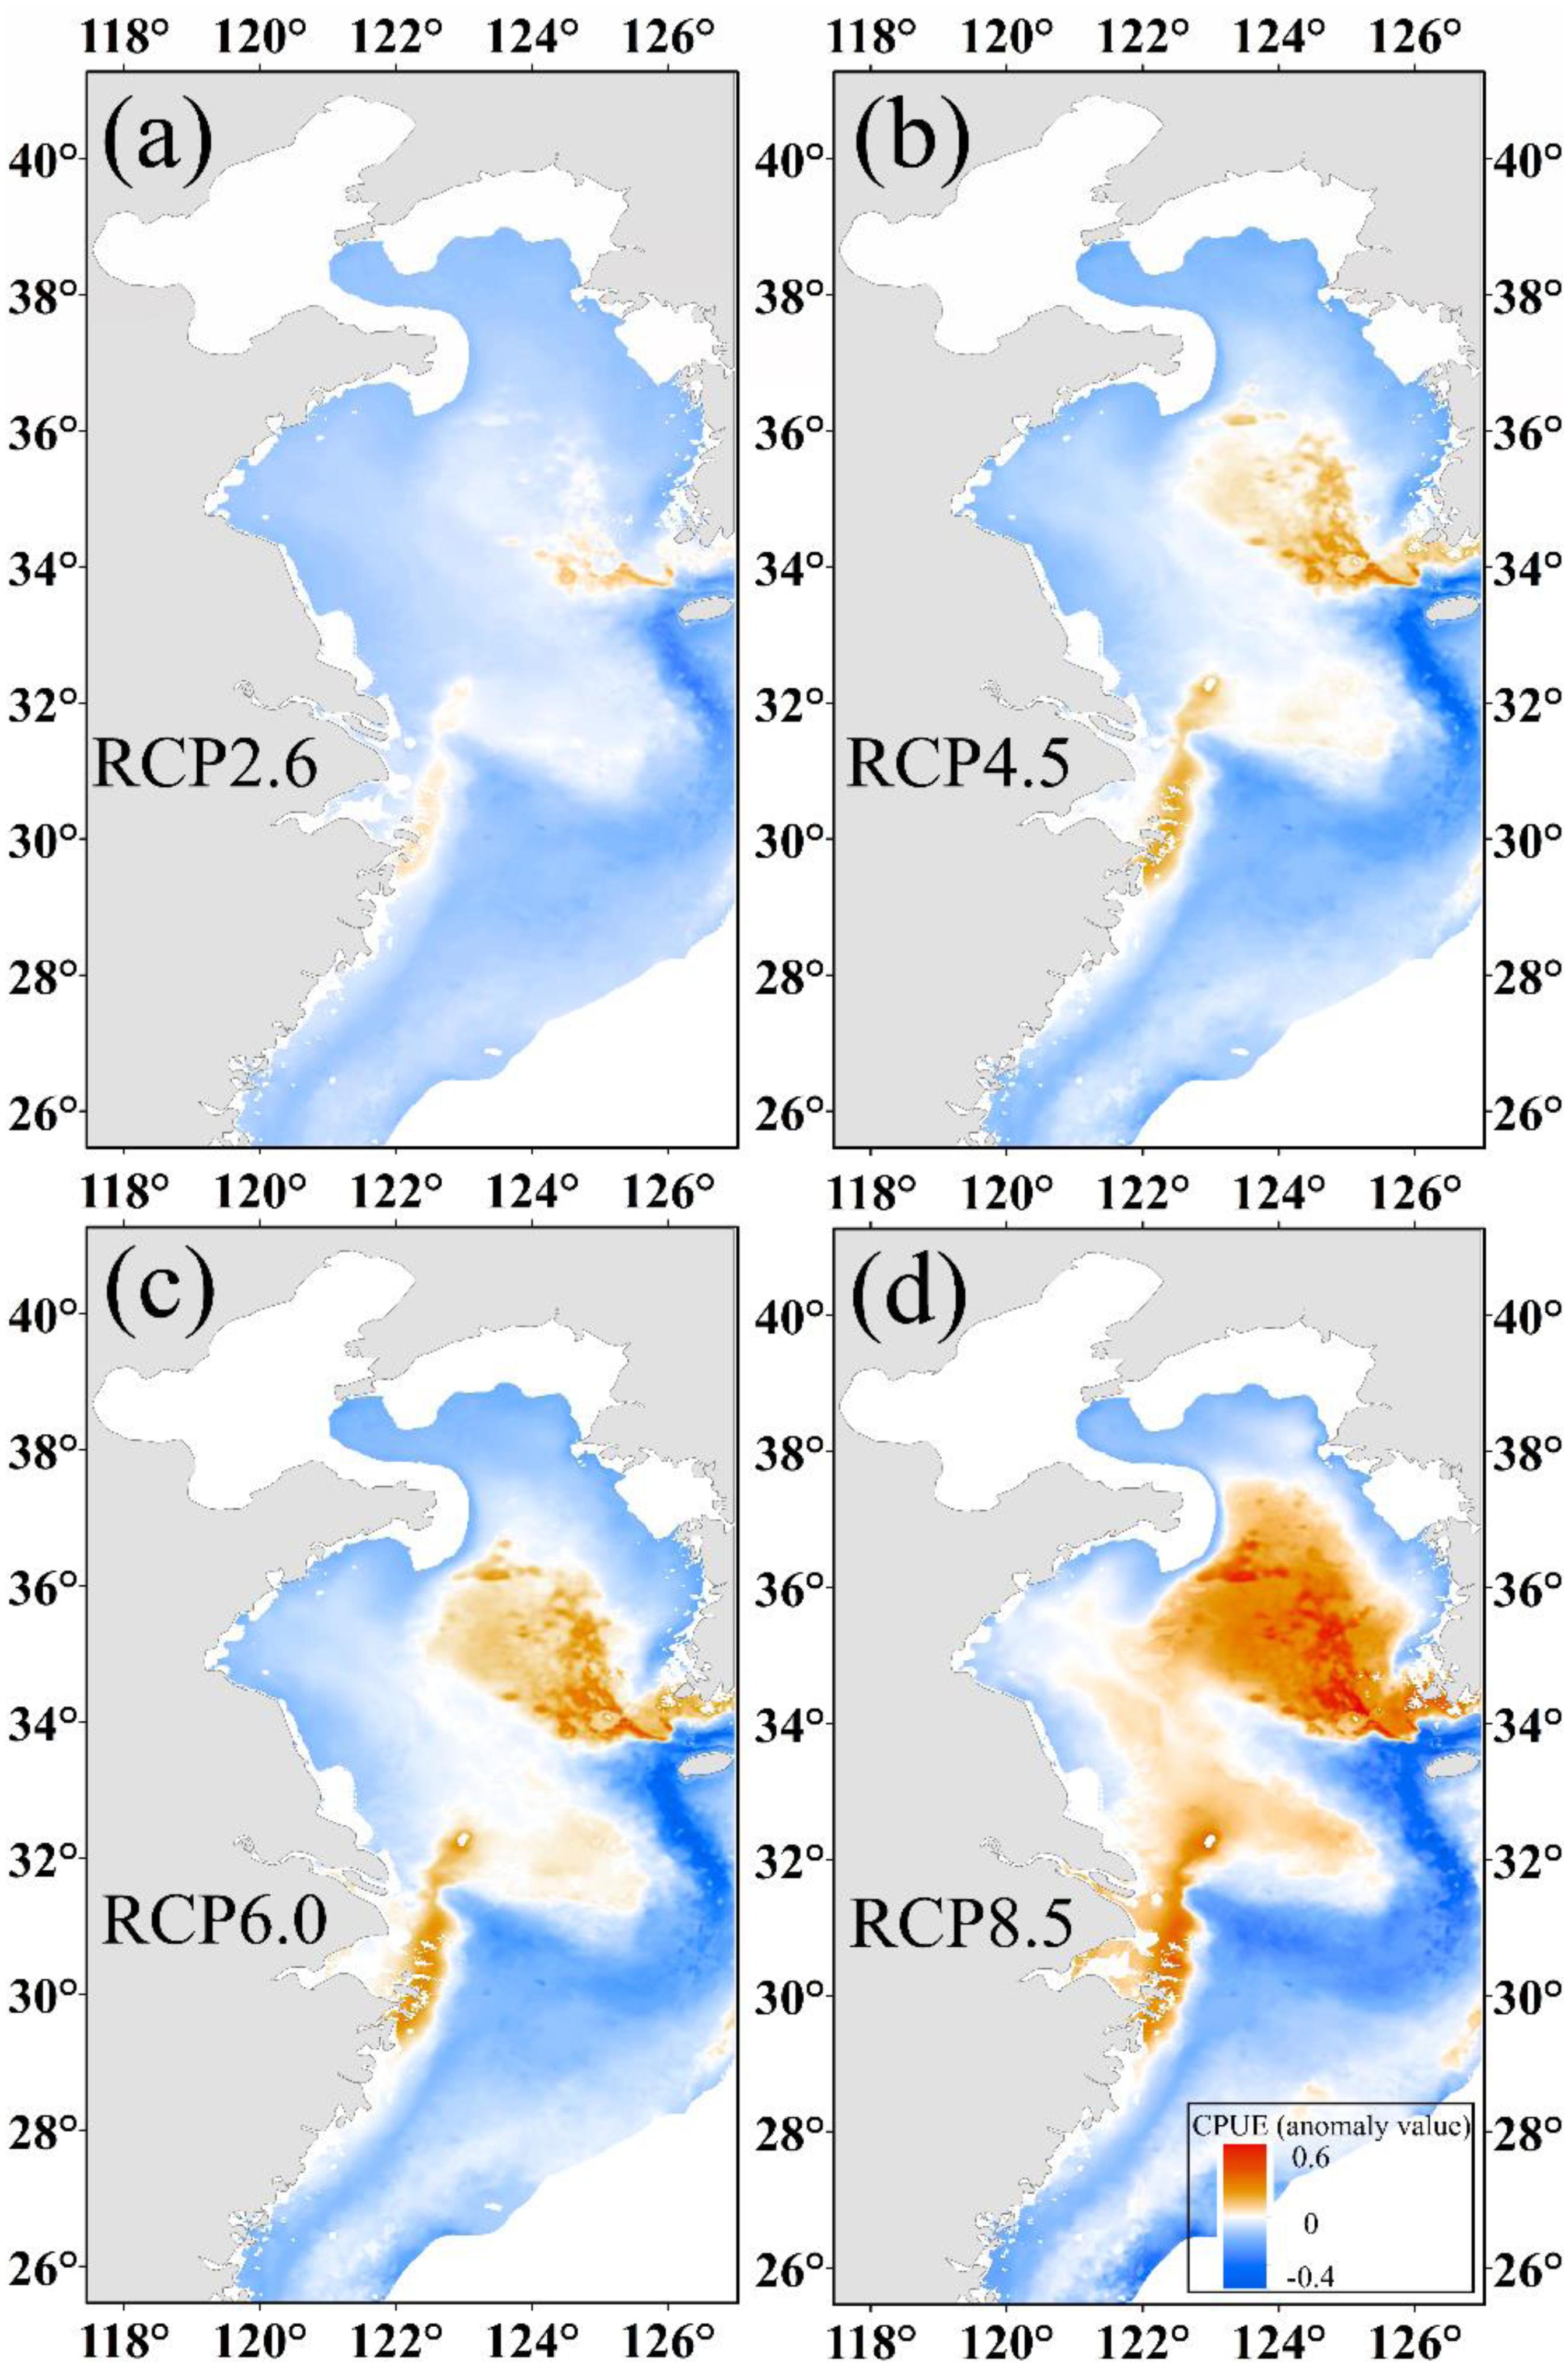
Figure 5. The predicted CPUE (ton h–1) anomaly value of Japanese anchovy based on projected increases of SST at (a) 1°C, (b) 1.8°C, (c) 2.2°C, and (d) 3.7°C at the end of the 21st century.
Correlation Between SST and the WFG CPUE Index
The SST showed that it decreased to 9.2°C in January 2011 and then increased to 10.5°C in February 2011 (Figure 6), but generally increased in China seas. The WFG CPUE index also tended to have an increasing trend from 2009 to 2015. In December, the WFG CPUE index was highest and declined as SST decreased. SST and WFG CPUE index showed a significant positive relationship (R2 = 0.69, p < 0.01) (Figure 7A).
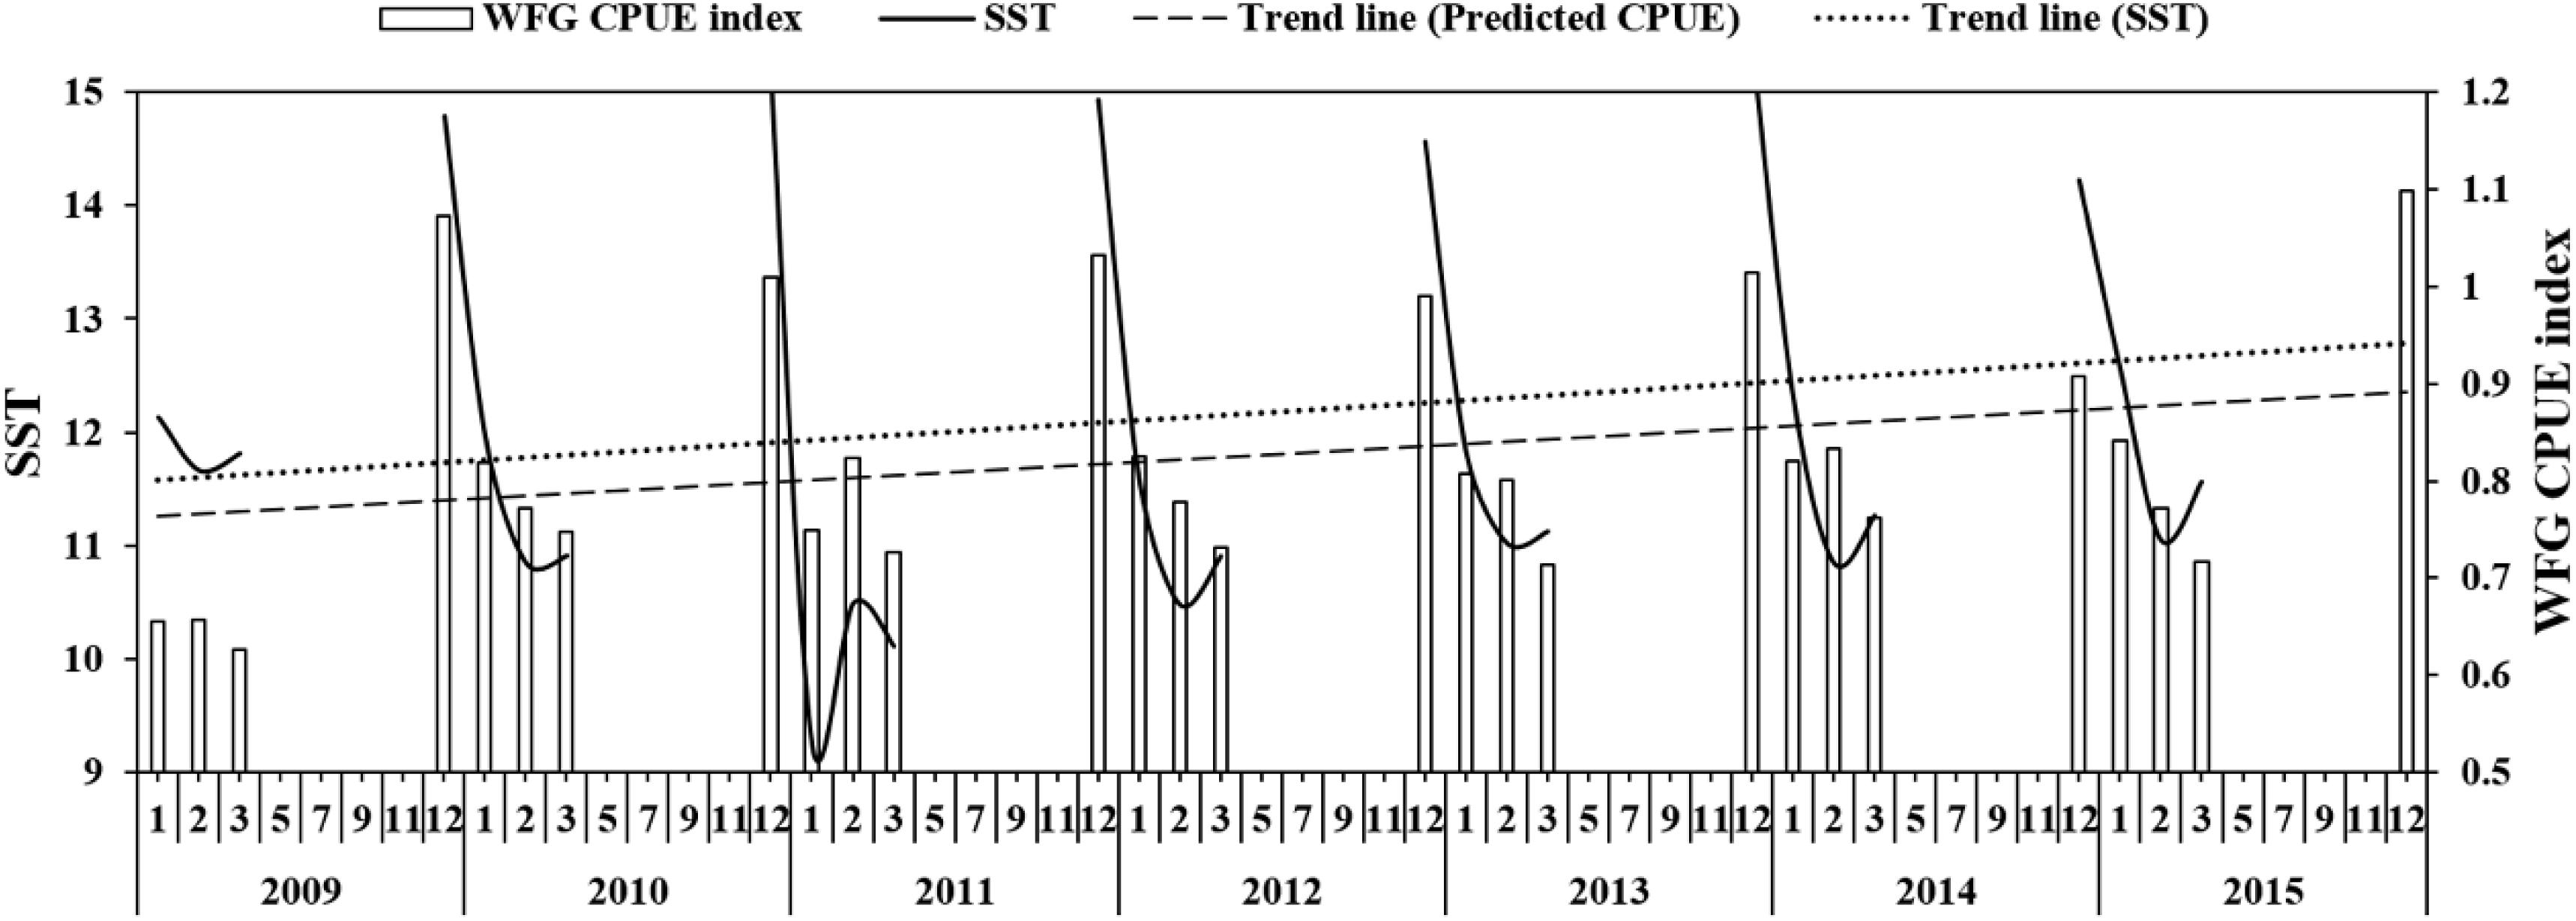
Figure 6. The relationship between predicted CPUE (ton h–1) of winter fishing ground (WFG) and SST (°C), the dotted line is the trend line of SST and predicted CPUE.
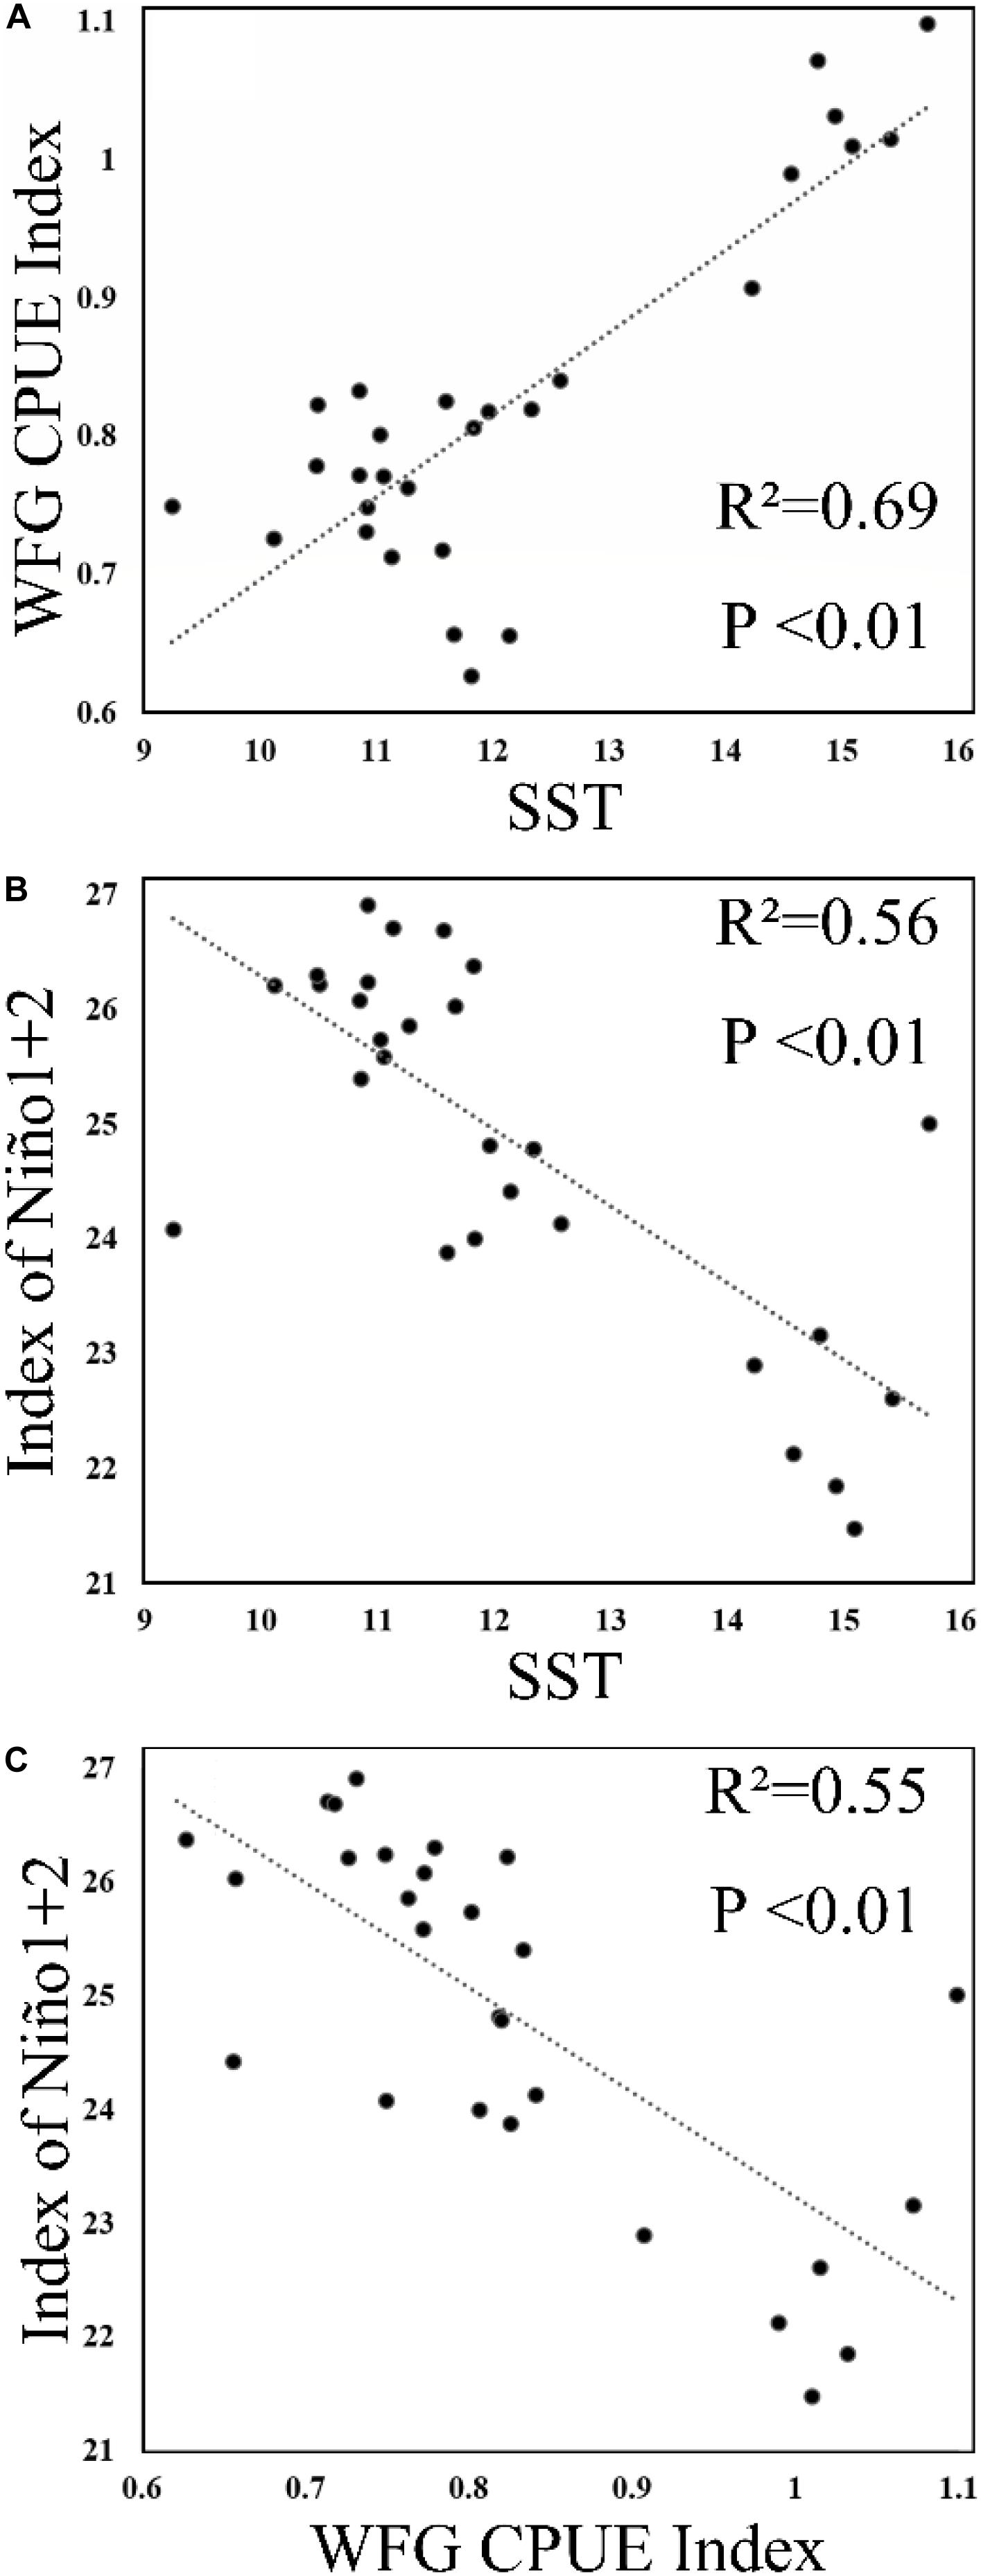
Figure 7. Scatterplot of (A) SST and winter fishing ground (WFG) CPUE index, (B) Niño1 + 2 and SST, and (C) Niño1 + 2 and WFG CPUE index.
Discussion
Impact of Environmental Variables on the CPUE of Japanese Anchovy
Our work proposed multiple marine statistical models to elucidate wintering ground distribution of Japanese anchovy, based on remotely sensed data and assimilated information. In the marine environment, the statistical model has been extensively used to predict species richness, diversity, and geographical abundance distributions (Smoliñski and Radtke, 2017). By comparing the predicted CPUE and the actual CPUE and the predicted and actual fishing ground locations, a multiple-models approach could generate the robust wintering ground predictions for Japanese anchovy. The spatial distribution of Japanese anchovy cannot be adequately monitored due to technical constraints and economic reasons, and the marine geospatial statistics model as an accurate and cost-effective technology could predict the inevitable gaps and species distribution in the unsurveyed area (Murase et al., 2009). The statistical models show the distribution of anchovy CPUE and infer the wintering ground of anchovy location. The model disclosed the impact of climate change on small pelagic fish by using Japanese anchovy as a model species; the result held the hypothesis that the rising temperature caused by climate change resulted in the shift of anchovy habitat northwardly and the increase of anchovy relative abundance. We could quantitatively evaluate the predictive ability of the marine statistical model through the comparison of different models for fishery resource protection and management application.
Freshwater discharge from the Yangtze River affects the salinity of the East China Sea (Delcroix and Murtugudde, 2002). The wide range of salinity preference of Japanese anchovy (Figure 3A) suggests that it can take advantage of nutrient-rich estuarine waters for foraging. The Changjiang Diluted Water makes the Yangtze River estuary and the adjacent East China Sea increasingly eutrophicated (Chai et al., 2006) and provides excellent feeding opportunities for the Japanese anchovy during their spawning and feeding migration. The concentration of winter fishing locations close to salinity fronts also supports these findings (Figure 8). The wintering migration of the Japanese anchovy is driven by temperature and salinity. A strong salinity front forms west of the Jeju Island in winter (Lie, 1985), where the wintering grounds for Japanese anchovy in the Yellow Sea coincides with the front near the Jeju Island (Huang et al., 2010). The Japanese anchovy catch in the south sea of the Korean peninsula accounted for 25% of the total catch in the adjacent waters (Kim and Kang, 2000). The salinity front created a good feeding environment for Japanese anchovy due to the accumulation of microalgae and zooplankton in the frontal region (Bertrand et al., 2002).
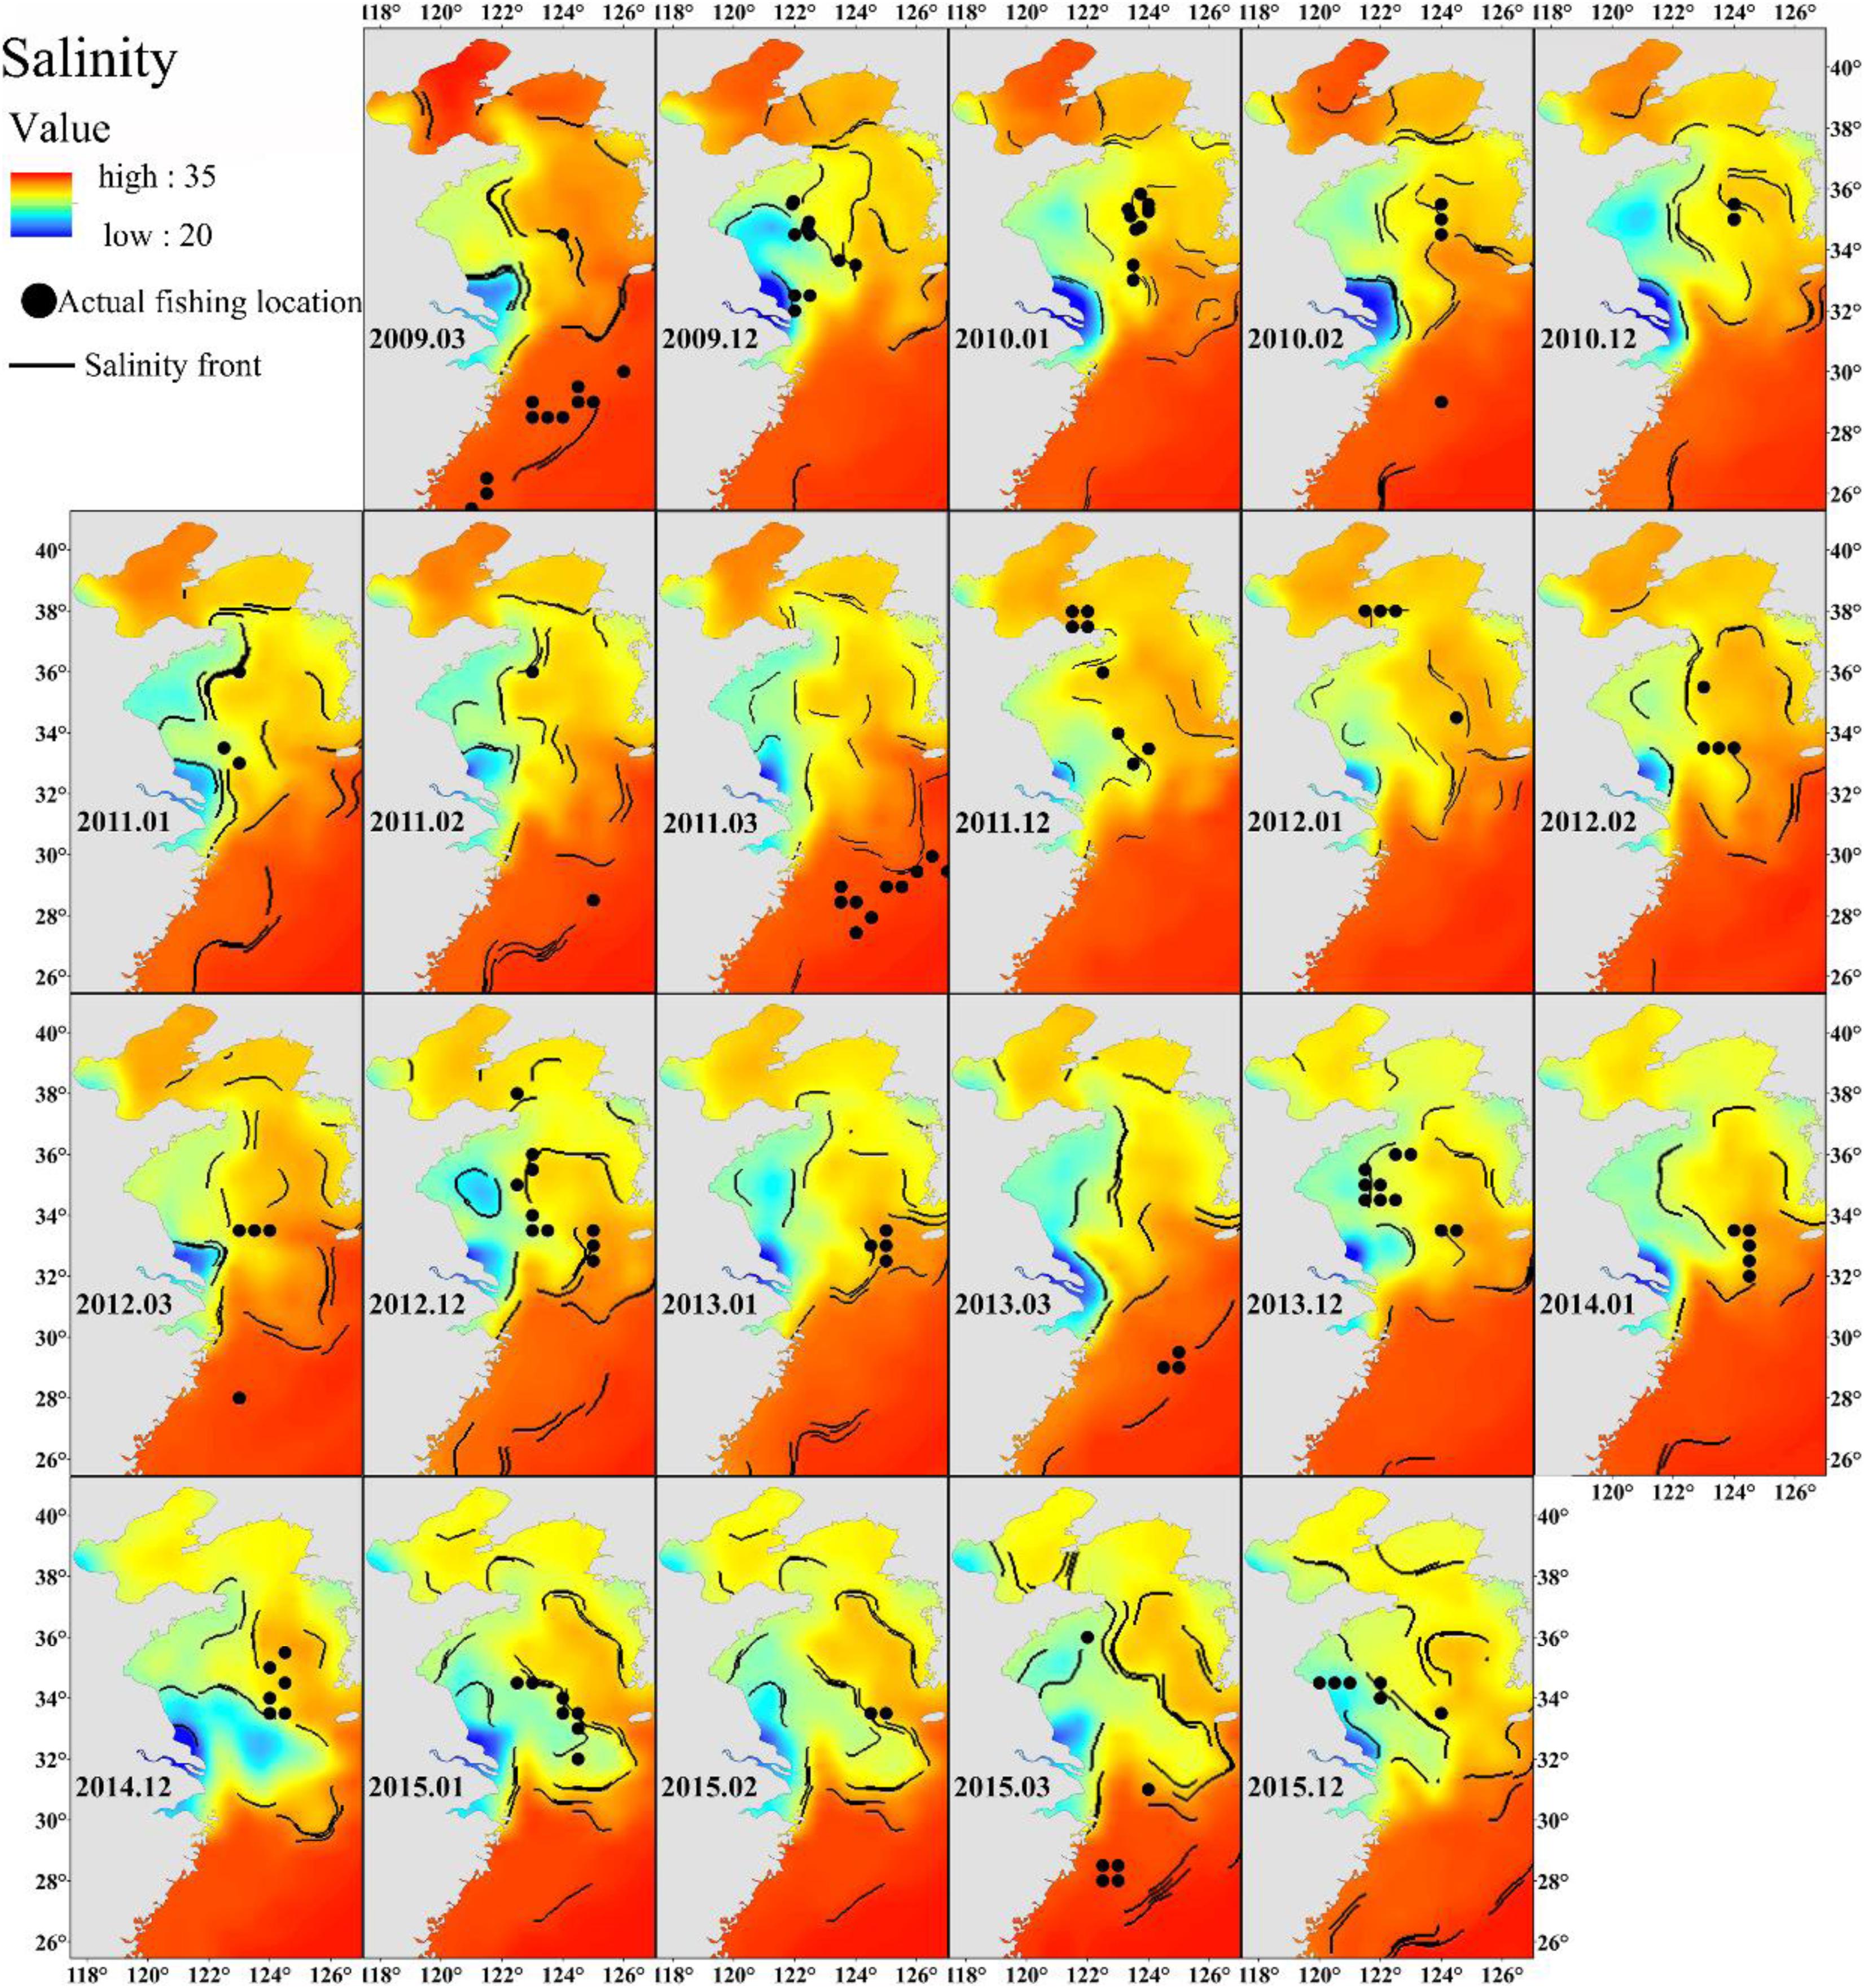
Figure 8. The relationship between winter Japanese anchovy fishing location (solid dots) and the salinity front (contours) in the China seas.
The salinity front is strongest in winter and is associated with topography (Chen, 2009). Depth is also relatively important for the CPUE distribution of the Japanese anchovy, where shallow waters (depth <50 m) generally exerted a negative effect on its CPUE. In the western margin of the North Pacific, depth indirectly plays an important role in the distribution of Japanese anchovy.
Japanese anchovy feeds on zooplankton rather than the phytoplankton (Niu et al., 2014). The earlier study has reported that the catch of Japanese anchovy is related to Chl-a concentration (Ihsan et al., 2018). Chl-a and zooplankton were also shown to be positively correlated with the catch of Japanese anchovy (Kim and Kang, 2000). Micro-zooplankton provides food sources for Japanese anchovy during their spawning and feeding migration, and Chl-a plays an indirect role in the distribution of Japanese anchovy. However, there may be a time-delayed relationship between pelagic fish and primary productivity (Yen and Lu, 2016), and Japanese anchovy feed rarely during their winter migration (Zhu, 1990). This may account for low deviance explained obtained for Chl-a.
Temperature plays a vital role in Japanese anchovy distribution (Hayashi et al., 2016). The SST range of positive effects on spawning and feeding migration is 19–22.5°C, and our results show that SST significantly influenced Japanese anchovy CPUE. The range between 8°C and 15°C was suitable for wintering Japanese anchovy, and it is concentrated between 11 and 13°C (Ma, 1989; Li et al., 2007). SST has a positive effect on the abundance of anchovy between 5°C and 9.5°C in winter (Niu et al., 2014). Our results were also consistent with the previous researches. The Japanese anchovy migrated vertically in the water layer (Zhao et al., 2008). The temperature experienced by the fish in different depth layers is the variable, and vertical change of temperature may be more influential to the distribution of Japanese anchovy and may explain the low deviance explained by SST.
The salinity front is related to the ocean current in the China seas (Chen, 2009). The current plays an indirect role in the distribution of the CPUE. In the sub-mesoscale physical process, plankton is concentrated as patches, and these patches were related to the spatial distribution of anchovy (Bertrand et al., 2008). Upwelling, that brings nutrient-rich waters to the sub-surface, also promotes primary productivity and copepod production, thus, facilitating the feeding and growth of Japanese anchovy larvae (Nakata et al., 2000).
Impact of Climate Change on Japanese Anchovy CPUE in Winter
Sea surface temperature was associated with biomass of wintering Japanese anchovy (Niu and Wang, 2017), and its catch positively correlates with SST in December (Kim and Kang, 2000). This is also consistent with our findings of an overall increasing SST trend in the China seas corresponding to an increase in WFG CPUE from 2009 to 2015 (Figures 6, 7A). The wintering ground formed in December, and as the SST decreases, Japanese anchovy in the Yellow Sea migrated southward and partially entered the East China Sea (Zhao, 2006). This migration pattern was also captured from our study and was apparent from the respective CPUE decrease and increase in the Yellow Sea and the East China Sea from December to March (Figure 4).
The suitable SST promoted Japanese anchovy migration to northern regions under warm periods over a long-term time scale (Zhou et al., 2015). Our results likewise supported our hypothesis of potential northward habitat shift and CPUE increase for Japanese anchovy under future projected warming (Figure 5). During actual fishing activities, the fishermen carry out fishing operations in areas with high fish density for several consecutive days to ensure a high catch rate (measured by CPUE). If fishing activities cannot maintain a high level of catch rate, then fishermen tend to move to other areas (Li et al., 2014). Thus, the catch rate (CPUE) could be used as an index of abundance (Maunder and Punt, 2004) and is assumed to provide a better indication of abundance than the catch and fishing effort (Lehodey et al., 1998; Chang et al., 2012). It is also effective to use the catch rate (CPUE) to explore the effects of climate change on fish (Syamsuddin et al., 2016). The maximum catch potential in the central and eastern parts of the Yellow Sea is also increasing during 2051–2060 compared to 2001–2010 (IPCC, 2014a). This suggests that the catch potential of Japanese anchovy could increase in response to the rising temperatures. Our results showed that CPUE would increase in response to future climate-driven warming, which is also consistent with our hypothesis.
As a small pelagic fish, Japanese anchovy exerts a top-down control on zooplankton and bottom-up control on pelagic predators, and hence occupy a central role in the marine food web (Rice, 1995). It is imperative that we pay attention to the migration of small pelagic as it can induce the redistribution of pelagic predators under climate change. The climate impacts on various marine species are increasingly prominent and require robust forecasts of species distribution for conservation and management of fishery resources. Global climate change effects on small pelagics (e.g., anchovies, sardines) are summarized in Table 5. For instance, European anchovy could better adapt to environmental variability. The IPCC-based model predictions for the European anchovy and Atlantic horse mackerel showed potential increase and northward habitat movement (Lenoir et al., 2011; Petitgas et al., 2013; Raybaud et al., 2017). However, the European anchovy stock was expected to decline in southern Europe due to climatic and eutrophication impacts (Macías et al., 2014; George, 2019). California anchovy was also projected to shift northward and likely become a dominant species (Cheung et al., 2015). These earlier results are also consistent with our findings. Moreover, two-thirds of the 36 reported warming-related species shifts in the North Sea highlighted northward habitat movement (Perry et al., 2005). The horse mackerel and anchovy showed a northward expansion of suitable habitats and an increased occurrence probability in the northern British waters by the 2090s (Pinnegar et al., 2017). The copepod abundance and composition will most likely lead to an increase in anchovy abundance under global warming (Stenevik and Sundby, 2007). In the Southern Hemisphere, the habitat distribution of Peruvian anchovy also showed climate-driven poleward shifts (except summer), with decreases in the potential relative in the north and central-south areas (Silva et al., 2016, 2019). Similarly, anchovy and sardine exhibited a large-scale phenomenon of alternation in abundance, associated with climate-associated temperature changes. In particular, the anchovy and sardine abundance showed respective positive and negative correlations against SST, with a stronger correlation between SST and anchovy abundance (Chavez et al., 2003; Checkley et al., 2009; Nakayama et al., 2018). The CPUE and landings of common sardine in the coastal areas off Chile were also projected to decrease in response to climate change (Silva et al., 2015; Yáñez et al., 2016). The biomass and expected profits of the European sardine will obviously decrease with increasing surface temperatures in Iberian-Atlantic (Garza-Gil et al., 2011). However, it would increase in the Bay of Biscay, which is north of the Iberian-Atlantic (Shchepetkin and McWilliams, 2005). The Japanese and Pacific sardines were also expected to expand northward with warming and the latter’s suitable habitat was expected to decrease by 50% in the Gulf of California and Mexican Northwest (Okunishi et al., 2012; Cheung et al., 2015; Petatán-Ramírez et al., 2019).
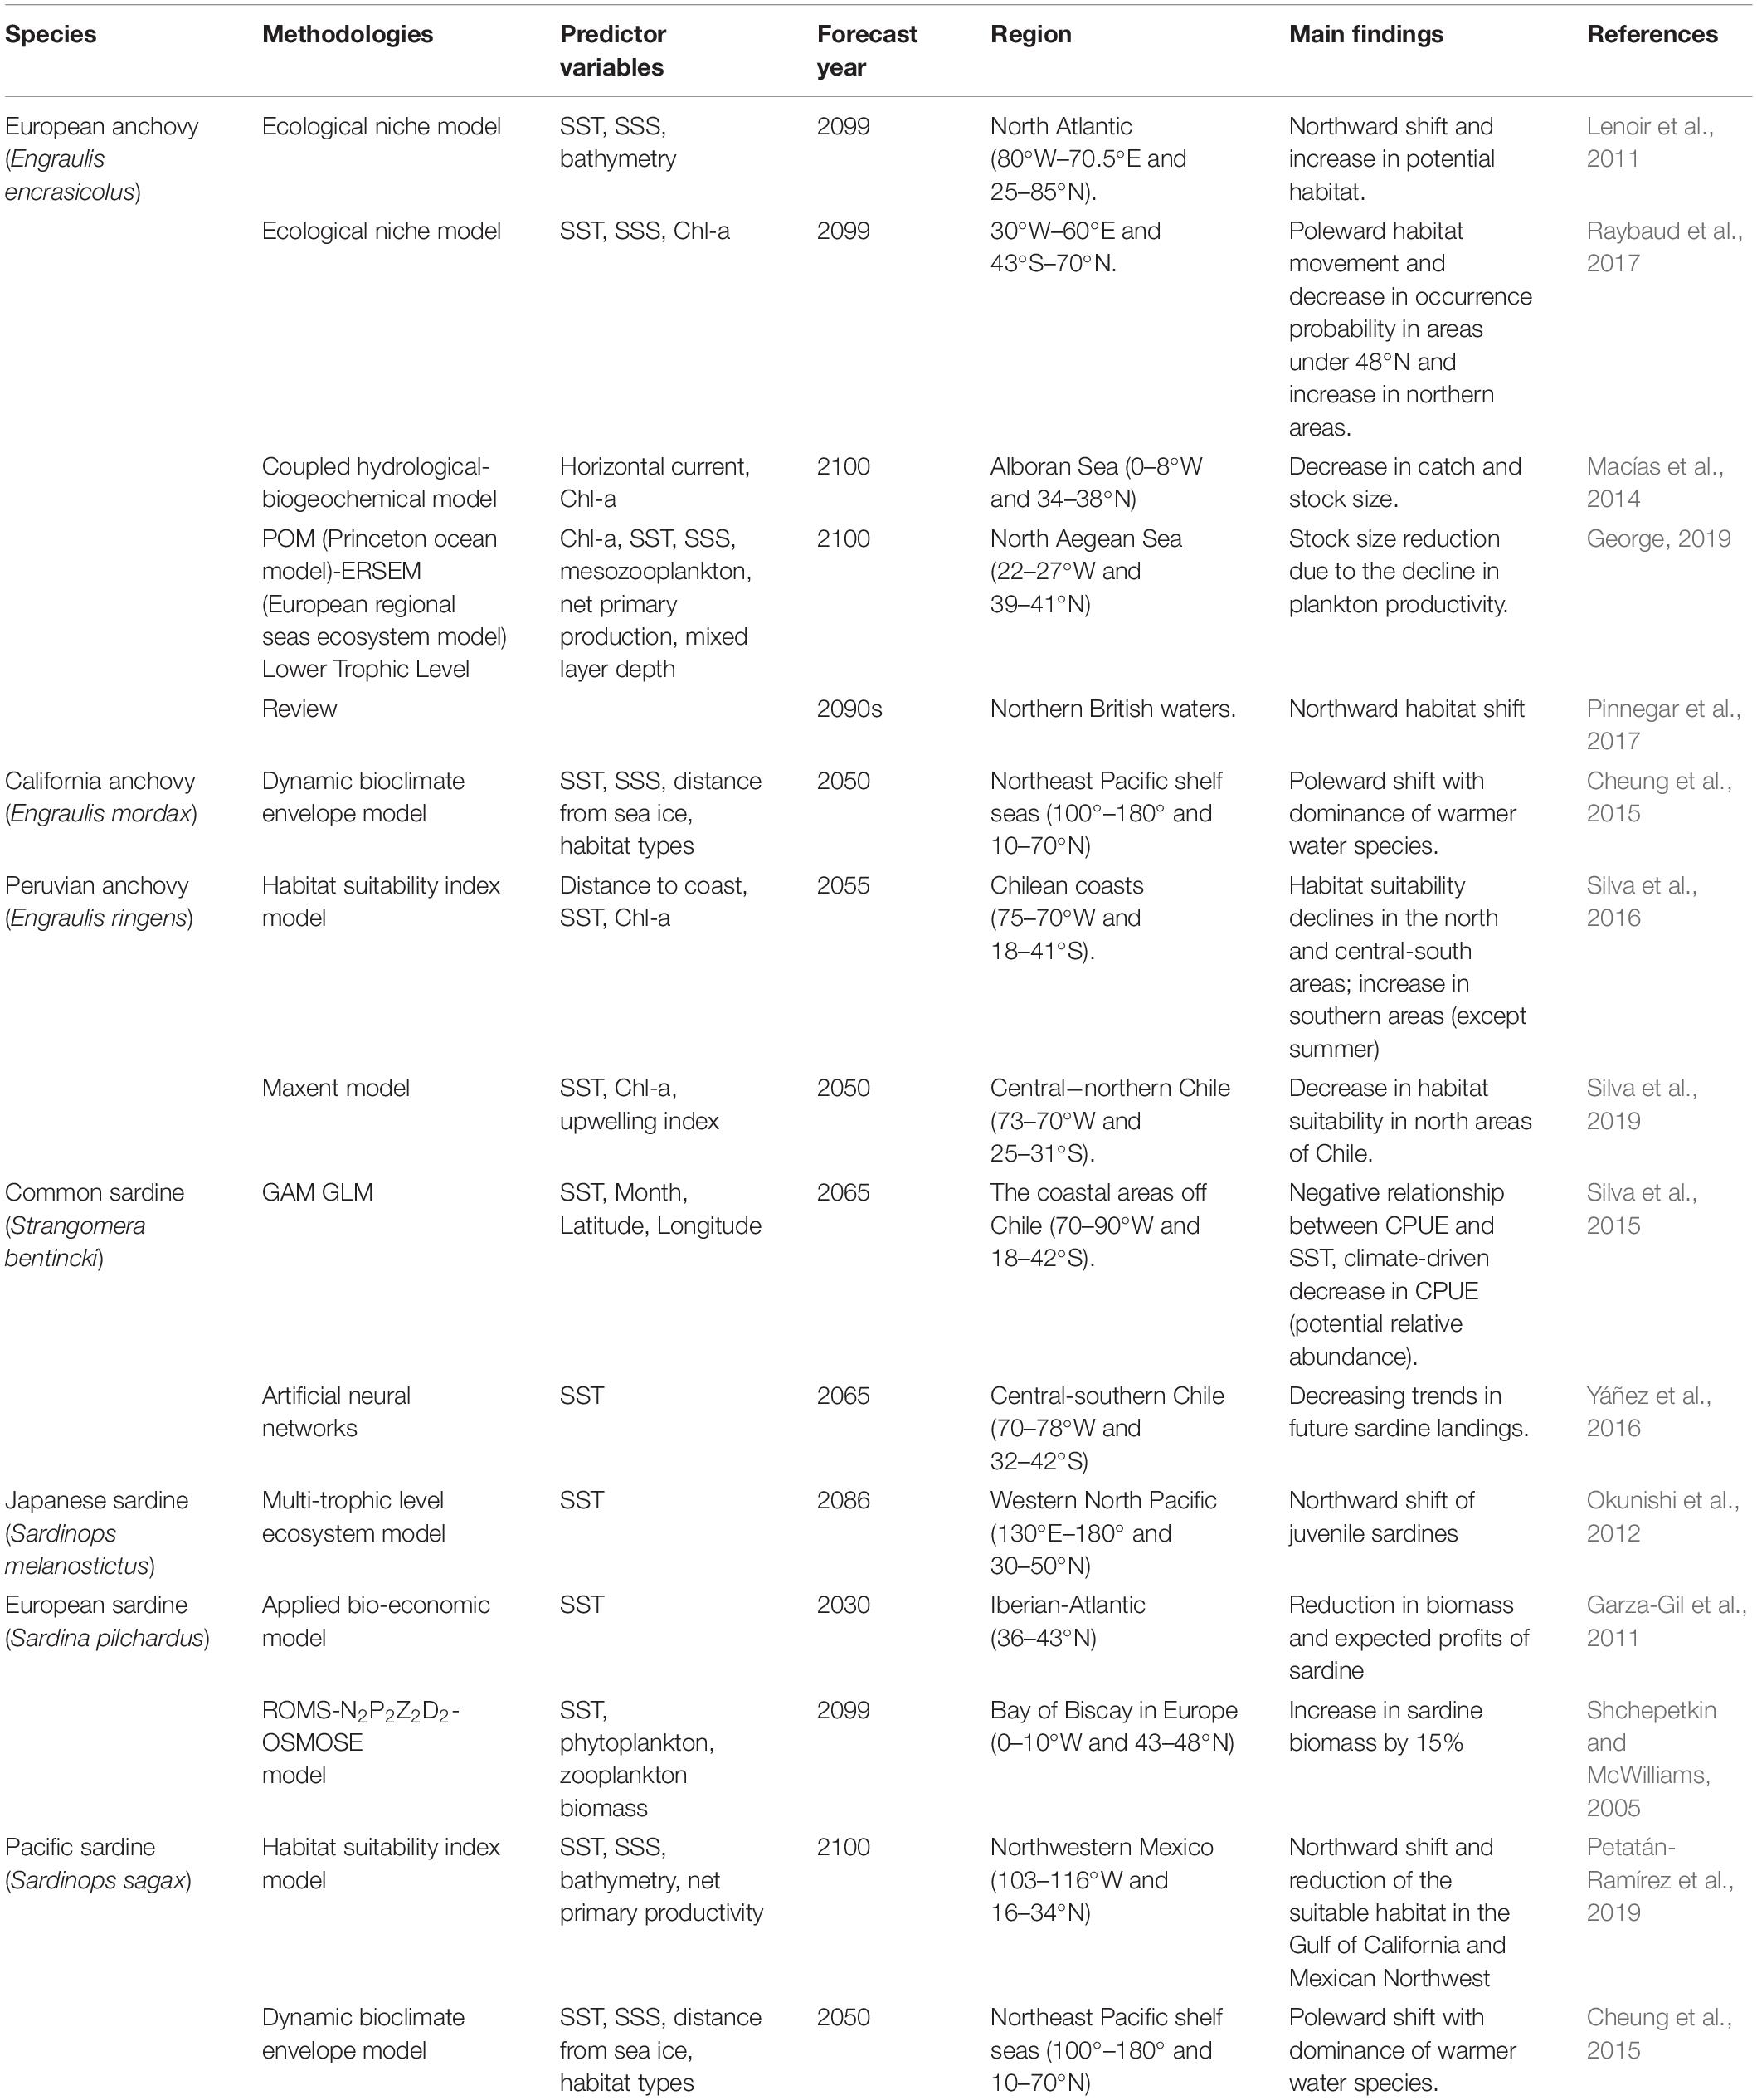
Table 5. Summary of recent studies on the climate change impacts on small pelagic fish (anchovies, sardines) across the different regions of the world.
Our result also showed that anchovy CPUE has a significant positive correlation with SST, albeit the Niño1 + 2 showed a significant negative correlation with SST and WFG CPUE index (Figures 7B,C). During an El Niño (positive Niño 1 + 2), the SST in the China seas was lower than during La Niña (negative Niño 1 + 2) (Jia and Sun, 2002; Wang et al., 2012). One possible mechanism to explain the impact of ENSO on the Japanese anchovy habitat could be provided by looking into the ENSO-related phenomena: ENSO affects the precipitation and subsequent discharge of the Yangtze River that influences temperature and salinity in the China seas. The variability in marine environments affects the wintering grounds and the life history of the Japanese anchovy. For pelagic fish, ENSO is also known to impact the environmental features of their spawning and feeding grounds (Yu et al., 2019). Here, the extent of its impact is likewise evident in the Japanese anchovy wintering ground, when it has the highest annual concentration.
Conclusion
The marine geospatial statistical model using environmental predictors provided important information on the wintering ground of Japanese anchovy. A comparison of the three models showed that GAM is the most suitable prediction model for wintering Japanese anchovy. Its distribution was not only affected by SST but also closely related to the salinity front, feeding opportunity, and ocean currents. From SSS images, the salinity front was detected as the main surface feature associated with its wintering ground, highlighting the importance of SSS to the distribution of anchovy. The impact of ENSO on the Japanese anchovy distribution is captured through its influence on the SST on the wintering fishing ground, where CPUE and Niño1 + 2 indices showed a significant negative correlation. We also proposed a hypothesis and explored the influence of future warming on its winter habitat based on four IPCC climate scenarios. Our research reinforced our hypothesis, where temperature increases resulted in a northward habitat shift and CPUE enhancement by the end of the century. This information would be useful in formulating protection policies and promoting sustainable development of fishery resources in the region.
Data Availability Statement
The raw data supporting the conclusions of this article will be made available by the authors, without undue reservation.
Author Contributions
All authors listed have made a direct and substantial contribution to this work. SL performed the data analyses and wrote the manuscript. YL conceived the idea for the study and analyses and edited the manuscript. IA edited and proofread the earlier versions of the manuscript. YT collected the data and edited the manuscript. ZY, HY, and JL edited the manuscript. JC provided the fishery data.
Funding
This study was supported by the National Key R&D Program of China (No. 2018YFD0900902), Shandong Key R&D Program (No. 2019GHY112014), National Natural Science Foundation of China (Nos. 41876177 and 41976210), and the Fundamental Research Funds for the Central Universities (Nos. 201822027 and 201762015).
Disclaimer
Frontiers Media SA remains neutral with regard to jurisdictional claims in published maps and institutional affiliations.
Conflict of Interest
The authors declare that the research was conducted in the absence of any commercial or financial relationships that could be construed as a potential conflict of interest.
Acknowledgments
We are grateful to Dr. Suam Kim (Pukyong National University), Dr. Yoshiro Watanabe (The University of Tokyo), and Dr. Mikko Petteri Heino (University of Bergen) for valuable discussions, comments, and advice on the manuscript.
Supplementary Material
The Supplementary Material for this article can be found online at: https://www.frontiersin.org/articles/10.3389/fmars.2020.00604/full#supplementary-material
Footnotes
- ^ https://oceancolor.gsfc.nasa.gov/
- ^ http://apdrc.soest.hawaii.edu/data/data.php
- ^ https://www.ngdc.noaa.gov/mgg/global/
- ^ https://www.ncdc.noaa.gov/teleconnections/enso/indicators/sst/
References
Bertrand, A., Gerlotto, F., Bertrand, S., Gutiérrez, M., Alza, L., Chipollini, A., et al. (2008). Schooling behaviour and environmental forcing in relation to anchoveta distribution: an analysis across multiple spatial scales. Prog. Oceanogr. 79, 264–277. doi: 10.1016/j.pocean.2008.10.018
Bertrand, A., Josse, E., Bach, P., Gros, P., and Dagorn, L. (2002). Hydrological and trophic characteristics of tuna habitat: consequences on tuna distribution and longline catchability. Can. J. Fish. Aquat. Sci. 59, 1002–1013. doi: 10.1139/f02-073
Brierley, A. S., and Kingsford, M. J. (2009). Impacts of climate change on marine organisms and ecosystems. Curr. Biol. 19, R602–R614. doi: 10.1016/j.cub.2009.05.046
Carton, J. A., and Giese, B. S. (2008). A reanalysis of ocean climate using Simple Ocean Data Assimilation (SODA). Mon. Weather Rev. 136, 2999–3017. doi: 10.1175/2007MWR1978.1
Cayula, J. F., and Cornillon, P. (1992). Edge detection algorithm for SST images. J. Atmos. Ocean. Technol. 9, 67–80. doi: 10.1175/1520-0426(1992)009<0067:edafsi>2.0.co;2
Chai, C., Yu, Z., Song, X., and Cao, X. (2006). The status and characteristics of eutrophication in the Yangtze River (Changjiang) estuary and the adjacent East China Sea, China. Hydrobiologia 563, 313–328. doi: 10.1007/s10750-006-0021-7
Chang, Y. J., Sun, C. L., Chen, Y., Yeh, S. Z., and Dinardo, G. (2012). Habitat suitability analysis and identification of potential fishing grounds for swordfish, Xiphias gladius, in the South Atlantic Ocean. Int. J. Remote Sens. 33, 7523–7541. doi: 10.1080/01431161.2012.685980
Chavez, F. P., Ryan, J., Lluch-Cota, S. E., and Ñiquen, C. M. (2003). Climate: from anchovies to sardines and back: multidecadal change in the Pacific Ocean. Science 299, 217–221. doi: 10.1126/science.1075880
Checkley, D. M., Alheit, J., Oozeki, Y., and Roy, C. (2009). Climate Change and Small Pelagic Fish. Cambridge: Cambridge University Press.
Chen, C. T. A. (2009). Chemical and physical fronts in the Bohai, Yellow and East China seas. J. Mar. Syst. 78, 394–410. doi: 10.1016/j.jmarsys.2008.11.016
Cheung, W. W. L., Brodeur, R. D., Okey, T. A., and Pauly, D. (2015). Projecting future changes in distributions of pelagic fish species of Northeast Pacific shelf seas. Prog. Oceanogr. 130, 19–31. doi: 10.1016/j.pocean.2014.09.003
Cornic, M., and Rooker, J. R. (2018). Influence of oceanographic conditions on the distribution and abundance of blackfin tuna (Thunnus atlanticus) larvae in the Gulf of Mexico. Fish. Res. 201, 1–10. doi: 10.1016/j.fishres.2017.12.015
Delcroix, T., and Murtugudde, R. (2002). Sea surface salinity changes in the East China Sea during 1997-2001: influence of the Yangtze River. J. Geophys. Res. Ocean. 107, 1–11. doi: 10.1029/2001jc000893
Dong, L. X., Guan, W. B., Chen, Q., Li, X. H., Liu, X. H., and Zeng, X. M. (2011). Sediment transport in the Yellow Sea and East China Sea. Estuar. Coast. Shelf Sci. 93, 248–258. doi: 10.1016/j.ecss.2011.04.003
Garza-Gil, M. D., Torralba-Cano, J., and Varela-Lafuente, M. M. (2011). Evaluating the economic effects of climate change on the European sardine fishery. Reg. Environ. Change 11, 87–95. doi: 10.1007/s10113-010-0121-9
Gen, L., Baohua, R., Chengyun, Y., and Jianqiu, Z. (2010). Indices of El Niño and El Niño Modoki: an improved El Niño Modoki index. Adv. Atmos. Sci. 27, 1210–1220. doi: 10.1007/s00376-010-9173-5.1.Introduction
George, T. (2019). Climatic and eutrophication effects on the North Aegean Sea productivity and anchovy (Engraulis encrasicolus) stock. Oceanogr. Fish. Open Access J. 8, 1–11. doi: 10.19080/ofoaj.2018.08.555749
Guisan, A., Edwards, T. C., and Hastie, T. (2002). Generalized linear and generalized additive models in studies of species distributions: setting the scene. Ecol. Modell. 157, 89–100. doi: 10.1016/s0304-3800(02)00204-1
Hanley, D. E., Bourassa, M. A., O’Brien, J. J., Smith, S. R., and Spade, E. R. (2003). A quantitative evaluation of ENSO indices. J. Clim. 16, 1249–1258. doi: 10.1175/1520-0442(2003)16<1249:aqeoei>2.0.co;2
Hayashi, A., Zhang, K., Saruwatari, T., Kawamura, T., and Watanabe, Y. (2016). Distribution of eggs and larvae of Japanese anchovy Engraulis japonicus in the Pacific waters off northern Japan in summer. Fish. Sci. 82, 311–319. doi: 10.1007/s12562-015-0966-4
Huang, D., Zhang, T., and Zhou, F. (2010). Sea-surface temperature fronts in the Yellow and East China Seas from TRMM microwave imager data. Deep Sea Res. Part II Top. Stud. Oceanogr. 57, 1017–1024. doi: 10.1016/j.dsr2.2010.02.003
Huang, J., Sun, Y., Jia, H., Yang, Q., and Tang, Q. (2014). Spatial distribution and reconstruction potential of Japanese anchovy (Engraulis japonicus) based on scale deposition records in recent anaerobic sediment of the Yellow Sea and East China Sea. Acta Oceanol. Sin. 33, 138–144. doi: 10.1007/s13131-014-0573-8
Ihsan, E. N., Enita, S. Y., and Kunarso Wirasatriya, A. (2018). Oceanographic factors in fishing ground location of anchovy at Teluk Cenderawasih National Park, West Papua : are these factors have an effect of whale sharks appearance frequencies? IOP Conf. Ser. Earth Environ. Sci. 116:012017. doi: 10.1088/1755-1315/116/1/012017
IPCC (2014a). Climate Change 2014: Impacts, Adaptation, and Vulnerability. Summaries, Frequently Asked Questions, and Cross-Chapter Boxes. A Contribution of Working Group II to the Fifth Assessment Report of the Intergovernmental Panel on Climate Change, eds C. B. Field, V. R. Barros, D. J. Dokken, K. J. Mach, and M. D. Mastrandrea Geneva, (Geneva: World Meteorological Organization).
IPCC (2014b). Climate Change 2014 Synthesis Report Summary Chapter for Policymakers. Geneva: IPCC. doi: 10.1017/CBO9781107415324
Jia, R. L., and Sun, L. (2002). Distribution features of the Yellow and Bohai Seas temperature in winter and summer. Mar. Sci. Bull. 21, 1–8.
Jiang, Y. Z., Cheng, J. H., and Li, S. F. (2009). Temporal changes in the fish community resulting from a summer fishing moratorium in the northern East China Sea. Mar. Ecol. Prog. Ser. 387, 265–273. doi: 10.3354/meps08078
Johnson, J. B., and Omland, K. S. (2004). Model selection in ecology and evolution. Trends Ecol. Evol. 19, 101–108. doi: 10.1016/j.tree.2003.10.013
Kim, J. Y., Kang, Y. S., Oh, H. J., Suh, Y. S., and Hwang, J. D. (2005). Spatial distribution of early life stages of anchovy (Engraulis japonicus) and hairtail (Trichiurus lepturus) and their relationship with oceanographic features of the East China Sea during the 1997-1998 El Niño Event. Estuar. Coast. Shelf Sci. 63, 13–21. doi: 10.1016/j.ecss.2004.10.002
Kim, S., and Kang, S. (2000). Ecological variations and El Niño effects off the southern coast of the Korean Peninsula during the last three decades. Fish. Oceanogr. 9, 239–247. doi: 10.1046/j.1365-2419.2000.00142.x
Kitagawa, T., Sartimbul, A., Nakata, H., Kimura, S., Yamada, H., and Nitta, A. (2006). The effect of water temperature on habitat use of young Pacific bluefin tuna Thunnus orientalis in the East China Sea. Fish. Sci. 72, 1166–1176. doi: 10.1111/j.1444-2906.2006.01273.x
Klemas, V. (2012). Remote sensing of environmental indicators of potential fish aggregation: an overview. Baltica 25, 99–112. doi: 10.5200/baltica.2012.25.10
Kwon, D. H., Hwang, S. D., and Lim, D. (2012). Catch predictions for pacific anchovy Engraulis japonicus larvae in the Yellow Sea. Fish. Aquat. Sci. 15, 345–352. doi: 10.5657/fas.2012.0345
Lecomte, F., Grant, W. S., Dodson, J. J., Rodríguez-Sánchez, R., and Bowen, B. W. (2004). Living with uncertainty: genetic imprints of climate shifts in East Pacific anchovy (Engraulis mordax) and sardine (Sardinops sagax). Mol. Ecol. 13, 2169–2182. doi: 10.1111/j.1365-294X.2004.02229.x
Lehodey, P., Bertignac, M., Christophe, A. S., Memery, M. L., and Grima, N. (1998). Predicting skipjack tuna forage distributions. Fish. Oceanogr. 7, 317–325. doi: 10.1046/j.1365-2419.1998.00063.x
Lenoir, S., Beaugrand, G., and Lecuyer, É. (2011). Modelled spatial distribution of marine fish and projected modifications in the North Atlantic Ocean. Glob. Change Biol. 17, 115–129. doi: 10.1111/j.1365-2486.2010.02229.x
Li, G., Chen, X., Lei, L., and Guan, W. (2014). Distribution of hotspots of chub mackerel based on remote-sensing data in coastal waters of China. Int. J. Remote Sens. 35, 4399–4421. doi: 10.1080/01431161.2014.916057
Li, Y., Zhao, X. Y., Zhang, T., Li, X. S., and Wei, H. (2007). Wintering migration and distribution of anchovy in the Yellow Sea and its relation to physical environment. Mar. Fish. Res. 28, 104–112.
Lie, H. J. (1985). Wintertime temperature-salinity characteristics in the southeastern Hwanghae (Yellow Sea). J. Oceanogr. Soc. Jpn. 41, 291–298. doi: 10.1007/BF02109236
Liu, Y., Saitoh, S., Maekawa, K., Mochizuki, K. I., and Tian, Y. (2018). Impact of short-term climate effects and sea ice coverage variation on Japanese scallop aquaculture in Saroma Lake, Japan. Aquac. Res. 49, 1752–1767. doi: 10.1111/are.13630
Liu, Y., Saitoh, S. I., Igarashi, H., and Hirawake, T. (2014). The regional impacts of climate change on coastal environments and the aquaculture of Japanese scallops in northeast Asia: case studies from Dalian, China, and Funka Bay, Japan. Int. J. Remote Sens. 35, 4422–4440. doi: 10.1080/01431161.2014.916435
Ma, S., Cheng, J., Li, J., Liu, Y., Wan, R., and Tian, Y. (2019a). Interannual to decadal variability in the catches of small pelagic fishes from China Seas and its responses to climatic regime shifts. Deep Sea Res. Part II Top. Stud. Oceanogr. 159, 112–129. doi: 10.1016/j.dsr2.2018.10.005
Ma, S., Liu, Y., Li, J., Fu, C., Ye, Z., Sun, P., et al. (2019b). Climate-induced long-term variations in ecosystem structure and atmosphere-ocean-ecosystem processes in the Yellow Sea and East China Sea. Prog. Oceanogr. 175, 183–197. doi: 10.1016/j.pocean.2019.04.008
Ma, S. S. (1989). Relationship between distribution and hydrological conditions of the wintering anchovy in Yellow Sea and East China Sea. J. Fish. China 13, 201–206.
Macías, D., Castilla-Espino, D., García-del-Hoyo, J. J., Navarro, G., Catalán, I. A., Renault, L., et al. (2014). Consequences of a future climatic scenario for the anchovy fishery in the Alboran Sea (SW Mediterranean): a modeling study. J. Mar. Syst. 135, 150–159. doi: 10.1016/j.jmarsys.2013.04.014
Maunder, M. N., and Punt, A. E. (2004). Standardizing catch and effort data: a review of recent approaches. Fish. Res. 70, 141–159. doi: 10.1016/j.fishres.2004.08.002
Mugo, R. M., Saitoh, S.-I., Nihira, A., and Kuroyama, T. (2011). “Application of multi-sensor satellite and fishery data, statistical models and marine-GIS to detect habitat preferences of skipjack tuna,” in Handbook of Satellite Remote Sensing Image Interpretation: Applications for Marine Living Resources Conservation and Management, eds S. S. Jesus Morales, V. Stuart, and T. Platt, (Dartmouth: EU PRESPO & IOCCG), 169–185.
Murase, H., Nagashima, H., Yonezaki, S., Matsukura, R., and Kitakado, T. (2009). Application of a generalized additive model (GAM) to reveal relationships between environmental factors and distributions of pelagic fish and krill : a case study in Sendai Bay, Japan. ICES J. Mar. Sci. 6, 1417–1424. doi: 10.1093/icesjms/fsp105
Nakata, H., Kimura, S., Okazaki, Y., and Kasai, A. (2000). Implications of meso-scale eddies caused by frontal disturbances of the Kuroshio current for anchovy recruitment. ICES J. Mar. Sci. 57, 143–151. doi: 10.1006/jmsc.1999.0565
Nakayama, S. I., Takasuka, A., Ichinokawa, M., and Okamura, H. (2018). Climate change and interspecific interactions drive species alternations between anchovy and sardine in the western North Pacific: detection of causality by convergent cross mapping. Fish. Oceanogr. 27, 312–322. doi: 10.1111/fog.12254
Nelder, J. A., and Wedderburn, R. W. M. (1972). Generalized linear models. Stat. Models S 135, 195–247. doi: 10.1201/9780203738535
Niu, M., Jin, X., Li, X., and Wang, J. (2014). Effects of spatio-temporal and environmental factors on distribution and abundance of wintering anchovy Engraulis japonicus in central and southern Yellow Sea. Chin. J. Oceanol. Limnol. 32, 565–575. doi: 10.1007/s00343-014-3166-7
Niu, M., and Wang, J. (2017). Variation in the distribution of wintering anchovy Engraulis japonicus and its relationship with water temperature in the central and southern Yellow Sea. Chin. J. Oceanol. Limnol. 35, 1134–1143. doi: 10.1007/s00343-017-6134-1
Nurdin, S., Mustapha, M. A., Lihan, T., and Zainuddin, M. (2017). Applicability of remote sensing oceanographic data in the detection of potential fishing grounds of Rastrelliger kanagurta in the archipelagic waters of Spermonde, Indonesia. Fish. Res. 196, 1–12. doi: 10.1016/j.fishres.2017.07.029
Okunishi, T., Shin-ichi, I., Hashioka, T., Sakamoto, T. T., Yoshie, N., Sumata, H., et al. (2012). Impacts of climate change on growth, migration and recruitment success of Japanese sardine (Sardinops melanostictus) in the western North Pacific. Clim. Change 115, 485–503. doi: 10.1007/s10584-012-0484-7
Park, T., Jang, C. J., Kwon, M., Na, H., and Kim, K. Y. (2015). An effect of ENSO on summer surface salinity in the Yellow and East China Seas. J. Mar. Syst. 141, 122–127. doi: 10.1016/j.jmarsys.2014.03.017
Perry, A. L., Low, P. J., Ellis, J. R., and Reynolds, J. D. (2005). Ecology: climate change and distribution shifts in marine fishes. Science 308, 1912–1915. doi: 10.1126/science.1111322
Petatán-Ramírez, D., Ojeda-Ruiz, M. Á., Sánchez-Velasco, L., Rivas, D., Reyes-Bonilla, H., Cruz-Piñón, G., et al. (2019). Potential changes in the distribution of suitable habitat for Pacific sardine (Sardinops sagax) under climate change scenarios. Deep Sea Res. Part II Top. Stud. Oceanogr. 169–170:104632. doi: 10.1016/j.dsr2.2019.07.020
Petitgas, P., Rijnsdorp, A. D., Dickey-Collas, M., Engelhard, G. H., Peck, M. A., Pinnegar, J. K., et al. (2013). Impacts of climate change on the complex life cycles of fish. Fish. Oceanogr. 22, 121–139. doi: 10.1111/fog.12010
Pinnegar, J. K., Cheung, W. W. L., Jones, M., Merino, G., Turrell, B., and Reid, D. (2017). Impact of climate change on fisheries. Mar. Clim. Change Impacts Partnersh. Sci. Rev. 9, 257–280. doi: 10.1016/B978-0-12-812160-3.00009-X
Raybaud, V., Bacha, M., Amara, R., and Beaugrand, G. (2017). Forecasting climate-driven changes in the geographical range of the European anchovy (Engraulis encrasicolus). ICES J. Mar. Sci. 74, 1288–1299. doi: 10.1093/icesjms/fsx003
Rice, J. (1995). “Food web theory, marine food webs, and what climate changes may do to northern marine fish populations,” in Climate Change and Northern Fish Populations, ed. R. J. Beamish, (Ottawa: NRC Research Press).
Roberts, J. J., Best, B. D., Dunn, D. C., Treml, E. A., and Halpin, P. N. (2010). Marine geospatial ecology tools: an integrated framework for ecological geoprocessing with ArcGIS, python, R, MATLAB, and C++. Environ. Model. Softw. 25, 1197–1207. doi: 10.1016/j.envsoft.2010.03.029
Shchepetkin, A. F., and McWilliams, J. C. (2005). The regional oceanic modeling system (ROMS): a split-explicit, free-surface, topography-following-coordinate oceanic model. Ocean Model. 9, 347–404. doi: 10.1016/j.ocemod.2004.08.002
Silva, C., Andrade, I., Yáñez, E., Hormazabal, S., Barbieri, M. Á., Aranis, A., et al. (2016). Predicting habitat suitability and geographic distribution of anchovy (Engraulis ringens) due to climate change in the coastal areas off Chile. Prog. Oceanogr. 146, 159–174. doi: 10.1016/j.pocean.2016.06.006
Silva, C., Leiva, F., and Lastra, J. (2019). Predicting the current and future suitable habitat distributions of the anchovy (Engraulis ringens) using the Maxent model in the coastal areas off central-northern Chile. Fish. Oceanogr. 28, 171–182. doi: 10.1111/fog.12400
Silva, C., Yáñez, E., Barbieri, M. A., Bernal, C., and Aranis, A. (2015). Forecasts of swordfish (Xiphias gladius) and common sardine (Strangomera bentincki) off Chile under the A2 IPCC climate change scenario. Prog. Oceanogr. 134, 343–355. doi: 10.1016/j.pocean.2015.03.004
Smoliñski, S., and Radtke, K. (2017). Spatial prediction of demersal fish diversity in the Baltic Sea: comparison of machine learning and regression-based techniques. ICES J. Mar. Sci. 74, 102–111. doi: 10.1093/icesjms/fsw136
Solanki, H. U., Bhatpuria, D., and Chauhan, P. (2017). Applications of generalized additive model (GAM) to satellite-derived variables and fishery data for prediction of fishery resources distributions in the Arabian Sea. Geocarto Int. 32, 30–43. doi: 10.1080/10106049.2015.1120357
Stenevik, E. K., and Sundby, S. (2007). Impacts of climate change on commercial fish stocks in Norwegian waters. Mar. Policy 31, 19–31. doi: 10.1016/j.marpol.2006.05.001
Syamsuddin, M., Saitoh, S., Hirawake, T., and Syamsudin, F. (2016). Interannual variation of Bigeye tuna (Thunnus obesus) hotspots in the eastern Indian Ocean off Java. Int. J. Remote Sens. 37, 2087–2100. doi: 10.1080/01431161.2015.1136451
Tian, Y., Akamine, T., and Suda, M. (2004). Modeling the influence of oceanic-climatic changes on the dynamics of Pacific saury in the northwestern Pacific using a life cycle model. Fish. Oceanogr. 13, 125–137. doi: 10.1111/j.1365-2419.2004.00314.x
Trenberth, K. E., and Stepaniak, D. P. (2001). Indices of El Niño evolution. J. Clim. 14, 1697–1701.
Valavanis, V. D., Pierce, G. J., Zuur, A. F., Palialexis, A., Saveliev, A., Katara, I., et al. (2008). Modelling of essential fish habitat based on remote sensing, spatial analysis and GIS. Hydrobiologia 612, 5–20. doi: 10.1007/s10750-008-9493-y
Wang, Z., Zuo, J., Chen, M., Xu, Q., and Yang, Y. (2012). Relationship between El Niño and sea surface temperature variation in coastal region of Yellow Sea and East China Sea. J. Hohai Univ. Nat. Sci. 40, 461–468.
Wei, H., Shi, J., Lu, Y., and Peng, Y. (2010). Interannual and long-term hydrographic changes in the Yellow Sea during 1977-1998. Deep Sea Res. Part II Top. Stud. Oceanogr. 57, 1025–1034. doi: 10.1016/j.dsr2.2010.02.004
Wood, S. N. (2006). Generalized Additive Models: an Introduction with R. Boca Raton, FL: Chapman and Hall.
Xing, Q., Yu, H., Yu, H., Sun, P., Liu, Y., Ye, Z., et al. (2020). A comprehensive model-based index for identification of larval retention areas: a case study for Japanese anchovy Engraulis japonicus in the Yellow Sea. Ecol. Indic. 116:106479. doi: 10.1016/j.ecolind.2020.106479
Yan, H., Liu, C., Zhang, W., Li, M., Zheng, X., Wei, G., et al. (2017). ENSO variability around 2000 years ago recorded by Tridacna gigas δ18O from the South China Sea. Quat. Int. 452, 148–154. doi: 10.1016/j.quaint.2016.05.011
Yáñez, E., Plaza, F., Silva, C., Sánchez, F., Barbieri, M. Á., and Aranis, A. (2016). Pelagic resources landings in central-southern Chile under the A2 climate change scenarios. Ocean Dyn. 66, 1333–1351. doi: 10.1007/s10236-016-0984-5
Yasuda, T., Yukami, R., and Ohshimo, S. (2014). Fishing ground hotspots reveal long-term variation in chub mackerel Scomber japonicus habitat in the East China Sea. Mar. Ecol. Prog. Ser. 501, 239–250. doi: 10.3354/meps10679
Yen, K. W., and Lu, H. J. (2016). Spatial–temporal variations in primary productivity and population dynamics of skipjack tuna Katsuwonus pelamis in the western and central Pacific Ocean. Fish. Sci. 82, 563–571. doi: 10.1007/s12562-016-0992-x
Yu, W., Chen, X., Zhang, Y., and Yi, Q. (2019). Habitat suitability modelling revealing environmental-driven abundance variability and geographical distribution shift of winter–spring cohort of neon flying squid Ommastrephes bartramii in the northwest Pacific Ocean. ICES J. Mar. Sci. 76, 1722–1735. doi: 10.1093/icesjms/fsz051
Yuan, X. C., and Zhao, W. W. (2016). China Fishery Statistics Yearbook 2016. Beijing: China Agriculture Press.
Zhang, X., Saitoh, S. I., and Hirawake, T. (2017). Predicting potential fishing zones of Japanese common squid (Todarodes pacificus) using remotely sensed images in coastal waters of south-western Hokkaido, Japan. Int. J. Remote Sens. 38, 6129–6146. doi: 10.1080/01431161.2016.1266114
Zhao, X., Hamre, J., Li, F., Jin, X., and Tang, Q. (2003). Recruitment, sustainable yield and possible ecological consequences of the sharp decline of the anchovy (Engraulis japonicus) stock in the Yellow Sea in the 1990s. Fish. Oceanogr. 12, 495–501. doi: 10.1046/j.1365-2419.2003.00262.x
Zhao, X., Wang, Y., and Dai, F. (2008). Depth-dependent target strength of anchovy (Engraulis japonicus) measured in situ. ICES J. Mar. Sci. 65, 882–888. doi: 10.1093/icesjms/fsn055
Zhao, X. Y. (2006). Population Dynamic Characteristics and Sustainable Utilization of the Anchovy Stock in the Yellow Sea. Shandong: Ocean University of China.
Zheng, W., Zou, L., and Han, Z. (2015). Genetic analysis of the populations of Japanese anchovy Engraulis japonicus from the Yellow Sea and East China Sea based on mitochondrial cytochrome b sequence. Biochem. Syst. Ecol. 58, 169–177. doi: 10.1016/j.bse.2014.12.007
Zhou, X., Sun, Y., Huang, W., Smol, J. P., Tang, Q., and Sun, L. (2015). The Pacific decadal oscillation and changes in anchovy populations in the Northwest Pacific. J. Asian Earth Sci. 114, 504–511. doi: 10.1016/j.jseaes.2015.06.027
Keywords: Japanese anchovy, habitat characterization, salinity front, abundance distribution models, climate change
Citation: Liu S, Liu Y, Alabia ID, Tian Y, Ye Z, Yu H, Li J and Cheng J (2020) Impact of Climate Change on Wintering Ground of Japanese Anchovy (Engraulis japonicus) Using Marine Geospatial Statistics. Front. Mar. Sci. 7:604. doi: 10.3389/fmars.2020.00604
Received: 23 March 2020; Accepted: 30 June 2020;
Published: 31 July 2020.
Edited by:
Morgane Travers-Trolet, Institut Français de Recherche pour l’Exploitation de la Mer (IFREMER), FranceReviewed by:
Pedro Morais, University of Algarve, PortugalEdgar Josymar Torrejón-Magallanes, National Polytechnic Institute (IPN), Mexico
Copyright © 2020 Liu, Liu, Alabia, Tian, Ye, Yu, Li and Cheng. This is an open-access article distributed under the terms of the Creative Commons Attribution License (CC BY). The use, distribution or reproduction in other forums is permitted, provided the original author(s) and the copyright owner(s) are credited and that the original publication in this journal is cited, in accordance with accepted academic practice. No use, distribution or reproduction is permitted which does not comply with these terms.
*Correspondence: Yang Liu, eWFuZ2xpdTMxNUBvdWMuZWR1LmNu; Yongjun Tian, eWp0aWFuQG91Yy5lZHUuY24=