 Carlie Wiener
 Lars Bejder
 David Johnston
 Leesa Fawcett
 Paul Wilkinson
- 1Department of Geography and Environment, College of Social Sciences, University of Hawai‘i at Mānoa, Honolulu, HI, United States
- 2Marine Mammal Research Program, Hawai‘i Institute of Marine Biology, University of Hawai‘i at Mānoa, Kaneohe, HI, United States
- 3Division of Zoophysiology, Department of Bioscience, Aarhus University, Aarhus, Denmark
- 4Centre for Sustainable Aquatic Ecosystems, Harry Butler Institute, Murdoch University, Perth, WA, Australia
- 5Division of Marine Science and Conservation, Nicholas School of the Environment, Duke University Marine Lab, Beaufort, NC, United States
- 6Faculty of Environmental Studies, York University, Toronto, ON, Canada
Wild dolphin-swim tourism has grown in specific locations where Hawaiian spinner dolphins (Stenella longirostris) have known resting habitat. The increased growth in dolphin-swim businesses has created an industry in Hawaii that earns an estimated $102 million (USD) annually in 2013. Semi-structured interviews with business owners, market research, and boat-based observations provide a platform for estimating revenue generated from dolphin tourism in two popular locations, Waianae, Oahu and Kailua-Kona, Hawaii Island. A revenue analysis of dolphin-swim tourism is presented using a peak season and utilization rate model. These predictions offer an accountability exercise based on a series of assumptions regarding wild dolphin-swim demand and an annual estimate of the number of viewing participants and revenue earned. The results show that dolphin viewing companies are making a larger profit than dolphin-swim businesses by approximately $19 million (USD) per year, however, both avenues are generating large earnings. Sizable differences between businesses in Kona and Waianae are discussed. The average lifetime revenue generated by a dolphin in 2013 is estimated at $3,364,316 (USD) for Waianae and $1,608,882 (USD) for Kona, and is presented as a first step in scenario analysis for policy makers looking to implement management in the bays where tourism occurs. This study offers the first revenue estimates of spinner dolphin tourism in Hawaii, which can provide context for further discussion on the impact and economic role of the dolphin-swim industry in the state.
Introduction
The wide-spread adoration of marine mammals over the past century is evidenced by their popularity in mass media (Burnett, 2010; Wiener, 2015a). This has trickled into wildlife tourism, leading to growth and expansion of whale and dolphin excursions (Delfour, 2007; Higham et al., 2009; Hu et al., 2009; Heenehan et al., 2015). Interaction with marine species in natural settings has become a critical aspect of the broader tourism industry (Catlin et al., 2013; Orams, 2013). In 2008, marine mammal tourism was offered in over 119 countries with an estimated value of $2.1 billion (USD) annually (O’Connor et al., 2009). In recent decades, dolphin-swim tourism has developed a similar path of expansion. Hot-spots for dolphin-swim tourism have become established in coastal communities with access to marine mammal populations (Wiener, 2015b). Developing countries such as the Philippines and Taiwan are increasingly using this type of tourism and now outnumber developed countries (Samonte-Tan et al., 2007; Mustika et al., 2013).
Escalating marine mammal tourism has led to investigation of how this growth is affecting whale and dolphin populations. Several studies have observed negative impacts (Lammers, 2004; Danil et al., 2005; Bejder et al., 2006; Courbis and Timmel, 2009; Heenehan et al., 2015; Higham et al., 2016; Tyne et al., 2018; Sprogis et al., 2020), yet communities advocate these activities for growth in local economies. With the majority of research focused on the biological impacts of dolphin-swim tourism, little attention has been paid to the social and economic effects. Few studies have identified the fiscal productivity of these activities and how the profits are distributed within local economies (Hoagland and Meeks, 2000; Yacob et al., 2007; Mustika et al., 2013; Guidino et al., 2020). Recent decline in fish catches and degradation of coastal ecosystems have led some fisheries to become involved in marine mammal tourism as a way to overcome economic challenges, while others have been driven away from traditional catch grounds due to expansion of tour boats (Orams, 2013). These shifts have contributed to a marine mammal tourism industry growing at a rate of 3.7% per year (Chen, 2011). This is why both economic and social costs must be considered in tandem, as there are benefits and losses derived from marine mammal tourism that cannot be measured individually (Bateman et al., 2010; Mustika et al., 2013). Location-specific studies are critical in marine mammal tourism as well, because most activities are based around particular populations that are attached to certain cultural contexts. As a result, economic analysis undertaken in one location cannot always be extrapolated to other settings (Catlin et al., 2013).
Currently, no estimates exist for dolphin-swim tourism either locally or globally, reflecting a gap in data. The goal of this research is to offer an accountability exercise based on a series of assumptions regarding wild dolphin-swim demand in Hawaii and an annual estimate of the number of viewing participants and revenue earned, as well as an estimated lifetime revenue that each individual dolphin may generate. With dolphin tourism continuously on the rise (Wiener, 2015b), it is important to capture a baseline of what this industry accrues to provide background for managers.
Natural systems and species are important contributors to economic activity and growing evidence shows increasing pressure on them from human tourism activity (Bateman et al., 2010). However, wildlife valuation is difficult and complex. An approximation of value is the best that can be achieved and typically involves many assumptions placed from an anthropocentric perspective (Knowles and Campbell, 2011; Orams, 2013). Many factors besides economics come into play when valuing a species, such as conserving habitat on which the species depends, or the environmental cost of the potentially negative effects of tourism activities (Dwyer et al., 2004; Orams, 2013). The ecological, sociocultural, and intrinsic values associated with Hawaiian spinner dolphins (Stenella longirostris) are explored by the authors in other research. However, for the purposes of this paper, the emphasis will be on the revenue generated from these activities.
Understanding the revenue of an under-studied industry such as dolphin-swim tourism is gravely needed before making policy decision. This requires studies that are focused on establishing a baseline of that ecosystem service or business (Baulcomb and Böhnke-Henrichs, 2011). This study presents a revenue analysis of Hawaiian spinner dolphin tourism as a first step in scenario analysis for dolphin-swim tourism in Hawaii and an expansion of the existing marine tourism literature. Revenue from ticket prices will provide a starting point for an evaluation of dolphin tourism in Hawaii and its significance for the state.
Estimates provided are based on participant observation, tour operator interviews, and market research conducted from July 2012 to June 2013. The market research included an online review of company websites, particularly tracking of ticket prices and tour frequencies. The resulting data in combination provide validity to the information shared through the interviews and strengthen the depth of analysis. One advantage of this approach is that it can be implemented in other locations to establish a baseline understanding of a relatively new or emerging industry where not a lot of information exists. However, there are also limitations to this work due to missing information from some of the operators and lack of clarity on operation costs; these shortcomings are discussed in the section “Causes and Considerations.” This body of knowledge represents the first attempt at an assessment of the Hawaiian spinner dolphin industry as a whole and provides a starting point for further study.
The Hawaiian spinner dolphin is a small species commonly found in Hawaiian near-shore waters. Spinner dolphins hunt cooperatively at night and are most playful during early morning hours while winding down from evening activities (Lammers, 2004; Tyne et al., 2015, 2017). During mid-morning, the dolphins enter a resting state, moving closer together and swimming in unison along the sea floor (Norris et al., 1994; Tyne et al., 2017). During these critical mid-morning resting periods, spinner dolphins are most heavily disturbed by tourist vessels seeking to interact with the species (Heenehan et al., 2015; Tyne et al., 2018). Since 1972, the Marine Mammal Protection Act has forbid any indirect aggravation (Level B harassment) of marine mammals in United States waters. Dolphin-swim tourism can violate this policy; however, it is difficult to enforce. Concerns that tourist activities directed at dolphins may have population effects (such as habitat shifts, compressing resting times resulting in reduced reproduction, and shifting energy budgets) have been documented (Östman, 1994; Wursig, 1996; Danil et al., 2005; Courbis, 2007; Delfour, 2007; Timmel et al., 2008; Courbis and Timmel, 2009; Milette et al., 2011; Tyne et al., 2018).
This paper shares results from the first revenue assessment of commercial wild dolphin tourism in Hawaii. We approximate participant and company numbers, and direct revenue from two main dolphin-swim tourism locations, Waianae, Oahu and Kailua-Kona, Hawaii Island. An appraisal of exposure and revenue generated from each dolphin is also presented, providing an estimate of how much each dolphin contributes over their lifetime. This information will assist marine resource managers who need to consider regulations, the economic benefits, and community impacts of dolphin tourism.
Materials and Methods
Sampling and Data Collection
Tour operator information was entered into a database gathered from marketing materials and internet inquiries. Vessel capacities, trip schedules, and prices were obtained from these sources and 77 tour companies were included. Four internet searches were conducted periodically between 2012 and 2013, and an additional update in 2018; any operator that advertised guided dolphin-swims, dolphin watching, or dolphin snorkeling was included in the database, resulting in four different operator categories (Figure 1). Annual revenues of each vessel were estimated by combining publicly available ticket prices, trip schedules, and capacity data with a utilization rate estimate based on interview data similar to other studies (Utech, 2000).
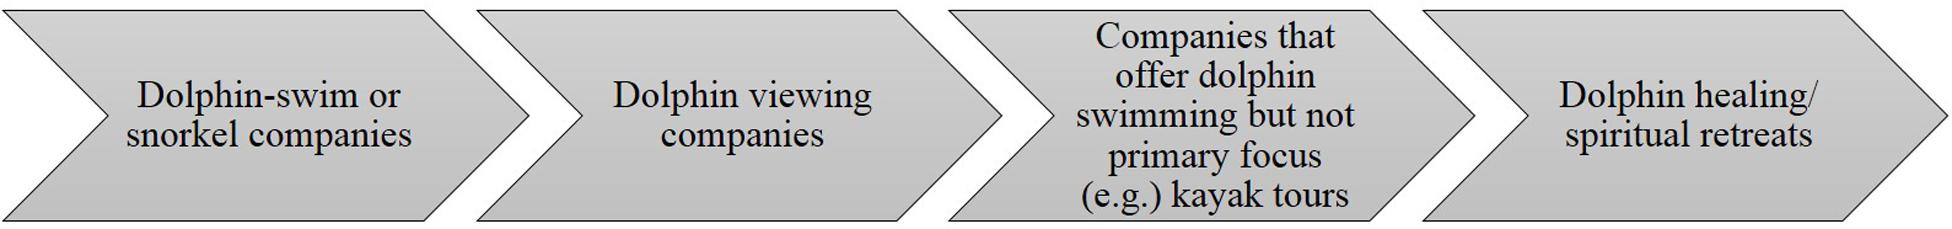
Figure 1. Four dolphin operator categories.
Semi-structured interviews were conducted with 26 dolphin-swim operators to assess the revenues generated from dolphin tourism and the perceptions toward the growth of the industry. Participants were selected using voluntary response sampling solicited through a community meeting and through cold calls to all dolphin-swim company owners. While the sample was not representative of the entire industry, this was the largest collection of operator interviews obtained from a reclusive group. Operators were asked to recall information about seasonal activity, revenue generated, the types and number of trips offered, number of passengers per trip, and vessel capacities. These data enabled calculation of vessel-specific estimates of direct revenues, also providing information about utilization rates, e.g., average number of passengers per trip, etc. Cooperative inquiry was included in transcription, allowing interviewees a final opportunity to confirm or re-clarify recorded notes (Braun and Clarke, 2006).
Additionally, field observations were made from July 2012- June 2013 on 40 days resulting in >257 h of observation. The tour boats on each island leave from the Ko Olina and Waianae Boat Harbor on Oahu and Honokohau on Hawaii Island, visiting known dolphin-swim sites (see map in Figure 2). The boat-based study allowed for observation of the number of boats and swimmers in the water with the spinner dolphins throughout the year. The observations served as a control for the utilization rate estimate or peak season timeline (PST) that was established based on company sales and operator experience. Observations also provided an assessment of human use.
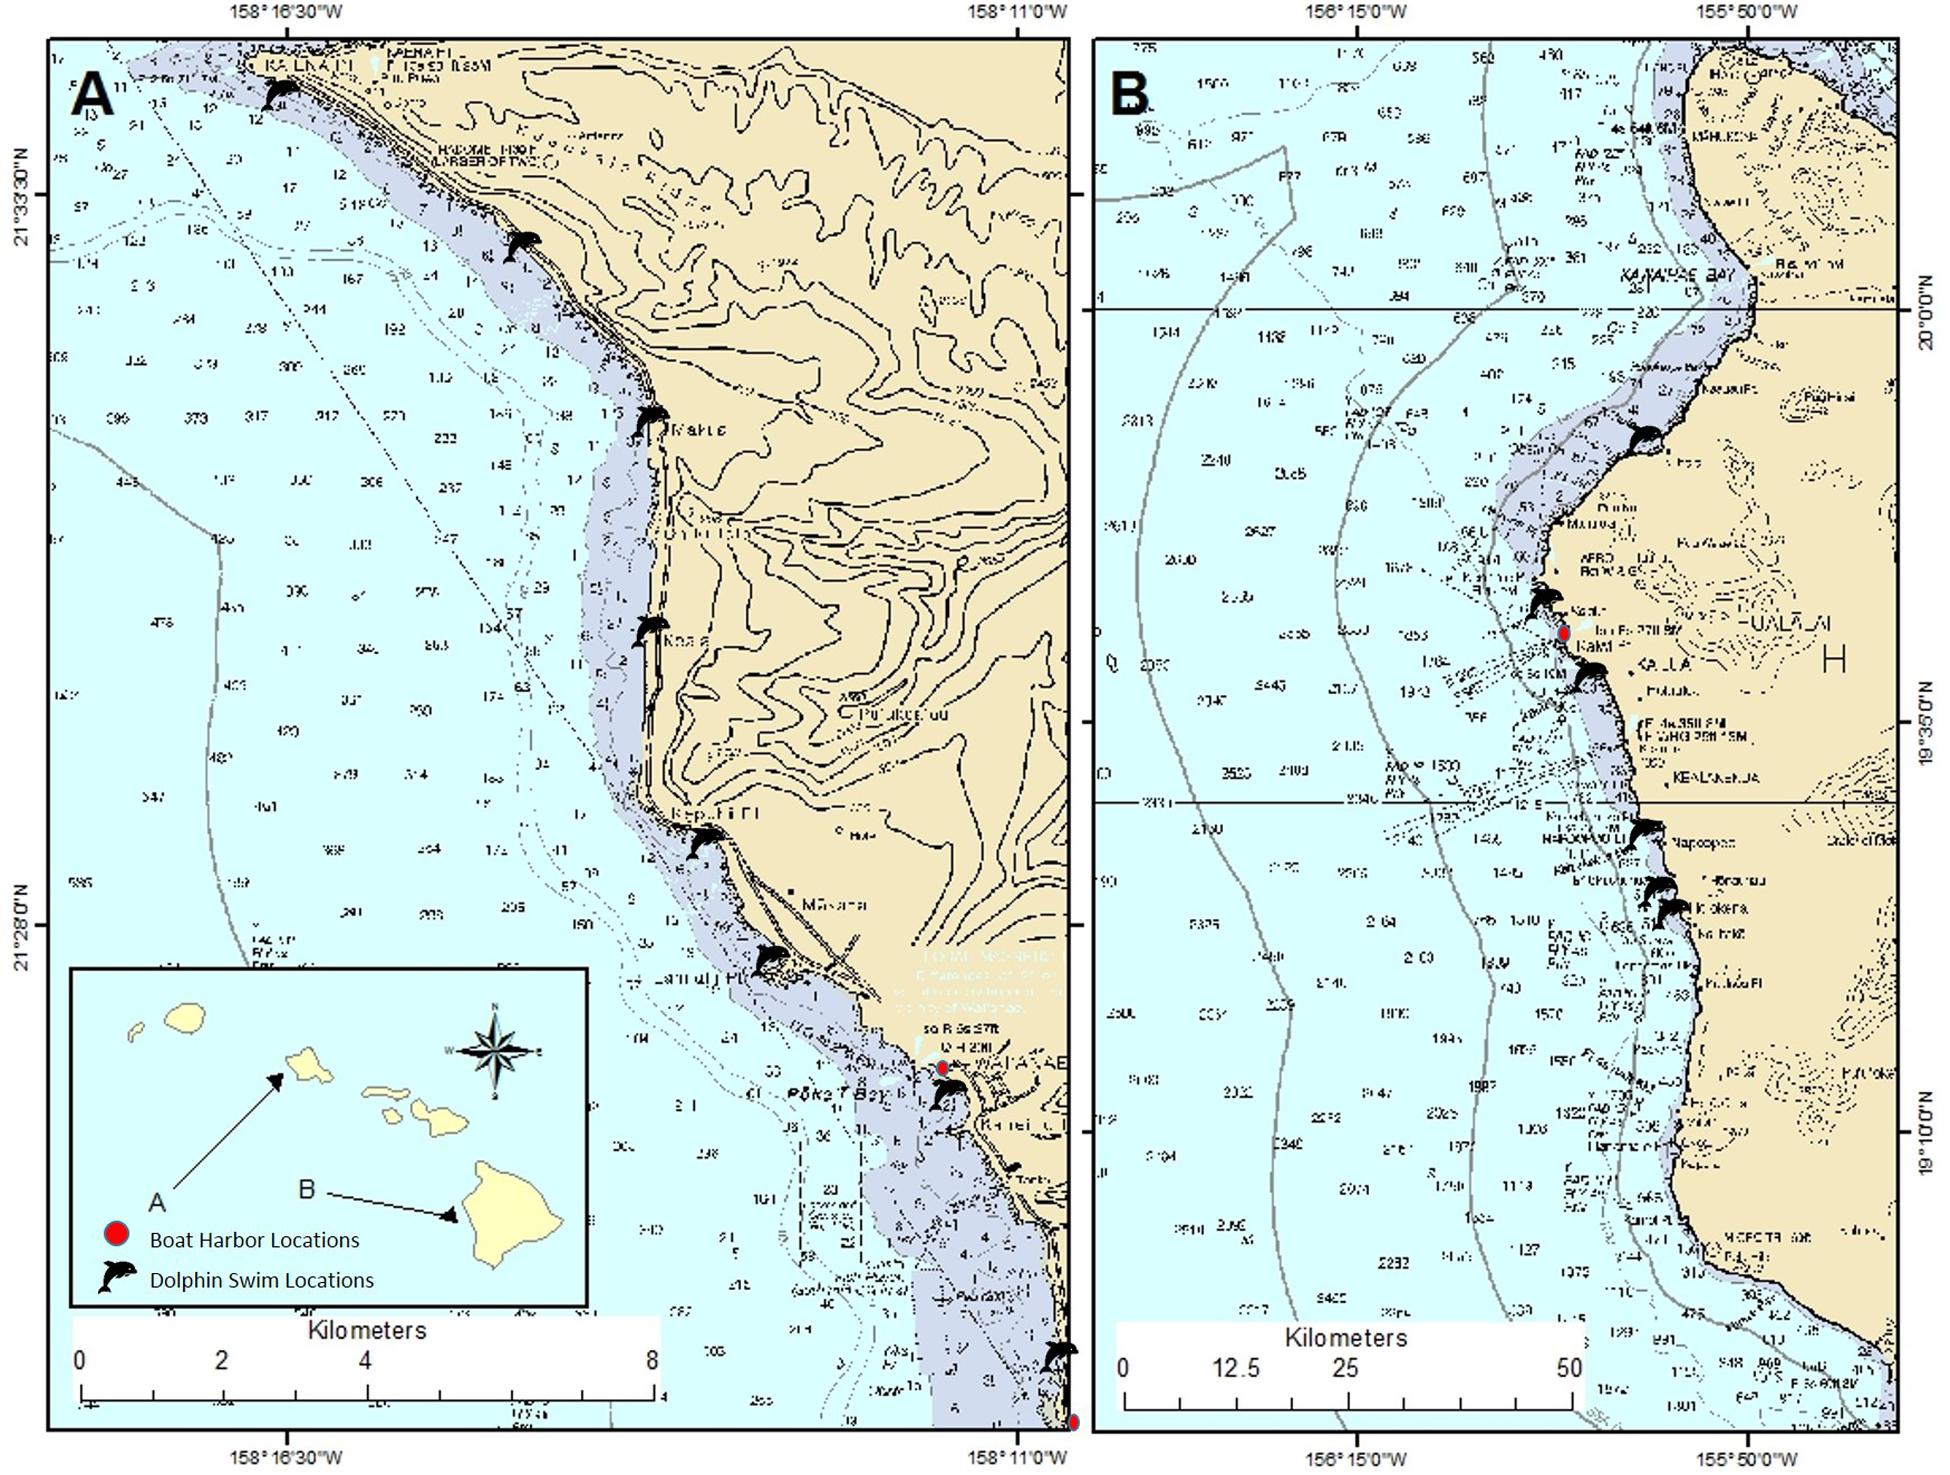
Figure 2. Map of dolphin-swim locations on (A) Waianae, O’ahu and (B) Kailua-Kona, Hawai’i Island. Base map: NOAA created in ArcGIS (GIS Software).
Calculations
Dolphin-swim tourism revenue was calculated based on similar methods conducted in a study by Clua et al. (2011). The mean participation and direct revenue on boat-based dolphin-swim tourism in Kailua-Kona and Waianae were calculated using a PST model developed with information obtained from operator interviews and participant observation. Months were divided by mean boat trips per week and categorized into three periods of peak (an average of seven or more boat days per week), average (an average of four to six boat days per week), or slow (an average of zero to three boat days per week) seasons. Months were divided by mean weekly trip numbers to calculate the monthly average boat trips (see Tables 1A,B). This model gives a monthly average that provides conservative estimates to account for daily fluctuations in the number of participants. Interviewees cautioned, however, that variations occur from year to year depending on the economic conditions of the country. Additionally, the model assumes full capacity during the tours accounted for, which may round up or provide a best guess estimation. Based on observation and interview, the tour boats tend to operate at capacity. To ensure consistency of the interview and observation data used to input the model, the monthly changes were compared with the Hawaii Tourism Authority (HTA, 2013, 2018) visitor numbers for each island (see Figure 3).
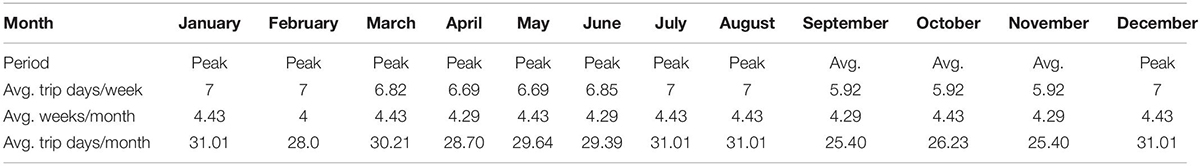
Table 1a. Wild dolphin-swim industry peak season timeline (PST) for Waianae, Oahu.
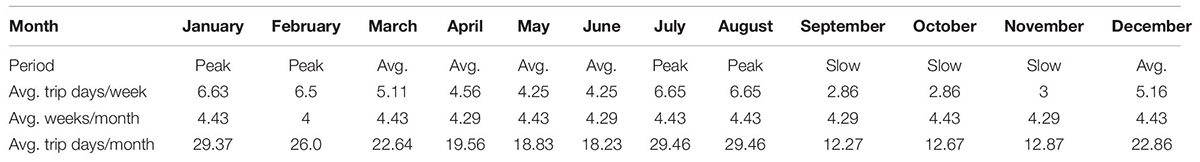
Table 1B. Wild dolphin-swim industry peak season timeline (PST) for Kailua-Kona, Hawaii Island.
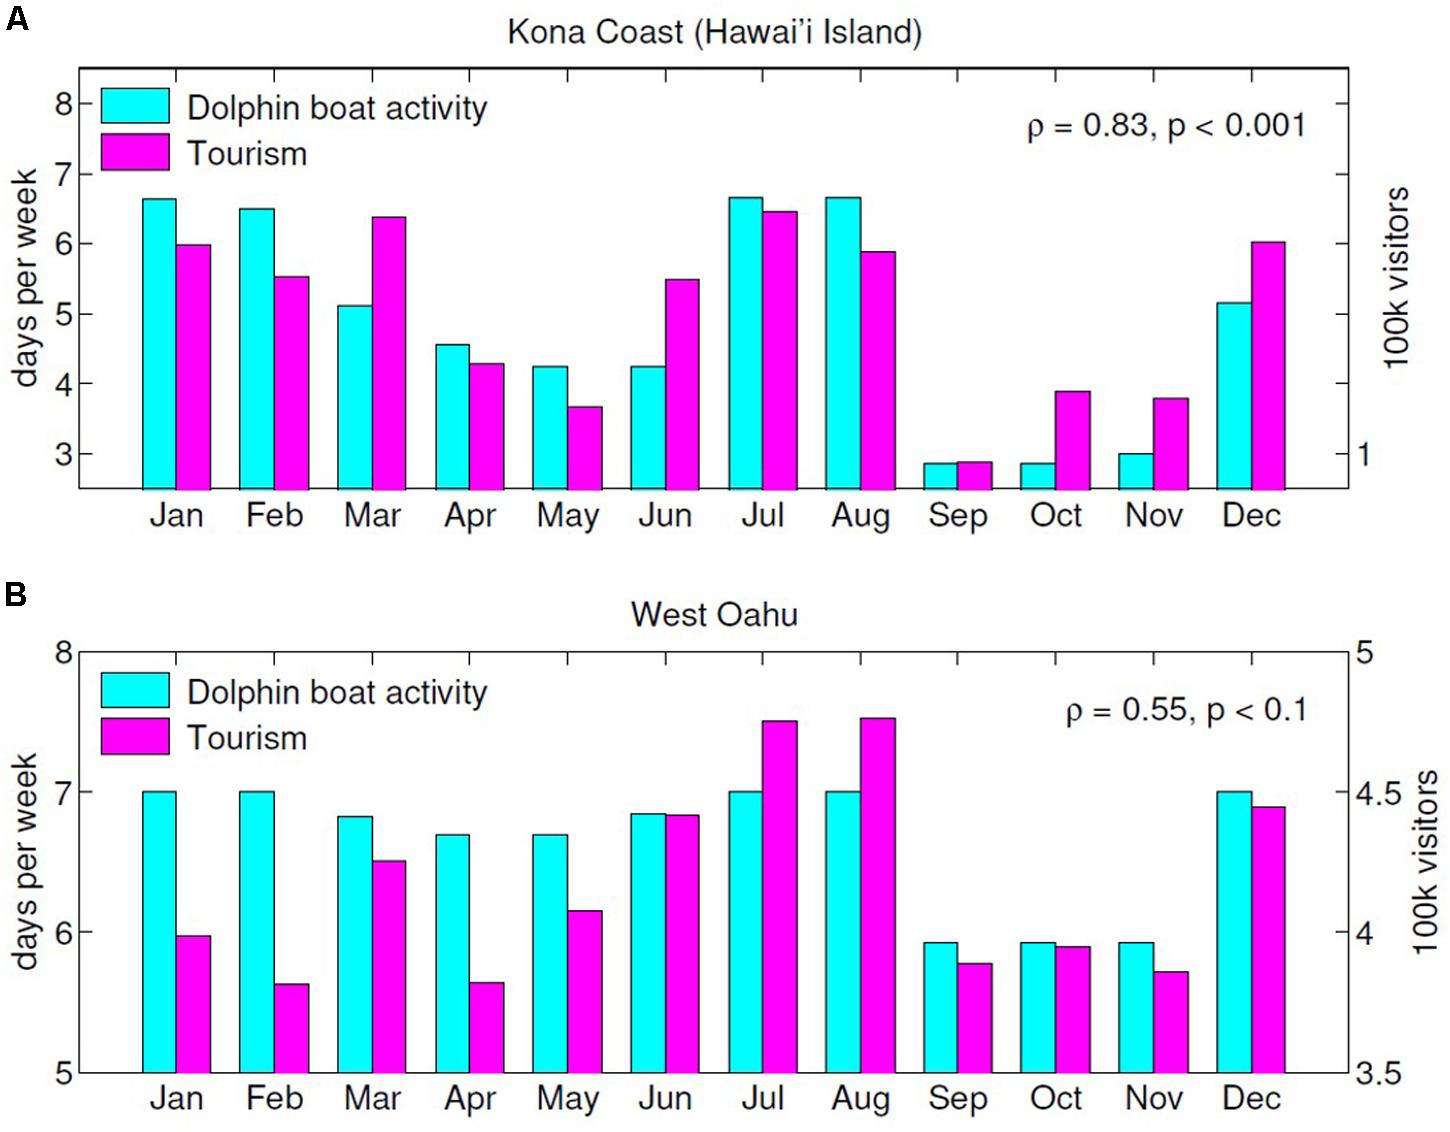
Figure 3. (A) Comparison of HTA visitor numbers and the wild dolphin-swim industry peak season timeline (PST) for Waianae, Oahu. (B) Comparison of HTA visitor numbers and the wild dolphin-swim industry peak season timeline (PST) for Kailua-Kona, Hawaii Island.
Utilization rate estimates were calculated using the PST established below. For each individual company, the number of boats (b) was multiplied by the number of trips they conducted each day (t) and by the boat capacity (c). This total was then multiplied by the PST to produce an annual estimate of participants for each company and account for shifts in numbers based on season [x = bt(c)(PST)] (see Table 2).
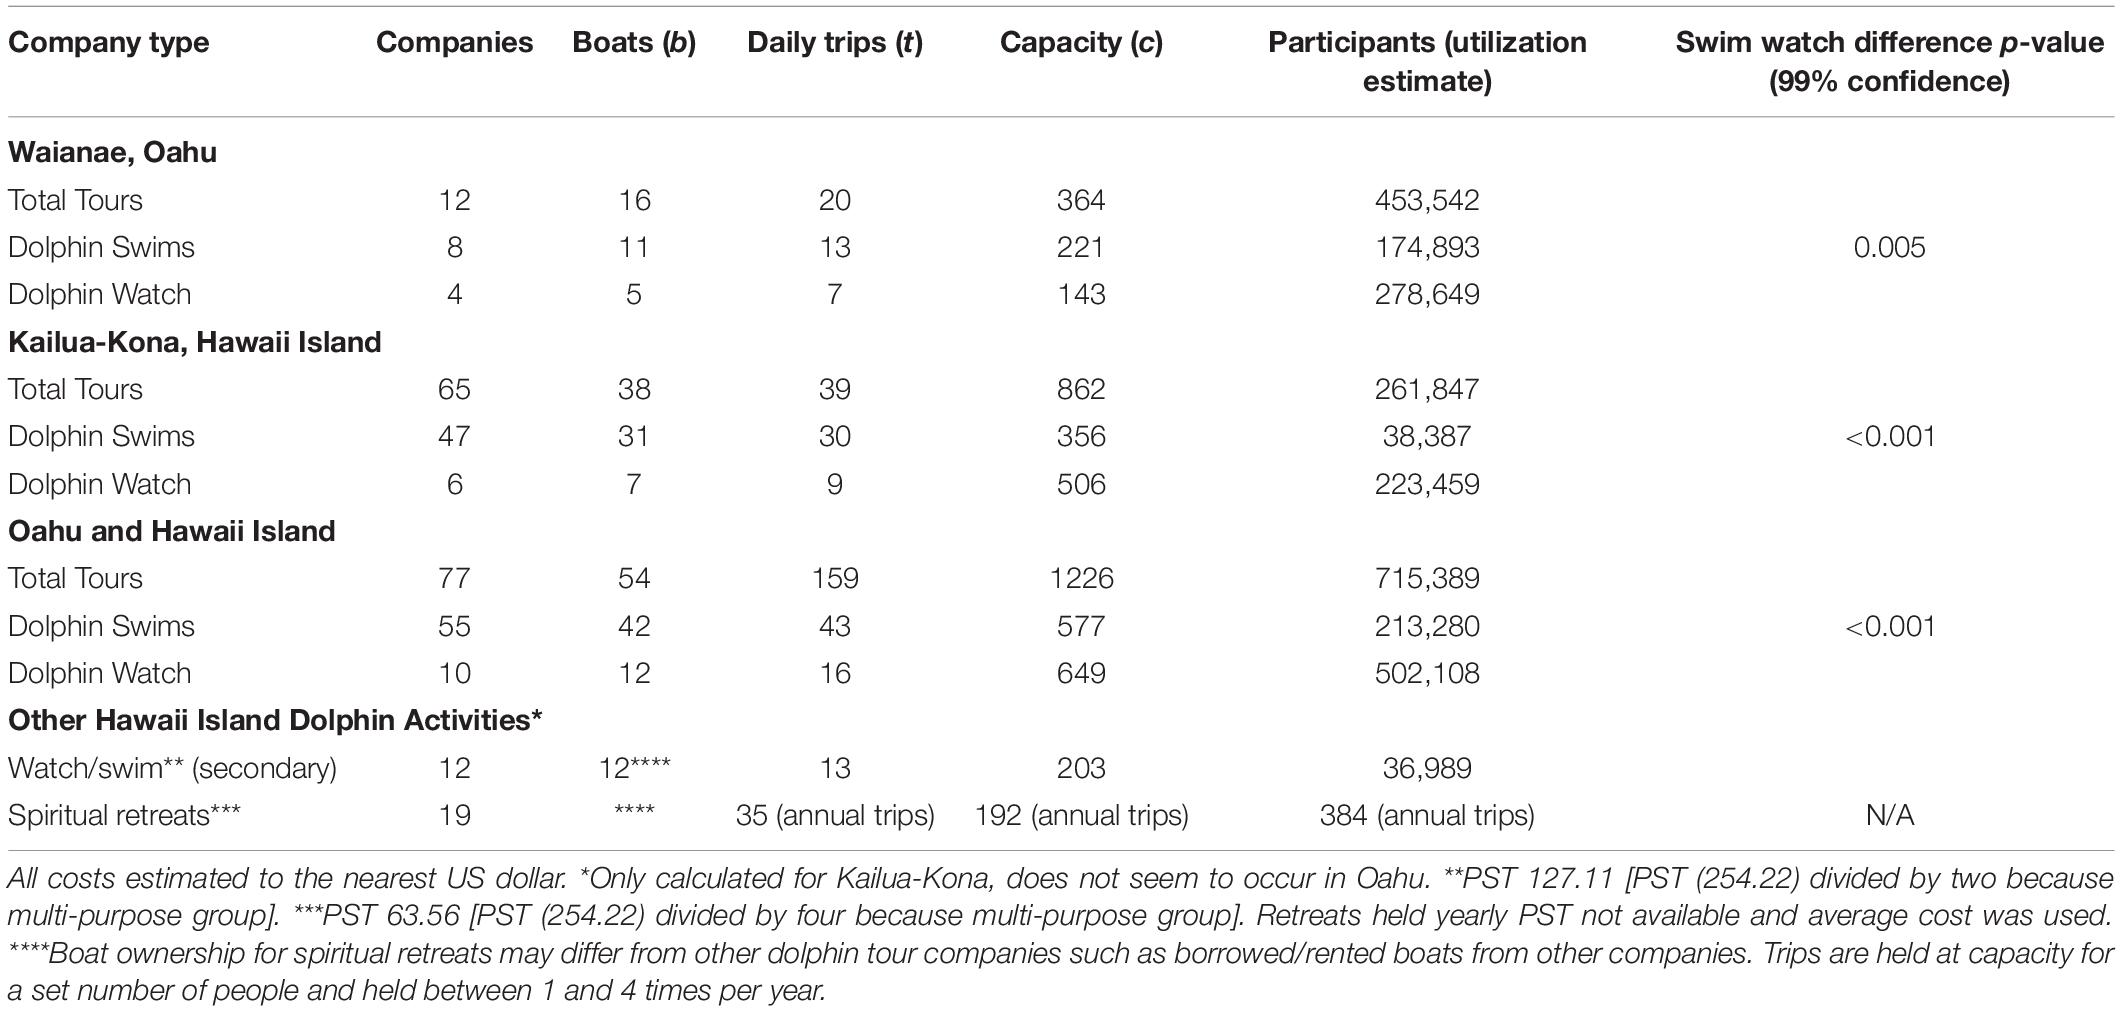
Table 2. Commercial dolphin tour and dolphin-swim utilization rate estimates.
Revenue was calculated by multiplying the utilization rate estimate to the ticket price (co) for each dolphin tourism company (see Table 3). This generated an annual estimate of revenues that could be added together to provide a revenue estimate for the dolphin tourism industry in Oahu and Hawaii Island. Separate analysis was run for Waianae, Oahu and Kailua-Kona, Hawaii Island because of the local differences in boat size and style of operators.
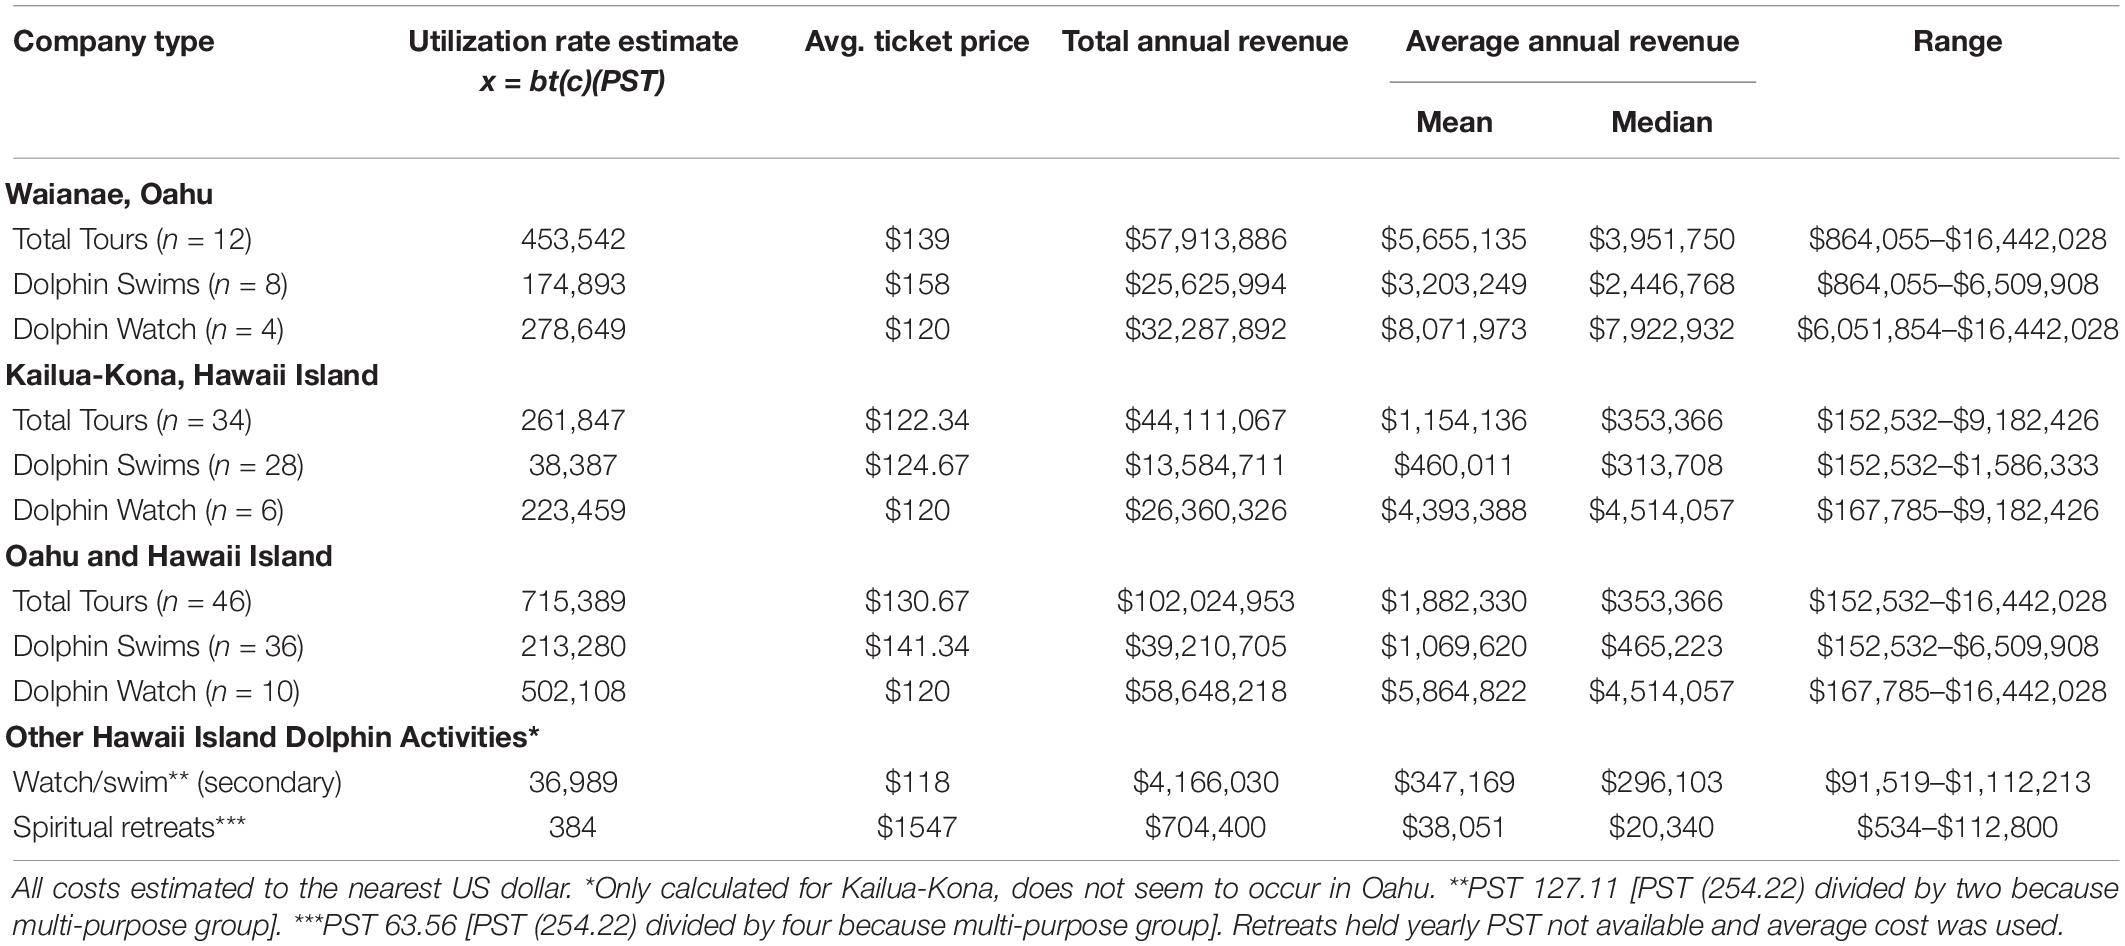
Table 3. Commercial boat-based dolphin-swim direct revenue estimates by operator categories.
The lifetime revenues were estimated for an individual spinner dolphin. Using a similar method to Knowles and Campbell (2011) and Catlin et al. (2013) total revenue per dolphin over their lifetime (DRL) (see Table 4) was calculated using an estimated 26-year life expectancy of the whitebelly spinner dolphin (Larese and Chivers, 2008). It should be noted that other studies have shown spinner dolphins to potentially live 30 years or longer; however, for the purposes of this paper a more conservative estimate was selected. The lifetime revenue was calculated by dividing the estimated dolphin tour annual revenue by the estimated dolphin population to get the annual revenue per dolphin (ER). Once this was calculated for each island, the discount rate [2.65%] (r) plus one was calculated with each year of the average dolphin lifespan (t). The ER was then divided by this discount rate for each year and then all 26 years were totaled together to get the final DRL. This was done separately for each island to account for the differences in annual revenue and dolphin populations. The estimates here reflect dolphin-swim only and are an underestimation of what dolphin’s lifetime potential revenue is in present day.
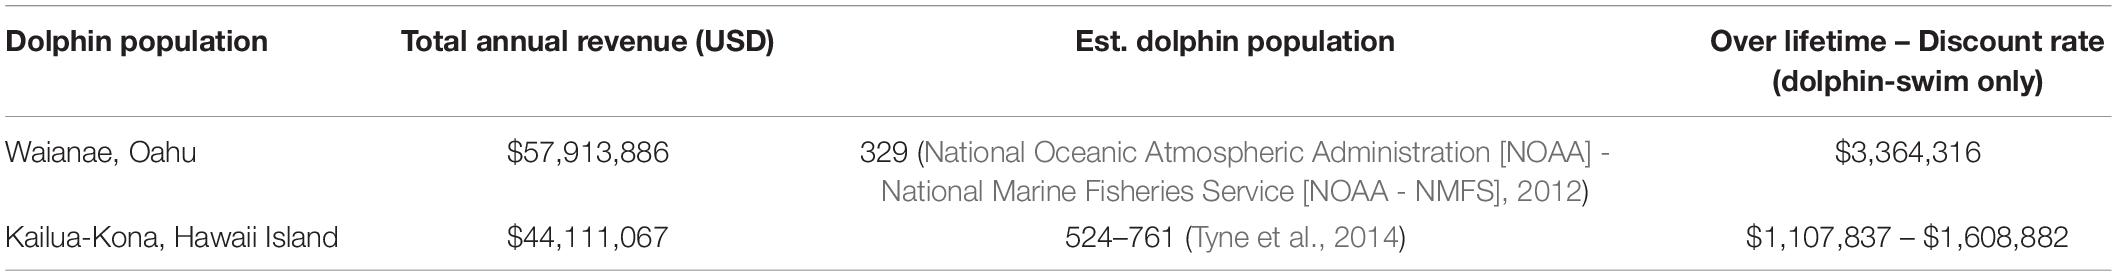
Table 4. Annual and lifetime revenue estimates for the Hawaiian spinner dolphin.
DRL, spinner dolphin revenue over lifetime; ED, Dolphin-swim tourism annual average revenue per dolphin; r, discount rate; t, life expectancy of average spinner dolphin.
Present value is used to estimate the capitalized value of lifelong revenues per dolphin by discounting future values at a certain rate (Clark, 2006; Clark, 2010; Knowles and Campbell, 2011). For every year that goes by in a dolphin’s life, the chance that it is alive continues to decrease. Using a discount rate helps to account for the decreased risk of life expectancy; however, discount rates can vary. Previous marine-based discount rates have ranged from 10% for marine protected areas (Samonte-Tan et al., 2007), 8% for lemon sharks (Clua et al., 2011), 5% for reef sharks (Vianna et al., 2012), and 2.65% for humpback whales and whale sharks (Knowles and Campbell, 2011; Catlin et al., 2013). Lower discount rates place greater emphasis on future value (i.e., 2.65%), whereas the larger end of the scale (i.e., 10%), value present day. There are several rationales for a discount rate, usually based on private or social opportunity cost. Given that the literature shows no decline in dolphin tourism, with potential for growth in the industry, the social discount value of 2.65% was selected to represent the Hawaiian spinner dolphin.
Results
Peak Season Timeline (PST)
A PST was calculated for each location to predict the number of annual participants in dolphin tourism; this was also used to determine an estimate of revenues for the wild Hawaiian spinner dolphin tourism industry (see Tables 1A,B). An average of 7,300 boat trips per year was calculated for Waianae, Oahu and 14,235 for Kailua-Kona, Hawaii Island. Two peak periods were established during mid-winter (end of December, end of January to February) and mid-summer (July and August) for Kailua-Kona, while peak numbers were consistently seen in Waianae with the exception of a slowdown in the fall (September and October). The PST model was also run using average values for blank interview responses that populated the timeline content. There were no significant differences when the model was run this way.
The PST model was also contrasted with the Hawaii Tourism Authority (2013, 2018) visitor numbers for each island to see if the peak trends were consistent (see Figure 3). The HTA comparison does not provide absolute confirmation on the model, but rather an estimate of relative numbers based on the best information available.
Utilization Rate Estimates
A total of 77 dolphin tour companies were used in this evaluation, including 541 boats across both islands. At the time, this represented all of the dolphin tourism companies on Oahu and Kailua-Kona that were publicly advertising their services and, to the authors’ knowledge, accounts for all of the legally registered companies operating out of the targeted harbors. The number of vessels operating in Waianae, Oahu (16 boats) was less when compared to the 38 based in Kailua-Kona, Hawaii; however, the vessels on Oahu were much larger, holding on average 27.7 people per trip. The total number of dolphin-tour companies was also smaller on Oahu; 12 companies, compared to the 65 in Kailua-Kona (see Table 2).
Primary Revenue
Overall ticket revenues for Waianae, Oahu have increased since 2006, jumping from an average dolphin-swim tour revenue of $111(USD) (Boehle, 2007) to $141.34 (USD) in 2013, and the prices in 2019 remain consistent with those from 2013 (see Table 3). Waianae, Oahu remains more expensive then Kailua-Kona. The higher average ticket total combined with the increase in participants resulted in $12,041,283 (USD) more in direct dolphin-swim revenue in Waianae, Oahu. The total estimated direct dolphin tour revenue for both Oahu and Hawaii Island in 2013 was $102,024,953 (USD); this does not include spiritual retreats or companies that offer dolphin-swims as secondary revenue. Table 3 illustrates the average utilization rate estimates and ticket prices by activity and island, but does not demonstrate the actual ticket price for each company, which was used to calculate individual company revenues. Individual company calculations are not shown, but were used to calculate total annual revenue, average annual revenue, and range in Table 3.
Lifetime Revenue per Dolphin
There have been several spinner dolphin population studies conducted in Kailua-Kona (Norris et al., 1994; Östman, 1994); however; the most recent estimates of 524–761 dolphins on the Kailua-Kona coast predicted with 95% confidence by Tyne et al. (2014) will be used in this paper. Unfortunately, the Waianae coast on Oahu has not received the same attention as Kailua-Kona and no official population estimates are available. Based on preliminary studies, abundance estimates for the island of Oahu were estimated at 329 spinner dolphins (National Oceanic Atmospheric Administration [NOAA] - National Marine Fisheries Service [NOAA - NMFS], 2012). These island populations are genetically distinctive and are considered unique stocks (Andrews et al., 2010). Table 4 provides an overview of the estimated revenue of spinner dolphins over their lifetime.
Discussion
Dolphin swim-tourism is only one segment of Hawaii’s multi-faceted ocean tour boat industry, and the spinner dolphins not only play a role in dolphin-swim tourism, but also other areas of the marine tourism industry as well, including snorkel and dive tours, whale watching, and charter fishing. According to the 2017 visitor activity and satisfaction report, 30% of all visitors to Hawaii on average participated in a boat-based marine mammal activity during their vacation; this equates to approximately 2.8 million tourists annually (Hawaii Tourism Authority, 2018).
Several dolphin-swim company owners expressed frustration with other marine tour businesses such as recreational fishing charters and scuba companies which began offering dolphin swims after the market reached “saturation.” Concerns regarding dolphin company growth were reflected in the operator interviews. Most respondents felt there were too many boats and swimmers in the water with the dolphins and that the boats in Waianae were too large. There was also concern that the competitive shift among companies had led to boats piggy-backing off other businesses that are good at finding the dolphins and the dissolving of “unspoken regulations” or “gentlemen’s agreements” among founding companies. Many of the operators complained of too many new businesses bringing on young or inexperienced captains who did not know the protocols.
As demand for the activity grows and new companies become established, more and more pressure is placed on the dolphins, whose population is estimated to be decreasing (Tyne et al., 2014). An economic study was completed on dolphin-swim tourism in Hawaii by Boehle (2007); comparing the results of this study to the observations above, dolphin-swim businesses have grown by 33% on Oahu and 23% on Hawaii Island. Contrasting these results to other marine mammal tourism in Hawaii, dolphin-swim boats could potentially be generating the greatest revenue.
Peak Season Timeline (PST)
The PST established in this research showed only a slightly significant relationship between the model and the tourism numbers for Oahu (ρ = 0.55, p ≤ 0.1); however, this was to be expected given that dolphin tourism remains constant for most of the year. Unlike humpback whales, which are a seasonal marine mammal species in Hawaii (peak season is November through March), Hawaiian spinner dolphins can be found reliably year-round. This demonstrates that the dolphin-swim businesses in Oahu are not influenced significantly by tourism fluctuations. During the slower fall season (September to mid-November), the HTA model also showed fewer visitors to the island. Kailua-Kona, Hawaii Island presented a very different dolphin-swim tourism pattern and this was reflected in the significant relation to the HTA visitor numbers (ρ = 0.83, p ≤ 0.001).
Comparing the HTA numbers from 2013 when this research was completed to 2018 demonstrates consistency and validity of the trends. For Oahu, there was a 16% increase in yearly visitors with similar month to month trends. The only change observed was a slightly larger dip in visitor numbers in August 2018, which was not seen in 2017. Visitor numbers for Kailua-Kona did not increase at the same rate, showing only a 3% increase in 2018 and 4% increase in 2017. Numbers for both years were considered in relation to the volcanic activity on Hawaii Island in 2018 affecting visitor numbers. The trend lines were less consistent for Kailua-Kona, with much less growth. Oahu visitor trends highlight the need for greater attention to the Waianae dolphin populations and swim industry which historically have received less consideration than Kailua-Kona.
As demonstrated above, stark differences between islands exist for revenues generated and the number of dolphin-swim participants. Previous dolphin-swim tourism research in Hawaii have lacked any inter-island comparisons, lumping populations and businesses across the state or only focusing on one area. This is problematic as the research does not properly inform policy makers who are currently exploring implementation of new regulations (Wiener, 2015a). Not only are there dramatic differences in revenue generation, but also in boat numbers, boat sizes, the way dolphin-swim companies conduct their businesses, and even in observed behaviors between dolphin populations. Tour operator expenses such as fuel costs, boat maintenance, slip fees, and employee salaries were not collected in interviews and, therefore, are not deducted from total revenue. Future work should consider adding these costs to get a better estimate of actual revenue.
Utilization Rate Estimates
Using the utilization rate estimation, 174,893 participants in 2013 were found to be going out on the dolphin-swim boats in Waianae annually versus 38,387 in Kailua-Kona. The mean number of participants per company for Waianae is significantly more (p ≤ 0.001) than the participants per company in Kailua-Kona. The greater number of participants on Oahu is somewhat surprising given the number of boats (b) and companies in Kailua-Kona. The smaller capacity on the small boats in Kailua-Kona is the main reason for the discrepancy in dolphin-swim participants. For both islands, 715,389 people are estimated to have participated in boat-based commercial dolphin tours (swim and watch) in 2013. This is 595,389 more than a preliminary estimate that was conducted statewide in 2008 (O’Connor et al., 2009), reflecting greater participation and dolphin tourism growth than previously predicted. There are also significant differences between the mean number of participants going out with dolphin-swim companies and the related dolphin watching tour boats. In both Waianae (p = 0.005) and Kailua-Kona (p ≤ 0.001) the dolphin-watch boats had more participants, again most likely due to boat capacity.
The participant estimates for both islands grossly underestimate the number of people directly engaging with the dolphins and have major implications for dolphin-swim activities. Concerns over the increase in dolphin-swim boats have led federal marine managers to consider banning this activity; however, actual implementation of any regulations has been stalled for more than a decade (Tyne et al., 2018). Dolphin-swim operators and company owners argue that that dolphin-swims bring a lot of revenue into the local communities and that prohibiting people from interacting with the dolphins in the water would diminish their businesses. According to Lück and Porter (2019), dolphin tour participants are primarily interested in being able to get close to the dolphins (88.3%).
This research can give context to federal and state managers who are looking to better understand the growth and varying forms of the dolphin swim industry. The scenario analysis can be used as an accountability exercise prior to further study and regulation aimed at better protection for the dolphins. If in-water dolphin-swims become outlawed, it will be important to outline how lost revenue will be made up and the mechanisms for enforcing new laws in coordination with the commercial operators.
There are many interest groups in both resident and tourist communities that swim with dolphins outside of commercial boat-based tours. Most of the shallow bays where people swim with the dolphins can be accessed from shore as well as by boat, making it easy for people to reach the dolphins. The numbers do not account for private and rented boats that interact with the dolphins, as well as chance encounters. Unfortunately, there has not been a directed count of total human users, something that should be focused on in future study.
Some of the distinctions between Kailua-Kona, Hawaii Island and Waianae, Oahu may lie in the tour boats and company structure. There are fewer boats on Oahu; however, they cater to larger groups of participants and go out at least two times a day. This contrasts with the smaller six-person boats that operate once daily in Kailua-Kona. Many of the Kailua-Kona boats also expand operations to manta ray swims at night. Although these operations cater to a smaller clientele, there are more than double the number of companies, leading to significantly more boats in the water. These boat and company differences will have implications for how the rules affect the tour operators and dolphin-swim participants. Regulations capping boat size or the number of boat permits available could dramatically shift the impact on the dolphins. For example, if permit and boat size limits were put in place, this could drop the swimmer numbers considerably compared to Oahu where fewer large boats operate. If the large boats on Oahu had to decrease their size, this would impact fewer companies, but cause significantly lower capacity for participants.
Primary Revenue
When the 2013 direct annual revenue for both Waianae, Oahu and Kailua-Kona, Hawaii Island was broken down by commercial categories (see Table 4), wild dolphin-swim activities made $32,287,892 (USD) less on Oahu and $30,526,356 (USD) less on Hawaii Islands than wild dolphin viewing. There are triple the number of dolphin-swim companies and boats compared to dolphin watching; however, the dolphin watch boats are much larger than most dolphin-swim vessels and can accommodate a greater number of participants. The average dolphin-swim vessel has a capacity of six in Kailua-Kona and 20 in Waianae, whereas the dolphin-watch vessels have an average capacity of 50.
On both Oahu and Hawaii Island, the dolphin-watch companies brought in more direct revenue in 2013 than the dolphin-swim companies. This was extremely surprising given the small number of dolphin-watch boats compared to the dolphin-swim boats; however, the size of the dolphin watch boats was almost triple that of the other companies. This could provide an alternative to the numerous dolphin-swim boats that can only handle a small number. While fewer companies could benefit, more people could still view the dolphins while decreasing the impacts of numerous boats approaching the dolphins all at once.
Other companies that participate in either dolphin watching or swimming, but do not make the activity their primary focus, also brought in an estimated $4,166,030 (USD) in 2013. This is a large amount of revenue that is not accounted for when thinking about dolphin tourism and an underestimation as it only represents companies located on Hawaii Island and does not include private boat rentals. The healing and spiritual retreats that center on the dolphins are not often discussed in Hawaii dolphin tourism literature, yet embody an important group of stakeholders. These businesses are currently centered on Hawaii Island and, as shown above, were estimated to bring in $704,400 (USD) in 2013 in direct annual revenue.
Lifetime Revenue per Dolphin
The dolphin-swims in Hawaii generate a higher revenue than other dolphin-swim island locations such as Bali that have a similar spinner dolphin population with predictable behavior. In Bali, dolphin-swim tours made US$4.1 million in direct revenue annually (Mustika et al., 2012). The wild dolphin-swim tours in Hawaii not only generate more revenue than dolphin-swims in other locations such as Lovina, Bali (Mustika et al., 2012) and Monkey Mia, Australia (Stoeckl et al., 2005), but are also making more than the local whale watching tourism (Utech, 2000). The data demonstrate a significant growth for the Hawaiian Islands in a short amount of time.
If the Hawaiian dolphin-swim industry reviewed here is compared to research conducted elsewhere (see Table 5), the market in Hawaii is among one of the largest generators of revenue annually. Individually, Hawaiian spinner dolphins produce more direct tourism revenue from dolphin-swims over their lifetime ($1,107,837 – $3,364,316) than other species examined, including some populations of humpback whales (Knowles and Campbell, 2011). However, they still are not amongst the top grossing marine animals over their lifetime compared with species such as the Sicklefish lemon shark ($2.64 million) or the reef shark ($2.31 million).
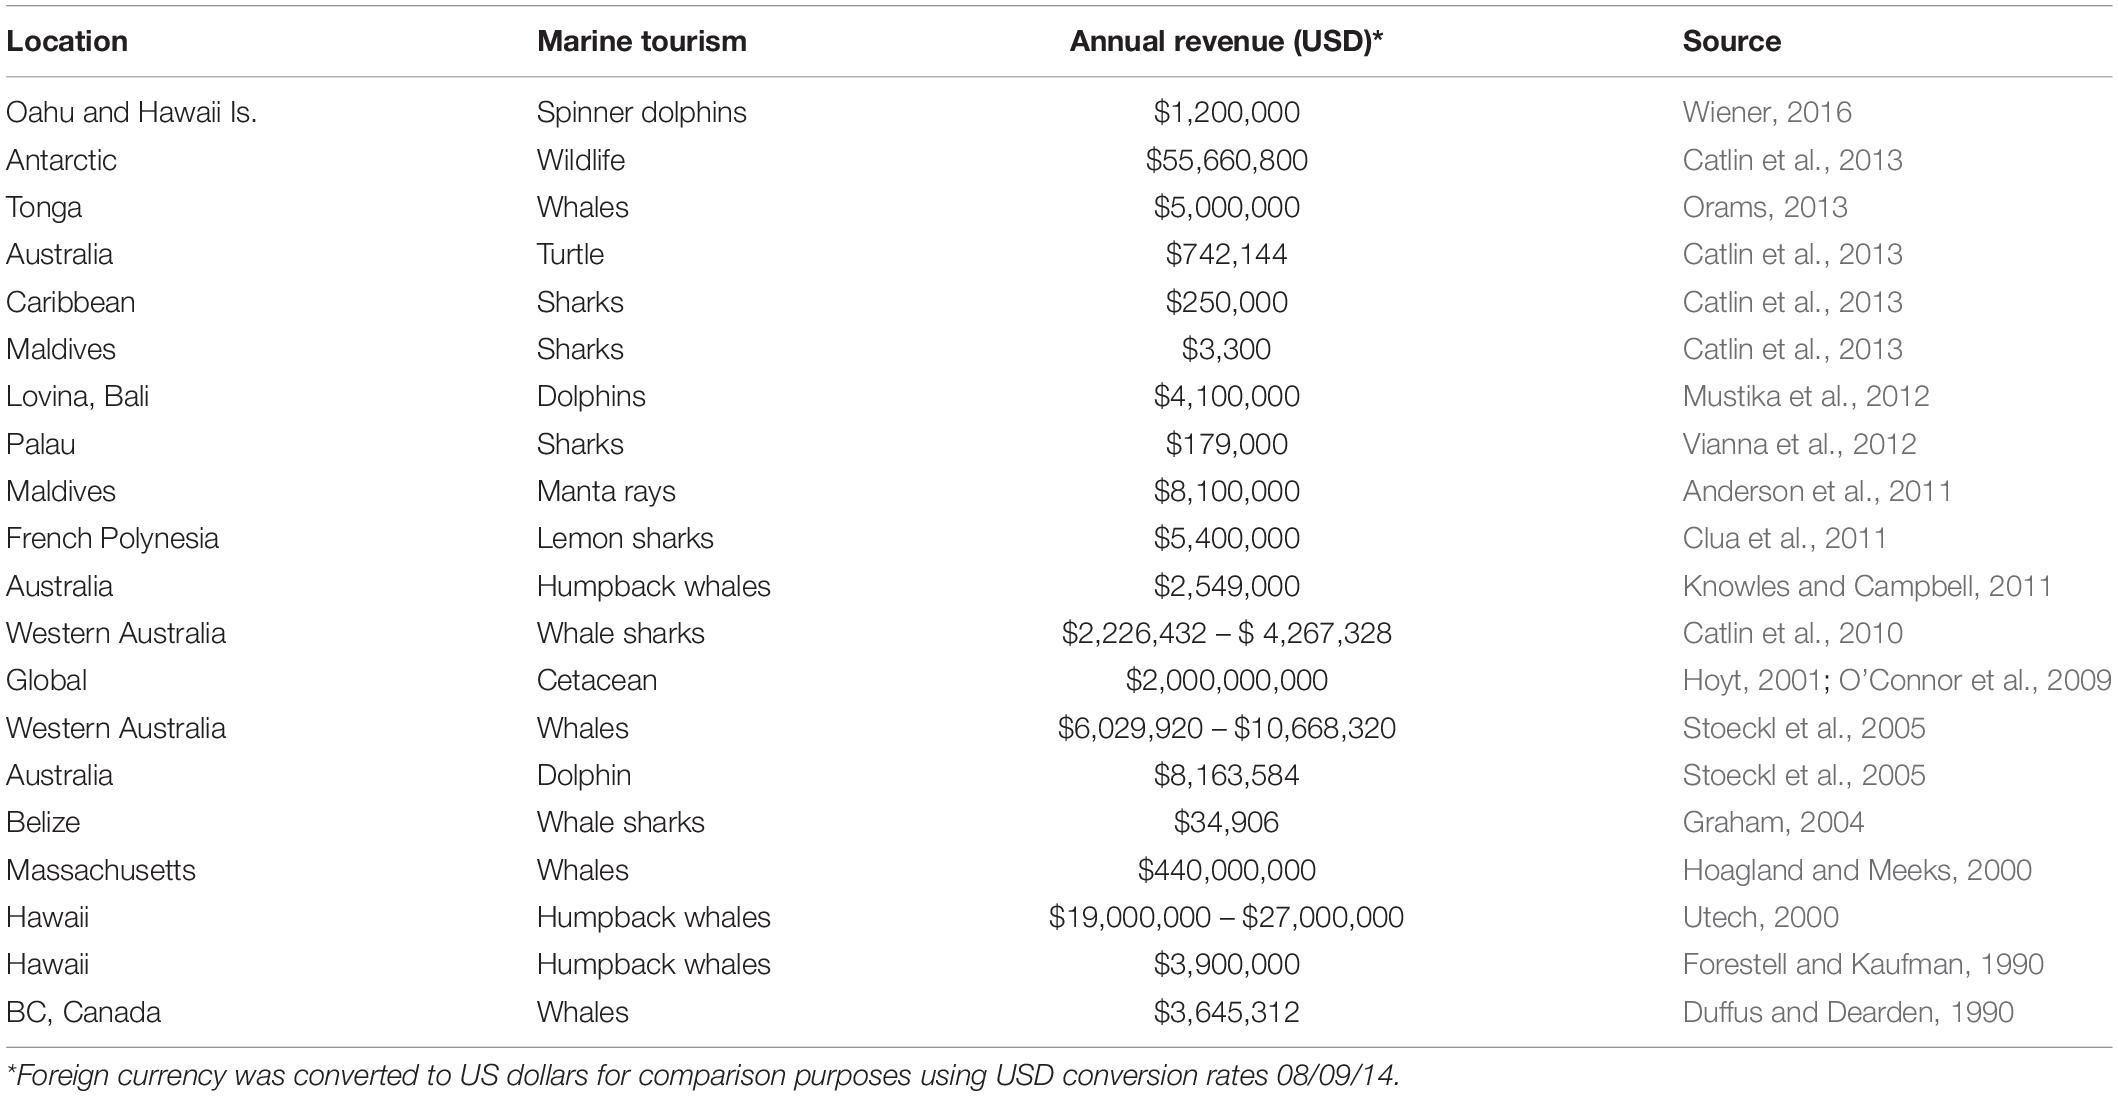
Table 5. Previous marine tourism valuation studies.
One of the problems that is not often considered with species-specific studies is the likelihood that some dolphins may be worth more than others. For this study, the entire population of dolphins per island was used to calculate lifetime revenue to account for inconsistencies in the number of dolphins in each bay daily. This does create some error as only certain bays have dolphin-swim boats and there may be individual dolphins that frequent bays with swimmers more than others. During operator interviews, there were individual dolphins that were called out by name and were familiar to residents. Certain dolphins may have individual characteristics either innate or learned that cause them to have greater exposure to swimmers. This is an important consideration, as some dolphins could be worth more than others, which also means that the impact to the population may be less if only a few pods are exposed to swimmers on a daily basis. While Tyne et al. (2014) have provided population estimates for the Hawaii Island dolphins, there has been relatively little effort to characterize the Oahu population, or bays outside of the Kailua-Kona coast on Hawaii Island. Without a complete population assessment, it will be hard to give an accurate measure of how many dolphins are involved in dolphin-swim activities.
Another component missing from species-specific analysis is the consideration of non-monetary benefits and costs. For example, this study found the Oahu dolphins to be worth considerably more than the Hawaii Island dolphins, but both have equal non-use values and are vital components of the coastal marine ecosystem. The Hawaiian spinner dolphins are appreciated not only by the commercial sector, but also by many residents and visitors who enjoy the mere presence of these dolphins. Some Native Hawaiians also believe that spinner dolphins are important family members and a living piece of their cultural heritage (Cressey, 2009).
A lack of government resources in Hawaii makes it difficult to adequately manage and enforce regulations pertaining to human interactions with wildlife. The tendency for marine conservation to be viewed as a cost to government budgets prevails in Hawaii, one which produces little return on investment (Catlin et al., 2013). As of this writing, the federal government has still not moved forward on any regulations after more than 10 years of proposed rules, public meetings and promises of action. In 2018, the NOAA Pacific Scientific Review Group (PSRG) also recommended that the NOAA National Marine Fisheries Service reconsider plans to manage human interactions with spinner dolphins through restrictions based on time and area management for boaters and swimmers (National Oceanic Atmospheric Administration [NOAA], 2018). This approach provides the ability for enforcement and consistent protection.
The revenue generated through dolphin tourism could easily be used to contribute to better enforcement for the dolphins and community through a user tax or fee added to each boat ticket sold. Other instruments such as exit surveys could help provide better understanding of the participants and better ways for enforcement to address user interactions.
Global Implications
All marine tourism industries – not just dolphin-swims – create conflict due to lack of regulation and general oversight of the ecosystem. The popularity and revenues of these activities increase stress on the species involved, which leads to amplified conflict amongst the operators. Historical mistrust of both state and federal governments has made the implementation of regulations and reporting of revenues and numbers difficult despite the obvious commercial expansion. This baseline scenario analysis illustrates the under-valuation of the industry and can serve as a call for further research into the valuing, monitoring, and regulation of wildlife tourism in Hawaii and around the globe. Many islands and coastal communities with dolphin populations do not take part in dolphin-swim tourism, but have the potential to host such businesses. For example, Guam has a local spinner dolphin population, a dedicated tourism industry, and several dolphin-watching businesses that have contemplated moving toward an in-water swim model. Using the results presented here, other locations may be able to mitigate conflict and stress on local dolphin populations by implementing management from the beginning. As the number of boats offering dolphin-swims grows, a standardized training course for operators might ensure that the proper information is passed on to participants. Lavín et al. (2016) have shown that, by having been provided ecological information, informed tourists are more prone to select visiting options that reduce animal stress and support conservation mechanisms in areas with little enforcement. This will not only help to better integrate the businesses into the community, but also to provide a safer environment for both participants and the dolphins.
Causes and Considerations
This paper does not attempt to provide a calculation of non-use or indirect costs associated with dolphin-swim tourism; while this is an important issue, the empirical data gathered from the operators do not lend for this type of examination. All efforts to ensure rigor were made and the data were assumed to be accurately reported; however, the results should still be considered interpretive.
The revenue estimates provided in this study only used market prices of commercial wild dolphin-swim/watch boats and do not constitute the entire dolphin tourism industry such as personal use stand-up paddleboards, kayaks, and shore swimmers. The number of users and revenue are estimates with the best available information as of 2013. There are new companies surfacing and ones operating illegally or on the side, so these numbers reflect an underestimation. Additionally, other islands (e.g., Maui and Kauai) which have recently reported new dolphin-swim tour companies have not been included. Operator costs were also not accounted for including fuel, equipment, employee wages, etc., an omission that represents a significant limitation to the research. Other considerations not included in this analysis are the impact of increasing boat traffic on the marine environment, use of local man-made and natural resources, and the rising human conflicts between user groups. The data provided represent an approximation of the dolphin-swim industry in Hawaii to give an idea of the participant numbers and revenue generated. Further research should explore the indirect costs and how much money is being funneled back to the communities surrounding dolphin-swim activities. Socioeconomic conditions vary for Hawaiian residents; for example, high poverty rates especially in the Waianae area can exceed 17%, more than 7% higher than the nationwide rate (Impact Assessment Inc., 2007).
Conclusion
As a whole, spinner dolphin tourism and marine tourism in Hawaii is severely under-studied and under-valued. This scenario analysis presents a first attempt at an accountability exercise based on a series of assumptions regarding demand of the Hawaiian dolphin tourism industry and its potential impact for the state. A better grasp on the broader economics of dolphin-swim tourism is necessary to gauge both direct and indirect effects which are not accounted for in this study. The estimates generated in this research provide a first and look at the potential revenue generated from an under-regulated and growing industry. The revenue potential identified in this research offers insight into the possible resources that could be made available for conservation and regulation enforcement, while still allowing for economic development. However, as the popularity and revenue growth increase, growing demand will be placed on the spinner dolphin population. Common-pool resources such as dolphins can easily become overly exploited through tourism if not managed appropriately (Heenehan et al., 2015). If growth continues without any additional protection or enforcement serious impacts will be placed on the dolphin population, leading to possible decline of the population or shift of habitat (Tyne et al., 2018; Kassamali-Fox et al., 2020). This would not only be a worst-case scenario for the genetically distinct Hawaiian spinner dolphin population, but would potentially crash the dolphin tourism industry as well, adding to the long list of species that have succumbed to the tragedy of the commons.
The benefit of providing a first analysis and estimate of the direct revenue associated with spinner dolphin-swim tourism is that it can offer resource managers a starting point for an assessment of a previously under-estimated component of the marine tourism industry in Hawaii. Resource managers should be working closely with the dolphin tourism stakeholders to better understand how conservation and regulation can be worked into local business models. There are large groups of stakeholders both commercially and in the community that interact with the spinner dolphins on a daily basis. They too could be collecting data on dolphin encounters to enhance the knowledge base and monitoring of the growing number of boats and people interacting with the dolphins in the water. Further understanding of the current practices and companies guiding dolphin tours is critical when reviewing and developing new laws and management of the dolphin-swim bays.
Data Availability Statement
The raw data supporting the conclusions of this article will be made available by the authors, without undue reservation.
Ethics Statement
The studies involving human participants were reviewed and approved by The Office of Research Ethics at York University. Written informed consent to participate in this study was provided by the participants or their legal guardian/next of kin.
Author Contributions
CW conceptualized the idea for research, implemented the research, and wrote the manuscript. Co-authors provided the valuable input during research and in the drafting of the manuscript. All the authors contributed to the article and approved the submitted version.
Funding
This research would not have been possible without the generous funding from the Social Science and Humanities Research Council of Canada (SSHRC) Doctoral Fellowship Award No. 752-2012-2384, Dolphin Quest, and York University.
Conflict of Interest
The authors declare that the research was conducted in the absence of any commercial or financial relationships that could be construed as a potential conflict of interest.
Acknowledgments
A special thank you to all of the operators and community members who took the time to provide interviews. We would also like to thank the reviewers for their insightful comments. Interview protocols adhered to the standards of the Canadian Tri-Council Research Ethics guidelines and went through human ethics approval at York University. This paper represents HIMB and SOEST contribution numbers 1816 and 11101.
Footnotes
- ^ Some companies work from shore.
References
Anderson, R. C., Shiham, A. M., Kitchen-Wheeler, A. M., and Stevens, G. (2011). Extent and economic value of manta ray watching in Maldives. Tour. Mar. Environ. 7, 15–27. doi: 10.3727/154427310x12826772784793
Andrews, K. R., Karczmarski, L., Au, W. W., Rickards, S. H., Vanderlip, C. A., Bowen, B. W., et al. (2010). Rolling stones and stable homes: social structure, habitat diversity and population genetics of the Hawaiian spinner dolphin (Stenella longirostris). Mol. Ecol. 19, 732–748. doi: 10.1111/j.1365-294x.2010.04521.x
Bateman, I. J., Mace, G. M., Fezzi, C., Atkinson, G., and Turner, K. (2010). Economic analysis for ecosystem service assessments. Environ. Resour. Econ. 48, 177–218. doi: 10.1007/s10640-010-9418-x
Baulcomb, C., and Böhnke-Henrichs, A. (2011). A Review of the Marine Economic Valuation Literature 1975 – 2011. Land Economy Working Paper Series No. 83. Scotland: SRUC Research.
Bejder, L., Samuels, A., Whitehead, H., Gales, N., Mann, J., Connor, R., et al. (2006). Relative abundance of bottlenose dolphins (Tursiops sp) exposed to long-term anthropogenic disturbance. Conserv. Biol. 20, 1791–1798. doi: 10.1111/j.1523-1739.2006.00540.x
Boehle, K. (2007). Valuation of Spinner Dolphin Excursions in Hawaii. Ph. D. Thesis, University of Hawai‘i at Mânoa, Honolulu, HI.
Braun, V., and Clarke, V. (2006). Using thematic analysis in psychology. Qual. Res. Psychol. 3, 77–101. doi: 10.1191/1478088706qp063oa
Burnett, D. G. (2010). A Mind in the Water: The Dolphin as Our Beast of Burden. Orion Magazine May/June. Available online at: http://www.orionmagazine.org/index.php/articles/article/5503/ (accessed November 12, 2011)
Catlin, J., Hughes, M., Jones, T., Jones, R., and Campbell, R. (2013). Valuing individual animals through tourism: science or speculation? Biol. Conserv. 157, 93–98. doi: 10.1016/j.biocon.2012.07.022
Catlin, J., Jones, T., Norman, B., and Wood, D. (2010). Consolidation in a wildlife tourism industry: the changing impact of whale shark tourist expenditure in the ningaloo coast region. Int. J. Tour. Res. 12, 134–138.
Chen, C. L. (2011). From catching to watching: moving towards quality assurance of whale/dolphin watching tourism in Taiwan. Mar. Policy 35, 10–17. doi: 10.1016/j.marpol.2010.07.002
Clark, C. W. (2006). The Worldwide Crisis in Fisheries: Economic Models and Human Behavior, 1st ed. New York, NY: Cambridge University Press.
Clark, C. W. (2010). Mathematical Bioeconomics: The Mathematics of Conservation, 3rd Edn. Hoboken, NJ: John, Wiley & Sons.
Clua, E., Buray, N., Legendre, P., Mourier, J., and Planes, S. (2011). Business partner or simple catch? The economic value of the sicklefin lemon shark in French Polynesia. Mar. Freshw. Res. 62, 764–770.
Courbis, S. (2007). Effect of spinner dolphin presence on level of swimmer and vessel activity in Hawaiian bays. Tour. Mar. Environ. 4, 1–14. doi: 10.3727/154427307784835697
Courbis, S., and Timmel, G. (2009). Effect of vessels and swimmers on behavior of Hawaiian spinner dolphins in Kealakeakua, Hônaunau, and Kauhako bays, Hawaii. Mar. Mammal Sci. 25, 430–440. doi: 10.1111/j.1748-7692.2008.00254.x
Cressey, J. (2009). Deep Voices: The Wisdom of Whales and Dolphin Tales. Victoria, BC: Trafford Publishing.
Danil, K., Maldini, D., and Marten, K. (2005). Patterns of use of Makua Beach, Oahu, Hawaii by spinner dolphins (Stenella longirostris) and potential effects of swimmers on their behavior. Aquat. Mammals 31, 403–412. doi: 10.1578/am.31.4.2005.403
Delfour, F. (2007). Hawaiian spinner dolphins and the growing dolphin watching activity in Oahu. J. Mar. Biol. Assoc. UK 87, 109–112. doi: 10.1017/s0025315407054148
Duffus, D. A., and Dearden, P. (1990). Non-consumptive wildlife-oriented recreation: a conceptual framework. Biol. Conserv. 53, 213–231. doi: 10.1016/0006-3207(90)90087-6
Dwyer, L., Forsyth, P., and Spurr, R. (2004). Evaluating tourism’s economic effects: new and old approaches. Tour. Manag. 25, 307–317. doi: 10.1016/s0261-5177(03)00131-6
Forestell, P. H., and Kaufman, G. D. (1990). “The history of whale-watching in Hawaii and its role in enhancing visitor appreciation for endangered species,” in Proceedings of the 1990 Congress on Coastal and Marine Tourism, Vol. 1(Corvallis, OR: National Coastal Resources Research Institute).
Graham, R. T. (2004). Global whale shark tourism: a ȁCGolden Goose” of sustainable lucrative tourism. Shark News 16, 8–9.
Guidino, C., Campbell, E., Alcorta, B., Gonzalez, V., Mangel, J. C., Pacheco, A. S., et al. (2020). Whale watching in Northern Peru: an economic boom? Tour. Mar. Environ. 15, 1–10. doi: 10.3727/154427320X15819596320544
Hawaii Tourism Authority (2013). 2013 Annual Visitor Research Report. Available online at http://www.hawaiitourismauthority.org/default/assets/File/reports/visitor-statistics/2013%20ANNUAL%20REPORT%20%28final%29.pdf (accessed April 29, 2015)
Hawaii Tourism Authority (2018). 2018 Annual Visitor Research Report. Available online at: http://dbedt.hawaii.gov/visitor/tourism/ (accessed April 01, 2019)
Heenehan, H., Basurto, X., Bejder, L., Tyne, J., Higham, J. E. S., and Johnston, D. W. (2015). Using Ostrom’s common-pool resource theory to build toward an integrated ecosystem-based sustainable cetacean tourism system in Hawaii. J. Sustain. Tour. 23, 536–556. doi: 10.1080/09669582.2014.986490
Higham, J., Bejder, L., Allen, S., Corkeron, P., and Lusseau, D. (2016). Managing whalewatching as a consumptive activity. J. Sustain. Tour. 24, 73–90.
Higham, J. E. S., Bejder, L., and Lusseau, D. (2009). An integrated and adaptive management model to address the long-term sustainability of tourist interactions with cetaceans. Environ. Conserv. 35, 294–302.
Hoagland, P., and Meeks, A. E. (2000). “The demand for whalewatching at Stellwagen Bank National Marine Sanctuary,” in NOAA Marine Sanctuaries Conservation Series MSD-00-2 - The Economic Contribution of Whalewatching to Regional Economies: Perspectives From Two National Marine Sanctuaries. Ref. No. 4OCEAN602417, (Silver Spring, ML: National Oceanic and Atmospheric Administration).
Hoyt, E. (2001). Whale-watching: Worldwide Tourism Numbers, Expenditures, and Expanding Socioeconomic Benefits. Yarmouth Port, MA: International Fund for Animal Welfare.
Hu, W., Boehle, K., Cox, L., and Pan, M. (2009). Economic values of dolphin excursions in Hawaii: a stated choice analysis. Mar. Resour. Econ. 24, 61–76. doi: 10.1086/mre.24.1.42629645
Impact Assessment, Inc (2007). Economic Data Report for NOAA Fisheries’ Spinner Dolphin Human Interaction EIS. Available online at: http://www.fpir.noaa.gov/Library/PRD/Spinner%20Dolphin/EIS/FinalSpinnerDolphinEconomicDataReportIAI.pdf (accessed April 29, 2015)
Kassamali-Fox, A., Christiansen, F., May-Collado, L. J., Ramos, E. A., and Kaplin, B. A. (2020). Tour boats affect the activity patterns of bottlenose dolphins (Tursiops truncatus) in Bocas del Toro, Panama. PeerJ. 8:e8804. doi: 10.7717/peerj.8804
Knowles, T., and Campbell, R. (2011). What’s a Whale Worth? Valuing Whales for National Whale Day. A Report for the International Fund for Animal Welfare (IFAW), Australia. Available online at: http://www.ecolarge.com/wp-content/uploads/2012/06/IFAW-NWD-Report-FINAL-lowres.pdf (accessed Augest 08, 2015)
Lammers, M. O. (2004). Occurrence and behavior of Hawaiian spinner dolphins (Stenella longirostris) along Oahu’s leeward and south shores. Aquat. Mammals. 30, 237–250. doi: 10.1578/am.30.2.2004.237
Larese, J. P., and Chivers, S. J. (2008). Age estimates for female eastern and whitebelly spinner dolphins (Stenella longirostris) incidentally killed in the eastern tropical Pacific tuna purse-seine fishery from 1973-82. J. Cetacean Resour. Manag. 10, 169–177.
Lavín, F. V., Gelcich, S., Lerdón, X. P., and Bustos, F. M. (2016). The role of information in changing tourists behavioral preferences at the Humboldt penguin reserve in northern Chile. Ocean Coast. 125, 63–69. doi: 10.1016/j.ocecoaman.2016.03.003
Lück, M., and Porter, B. A. (2019). Experiences on swim-with-dolphins tours: an importance– performance analysis of dolphin tour participants in Kaikoura, New Zealand. J. Ecotour. 18, 25–41. doi: 10.1080/14724049.2017.1353609
Milette, A. J., Pack, A. A., Herman, L. M., Estes, A., McCue, L. M., and Greenwood, V. (2011). “The frequency of encounters between individual Hawaiian spinner dolphins and dolphin directed human activity along Leeward Oahu,” in Proceedings of the 34th Conference of the Society of Marine Mammalology, (Tampa Bay, FL: Society of Marine Mammalology).
Mustika, P. L. K., Birtles, A., Everingham, Y., and Marsh, H. (2013). The human dimensions of wildlife tourism in a developing country: watching spinner dolphins at Lovina, Bali, Indonesia. J. Sustain. Tour. 21, 229–251. doi: 10.1080/09669582.2012.692881
Mustika, P. L. K., Birtles, A., Welters, R., and Marsh, H. (2012). The economic influence of community-based dolphin watching on a local economy in a developing country: implications for conservation. Ecol. Econ. 79, 11–20. doi: 10.1016/j.ecolecon.2012.04.018
National Oceanic Atmospheric Administration [NOAA] (2018). Pacific SRG Meeting Minutes and Correspondence. Available online at: https://www.fisheries.noaa.gov/national/marine-mammal-protection/scientific-review-groups#pacific-scientific-review-group (accessed April 01, 2019)
National Oceanic Atmospheric Administration [NOAA] - National Marine Fisheries Service [NOAA - NMFS] (2012). Spinner Dolphin (Stenella longirostris): Hawaiian Islands Stock Complex- Hawaii Island, Oahu/4-islands, Kauai/Niihau, Pearl & Hermes Reef, Midway Atoll/Kure, Hawaii Pelagic. Honolulu, HI: Pacific Islands Region, Observer Program.
Norris, K. S., Würsig, B., Wells, R. S., and Würsig, M. (1994). The Hawaiian Spinner Dolphin. Los Angeles, CA: University of California Press.
O’Connor, S., Campbell, R., Cortez, H., and Knowles, T. (2009). Whale Watching Worldwide: Tourism Numbers, Expenditures and Expanding Economic Benefits. Melbourne: IFAW.
Orams, M. (2013). Economic activity derived from whale-based tourism in Vava’u, Tonga. Coast. Manag. 41, 481–500. doi: 10.1080/08920753.2013.841346
Östman, J. S. O. (1994). Social Organization and Social Behavior of Hawaiian Spinner Dolphins (Stenella longerostris). Doctoral dissertation, University of California Santa Cruz, Santa Cruz, CA.
Samonte-Tan, G. P., White, A. T., Tercero, M. A., Diviva, J., Tabara, E., and Caballes, C. (2007). Economic valuation of coastal and marine resources: bohol marine Triangle, Philippines. Coast. Manag. 35, 319–338. doi: 10.1080/08920750601169634
Sprogis, K., Bejder, L., Hanf, D., and Christiansen, F. (2020). Behavioural responses of migrating humpback whales to swim-with-whale activities in the Ningaloo Marine Park, Western Australia. J. Exp. Mar. Biol. Ecol. 522:151254. doi: 10.1016/j.jembe.2019.151254
Stoeckl, N., Smith, A., Newsome, D., and Lee, D. (2005). Regional economic dependence on iconic wildlife tourism: case studies of Monkey Mia and Harvey Bay. J. Tour. Stud. 16, 69–81.
Timmel, G., Courbis, S., Sargeant-Green, H., and Markowitz, H. (2008). Effects of human traffic on the movement patterns of Hawaiian spinner dolphins (Stenella longirostris) in Kealakekua Bay, Hawaii. Aquat. Mammals 34, 402–411. doi: 10.1578/am.34.4.2008.402
Tyne, J., Christiansen, F., Heenehan, H., Johnston, D., and Bejder, L. (2018). Chronic exposure of Hawaiian spinner dolphins (Stenella longirostris) to human activities in important resting habitats. R. Soc. Open Sci. 5:171506. doi: 10.1098/rsos.171506
Tyne, J., Johnston, D., Christiansen, F., and Bejder, L. (2017). Temporally and spatially partitioned behaviours of spinner dolphins: implications for resilience to human disturbance. R. Soc. Open Sci. 4:160626. doi: 10.1098/rsos.160626
Tyne, J. A., Johnston, D. W., Rankin, R., Loneragan, N. R., and Bejder, L. (2015). The importance of spinner dolphin (Stenella longirostris) resting habitat: implications for management. J. Appl. Ecol. 52, 612–630.
Tyne, J. A., Pollock, K. H., Johnston, D. W., and Bejder, L. (2014). Abundance and survival rates of the Hawai’i island associated spinner dolphin (Stenella longirostris) stock. PLoS One 9:e86132. doi: 10.1371/journal.pone.0086132
Utech, D. (2000). “Valuing Hawaii’s humpback whales: the economic impact of humpbacks on Hawaii’s ocean tour boat industry,” in NOAA Marine Sanctuaries MSD-00-2 The Economic Contribution of Whalewatching to Regional Economies: Perspectives From Two National Marine Sanctuaries, (Kihei, HI: Hawaiian Islands Humpback Whale National Marine Sanctuary).
Vianna, G. M. S., Meekan, M. G., Pannell, D., Marsh, S., and Meeuwig, J. (2012). Socioeconomic value and community benefits from shark-diving tourism in Palau: a sustainable use of reef shark populations. Biol. Conserv. 145, 1267–1277.
Wiener, C. (2015a). “Flipper fallout: dolphins as cultural workers, and the human conflicts that ensue,” in Human-Wildlife Conflict: Complexity in the Marine Environment, eds M. Draheim, F. Madden, J. B. McCarthy, and E. C. M. Parsons (London, UK: Oxford University Press), 137–158. doi: 10.1093/acprof:oso/9780199687145.003.0008
Wiener, C. (2015b). “Dolphin tourism and human perceptions: social considerations to assessing the human-dolphin interface,” in Animals and Tourism: Understanding Diverse Relationships, ed. K. Markwell (Bristol: Channel View Publications), 146–162. doi: 10.21832/9781845415051-013
Wiener, C. (2016). Understanding Spinner Dolphin Marine Tourism in Hawaii: A Social Approach To Assessing Underwater Interactions. Doctoral dissertation, York University, Toronto, ON.
Wursig, B. (1996). Swim-with-dolphin activities in nature: weighing the pros and cons. Whalewatcher 30, 11–15.
Keywords: dolphin-swim, tourism, revenue analysis, Hawaiian spinner dolphin, utilization rate model, time area management
Citation: Wiener C, Bejder L, Johnston D, Fawcett L and Wilkinson P (2020) Cashing in on Spinners: Revenue Estimates of Wild Dolphin-Swim Tourism in the Hawaiian Islands. Front. Mar. Sci. 7:660. doi: 10.3389/fmars.2020.00660
Received: 03 April 2020; Accepted: 21 July 2020;
Published: 13 August 2020.
Edited by:
Aldo S. Pacheco, National University of San Marcos, PeruReviewed by:
Felipe Vasquez Lavin, Universidad del Desarrollo, ChileAlan Giraldo, University of Valle, Colombia
Copyright © 2020 Wiener, Bejder, Johnston, Fawcett and Wilkinson. This is an open-access article distributed under the terms of the Creative Commons Attribution License (CC BY). The use, distribution or reproduction in other forums is permitted, provided the original author(s) and the copyright owner(s) are credited and that the original publication in this journal is cited, in accordance with accepted academic practice. No use, distribution or reproduction is permitted which does not comply with these terms.
*Correspondence: Carlie Wiener, Y3dpZW5lckBoYXdhaWkuZWR1; Y2FybGlld2llbmVyQGdtYWlsLmNvbQ==