 Dennis S. Petersen
 Stanislav N. Gorb
 Lars Heepe
- Department of Functional Morphology and Biomechanics Zoological Institute, Kiel University, Kiel, Germany
Under natural conditions, barnacles, one of the most prominent marine hardfouling organisms, encounter a vast variety of heterogeneous surfaces including artificial ones, such as ship hulls on which they adhere efficiently. Despite intensive research in the last decades, it is still not clear, how material related factors influence the fouling development under natural conditions, and whether roughness at the micro scale affects the release dynamics of barnacles. In order to shed light on the relationship between these substrate factors and their effect on biofouling, both settlement and fouling development of Balanus (= Amphibalanus) improvisus was evaluated on epoxy resin and polyvinylsiloxane (PVS) substrates differing in their roughness (flat, asperity sizes: 0.3, 1, 3, 9, 12 μm) in a static field trial in the Baltic Sea for 17 weeks performed in 2014. All barnacles on these tested surfaces were individually tracked on a weekly basis, in order to calculate the release-to-settlement ratios (r/s), to evaluate the fouling- release performance and to monitor the actual attachment duration. It was demonstrated that both stiffness and surface free energy had no strong effect on initial settlement. The total fouling accumulation was nearly identical for epoxy resin and PVS, if fallen-off barnacles were included in the analysis. Roughness influenced initial settlement and fouling development. On PVS the r/s ranged between 0.5 and 0.7 and the attachment duration was around 4 weeks. However, samples with a roughness of 9 μm displayed a lower r/s ratio (0.35) and barnacles showed longer attachment durations (8 weeks). In a second field trial performed in 2017, attachment forces of barnacles were measured after the samples had been immersed for 10 weeks in the Baltic Sea. The shear stresses obtained were similar for substrates with different roughness with around 0.12 MPa and were independent of the barnacle’s size. These findings show that roughness even at the micro scale can impact the fouling release ability of a surface.
Introduction
Among the marine hardfouling organisms, barnacles (Cirripedia, Thoracica) represent one of the most successful groups. Adhesion related phenomena play an important role during their life cycle, especially during the transition between the motile larval phase (cyprid larva) and the adult sessile phase. Also the entire adult phase, at which reproduction takes place, strongly relies on attachment to a vast variety of substrates (Anderson, 1993). The chemical background of underwater attachment in barnacles is complex and involves a range of substance classes, such as lipids, antimicrobial peptides and binding proteins (Dickinson et al., 2009; Burden et al., 2012; Kamino, 2013; Gohad et al., 2014; Kamino, 2016; So et al., 2016; Fears et al., 2018). Most of these biological compounds are multifunctional and interactions between them and the underwater substrates are still largely unknown. Some barnacles including Balanus [=Amphibalanus] improvisus (Pitombo, 2004) additionally produce a calcareous base plate in the adult phase and secrete their cement underneath it in a stepwise process during growth (Burden et al., 2014). As they grow, periodic molts take place every few days. The base plate also expands radially and with it also the adhesive layer. This means that barnacles have to continuously produce adhesive onto the corresponding surface which makes adhesion a permanent challenge in their life.
In general, barnacle adhesion may be regarded as a glue-based system with all its requirements necessary for a strong and reliable adhesive joint. A desired adhesive joint can only be achieved if the glue system can readily wet the surface, displace water and other residues from the interface and form a thin layer between the surface and the organism with a high Young’s modulus in the cured state (Lane, 2005). This is a difficult task because under natural conditions barnacles encounter a vast variety of heterogeneous surfaces like rocks, flotsam or even other organisms (epibiosis) (Wahl, 1989). They also adhere efficiently to manmade surfaces like ship vessels or maritime installations. This overgrowing of surfaces, also called biofouling, leads to huge economical costs due to increased fuel consumption and biocorrosion (Schultz et al., 2011).
All these surfaces have different material properties that may interact differently with the glue and thereby affect the efficacy and reliability of the adhesive joint. The two most important material parameters with respect to barnacle adhesion are surface chemistry (wettability, surface free energy, surface charge) and surface stiffness (Brady and Singer, 2000). The third important aspect although not directly associated with the properties of the material is the surface roughness, because it can influence the wetting behavior irrespective of the initial material properties (Wenzel, 1949; Yan et al., 2011). The differences in wetting behavior can lead to difficulties in getting rid of contaminations and adsorbed water at the interface. A still contaminated surface can lead to a reduced real contact area between the glue and substrate. Such failures in wetting and contact formation may drastically weaken the performance of the resulting adhesive layer. However, if the glue is able to readily wet the surface, higher roughness usually leads to an increase of the real contact area. As a result, the mechanical interlocking between the cured glue and rough solid substrate takes place, additionally enhancing the attachment strength in comparison to a smooth substrate (Habenicht, 2002).
Despite their importance for adult barnacle adhesion, the effects of surface chemistry, stiffness and roughness are still poorly understood under natural conditions. It has been shown that substrates with relatively low stiffness, such as silicones and hydrogels, can reduce the adhesion strength of barnacles (Sun et al., 2004; Wendt et al., 2006), because barnacles often display morphological/physiological changes, when growing on substrates with very low stiffness. In some cases, barnacles may even develop cup-shaped basal plates most likely because the material became compressed during growth due to the continuous pressure applied by barnacles to the substrate at the edges of their basal plates (Ahmed et al., 2011, 2014). On stiff substrates, the barnacle glue forms a few micrometers thick transparent, rigid layer after curing (Saroyan et al., 1970). However, on soft substrates, barnacle glue can be opaque and can have a rubber-like appearance (Berglin and Gatenholm, 2003; Wiegemann and Watermann, 2003; Ahmed et al., 2011). It was assumed that the reason for different cement conditions may be linked to genetic regulation (Holm et al., 2005, 2009), changes in the glue production or enhanced water uptake of the glue in the uncured state (Wiegemann and Watermann, 2003; Ramsay et al., 2008). Especially, water uptake could change the cross-linking of the cement and in turn its appearance and mechanical properties. Such soft rubber-like glue drastically reduces the adhesion strength of barnacles possibly due to the increased size of the adhesive layer and its low Young’s modulus (Kavanagh et al., 2005).
Barnacle adhesion is linked to surface chemistry, but it is difficult to estimate its effect on adult barnacle adhesion with our current knowledge. Previous works have mostly investigated the effect of surface free energy (SFE) on the settlement behavior of barnacles during the cyprid larval stage (Roberts et al., 1991; Holm et al., 1997). Overall, the results are difficult to interpret. It is unclear whether hydrophilic or hydrophobic surfaces encourage settlement and results also varied between different barnacle species (Rittschof and Costlow, 1989; Gerhart et al., 1992; O’Connor and Richardson, 1994; Dahlström et al., 2004). In more recent studies, the influence of surface charge on the settlement of cyprid larvae was investigated (Petrone et al., 2011; Di Fino et al., 2014). It has been shown that cyprids of B. improvisus settled significantly more often on negatively charged surfaces, if compared to positively charged ones regardless of the present SFE. The authors, therefore, postulated a possible overriding effect of surface charge. However, all these results were gathered in experiments performed under laboratory conditions, which complicates the application to natural conditions (Briand, 2009). Other factors, such as water current (Crisp, 1955) and biofilm coverage of the substrate (Hung et al., 2008) may be of strong importance and could potentially change the settlement patterns regardless of the SFE of the substrate.
Investigating the influence of stiffness, SFE and roughness on the adhesion of adult barnacles under natural conditions is a very challenging task due to the dynamic nature of biofouling. Normally either percentage of coverage or number of individuals is monitored after preselected time intervals ranging from few weeks to several months (Briand, 2009). Force measurements are sometimes used to further quantify the attachment strength of barnacles (Swain et al., 1992; Swain and Schultz, 1996). However, all these methods have to some degree only limited application, if biofouling of adult barnacles shall be evaluated reliably. The problem is that in the majority of previous studies no information is given about attachment and detachment events of individual barnacles. This circumstance makes the evaluation of the fouling repellence and the fouling release abilities of a surface very difficult. In this case, fouling repellence means the frequency of cyprids rejecting to settle on a surface. For example, one sample may have no fouling repellence, but good fouling release abilities. If this sample is then compared with a sample that has good fouling repellence, but weak fouling release abilities, the chosen time interval for analysis would drastically influence the evaluation and may lead to a misjudgment of the samples’ effects on biofouling. Additionally, some effects may even be overlooked which could be important in developing new antifouling strategies.
Instead of only providing a snapshot after a given time, in this study, all barnacles were continuously tracked individually on a weekly basis from their initial attachment until their detachment in a 17 weeks long field experiment conducted in the Baltic Sea near Kiel, Germany. Two different materials (Epoxy resin and Polyvinylsiloxane) varying in stiffness and SFE with in total seven different roughness ranges at the microscale were tested in the field experiment. Due to the high temporal resolution during tracking of individual barnacles, new parameters describing the initial fouling settlement and fouling dynamics of the samples were identified. These include (1) initial settlement, (2) fouling dynamics, (3) actual barnacle density at the end of the experiment, (4) cumulative barnacle density (adding all detached barnacles to the ones still attached), (5) attachment duration prior to release and (6) release-to-settlement ratio (Petersen et al., 2018). With all these new parameters, our approach was to evaluate the influence of stiffness, SFE and roughness on adult barnacle adhesion to understand whether strong and reliable adhesion of adult barnacles is always directly associated with the substrate choice made at the cyprid larval stage (Aldred et al., 2010).
In addition, a second field experiment was conducted in which force measurements were performed and shear stresses were calculated on the same samples. The results of the force measurements were then put into perspective with the results obtained from the previous settlement experiment, to evaluate significance and correlation of different parameters for further usage as a description tool for the fouling release ability of samples.
Materials and Methods
Sample Preparation
Sample substrates were produced from two different materials with different stiffness and varying surface roughness. Soft samples were made from a soft silicone elastomer polyvinylsiloxane (PVS) (Colthéne/Whaledent AG, Altstätten, Switzerland), whereas stiff samples were made from epoxy resin (Spurr, 1969). Samples with varying surface roughness were produced by molding PVS against a glass surface (used as flat controls) and polishing papers with grain sizes ranging from 0.3, 1, 3, 9, and 12 μm (Buehler, Lake Bluff, IL, United States). Subsequently, Epoxy samples were produced by molding PVS samples. The samples had a size of 5 × 8 cm and were mounted within acrylic glass (PMMA) sample holders with a length of 11 cm and a width of 8 cm (Figure 1). In total 39 samples were used by having three replicates per roughness and material.
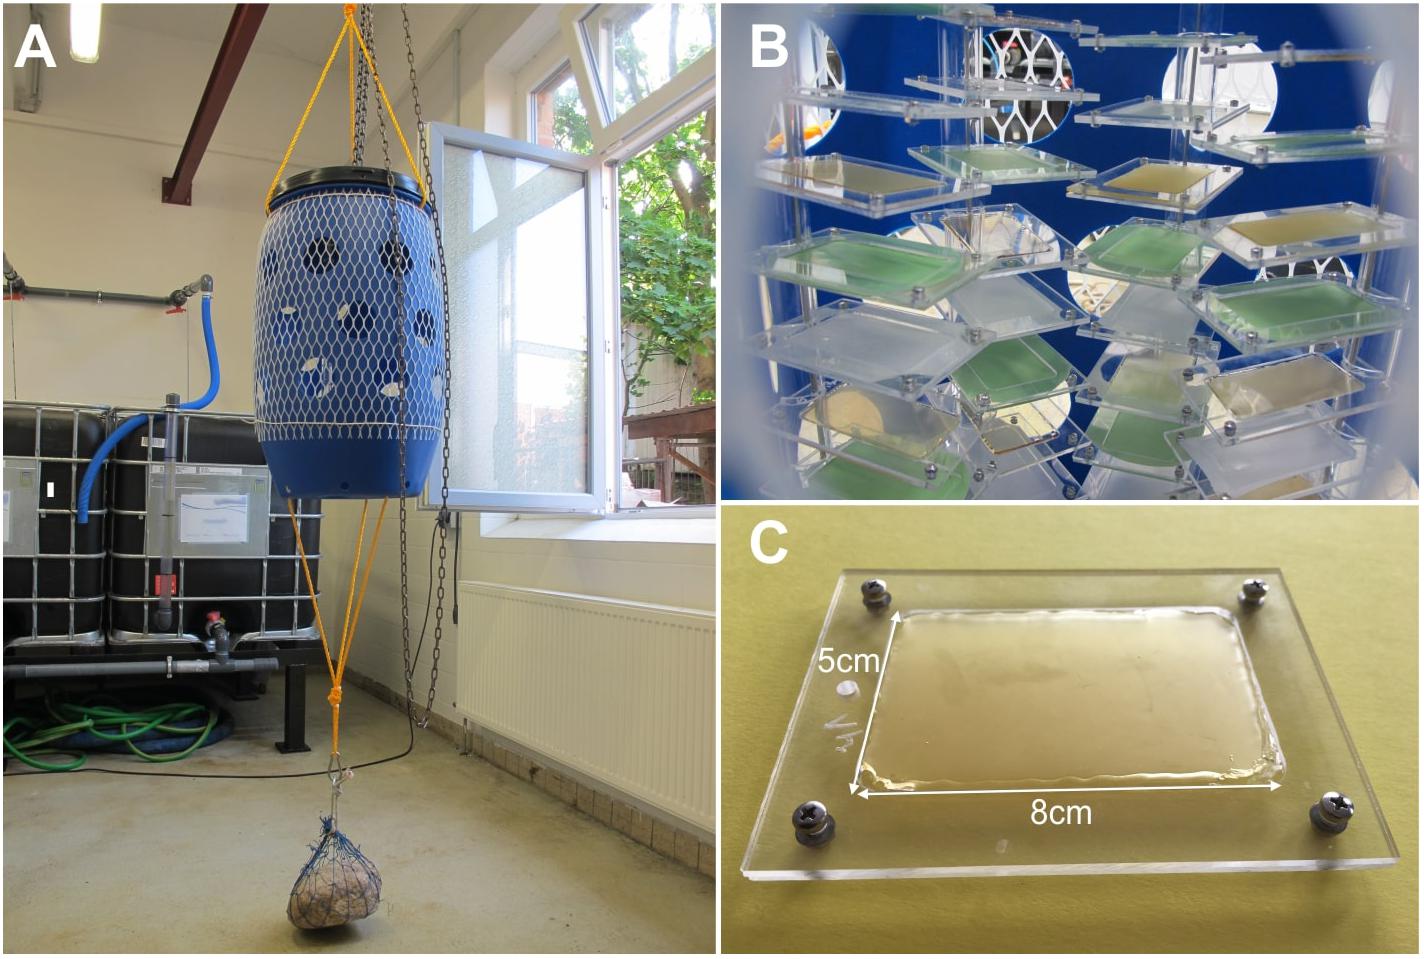
Figure 1. Experimental setup. (A) A barrel was used to protect the samples situated inside. (B) The samples were put into sample holders that were mounted on PMMA pipes. (C) Typical sample used during the field experiment. The sample area was 5 × 8 cm.
Roughness Analysis and Evaluation of the Material Properties
Detailed information about the surface roughness of the glass and polishing papers used for the sample preparation is available in Salerno et al. (2018). In order to check, whether surface roughness of the PVS and Epoxy samples are comparable after molding, surface topographies were measured using a scanning white light interferometer NewView 6000 (Zygo Middlefield, CT, United States) with a scan size of 1400 μm x 1400 μm. Symmetrical height distribution of the rough surfaces confirmed the similarity of PVS and Epoxy roughness samples.
Surface energies of PVS and Epoxy samples were estimated using the sessile drop method. An optical contact angle measurement device OCAH 200 (Data-Physics Instruments, Filderstadt, Germany) was used to measure static contact angles of water, diiodomethane and ethylene glycole on both types of materials. In total, ten measurements with each liquid were performed on flat surfaces. The average surface energy of PVS (γPvs = 17.92 ± 0.23 mN/m) and Epoxy (γepoxy = 45.39 ± 0.21 mN/m) were calculated according to Wu et al. (1995). The Young’s modulus, measured in a compression test of PVS used in this study, is EPVS ≈ 3.2 MPa (Peressadko and Gorb, 2004) and the Young’s modulus of fully polymerized epoxy resin is EEpoxy ≈ 7.0 GPa (Peisker and Gorb, 2010).
Evaluation of Settlement and Fouling Dynamics (First Field Experiment)
On the 29th of May 2014, a 17 weeks long field experiment was conducted in in the Baltic Sea near Kiel (Schleswig Holstein, Germany). The samples were submerged in the Kiel Fjord (5419’46.200 N, 1010’28.400 E). They were mounted on PVC pipes in a perforated plastic barrel having holes with a diameter of 15 cm to protect them from predation, high currents and impact of flotsam (Figure 1A; Petersen et al., 2018). If predation was observed during the field experiment the detached barnacles weren’t considered during the fouling release evaluation. For each sample treatment one sample was located in the top, the middle and the bottom region of the barrel. The barrel was located around 1 m below the water surface and was fixated to the ground with a stone. Water temperature, salinity and total dissolved solutes (TDS) were measured with a portable conductivity meter WTW Cond 3310 (WTW Wissenschaftlich-Technische Werkstätten GmbH, Weilheim, Germany) once a week (Figure 4).
Quantification of Fouling Dynamics
Each week the barrel was taken out of the water and each sample was photographed individually using a Canon G11 digital camera (Canon Deutschland GmbH, Krefeld, Germany). The samples were kept in fresh sea water and were only exposed to air during image acquisition. All samples were then mounted back in the barrel and re-exposed in the Baltic Sea. The total number of adult barnacles (Balanus [=Amphibalanus] improvisus) (Pitombo, 2004) with a minimum size of 2 mm was counted for each sample. Only organisms, that had settled at least 3 mm away from the edges of the window frame, were counted to avoid errors caused by edge effects. All samples were photographed with a tripod to keep the same distance between sample and camera. Barnacles are often difficult to track during the early stages after metamorphosis under natural conditions. Therefore, pictures that had been taken at a later stage were used to backtrack small barnacles and to double check the growth progression. All barnacles were individually indexed after first appearance for each sample and continuously tracked throughout the end of the experiment (Figure 2). If a barnacle had been detached from a surface, the duration of its settlement in weeks prior to the detachment was monitored. [For a more detailed description about the mussel presence during the experiment (see Petersen et al., 2018)]. Mussels were not considered during fouling evaluation. A counting error of 0.025 barnacles per cm2 was assumed.
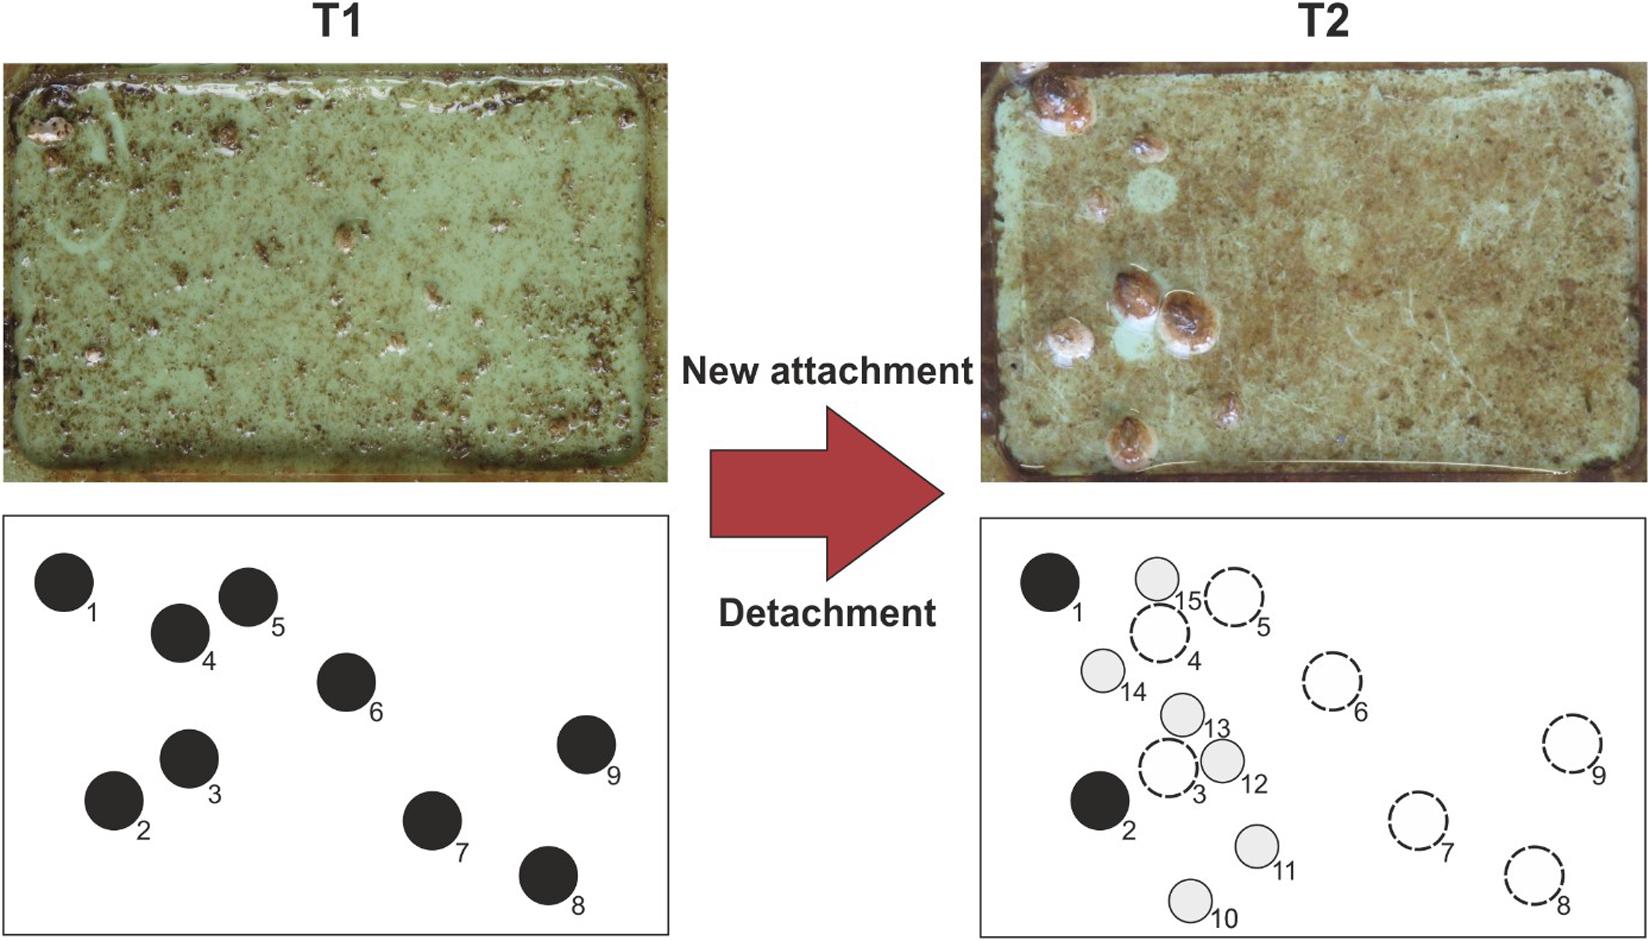
Figure 2. Actual photos taken during the field experiment and an scheme showing the fouling evaluation method. At a given time T1 (here week 4), barnacles (black circles) are counted and indexed. At a later time T2 (here week 16), all detachment events are tracked (dashed circles). All newly attached barnacles (gray circles) are again tracked and indexed. The time interval used in this study between each fouling evaluation was 1 week. The entire field experiment took 17 weeks. Mussels were not considered during fouling evaluation.
Following parameters describing the fouling dynamics have been defined. The parameter “actual barnacle density” is the true barnacle density counted for each week on a sample. The parameter “cumulative barnacle density” refers to all barnacles that have ever been attached to the surface neglecting their detachment during the experiment. The parameter “attachment duration” refers to the time interval between the initial attachment and the possible detachment of a barnacle from a surface. The parameter “release-to-settlement (r/s)” (Petersen et al., 2018) refers to the total number of released barnacles divided by the total number of settled ones and is used together with the attachment duration to quantitatively compare the fouling release ability between the different surfaces. Since epoxy resin samples show no fouling release ability, attachment duration and r/s were only evaluated for PVS samples.
Force Measurements on PVS Samples (Second Field Experiment)
A second barrel was exposed at the same study site in 2017 with identical PVS samples compared to the ones used in the previous field experiments in 2014 for 10 weeks. Only PVS samples were re-exposed, because barnacles attached too strongly to epoxy samples and attachment forces often could not be measured without destroying them. Barnacles began to grow on the substrates after 2 weeks. The samples were then transferred to the laboratory. Shear strengths of all barnacles attached to these surfaces with a minimum base plate diameter of 5 mm were measured with a force transducer (5000 g capacity; FORT10, World Precision Instruments, Inc., Sarasota, FL, United States) connected to a BIOPAC Model MP100 acquisition system (BIOPAC Systems, Inc., Goleta, CA, United States). Force-time curves were visualized using Acq Knowledge 3.7.0 (BIOPAC Systems, Inc., Goleta, CA, United States). Force was applied at constant speed (v = 1mm/s) with the help of a micromanipulator until the barnacle detached from the surface. The force present directly before the detachment was considered the maximum attachment force of that barnacle and was later statistically analyzed. All experiments were performed at 25°C and underwater. The samples were kept in artificial seawater until the force measurements were performed. After removal, barnacle base plate sizes were measured using a Keyence VR-3100 3D measurement macroscope (Keyence Corp., Osaka, Japan) in order to estimate the contact area. Attachment strength was calculated in MPa by dividing the force to the area of the basal plate.
Statistical Analysis
Chi-squared tests were performed, in order to evaluate an influence of topography on actual and cumulative fouling densities. The total count of all attached barnacles across all sample types was used to calculate expected barnacle densities, if no difference in fouling accumulation was assumed across all samples. A one-way ANOVA on ranks test was performed, in order to evaluate the influence of topography on average attachment duration prior to release and shear stress. If significant differences were found, a Holm–Sidak post hoc test was additionally performed. All statistical analyses were executed using SigmaPlot 12.0 (Systat Software Inc., San Jose, CA, United States). If not stated otherwise, the data was normally distributed and showed homoscedasticity.
Results
First Field Experiment: General Fouling Dynamics
Figure 3 shows the temporal course of the actual barnacle densities (total number of barnacles per cm2) on epoxy (Figure 3A) and PVS (Figure 3B) samples and the temporal course of the cumulative barnacle densities on epoxy (Figure 3C) and PVS (Figure 3D) samples for each roughness. Water temperature ranged between 16.7 and 22.4°C with a peek between weeks 8 and 10 (Figure 4). Salinity has gradually increased in the field in the course of 17 weeks from around 9 PSU to 14.3 PSU (Figure 4).
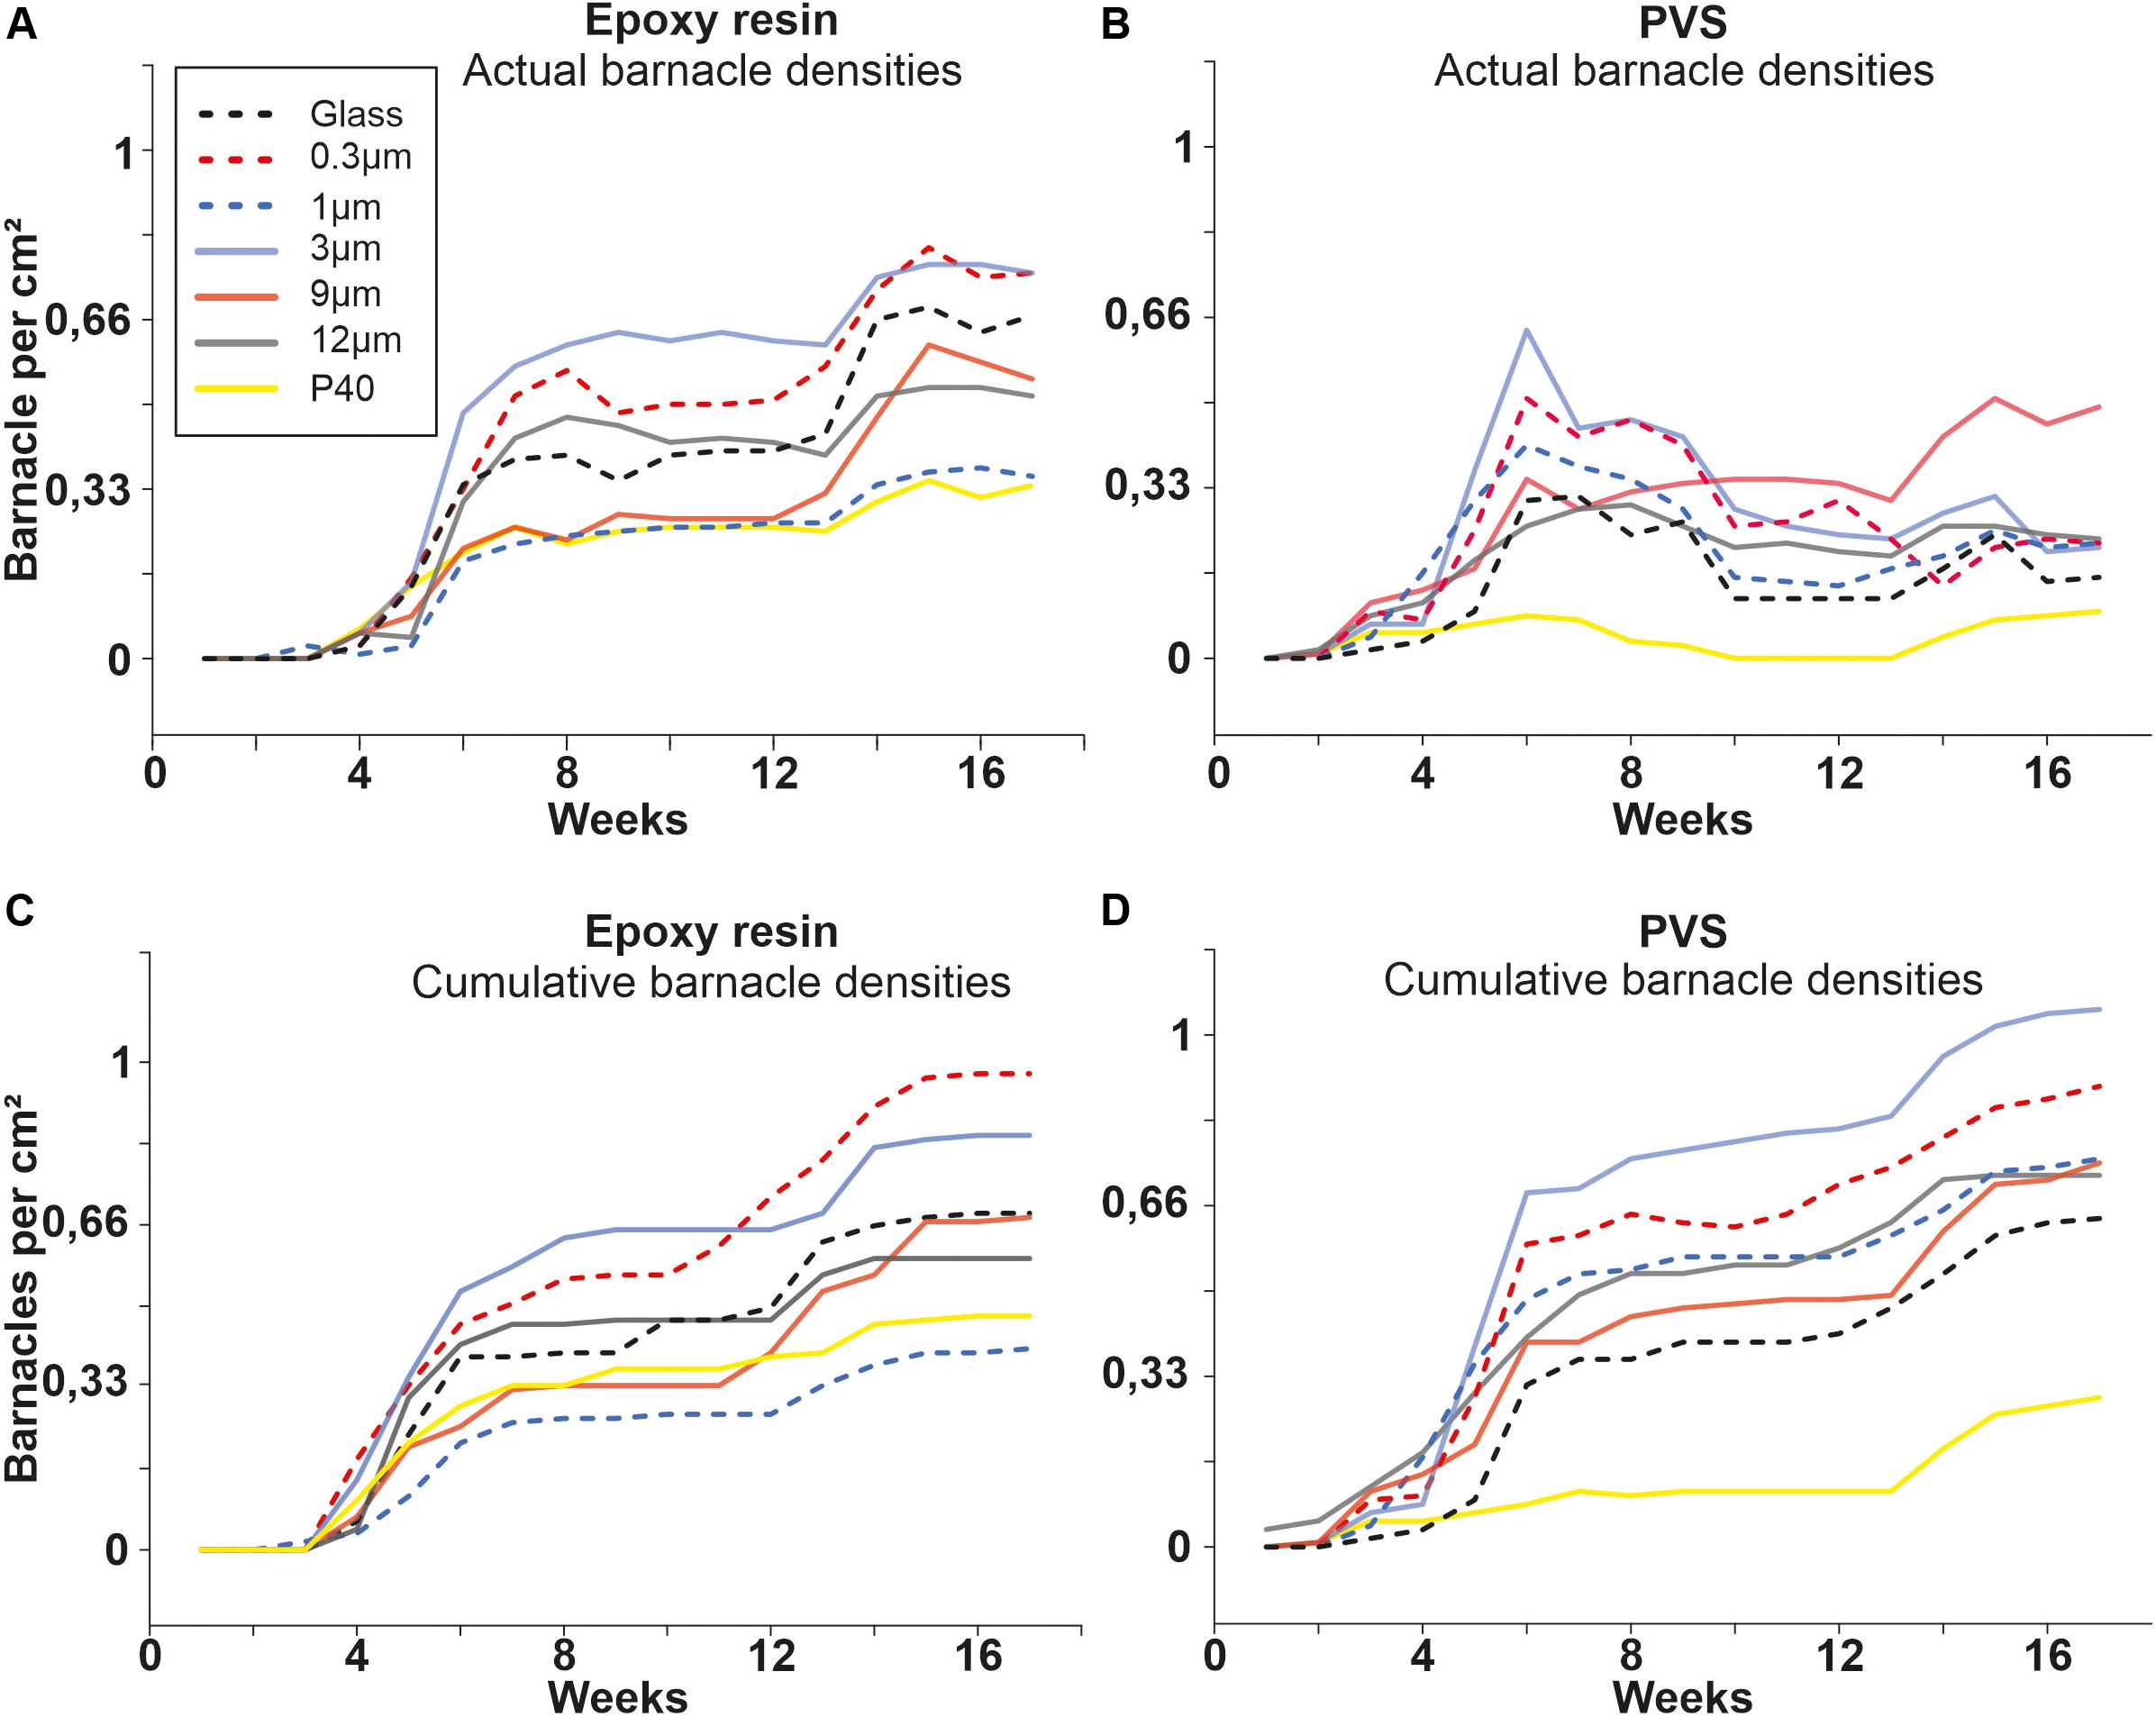
Figure 3. Results of the field experiment 1. (A,B) Actual barnacle densities (total number of barnacles per cm2) for samples made of Epoxy and PVS are subdivided into the seven roughness types. (C,D) Accumulated barnacle densities including all detached ones.
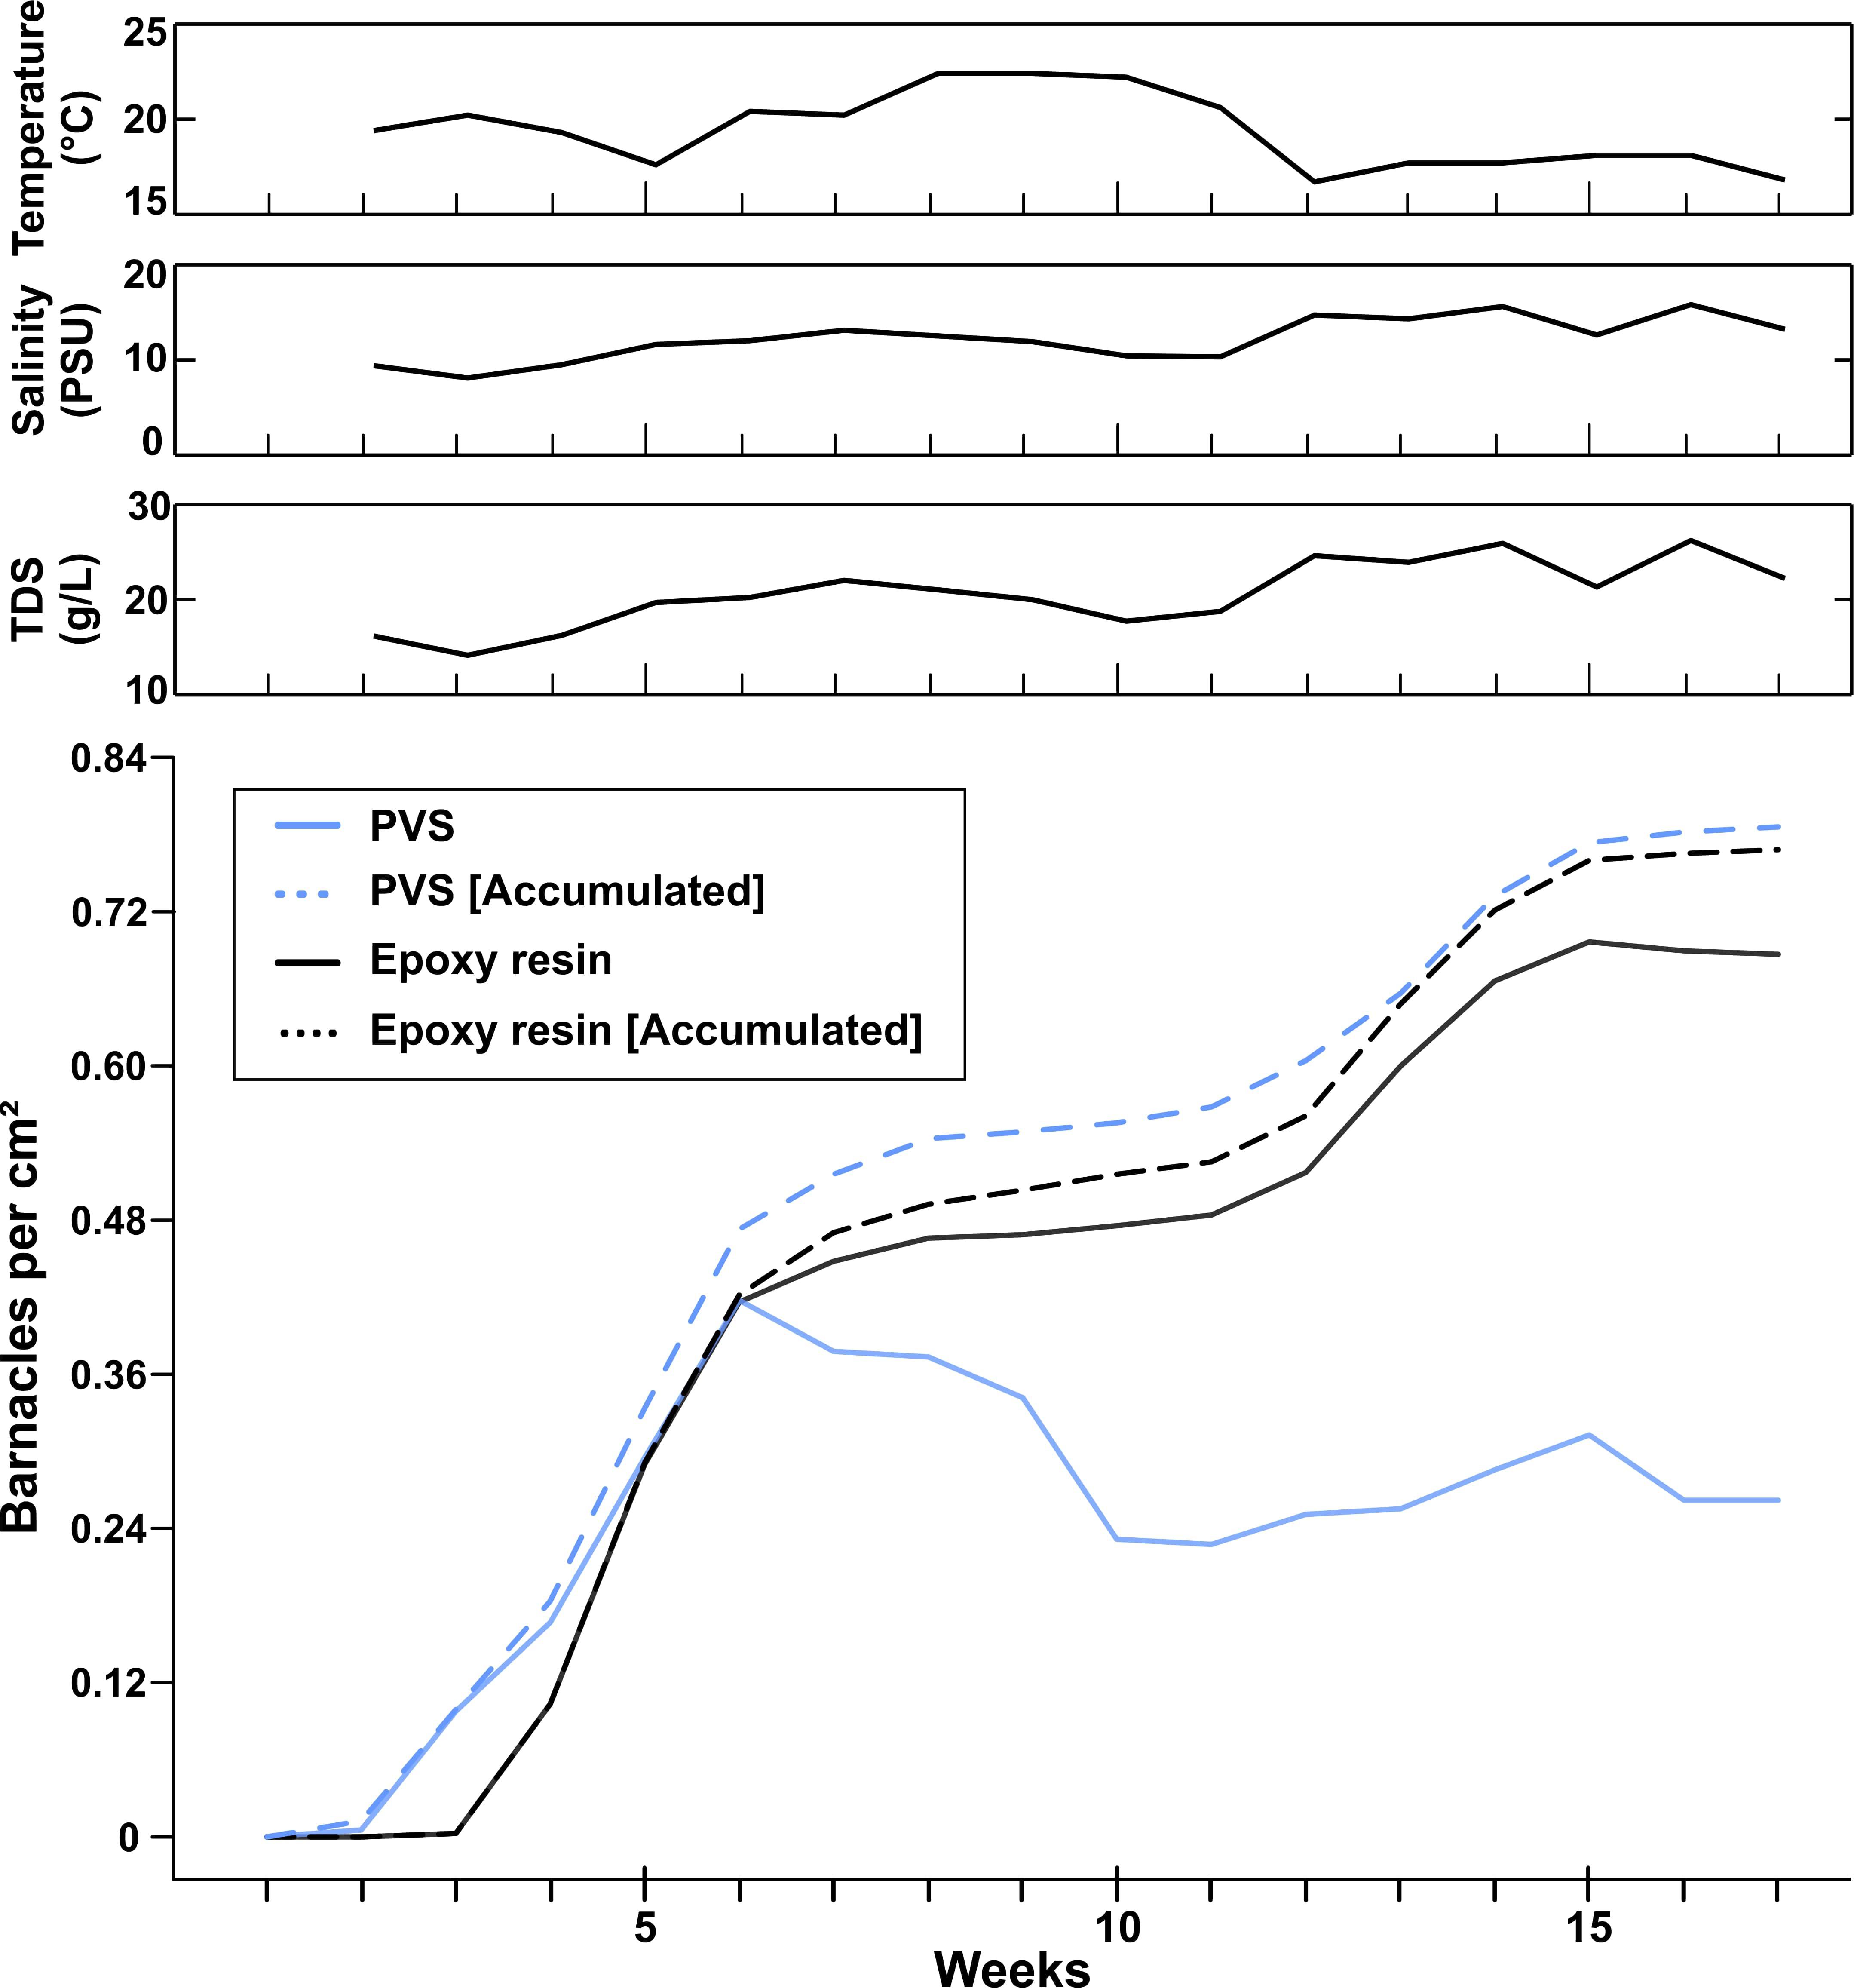
Figure 4. Actual and cumulative barnacle densities (total number of barnacles per cm2) in dependence of the substrate material during the field experiment 1. Abiotic factors were monitored weekly [temperature, salinity, total dissolved solutes (TDS)].
Within each material, the temporal course of actual barnacle densities was similar for all roughness samples except for sample roughness 9 μm on PVS. On epoxy, the actual barnacle densities started to increase from week 4 on up to week 8 (Figure 3A). From week 9 on, actual barnacle densities remained stable for all roughness samples up to week 13 followed by a second accumulation phase until the end of the experiment. Samples with a roughness of 3 and 0.3 μm showed the highest actual barnacle densities after 17 weeks with around 0.76 ± 0.01 barnacles per cm2. The lowest actual barnacle density on epoxy was observed for samples with a roughness of 1 μm (0.38 ± 0.01 barnacles per cm2). The actual barnacle densities observed after 17 weeks are statistically different between the roughness samples (Chi Square Test, p = 0.003, df = 6, F = 19.565).
On PVS, all actual barnacle densities increased up to week 6 (Figure 3B). The highest actual barnacle density was observed on samples with a roughness of 3 μm in week 6 (0.64 ± 0.01 barnacles per cm2) followed by the 0.3 μm sample (0.51 ± 0.01 barnacles per cm2). All other roughness samples ranged between 0.2 and 0.5 ± 0.01 barnacles per cm2 at week 6. From week 7 on, barnacles had been starting to detach from all PVS surfaces. After 17 weeks, the actual barnacle densities had stabilized between 0.09 and 0.23 ± 0.01 barnacles per cm2. Only on samples with a roughness of 9 μm, an increase was observed after weeks 6 to 0.49 ± 0.01 barnacles per cm2. Again, the actual barnacle densities between the different roughness samples are statistically different after 17 weeks (Chi Square Test, p = 0.002, df = 6, F = 20.288).
Figure 3C shows the cumulative barnacle densities on epoxy samples. No statistically significant difference between the actual and cumulative barnacle densities was observed for all roughness samples on epoxy (Chi Square Test, p = 0.958, df = 6, F = 1.522). Overall, only very few barnacles had been detached from epoxy during the field experiment. Figure 3D shows the cumulative barnacle densities on PVS for all roughness samples. The observed values are statistically significant, if the actual and cumulative barnacle densities are compared after 17 weeks (Chi Square Test, p = 0.001, df = 6, F = 25,749).
Influence of Substrate Material on the Fouling Dynamics
All barnacle densities were pooled together for each material, in order to further investigate the effect of sample material on initial settlement and fouling dynamics (Figure 4). For the first 6 weeks, PVS and epoxy samples showed no statistically significant difference in actual barnacle densities (One Way ANOVA, p = 0.963, n = 28) (Figure 4, solid lines) with PVS samples having a peak at 0.40 ± 0.03 barnacles per cm2. After week 6, barnacles had been starting to fall off on the PVS samples, while actual barnacle densities on epoxy samples were steadily increasing until the end of the experiment. In week 10, the actual barnacle density had decreased to 0.21 ± 0.03 barnacles per cm2 on the PVS samples and then stabilized at 0.24 ± 0.03 barnacles per cm2 until the end of the experiment. On epoxy samples, actual barnacle densities stagnated between weeks 8 and 11 at 0.48 ± 0.03 barnacles per cm2 and then increased to 0.59 ± 0.03 barnacles per cm2 until the end of the experiment. The actual barnacle densities are significantly different between both materials after 17 weeks (One Way ANOVA, p = 0.001, n = 28).
The actual and cumulative barnacle densities (Figure 4, solid black line) on epoxy showed a strong linear correlation (Pearson correlation, r = 1, p = 1.25∗10–21). In comparison, on PVS samples, the actual barnacle densities over 17 weeks (Figure 4, solid gray line) and the cumulative barnacle densities over 17 weeks (Figure 4, dashed gray line) showed a weaker linear correlation, (r = 0.716, p = 1.25∗10–3) due to a drastic decrease in actual barnacle densities observed after week 7. If the cumulative barnacle densities over 17 weeks on PVS were compared with the cumulative barnacle densities over 17 weeks on epoxy, a strong linear correlation (r = 0.99, p = 1.25∗10–14) was found again. Also, cumulative barnacle densities were statistically equal between PVS and epoxy after 17 weeks (One Way ANOVA, p = 0.99, n = 28).
Synergistic Effects Between Material and Roughness
In order to test for potential synergistic effects between roughness and material, each roughness was individually compared between both materials with respect to the actual and cumulative barnacle densities. Figure 5 shows difference plots for each roughness. Difference plots were calculated by subtracting barnacle densities on PVS samples from the ones on epoxy samples with identical roughness for each week. A positive value corresponds to a higher barnacle density on epoxy samples, whereas a lower value corresponds to the higher barnacle density on PVS samples. Empty circles represent the difference between the actual barnacle densities on epoxy and PVS samples and filled circles represent the difference between the cumulative densities on epoxy and PVS samples.
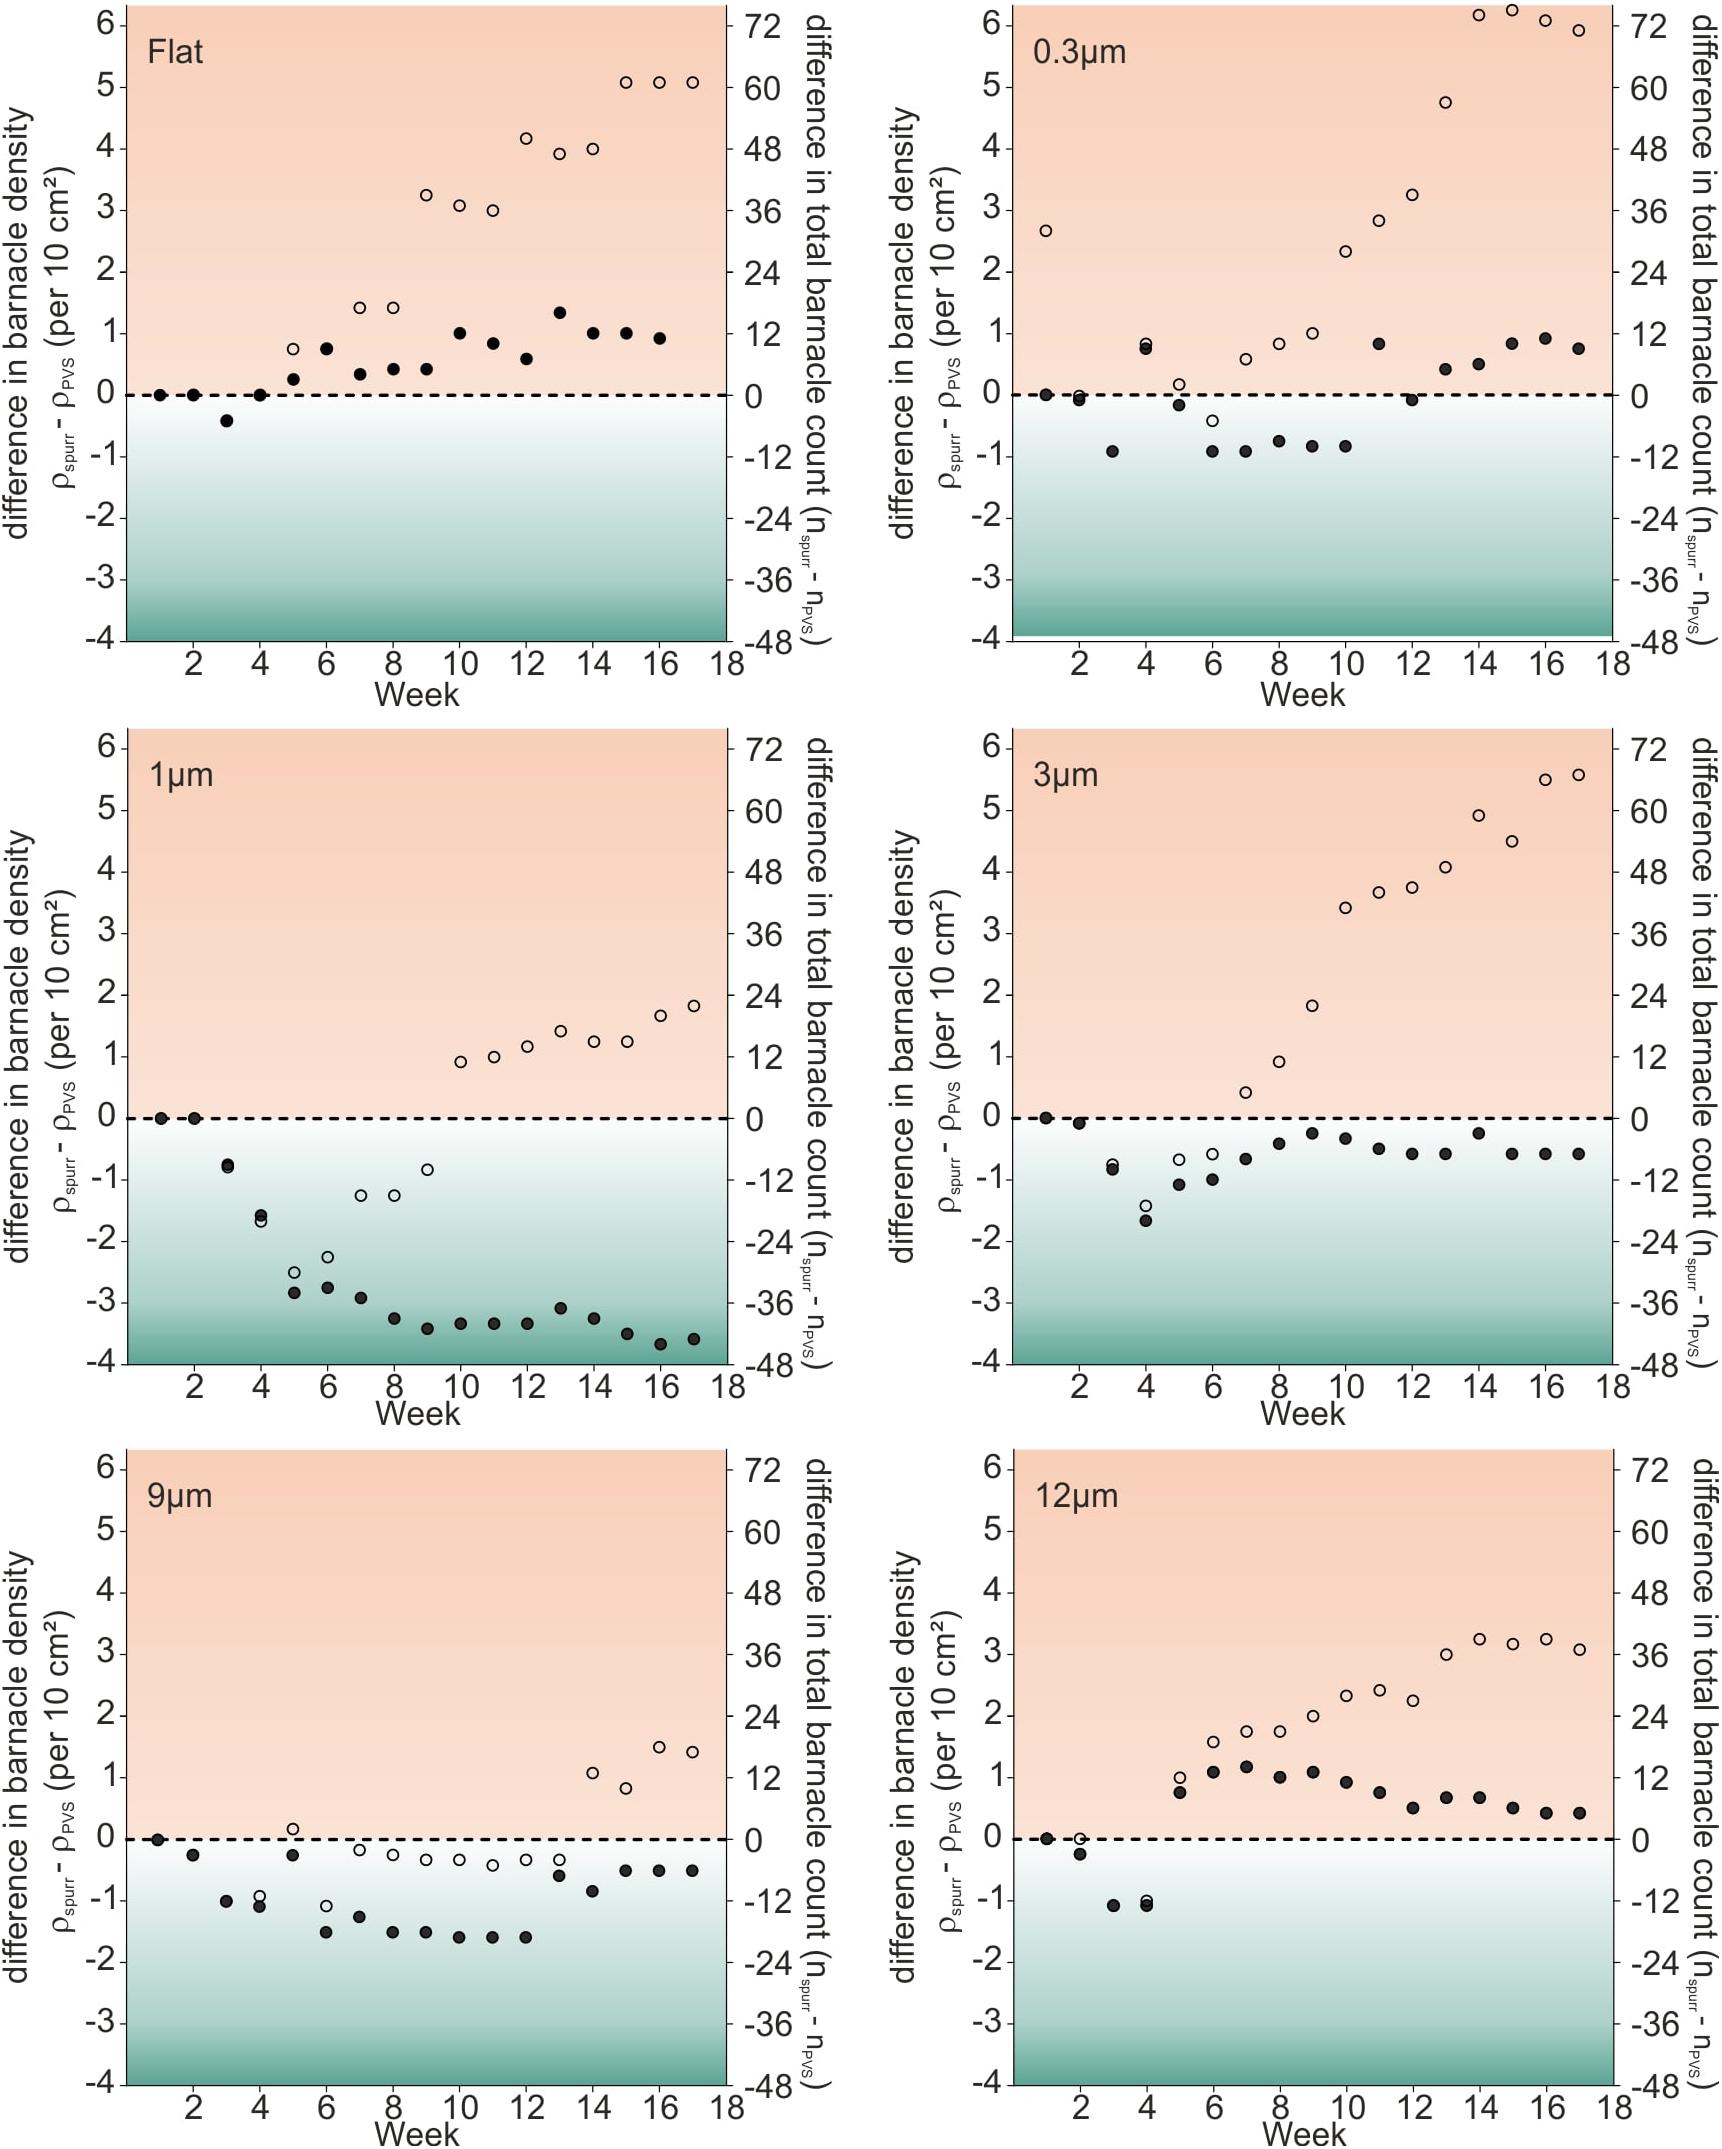
Figure 5. Dot plots showing the difference in barnacle densities (total number of barnacles per 10 cm2) between substrates made of Epoxy and PVS for each roughness sample during the field experiment 1. Empty circles represent the difference between actual barnacle densities on Epoxy and PVS types of samples. Filled circles represent the difference between the cumulative barnacle density on Epoxy type of samples and the cumulative barnacle density on PVS type of samples.
For all rough samples, the higher actual barnacle densities were observed on epoxy at the end of the experiment (empty circles). On flat samples (5.10 barnacles per 10 cm2) and the ones with a roughness of 0.3 μm (5.92 barnacles per 10 cm2), 3 μm (5.58 barnacles per 10 cm2), the biggest differences in actual barnacle densities were observed after 17 weeks. On samples with a roughness of 12 μm (3.08 barnacles per 10 cm2), 1 μm (1.83 barnacles per 10 cm2) and 9 μm (1.42 barnacles per 10 cm2), lower differences in actual barnacle densities were observed at the end of the field experiment. However, during the first three to five weeks, the differences in actual barnacle densities were close to the equilibrium among all roughness samples (flat, 0.3, 9, 12 μm) or samples showed a tendency to higher values on PVS (1, 3 μm). From week 6 on, a shift to higher actual barnacle densities on epoxy was found for all roughness samples except for 9 μm. Here, the difference in actual barnacle densities between epoxy resin and PVS had remained close to equilibrium up to week 13, before a shift toward higher actual barnacle densities on epoxy was observed.
The differences between the cumulative barnacle densities were close to equilibrium among all roughness samples with exception of 1 μm (Figure 5, filled circles). Here, a strong shift to PVS with -3.58 barnacles per 10 cm2 was observed.
Average Duration of Barnacle Attachment and Release-to-Settlement
All barnacles were tracked individually after their first appearance on each sample during the field experiment, so that it was possible to describe all detachment events that had taken place in each week quantitatively. Figure 6A shows the attachment duration in weeks for all barnacles including the detached organisms and still attached ones after the end of the field experiment for each roughness. Only barnacles that had been attached for at least one week were included in the analysis. Attachment duration is statistically different between the roughness samples (ANOVA on Ranks, p < 0.001, df = 6). The average attachment duration was similar for smooth samples and the ones with a roughness of 0.3, 1, 3, and 12 μm and ranged between 3 and 5 weeks (median). Samples with a roughness of 9 μm showed the highest average attachment duration with 8 weeks in median and were statistically different from all other roughness samples with exception of samples with 12 μm roughness (adjusted Dunn’s Test, alpha = 0.05).
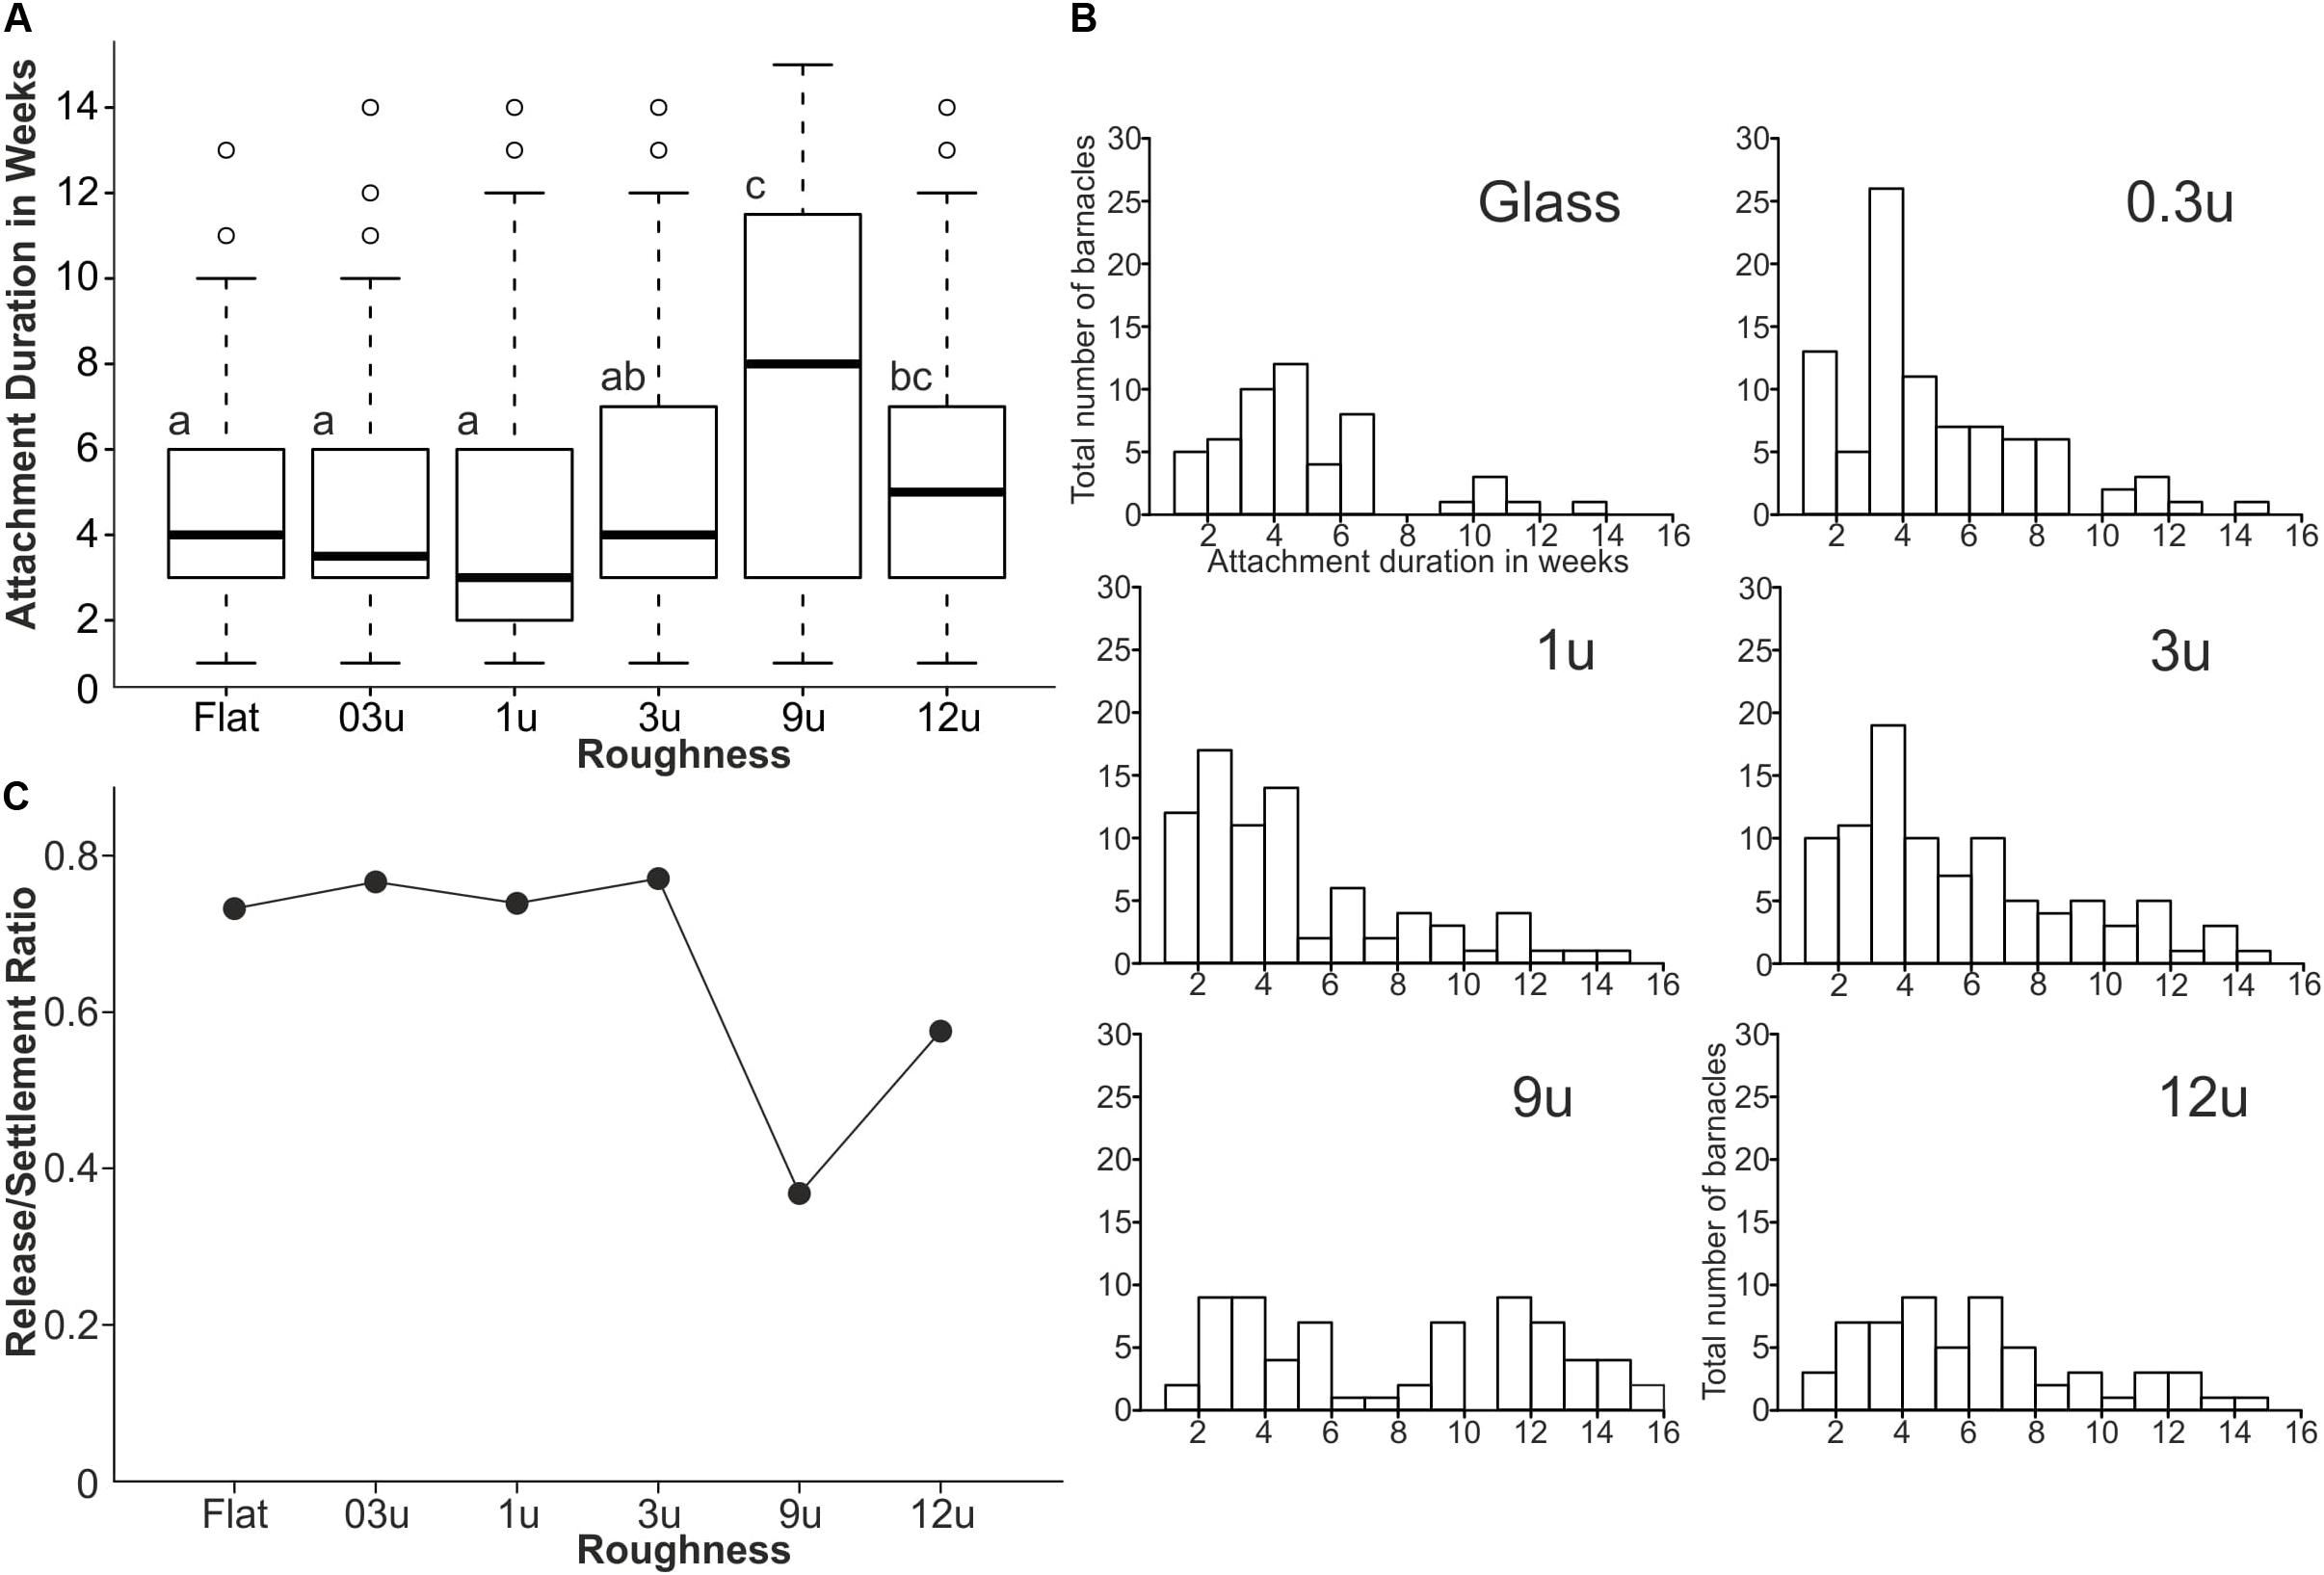
Figure 6. The fouling release ability of PVS type of samples during the field experiment 1. (A) Boxplots showing the average attachment duration for each roughness type (groups with same letters are statistically equal). (B) The frequency histograms of attachment durations for all barnacles on each roughness. (C) Release-to-settlement ratios for all samples with different roughness made of PVS.
Figure 6B shows the frequency of barnacles (here the total number of barnacles on all three replicates per roughness on PVS) in relation to their attachment duration. The histograms for smooth samples and the ones with a roughness of 0.3, 1, and 3 μm were strongly skewed to the left and the maximum total number of barnacles with respect to attachment duration can be found between 3 and 5 weeks. The histogram for samples with a roughness of 12 μm was also skewed to the left, but the frequencies were more uniformly distributed between 3 and 7 weeks and no distinct maximum was observed. The histogram for samples with a roughness of 9 μm, in contrast, did not follow the pattern of a left-skewed distribution, as observed for the other roughness samples. The distribution was more bimodal with the first cluster at 2–6 weeks and the second cluster at 9–16 weeks. The first cluster showed a more uniform distribution. The second cluster showed a distribution that was skewed to the left with a dominant gap at 10 weeks.
Release-to-settlement ratios (r/s) according to Petersen et al. (2018) were calculated by dividing the number of released barnacles by the total number of settled ones. Figure 6C displays the calculated r/s values for each roughness. The flat samples and the ones with roughness of 0.3, 1, and 3 μm showed similar r/s with around 0.73. For samples with a roughness of 9 μm, the release of barnacles was reduced as indicated by an r/s of 0.35. This is the lowest r/s value observed since samples with a roughness of 12 μm again showed a higher r/s value with 0.55.
Maximum Attachment Force and Average Shear Stress of Barnacles on Silicone Samples
The maximum attachment forces of barnacles were monitored in a second field experiment for identical PVS samples performed in 2017. The samples were exposed to the Baltic Sea for approximately 10 weeks. Figure 7A shows the measured shear stress for each roughness. No significant difference with respect to shear stress and roughness was observed (ANOVA on Ranks, p = 0.180, df = 5) and the average shear stress ranged between 0.10 and 0.14 MPa. The overall highest average shear stress was observed on samples with a roughness of 0.3 μm with a median of 0.14 MPa. Samples with roughness of 9 μm showed a higher variance with higher shear stress values compared to all other roughness samples.
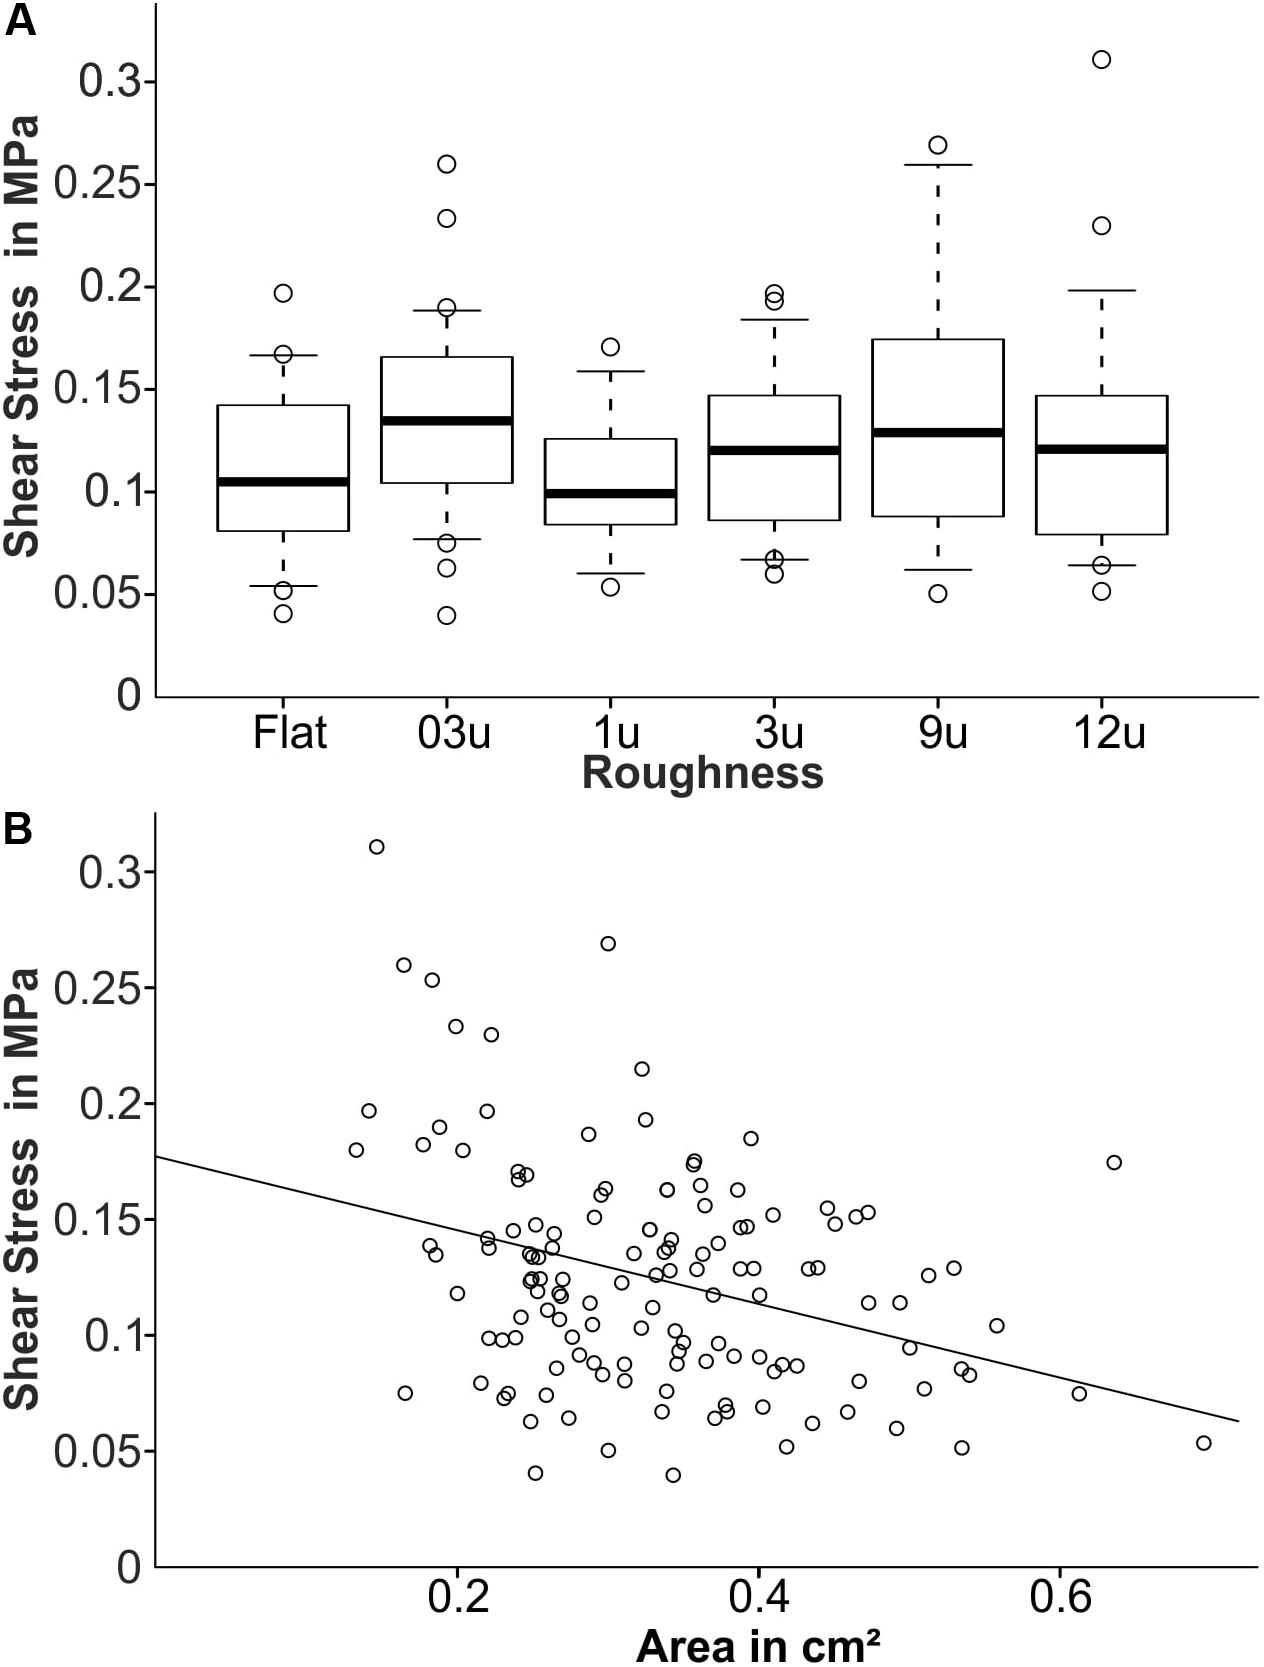
Figure 7. The attachment strength of PVS samples during the field experiment 2. (A) The average shear stress (MPa) for each roughness. (B) The relationship between measured shear stress and the barnacle basal plate area. The fitting line corresponds to an assumed linear relationship between both shear stress and basal plate size.
Figure 7B shows the pooled shear stress in dependence of the barnacle’s basal plate size. The shear stress ranged between 0.05 and 0.30 MPa. In general, a decrease in shear stress can be observed in barnacles with larger contact area.
Discussion
The Effect of the Substrate Material on Biofouling Dynamics
A 17 weeks long field experiment (2014) was conducted, in order to evaluate the influence of material properties and topography on the biofouling dynamics of barnacles. The cumulative barnacle densities of all roughness samples pooled into the two materials (epoxy and PVS) showed that there is no significant difference with respect to material (Figure 4, dashed lines). Both materials show a nearly identical cumulative barnacle density after 17 weeks (epoxy: 0.74 barnacles per cm2, PVS: 0.76 barnacles per cm2) At first glance, this result may contradict previous studies, because it has been stated several times that both materials may have different initial settlement rates possibly due to the influence of SFE and elastic moduli on the settlement behavior of cyprid larvae (Dahlström et al., 2004; Wendt et al., 2006; Kim et al., 2007). Most likely, roughness might have had an overriding effect over SFE and stiffness under natural conditions. This circumstance may be the reason why both materials showed a similar growth progression despite a potential fouling retention of the material. The flat control samples made from epoxy resin showed higher cumulative fouling densities than the ones made from PVS, which may indicate an influence of material on initial settlement under natural conditions.
The difference between results from the present study compared to previous ones may also originate from the temporal resolution or duration of the experiment used during evaluation as well as the fouling quantification method (e.g., Chabot and Bourget, 1988; Hills and Thomason, 1998; Berntsson et al., 2004). If actual barnacle densities had been monitored for example only every 8 weeks during our field experiment, the data evaluation would have led to other conclusions and a difference in fouling retention between the materials would have been assumed! It may be beneficial to use a high temporal resolution of at least one week during the evaluation of material related effects on the attachment strength of adult barnacles. Marine biofouling on its own is a highly dynamic process and possible interactions with the tested material parameters can be already present at early stages. It seems beneficial to evaluate material related effects based on cumulative densities of barnacles and not on actual barnacle densities, if materials with known fouling release abilities like silicones are used (Lejars et al., 2012). The incorporation of data on all fallen off barnacles to the ones still attached to the surfaces allows for a better picture on initial settlement in the first weeks and a more efficient description of biofouling dynamics of adult barnacles. It is important to note, that this field experiment does not exclude the presence of effects due to different SFE and elastic modulus on the settlement behavior on cyprids under natural conditions because no rejection rates were monitored directly. Also, silicones are known to leach compounds that alter the enzyme activity during curing of the barnacle adhesive (Rittschof et al., 2011). This leaching may have also affected the results presented in this study.
The Role of the Substrate Roughness on the Biofouling Dynamics
The roughness range which was tested during the field experiment showed am influence on initial settlement of B. improvisus. During the first 6 weeks of immersion, differences between the tested roughness samples were visible on both materials (Figures 3A,B). Similar patterns with respect to fouling dynamics could be observed between the two materials in relation to roughness (accumulated data, Figures 1C,D). However, the observed effect of roughness was smaller as we would have expected. A positive relationship between fouling accumulation and topography was observed for several barnacle species in earlier studies including Balanus crenatus (Hudon et al., 1983), Semibalanus balanoides (Hills and Thomason, 1998), Chthamalus fragilis (Wethey, 1986), Chthamalus anisopoma (Raimondi, 1988), Elminius modestus (Crisp and Barnes, 1954). Also in some more recent studies performed with Balanus improvisus (Berntsson et al., 2000a, 2004) and B. amphritite (Schumacher et al., 2007; Aldred et al., 2010) an influence of roughness on fouling dynamics has been documented. Although the roughness samples differ between these studies, similar height ranges were present that allow for coarse a comparison. Berntsson et al. (2000b) observed the highest initial fouling settlement on smooth samples for B. improvisus both under natural and laboratory conditions. Roughness ranging in the similar range to the one found on samples with roughnesses of 9 and 12 μm, on the other hand, showed a significant reduction in initial fouling settlement. These observations can be confirmed by the results obtained from this study but the effect was smaller. It is important to note that only a small roughness range was tested in this study. Coarser surfaces are known to decrease the initial settlement even more.
From a contact mechanics point of view, settlement preference for smooth surfaces would not be advantageous, if it is assumed that maximizing the attachment strength is the key factor in the decision making of cyprid larvae prior to metamorphosis (Aldred et al., 2010). The maximum attachment force would be much higher on a coarser surface due to a increased contact area and an additional effect of mechanical interlocking between the cured adhesive and the corresponding surface. It could be argued that roughness interferes in building up an intimate contact to the corresponding surface, although this seems unlikely at the feature sizes of the tested samples, because adult barnacles (B. improvisus) are able to embed even micropillars with a height of 50 μm in their glue (Petersen et al., 2018). Aldred et al. (2010) observed under laboratory conditions that settlement preference of cyprid larvae (B. amphritite) correlated inversely with removal rates during water jetting or positively with the potential attachment strength on the corresponding surface. Interestingly, they discovered increased attachment strengths at substrates with feature sizes similar to the samples with a roughness of 9 and 12 μm, but could not explain why. Important to note is that the initial settlement was not greater on these roughness samples during the field experiment in this study (Figures 3A,B) and that the average attachment force of adult barnacles was also not remarkably higher (Figure 6A).
No combinatorial effects between material and roughness were revealed in our field experiment, if cumulative barnacle densities were considered for evaluation (Figure 5, filled dots). In all difference plots, except for samples with a roughness of 1 μm, the cumulative barnacle densities are close to equilibrium between epoxy and PVS. The strong disparity between epoxy and PVS on the samples with a roughness of 1 μm is due to one PVS sample being completely overgrown by barnacles. There is no clear explanation, why only this one sample has shown such a different fouling dynamic compared to all other samples, but it is known that barnacles tend to grow in a gregarious manner due to their sessile living style (Knight-Jones, 1953; Crisp, 1974; Le Tourneux and Bourget, 1988). This particular sample showed a much higher actual barnacle densities in the first 5 weeks compared to all other samples. So, it may have become more appealing for other barnacles to settle on.
Roughness-Dependent Fouling Release Ability of PVS Samples
If actual barnacle densities were used for calculating the difference plots (Figure 5, open dots), epoxy samples displayed higher barnacle densities compared to PVS samples after 6 weeks, which can be explained by the beginning detachment of barnacles known for silicone-based materials (Figure 4; Lejars et al., 2012). However, for samples with a roughness of 9 μm, the difference in the actual barnacle density between epoxy and PVS remained mostly stable throughout the entire field experiment indicating the presence of a deterioration in the detachment. This deterioration in the detachment can be rediscovered in the two times longer average attachment duration on samples with a roughness of 9 μm compared to the other samples (Figures 6A,B) and the lowest release-to-settlement ratio (r/s) (Figure 6C). Interestingly, there is no higher initial settlement on 9 μm despite the higher average attachment duration and low r/s.
Another useful parameter, to characterize the fouling release ability of a surface, is the r/s ratio (Petersen et al., 2018). It appears to correlate inversely with the attachment duration (Figures 6A,B) and allows for a more detailed quantification of the fouling release ability than the sole usage of the actual barnacle densities. The results obtained shed light on the interaction between roughness and adult barnacle adhesion. Samples with a roughness of 12 μm showed a lower r/s ratio (0.55) than the smooth surface and 0.3, 1, and 3 μm (0.73 in average). However, r/s ratios of all these samples were remarkably higher than that on 9 μm (0.35). This result was unexpected, because the real contact area and resulting mechanical interlocking should be higher on 12 μm than on 9 μm, if intimate contact is granted. Additional unknown factors apart from roughness and material (e.g., curing behavior of the adhesive) seem to play important roles in adult barnacle adhesion under natural conditions which need further investigation in the future.
The Effect of the Substrate Roughness on the Attachment Strength of B. improvisus
Force measurements were performed during the course of a second field experiment with identical samples to gain more insight into the factors that influence attachment strength of adult barnacles under natural conditions. The first main result was that the average shear stress (0.10–0.14 MPa) is very similar between all roughness samples (Figure 7A) and the obtained values go in line with results from other studies that have performed force measurements on other flat silicone substrates (e.g., Swain and Schultz, 1996; Wendt et al., 2006; Beigbeder et al., 2008; Martinelli et al., 2012). However, this actual non-existing influence of roughness on the shear stress was unexpected, because an increase in real contact area due to roughness should also increase maximum shear stress given that intimate contact is present. Also the observed deteriorations in the detachment, as well as the monitored differences in attachment durations from the first field experiment support this idea.
Force measurements represent a standard method to evaluate the fouling release performance of materials (Swain et al., 1992, 1998) and are normally combined with static field trials. Here, force measurements were performed after the samples had been exposed to the marine environment for 10 weeks. It is very likely that barnacles with lower shear stress values had already been detached prior to the force measurements. This may have caused a bias in the force measurements, because only barnacles with sufficiently high attachment strength are measured. This “preselection” could lead to false statements with respect to attachment strength of adult barnacles on the corresponding surface or treatment. Also it would not provide any detailed information about the real fouling release properties, if attachment strength is used alone and is not put in context with other data. Parameters such as attachment duration and r/s ratio, on the other hand, are very effective in describing fouling release properties of materials under natural conditions, because they consider the highly dynamic nature of biofouling. Force measurements, in turn, represent rather a snapshot of the current fouling state. This does not mean that force measurements should be excluded during evaluation, but the results should be treated with caution and always put into perspective with static field experiments. Another surprising outcome of the force measurements was that shear stress of adult barnacles appears to decrease with their size/area (Figure 7B), because previously Berglin et al. (2001) have not observed such a relationship between barnacle size and detachment stress during vertical measurements. The decrease in shear stress can be explained by a possible decrease in real contact area. The larger the barnacle grows in size the more likely becomes the incorporation of defects within the contact area (failures during curing of the cement, presence of dirt or water at the interface). Such an accumulation of defects may facilitate detachment at lower shear stresses. This effect has been previously shown for artificial adhesive systems (Carbone et al., 2011).
Important to note is that the silicone samples used in the second field experiment performed in 2017 were produced in 2014. The aging of the silicone samples may have influenced the resulting shear stresses. However, all samples were stored under the same conditions so that the effect of aging should be similar across all sample types. Another potential influence that could have affected the shear stress values are possible genetic variations between the barnacle populations from 2014 and 2017. Holm et al. (2005, 2009) have shown that genetics may play a role in the development of a thick adhesive plaque on silicones, which is known to reduce barnacle attachment strength (Berglin and Gatenholm, 2003; Wiegemann and Watermann, 2003). It could be possible that the percentage of barnacles that tend to produce thick adhesive plaques was different between both years. Therefore, the results of the force measurement should be treated with caution. Additional force measurements are necessary to rule these above mentioned factors out in order to properly validate the influence of roughness on the attachment strength of B. improvisus.
Conclusion
No strong influence of stiffness and surface energy on initial settlement of B. improvisus was observed under natural conditions carried out in the Baltic Sea, Kiel, Germany. Cumulative barnacle densities showed a strong linear correlation between PVS and epoxy with respect to fouling dynamics in the course of 17 weeks. The tested roughness samples had a significant influence on actual barnacle densities. No combinatorial effects between material and roughness were observed with regard to the biofouling dynamics. The parameters (1) attachment duration and (2) release-to-settlement ratio (r/s) are additional evaluation tools that can be used to describe the fouling release properties of a surface in more detail. The parameters consider the dynamic nature of the fouling process. Both average attachment duration and r/s indicate deterioration in the detachment of barnacles on samples with a roughness of 9 μm. Force measurements showed no strong differences in average shear stress (0.05–0.30 MPa) across all roughness samples. However, with an increasing basal plate size, the measured shear stress tended to decrease. This work is an important step toward a better understanding of the influence of different substrate parameters on underwater attachment of adult barnacles and provides additional methods for the evaluation of biofouling dynamics under natural conditions.
Data Availability Statement
The raw data supporting the conclusions of this article will be made available by the authors, without undue reservation, to any qualified researcher.
Author Contributions
SG, DP, and LH designed the study. DP performed the experiments and wrote the initial draft. DP and LH analyzed the data. SG and LH approved the submitted manuscript. All authors contributed to the article and approved the submitted version.
Conflict of Interest
The authors declare that the research was conducted in the absence of any commercial or financial relationships that could be construed as a potential conflict of interest.
Acknowledgments
We thank J. Ösert (Kiel University) for his technical support during the entire project. We thank Cathelco R&D Centre GmbH, Kiel, Germany, for technical support during the field experiment. We acknowledge financial support by DFG within the funding programme Open Access Publizieren.
References
Ahmed, N., Murosaki, T., Kakugo, A., Kurokawa, T., Gong, J. P., and Nogata, Y. (2011). Long-term in situ observation of barnacle growth on soft substrates with different elasticity and wettability. Soft Matter 7, 7281–7290.
Ahmed, N., Murosaki, T., Kurokawa, T., Kakugo, A., Yashima, S., Nogata, Y., et al. (2014). Prolonged morphometric study of barnacles grown on soft substrata of hydrogels and elastomers. Biofouling 30, 271–279. doi: 10.1080/08927014.2013.863280
Aldred, N., Scardino, A., Cavaco, A., de Nys, R., and Clare, A. S. (2010). Attachment strength is a key factor in the selection of surfaces by barnacle cyprids (Balanus amphitrite) during settlement. Biofouling 26, 287–299. doi: 10.1080/08927010903511626
Anderson, D. T. (1993). Barnacles: Structure, Function, Development and Evolution. Heidelberg: Springer Science and Business Media.
Beigbeder, A., Degee, P., Conlan, S. L., Mutton, R. J., Clare, A. S., Pettitt, M. E., et al. (2008). Preparation and characterisation of silicone-based coatings filled with carbon nanotubes and natural sepiolite and their application as marine fouling-release coatings. Biofouling 24, 291–302. doi: 10.1080/08927010802162885
Berglin, M., and Gatenholm, P. (2003). The barnacle adhesive plaque: morphological and chemical differences as a response to substrate properties. Colloids Surf. B 28, 107–117. doi: 10.1016/s0927-7765(02)00149-2
Berglin, M., Larsson, A., Jonsson, P. R., and Gatenholm, P. (2001). The adhesion of the barnacle, Balanus improvisus, to poly (dimethylsiloxane) fouling-release coatings and poly (methyl methacrylate) panels: the effect of barnacle size on strength and failure mode. J. Adhes. Sci. Technol. 15, 1485–1502. doi: 10.1163/156856101753213321
Berntsson, K. M., Andreasson, H., Jonsson, P. R., Larsson, L., Ring, K., Petronis, S., et al. (2000a). Reduction of barnacle recruitment on micro−textured surfaces: analysis of effective topographic characteristics and evaluation of skin friction. Biofouling 16, 245–261. doi: 10.1080/08927010009378449
Berntsson, K. M., Jonsson, P. R., Larsson, A. I., and Holdt, S. (2004). Rejection of unsuitable substrata as a potential driver of aggregated settlement in the barnacle Balanus improvisus. Mar. Ecol. Prog. Ser. 275, 199–210. doi: 10.3354/meps275199
Berntsson, K. M., Jonsson, P. R., Lejhall, M., and Gatenholm, P. (2000b). Analysis of behavioural rejection of micro-textured surfaces and implications for recruitment by the barnacle Balanus improvisus. J. Exp. Mar. Biol. Ecol. 251, 59–83. doi: 10.1016/s0022-0981(00)00210-0
Brady, R. F., and Singer, I. L. (2000). Mechanical factors favoring release from fouling release coatings. Biofouling 15, 73–81. doi: 10.1080/08927010009386299
Briand, J. F. (2009). Marine antifouling laboratory bioexperiments: an overview of their diversity. Biofouling 25, 297–311.
Burden, D. K., Barlow, D. E., Spillmann, C. M., Orihuela, B., Rittschof, D., Everett, R. K., et al. (2012). Barnacle Balanus amphitrite adheres by a stepwise cementing process. Langmuir 28, 13364–13372. doi: 10.1021/la301695m
Burden, D. K., Spillmann, C. M., Everett, R. K., Barlow, D. E., Orihuela, B., Deschamps, J. R., et al. (2014). Growth and development of the barnacle Amphibalanus amphitrite: time and spatially resolved structure and chemistry of the base plate. Biofouling 30, 799–812. doi: 10.1080/08927014.2014.930736
Carbone, G., Pierro, E., and Gorb, S. N. (2011). Origin of the superior adhesive performance of mushroom-shaped microstructured surfaces. Soft Matter 7, 5545–5552.
Chabot, R., and Bourget, E. (1988). Inflence of substratum heterogeneity and settled barnacle density on the settlement of cypris larvae. Mar. Biol. 97, 45–56. doi: 10.1007/bf00391244
Crisp, D. J. (1955). The behaviour of barnacle cyprids in relation to water movement over a surface. J. Exp. Biol. 32, 569–590.
Crisp, D. J. (1974). “Factors influencing the settlement of marine invertebrate larvae. chemoreception in marine organisms,” in Chemoreception in Marine Organisms, eds P. T. Grant and A. N. Mackie (New York, NY: Academic Press), 177–265.
Crisp, D. J., and Barnes, H. (1954). The orientation and distribution of barnacles at settlement with particular reference to surface contour. J. Anim. Ecol. 23, 142–162.
Dahlström, M., Jonsson, H., Jonsson, P. R., and Elwing, H. (2004). Surface wettability as a determinant in the settlement of the barnacle Balanus improvisus (Darwin). J. Exp. Mar. Biol. Ecol. 305, 223–232. doi: 10.1016/j.jembe.2003.12.013
Di Fino, A., Petrone, L., Aldred, N., Ederth, T., Liedberg, B., and Clare, A. S. (2014). Correlation between surface chemistry and settlement behaviour in barnacle cyprids (Balanus improvisus). Biofouling 30, 143–152. doi: 10.1080/08927014.2013.852541
Dickinson, G. H., Vega, I. E., Wahl, K. J., Orihuela, B., Beyley, V., Rodriguez, E. N., et al. (2009). Barnacle cement: a polymerization model based on evolutionary concepts. J. Exp. Biol. 212, 3499–3510. doi: 10.1242/jeb.029884
Fears, K. P., Orihuela, B., Rittschof, D., and Wahl, K. J. (2018). Acorn barnacles secrete phase−separating fluid to clear surfaces ahead of cement deposition. Adv. Sci. 5:1700762. doi: 10.1002/advs.201700762
Gerhart, D. J., Rittschof, D., Hooper, I. R., Eisenman, K., Meyer, A. E., Baier, R. E., et al. (1992). Rapid and inexpensive quantification of the combined polar components of surface wettability: application to biofouling. Biofouling 5, 251–259. doi: 10.1080/08927019209378246
Gohad, N. V., Aldred, N., Hartshorn, C. M., Lee, Y. J., Cicerone, M. T., Orihuela, B., et al. (2014). Synergistic roles for lipids and proteins in the permanent adhesive of barnacle larvae. Nat. Comm. 5:4414.
Habenicht, G. (2002). “Eigenschaften von Klebungen,” in VDI-Buch, ed. Kleben (Berlin: Springer), 319–439.
Hills, J. M., and Thomason, J. C. (1998). The effect of scales of surface roughness on the settlement of barnacle (Semibalanus balanoides) cyprids. Biofouling 12, 57–69. doi: 10.1080/08927019809378346
Holm, E. R., Cannon, G., Roberts, D., Schmidt, A. R., Sutherland, J. P., and Rittschof, D. (1997). The influence of initial surface chemistry on development of the fouling community at Beaufort, North Carolina. J. Exp. Mar. Biol. Ecol. 215, 189–203. doi: 10.1016/S0022-0981(97)00040-3
Holm, E. R., Kavanagh, C. J., Orihuela, B., and Rittschof, D. (2009). Phenotypic variation for adhesive tenacity in the barnacle Balanus amphitrite. Exp. Mar. Biol. Ecol. 380, 61–67. doi: 10.1016/j.jembe.2009.06.026
Holm, E. R., Orihuela, B., Kavanagh, C. J., and Rittschof, D. (2005). Variation among families for characteristics of the adhesive plaque in the barnacle Balanus amphitrite. Biofouling 21, 121–126. doi: 10.1080/08927010512331344188
Hudon, C., Bourget, E., and Legendre, P. (1983). An integrated study of the factors influencing the choice of the settling site of Balanus crenatus cyprid larvae. Can. J. Fish. Aquat. Sci. 40, 1186–1194. doi: 10.1139/f83-135
Hung, O. S., Thiyagarajan, V., and Qian, P. Y. (2008). Preferential attachment of barnacle larvae to natural multi-species biofilms: does surface wettability matter? J. Exp. Mar. Biol. Ecol. 361, 36–41. doi: 10.1016/j.jembe.2008.04.011
Kamino, K. (2013). Mini-review: barnacle adhesives and adhesion. Biofouling 29, 735–749. doi: 10.1080/08927014.2013.800863
Kamino, K. (2016). “Barnacle underwater attachment,” in Biological Adhesives, 2nd Edn, ed. A. Smith (Heidelberg: Springer Science and Business Media).
Kavanagh, C. J., Quinn, R. D., and Swain, G. W. (2005). Observations of barnacle detachment from silicones using high-speed video. J. Adh. 81, 843–868. doi: 10.1080/00218460500189331
Kim, J., Chisholm, B. J., and Bahr, J. (2007). Adhesion study of silicone coatings: the interaction of thickness, modulus and shear rate on adhesion force. Biofouling 23, 113–120. doi: 10.1080/08927010701189708
Knight-Jones, E. W. (1953). Laboratory experiments on gregariousness during setting in Balanus balanoides and other barnacles. J. Exp. Biol. 30, 584–598.
Lane, J. M. (2005). “Underwater adhesives,” in Handbook of Adhesion, ed. D. E. Packham (Hoboken, NJ: Wiley), 565–570.
Le Tourneux, F., and Bourget, E. (1988). Importance of physical and biological settlement cues used at different spatial scales by the larvae of Semibalanus balanoides. Mar. Biol. 97, 57–66. doi: 10.1007/bf00391245
Lejars, M., Margaillan, A., and Bressy, C. (2012). Fouling release coatings: a nontoxic alternative to biocidal antifouling coatings. Chem. Rev. 112, 4347–4390. doi: 10.1021/cr200350v
Martinelli, E., Sarvothaman, M. K., Galli, G., Pettitt, M. E., Callow, M. E., Callow, J. A., et al. (2012). Poly (dimethyl siloxane) (PDMS) network blends of amphiphilic acrylic copolymers with poly (ethylene glycol)-fluoroalkyl side chains for fouling-release coatings. II. Laboratory experiments and field immersion trials. Biofouling 28, 571–582. doi: 10.1080/08927014.2012.697897
O’Connor, N. J., and Richardson, D. L. (1994). Comparative attachment of barnacle cyprids (Balanus amphitrite Darwin, 1854; B. improvisus Darwin, 1854; & B. ebumeus Gould, 1841) to polystyrene and glass substrata. J. Exp. Mar. Biol. Ecol. 183, 213–225. doi: 10.1016/0022-0981(94)90088-4
Peisker, H., and Gorb, S. N. (2010). Always on the bright side of life: anti-adhesive properties of insect ommatidia grating. J. Exp. Biol. 213, 3457–3462. doi: 10.1242/jeb.043661
Peressadko, A., and Gorb, S. N. (2004). When less is more: experimental evidence for tenacity enhancement by division of contact area. J. Adh. 80, 247–261. doi: 10.1080/00218460490430199
Petersen, D. S., Kleinteich, T., Gorb, S. N., and Heepe, L. (2018). Competing with barnacle cement: wetting resistance of a re-entrant surface reduces underwater adhesion of barnacles. J. R. Soc. Interface 15:20180396. doi: 10.1098/rsif.2018.0396
Petrone, L., Di Fino, A., Aldred, N., Sukkaew, P., Ederth, T., Clare, A. S., et al. (2011). Effects of surface charge and Gibbs surface energy on the settlement behaviour of barnacle cyprids (Balanus amphitrite). Biofouling 27, 1043–1055. doi: 10.1080/08927014.2011.625474
Pitombo, F. B. (2004). Phylogenetic analysis of the balanidae (Cirripedia, Balanomorpha). Zool. Scripta 33, 261–276. doi: 10.1111/j.0300-3256.2004.00145.x
Raimondi, P. T. (1988). Rock type affects settlement, recruitment, and zonation of the barnacle Chthamalus anisopoma Pilsbury. J. Exp. Mar. Biol. Ecol. 123, 253–267. doi: 10.1016/0022-0981(88)90046-9
Ramsay, D. B., Dickinson, G. H., Orihuela, B., Rittschof, D., and Wahl, K. J. (2008). Base plate mechanics of the barnacle Balanus amphitrite (= Amphibalanus amphitrite). Biofouling 24, 109–118. doi: 10.1080/08927010701882112
Rittschof, D., and Costlow, J. D. (1989). Bryozoan and barnacle settlement in relation to initial surface wettability: a comparison of laboratory and field studies. Sci. Mar. 53, 411–416.
Roberts, D., Rittschof, D., Holm, E., and Schmidt, A. R. (1991). Factors influencing initial larval settlement: temporal, spatial and surface molecular components. J. Exp. Mar. Biol. Ecol. 150, 203–221. doi: 10.1016/0022-0981(91)90068-8
Rittschof, D., Orihuela, B., Harder, B., Stafslien, B., Chisholm, B., and Dickinson, G. H. (2011). Compounds from silicones alter enzyme activity in curing barnacle glue and model enzymes. PLoS One 6:e16487. doi: 10.1371/journal.pone.0016487
Salerno, G., Rebora, M., Kovalev, A., Gorb, E. V., and Gorb, S. N. (2018). Contribution of different tarsal attachment devices to the overall attachment ability of the stink bug Nezara viridula. J. Comp. Physiol. A 204, 627–638. doi: 10.1007/s00359-018-1266-0
Saroyan, J. R., Lindner, E., Dooley, C. A., and Bleile, H. R. (1970). Barnacle cement – key to second generation antifouling coatings. Ind. Eng. Chem. Prod. Res. Dev. 9, 122–133. doi: 10.1021/i360034a002
Schultz, M. P., Bendick, J. A., Holm, E. R., and Hertel, W. M. (2011). Economic impact of biofouling on a naval surface ship. Biofouling. 27, 87–98. doi: 10.1080/08927014.2010.542809
Schumacher, J. F., Aldred, N., Callow, M. E., Finlay, J. A., Callow, J. A., Clare, A. S., et al. (2007). Species-specific engineered antifouling topographies: correlations between the settlement of algal zoospores and barnacle cyprids. Biofouling 23, 307–317. doi: 10.1080/08927010701393276
So, C. R., Fears, K. P., Leary, D. H., Scancella, J. M., Wang, Z., Liu, J. L., et al. (2016). Sequence basis of barnacle cement nanostructure is defined by proteins with silk homology. Sci. Rep. 6:36219.
Spurr, A. R. (1969). A low-viscosity epoxy resin embedding medium for electron microscopy. J. Ultrastruct. Res. 26, 31–43. doi: 10.1016/s0022-5320(69)90033-1
Sun, Y., Guo, S., Walker, G. C., Kavanagh, C. J., and Swain, G. W. (2004). Surface elastic modulus of barnacle adhesive and release characteristics from silicone surfaces. Biofouling 20, 279–289. doi: 10.1080/08927010400026383
Swain, G. W., Griffith, J. R., Bultman, J. D., and Vincent, H. L. (1992). The use of barnacle adhesion measurements for the field evaluation of non−toxic foul release surfaces. Biofouling 6, 105–114. doi: 10.1080/08927019209386216
Swain, G. W., Nelson, W. G., and Preedeekanit, S. (1998). The influence of biofouling adhesion and biotic disturbance on the development of fouling communities on non−toxic surfaces. Biofouling 12, 257–269. doi: 10.1080/08927019809378358
Swain, G. W., and Schultz, M. P. (1996). The testing and evaluation of non−toxic antifouling coatings. Biofouling 10, 187–197. doi: 10.1080/08927019609386279
Wahl, M. (1989). Marine epibiosis. I. Fouling and antifouling: some basic aspects. Mar. Ecol. Prog. Ser. 58, 175–189. doi: 10.3354/meps058175
Wendt, D. E., Kowalke, G. L., Kim, J., and Singer, I. L. (2006). Factors that influence elastomeric coating performance: the effect of coating thickness on basal plate morphology, growth and critical removal stress of the barnacle Balanus amphitrite. Biofouling 22, 1–9. doi: 10.1080/08927010500499563
Wenzel, R. N. (1949). Surface roughness and contact angle. J. Phys. Chem. A 53, 1466–1467. doi: 10.1021/j150474a015
Wethey, D. S. (1986). Ranking of settlement cues by barnacle larvae: influence of surface contour. Bull. Mar. Sci. 39, 393–400.
Wiegemann, M., and Watermann, B. (2003). Peculiarities of barnacle adhesive cured on non-stick surfaces. J. Adhes. Sci. Technol. 17, 1957–1977. doi: 10.1163/156856103770572070
Wu, W., Giese, R. F., and van Oss, C. J. (1995). Evaluation of the Lifshitz-van der Waals/acid-base approach to determine surface tension components. Langmuir 11, 379–382. doi: 10.1021/la00001a064
Keywords: adhesion, wettability, roughness barnacle, marine bioadhesives, biofouling
Citation: Petersen DS, Gorb SN and Heepe L (2020) The Influence of Material and Roughness on the Settlement and the Adhesive Strength of the Barnacle Balanus Improvisus in the Baltic Sea. Front. Mar. Sci. 7:664. doi: 10.3389/fmars.2020.00664
Received: 23 March 2020; Accepted: 21 July 2020;
Published: 18 August 2020.
Edited by:
Daniel Rittschof, Duke University, United StatesReviewed by:
Kelli Zargiel Hunsucker, Florida Institute of Technology, United StatesShane Stafslien, North Dakota State University, United States
Copyright © 2020 Petersen, Gorb and Heepe. This is an open-access article distributed under the terms of the Creative Commons Attribution License (CC BY). The use, distribution or reproduction in other forums is permitted, provided the original author(s) and the copyright owner(s) are credited and that the original publication in this journal is cited, in accordance with accepted academic practice. No use, distribution or reproduction is permitted which does not comply with these terms.
*Correspondence: Dennis S. Petersen, ZHBldGVyc2VuQHpvb2xvZ2llLnVuaS1raWVsLmRl