 Nauzet Hernández-Hernández1
 Javier Arístegui1*
 María F. Montero1
 Esther Velasco-Senovilla1
 Federico Baltar2
 Ángeles Marrero-Díaz3
 Antonio Martínez-Marrero1
 Ángel Rodríguez-Santana3
- 1Instituto de Oceanografía y Cambio Global, IOCAG, Universidad de Las Palmas de Gran Canaria, Las Palmas, Spain
- 2Department of Limnology and Bio-Oceanography, University of Vienna, Vienna, Austria
- 3Departamento de Física, Universidad de Las Palmas de Gran Canaria, Las Palmas, Spain
Cyclonic and anticyclonic eddies are common mesoscale features in the flow past the Canary Islands throughout the year. While drifting southward, eddy pairs interact among them but also with upwelling filaments and eddies generated at the coastal jet of the nearby African upwelling system. These interactions force the generation of frontal zones where ageostrophic secondary circulation (ASC) may occur. With the aim of contributing to understand how meso-submesoscale interactions modulate plankton distribution, we carried out an interdisciplinary cruise across a mesoscale eddy field. The sampled region was characterized by the presence of a cyclonic eddy interacting with two anticyclonic eddies and an upwelling filament. High-resolution sampling allowed us to assess the upwelling/downwelling processes associated with eddy pumping and ASC, the injection of nutrients into the euphotic zone, and the subduction of particles related to these processes. The planktonic community, which included heterotrophic bacteria, cyanobacteria-like Prochlorococcus and Synechococcus, pico and nanoautotrophic eukaryotes, and heterotrophic nanoflagellates, showed a heterogeneous distribution in response to meso-submesoscale processes. Redundancy analysis and plankton distribution suggest that while the distribution of small organisms (picoplankton) is modulated by a combination of physical and biogeochemical drivers, the distribution of larger autotrophic and heterotrophic nanoflagellates is modulated by nutrient inputs and grazing, respectively. These observational results provide new insights in the study of the impact of mesoscale structures in the dynamics of nutrients, chlorophyll and planktonic communities, and valuable to validate theoretical and modeling studies.
Introduction
Mesoscale eddies may originate nearly everywhere in the World Ocean (Chelton et al., 2007, 2011), being one of the key processes driving nutrient supply into the euphotic zone of the oceans (McGillicuddy et al., 2003; Klein and Lapeyre, 2009), and consequently affecting phytoplankton growth and its distribution at global scale (Mcgillicuddy et al., 2007; Lévy et al., 2018). Several processes, known as the “Oceanic Vertical Pump,” have been proposed as responsible of eddy-related nutrient fluxes (Klein and Lapeyre, 2009). Of particular interest are two mechanisms: “eddy pumping” at the core of the eddies (McGillicuddy, 2016 and reference therein), and frontogenesis, resulting from eddy-eddy interaction (Mahadevan and Tandon, 2006; Capet et al., 2008b; McWilliams, 2016).
Eddy pumping is used to define the upwelling and downwelling generated during eddy intensification. When cyclonic (anticyclonic) eddies intensify, isopycnals are uplifted (depressed) inducing to upwelling (downwelling) at the eddy center, with associated vertical velocities up to 1 m⋅d–1 (Gaube et al., 2014). This may lead to a surface enhancement of chlorophyll in cyclones and a depression and downward transport of chlorophyll in anticyclones (Falkowski et al., 1991; McGillicuddy et al., 1998; Siegel et al., 2008, 2011). On the other hand, eddy-eddy interactions may lead to frontogenesis, resulting in convergent strain fields that will act by destroying the thermal wind balance, establishing an ageostrophic secondary circulation (ASC) in order to restore geostrophy (Mahadevan, 2016; McWilliams, 2016). Vertical velocities originated by frontogenesis may be as high as 100 m⋅d–1 (Mahadevan and Tandon, 2006). Nagai et al. (2008) modeled the distribution of chlorophyll related to frontal ASC predicting a subduction in the cold (cyclonic) side (Fielding et al., 2001; Omand et al., 2015) and chlorophyll enhancement in the warm (anticyclonic) side (Hosegood et al., 2017).
Past studies reporting the effect of the “Oceanic Vertical Pump” over phytoplankton communities point out that the whole phytoplankton community does not respond in the same way against the same stressor (Benitez-Nelson et al., 2007; Nencioli et al., 2008; Bibby and Moore, 2011; Chenillat et al., 2015). Rodriguez et al. (2001) showed that the size structure of the phytoplankton community is controlled by the strength of vertical velocities. Their observations indicate that the relative proportion of large cells increases with the magnitude of the upward velocity. Sangrà et al. (2014) also observed in a not nutrient-limited environment that phytoplankton size spectra strongly correlate with turbulence, being the larger phytoplankton size classes more abundant in high-turbulence environments. In a study along the Kuroshio Front, Clayton et al. (2014) described the complexity of the phytoplankton community structure, shaped by a combination of the large-scale biogeographical variability of the region, mesoscale mixing of populations, and finer scale modification of the light and nutrient environment. However, none of these studies addresses the variability of the phytoplankton community composition at submesoscale levels, in spite of the generally accepted view that processes at small scales govern carbon fluxes in the ocean (Lévy et al., 2001; McGillicuddy, 2016).
With the aim of contributing to understand the impact of meso-submesoscale processes over plankton communities, we conducted an interdisciplinary survey across a highly variable mesoscale field south of Gran Canaria Island (Canary Island). The main goal of the study was to understand how physical and biological factors, resolved at a resolution close to submesoscale (∼1 km) could affect the distribution of pico- and nanoplankton, the main components of planktonic communities in the Canary Islands waters (Arístegui et al., 2004). This region spans the coastal transition zone between the rich eutrophic waters of the NW Africa upwelling system and the poor oligotrophic waters of the North Atlantic Subtropical Gyre (Arístegui et al., 2009). It is almost unique in terms of the high mesoscale and submesoscale variability resulting both from the topographic perturbation of the prevailing winds and currents by the islands of the archipelago and from baroclinic instabilities developed along the offshore boundary region of the NW African coastal upwelling system. Mesoscale eddies are continuously shed downstream off the islands (Arístegui et al., 1994, 1997; Piedeleu et al., 2009; Barceló-Llull et al., 2017a), being the origin of the main pathway of long-lived eddies of the northeast subtropical Atlantic, coined as the “Canary Eddy Corridor” by Sangrà et al. (2009). On the other hand, upwelling filaments and eddies, resulting from instabilities along the coastal upwelling jet, may exchange chemical and biological properties between the shelf waters and the open ocean, contributing largely to the coastal-ocean export of organic matter (García-Muñoz et al., 2004, 2005; Pelegrí et al., 2005; Álvarez-Salgado et al., 2007; Santana-Falcón et al., 2017). Eventually, upwelling filaments may interact with island-generated eddies, leading to a complex hydrographic environment that shapes the distribution and activity of planktonic communities (Barton et al., 2004; Arístegui and Montero, 2005; Sangrà et al., 2005). The almost permanent occurrence of several kind of meso-submesoscale features, as well as the interaction among them, makes the Canary region a perfect natural oceanographic laboratory to study the coupling between physical and biogeochemical processes.
Materials and Methods
Sampling and Hydrographic Data
The data for this study were collected during the cruise “RODA I” (August 11, 2006 through September 7, 2006) on board of the BIO Hespérides. In order to map the hydrographic field to search for mesoscale features (Figure 1a), a 70 × 80-nm grid was first surveyed downstream of Gran Canaria (August 11–14), by means of 62 expendable bathythermographers (XBTs) casts down to 1,000 m (Figure 1b). After locating the eddies’ emplacement, a high-resolution physical biogeochemical section was sampled (August 14–16) crossing a cyclonic eddy interacting with two anticyclonic eddies and an upwelling filament. The section consisted in 20 stations (named 64–83) separated 4 nautical miles from each other (Figure 1b).
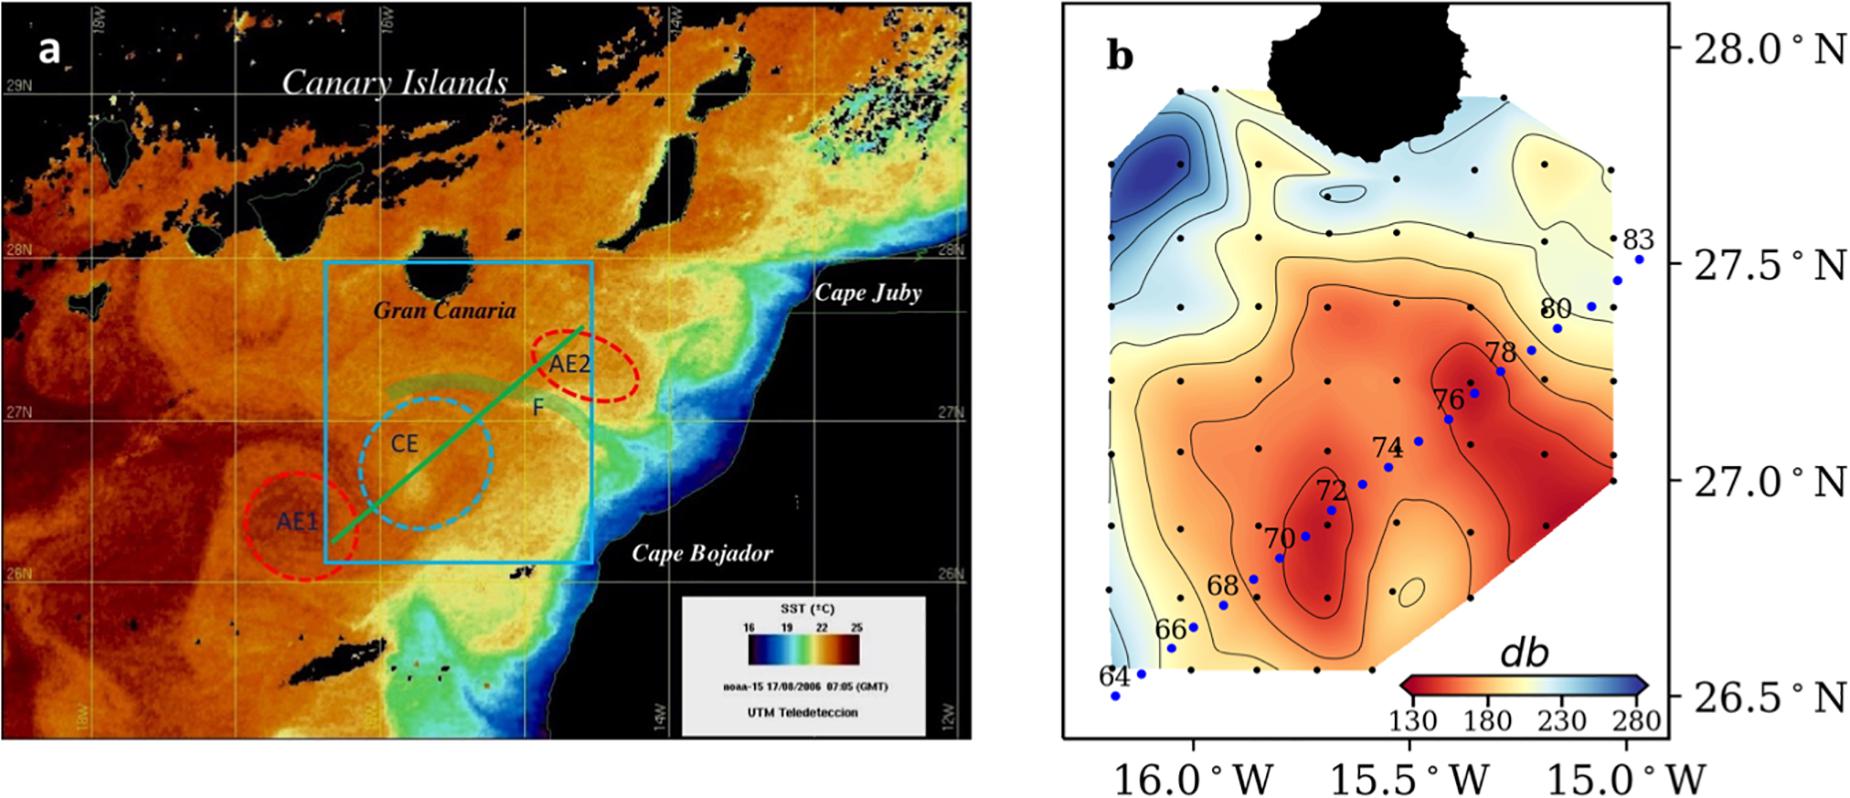
Figure 1. (a) Sea surface temperature (SST) image from NOAA-15 for 15 August 2006. Study area (blue box), showing mesoscale and submesoscale features sampled during the cruise: upwelling filament (F), cyclonic eddy (CE) and anticyclonic eddies (AE1 and AE2). (b) Topography of the 16°C isotherm obtained from the XBT grid. Black dots indicate XBT stations; blue dots indicate CTD stations along the studied section. Labels are only included in the even stations.
At each station, hydrographic casts were performed down to 1,000 m using a SeaBird 911 Plus CTD system mounted on a General Oceanics rosette sampler equipped with 24 Niskin bottles of 12 L. A Wet Lab ECO-AFL/FL fluorescence sensor and a Sea Tech transmissometer were additionally equipped in the rosette and connected to the CTD probe. All CTD sensors were previously calibrated in the factory. Chlorophyll a (Chl a) was also inferred from the fluorescence sensor calibrated with chlorophyll reference patterns in the factory. Water samples were collected for inorganic nutrients and planktonic organisms at 5, 25, 50, 75, 100, 150, and 200 m, plus an additional sample at the depth of the deep chlorophyll maximum (DCM).
The geostrophic velocity (Vg) field, relative to 1,000 dbar, was estimated from potential temperature (Tθ) and practical salinity (S). Potential temperature anomaly (ΔTθ) was calculated using as reference values the Tθ profile at station 83 (outside eddy AE2), and then subtracted from each of the temperature profiles. The mixed layer depth (MLD) was inferred by means of the de Boyer Montégut et al. (2004) approximation.
Inorganic Nutrients
Triplicate samples for nitrate and nitrite determination were poured directly from the Niskin bottles into 15-mL polyethylene tubes (Van Waters and Rogers Co., VWR) and preserved frozen at –20°C until their analysis. Nitrate + nitrite (NOx) were colorimetrically measured using a Bran + Luebbe Autoanalyzer AA3 model following the Hansen and Grasshoff (1983) protocol for automated seawater nutrients analysis. Detection limit for NOx was 0.02 μM. Instrument precision (0.008 μM for NOx) was calculated from the standard deviation of replicate samples.
Cell Abundance and Biomass Conversion
Picoplankton (0.2–2 μm) was enumerated by flow cytometry (Becton–Dickinson FACScalibur with 488 nm argon ion laser). Duplicate samples were collected in sterile cryovials (2 mL), immediately fixed with paraformaldehyde (2% final concentration), refrigerated at 4°C for half an hour, and quickly frozen in liquid nitrogen (–196°C) until their analysis on board. For the enumeration of total heterotrophic bacterioplankton (HB; which includes also Archaea), as well as the proportion of high DNA (HNA) and low DNA (LNA) bacteria (Gasol et al., 1999), the samples were stained with SYTO-13 (Molecular Probes Inc.), using a dilution of the stock solution (1:10) to a final concentration of 2.5 μM; and their signature was identified in a plot of side scatter vs. green fluorescence. The identification and enumeration of autotrophic picoplankton – the cyanobacteria Prochlorococcus (Pro) and Synechococcus (Syn), and picoeukaryotes (PEuk) – in unstained samples was based on the analysis of multiple bivariate scatter plots of side scatter, and red and orange fluorescence. The analyses were run at low speed for the HB and at medium or high speed for the autotrophic picoplankton, until 10,000 events were acquired. A suspension of yellow-green 1 μm latex beads (105 and 106 mL beads mL–1 for autotrophs and bacterioplankton, respectively) was added as an internal standard (Polyscience Inc.). The flow rate was determined volumetrically after every 10 samples run.
Autotrophic (NEuk) and heterotrophic (HNF) nanoplankton (2–20 μm) were analyzed by epifluorescence with an inverted microscope (ZEISS AXIOVERT 35) with 1000× resolution. Samples (100 ml) were preserved with glutaraldehyde (1% final concentration) and stored under cold (4°C) and dark conditions during few days. Subsamples (45 ml) were then filtered through 0.6-μm black polycarbonate filters and stained with DAPI (4,6-diamidino-2-phenylindole; Porter and Feig, 1980) at a final concentration of 5 μg⋅L–1 (Sieracki and Johnson, 1985). To differentiate between HNF and NEuk, the samples were analyzed under UV, green, and blue light filters. The enumeration included at least 100 cells of each group per sample.
Plankton abundances were transformed to biomass following the conversion factors obtained by Montero et al. (unpublished) for coastal and oceanic waters of the Canary Islands region. To estimate picoplankton cell biovolumes, more than 60 experiments of sequential filtration (through seven polycarbonate filters from 0.2 to 3 μm) were performed, with water from the surface and the deep chlorophyll maximum around Gran Canaria. Average biovolumes from cell counts obtained by flow cytometry were calculated from sigmoidal fits assuming a spherical shape. For nanoplankton, 140 samples were counted and measured by epifluorescence microscopy from three size classes (2–6, 6–11, and 11–20 μm). Average biovolumes were derived from mathematical equations, according to the shape of the cell. The following conversion factors were applied: 18 fg C⋅cell–1 for HB, 43 fg C⋅cell–1 for Pro, 120 fg C⋅cell–1 for Syn, 500 fg C⋅cell–1 for PEuk, and 3,100 fg C⋅cell–1 for average NEuk and HNF.
Data Analysis
In order to elucidate the influence of the physical and biogeochemical variables (Vg, Tθ, MLD, NO3, and HNF; environmental variables hereafter) on the distribution of the planktonic groups (Pro, Syn, PEuk, NEuk, HB, and HNF), a correlation analysis was performance following Legendre and Legendre (2012). Note that HNF is included in both environmental variables and planktonic groups since grazing by HNF may modulate other planktonic groups distribution. For statistical analysis, all plankton biomasses and nutrient concentrations were depth-integrated from 0 to 200 m at every station (Tables 1, 2). Since both Tθ and Vg are not accumulative magnitudes, they were depth-averaged instead (Table 2). To select the suitable correlation analysis, data gradient linearity was first tested by means of a detrended correspondence analysis (DCA). Since all DCA values were below 3 (in fact, <0.4), which indicates linear gradient of the data set, a distance-based redundancy analysis (db-RDA) was computed. Plankton data matrix was transformed using the Hellinger’s method, while environmental variables remained untransformed. Absence of multicollinearity was inferred by means of variance inflation factors. Monte Carlo permutation significance test was conducted to obtain the pv-alue and the adjusted correlation coefficient (R) was calculated. RDA results were graphically represented in non-scaled correlation triplots. All statistical analyses were conducted in R software using vegan package1.
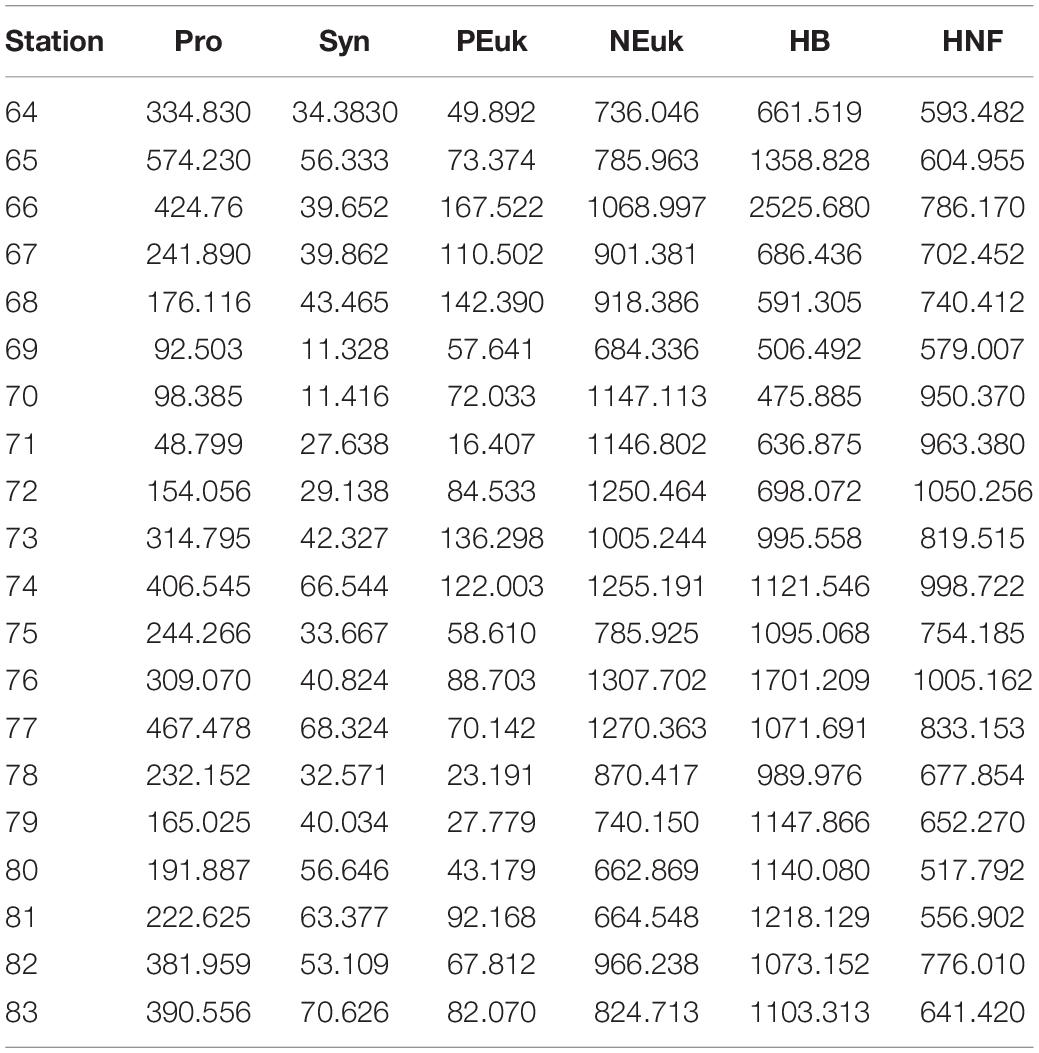
Table 1. Integrated (0–200 m) biomass concentrations (μg C⋅m–2; ×103) for Prochlorococcus (Pro), Synechococcus (Syn), picoeukaryotes (PEuk), nanoeukaryotes (NEuk), heterotrophic bacteria (HB), and heterotrophic nanoeukaryotes (HNF) at every station.
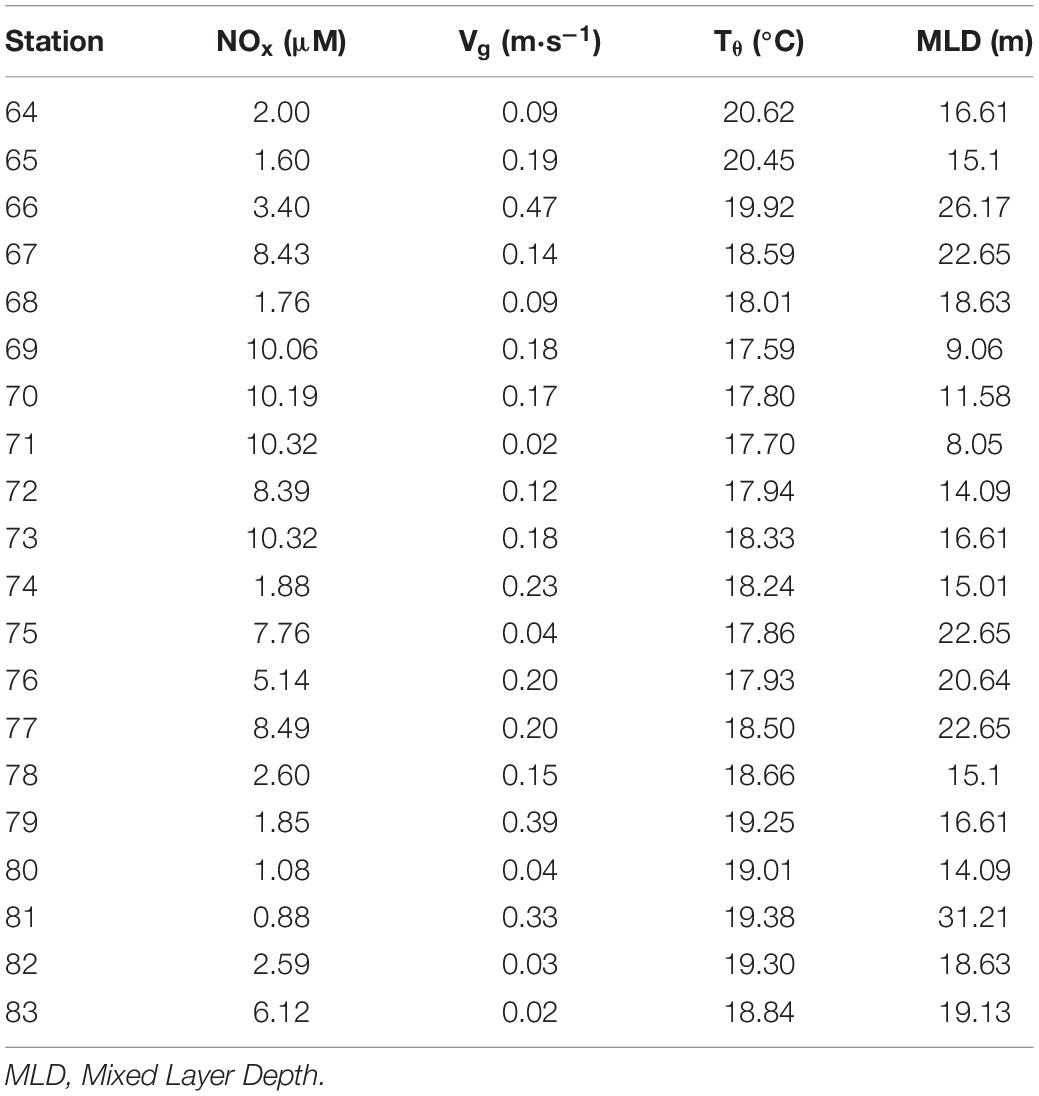
Table 2. Integrated (0–200 m) and averaged values for nitrate + nitrite (NOx), and average values for across-section geostrophic velocities (Vg) and potential temperature (Tθ) at every station.
Results
Signature of Meso-Submesoscale Features in the Hydrographic Field
Figure 1a shows a satellite image of sea surface temperature (SST) at the time of the study, where the eddy field south of the Canary Islands and several offshore filaments stretching from the NW African upwelling region are observed. Four different mesoscale-submesoscale features were sampled during our cruise (blue box in Figure 1a): A cyclonic eddy (CE) in the center of the box, the margins of two anticyclonic eddies (AE1, AE2) at the southwest and northeast position of the CE, respectively, and the offshore extension of an upwelling filament (F) between CE and AE2. Figure 1b represents the 16°C isotherm topography as obtained from the XBT grid, and shows the position of the high-resolution biogeochemical section (stations 64–83) crossing all the mentioned features, with the isotherms’ topography in AE1 being deeper than in AE2. In Figure 2, the CE is clearly identified by the doming of isotherms and isopycnals at stations 67–75, being the eddy center located at station 70. Although the XBT grid did not cover the whole extension of the two AE, the downwelling of surface warm and high salinity water at stations 64–67 and 81–83, as well as other signatures (see below), indicate the presence of AE1 and AE2, respectively.
Figure 2. Vertical sections of potential temperature (Tθ) in°C (A), potential density (σθ) in kg⋅m–3 (B), and practical salinity (S) (C). Inverted red triangles on the top axis indicate stations position. The locations of the anticyclonic eddies (AE), the cyclonic eddy (CE), and the filament (F) are also indicated on the top axis. The bold black line shows the depth of the mixed layer (MLD).
The representation of the potential temperature anomaly (ΔTθ) shows that the CE introduces colder waters (about –4°C) in the upper layers (Figure 3A). The CE radius, as calculated from the vertical anomaly section, is about 40 km, which is of the order of the climatological first baroclinic radius of deformation (Rd) for the region (Chelton et al., 1998), being thus a mesoscale structure. At the northern part of the section, the 21–23°C isotherms define a bowl-shape structure centered at station 81 (Figure 2A), introducing positive ΔTθ of about +2°C (Figure 3A). This relatively shallow warm core structure is associated with the above-mentioned submesoscale anticyclonic eddy (AE2) of 20-km radius. Between the CE and AE2, the offshore branch of an upwelling filament is observed centered at station 77. The width of the filament is about 20 km, well below the Rd, being thus a submesoscale structure. Finally, at the southern end of the section, there is a strong frontal region between station 65 and 68 resulting from the interaction of the CE with AE1, as observed in the SST field (Figure 1a), with a positive ΔTθ of about +3–4°C in the 50–100-m depth range (Figure 3A). The width of this frontal structure is about 35 km, well below Rd, being also a submesoscale structure. AE1 shows signatures of an intrathermocline eddy, characterized by a biconvex shape of the isopycnals and by a homogeneous layer of subtropical mode water embedded within (36.9 psu in 64–69 stations, Figure 2B) similar to the PUMP eddy described by Barceló-Llull et al. (2017a) in the same region. Along the south-north (left-right) section (Figure 3B) the frontal region between AE1 and CE (stations 65 and 68) originates a strong jet, with south-eastward Vg of up to 1 m⋅s–1. The subsurface maximum of the velocity field can be associated with the biconvex shape of the isopycnals in AE1. The estimated Rossby number (Ro) for this feature is 0.48, which represents a typical value for submesoscale processes (Mahadevan, 2016). On the other hand, relatively high positive and negative Vg regions are found at the boundaries of AE2, between stations 79 and 80 and 81 and 82, respectively; both reaching values up to 0.5 m⋅s–1.
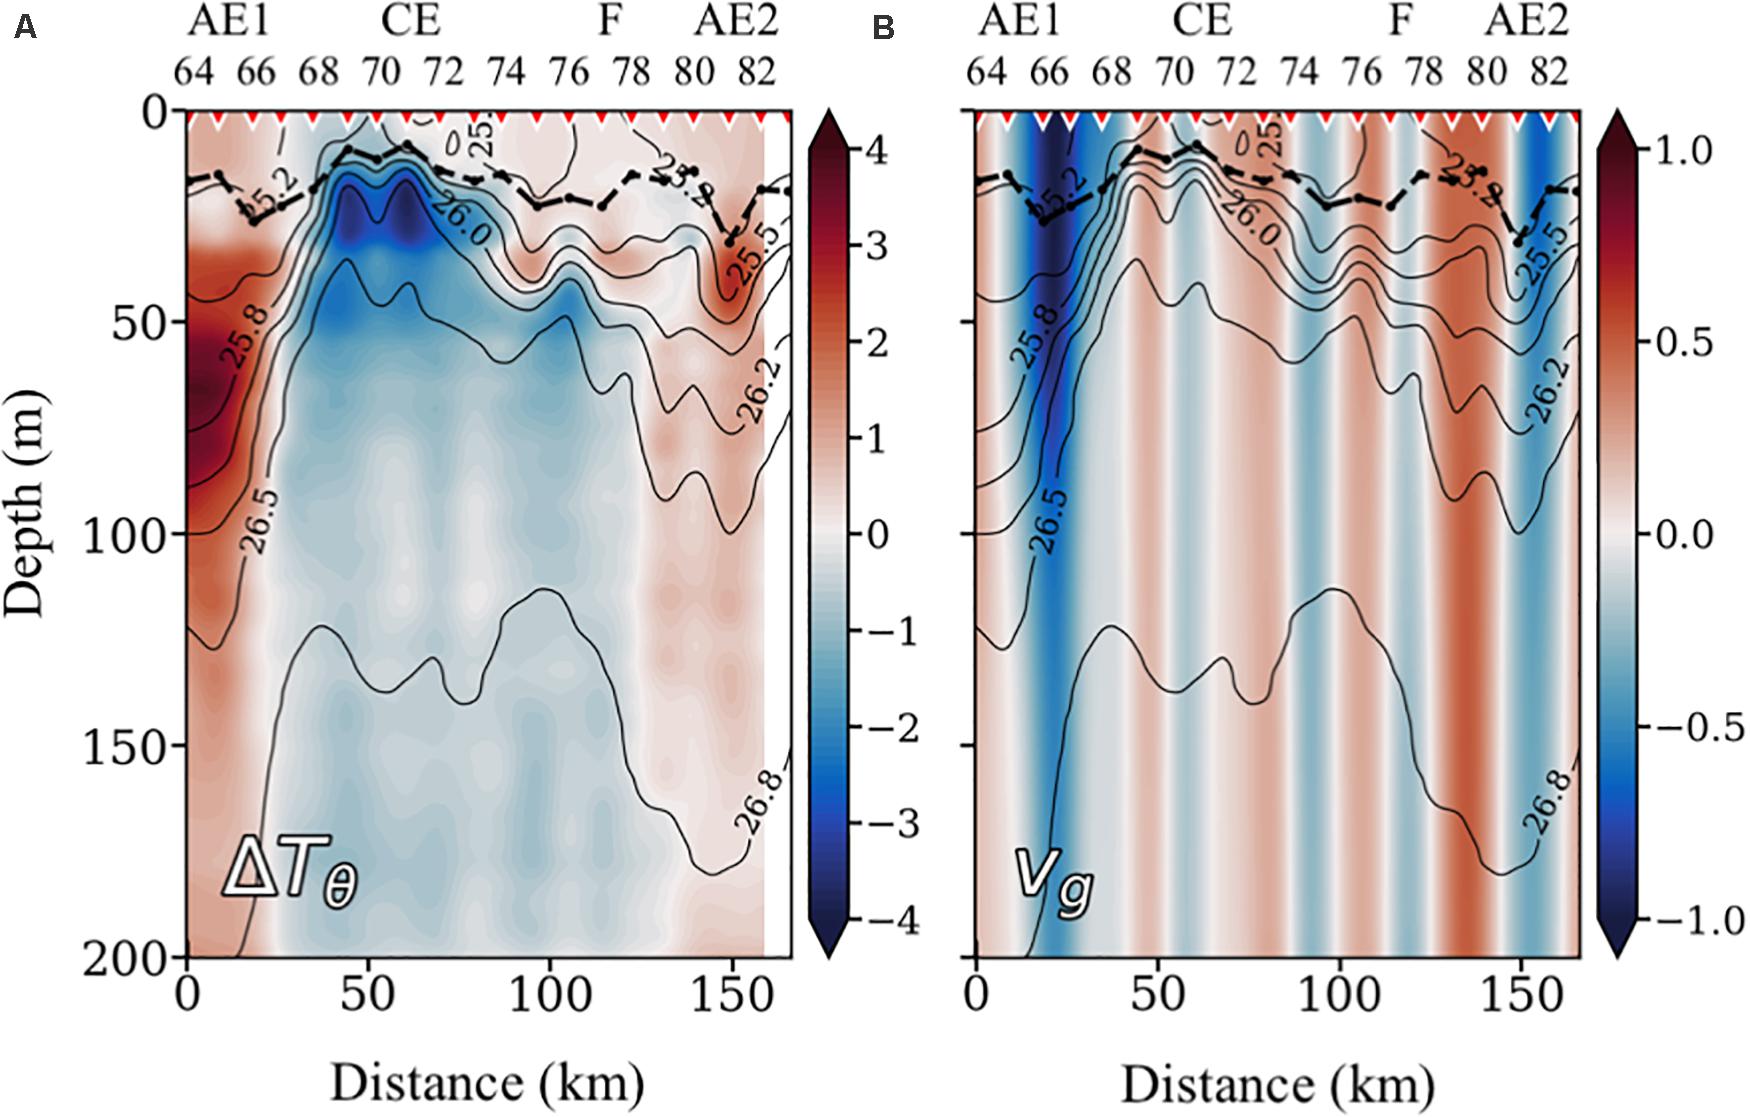
Figure 3. Vertical sections of potential temperature anomaly (ΔTθ) in°C (A) and across section geostrophic velocity (Vg), relative to 1,000 dbar, in m⋅s–1 (B), both with the isopycnals superimposed. Inverted red triangles on the top axis indicate stations position. The locations of the anticyclonic eddies (AE), the cyclonic eddy (CE), and the filament (F) are also indicated on the top axis. The bold black line shows the depth of the mixed layer (MLD). In the Vg plot, positive values indicate north-westward currents, while negative values indicate south-eastward currents.
Biogeochemistry
The NOx (nitrate + nitrite) distribution (Figure 4A) presents low values (<1 μM) in the upper 50 m at all stations, except in the core of the cyclonic eddy (stations 69–73), where the uplifting of colder deep waters brings NOx concentrations of about to 2–μM to the upper 50 m. The lowest NOx concentrations in the upper 100-m layer are found at the CE boundaries (stations 68 and 74) and in the convergence regions of AE1 and AE2, due to downwelling of surface water.
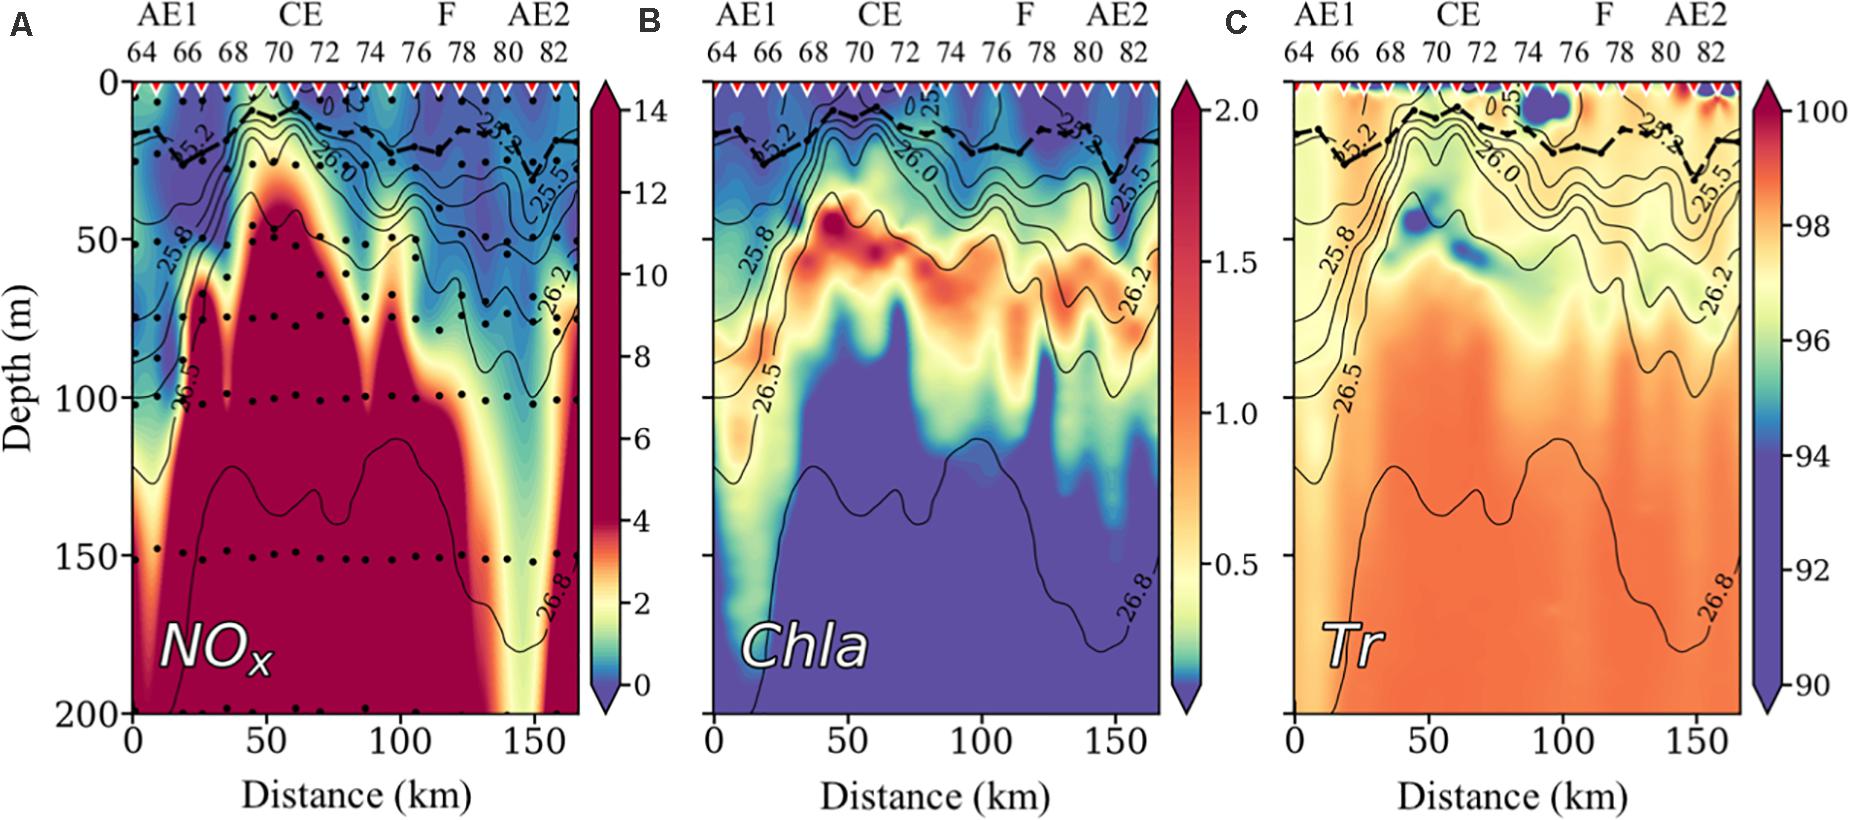
Figure 4. Vertical distribution of nitrate + nitrite concentrations (NOx) in μM (A), chlorophyll a (Chl a) in μg⋅L–1 (B), and Transmittance (T) in % (C), with isopycnals superimposed. Inverted red triangles on the top axis indicate stations position. The locations of the anticyclonic eddies (AE), the cyclonic eddy (CE), and the filament (F) are also indicated on the top axis. The bold black line shows the depth of the mixed layer (MLD). Black dots indicate sampled depths.
Chlorophyll a (Chl a) (Figure 4B) presents the typical subtropical ocean distribution, with low values in surface waters and a maximum at depth (DCM). The DCM is closely related to the physical structure of the water column, being shallower and more intense in the center of the cyclonic eddy (where NOx concentrations are higher) and deeper and weaker at stations associated with downwelling of surface water (AE1, AE2). In general, the DCM is placed below the seasonal thermocline along the section, between 50 and 80-m depth.
Transmittance (Tr), as a proxy of accumulation of organic and mineral particles (Figure 4C), is higher (less particles) in deep waters below the DCM. Lower Tr values (more particles) are found in surface waters and coinciding with the DCM (Figure 4B). The low Tr at surface waters between stations 74 and 76 is probably due to the accumulation of mineral and organic (low chlorophyll) particles at the intense frontal region between the CE and the F.
Plankton Community Distribution
The biomass concentrations of Pro and Syn are shown in Figures 5A,B, respectively. Both cyanobacteria groups present a rather similar distribution pattern with higher concentrations between stations 64 and 67, 72 and 77, and 81 and 83. However, maximum values of Pro are found below the MLD, while Syn highest concentrations are found above it. Cyanobacteria concentrations are lowest in the core of the CE (stations 69–71). PEuk biomass matches the pattern of distribution of the DCM (Figure 5C). High concentrations are observed below the seasonal thermocline with highest biomass at the margins of the CE. At the core of the CE and in the F region, where the isopycnals rise and NOx concentrations are higher, PEuk drops in biomass, being replaced by larger autotrophic eukaryotes (NEuk; Figure 5D), which are the main contributors to the DCM in these areas (Figure 4B).
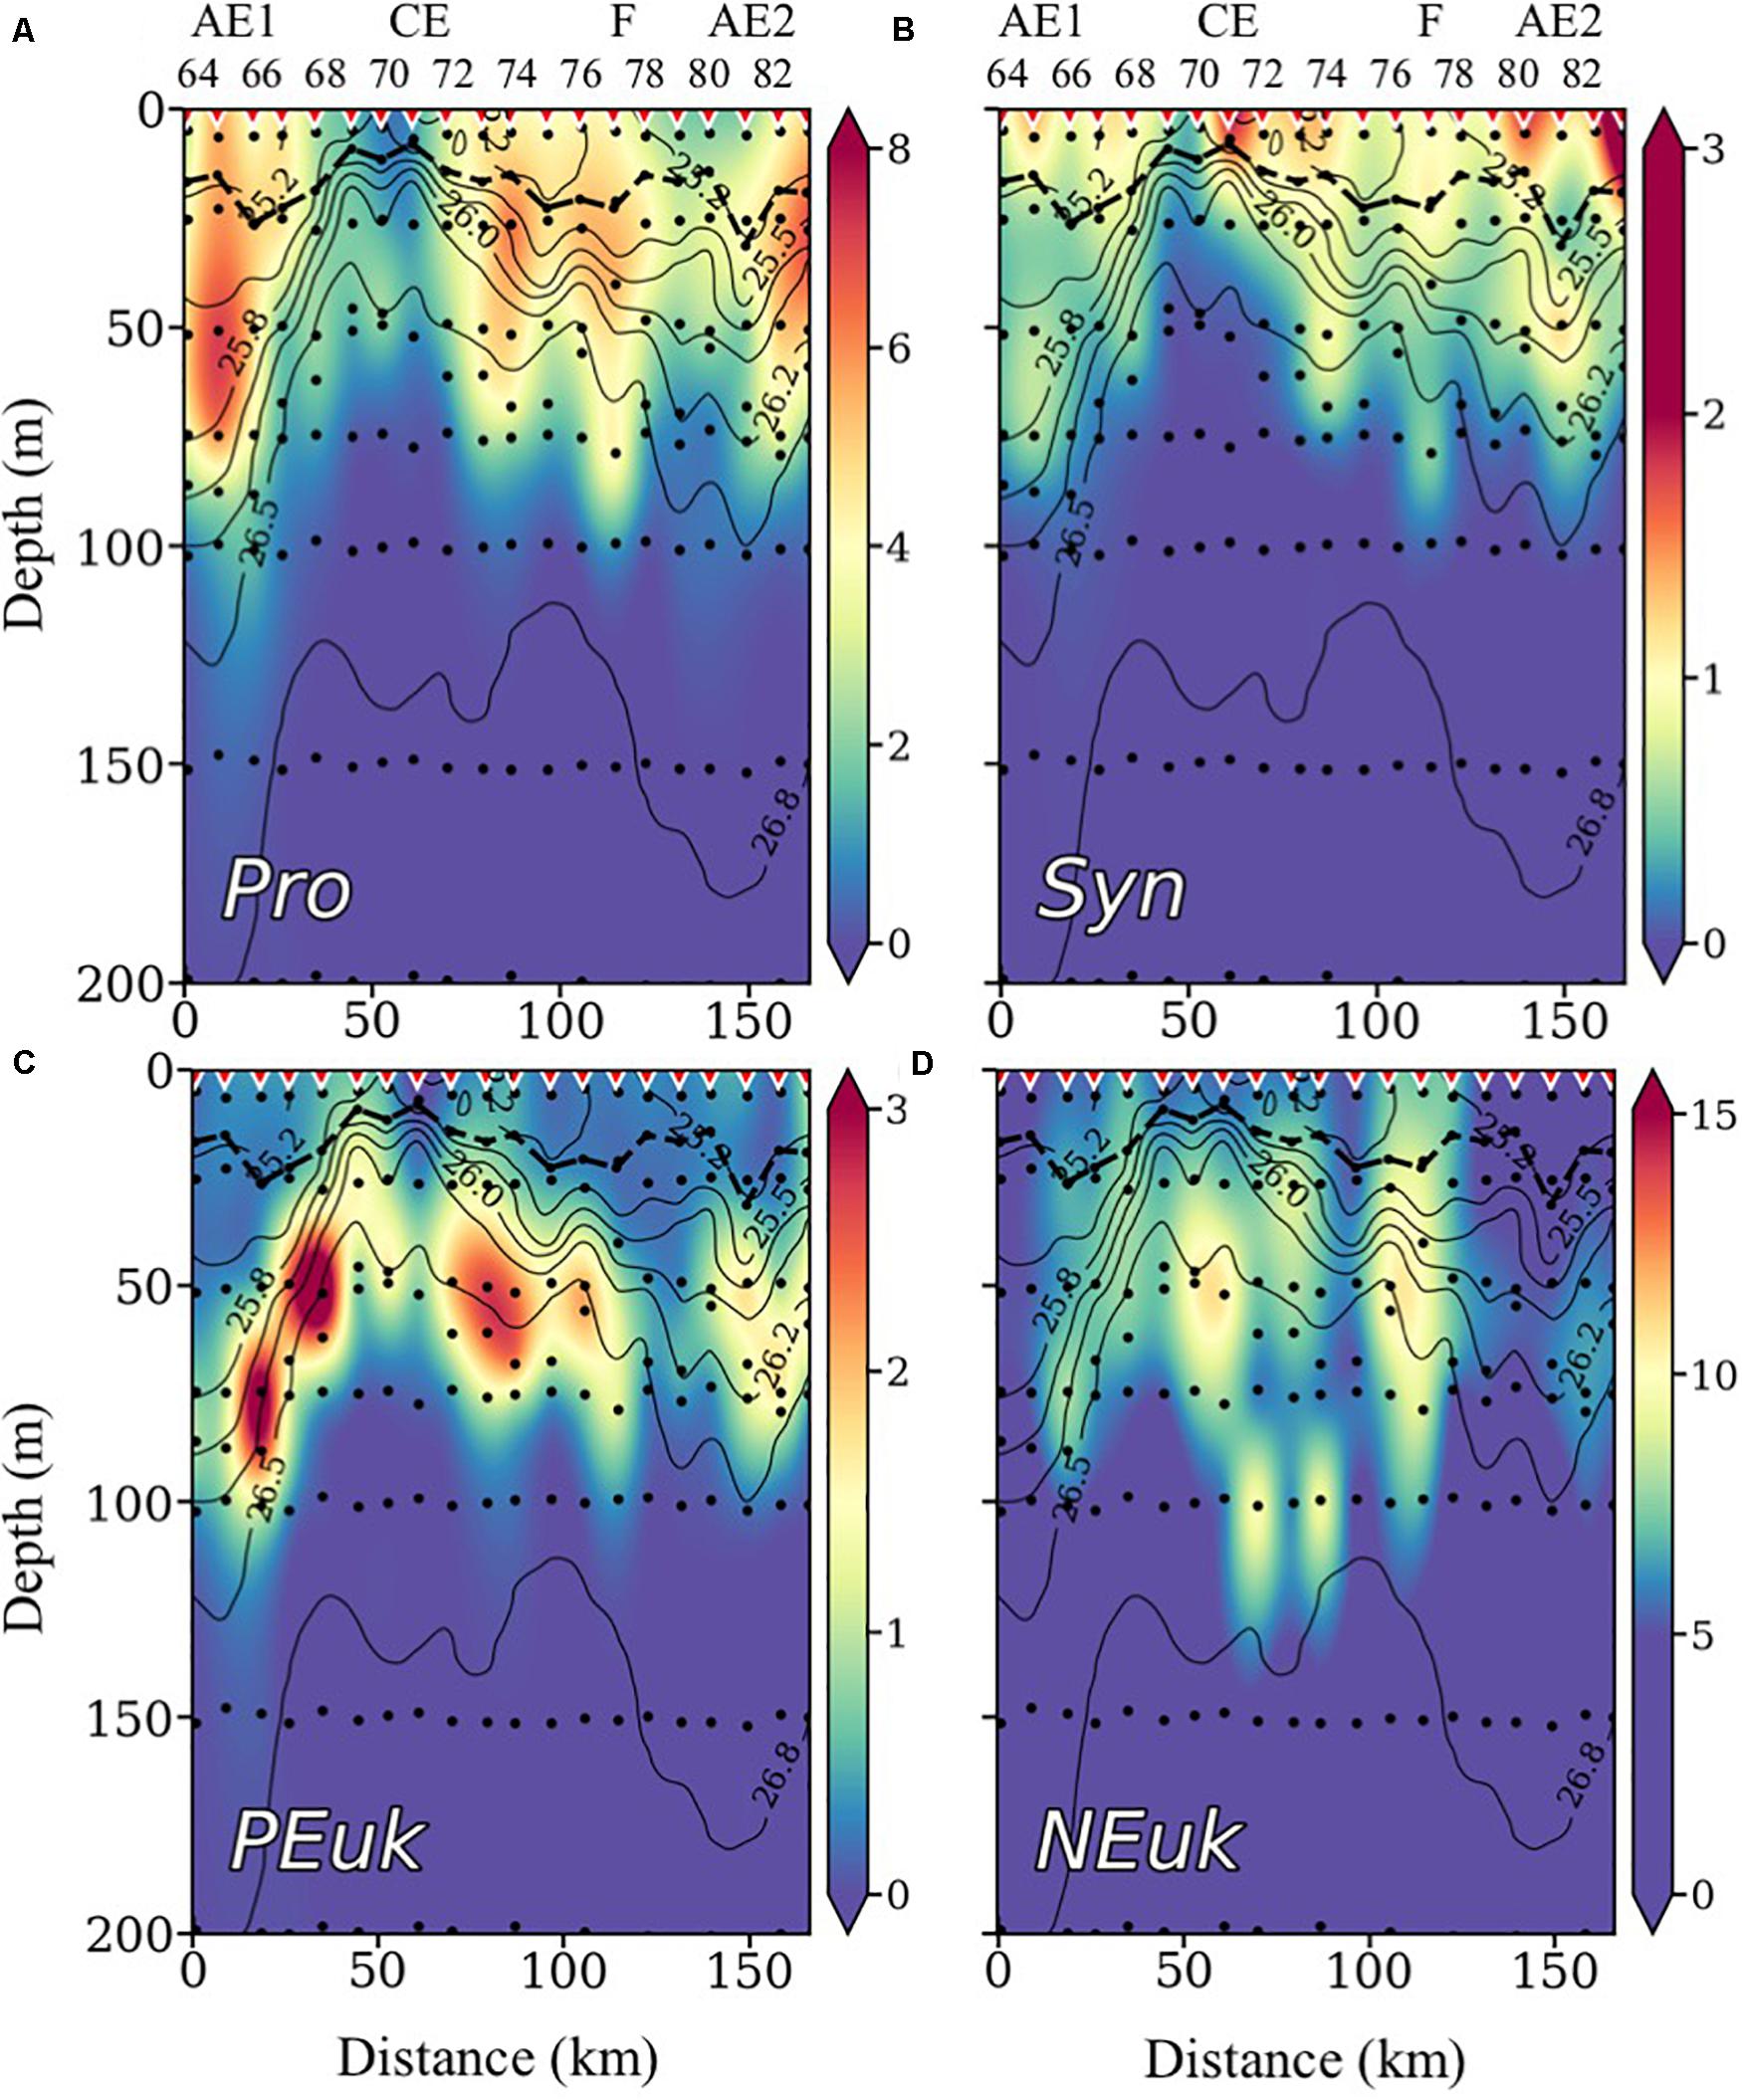
Figure 5. Vertical distribution of cyanobacteria-like Prochlorococcus (Pro) (A), Synechococcus (Syn) (B), autotrophic picoeukaryotes (PEuk) (C), and nanoeukaryotes (NEuk) (D) biomass concentrations in μg C⋅m–3, with isopycnals superimposed. Inverted red triangles on the top axis indicate stations position. The locations of the anticyclonic eddies (AE), the cyclonic eddy (CE), and the filament (F) are also indicated on the top axis. The bold black line shows the depth of the mixed layer (MLD). Black dots indicate sampled depths. Note the different scales for the plots.
The highest bacteria accumulations (Figure 6A) are found at the frontal regions of CE, where isopycnals depress (Figures 3, 4). The ratio of HNA/LNA bacteria (Figure 6B) is lower outside the CE region, and particularly low (<0.5) in the whole water column (down to 1,000 m; data not shown) at the frontal region between the CE and AE1, where water transmittance is lower (Figure 4C). The lowest HB biomasses, but with highest HNA/LNA ratios, are observed at the core of the CE, where HNF distribution are highest (Figure 6C), suggesting a prey-predator relationship (see below).
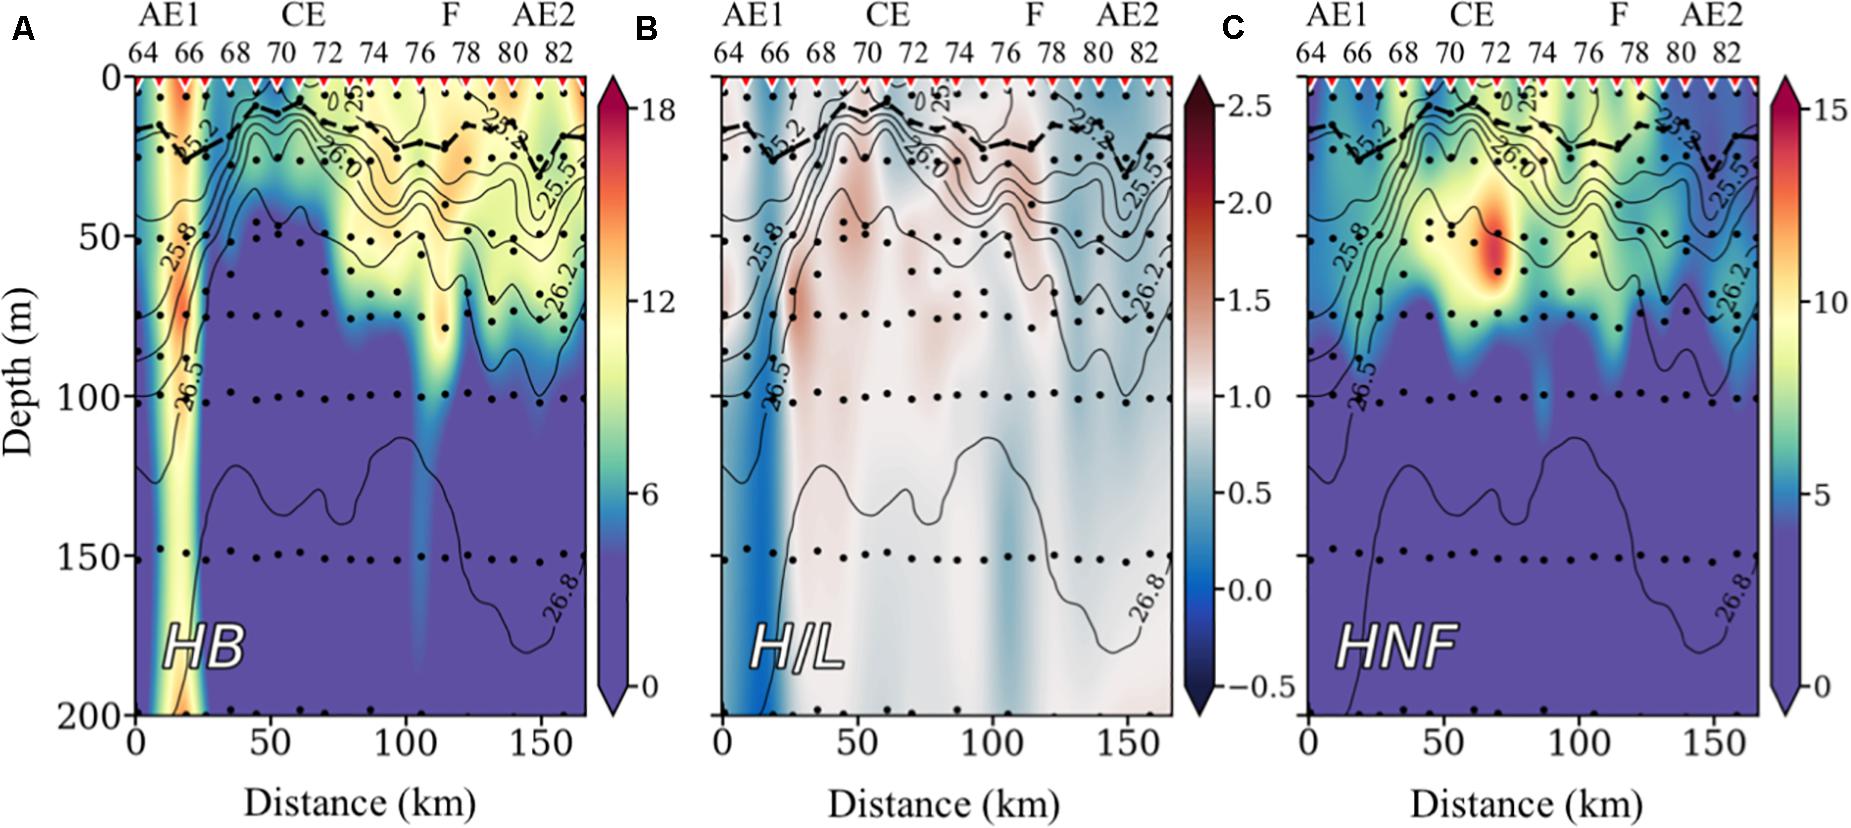
Figure 6. Vertical distribution of heterotrophic bacteria (HB) biomass concentration in μg C⋅m–3 (A), the ratio HNA/LNA (B), and heterotrophic nanoeukaryotes (HNF) biomass concentration in μg C⋅m–3 (C); all with isopycnals superimposed. Inverted red triangles on the top axis indicate stations position. The locations of the anticyclonic eddies (AE), the cyclonic eddy (CE), and the filament (F) are also indicated on the top axis. The bold black line shows the depth of the mixed layer (MLD). Black dots indicate sampled depths. Note that scales are different for the HB and NEuk plots.
Distance-based redundancy analysis correlates phytoplankton groups with physical and biogeochemical variables. These correlations are presented in ordination triplots (Figure 7), where angles between vectors reflect the correlations (Table 3). Specifically, the correlation (R2) is equal to the cosine of the angle between vectors. This means that vector pairs describing an angle of 90° are uncorrelated since the cosine of 90° is equal to 0, while vector pairs angles of 50° (or lower) would be highly correlated as cosine of 50° is 0.65 (>0.65).
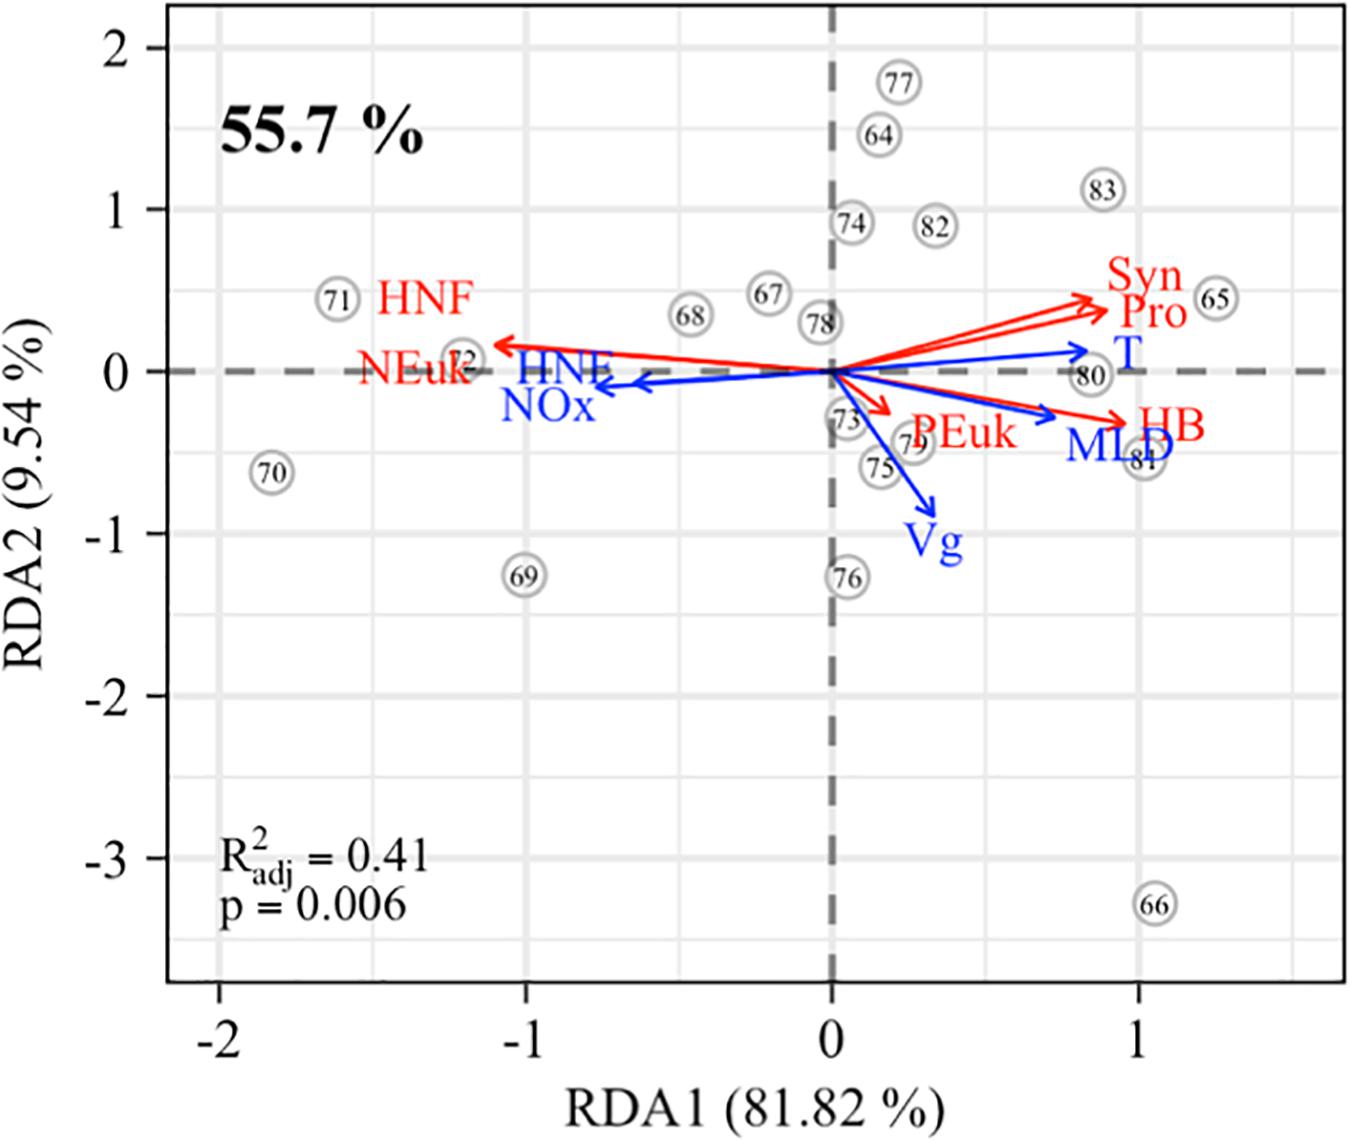
Figure 7. Results of the correlation plot of db-RDA, for the integrated biomasses of the different plankton groups (red arrows: Pro, Prochlorococcus; Syn, Synechococcus; PEuk, picoeukaryotes; NEuk, nanoeukaryotes; HB, heterotrophic bacteria; HNF, heterotrophic nanoflagellates) and the physical-biogeochemical variables (blue arrows: T, potential temperature; MLD, mixed layer depth; Vg, geostrophic velocity; NOx, nitrate + nitrite; HNF, heterotrophic nano flagellates). Stations are indicated by open dots. Note that distances among stations are not approximated to ecological distances. The explained variance for canonical axes RDA1 and RD2 is given on the axis. The percentage on the upper left corner refers to the explained constrained variance by all canonical axes. The adjusted correlation coefficient (R) and the Monte Carlo permutation test p-value are also shown in the lower left corner.
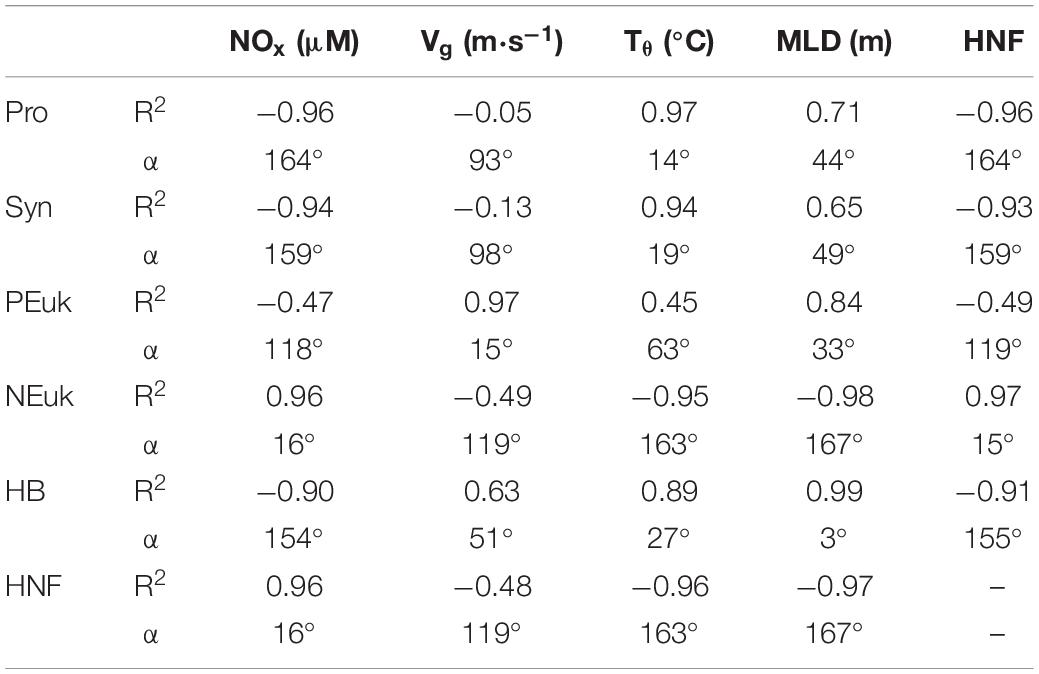
Table 3. Correlation coefficients (R2) and angles (α) between phytoplankton groups – Prochlorococcus (Pro), Synechococcus (Syn), picoeukaryotes (PEuk), nanoeukaryotes (NEuk), heterotrophic bacteria (HB), and heterotrophic nanoeukaryotes (HNF) – and variables –nitrate + nitrite (NOx), geostrophic velocity (Vg), potential temperature (Tθ), mixed layer depth (MLD), and heterotrophic nanoeukaryotes (HNF).
In our case, phytoplankton groups and the physical and biogeochemical variables present statistically significant correlation (R = 0.41, p = 0.006) being a significant percentage (55.7%) of the plankton variability explained by these variables. Positive correlations (angles lower than 50°, i.e., >0.65) are observed between (i) NEuk, HNF, and NOx concentrations; (ii) total HB, HNA, LNA, Tθ, and MLD; and (iii) PEuk, Vg, and MLD. Conversely, there are negative correlations between (i) all prokaryotic groups (HB, Syn, and Pro) and HNF; and (ii) nanoplankton (NEuk and HNF) with Tθ and MLD.
Discussion
Mesoscale-Submesoscale Interactions and Their Effects on Biogeochemistry
Our results show the presence of four different meso-submesoscale structures interacting among them. The main structure is a mesoscale CE characterized by a shoaling of the isopycnals and the nitracline in its core and the consequently increase in Chl a. The doming of the seasonal pycnocline produces the upwelling of nutrients into the euphotic zone, hence increasing Chl a in the core of the eddy at about 50-m depth. This process, referred as “eddy pumping” (Sangrà et al., 2007; McGillicuddy, 2016), is characteristic of young eddies south of the Canary Islands in their early stages of generation (Arístegui et al., 1997; Sangrà et al., 2009).
At stations 65–68, the CE interacts with AE1 in its south-western boundary, resulting in a strong submesoscale frontal zone. The convergence of two water masses with different densities in a mesoscale flow field, as observed in this frontal zone, may lead to a loss of the geostrophic balance and the subsequently ASC (Hoskins, 1982; Capet et al., 2008a; McWilliams, 2016). Despite vertical velocities not being measured, several observations give evidence of the presence of ASC in this frontal zone. The high Ro (0.48) associated with the front is an indicator of high relative vorticity, which generates losses in the geostrophic balance (Mahadevan and Tandon, 2006; Mahadevan, 2016). Moreover, Barceló-Llull et al. (2017b) obtained, in an intrathermocline eddy similar to AE1, maximum values of vertical velocity (w) of −6.4 m day–1 (downwelling) in the western edge of the eddy and 3.4 m day–1 (upwelling) in the eastern edge, between 160 and 185 m depth, showing a dipolar shape, with gradual changes with depth. Figure 4A shows that the upward vertical advection of nitrate into the euphotic zone crosses the isopycnals at the frontal regions of CE, suggesting diapycnal mixing (Mahadevan and Archer, 2000; Spall and Richards, 2000; Lévy et al., 2001; Klein and Lapeyre, 2009). To conserve potential vorticity, the implied ASC provides downwelling on the cyclonic (dense) side of the front and upwelling on the anticyclonic (less dense) side (Nagai et al., 2008), as suggested from the nitrate field (Figure 4A). This leads to a patchy distribution of Chl a (Figure 4B), as well as of the PEuk and NEuk organisms responsible of the DCM along the front (Figures 5C,D).
One prominent characteristic of the AE1-CE frontal zone is the high horizontal Vg, which reaches up to 1 m⋅s–1, a value five times higher than the average Vg (0.2 m⋅s–1) reported for the Canary Current (Sangrà, 1995; Pelegrí et al., 2005), and of the same order of magnitude of the highest ones registered in the ocean. Strong horizontal velocities (up to ±0.5 m⋅s–1) are also observed at the frontal regions of AE2, giving evidence of the anticyclonic nature of the eddy. These strong horizontal velocities associated with frontal zones would transport and redistribute small particles and organisms around the eddy field south of the islands, being responsible for the patchy distribution of organic matter and plankton observed in the Canary region (Arístegui et al., 2003; Arístegui and Montero, 2005; Baltar et al., 2009).
The filament (F) crossing our sampling region (Figure 1a) stems from the coastal jet of the upwelling system. It recirculates around the cyclonic eddy, although its signature is rather weak along our grid of study. In fact, although there are clear evidences of its presence from the Tθ, S, and σθ fields, there is no evidence of a larger transport of Chl a, in spite that NEuk present relatively higher biomasses down to 50 m near the core of F (station 77), coinciding with relatively higher nitrate concentrations close to the uplifted pycnocline (Figures 4A, 5D). This agrees with previous studies of filaments in this region that show a sharp demise in planktonic biomass along the offshore extension of the filaments (Arístegui et al., 2004; Baltar et al., 2009).
Drivers of Plankton Distribution and Community Structure
Although Syn and Pro share similar patterns of distribution, with higher concentrations in AE1 and AE2 and lower in the core of CE, Syn presents maximum concentrations in shallower waters than Pro, each one dominating different niche. This has been previously attributed to differences in light harvesting between the two groups (Bouman et al., 2006; Mackey et al., 2013; Biller et al., 2015; Grébert et al., 2018). RDA analysis shows a strong negative correlation between the two cyanobacteria groups and NOx, indicating that either they are outcompeted by eukaryotes when nutrient concentrations are higher, or that picocyanobacteria rely mainly on dissolved organic matter for their growth (Berman and Bronk, 2003; Mulholland and Lee, 2009; Znachor and Nedoma, 2010; Duhamel et al., 2018). Strong vertical velocities associated with eddy pumping and ASC in CE could have contributed to displace the smaller picoplanktonic cells (Pro, Syn, and HB) to the frontal regions of the eddy, where they accumulate (McGillicuddy et al., 2003; Guidi et al., 2012; Omand et al., 2015). In particular, HB present high biomasses in the water column (down to at least 1,000 m; data not shown) at the strong frontal zone between AE1 and CE, presumably due to aggregation to sinking particles. Past studies in the Canary region have shown that HB accumulate in frontal zones between eddies, where dissolved and particulate organic matter are concentrated (Arístegui et al., 2003; Arístegui and Montero, 2005; Baltar et al., 2009). However, there is not a clear explanation of why LNA bacteria prevail over HNA bacteria in this frontal region, except that there could be preferential grazing pressure over HNA bacteria. Syn, Pro, and HB also present strong negative relationship with HNF, suggesting that grazing of bacteria and cyanobacteria by HNF, commonly reported in the literature (e.g., Massana et al., 2009; Baltar et al., 2016; Yang et al., 2018; Livanou et al., 2019), could have also contributed to determine their distribution across the eddy field.
Like in other oceanic regions (Zubkov et al., 2000), PEuk accumulate below the thermocline, close to the nitracline, being the principal contributor to the DCM across the section. Painter et al. (2014) observed that nitrate uptake rates by PEuk are 10-fold higher in the DCM than in surface waters, contributing to higher growth rates. They argued that PEuk are well adapted to low light regimes, granting them the benefit to thrive at deeper layers than other phytoplankton groups. RDA shows a strong inverse correlation between PEuk and the MLD, indicating that the deeper the mixed layer is (and hence the DCM) the greater the contribution of PEuk to the DCM.
There are two exceptions where PEuk dominance at the DCM is replaced by NEuk: the cores of the CE and the F, where the uplifting of isotherms brings high nutrient concentrations to the upper 50 m, with higher irradiances benefiting the growth of larger eukaryotic cells. Indeed, larger cells of micro- and nanoplankton have an advantage over smaller cells in utilizing nutrient pulses (Marañón et al., 2013; Marañón, 2015). Moreover, the greater motility of larger flagellate cells allows NEuk to withstand at some extent physical forcing, maintaining their position in the core of these features, in spite of advection. The strong positive relationship with NOx and negative relationship with Tθ, obtained by RDA, support the notion that upwelling of cold nutrient-rich water drives NEuk distribution.
HNF display biomass maxima at the same stations than NEuk, also presenting strong positive correlations with NOX and negative with Tθ and all prokaryotic groups (Pro, Syn, and HB). It is well-known that nanoflagellates prey over small picoplankton (Christaki et al., 2005; Tsai et al., 2018). However, the fact that HNF correlates inversely with nutrients could also indicate that a large part of these organisms may behave as mixotrophs (Stoecker et al., 2017 and references therein).
Collectively, the distribution of small prokaryotic picoplankton would be modulated by physical forcing, displacing the organisms away from highly advective regions (like the core of CE and F), but also by grazing of HNF and the availability of organic matter at the frontal regions between mesoscale features. The PEuk distribution would depend mainly on the competition with NEuk on light availability and nutrients, but also on grazing by HNF. Conversely, the distribution of larger flagellate organisms, with a moderate capacity to withstand water advection, would be driven by their metabolic requirements: nutrient concentration (NEuk) and prey availability (HNF).
Conclusion
The small-scale resolution of our sampling provides new insights into the study of the impact of mesoscale and submesoscale features in the dynamics of nutrients, chlorophyll, and planktonic communities. We were able to assess the upwelling/downwelling processes at submesoscale resolution, associated with eddy pumping and with the ageostrophic secondary circulation, which dominates small-scale circulation patterns at the frontal regions between adjacent structures.
We found that autotrophic and heterotrophic pico- and nanoplanktonic organisms presented a heterogeneous distribution in response to nutrient inputs caused by meso- and submesoscale processes, but also due to potential motility and grazing pressure. Redundancy analysis suggests that the distribution of motile organisms like the nanoplanktonic NEuk and HNF are driven by nutrient supply and prey availability, respectively. Due to their mobility, these organisms may maintain their position at the core of the eddy. On the contrary, the distribution of small picoplanktonic organisms is modulated by physical (vertical and horizontal velocities) and biogeochemical (nutrient/organic matter availability or grazing pressure) drivers, or a combination of both.
We are aware that this study is limited to a single section, and therefore, our conclusions may be interpreted with caution. However, our results strongly suggest that the structure of the planktonic community; hence, its contribution to primary productivity and flux of carbon to the deep ocean will be modified along the life cycle of eddies through their interaction with other mesoscale and submesoscale features, from their generation state to their final fading, as the relative impact of physical and biogeochemical processes vary.
Data Availability Statement
The datasets generated for this study are available on request to the corresponding author.
Author Contributions
JA conceived and designed the cruise. JA and FB carried out sampling. NH-H, JA, MM, EV-S, ÁM-D, AM-M, and ÁR-S analyzed the data. NH-H performed the statistics. JA and NH-H wrote the manuscript with inputs from all co-authors. All authors contributed to the article and approved the submitted version.
Funding
This work was a contribution to projects RODA (CTM2004-06842-C03/MAR), PUMP (CTM2012-33355), FLUXES (CTM2015-69392-C3-1-R), and e-IMPACT (PID2019-109084RB-C2), funded by the Spanish “Plan Nacional de I + D,” CEI2019-01, funded by the ULPGC, and to project TRIATLAS (AMD-817578-5) financed by the European Commission (H2020). NH-H was supported by a grant (TESIS2015010036) of the Agencia Canaria de Investigación, Innovación y Sociedad de la Información (ACIISI).
Conflict of Interest
The authors declare that the research was conducted in the absence of any commercial or financial relationships that could be construed as a potential conflict of interest.
Acknowledgments
We thank to the officers and crew of the BIO Hespérides, Minerva Espino, and the staff of the Unit of Marine Technology (UTM) of the Spanish Research Council (CSIC) for their invaluable help at sea. This manuscript is in memoriam of Dr. Pablo Sangrà, who passed away when we were working together on a preliminary draft of the manuscript.
Footnotes
References
Álvarez-Salgado, X. A., Arístegui, J., Barton, E. D., and Hansell, D. A. (2007). Contribution of upwelling filaments to offshore carbon export in the subtropical Northeast Atlantic Ocean. Limnol. Oceanogr. 52, 1287–1292. doi: 10.4319/lo.2007.52.3.1287
Arístegui, J., Barton, E. D., Álvarez-Salgado, X. A., Santos, A. M. P., Figueiras, F. G., Kifani, S., et al. (2009). Sub-regional ecosystem variability in the canary current upwelling. Prog. Oceanogr. 83, 33–48. doi: 10.1016/j.pocean.2009.07.031
Arístegui, J., Barton, E. D., Montero, M. F., García-Muñoz, M., and Escánez, J. (2003). Organic carbon distribution and water column respiration in the NW Africa-Canaries coastal transition zone. Aquat. Microb. Ecol. 33, 289–301. doi: 10.3354/ame033289
Arístegui, J., Barton, E. D., Tett, P., Montero, M. F., García-Muñoz, M., Basterretxea, G., et al. (2004). Variability in plankton community structure, metabolism, and vertical carbon fluxes along an upwelling filament (Cape Juby, NW Africa). Prog. Oceanogr. 62, 95–113. doi: 10.1016/j.pocean.2004.07.004
Arístegui, J., and Montero, M. F. (2005). Temporal and spatial changes in plankton respiration and biomass in the Canary islands region: the effect of mesoscale variability. J. Mar. Syst. 54, 65–82. doi: 10.1016/j.jmarsys.2004.07.004
Arístegui, J., Sangrá, P., Hernández-León, S., Cantón, M., Hernández-Guerra, A., and Kerling, J. L. (1994). Island-induced eddies in the Canary islands. Deep. Res. Part I Oceanogr. Res. Pap. 41, 1509–1525. doi: 10.1016/0967-0637(94)90058-90052
Arístegui, J., Tett, P., Hernández-Guerra, A., Basterretxea, G., Montero, M. F., Wild, K., et al. (1997). The influence of island-generated eddies on chlorophyll distribution: a study of mesoscale variation around Gran Canaria. Deep. Res. Part I Oceanogr. Res. Pap. 44, 71–96. doi: 10.1016/S0967-0637(96)00093-93
Baltar, F., Arístegui, J., Montero, M. F., Espino, M., Gasol, J. M., and Herndl, G. J. (2009). Mesoscale variability modulates seasonal changes in the trophic structure of nano- and picoplankton communities across the NW Africa-Canary Islands transition zone. Prog. Oceanogr. 83, 180–188. doi: 10.1016/j.pocean.2009.07.016
Baltar, F., Palovaara, J., Unrein, F., Catala, P., Hornák, K., Csimek, K., et al. (2016). Marine bacterial community structure resilience to changes in protist predation under phytoplnakton bloom conditions. ISME J. 10, 568–581. doi: 10.1038/ismej.2015.135
Barceló-Llull, B., Pallàs-Sanz, E., Sangrà, P., Martínez-Marrero, A., Estrada-Allis, S. N., and Arístegui, J. (2017a). Ageostrophic secondary circulation in a subtropical intrathermocline eddy. J. Phys. Oceanogr. 47, 1107–1123. doi: 10.1175/JPO-D-16-0235.1
Barceló-Llull, B., Sangrà, P., Pallàs-Sanz, E., Barton, E. D., Estrada-Allis, S. N., Martínez-Marrero, A., et al. (2017b). Anatomy of a subtropical intrathermocline eddy. Deep Sea Res. Part I 124, 126–139. doi: 10.1016/j.dsr.2017.03.012
Barton, E. D., Arístegui, J., Tett, P., and Navarro-Pérez, E. (2004). Variability in the Canary Islands area of filament-eddy exchanges. Prog. Oceanogr. 62, 71–94. doi: 10.1016/j.pocean.2004.07.003
Benitez-Nelson, C. R., Bidigare, R. R., Dickey, T. D., Landry, M. R., Leonard, C. L., Brown, S. L., et al. (2007). Mesoscale eddies drive increased silica export in the subtropical pacific ocean. Science 316, 1017–1022.
Berman, T., and Bronk, D. A. (2003). Dissolved organic nitrogen: a dynamic participant in aquatic ecosystems. Aquat. Microb. Ecol. 31, 279–305. doi: 10.3354/ame031279
Bibby, T. S., and Moore, C. M. (2011). Silicate:nitrate ratios of upwelled waters control the phytoplankton community sustained by mesoscale eddies in sub-tropical North Atlantic and Pacific. Biogeosciences 8, 657–666. doi: 10.5194/bg-8-657-2011
Biller, S. J., Berube, P. M., Lindell, D., and Chisholm, S. W. (2015). Prochlorococcus: the structure and function of collective diversity. Nat. Rev. Microbiol. 13, 13–27. doi: 10.1038/nrmicro3378
Bouman, H. A., Ulloa, O., Scanlan, D. J., Zwirglmaier, K., Li, W. K. W., Platt, T., et al. (2006). Oceanographic basis of the global surface distribution of Prochlorococcus ecotypes. Science 312, 918–921. doi: 10.1126/science.1122692
Capet, X., McWilliams, J. C., Molemaker, M. J., and Shchepetkin, A. F. (2008a). Mesoscale to submesoscale transition in the california current system. Part I: flow structure, eddy flux, and observational tests. J. Phys. Oceanogr. 38, 44–64. doi: 10.1175/2007JPO3672.1
Capet, X., McWilliams, J. C., Molemaker, M. J., and Shchepetkin, A. F. (2008b). Mesoscale to submesoscale transition in the california current system. Part II: frontal processes. J. Phys. Oceanogr. 38, 2256–2269. doi: 10.1175/2008JPO3810.1
Chelton, D. B., DeSzoeke, R. A., Schlax, M. G., El Naggar, K., and Siwertz, N. (1998). Geographical variability of the first baroclinic rossby radius of deformation. J. Phys. Oceanogr. 28, 433–460. doi: 10.1175/1520-0485(1998)028<0433:gvotfb>2.0.co;2
Chelton, D. B., Schlax, M. G., and Samelson, R. M. (2011). Global observations of nonlinear mesoscale eddies. Prog. Oceanogr. 91, 167–216. doi: 10.1016/j.pocean.2011.01.002
Chelton, D. B., Schlax, M. G., Samelson, R. M., and de Szoeke, R. A. (2007). Global observations of large oceanic eddies. Geophys. Res. Lett. 34, 1–5. doi: 10.1029/2007GL030812
Chenillat, F., Franks, P. J. S., Rivière, P., Capet, X., Grima, N., and Blanke, B. (2015). Plankton dynamics in a cyclonic eddy in the Southern California current system. J. Geophys. Res. Ocean. 120, 5566–5588. doi: 10.1002/2015JC010826.Received
Christaki, U., Vázquez-Domínguez, E., Courties, C., and Lebaron, P. (2005). Grazing impact of different heterotrophic nanoflagellates on eukaryotic (Ostreococcus tauri) and prokaryotic picoautotrophs (Prochlorococcus and Synechococcus). Environ. Microbiol. 7, 1200–1210. doi: 10.1111/j.1462-2920.2005.00800.x
Clayton, S., Nagai, T., and Follows, M. J. (2014). Fine scale phytoplankton community structure across the Kuroshio Front. J. Plankton Res. 36, 1017–1030. doi: 10.1093/plankt/fbu020
de Boyer Montégut, C., Madec, G., Fischer, A. S., Lazar, A., and Iudicone, D. (2004). Mixed layer depth over the global ocean: an examination of profile data and a profile-based climatology. J. Geophys. Res. C Ocean. 109, 1–20. doi: 10.1029/2004JC002378
Duhamel, S., Van Wambeke, F., Lefevre, D., Benavides, M., and Bonnet, S. (2018). Mixotrophic metabolism by natural communities of unicellular cyanobacteria in the western tropical South Pacific Ocean. Environ. Microbiol. 20, 2743–2756. doi: 10.1111/1462-2920.14111
Falkowski, P. G., Ziemann, D., Kolber, Z., and Bienfang, P. K. (1991). Role of eddy pumping in enhancing primary production in the ocean. Nature 352, 55–58. doi: 10.1038/352055a0
Fielding, S., Crisp, N., Allen, J. T., Hartman, M. C., Rabe, B., and Roe, H. S. J. (2001). Mesoscale subduction at the Almeria-Oran front Part 2. biophysical interactions. J. Mar. Syst. 30, 287–304. doi: 10.1016/S0924-7963(01)00063-X
García-Muñoz, M., Arístegui, J., Montero, M. F., and Barton, E. D. (2004). Distribution and transport of organic matter along a filament-eddy system in the Canaries – NW Africa coastal transition zone region. Prog. Oceanogr. 62, 115–129. doi: 10.1016/j.pocean.2004.07.005
García-Muñoz, M., Arístegui, J., Pelegrí, J. L., Antoranz, A., Ojeda, A., and Torres, M. (2005). Exchange of carbon by an upwelling filament off Cape Ghir (NW Africa). J. Mar. Syst. 54, 83–95. doi: 10.1016/j.jmarsys.2004.07.005
Gasol, J. M., Li Zweifel, U., Peters, F., Fuhrman, J. A., and Hagström, Å (1999). Significance of size and nucleic acid content heterogeneity as measured by flow cytometry in natural planktonic bacteria. Appl. Environ. Microbiol. 65, 4475–4483. doi: 10.13039/501100000780
Gaube, P., McGillicuddy, D. J. J., Chelton, D. B., Behrenfeld, J., and Strutton, P. G. (2014). Regional variations in the influence of mesoscale eddies on near-surface chlorophyll. J. Geophys. Res. Ocean. 119, 8195–8220. doi: 10.1002/2014JC010111.Received
Grébert, T., Doré, H., Partensky, F., Farrant, G. K., Boss, E. S., Picheral, M., et al. (2018). Light color acclimation is a key process in the global ocean distribution of Synechococcus cyanobacteria. Proc. Natl. Acad. Sci. U.S.A. 115, E2010–E2019. doi: 10.1073/pnas.1717069115
Guidi, L., Calil, P. H. R., Duhamel, S., Björkman, K. M., Doney, S. C., Jackson, G. A., et al. (2012). Does eddy-eddy interaction control surface phytoplankton distribution and carbon export in the North Pacific Subtropical Gyre? J. Geophys. Res. 117, 1–12. doi: 10.1029/2012JG001984
Hansen, H. P., and Grasshoff, K. (1983). “Automated chemical analysis,” in Methods of Seawater Analysis, ed. K. Grashoff M. Ehrhardt and K. Kremling (Weinheim: Verlag Chemie) 347–379. doi: 10.1016/0304-4203(78)90045-2
Hosegood, P. J., Nightingale, P. D., Rees, A. P., Widdicombe, C. E., Woodward, E. M. S., Clark, D. R., et al. (2017). Nutrient pumping by submesoscale circulations in the mauritanian upwelling system. Prog. Oceanogr. 159, 223–236. doi: 10.1016/j.pocean.2017.10.004
Hoskins, B. J. (1982). The mathematical theory of frontogenesis. Annu. Rev. Fluid Mech. 14, 131–151. doi: 10.1146/annurev.fl.14.010182.001023
Klein, P., and Lapeyre, G. (2009). The oceanic vertical pump induced by mesoscale and submesoscale turbulence. Ann. Rev. Mar. Sci. 1, 351–375. doi: 10.1146/annurev.marine.010908.163704
Legendre, P., and Legendre, L. (eds) (2012). Numerical Ecology, 3rd Edn, Amsterdam: Elsevier, doi: 10.1016/B978-0-444-53868-0.50016-2
Lévy, M., Franks, P. J. S., and Smith, K. S. (2018). The role of submesoscale currents in structuring marine ecosystems. Nat. Commun. 9:4758. doi: 10.1038/s41467-018-07059-7053
Lévy, M., Klein, P., and Treguier, A.-M. (2001). Impact of sub-mesoscale physics on production and subduction of phytoplankton in an oligotrophic regime. J. Mar. Res. 59, 535–565. doi: 10.1357/002224001762842181
Livanou, E., Lagaria, A., Santi, I., Mandalakis, M., Pavlidou, A., Lika, K., et al. (2019). Pigmented and heterotrophic nanoflagellates: abundance and grazing on prokaryotic picoplankton in the ultra-oligotrophic Eastern Mediterranean Sea. Deep. Res. Part II Top. Stud. Oceanogr. 164, 100–111. doi: 10.1016/j.dsr2.2019.04.007
Mackey, K. R. M., Paytan, A., Caldeira, K., Grossman, A. R., Moran, D., McIlvin, M., et al. (2013). Effect of temperature on photosynthesis and growth in marine Synechococcus spp. Plant Physiol. 163, 815–829. doi: 10.1104/pp.113.221937
Mahadevan, A. (2016). The Impact of submesoscale physics on primary productivity of plankton. Ann. Rev. Mar. Sci. 8, 161–184. doi: 10.1146/annurev-marine-010814-015912
Mahadevan, A., and Archer, D. (2000). Modeling the impact of fronts and mesoscale circulation on the nutrient supply and biogeochemistry of the upper ocean. J. Geophys. Res. Ocean. 105, 1209–1225. doi: 10.1029/1999JC900216
Mahadevan, A., and Tandon, A. (2006). An analysis of mechanisms for submesoscale vertical motion at ocean fronts. Ocean Model. 14, 241–256. doi: 10.1016/j.ocemod.2006.05.006
Marañón, E. (2015). Cell size as a key determinant of phytoplankton metabolism and community structure. Ann. Rev. Mar. Sci. 7, 241–264. doi: 10.1146/annurev-marine-010814-015955
Marañón, E., Cermeño, P., López-Sandoval, D. C., Rodríguez-Ramos, T., Sobrino, C., Huete-Ortega, M., et al. (2013). Unimodal size scaling of phytoplankton growth and the size dependence of nutrient uptake and use. Ecol. Lett. 16, 371–379. doi: 10.1111/ele.12052
Massana, R., Unrein, F., Rodríguez-Martínez, R., Forn, I., Lefort, T., Pinhassi, J., et al. (2009). Grazing rates and functional diversity of uncultured heterotrophic flagellates. ISME J. 3, 588–595. doi: 10.1038/ismej.2008.130
McGillicuddy, D. J. (2016). Mechanisms of physical-biological-biogeochemical interaction at the oceanic mesoscale. Ann Rev Mar Sci. 8, 125–159. doi: 10.1146/annurev-marine-010814-015606
Mcgillicuddy, D. J., Anderson, L. A., Bates, N. R., Buesseler, K. O., Carlson, C. A., Davis, C. S., et al. (2007). Eddy/Wind interactions stimulate extraordinary mid-ocean blooms. Science 316, 1021–1026. doi: 10.1126/science.1136256
McGillicuddy, D. J., Anderson, L. A., Doney, S. C., and Maltrud, M. E. (2003). Eddy-driven sources and sinks of nutrients in the upper ocean: results from a 0.1° resolution model of the North Atlantic. Global. Biogeochem. Cycles 17:1035. doi: 10.1029/2002gb001987
McGillicuddy, D. J. J., Robinson, A. R., Siegel, D. A., Jannasch, H. W., Johnson, R., Dickey, T. D., et al. (1998). Influence of mesoscale eddies on new production in the Sargasso Sea. Nature 285, 263–266. doi: 10.1038/28367
McWilliams, J. C. (2016). Submesoscale currents in the ocean. Proc. R. Soc. A Math. Phys. Eng. Sci. 472:20160117. doi: 10.1098/rspa.2016.0117
Mulholland, M. R., and Lee, C. (2009). Peptide hydrolysis and the uptake of dipeptides by phytoplankton. Limnol. Oceanogr. 54, 856–868. doi: 10.4319/lo.2009.54.3.0856
Nagai, T., Tandon, A., Gruber, N., and McWilliams, J. C. (2008). Biological and physical impacts of ageostrophic frontal circulations driven by confluent flow and vertical mixing. Dyn. Atmos. Ocean. 45, 229–251. doi: 10.1016/j.dynatmoce.2007.12.001
Nencioli, F., Kuwahara, V. S., Dickey, T. D., Rii, Y. M., and Bidigare, R. R. (2008). Physical dynamics and biological implications of a mesoscale eddy in the lee of Hawai’i: cyclone opal observations during E-Flux III. Deep. Res. Part II Top. Stud. Oceanogr. 55, 1252–1274. doi: 10.1016/j.dsr2.2008.02.003
Omand, M. M., D’Asaro, E. A., Lee, C. M., Perry, M. J., Briggs, N., Cetini, I., et al. (2015). Eddy-driven subduction exports particulate organic carbon from the spring bloom. Science 348, 22–225. doi: 10.1126/science.1260062
Painter, S. C., Patey, M. D., Tarran, G. A., and Torres-Valdés, S. (2014). Picoeukaryote distribution in relation to nitrate uptake in the oceanic nitracline. Aquat. Microb. Ecol. 72, 195–213. doi: 10.3354/ame01695
Pelegrí, J. L., Arístegui, J., Cana, L., González-Dávila, M., Hernández-Guerra, A., Hernández-León, S., et al. (2005). Coupling between the open ocean and the coastal upwelling region off northwest Africa: water recirculation and offshore pumping of organic matter. J. Mar. Syst. 54, 3–37. doi: 10.1016/j.jmarsys.2004.07.003
Piedeleu, M., Sangra, P., Sánchez-Vidal, A., Fabrés, J., Gordo, C., and Calafat, A. (2009). An observational study of oceanic eddy generation mechanisms by tall deep-water islands (Gran Canaria). Geophys. Res. Lett. 36, 1–5. doi: 10.1029/2008GL037010
Porter, K. G., and Feig, Y. S. (1980). The use of DAPI for identifying and counting aquatic microflora. Limnol. Oceanogr. 25, 943–948. doi: 10.4319/Lo.1980.25.5.0943
Rodriguez, J., Tintore, J., Allen, J. T., Blanco, J. M., Gomis, D., Reul, A., et al. (2001). Mesoscale vertical motion and the size structure of phytoplakton in the ocean. Nature 410, 360–362.
Sangrà, P. (1995). Perturbación de un Flujo Geofísico Por un Obstáculo: Aplicación a la isla de Gran Canaria. Doctoral dissesrtation, University Of Las Palmas De Gran Canaria, Spain.
Sangrà, P., Auladell, M., Marrero-Díaz, A., Pelegrí, J. L., Fraile-Nuez, E., Rodríguez-Santana, A., et al. (2007). On the nature of oceanic eddies shed by the Island of Gran Canaria. Deep. Res. Part I Oceanogr. Res. Pap. 54, 687–709. doi: 10.1016/j.dsr.2007.02.004
Sangrà, P., García-Muñoz, C., García, C. M., Marrero-Díaz, Á, Sobrino, C., Mouriño-Carballido, B., et al. (2014). Coupling between upper ocean layer variability and size-fractionated phytoplankton in a non-nutrient-limited environment. Mar. Ecol. Prog. Ser. 499, 35–46. doi: 10.3354/meps10668
Sangrà, P., Pascual, A., Rodríguez-Santana, Á, Machín, F., Mason, E., McWilliams, J. C., et al. (2009). The canary eddy corridor: a major pathway for long-lived eddies in the subtropical North Atlantic. Deep. Res. Part I Oceanogr. Res. Pap. 56, 2100–2114. doi: 10.1016/j.dsr.2009.08.008
Sangrà, P., Pelegrí, J. L., Hernández-Guerra, A., Arregui, I., Martín, J. M., Marrero-Díaz, A., et al. (2005). Life history of an anticyclonic eddy. J. Geophys. Res. C Ocean. 110, 1–19. doi: 10.1029/2004JC002526
Santana-Falcón, Y., Álvarez-Salgado, X. A., Pérez-Hernández, M. D., Hernández-Guerra, A., Mason, E., and Arístegui, J. (2017). Organic carbon budget for the eastern boundary of the North Atlantic subtropical gyre: major role of DOC in mesopelagic respiration. Sci. Rep. 7, 1–12. doi: 10.1038/s41598-017-10974-y
Siegel, D. A., Court, D. B., Menzies, D. W., Peterson, P., Maritorena, S., and Nelson, N. B. (2008). Satellite and in situ observations of the bio-optical signatures of two mesoscale eddies in the Sargasso Sea. Deep. Res. Part II Top. Stud. Oceanogr. 55, 1218–1230. doi: 10.1016/j.dsr2.2008.01.012
Siegel, D. A., Peterson, P., McGillicuddy, D. J., Maritorena, S., and Nelson, N. B. (2011). Bio-optical footprints created by mesoscale eddies in the Sargasso Sea. Geophys. Res. Lett. 38, 1–6. doi: 10.1029/2011GL047660
Sieracki, M. E., and Johnson, P. W. (1985). Detection, enumeration, and sizing of planktonic bacteria by image-analyzed epifluorescence microscopy downloaded from. Appl. Environ. Microbiol. 49, 799–810.
Spall, S. A., and Richards, K. J. (2000). A numerical model of mesoscale frontal instabilities and plankton dynamics – I. model formulation and initial experiments. Deep. Res. Part I Oceanogr. Res. Pap. 47, 1261–1301. doi: 10.1016/S0967-0637(99)00081-83
Stoecker, D. K., Hansen, P. J., Caron, D. A., and Mitra, A. (2017). Mixotrophy in the marine Plankton. Ann. Rev. Mar. Sci. 9, 311–335. doi: 10.1146/annurev-marine-010816-060617
Tsai, A. Y., Gong, G. C., Chung, C. C., and Huang, Y. T. (2018). Different impact of nanoflagellate grazing and viral lysis on Synechococcus spp. and picoeukaryotic mortality in coastal waters. Estuar. Coast. Shelf Sci. 209, 1–6. doi: 10.1016/j.ecss.2018.05.012
Yang, J. W., Wu, W., Chung, C. C., Chiang, K. P., Gong, G. C., and Hsieh, C. H. (2018). Predator and prey biodiversity relationship and its consequences on marine ecosystem functioning – Interplay between nanoflagellates and bacterioplankton. ISME J. 12, 1532–1542. doi: 10.1038/s41396-018-0111-113
Znachor, P., and Nedoma, J. (2010). Importance of dissolved organic carbon for phytoplankton nutrition in a eutrophic reservoir. J. Plankton Res. 32, 367–376. doi: 10.1093/plankt/fbp129
Keywords: plankton community structure, mesoscale-submesoscale interactions, eddies, upwelling filaments, eddy pumping, frontogenesis, Canary Islands, NW Africa upwelling
Citation: Hernández-Hernández N, Arístegui J, Montero MF, Velasco-Senovilla E, Baltar F, Marrero-Díaz Á, Martínez-Marrero A and Rodríguez-Santana Á (2020) Drivers of Plankton Distribution Across Mesoscale Eddies at Submesoscale Range. Front. Mar. Sci. 7:667. doi: 10.3389/fmars.2020.00667
Received: 08 January 2020; Accepted: 22 July 2020;
Published: 21 August 2020.
Edited by:
Malcolm McFarland, Florida Atlantic University, United StatesReviewed by:
Peter Strutton, University of Tasmania, AustraliaNestor Arandia-Gorostidi, Stanford University, United States
Copyright © 2020 Hernández-Hernández, Arístegui, Montero, Velasco-Senovilla, Baltar, Marrero-Díaz, Martínez-Marrero and Rodríguez-Santana. This is an open-access article distributed under the terms of the Creative Commons Attribution License (CC BY). The use, distribution or reproduction in other forums is permitted, provided the original author(s) and the copyright owner(s) are credited and that the original publication in this journal is cited, in accordance with accepted academic practice. No use, distribution or reproduction is permitted which does not comply with these terms.
*Correspondence: Javier Arístegui, amF2aWVyLmFyaXN0ZWd1aUB1bHBnYy5lcw==