 Viola Alms1,2*
 Matthias Wolff1
- 1Leibniz Centre for Tropical Marine Research, Department of Theoretical Ecology and Modelling, Bremen, Germany
- 2University of Bremen, Bremen, Germany
The Gulf of Nicoya is a large tropical estuary located on the Pacific coast of Costa Rica and accounts for the country’s main fish production. It is increasingly impacted not only by its fisheries, but also by urbanization, tourism developments, the input of pollutants from urban centers and agriculture activities in the catchment areas of large rivers entering the gulf. Similar to other coastal ecosystems, the gulf is particularly sensitive to short- and long-term changes in the climate, such as the precipitation rate, Sea Surface Temperature, wind speed and current regimes. While the gulf has been studied for decades, until now no attempt has been made to combine the analysis of the impacts of fishing and environmental changes on the ecosystem. By following a holistic approach that uses fisheries and environmental time series data from collaborative research and simulation models, this study aims at identifying the main drivers of the observed changes in the Gulf of Nicoya ecosystem. While the model simulations indicate that variations in the catch of some target species (e.g., cephalopods and shrimps) are mainly driven by the fisheries’ exploitation rates, several other species (e.g., corvina, snook, small pelagics, and crabs) are also substantially affected by climate variations, particularly during El Niño periods of high Sea Surface Temperature extremes and increased precipitation. During these periods, phytoplankton productivity and zooplankton biomass deceases with bottom–up effects on the entire food chain. Indicators of the environmental state of the system thus have to be considered along with regulations of the fishing pressure to form the basis for the development of appropriate management strategies.
Introduction
Ecosystem food webs change over time either due to changes in natural predator-prey interactions, resource limitations and anthropogenic influences, or due to environmental influences that cause changes in the distribution, growth performance or survival rate of the species. Fishing as a major anthropogenic impact factor additionally greatly affects the population size of target species, their prey and predators and may even damage the species habitats (Jennings and Kaiser, 1998; Frederiksen et al., 2006). Although overfishing is known to have caused the decline and collapse of many fish stocks around the world, it can also alter the sensitivity of the ecosystem to natural environmental variations and reduce the ability to buffer the effects of extreme natural events or future climate change (Hidalgo et al., 2011). At the same time, the limits overfishing of sustainability critical threshold for fishing can be affected by environmental changes (Neira et al., 2009). Fishing induced changes in the biomass that occur at one trophic level affect the trophic levels above and below that level, causing trophic cascades throughout the system (e.g., Duarte and Garcıa, 2004; Andersen and Pedersen, 2009). Ecosystems are driven by the combined effect of varied influencing factors, that have to be identified and examined to understand the dynamics of the system. To assess the particular role of small-scale and industrial fisheries within the ecosystem multiple factors need to be evaluated. The historical development of the operating fishing fleets, the different gear types and target species, as well as the temporal distribution of the fishing effort are all important factors that need to be considered for a holistic assessment of the Gulf of Nicoya ecosystem and its changes over time. We assume that the historical and ongoing removal of large numbers of small pelagic species and the existence of a variety of small demersal species should have most likely shaped the ecosystem over the last decades (Alms and Wolff, 2019). This process, together with the fisheries-induced substantial reduction of shrimp biomass over the last two decades, might be particularly relevant since it may have greatly reduced system biomass and productivity in low and mid trophic levels, reducing the energy basis for higher trophic levels of the gulf (Duarte and Garcıa, 2004). Our previous research on the Gulf of Nicoya ecosystem (Wolff et al., 1998; Alms and Wolff, 2019) allowed us to describe the energy flow structure and biomass changes that have occurred in the system over a period of two decades. We attributed an important role in causing these changes to fisheries and were able to show that phytoplankton and zooplankton largely control higher trophic levels groups, such as benthos, shrimps, and small pelagic fishes, suggesting that bottom–up control mechanisms are crucial to the system.
Since in such environments changes in abiotic factors due to climate variations may directly affect the primary productivity, we further examine these bottom–up effects in this study. Additionally, we aim at exploring the possibility of mixed trophic interactions or wasp-waist control mechanisms within intermediate trophic level species that exercise both bottom–up control on their predators and top–down control on their prey (Cury et al., 2000).
According to the Food and Agriculture Organization (FAO), most inter-annual fluctuations in fish production in the Eastern Central Pacific Ocean (Fishing Area 77) result from abundance changes in mid-trophic level pelagic fish. These fish often assume a central role in marine ecosystems and influence both higher and lower trophic levels (Frederiksen et al., 2006). Duarte and Garcıa (2004), however, point out that this “wasp-waist” role of small pelagic fish that has been proven for temperate and subtropical upwelling regions may not remain valid for tropical and therefore less productive upwelling areas, a statement we would like to analyze for the Gulf of Nicoya.
Previous studies prove that the El Niño-Southern Oscillation (ENSO) cycle occurring in the Eastern Tropical Pacific Ocean (ETP) causes periodic variations in several environmental parameters, which temporarily change the coastal marine environment and its species composition (Fiedler, 2002; Tam et al., 2008; Taylor et al., 2008b; Wolff et al., 2012). In the southern Humboldt and southern Benguela upwelling systems, environmental variations and trophic interactions were found to be more important than the fisheries in causing variations in species abundance (Shannon et al., 2008). Atmospheric pressure and Sea Surface Temperature (SST) are the main indicators of El Niño events (National Oceanic and Atmospheric Administration, 2020a), although rain fall, wind and current patterns may also change dramatically (Wolff, 2010). On average, the atmospheric pressure is low in the Western Tropical Pacific and relatively high in the Eastern Tropical Pacific. Here, sea level Sea Surface Temperature (SST) greatly rises during El Nino events, concurrently with changes in other climatic parameters, such as wind direction, wind speed and precipitation rates (Ji et al., 2015). In the entire ETP region, climate impacts of the ENSO cycle are perceptible and in Costa Rica, strong effects of the ENSO cycle have been observed in the Gulf of Nicoya as well as in the Golfo Dulce, the second important gulf system of the Costa Rican Pacific coast (Quesada-Alpízar and Morales-Ramírez, 2004).
During the particularly strong El Niño phase in 1997/98, as well as during the ENSO phase in 2009, changes in the structure of the phytoplankton and zooplankton communities have been observed (Brugnoli-Olivera and Morales-Ramírez, 2008). The phytoplankton and primary productivity decreased in these years and lower densities of diatoms and dinoflagellates were reported in the Gulf of Nicoya (Brugnoli-Olivera and Morales-Ramírez, 2008; Calvo Vargas et al., 2014). This reduction of low trophic level biomass and productivity is then usually followed by a reduction in biomass of plankton, fish and seabirds, leading to severe consequences for the regional fishing sector and coastal communities (Lizano and Alfaro, 2004; Wolff et al., 2012) as their catch of pelagic species, coastal demersal species, shrimp, squid and other marine organisms (FAO) is affected. For an effective implementation of an ecosystem-based fisheries management in the region it is crucial to understand the response of the ecosystem to different fisheries in place and to the environmental drivers as a whole. This is based on the understanding of the biomass flows through the food web, starting at the lowest trophic level (Brugnoli-Olivera and Morales-Ramírez, 2008; Tam et al., 2008).
Accordingly, we used a routine adapted to specific time series using fisheries and environmental data for a period from 1995 to 2014 to elucidate the role of the fishing effort and abiotic factors in explaining observed changes. For this purpose, we used the open-source software Ecopath with Ecosim (EwE) and applied a hypothesis-based model fitting procedure, for which we considered time series of both inter-annual changes in fishing effort and fleet composition as well as the most relevant environmental factors (Sea Level Pressure, Sea Surface Temperature, Chlorophyll-a concentrations, wind direction and speed, precipitation rates, particulate inorganic and organic carbon concentrations and photosynthetically active radiation). A central question examined in our study is whether the observed system changes were driven by the exploitation patterns of fisheries or/and by environmental changes. The basis for this analysis was provided by two EwE “snapshot models” of the Gulf of Nicoya ecosystem for the years 1995 (Wolff et al., 1998) and 2015 (Alms and Wolff, 2019). We consider the identification of main drivers behind the observed changes as crucial requisites for the selection of appropriate management and conservation strategies of the gulf. Therefore, on the basis of the present research, future measures can be taken to sustainably improve the habitat of the Gulf of Nicoya.
Materials and Methods
Description of the Study Site
The Gulf of Nicoya (10°N, 85°W) is an estuary influenced by the tides on the northwest Pacific coast of Costa Rica (Figure 1). The mangrove-fringed gulf extends from the mouth of the Tempisque River to the Pacific Ocean, with an area of 1530 km2. It is of considerable ecological importance due to its function as a feeding, reproduction and nursing site for many species, such as shrimps, sharks, small pelagic fish and seabirds. Due to its high productivity, the estuary is the country’s principal fishing ground for the artisanal fishing fleet on the one hand (Vargas, 1995) and for the semi-industrial fishing fleets on the other hand. In the inner shallow part of the Gulf of Nicoya, the small-scale artisanal fishing sector is of major economic and social importance (Trujillo et al., 2012; Lozano and Heinen, 2016). More than 20 coastal communities around the Gulf of Nicoya depend on the artisanal fishing sector, with rare options for alternative livelihoods (Proyecto Golfos, 2013).
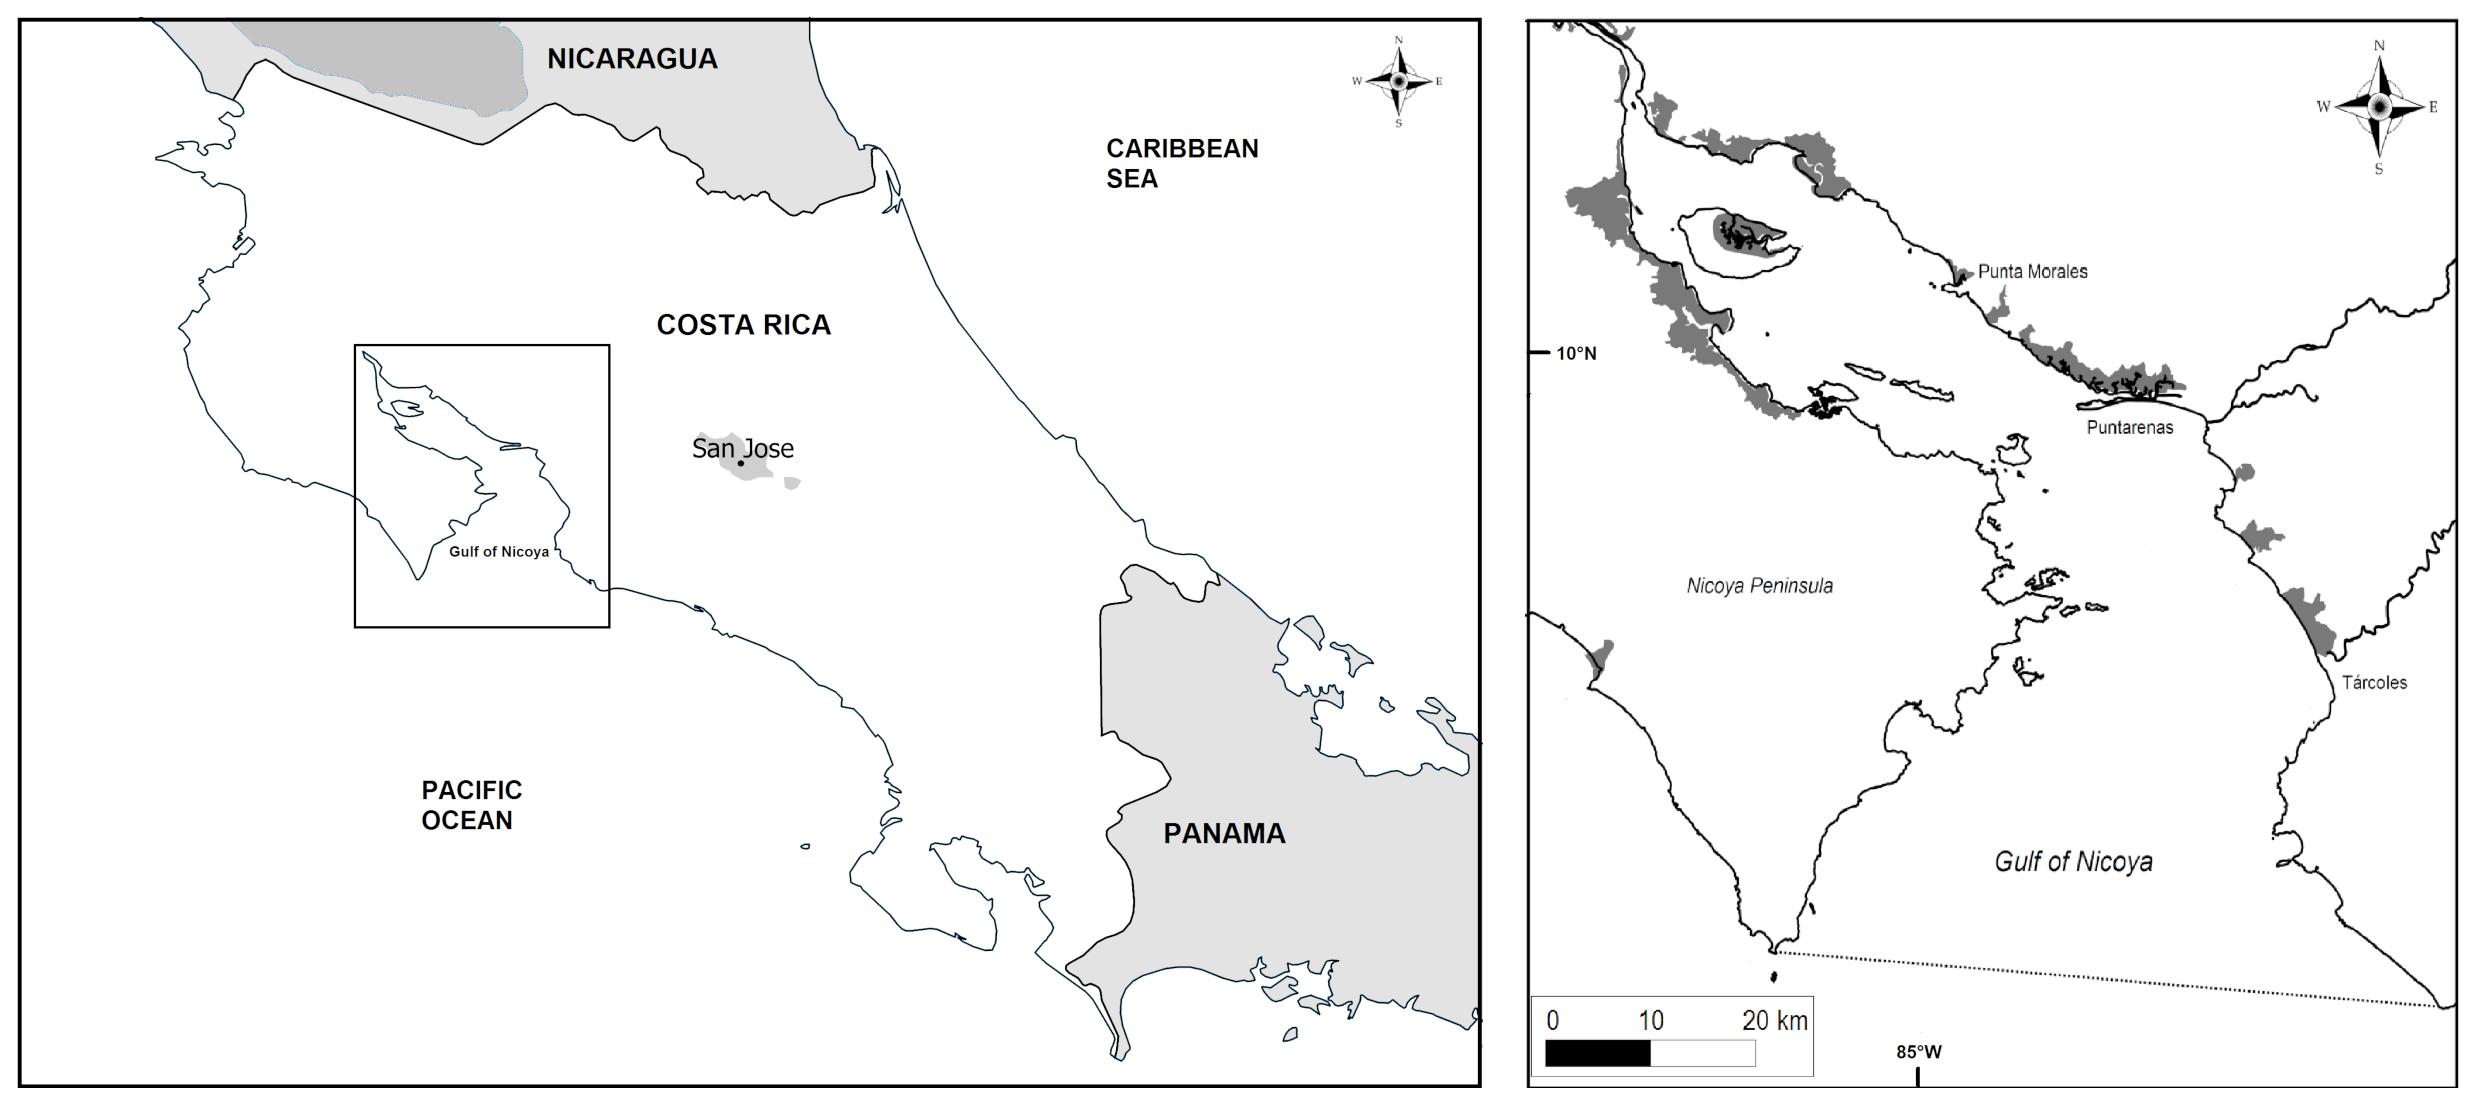
Figure 1. Maps of the study area (Gulf of Nicoya, Costa Rica), modified from Alms and Wolff (2019).
Fisheries and Time-Series Data Used
The Gulf of Nicoya is the country’s main fishing ground. The present research is based on fisheries data of the artisanal and semi-industrial fishing sector.
Four artisanal fishing fleets with approximately 2000 licensed fishermen operate in the gulf with different boat sizes and gear types that target a variety of demersal and coastal species (BIOMARCC-SINAC-GIZ, 2013). Gillnets are prominently used and its usage further increased in the 2010s (Sánchez-Jiménez et al., 2019). Fishermen use small motorized boats (pangas). Catches are diverse but dominated by drums (Perciformes: Sciaenidae), catfishes (Siluriformes: Ariidae), snooks (Perciformes:Centropomidae), and different penaeid shrimp species. The line fleet uses bottom longlines and drifting longlines and operate bigger motorized boats (lanchas). Target species are sharks, barracuda, comber and others. Smaller non-motorized boats fish for drums, croakers and snook, using handlines in the inner shallow part of the gulf. Manual mollusk extraction is mostly carried out by the women of the coastal communities, combined with the manual trap fisheries targeting different crustaceans. The artisanal fleet provides around 55% of the total catch in the Gulf of Nicoya (in 2013).
Additionally, two semi-industrial fishing fleets operate in the gulf: shrimp trawlers and sardine purse-seiners. The purse seine vessels target small pelagic fish species in the intermediate and outer zones of the Gulf of Nicoya. The bottom trawl fleet targets several shrimp species, mostly in the outer gulf, however the capture of bycatch species drastically exceeds the shrimp catches.
Artisanal fisheries landing data of the Gulf of Nicoya on the one hand was obtained from the Costa Rican national landing statistics registered by the Instituto Costarricense de Pesca y Acuicultura (INCOPESCA). The time series data collected from 1994 to 2014 consists of monthly records of the main target species and groups (fish and invertebrates) fished and landed inside the Gulf of Nicoya, measured in kg. The catches were organized by fishing fleet and gear. The monthly catch data was then converted into tons per square kilometer of the entire area (1530 km2) per year. Fishing effort time series data were added to the model to realistically simulate changes in the fishing pressure over the last 20 years (1994–2014). Fishing effort data (days fishing and number of fishing trips) per fleet is available for the years prior to 2005. Thereafter, only combined fishing effort was available for both the artisanal and semi-industrial fleets. We then divided this effort for the artisanal and semi-industrial fleets using percentages estimated from previous years and current information about recent developments in the fishing fleets and fishing zones (INCOPESCA). Biomass estimates of all target groups were entered for the beginning and for the endpoint of the simulations (1993 and 2013) from the EwE reference models presented in Alms and Wolff (2019).
Environmental Forcing Functions
In order to account for possible environmental impacts on the different model compartments, time series data derived from satellite images were used for the simulations. The data was taken from the Sea-viewing Wide Field-of-view Sensor (SeaWIFS) project and the Moderate Resolution Imaging Spectroradiometer (MODIS) provided by the NASA (NASA Ocean Color). As a first approach to find significant environmental drivers, the most common marine climate factors were tested, i.e., daytime and night-time Sea Surface Temperature (°C), sea surface salinity (ppt), zonal wind speed (m s –1) and direction, tropical easterly trade wind speed (m s–1), and precipitation rates (mm). Additionally, specific ENSO related parameters were used, i.e., Eastern Equatorial Pacific Sea Level Pressure, SST in El Niño regions 1 + 2 and 3, 3.4 and 4 (National Oceanic and Atmospheric Administration, 2020a), as well as proxies for primary productivity, such as Chlorophyll a (Chla) concentrations (mg m–3), photosynthetically active radiation (Einstein m–2 day–1), dissolved organic matter (mg m–3), particulate organic matter (mg m–3) and high colored dissolved organic matter. The time series data were standardized by scaling the values to the (0.5,1.5) range, according to the following formula:
whereas each time series value x was scaled according to the new maximum: max’ = 1.5 and new minimum value min’ = 0.5.
Hypothesis Testing and Model Selection
The EwE time series fitting routine was used to identify the model that matches the variation in the abundance of the functional groups with the historical catch time series data of the Gulf of Nicoya. For the choice of model procedure forcing data is needed to trace the biomass changes of the model compartments over time and reference data is necessary for comparison and validation of the models. In conclusion, three essential classes of ecosystem drivers were tested: anthropogenic factors (fishing, pollution), trophic control mechanisms (interactions) and the influence of the chemical and physical environment (climate).
Fishing effort (days fishing) and environmental time series data of the environmental parameters mentioned above were used to force model group catches and biomasses over time, whereas the recorded historic landings served as (observational) reference data for the catch. The effect of the forcing data on the goodness of model fit could then be observed in the resulting biomass and catch estimates. We used the predicted variations of environmental factors in the ETP related to future climate change as given by the IPCC (IPCC, 2007) and selected the predictions for South and Central America (Latin America) for two emission scenarios, namely the representative concentration pathways RCP4.5 (radiative forcing of 4.5 W m–2 by 2100) and RCP8.5 (radiative forcing > 8.5 W m–2 by 2100).
The vulnerability settings in the model represent the assumed trophic control mechanisms between functional groups (later trophic effects). While vulnerabilities can be set between 1 and 100, 2 is used as the default setting. At a low vulnerability setting (close to 1) an increasing predator biomass does not cause a substantial increase in the predation mortality of the prey (bottom–up control). On the contrary, at high vulnerability values (up to 100) an increasing predator biomass causes a similar increase in the predation mortality of the prey (top–down control). In the time series routine, the EwE software modifies the vulnerability parameter of the predator groups from its default 2 to find the setting which reduces the sum of square difference between the predicted and the observed data (Scott et al., 2016). The Stepwise Fitting Procedure for automated fitting as described by Scott et al. (2016) was used, allowing to test a high number of settings to find the best fit model. The routine tested for the most sensitive predator and predator-prey interactions. The search for vulnerability parameters set for the predator columns of the model resulted in better outcomes than by each prey/predator cell, thus only these results will be presented in the following. For the model fitting procedure 22 time series were used as a reference, thus a maximum of 22-1 = 21 vulnerability parameters were estimated. In the same manner, primary productivity (PP) anomalies can be estimated by the software. The software searches for an anomaly PP function to simulate potential bottom–up control mechanisms on the ecosystem. The time series data contained 19 years, thus 2–19 spline points could be calculated (Scott et al., 2016). For the model time series fitting procedure, the best practice is to use statistical hypotheses testing (Mackinson et al., 2009; Scott et al., 2016) that is based on ecological knowledge. Table 1 summarizes the scenarios selected. In general terms it was hypothesized that temporal changes in primary productivity due to regional oscillations in environmental conditions on one hand, and fishery induced changes in the trophic control of the food web on the other hand (through changes in the relative biomass contribution of the different fishing target species) both might have contributed to the observed temporal variation in the volume and composition of the catch.
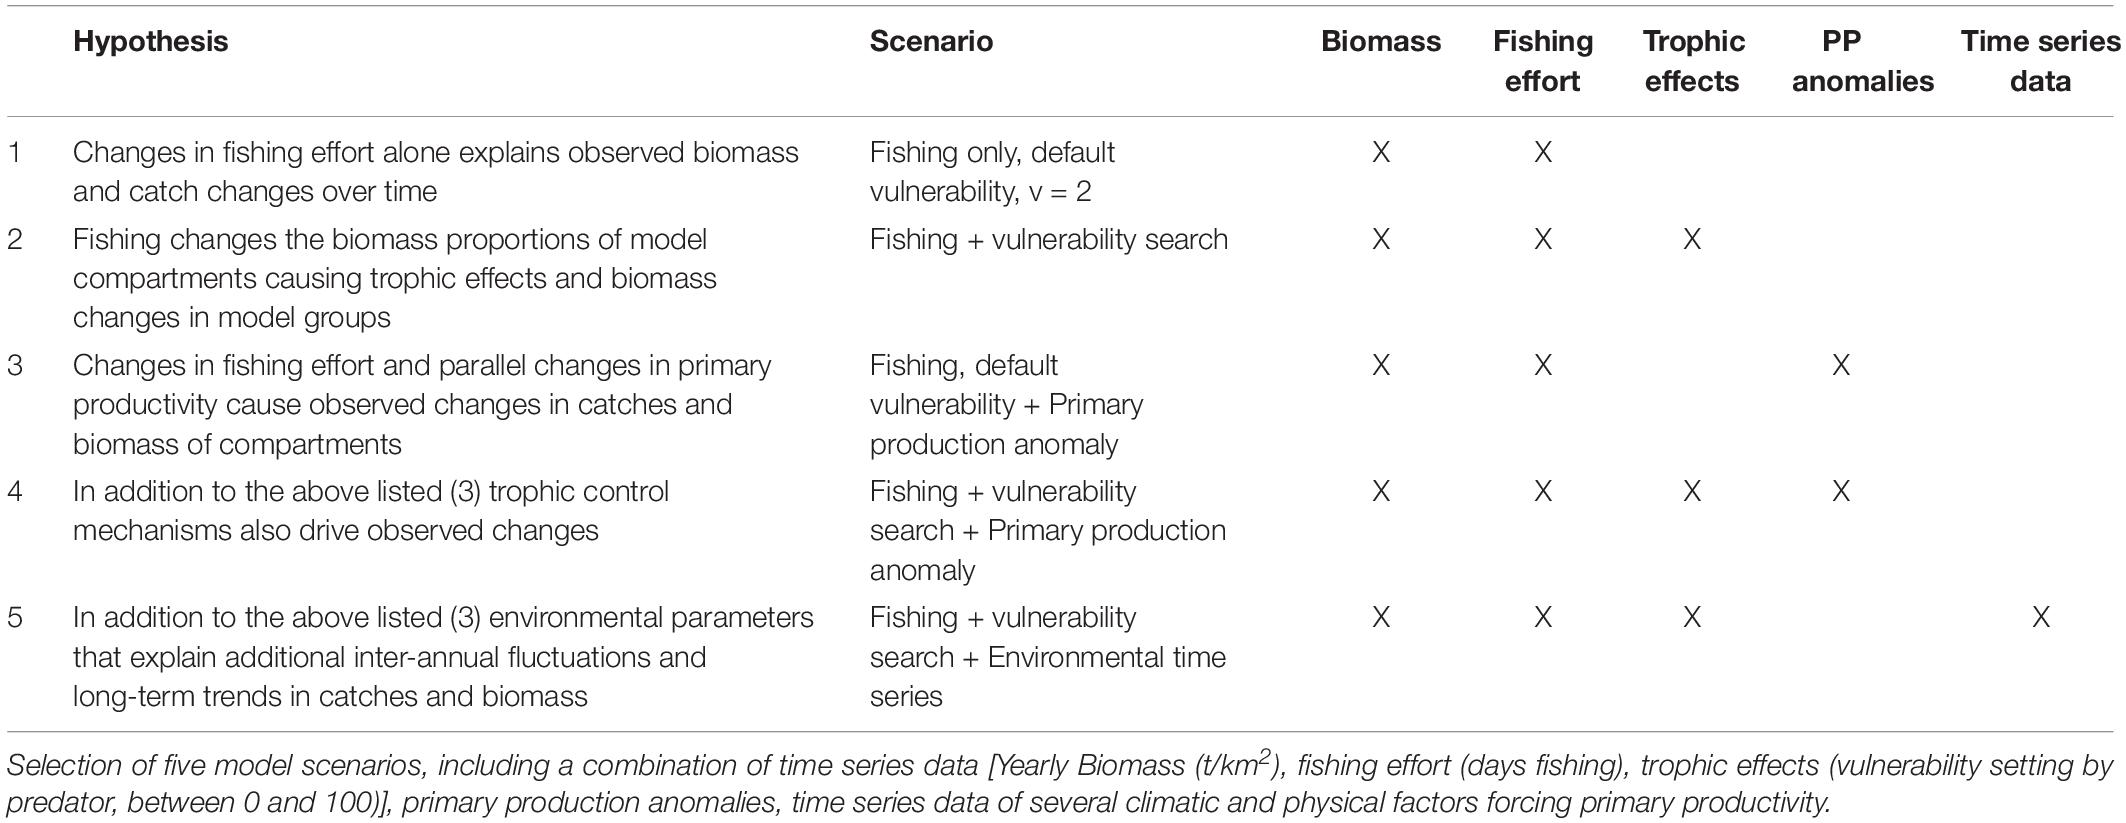
Table 1. Hypothesis-based model fitting.
The most representative model was selected based on the calculated sum of squares and the Akaike information criterion as an output of the Ecosim routine (AIC). The AIC was calculated as follows:
Here, n is the number of observations (data points) being fitted and k is the number of parameters estimated (kmax = number of time series - 1), SS is the sum of square residuals and minSS is the calculated sum of squares.
To prevent overfitting and to select the most parsimonious model for the given data, the AIC is a good indicator to use, as it includes penalties for increasing the number of adjusted parameters. The AIC assumes that all data points are independent. Since this is not always the case with fisheries data, a conservative approach was chosen and the number of parameters (k – 1) was based on the number of time series instead of single data points. For small sample sizes it is recommended to use the AIC corrected for small sample sizes (AICc) and since the AICc converges to AIC as n increases, the AICc can be employed regardless of the sample size (Burnham and Anderson, 2004). The AICc is derived from the AIC as follows:
According to the protocol created by Burnham and Anderson, 2004, several additional measures associated with the AIC were calculated to improve model comparison:
The relative difference (Δi) in AICc compared to the best model (AICcmin)
the relative likelihood of the model having the best fit
and the Akaike weights (Wi):
where wi is a measure of the strength of evidence for each model, indicating the probability that the model is the most accurate one among the set of possible models.
The models were ranked by AICc and their relative difference was compared to the minimum AIC. In general, the model was selected that provided the lowest (most negative) AICc value, and models with fewer parameters were favored. However, to select the most representative model that conveniently explains variations in the data, several approaches can be followed. In this case, all models with an AIC difference Δi < 2 compared to the best model were considered. The favored models were selected based on the SS decreases, the number of estimated variables and the ability of the model to explain variations in the historical catch data. In order to compare the trends of the observed and predicted values, the data were visualized (see Figure 5). To validate the selection of the model, the model’s functional groups and their data availability (catch and effort data) were taken into account.
Uncertainty and Sensitivity Analysis
In order to examine the sensitivity of the results with regard to uncertainty of the input parameter values, Monte Carlo simulations were run for each scenario. Each trial (number of trials = 100) represents an Ecosim run with a randomly selected set of Ecopath parameters (B, P/B, EE, BA) for each group, within a distribution centered around the original values. The coefficient of variation of each parameter was selected according to the certainty of the input data set in the pedigree, defined by the quality of the data from estimates from low to high precision sampling (Heymans et al., 2016). The predicted biomass trajectories and the sum of squares of the best iteration runs were compared to the initial input data to detect changes in model behavior due to changes in the input data (Travers et al., 2010). These steps ensure an analysis of the data that is considerably less sensitive to errors.
Results
Fisheries Data
Trends in the fishing effort and catch per unit effort of the artisanal and semi-industrial fleets are displayed in Figure 2.
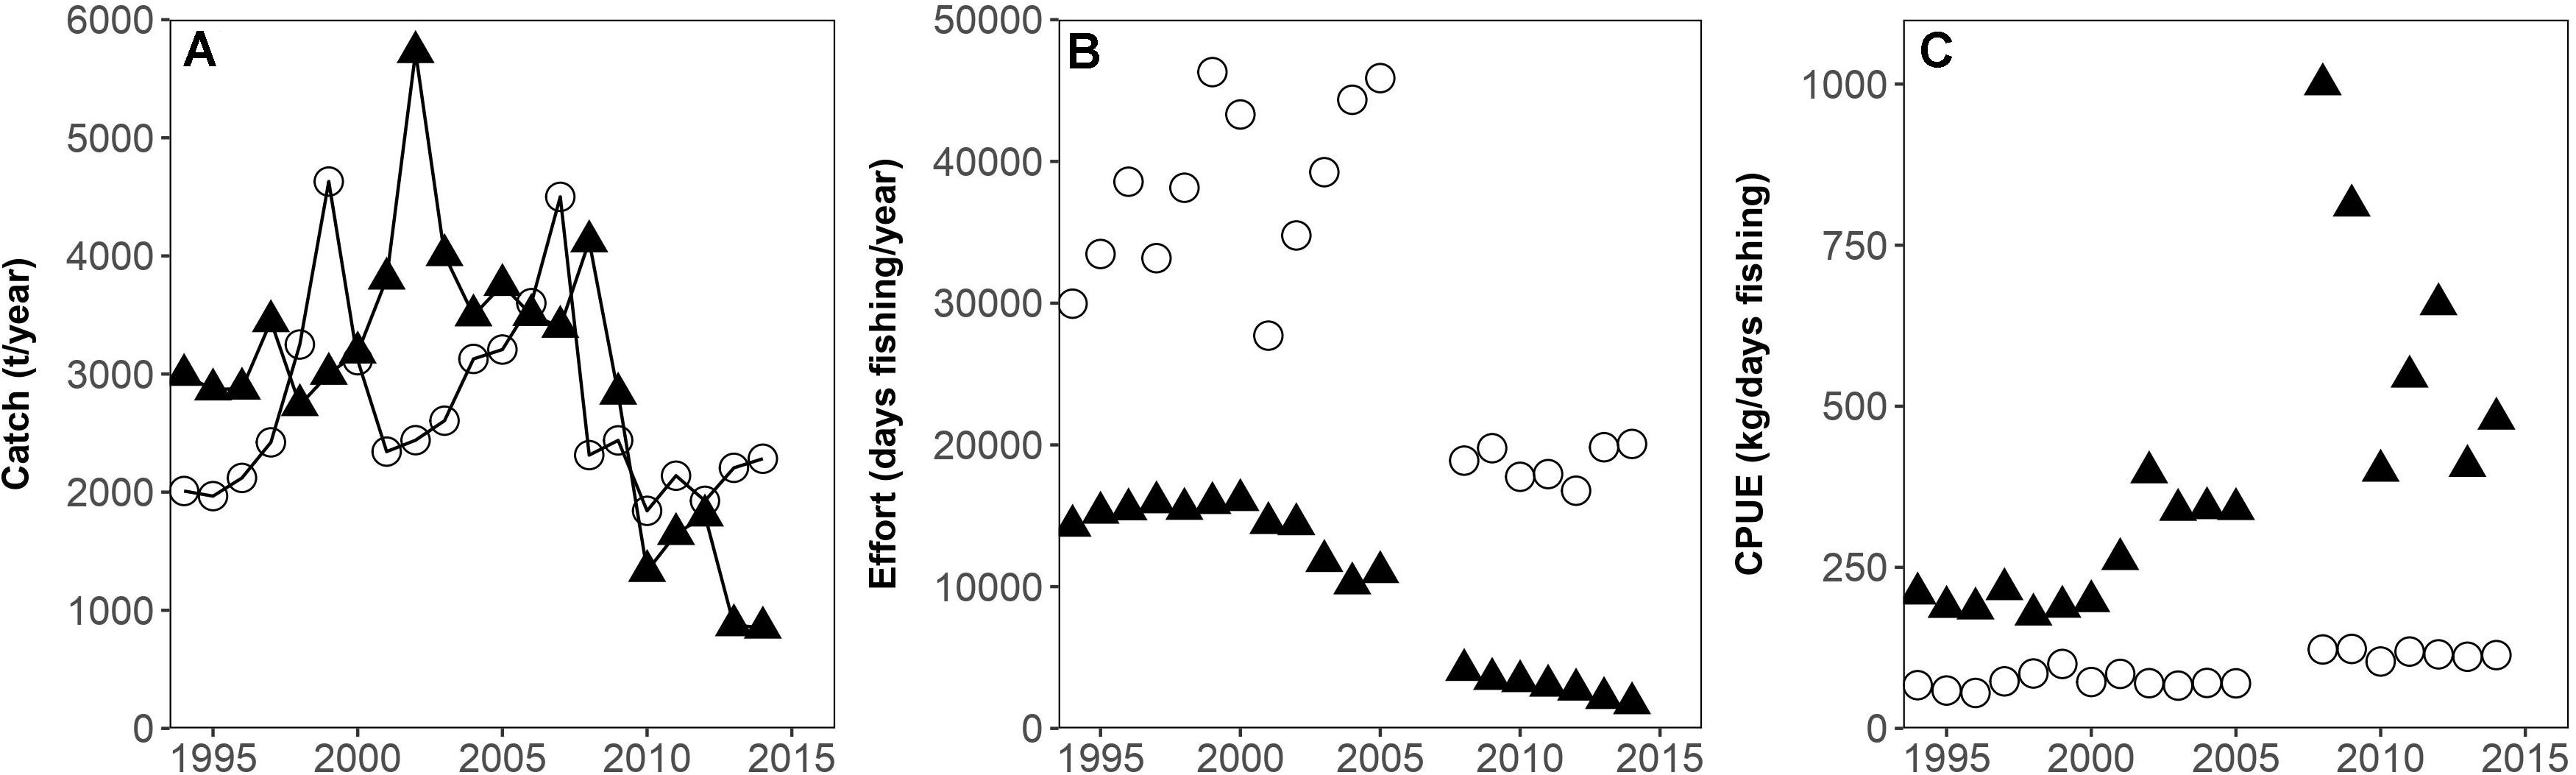
Figure 2. (A) Semi-industrial (filled triangles) and artisanal (circles) catches (t/year), (B) Semi-industrial (filled triangles) and artisanal (circles) fishing effort (days fishing/year), (C) Semi-industrial (filled triangles) and artisanal (circles) Catch per unit effort (CPUE) (kg/day fishing) for the years 1994–2014 (missing effort data 2006 and 2007) in the Gulf of Nicoya (Costa Rica).
It can be observed that the semi-industrial fishing effort increased until 2000, followed by a slight decline in the early 2000s and a further drastic decline after 2006 and 2007, resulting in an effort reduction of 65% in total. The artisanal fishing effort remained high until 2005, with some variations, and then declined drastically. Recent levels of fishing effort are reduced by 55% compared to 2005; also due to the seasonal fishing ban “veda” that lasts 3 months.
A peak of artisanal catches can be observed in the late 1990s, followed by decreasing catches.
Ecosim Simulations
The EwE time series simulations of the last two decades indicated that the fishing effort explains a large part of the variability in the catch and biomass data of some functional groups (Figure 2). The semi-industrial fleet’s effort improves the model of the target species shrimp and sardine, as well as of small demersal fish and crabs as bycatch species of the shrimp trawl fleet.
Since not all trends in the catch data can be explained by variations in the fishing effort of different fleets, the possible role of trophic effects was taken into account and the vulnerability settings of 11 different predator groups were changed from its default to simulate top–down and bottom–up effects (Table 2). This allowed for further improvement of the model fit and a reduction of the SS.
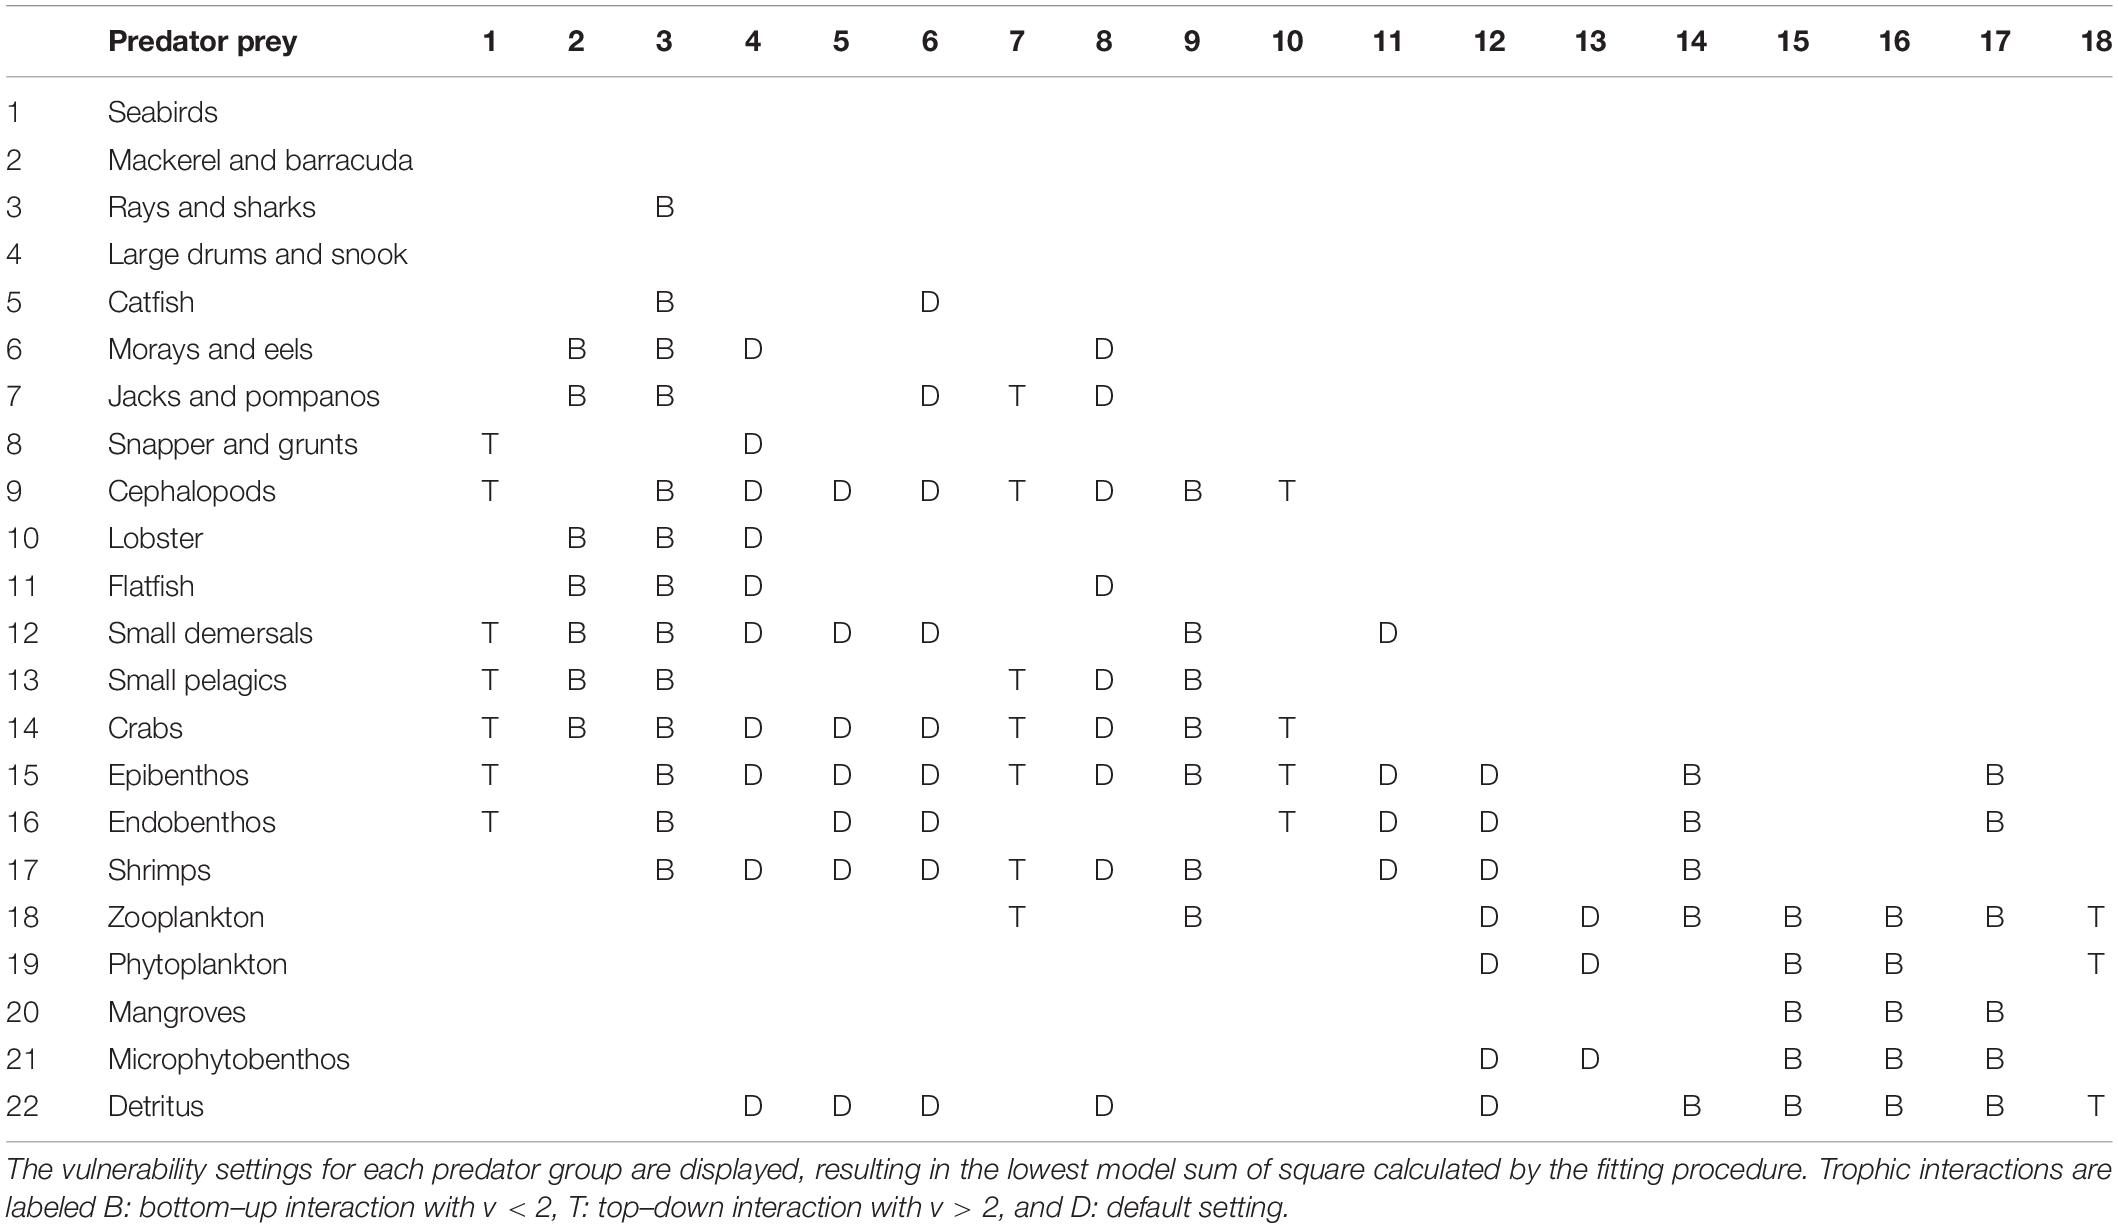
Table 2. Prey-predator interactions in the Gulf of Nicoya Model (scenario 2).
The assessment of the prey-predator interactions in the model of the Gulf of Nicoya provides important information on the food web structure of the system. The most representative vulnerability settings are displayed for each predator group, whereas bottom–up (B), top–down (T) interactions are indicated in Table 2. The top predatory fish species in the system, mackerel and barracuda as well as rays, sharks and cephalopods, are bottom–up controlled as well as the lower trophic level species, such as benthos, shrimps, and crabs. According to the modeling results, only few species exert top–down control on their prey, such as jacks and pompanos, lobster, seabirds and zooplankton. Mid-trophic-level species, small pelagics and small demersals are assumed to exert mixed control on their prey and predators.
Furthermore, some of the functional groups seemed to be further affected by inter-annual production anomalies. The consideration of these anomalies (scenarios 3 and 4) further improved the model (Figure 3). The best model was obtained by adjusting the trophic interactions and adding environmental forcing data (Scenario 5) related to changes in primary productivity. Moreover, adding Chla time series to the model, a proxy for the available amount of phytoplankton in the system, improved the model substantially. Together with changes in the vulnerability settings of 10 groups, the model (sum of squares) improved by as much as 69% (and showed the lowest AICc). Table 3 gives an additional overview of the factors that improve the model of each functional group.
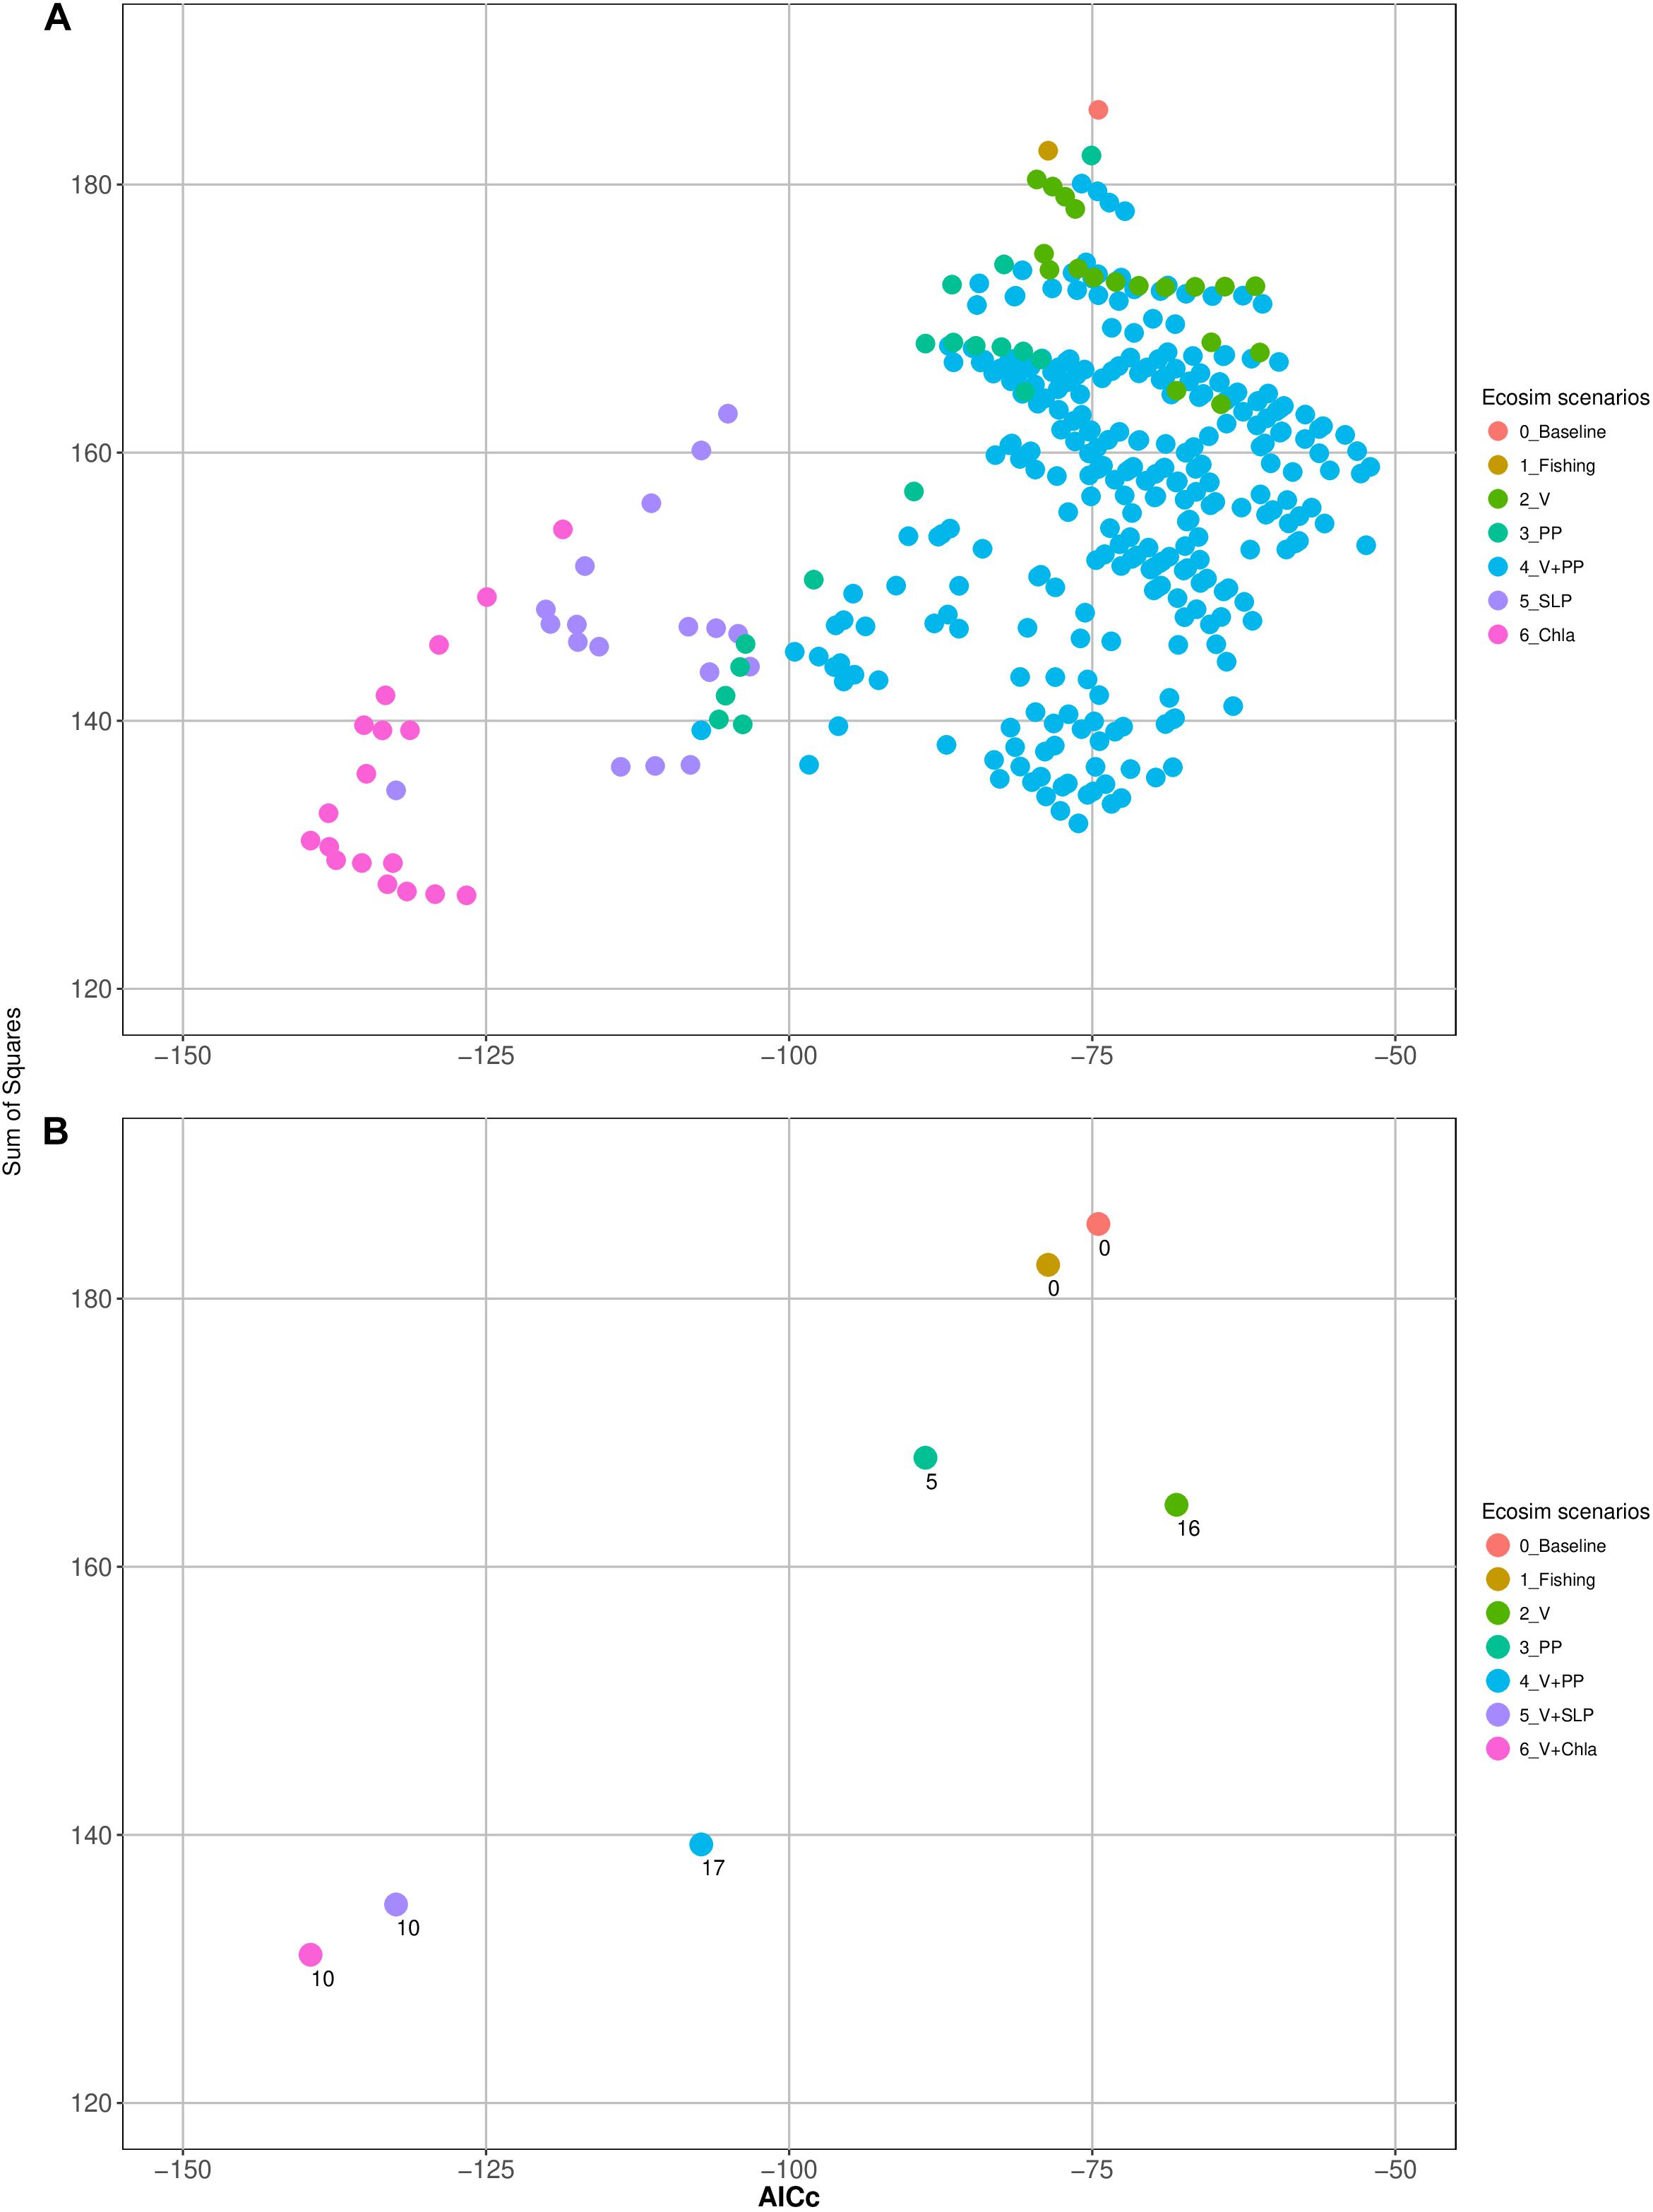
Figure 3. (A) Sum of squares and the corrected Akaike information criterion (AICc) of all tested models of each scenario and (B) number of estimated parameters (vulnerabilities and or spline points of primary production anomalies) of the ‘best models’ of each scenario.
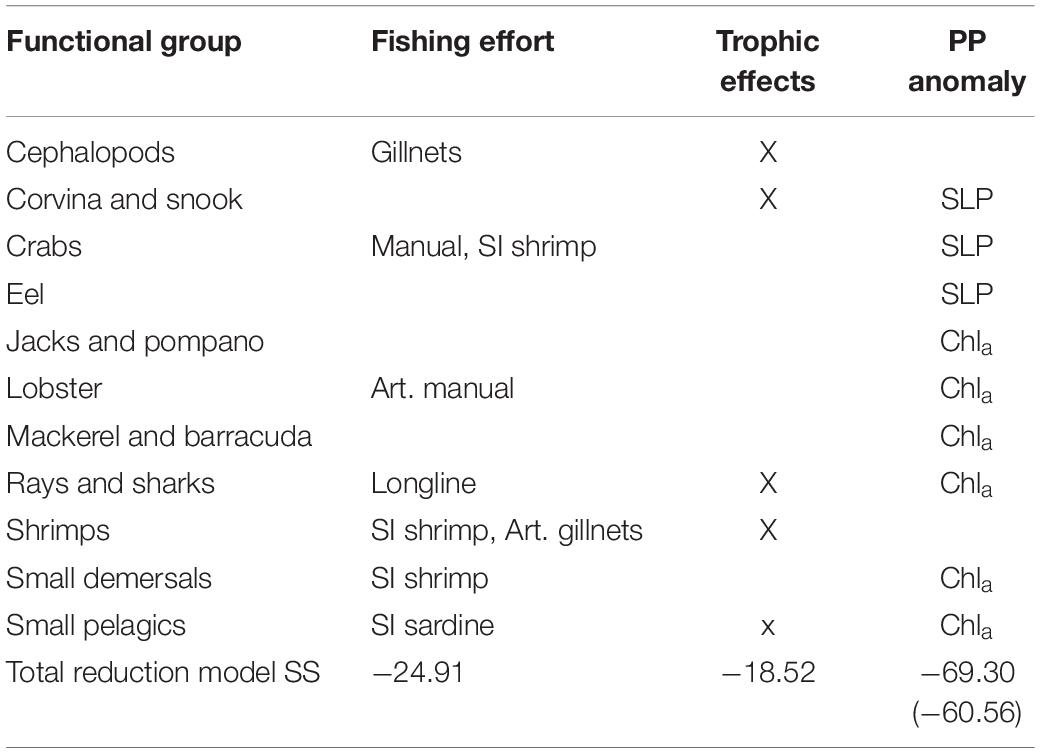
Table 3. Catch time series: factors [fleet effort, trophic effects, primary production anomalies: Sea Level Pressure (SLP) and Chlorophyll a] that improve the model (reduce the sum of squares) of each functional group and the total improvement of the sum of squares for all groups for each factor analyzed.
The variations of the physical environment in the Gulf of Nicoya linked to the ENSO cycle were represented in the model by the Eastern Equatorial Sea Level Pressure (SLP) time series, leading to substantial improvement of the model. Changing the vulnerability setting of once again 10 groups resulted in the most representative model and a 60% reduction of the SS (as well as low AICc values) (Figure 3).
Figure 4 elucidates the relation between phytoplankton productivity (Chla as proxy), the SLP and the ENSO cycle. This shows that there is a negative relationship between the East Equatorial Sea Level Pressure and the El Niño phenomenon. El Niño years are associated with negative anomalies in Sea Level Pressure (SLP), e.g., in the years 2002 and 2009. A pronounced positive peak in the SLP in 1999 can be associated with a strong La Niña event, the counterpart of El Niño. Positive SST anomalies occur during episodes of El Niño (e.g., 2002, 2009). Maximum Chla concentrations coincide with La Niña episodes (2005, 2012).
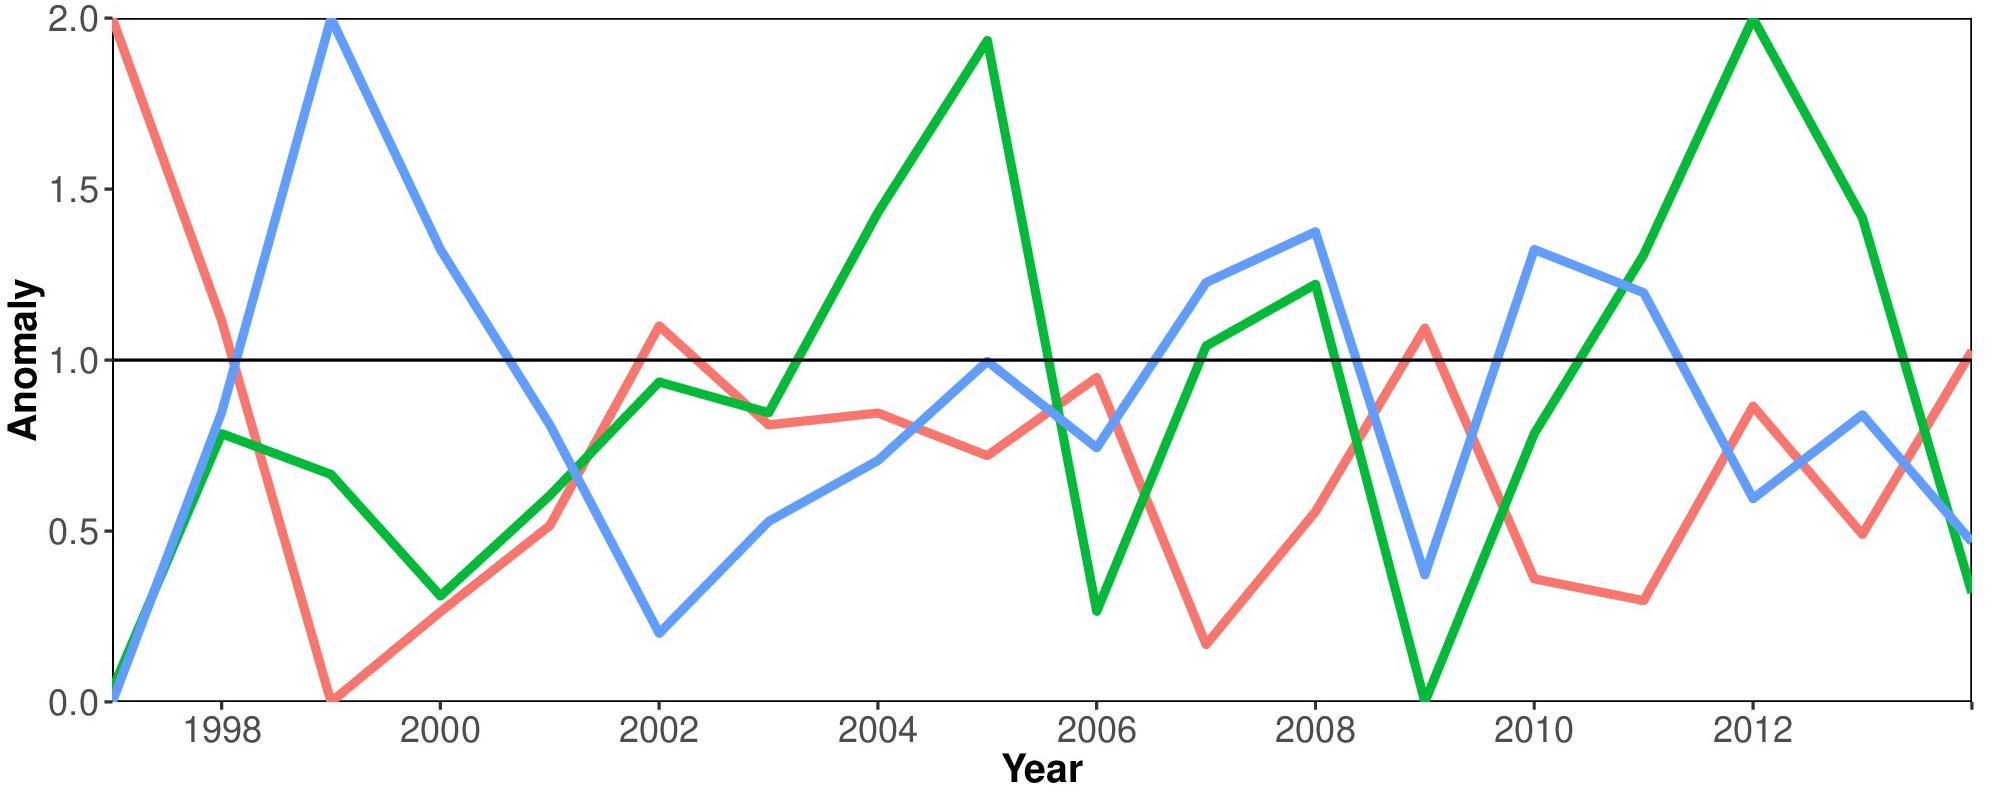
Figure 4. Environmental time series 1997–2014: anomalies of Sea Surface Temperature (SST) (red line), Chlorophyll a concentration (green line) and the Sea Level Pressure (blue line) in the Equatorial Eastern Pacific Ocean associated with the El Niño-Southern Oscillation cycle.
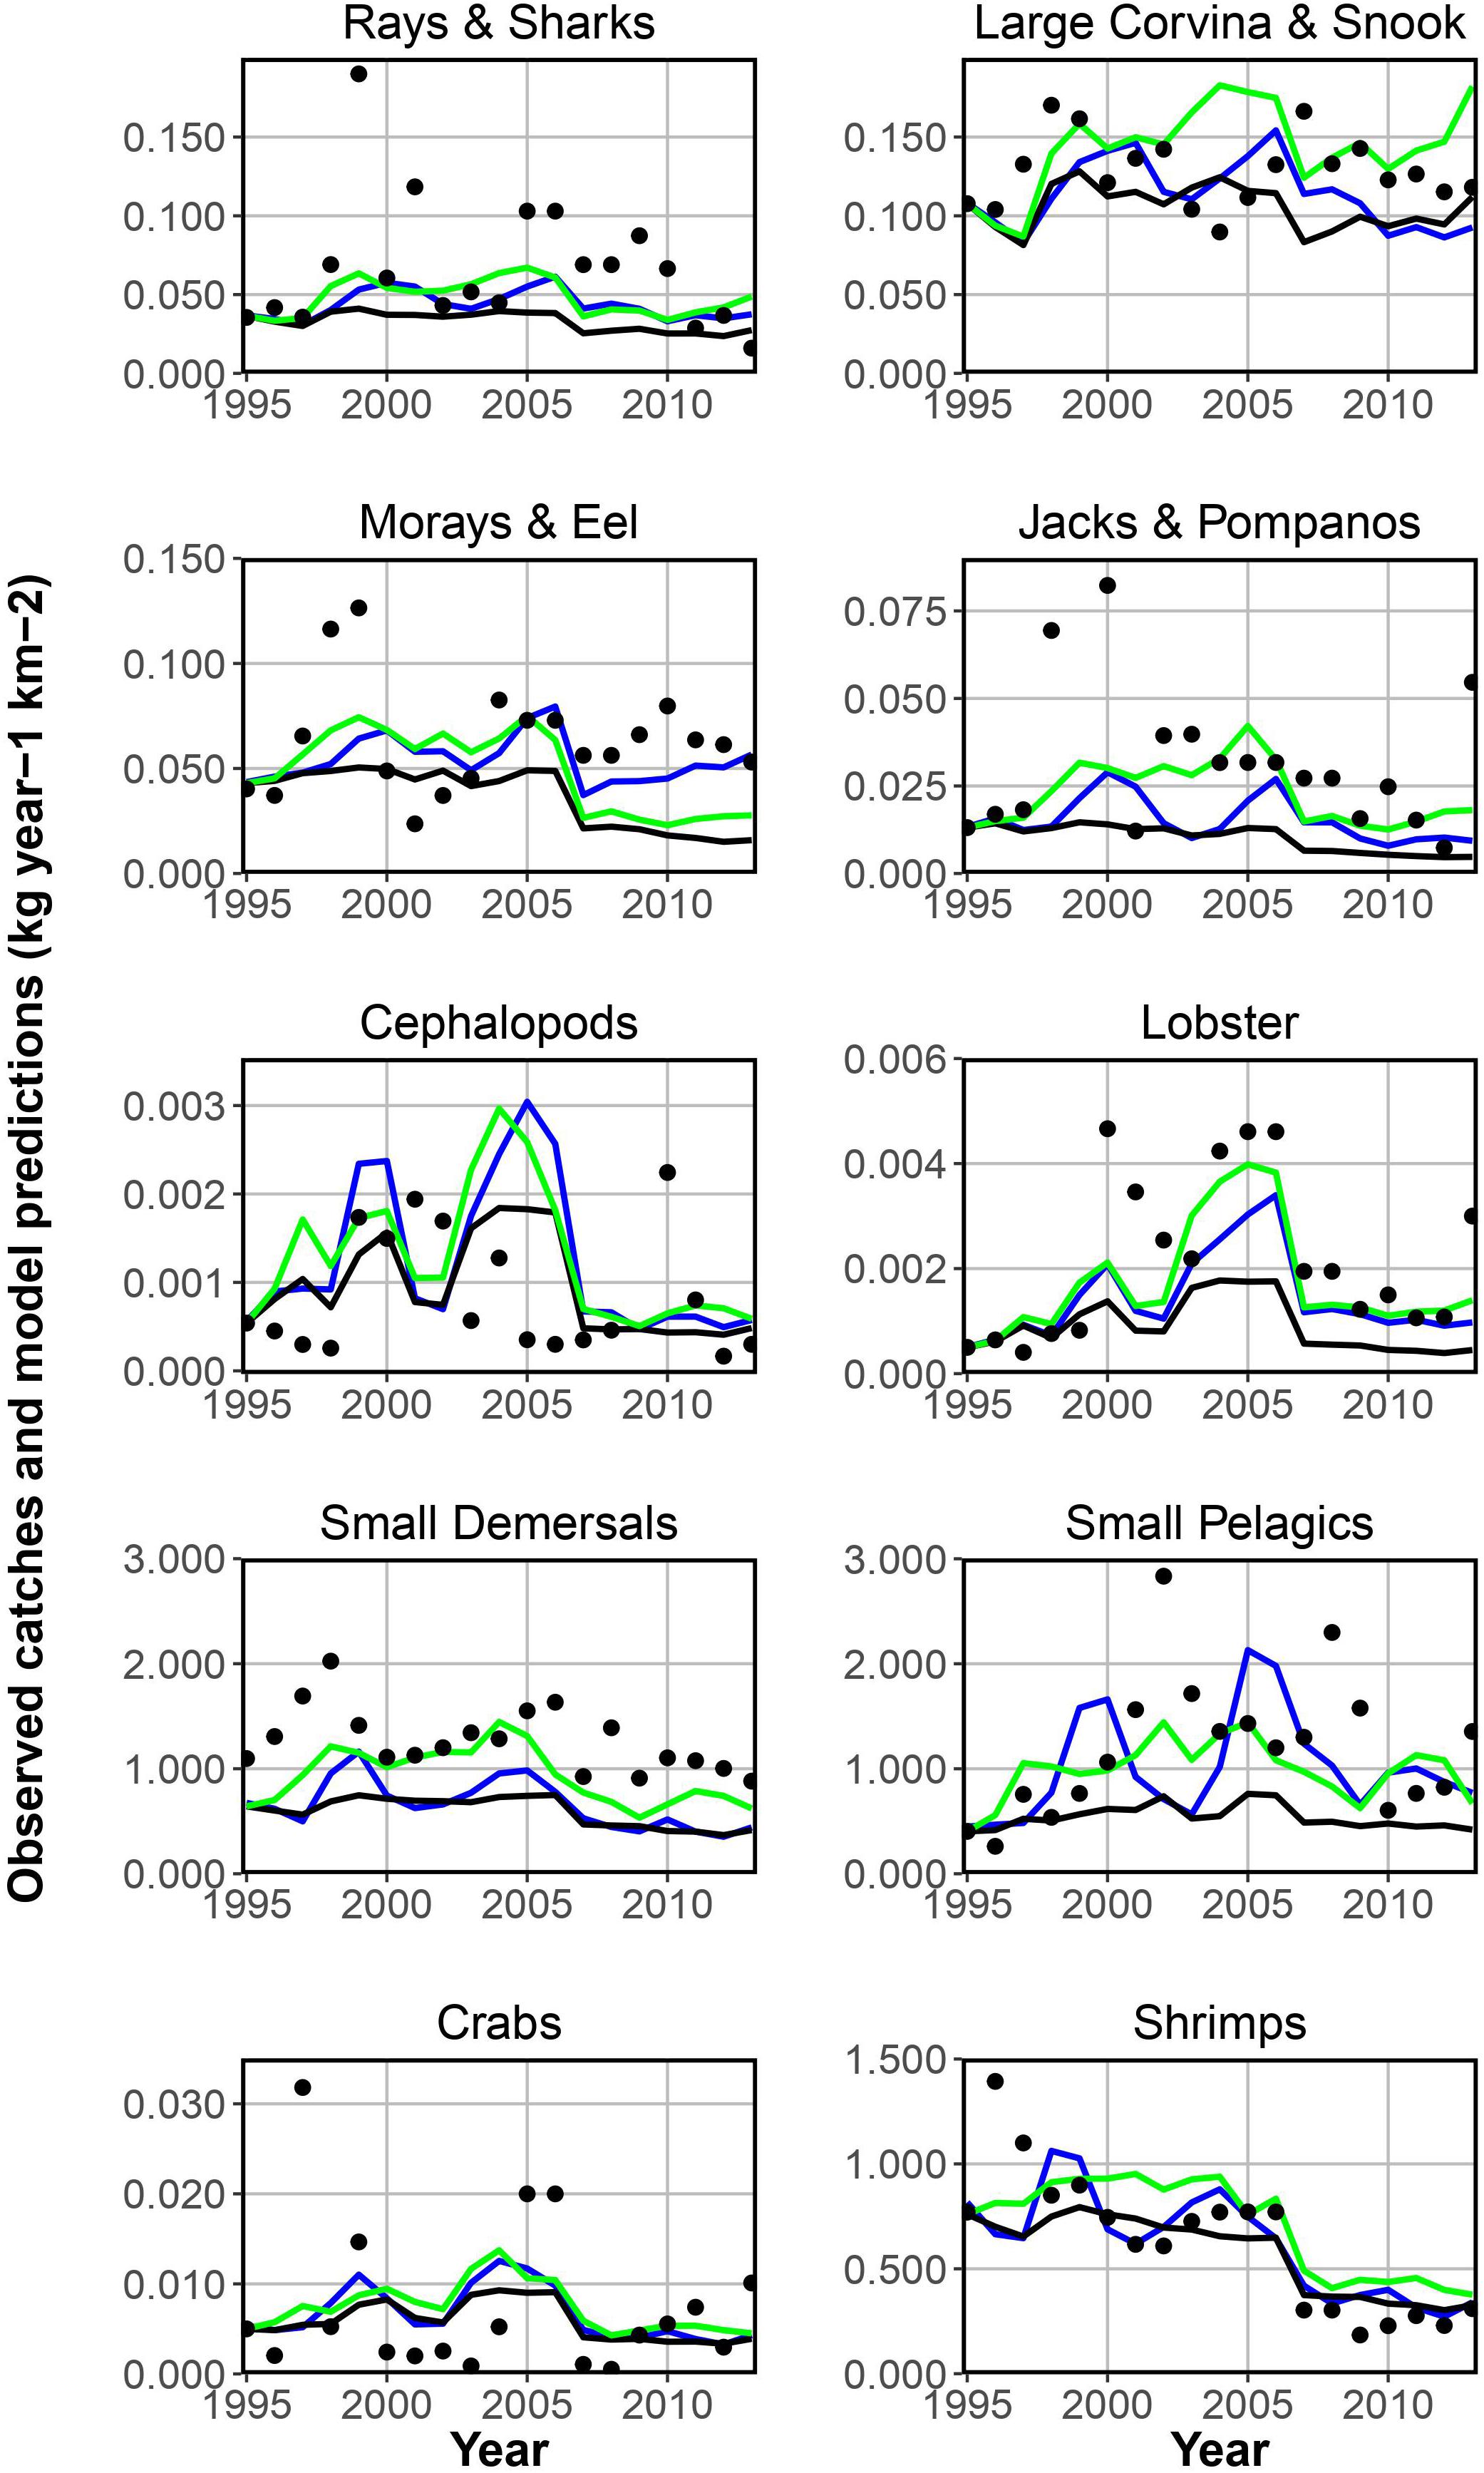
Figure 5. Yearly catches (filled circles) and model predictions for the simulated EwE scenarios: fishing effort (black line); fishing effort, trophic effects and Sea Level Pressure forcing phytoplankton productivity (blue line); fishing effort, trophic effects and Chlorophyll a concentrations forcing phytoplankton productivity (green line).
In Figure 5 the two Ecosim model scenarios and the baseline scenario are presented together with the catch reference time series-data for the 10 selected functional groups. The baseline scenario includes solely the fishing effort and the two best fitted scenarios include either Sea Level Pressure or Chla concentrations. Both time series can be used seperately to force phytoplankton productivity, improving the overall model fit. For several functional groups the model’s predictions of the catch are relatively close to the observational data. Especially for important target groups (shrimps and small pelagics) the model can predict changes in the catches. For some other groups, such as rays and sharks, catches for some years are above or below the predicted values. The results show that some functional groups (e.g., lobster, small demersals, small pelagics, and shrimps) are more affected by the environmental factors than others and can be predicted best by scenarios including phytoplankton forcing. Table 4 provides the related sum of square (residual sum of squares, regression sum of squares and total sum of squares) values for each target group and scenario presented in Figure 5.
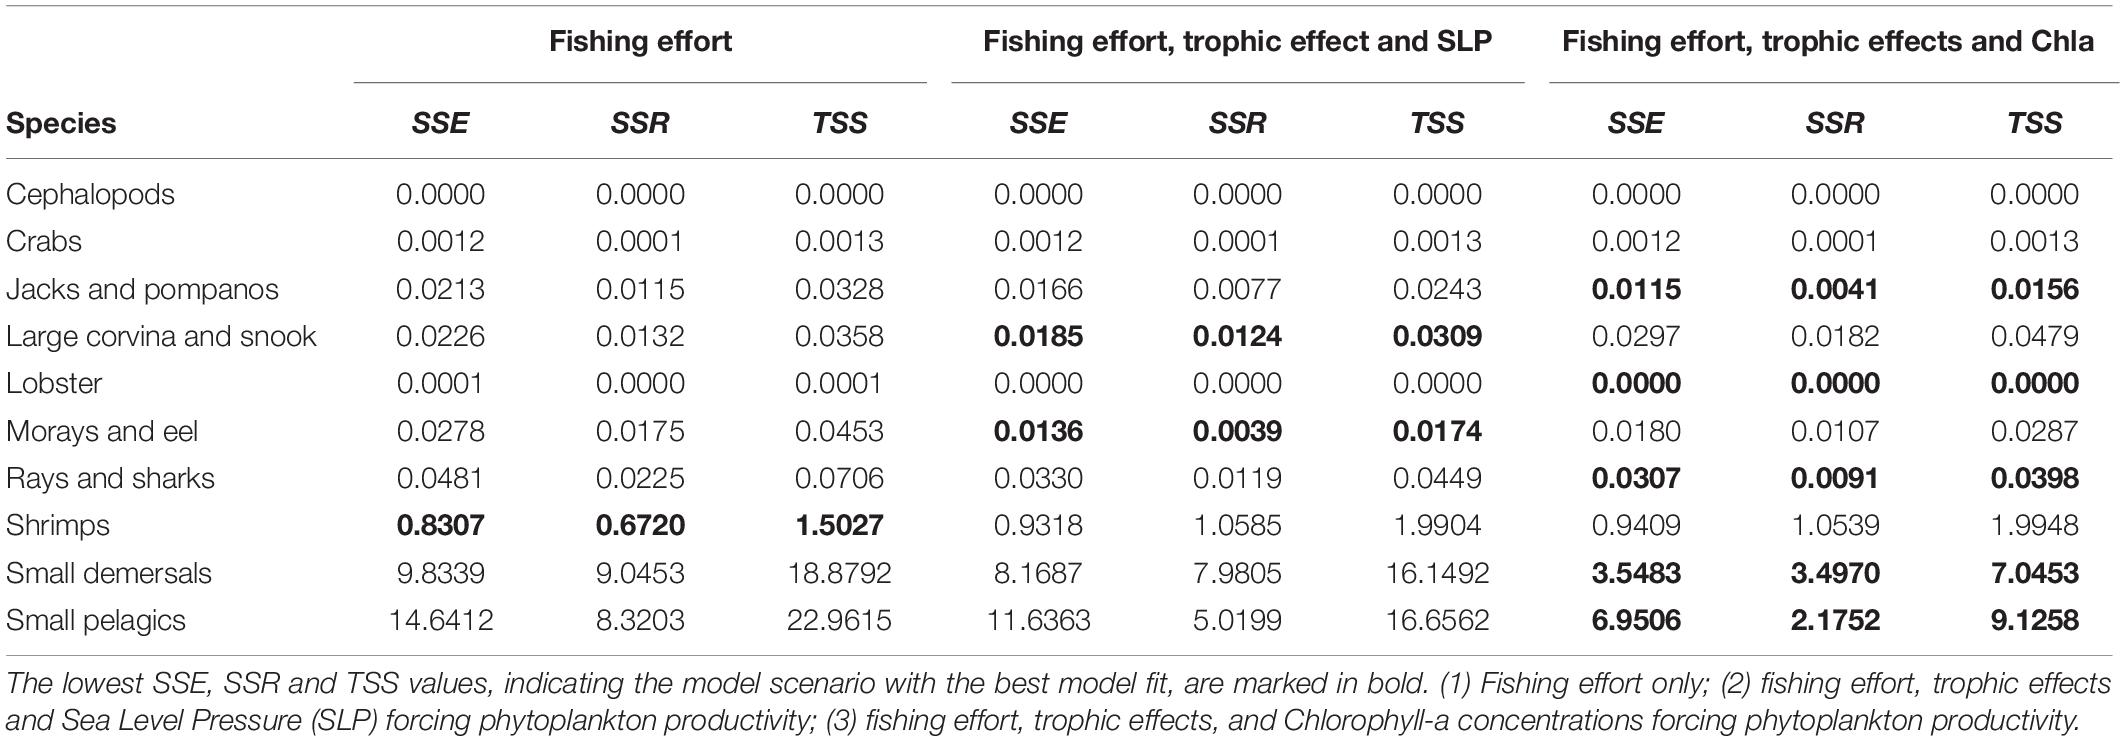
Table 4. Calculated sum of squares: residual sum of squares (SSE), regression sum of squares (SSR), and total sum of squares (TSS) for the model’s predictions of the selected scenarios and important target groups compared to the reference catch data.
Discussion
Combined Ecosystem Effect
The aim of the present study was to identify factors influencing the changes observed in the Gulf of Nicoya ecosystem over the past two decades, and to understand how these factors control the energy flows in the system (bottom–up, top–down or mixed/wasp waist control). We hypothesized that a combination of several drivers might affect the ecosystem and may decrease its natural resilience toward future environmental changes (Côté and Darling, 2010). As it has been shown in previous studies, ecosystem parameters calculated from Ecopath models can be used as indicators of the status of the ecosystem (Wolff et al., 2012; Heymans et al., 2014). Accordingly, fisheries and/or climate impacts on the ecosystem should result in changes in the sensitive system state indicators.
The officially registered overall fishing effort in the Gulf of Nicoya declined drastically since the early 2000s. On the one hand, the reduction is due to the implementation of the seasonal fishing ban “veda” in the inner Gulf of Nicoya, which has directly reduced the yearly effort since 2006 by approximately 60%. On the other hand, the shrimp fishing fleet reduced its capacities due to a lack of resources and the expiration of licenses. In 2013 shrimp trawling was declared unconstitutional in Costa Rica and no further licenses were said to be granted in the future. The last remaining shrimp licenses expired in 2018 and 2019.
Although the overall fishing effort decreased, the CPUE of the artisanal and semi-industrial fleet increased compared to the early 1990s, despite the heavy exploitation of the resources. However, gear improvements changed the relation between the CPUE and the actual abundance of species and tend to mask the trends of the species exploitation status (Arreguın-Sánchez et al., 2002; Ward and Myers, 2005). Illegal fishing gear improvements, i.e., toward Taiwanese lines and smaller gillnet mesh sizes might have allowed increasing catches per unit effort. These changes in the fishing fleet have most likely increased the overall efficiency of the fishing gear and the catchability of certain target resources.
We come to the conclusion (Table 3) that both the semi-industrial and artisanal (gillnet) fleet negatively influence the distribution of some target species (e.g., cephalopods, rays, and sharks). However the negative impact on the major target species is dominated by the shrimp trawl fleet, which negatively influences its target species as well as its bycatch species and by the semi-industrial sardine fleet. The artisanal handline fleet does not appear to have a relevant influence on any target species. The manual mollusk extraction is a very selective harvesting method, however the removal of piangua (Anadara tuberculosa, Arcoida: Arcida) drastically increased in the last decade and exceeded sustainable levels.
The evaluation of the trophic effects of the most representative models helped to investigate the most relevant control mechanisms between predators and their prey (Table 2). As seen in Table 3, the top predatory fish species in the system as well as cephalopods are bottom–up controlled by their prey. The same force applies to lower trophic level groups, such as benthos, shrimps and crabs. According to our analysis, only few species exert top–down control on their prey, such as jacks and pompanos, lobster, seabirds and zooplankton. It seems that mid-trophic-level species exert wasp-waist control on their prey and predators. This is in agreement with findings of Griffiths et al. (2013) and Roux et al. (2013). As has been found in these studies, the mid-trophic levels are only represented by few species, such as plankton feeding small pelagic fish.
Our analysis confirms these findings for the Gulf of Nicoya ecosystem and highlights the importance of the mid-trophic level species, which are heavily exploited by both semi-industrial fisheries (small pelagics) and artisanal fleets (small demersals). The observed decline of these species did not only have ecological, economic and social consequences (Alms and Wolff, 2019; Queiros et al., 2019), but may also lead to unfavorable and irreversible shifts in the ecosystem. This has been observed in other ecosystems, namely through the expansion of jellyfish (Roux et al., 2013) or may lead to the decrease of predatory species, such as fish, seabirds, and mammals (e.g., Crawford and Shelton, 1978; Pichegru et al., 2010).
The modeling approach we applied in our study clearly showed that the variations in the catch cannot solely be explained by variations in fishing pressure. Similar results have been found in other systems, such as the Southern Benguela system (Shannon et al., 2008).
Adding environmental data related to the primary productivity of the system to the simulations considerably increased the reliability of the model.
Especially primary producers are strongly influenced by the environmental conditions through changes in nutrient or light availability (through wind, current, or upwelling pattern changes) and growth conditions (if in situ temperatures changes) (Hays et al., 2005). Since changes in phytoplankton productivity are closely related to zooplankton abundance (Runge, 1988, FAO), e.g., bottom–up force through the entire food chain can be the consequence. For the analysis of the effects of inter-annual environmental variations on the ecosystems in the ETP region, the El Niño–Southern Oscillation (ENSO) cycle needs to be considered, which is known to be a major factor of climate variability in the Eastern Tropical Pacific with global impact. It is anticipated that ENSO will potentially modify in frequency and intensity due to global climate change (Collins et al., 2010; Cai et al., 2014).
In our study, the Chla concentration appeared to be the most relevant of tested environmental drivers. It is a proxy for the amount of plankton in the water column, which directly affects the bottom of the food chain. Increasing phytoplankton availability enhances zooplankton growth, resulting in higher availability of prey for low trophic level species foraging on zooplankton. The associated increased production will then cascade through the entire food web.
On the contrary, a reduced primary production will lead to a lack of foraging success of species in higher trophic levels. Changes in the vertical and horizontal distribution of the plankton could also cause changes in the spatial distribution of foraging fish with effect on their predators and fishery through an alteration in catchability. Our results indicate that particularly the lower trophic level groups, such as small demersal- and small pelagic fish benefit from increased phytoplankton availability. Since catches of predatory fish species, such as rays, sharks, mackerel and barracuda, as well as the catches of lobster also positively benefit from high Chla concentrations, this could be due to a bottom–up effect due to increased prey availability of these groups. Plankton feeding fish are known to aggregate closer to the coast due to food concentration in these areas. Foraging fish follow their prey and likewise occur closer to the coast. Thus, the catchability of certain fish species increases for the coastal fisheries.
Furthermore, other abiotic factors of the marine environment (e.g., wind direction and speed, light availability) can directly influence higher trophic levels of the system, for instance by affecting larval dispersal and the productivity of certain species (Runge, 1988).
The environmental indicator that led to the most representative model was the East Equatorial Sea Level Pressure (SLP), which is negatively related to the El Niño phenomenon (Figure 4). At high SLP (La Niña events), a lower SST can be observed (station ElNiño4) as well as stronger winds and upwelling, and lower precipitation rates. As we expected a negative impact of El Niño on the catches, the East Equatorial SLP as the inverse of SST anomalies proved to be a good measure. In the Eastern Pacific, the ENSO cycle is known to alter the oceanographic condition in the area and to affect a variety of marine communities (National Oceanic and Atmospheric Administration, 2020b). Ah it has been observed in the upwelling regions of the Humboldt Current system, small pelagic fish biomass decrease during strong El Niño years and the total fisheries production declined up to 50% (Wolff et al., 2003, 2012; Taylor et al., 2008a).
Our study reveals that several species in the Gulf of Nicoya are influenced by these large-scale environmental conditions associated with the ENSO cycle. We specifically observed that variations in the catches of functional groups (large drums and snook, crabs and morays and eels) are related to the ENSO cycle.
At higher temperatures during El Niño events some species in the Gulf of Nicoya migrate further out of the gulf into cooler oceanic waters while others, i.e., small pelagic fish (sardine), aggregate close to the beaches at the Pacific coast of Costa Rica. Similar aggregation patterns of small pelagic fish can be observed in other regions (Gutierrez et al., 2007). A shallow and more pronounced thermocline can therefore limit the vertical distribution of certain pelagic species and may increase their catchability in the upper water column (Bigelow et al., 2002). Warm water masses can also cause other species to move offshore into deeper and cooler waters, reducing their catchability.
According to the FAO, most of the inter-annual fluctuations in total fish production in the Eastern Central Pacific (Fishing Area 77) are due to changes in the abundance of small pelagic fish (FAO), that play a central role in this and many other marine ecosystems (Frederiksen et al., 2006; Shannon et al., 2008). ENSO related changes in water properties (e.g., heavy rains washing nutrients into the gulf or calm periods leading to enhanced water stratification and oxygen deficiency) might also increase the frequency of toxic algae blooms that have previously been observed in the Gulf of Nicoya, and eventually cause fish mass mortalities in the Gulf of Nicoya (Vargas-Montero and Freer, 2004).
The findings of our study suggests that there are multiple factors that impact the ecosystem, besides the exploitation by the semi-industrial fishing fleets. Environmental forcing plays an important role in the explanation of species biomass variabilities, especially in relation to the ENSO cycle, together with bottom–up effects, due to fluctuations in primary productivity. Furthermore, mid-trophic level species, such as small pelagic fish, have a pivotal role in the food web of the Gulf of Nicoya.
Uncertainty and Sensitivity Analysis
Although we reported a substantial reduction of the officially reported fishing effort in the gulf, it can be assumed that unreported catches, fishing without licenses and fishing during the closed season have occurred during the observational period. These unreported fishing activities cannot be quantified and are thus not part of the study.
The Ecopath models have been carefully validated with a prescribed balancing routine of Link (2010). The balancing process of the models has been described in Alms and Wolff (2019). Wee adhered to the suggestions of best-practice in Ecopath with Ecosim food-web models for ecosystem-based management by Heymans et al. (2016). Adding data to the model such as model drivers and reference data sets using the Ecosim tools helped to further validate the quality and accuracy of the created static Ecopath model. The model was additionally calibrated with historical fishing datasets and the comparison of the model predictions to reference data allowed for the validation of the model performance (Heymans et al., 2016). The calculated EwE Pedigree Index of 0.29, based on the confidence intervals of all input parameters, indicated that the model’s level of precision is in the intermediate to the upper range, compared to other published Ecopath models worldwide (Morissette, 2007). We believe that the AICc is a good measure for validation of the selected model. We followed the recommendation to adapt the AIC for small sample sizes (Burnham and Anderson, 2004).
The aim was to provide a holistic modeling approach, in the sense looking at combined effects influencing the species biomass variations. We covered trophic effects, the effects of fishing, the most prominent climate variables, and physical and chemical factors (also as proxy for pollution). However, the selection of factors was limited by the availability of time-series data and not every single possible parameter could be tested. Some factors, such as human disturbances, sedimentation, solid waste pollution and agricultural pollution, could not be assessed. For future research it would be useful to incorporate social-ecological interactions into the model.
Management Outlook and Implications
The present study lead to the conclusion that fisheries management policies entirely based on fisheries information only, with no consideration of the influence of environmental factors is not sufficient for the development of a holistic management strategy. Both fishing regulations and environmental monitoring needs to go hand in hand. We found that the shrimp trawl fleet predominately affects the distribution of important target species. Thus the advised fishing ban and the expiration of licenses concerning the trawler can be seen as a promising management measure. The sardine purse-seine fleet needs to be seen critically as we could highlight the importance of small pelagic fish to the ecosystem and their susceptibility to climate change. The impact of the artisanal fleet is minor compared to the semi-industrial fleet. However the gillnet fleet using small mesh sizes can be potentially harmful for a sustainable fisheries. To reduce illegal fishing activities stronger control mechanisms and rigor enforcement are needed. Furthermore, the manual mollusk extraction needs to be limited, as yearly around 8 million individuals are harvested from the Gulf of Nicoya (SINAC, 2019).
Environmental monitoring needs to be considered and combined with fisheries assessment studies, due to the considerable influence of these factors on the entire trophic system as well as their social-economic impacts. A regular monitoring programme for the Gulf of Nicoya is necessary to track changes in primary production, and phytoplankton community composition in the Gulf of Nicoya, that may be driven by both increased coastal pollution and environmental change. To apply appropriate management measures, a forecasting approach is needed (Clark et al., 2001) that takes into account knowledge of the current and predicted ecosystem structure and functioning (Valette-Silver and Scavia, 2003).
Our study may be used as a reference to further assess the regional impacts of future climate variations and extreme events in an ecosystem already altered by the fisheries. In the Gulf of Nicoya, like in other tropical environments, we need to consider the effects of increasing temperatures, as stated by Cheung et al. (2013) and Palomares and Pauly (2019). In contrast to colder regions, no species adapted for warm regions will be available to replace species that are displaced by the high temperature thus there will most likely be a temperature-driven loss of species in these areas.
Of particular relevance for future management scenarios are regional changes that have been predicted by the Intergovernmental Panel on Climate Change (IPCC) until the year 2100. According to the IPCC the Gross Primary Productivity is expected to decrease, mainly due to an increase in Colored Dissolved Organic Matter (CDOM), which absorbs a fraction of the Photosynthetically Active Radiation (PAR) (Thrane et al., 2014; Wolf and Heuschele, 2018). One can thus expect that Chla concentrations decrease in the Gulf of Nicoya and that phytoplankton composition, quantity and distribution will change. In addition, mangrove coverage is expected to further decrease due to sea level rise and changes in salinity (Ward et al., 2016). While mangroves only account for an estimate of 1% of the gulf’s primary production (Wolff et al., 1998), they contribute to the system’s productivity in the Gulf of Nicoya by providing organic matter and protected areas, enhancing fish and invertebrate productivity (Wolff et al., 1998). Considering the predicted decrease in primary productivity, it seems necessary for a sustainable ecosystem management to adapt the volume of fishery catches to potentially lower overall resource productivity.
Furthermore, there is a high uncertainty concerning the future dynamics of the ENSO cycle. The frequency and intensity of El Niño events is likely to be altered by climate change, however it is unknown to what extent (e.g.,Collins et al., 2010; Cai et al., 2014). As our simulations suggest, catch and biomass fluctuations in the Gulf of Nicoya are linked to ENSO related variations in the Equatorial Pacific Sea Level Pressure, and a constant monitoring of the regional ENSO impact is thus imperative.
As we have suggested previously (Alms and Wolff, 2019), it is crucial to think of measures to sustain primary productivity and to protect keystone groups, benthos and shrimps in the Gulf of Nicoya, but also adequately manage the mid-trophic level species such as small pelagic and small demersal fish. It is known that in the gulf, like in other coastal areas and estuaries with high abiotic variability (Heymans et al., 2014), these groups are central for ecosystem functioning and need to be prioritized in future management plans. In addition to adequate fisheries regulation, possible measures for improving the overall management of the Gulf of Nicoya could be the improvement of wastewater management and treatment and solid waste disposal plans. For the conservation of the coastal marine environment the further protection and restoration of mangroves is an important issue that needs to be further pursued (SINAC, 2019).
Furthermore our models can be used to directly engage stakeholders in the management plans, as it has been attempted by Sánchez-Jiménez et al. (2019). The EwE software was used as an interactive communication tool with artisanal fishers in the Gulf of Nicoya, to facilitate discussions on changes in the fishing ecosystem over time.
Data Availability Statement
The data analyzed in this study is subject to the following licenses/restrictions: “The fisheries data belong to the Instituto Costarricense de Pesca y Acuicultura, Costa Rica and the Centro de Investigación en Ciencias del Mar y Limnología, Costa Rica. The authors are not authorized to publish the original/raw data.” Requests to access these datasets should be directed to https://www.incopesca.go.cr/Contactenos/.
Author Contributions
MW contributed the Ecopath baseline model (Wolff et al., 1998) and initiated the research cooperation with the Centro de Investigación en Ciencias del Mar y Limnología (CIMAR) and the Universidad de Costa Rica and supervised the project. VA performed the data analysis, calculations, and the numerical simulations, drafted the manuscript, and designed the figures. Both authors contributed to the final version of the manuscript.
Funding
This study was financed by the Project MONICOYA [Modeling Two Decades of Change of the Nicoya Gulf (Costa Rica) Ecosystem: Implications for Future Management] of the Leibniz Centre for Tropical Marine Research (ZMT), in which VA had the opportunity to conduct her Ph.D. studies. This work was also supported by GLOMAR – Bremen International Graduate School for Marine Sciences. This research did not receive any specific grants by funding agencies in the public, commercial, or not-for-profit sectors.
Conflict of Interest
The authors declare that the research was conducted in the absence of any commercial or financial relationships that could be construed as a potential conflict of interest.
Acknowledgments
The facilities in Costa Rica and some of the data about the Gulf of Nicoya were provided by the Centro de Investigación en Ciencias del Mar y Limnología (CIMAR) and the Universidad de Costa Rica. The research project was strongly supported by our main project partner Alvaro Morales Ramírez in Costa Rica, who provided the infrastructure and guidance in Costa Rica and helped to develop the project collaboration between the Leibniz Centre for Tropical Marine Research and the CIMAR. Several other colleagues from the CIMAR and the University of Costa Rica supported the project, Jorge Cortés Núñez, José A. Vargas Zamora, Helena Molina Ureña, and Catalina Benavides Varela. Berny Marín Alpízar (INCOPESCA) supported the study with valuable advice and guidance concerning the marine resources in the Gulf of Nicoya. Moritz Stäbler (ZMT) supported the time series modeling task with his experience and advice on the Ecopath with Ecosim modeling approach.
References
Alms, V., and Wolff, M. (2019). The Gulf of Nicoya (Costa Rica) fisheries system: two decades of change. Mar. Coast. Fish. 11, 139–161. doi: 10.1002/mcf2.10050
Andersen, K. H., and Pedersen, M. (2009). Damped trophic cascades driven by fishing in model marine ecosystems. Proc. R. Soc. Lond. B Biol. Sci. 277, 795–802. doi: 10.1098/rspb.2009.1512
Arreguın-Sánchez, F., Arcos, E., and Chávez, E. A. (2002). Flows of biomass and structure in an exploited benthic ecosystem in the Gulf of California, Mexico. Ecol. Model. 156, 167–183. doi: 10.1016/s0304-3800(02)00159-x
Bigelow, A. F., Schroeder, W. C., Collette, B. B., and Klein-MacPhee, G. (2002). Bigelow and Schroeder’s Fishes of the Gulf of Maine. Washington, DC: Smithsonian Institution Press.
Brugnoli-Olivera, E., and Morales-Ramírez, A. (2008). Trophic planktonic dynamics in a tropical estuary, Gulf of Nicoya, Pacific coast of Costa Rica during El Niño 1997 event. Biol. Mar. Oceanogr. 43, 75–89.
BIOMARCC-SINAC-GIZ (2013). Estudios científicos de hábitat marino costero y situación socioeconómica del Pacífico Norte de Costa Rica. San José-Costa Rica. 236.
Burnham, K. P., and Anderson, D. R. (2004). Multimodel inference: understanding AIC and BIC in model selection. Sociol. Methods Res. 33, 261–304. doi: 10.1177/0049124104268644
Cai, W., Borlace, S., Lengaigne, M., van Rensch, P., Collins, M., Vecchi, G., et al. (2014). Increasing frequency of extreme El Niño events due to greenhouse warming. Nat. Clim. Change 4, 111–116. doi: 10.1038/nclimate2100
Calvo Vargas, E., Boza Abarca, J., and Berrocal Artavia, K. (2014). Efectos de El Niño y La Niña Sobre el Comportamiento del Microfitoplancton Marino y Las Variables Fisicoquímicas Durante el 2008 a 2010 en el Golfo de Nicoya, Costa Rica. REVMAR 6. Available online at: http://www.revistas.una.ac.cr/index.php/revmar/article/view/6237 (accessed November 2019).
Cheung, W. W., Sarmiento, J. L., Dunne, J., Frölicher, T. L., Lam, V. W., Palomares, M. D., et al. (2013). Shrinking of fishes exacerbates impacts of global ocean changes on marine ecosystems. Nat. Clim. Change 3, 254–258. doi: 10.1038/nclimate1691
Clark, D. A., Brown, S., Kicklighter, D. W., Chambers, J. Q., Thomlinson, J. R., Ni, J., et al. (2001). Net primary production in tropical forests: an evaluation and synthesis of existing field data. Ecol. Appl. 11, 371–384. doi: 10.1890/1051-0761(2001)011[0371:nppitf]2.0.co;2
Collins, M., An, S.-I., Cai, W., Ganachaud, A., Guilyardi, E., Jin, F.-F., et al. (2010). The impact of global warming on the tropical Pacific Ocean and El Niño. Nat. Geosci. 3, 391–397. doi: 10.1038/ngeo868
Côté, I. M., and Darling, E. S. (2010). Rethinking ecosystem resilience in the face of climate change. PLoS Biol. 8:e1000438. doi: 10.1371/journal.pbio.1000438
Crawford, R. J., and Shelton, P. A. (1978). Pelagic fish and seabird interrelationships off the coasts of South West and South Africa. Biol. Conserv. 14, 85–109. doi: 10.1016/0006-3207(78)90026-5
Cury, P., Bakun, A., Crawford, R. J., Jarre, A., Quinones, R. A., Shannon, L. J., et al. (2000). Small pelagics in upwelling systems: patterns of interaction and structural changes in “wasp-waist” ecosystems. ICES J. Mar. Sci. 57, 603–618. doi: 10.1006/jmsc.2000.0712
Duarte, L. O., and Garcıa, C. B. (2004). Trophic role of small pelagic fishes in a tropical upwelling ecosystem. Ecol. Model. 172, 323–338. doi: 10.1016/j.ecolmodel.2003.09.014
Fiedler, P. C. (2002). Environmental change in the eastern tropical Pacific Ocean: review of ENSO and decadal variability. Mar. Ecol. Prog. Ser. 244, 265–283. doi: 10.3354/meps244265
Frederiksen, M., Edwards, M., Richardson, A. J., Halliday, N. C., and Wanless, S. (2006). From plankton to top predators: bottom-up control of a marine food web across four trophic levels. J. Anim. Ecol. 75, 1259–1268. doi: 10.1111/j.1365-2656.2006.01148.x
Griffiths, S., Olson, R., and Watters, G. (2013). Complex wasp-waist regulation of pelagic ecosystems in the Pacific Ocean. Rev. Fish Biol. Fish. 23, 459–475. doi: 10.1007/s11160-012-9301-7
Gutierrez, M., Swartzman, G., Bertrand, A., and Bertrand, S. (2007). Anchovy (Engraulis ringens) and sardine (Sardinops sagax) spatial dynamics and aggregation patterns in the Humboldt Current ecosystem, Peru, from 1983–2003. Fish. Oceanogr. 16, 155–168. doi: 10.1111/j.1365-2419.2006.00422.x
Hays, G. C., Richardson, A. J., and Robinson, C. (2005). Climate change and marine plankton. Trends Ecol. Evol. 20, 337–344. doi: 10.1016/j.tree.2005.03.004
Heymans, J. J., Coll, M., Libralato, S., Morissette, L., and Christensen, V. (2014). Global patterns in ecological indicators of marine food webs: a modelling approach. PLoS One 9:e0095845. doi: 10.1371/journal.pone.0095845
Heymans, J. J., Coll, M., Link, J. S., Mackinson, S., Steenbeek, J., Walters, C., et al. (2016). Best practice in Ecopath with Ecosim food-web models for ecosystem-based management. Ecol. Model. 331, 173–184. doi: 10.1016/j.ecolmodel.2015.12.007
Hidalgo, M., Rouyer, T., Molinero, J. C., Massutí, E., Moranta, J., Guijarro, B., et al. (2011). Synergistic effects of fishing-induced demographic changes and climate variation on fish population dynamics. Mar. Ecol. Prog. Ser. 426, 1–12. doi: 10.3354/meps09077
Jennings, S., and Kaiser, M. J. (1998). The effects of fishing on marine ecosystems. Adv. Mar. Biol. 34, 201–352. doi: 10.1016/s0065-2881(08)60212-6
Ji, X., Neelin, J. D., and Mechoso, C. R. (2015). El niño–southern oscillation sea level pressure anomalies in the western pacific: why are they there?∗. J. Clim. 28, 8860–8872. doi: 10.1175/jcli-d-14-00716.1
Link, J. S. (2010). Adding rigor to ecological network models by evaluating a set of pre-balance diagnostics: a plea for PREBAL. Ecol. Model. 221, 1580–1591. doi: 10.1016/j.ecolmodel.2010.03.012
Lizano, O. G., and Alfaro, E. J. (2004). Algunas características de las corrientes marinas en el Golfo de Nicoya, Costa Rica. Rev. Biol. Trop. 52, 77–94.
Lozano, A. J. G., and Heinen, J. T. (2016). Identifying drivers of collective action for the co-management of coastal marine fisheries in the Gulf of Nicoya, Costa Rica. Environ. Manage. 57, 759–769. doi: 10.1007/s00267-015-0646-2
Mackinson, S., Daskalov, G., Heymans, J. J., Neira, S., Arancibia, H., Zetina-Rejón, M., et al. (2009). Which forcing factors fit? Using ecosystem models to investigate the relative influence of fishing and changes in primary productivity on the dynamics of marine ecosystems. Ecol. Model. 220, 2972–2987. doi: 10.1016/j.ecolmodel.2008.10.021
Morissette, L. (2007). Complexity, Cost and Quality of Ecosystem Models and Their Impact On Resilience: A Comparative Analysis, With Emphasis On Marine Mammals and the Gulf Of St. Lawrence. Vancouver, BC: University of British Columbia.
National Oceanic and Atmospheric Administration (2020a). El Niño/Southern Oscillation (ENSO) Technical Discussion. NOAA.gov. Available online at: https://www.ncdc.noaa.gov/teleconnections/enso/enso-tech.php (accessed February 2020).
National Oceanic and Atmospheric Administration (2020b). The El Niño Southern Oscillation (ENSO) is one of the most important climatic phenomena on Earth. NOAA.gov. Available online at: https://www.noaa.gov/education/resource-collections/weather-atmosphere-education-resources/el-nino (accessed February 2020).
Neira, S., Moloney, C. L., Cury, P., Mullon, C., and Christensen, V. (2009). Mechanisms affecting recovery in an upwelling food web: the case of the southern Humboldt. Prog. Oceanogr. 83, 404–416. doi: 10.1016/j.pocean.2009.07.007
Palomares, M.-L. D., and Pauly, D. (2019). “Coastal fisheries: the past, present, and possible futures,” in Coasts and Estuaries, eds E. Wolanski, J. W. Day, M. Elliott, and R. Ramachandran (Amsterdam: Elsevier), 569–576. doi: 10.1016/b978-0-12-814003-1.00032-0
Pichegru, L., Ryan, P. G., Crawford, R. J. M., van der Lingen, C. D., and Grémillet, D. (2010). Behavioural inertia places a top marine predator at risk from environmental change in the Benguela upwelling system. Mar. Biol. 157, 537–544. doi: 10.1007/s00227-009-1339-2
Queiros, Q., Fromentin, J.-M., Gasset, E., Dutto, G., Huiban, C., Metral, L., et al. (2019). Food in the Sea: size also matters for pelagic fish. Front. Mar. Sci. 6:385. doi: 10.3389/fmars.2019.00385
Quesada-Alpízar, M. A., and Morales-Ramírez, A. (2004). Comportamiento de las masas de agua en el Golfo Dulce, Costa Rica durante El Niño (1997 - 1998). Rev. Biol. Trop. 52, 95–103.
Roux, J.-P., van der Lingen, C. D., Gibbons, M. J., Moroff, N. E., Shannon, L. J., Smith, A. D., et al. (2013). Jellyfication of marine ecosystems as a likely consequence of overfishing small pelagic fishes: lessons from the Benguela. Bull. Mar. Sci. 89, 249–284. doi: 10.5343/bms.2011.1145
Runge, J. (1988). Should we expect a relationship between primary production and fisheries? The role of copepod dynamics as a filter of trophic variability. Hydrobiologia 67, 61–71. doi: 10.1007/bf00026294
Sánchez-Jiménez, A., Fujitani, M., MacMillan, D. C., Schlüter, A., and Wolff, M. (2019). Connecting a trophic model and local ecological knowledge to improve fisheries management: the case of Gulf of Nicoya, Costa Rica. Front. Mar. Sci. 6:126. doi: 10.3389/fmars.2019.00126
Scott, E., Serpetti, N., Steenbeek, J., and Heymans, J. J. (2016). A stepwise fitting procedure for automated fitting of ecopath with ecosim models. SoftwareX 5, 25–30. doi: 10.1016/j.softx.2016.02.002
Shannon, L., Neira, S., and Taylor, M. (2008). Comparing internal and external drivers in the southern Benguela and the southern and northern Humboldt upwelling ecosystems. Afr. J. Mar. Sci. 30, 63–84. doi: 10.2989/ajms.2008.30.1.7.457
SINAC (2019). Estrategia Regional para el Manejo y Conservación de los Manglares en el Golfo de Nicoya-Costa Rica 2019-2030. San José: SINAC.
Tam, J., Taylor, M. H., Blaskovic, V., Espinoza, P., Ballón, R. M., Díaz, E., et al. (2008). Trophic modeling of the Northern Humboldt current ecosystem, Part I: comparing trophic linkages under La Niña and El Niño conditions. Prog. Oceanogr. 79, 352–365. doi: 10.1016/j.pocean.2008.10.007
Taylor, M. H., Tam, J., Blaskovic, V., Espinoza, P., Ballón, R. M., Wosnitza-Mendo, C., et al. (2008a). Trophic modeling of the Northern Humboldt Current Ecosystem, Part II: elucidating ecosystem dynamics from 1995 to 2004 with a focus on the impact of ENSO. Prog. Oceanogr. 79, 366–378. doi: 10.1016/j.pocean.2008.10.008
Taylor, M. H., Wolff, M., Vadas, F., and Yamashiro, C. (2008b). Trophic and environmental drivers of the Sechura Bay Ecosystem (Peru) over an ENSO cycle. Helgol. Mar. Res. 62, 15–32. doi: 10.1007/s10152-007-0093-4
Thrane, J.-E., Hessen, D. O., and Andersen, T. (2014). The absorption of light in lakes: negative impact of dissolved organic carbon on primary productivity. Ecosystems 17, 1040–1052. doi: 10.1007/s10021-014-9776-2
Travers, M., Watermeyer, K., Shannon, L., and Shin, Y.-J. (2010). Changes in food web structure under scenarios of overfishing in the southern Benguela: comparison of the Ecosim and OSMOSE modelling approaches. J. Mar. Syst. 79, 101–111. doi: 10.1016/j.jmarsys.2009.07.005
Trujillo, P., Cisneros-Montemayor, A. M., Harper, S., and Zeller, D. (2012). Reconstruction of Costa Rica’s Marine Fisheries Catches (1950–2008).
Valette-Silver, N., and Scavia, D. (2003). Ecological Forecasting: New Tools for Coastal and Ecosystem Management. NOAA Tech. Memo. NOS NCCOS 1. Silver Spring, MD: NOAA.
Vargas, J. A. (1995). The Gulf of Nicoya estuary, Costa Rica: past, present, and future cooperative research. Helgoländer Meeresuntersuchungen 49, 821–828. doi: 10.1007/BF02368405
Vargas-Montero, M., and Freer, E. (2004). Harmful blooms of cyanobacteria (Oscillatoriaceae) and dinoflagellates (Gymnodiniaceae) in the Golfo de Nicoya, Costa Rica. Rev. Biol. Trop. 52, 121–125.
Ward, P., and Myers, R. A. (2005). Shifts in open-ocean fish communities coinciding with the commencement of commercial fishing. Ecology 86, 835–847. doi: 10.1890/03-0746
Ward, R. D., Friess, D. A., Day, R. H., and MacKenzie, R. A. (2016). Impacts of climate change on mangrove ecosystems: a region by region overview. Ecosyst. Health Sustain. 2:e01211. doi: 10.1002/ehs2.1211
Wolf, R., and Heuschele, J. (2018). Water browning influences the behavioral effects of ultraviolet radiation on zooplankton. Front. Ecol. Evol. 6:26. doi: 10.3389/fevo.2018.00026
Wolff, M. (2010). Galapagos does not show recent warming but increased seasonality. Galapagos Res. 67, 38–44.
Wolff, M., Koch, V., Chavarria, J. B., and Vargas, J. A. (1998). A trophic flow model of the Golfo de Nicoya, Costa Rica. Rev. Biol. Trop. 46, 63–80.
Wolff, M., Ruiz, D. J., and Taylor, M. (2012). El Niño induced changes to the Bolivar Channel ecosystem (Galapagos): comparing model simulations with historical biomass time series. Mar. Ecol. Prog. Ser. 448, 7–22. doi: 10.3354/Meps09542
Keywords: ecosystem modeling, fisheries management, climate variability, ecopath with ecosim, trophic interaction
Citation: Alms V and Wolff M (2020) Identification of Drivers of Change of the Gulf of Nicoya Ecosystem (Costa Rica). Front. Mar. Sci. 7:707. doi: 10.3389/fmars.2020.00707
Received: 21 March 2020; Accepted: 03 August 2020;
Published: 28 August 2020.
Edited by:
Prateep Kumar Nayak, University of Waterloo, CanadaReviewed by:
Jenia Mukherjee, Indian Institute of Technology Kharagpur, IndiaSherman Farhad, Brock University, Canada
Lynne Jane Shannon, University of Cape Town, South Africa
Copyright © 2020 Alms and Wolff. This is an open-access article distributed under the terms of the Creative Commons Attribution License (CC BY). The use, distribution or reproduction in other forums is permitted, provided the original author(s) and the copyright owner(s) are credited and that the original publication in this journal is cited, in accordance with accepted academic practice. No use, distribution or reproduction is permitted which does not comply with these terms.
*Correspondence: Viola Alms, dmlvbGEuYWxtc0BsZWlibml6LXptdC5kZQ==