 Kurt J. Rosenberger1*
 Curt D. Storlazzi1
 Olivia M. Cheriton1
 Andrew W. M. Pomeroy2,3
 Jeff E. Hansen2
 Ryan J. Lowe2
 Mark L. Buckley2
- 1U.S. Geological Survey, Pacific Coastal and Marine Science Center, Santa Cruz, CA, United States
- 2UWA Oceans Institute, University of Western Australia, Crawley, WA, Australia
- 3Australian Institute of Marine Science (AIMS), Townsville, QLD, Australia
Coral reefs are an important source of sediment for reef-lined coasts and help to maintain beaches by providing protection though dissipation of wave energy. Understanding the mechanisms that deliver sediment to the coast from coral reefs and quantifying the total volume of sediment generated at coral reefs are critical for projecting future coastal change. A month-long hydrodynamics and sediment transport study on a fringing reef/lagoon complex in Western Australia indicates that lower frequency wave energy constituents are important to the total bedload transport of sediment across the reef flat and lagoon to the shoreline. The reef flat and the lagoon are characterized by distinctly different transport regimes, resulting in an offset in the timing of bedform migration between the two. Short-term storage of sediment occurs on the reef flat, which is subsequently transported into the lagoon when offshore wave heights increase and strong currents due to wave breaking at the reef crest develop. This sudden influx of sediment is correlated with an increase in bedform migration rates in the lagoon. Infragravity wave energy on the reef flat and lagoon make an important contribution to the migration of bedforms and resultant bedload transport. Given the complexity of the hydrodynamics of fringing reefs, the transfer of energy to lower frequency bands, as well as accurate estimates of sources and sinks of sediment, must but considered in order to correctly model the transport of sediment from the reef to the coast.
Introduction
The importance of coral reefs in protecting and supplying sediment to reef-lined coasts is becoming widely recognized, as highlighted by many recent studies (Pomeroy et al., 2017; Cuttler et al., 2018b; Reguero et al., 2019; Storlazzi et al., 2019). The precise mechanisms by which sediment is transported across a reef to the shoreline, however, are still not well understood. Sediment is transported as both suspended load and bedload, and laboratory studies have suggested that in a reef environment, the bedload component dominates (Pomeroy et al., 2015a). There have been few studies on the bedload transport of sediment in reef environments. Cacchione et al. (1999) considered bedform migration in a reef channel off Kailua, Oahu, and found that the net transport direction varied according to the seasonality of the trade winds. Becker et al. (2007) investigated the migration of bedforms in Waimea Bay on the island of Oahu using imagery at low tide, when the beach was exposed. Although they compared seabed response to predicted forcing using a numerical model, they did not attempt to calculate the volume of resultant transport by migrating bedforms. Cuttler et al. (2018a) estimated migration rates and sediment flux from in situ data within the lagoon on Ningaloo reef, but lacked data from the reef flat, and therefore did not have estimates of transport from the reef flat to the lagoon.
Seaward of the reef crest, in deep water, incident sea-swell (SS) waves (peak period, Tp = 5–25 s) dominate. However, depth-limited wave breaking limits SS wave heights shoreward of the reef crest and surfzone generated infragravity (IG) waves (Tp = 25–250 s) become a large proportion of the total wave energy (Pomeroy et al., 2012; Buckley et al., 2018). As such, infragravity waves likely make important contributions to the transport of sediment on reef flats and lagoons (Pomeroy et al., 2015a), but this has yet to be demonstrated with field observations. Most sediment transport models rely on bulk statistics of monochromatic waves such as significant wave height and peak period or an idealized spectrum such as JONSWAP to empirically relate wave hydrodynamics to the resultant transport of sediment (Traykovski, 2007; Soulsby et al., 2012; Deltares Systems, 2019). These representations of the wave field do not account for infragravity waves and, therefore, may not accurately describe the resultant sediment transport in environments with a high proportion of the total wave energy in the IG band, such as occurs on reefs.
Numerous models of both equilibrium and dynamic bedform development and change have been proposed, mostly from data acquired on sandy coasts (Grant and Madsen, 1979; Nielsen, 1981; Wiberg and Harris, 1994; Styles and Glenn, 2002; Soulsby and Whitehouse, 2005; O’Donoghue et al., 2006; Traykovski, 2007; Wengrove et al., 2018). Many of these models primarily depend upon the horizontal wave-orbital excursion length to predict bedform dimensions, which is only a function of the wave forcing. Some models use the mobility parameter, Ψ, which is dependent on the grain density (Camenen, 2009). Given that grain density of carbonate sediment can be less than typical quartz beach sediment (Cuttler et al., 2017), we propose this to be an important factor in predicting bedform geometry (and subsequent bedload transport) on coral reefs. The Shields parameter is often used to distinguish between and predict wave- (θwv) and current-dominated (θcur) transport in coastal regions (Soulsby et al., 2012; Kramer and Winter, 2016). The advantage of using the Shields parameter is that it includes the non-dimensional grain size, D*, which accounts for the relative grain density. Soulsby et al. (2012) determined critical Shields parameters for the initiation of motion (θcrit), the washout of bedforms (θwo), and the initiation of sheetflow conditions (θsf) based on D* using data from multiple field experiments. Equations for the aforementioned parameters can be found in Appendix A.
In this study we present the results of a month-long field study on the hydro and sediment dynamics across a fringing reef/lagoon system in Western Australia. The goal was to make highly detailed measurements of the currents, waves, and suspended and bedload transport across the reef and lagoon to better constrain the processes responsible for shoreward transport of sediment. The objectives of this paper are to (1) Quantify the time variation and total bedload transport by characterizing the migration of bedforms, (2) Compute the relative contribution of sea-swell and lower-frequency constituents to shear stresses on the seafloor, (3) Relate the observed forcing to bedform migration, (4) Determine how lower-frequency motions on the reef contribute to the total bedload transport, and (5) Evaluate how well current equilibrium models of bedform development predict the dimensions of bedforms observed in the coral reef environment. We found that the mechanisms responsible for bedform migration differ greatly from the reef flat to the lagoon, and that lower-frequency constituents of wave forcing on the reef need to be accounted for to properly predict timing and rates of sediment transport by bedforms. It should be noted that bedload transport alone does not account for all of the flux of sediment across the reef toward the shore, and that suspended load can also represent a significant portion of that flux. The contribution of the suspended load will be addressed in a separate manuscript.
Study Area
Ningaloo Reef in northern Western Australia is the largest fringing reef in Australia, spanning 260 km of the coast, and lies within UNESCO’s Ningaloo Coast World Heritage Area. Many recent studies have focused on a section of reef near Jurabi (21°52′6.03″S, 113°58′58.26″E, Figure 1) that is approximately 4 km in the alongshore dimension, extends 2.0–2.5 km from the shoreline, and has a ∼500 m wide reef flat that is submerged approximately 0.6–1.5 m at mean sea level (Pomeroy et al., 2015b, 2018; Cuttler et al., 2017, 2018a, b). The shorewardmost portion of the reef is characterized by a large, sandy lagoon that averages 3 m deep and is bounded to the north and south by channels up to 6 m deep. One of the most significant features of the coastline is a large promontory, or salient, which is aligned with the central axis of the reef, as is the case with many sections of Ningaloo Reef (Cuttler et al., 2018a).
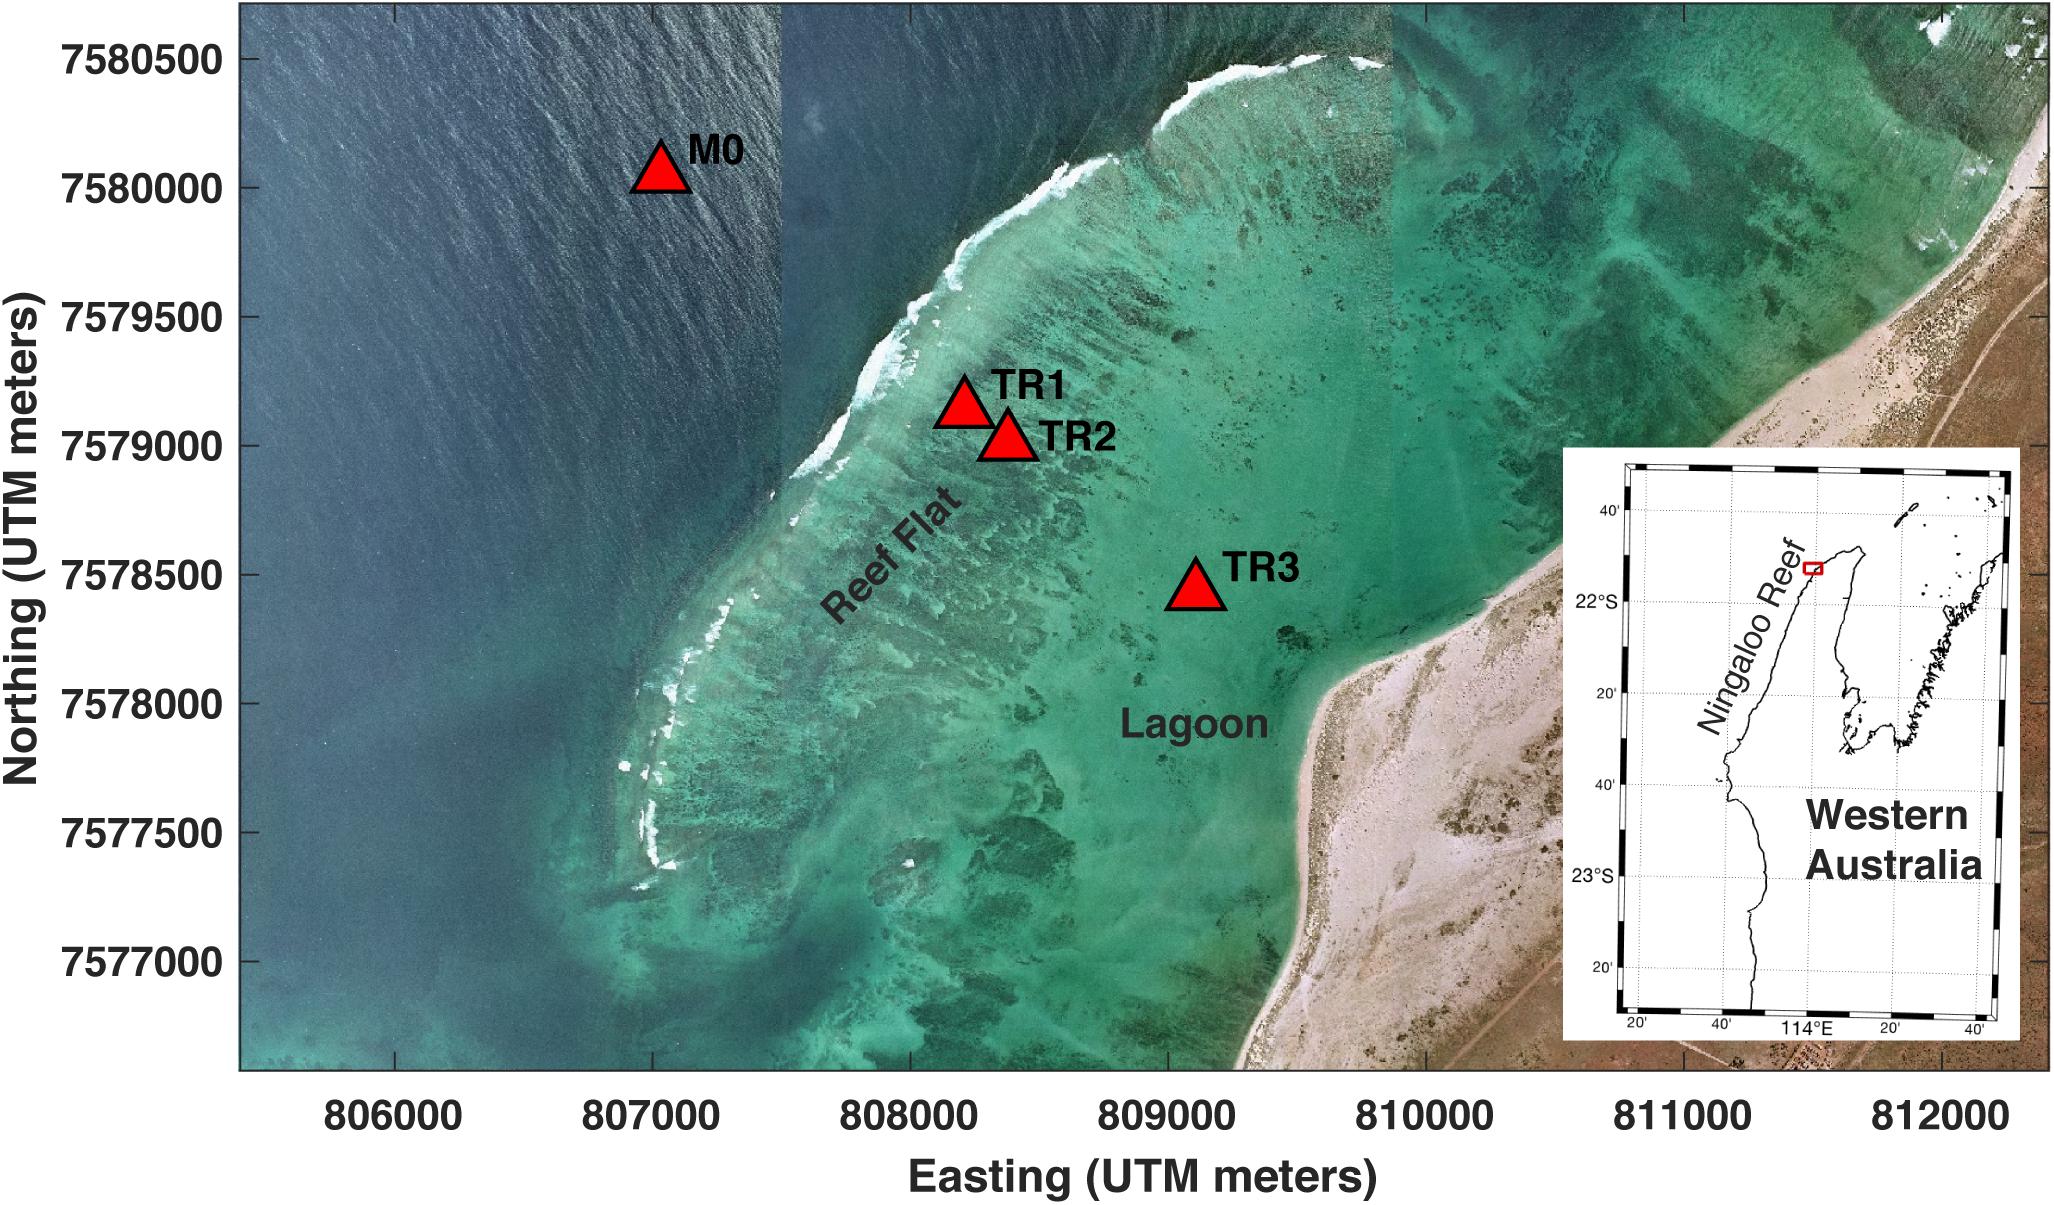
Figure 1. Aerial image of the study area showing the location of the instrument packages (red triangles) used in this study.
There is a trend of decreasing median grain size from the reef crest, shoreward through the lagoon to the beach with the sediment on the southern side of the lagoon slightly coarser than on the northern side (Cuttler et al., 2017). The sediment at the edges of the reef-lagoon system primarily consists of coralline algae and reworked coral-derived grains. The greatest number of foraminifera and mollusk fragments are found in the northwest corner of the study area and quartz is only a dominant constitute near the shoreline (Cuttler et al., 2017).
Tides in the region are characterized as semidiurnal transitioning between microtidal and macrotidal; in the study area tides are mixed semidiurnal, with a spring range of more than 1.5 m and a mean range of 0.9 m (Taebi et al., 2011). Significant wave heights offshore of the study area typically range from 1 to 2 m, and average wave periods are 11–15 s. Infrequent (every 1–2 y) tropical cyclones that occur along the northwest shelf of Australia can expose the reef to large (>5 m) waves (Drost et al., 2017; Cuttler et al., 2018a), and occasional Southern Ocean swell events can exceed 4 m. Currents on the reef are predominantly driven by cross-shore gradients in water level induced by setup when offshore waves break at the reef crest. This process is modulated by the tides, as the degree of wave breaking dissipation, and hence wave energy transmitted onto the reef, is influenced by tidal depth variations at the reef crest (Pomeroy et al., 2018).
Methods
Field Methods
Three hydrodynamic and sediment dynamic tripods with multiple instrument packages were deployed across the fringing reef flat off Jurabi for a 33-day period from 21 May to 23 June 2016. Two tripods (TR1, TR2; Figure 1) were located on the reef flat 0.4 and 0.6 km from the reef crest in ∼1.5 m water depth. A third tripod (TR3, Figure 1) was positioned in the lagoon in ∼3 m water depth, 1.5 km from the reef crest and 0.65 km from the salient. Each tripod had a downward-looking Nortek 1 MHz pulse-coherent acoustic Doppler current profiler (ADP), a Seapoint optical backscatter sensor (OBS), an RBR, Ltd. pressure-based wave and water level gauge, and three Echologger AA400 downward-looking 450 kHz acoustic altimeters (Table 1). The ADP continuously sampled current profiles of the bottom 65 cm of the water column at 1 Hz (in 2-cm vertical bins), and logged data from the OBS located 0.40 m above the bottom (mab). The wave gauge continuously sampled water levels at 1 mab at 4 Hz. The continuous measurements of currents (U, V, and W) by current meters and high-accuracy water level (P) enabled wave energy data to be parsed into sea-swell (T = 5–25 s, ‘SS’), infragravity (T = 25–250 s, ‘IG’) and very-low frequency (T > 250 s, ‘VLF’) bands. The altimeters were spaced 6.5 cm apart in a line oriented perpendicular to the reef crest and shoreline (in-line with the dominant wave direction) to measure bedform migration and collected bursts of 10 samples of range to bottom every 10 min. A Nortek AWAC ADCP tide/wave gauge was deployed offshore in 20 m water depth on the fore reef approximately 1 km seaward of the reef crest to provide hourly measurements of incident wave parameters. A meteorological station measuring wind speed, direction and barometric pressure was deployed on the shore for the study period.
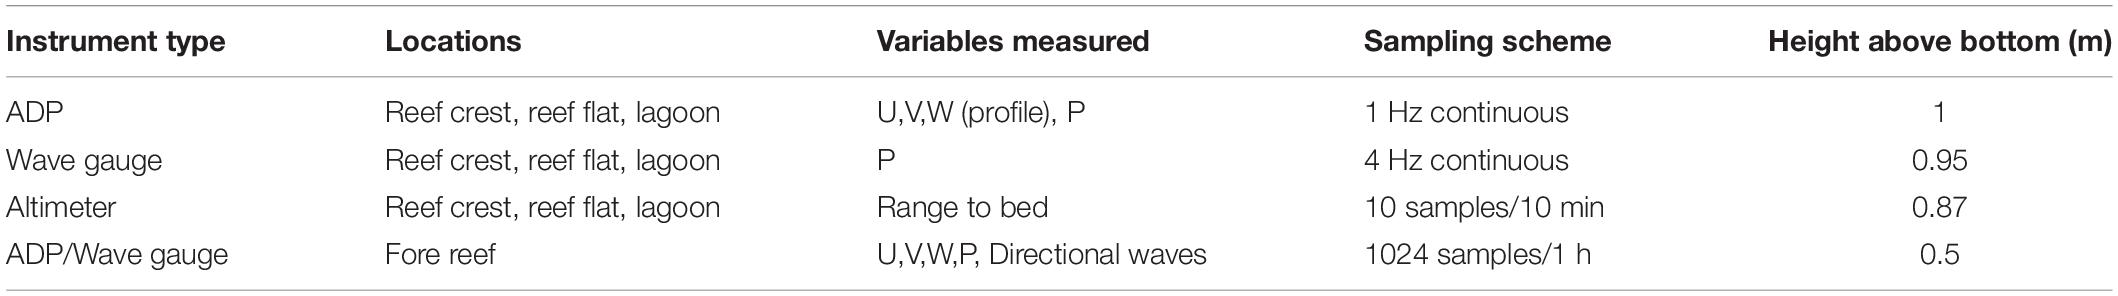
Table 1. Instrumentation used in the experiment.
Analysis Methods
Grain-size distributions of surface sediment grab samples and from sediment collected in sediment traps at each location were determined using a Beckman LS-13-320 laser diffraction particle size analyzer. The grain density (or particle density) of samples from sediment traps was directly measured in the laboratory using a method derived from the American Society for Testing and Materials, ASTM D854 (ASTM International, 2010).
Identification of individual bedforms in the acoustic altimeter data (i.e., range to seabed, or bed level) was performed manually, as the data contained some noise and the shape of the features varied enough that algorithms designed to search for one type of bedform would invariably neglect others; this ensured that all migrating ripples were detected. Ripple speed was calculated using the change in arrival time of a given feature identified between adjacent altimeters. Bedload sediment flux was determined from bedform migration using a method similar to Traykovski et al. (1999), except that migration rates at each timestep of bed elevation measurement were not available. Instead, we integrated the accumulation of sediment between troughs of each bedform using the time for adjacent troughs to pass by an altimeter.
The continuous 1-Hz current and water level data were parsed into one-hour bursts for spectral analysis. A frequency-space FFT filter was applied to each burst of current and water level data to obtain data filtered into SS, IG, and VLF bands. Hourly time series of bulk wave statistics such as significant wave height (Hs), mean period (Tm), and peak period (Tp) were then calculated for each frequency band using the Oceanlyz wave toolbox in Matlab (Karimpour and Chen, 2017). Near-bottom wave orbital velocity (Uorb, per Wiberg and Sherwood, 2008) and depth-averaged velocity (Umean) were calculated on the filtered data from each band as well. Wave asymmetry and skewness were also calculated for each frequency band following Pomeroy et al. (2015a). The Grant and Madsen model (GM94) for combined waves and currents (Madsen, 1994) was used to determine shear velocity (U*) in each band of filtered data, and the formulations of Soulsby et al. (2012) were used to calculate the Shields parameters (see Appendix A). Current speed at 15 cm above bottom from the downward profiling ADCP data were used in the calculations of Sheilds parameters, Uorb, and GM94; this height was chosen to account for variability in bed height.
Results
Forcing Conditions
Meteorological conditions during the 6-week study period were generally calm; no frontal systems or cyclones passed through the region. The winds were light to moderate (0–10 m/s) and were typically onshore or obliquely onshore, with a stronger down-coast component (Figure 2A). A diurnal sea breeze was prevalent during the latter part of the study period (2016 Year Day (YD) 162-170). The offshore waves comprised of Southern Ocean swell from the southwest with heights (Hm0) consistently above 1 m and average Tp of between 10–20 s (Figure 2B). Two larger swell events impacted the study area on 2016 YD 150-152 and 2016 YD 158-162 (Figure 2C), with a period of elevated wave height and period in between the events. The beginning of the second swell event was marked by a bimodal wave distribution, with short-period wind waves (∼5 s) and long-period swell (∼20 s) occurring simultaneously. Waves near the reef crest were tidally modulated, with larger wave heights at higher tides when incident waves energy propagated more efficiently onto the reef (Figures 2D,E). Tp near the reef crest (TR1) varied from 5–20 s, with longer period waves occurring during times of elevated offshore incident wave energy; Tm were much shorter, averaging around 5 s (Figure 2D). The tidal range during the measurement period varied from 0.75 to 1.5 m (Figure 2F).
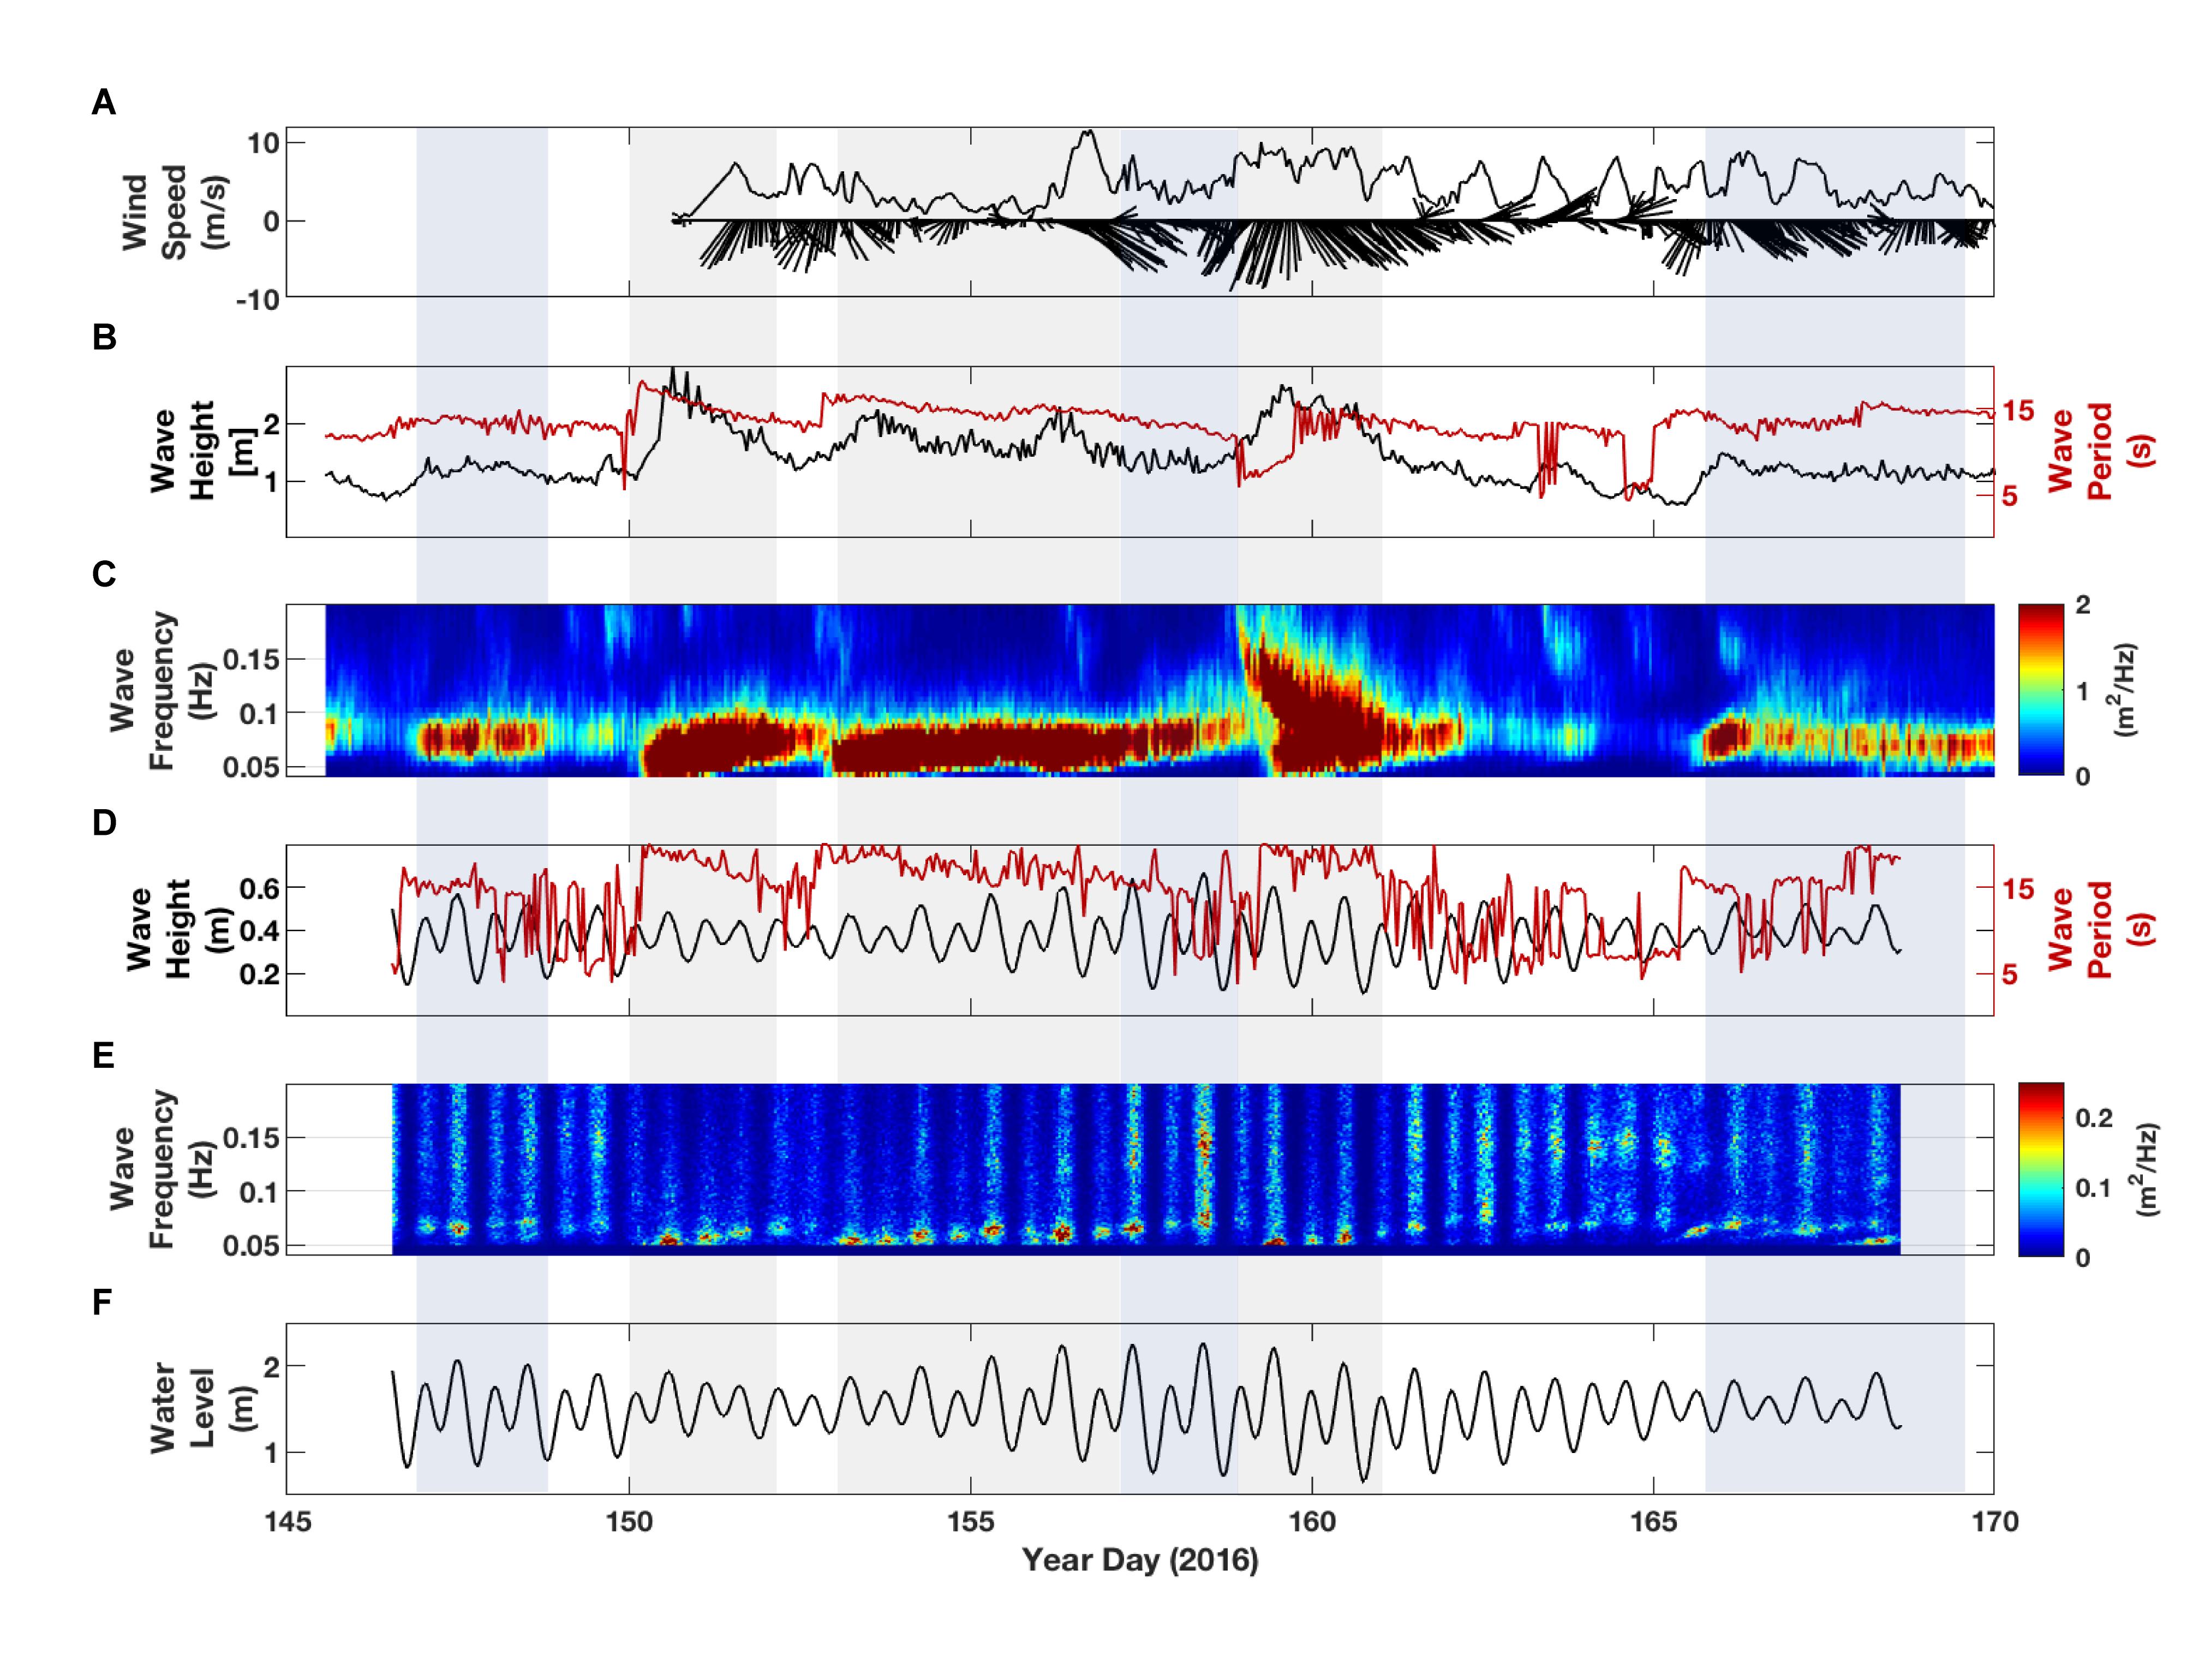
Figure 2. Meteorologic and oceanographic forcing during the measurement period. (A) Wind speed and 3-h average wind vectors measured at the shoreline. (B) Offshore significant wave height and peak wave period. (C) Offshore wave spectral energy density at station M0. (D) Wave height and period near the reef crest at station TR1. (E) Wave spectral density near the reef crest. (F) Water level on the reef. The time frames shaded in gray represent “swell events” where offshore wave heights were greater than 1.5 m and wave periods were longer than 13 s. The areas shaded in blue represent time frames where there were consistent offshore waves heights greater than 1 m with periods greater than 12 s.
Reef Hydrodynamics
Waves
The hydrodynamics varied from the reef crest to the lagoon (Figures 3–5). Hs was generally highest near the reef crest (ranging from 0.10 to 0.65 m), and was at times almost twice as high as in the lagoon (ranging from 0.10 to 0.46 m). Tidal modulation of wave height is evident at all sites on the reef and in the lagoon. Offshore swell events were not as apparent in wave height on the reef; the average Hs on the reef was only slightly elevated during the two swell events of the study period, as indicated within the low-pass filtered time series (Figure 3A). The incident wave direction was almost exclusively out of the west-northwest, averaging 260 degrees, and did not vary more than 20 degrees except for short periods of a few hours (not shown).
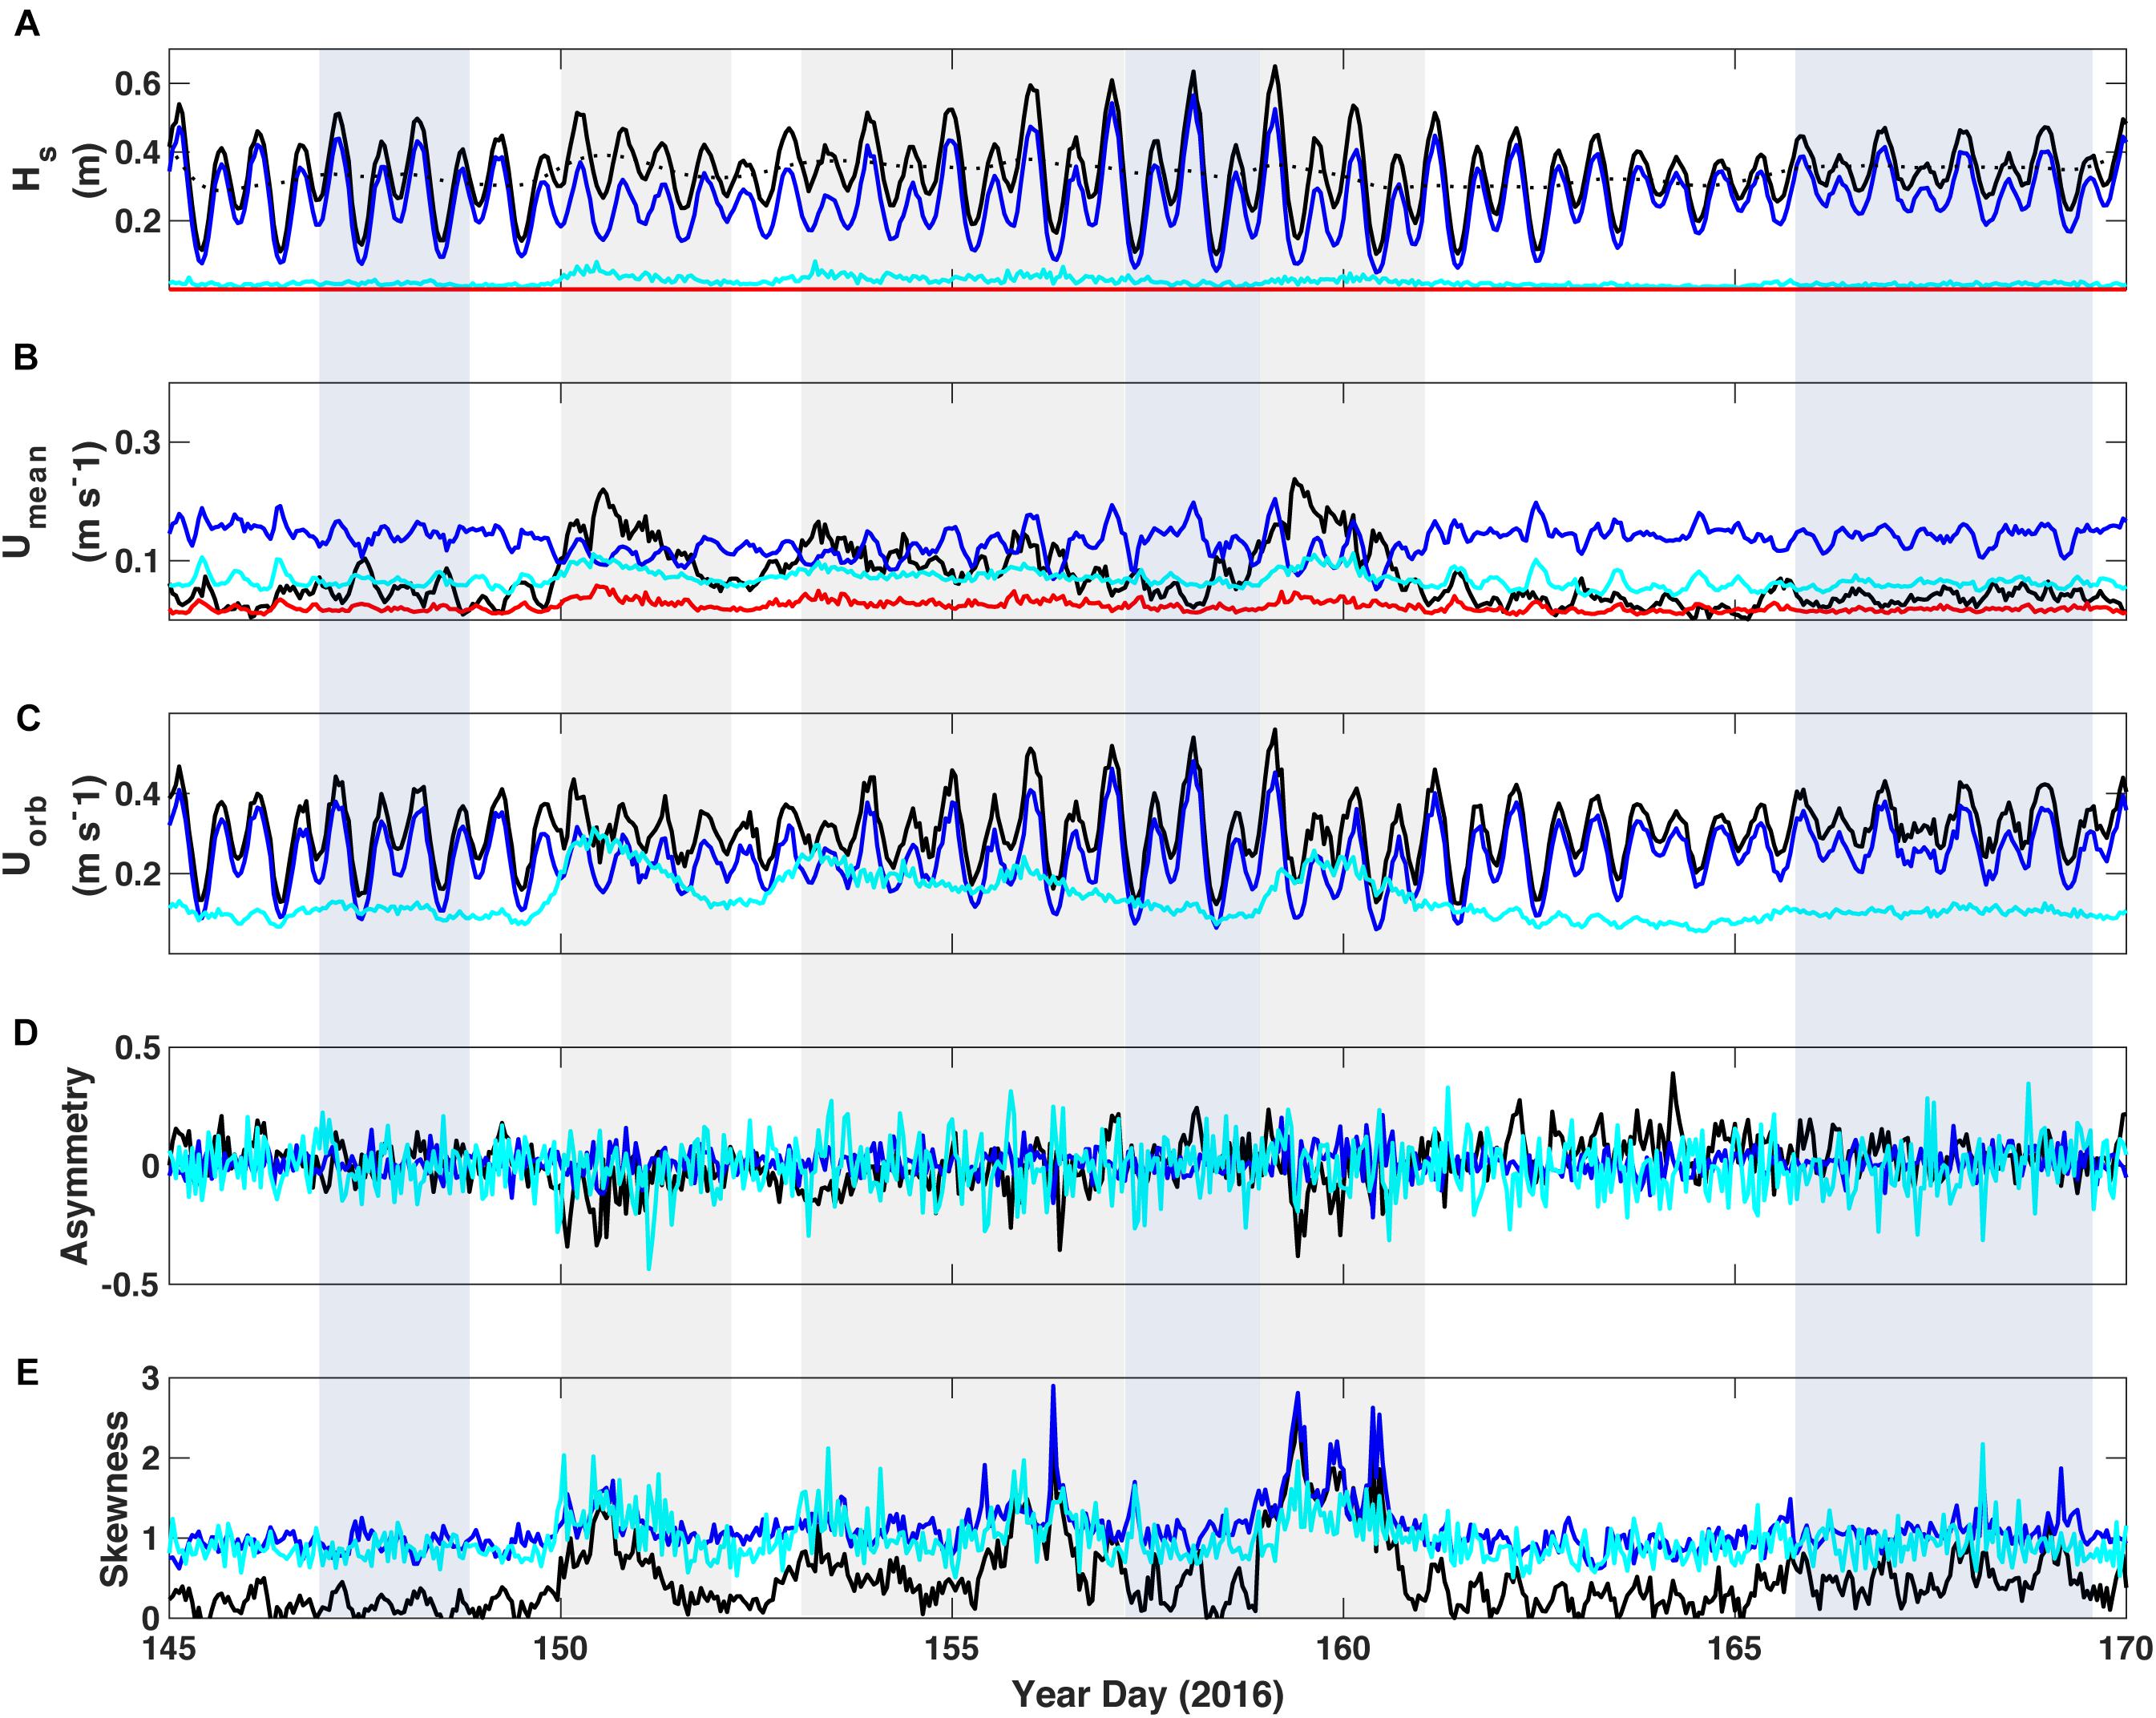
Figure 3. Wave and current parameters delineated by spectral bandwidth at TR1 on the outer reef flat near the reef crest. (A) Significant wave height; the black dotted line denotes the 40-h low-pass filtered wave height. (B) Burst mean near-bed current speed and (C) Near-bed wave-orbital velocity from 10 cm above bottom. (D) Wave asymmetry. (E) Wave skewness. Black = unfiltered data, blue = sea-swell band, cyan = infragravity band, and red = very-low frequency band. Parameters were calculated from hour-long bursts of continuous data; mean current speed of unfiltered data was derived from the vector sum of the burst mean U and V. Energy in the VLF band was significantly lower, if not zero, and is therefore not plotted in Uorb, asymmetry or skewness.
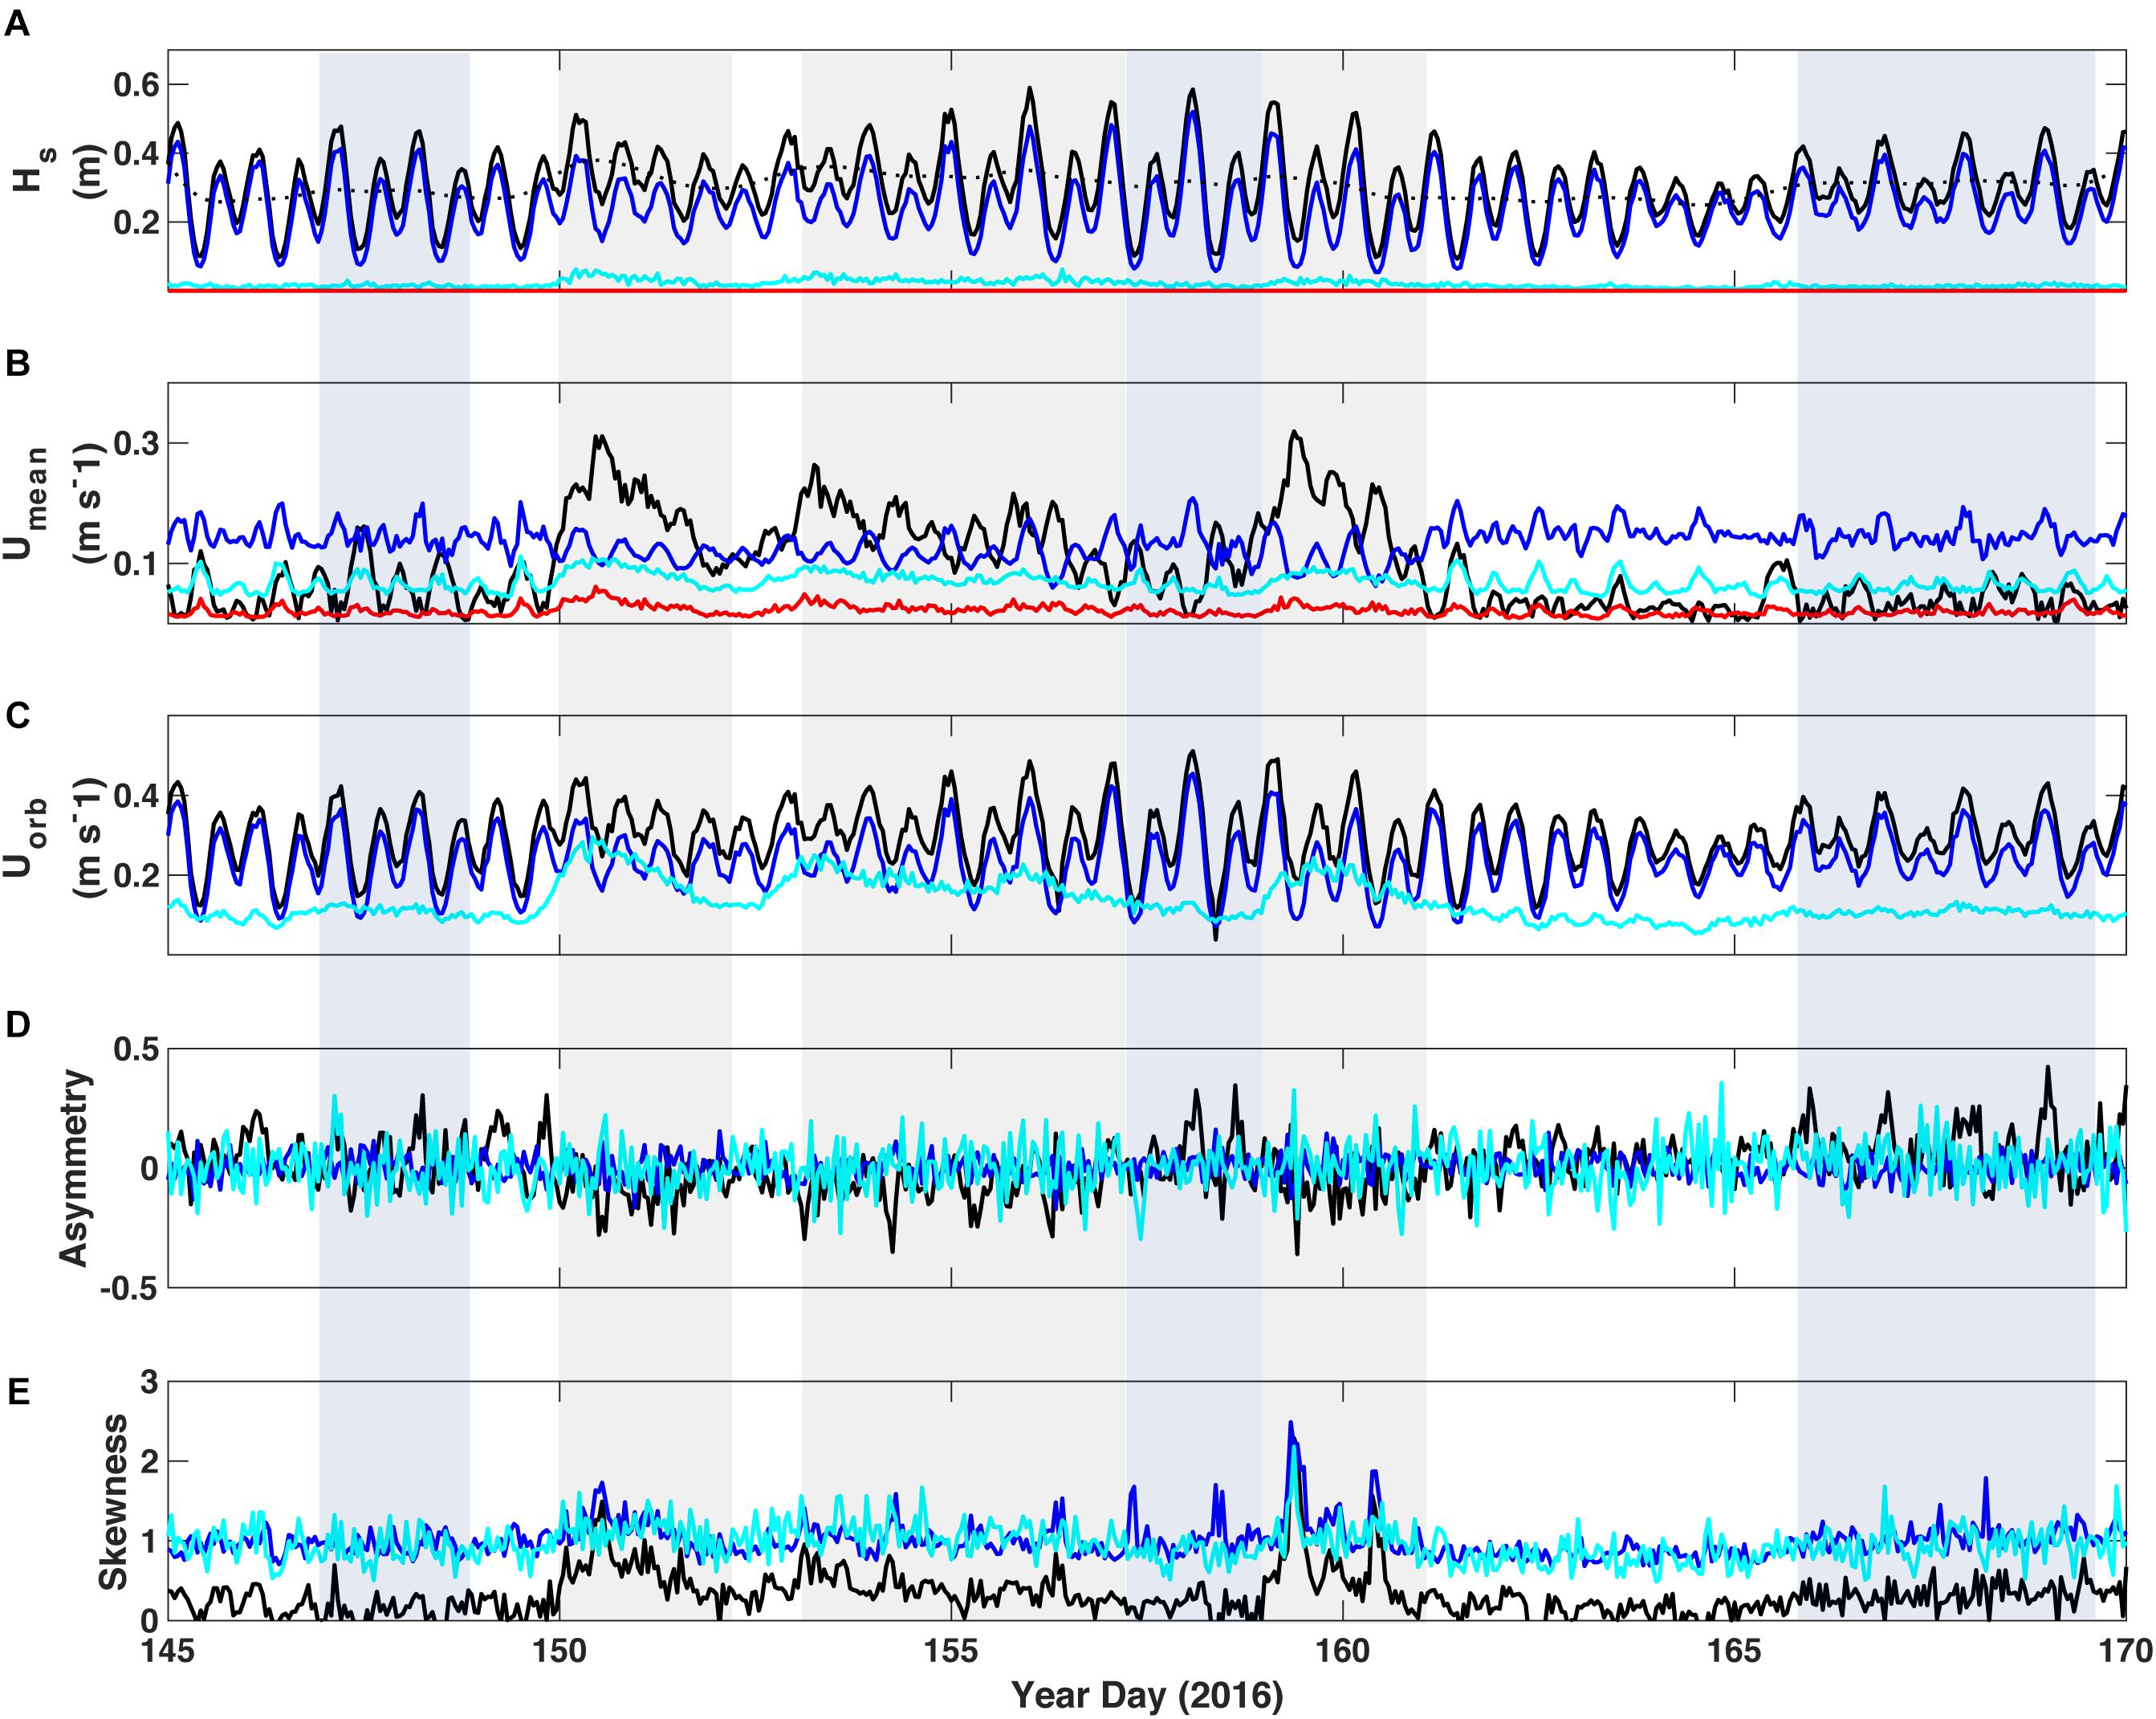
Figure 4. Wave and current parameters delineated by spectral bandwidth at TR2 on the mid-reef flat. (A) Significant wave height; the black dotted line denotes the 40-h low-pass filtered wave height. (B) Burst mean near-bed current speed and (C) Near-bed wave-orbital velocity from 10 cm above bottom. (D) Wave asymmetry. (E) Wave skewness. Black = unfiltered data, blue = sea-swell band, cyan = infragravity band, and red = very-low frequency band. Parameters were calculated from hour-long bursts of continuous data; mean current speed of unfiltered data was derived from the vector sum of the burst mean U and V. Energy in the VLF band was significantly lower, if not zero, and is therefore not plotted in Uorb, asymmetry or skewness.
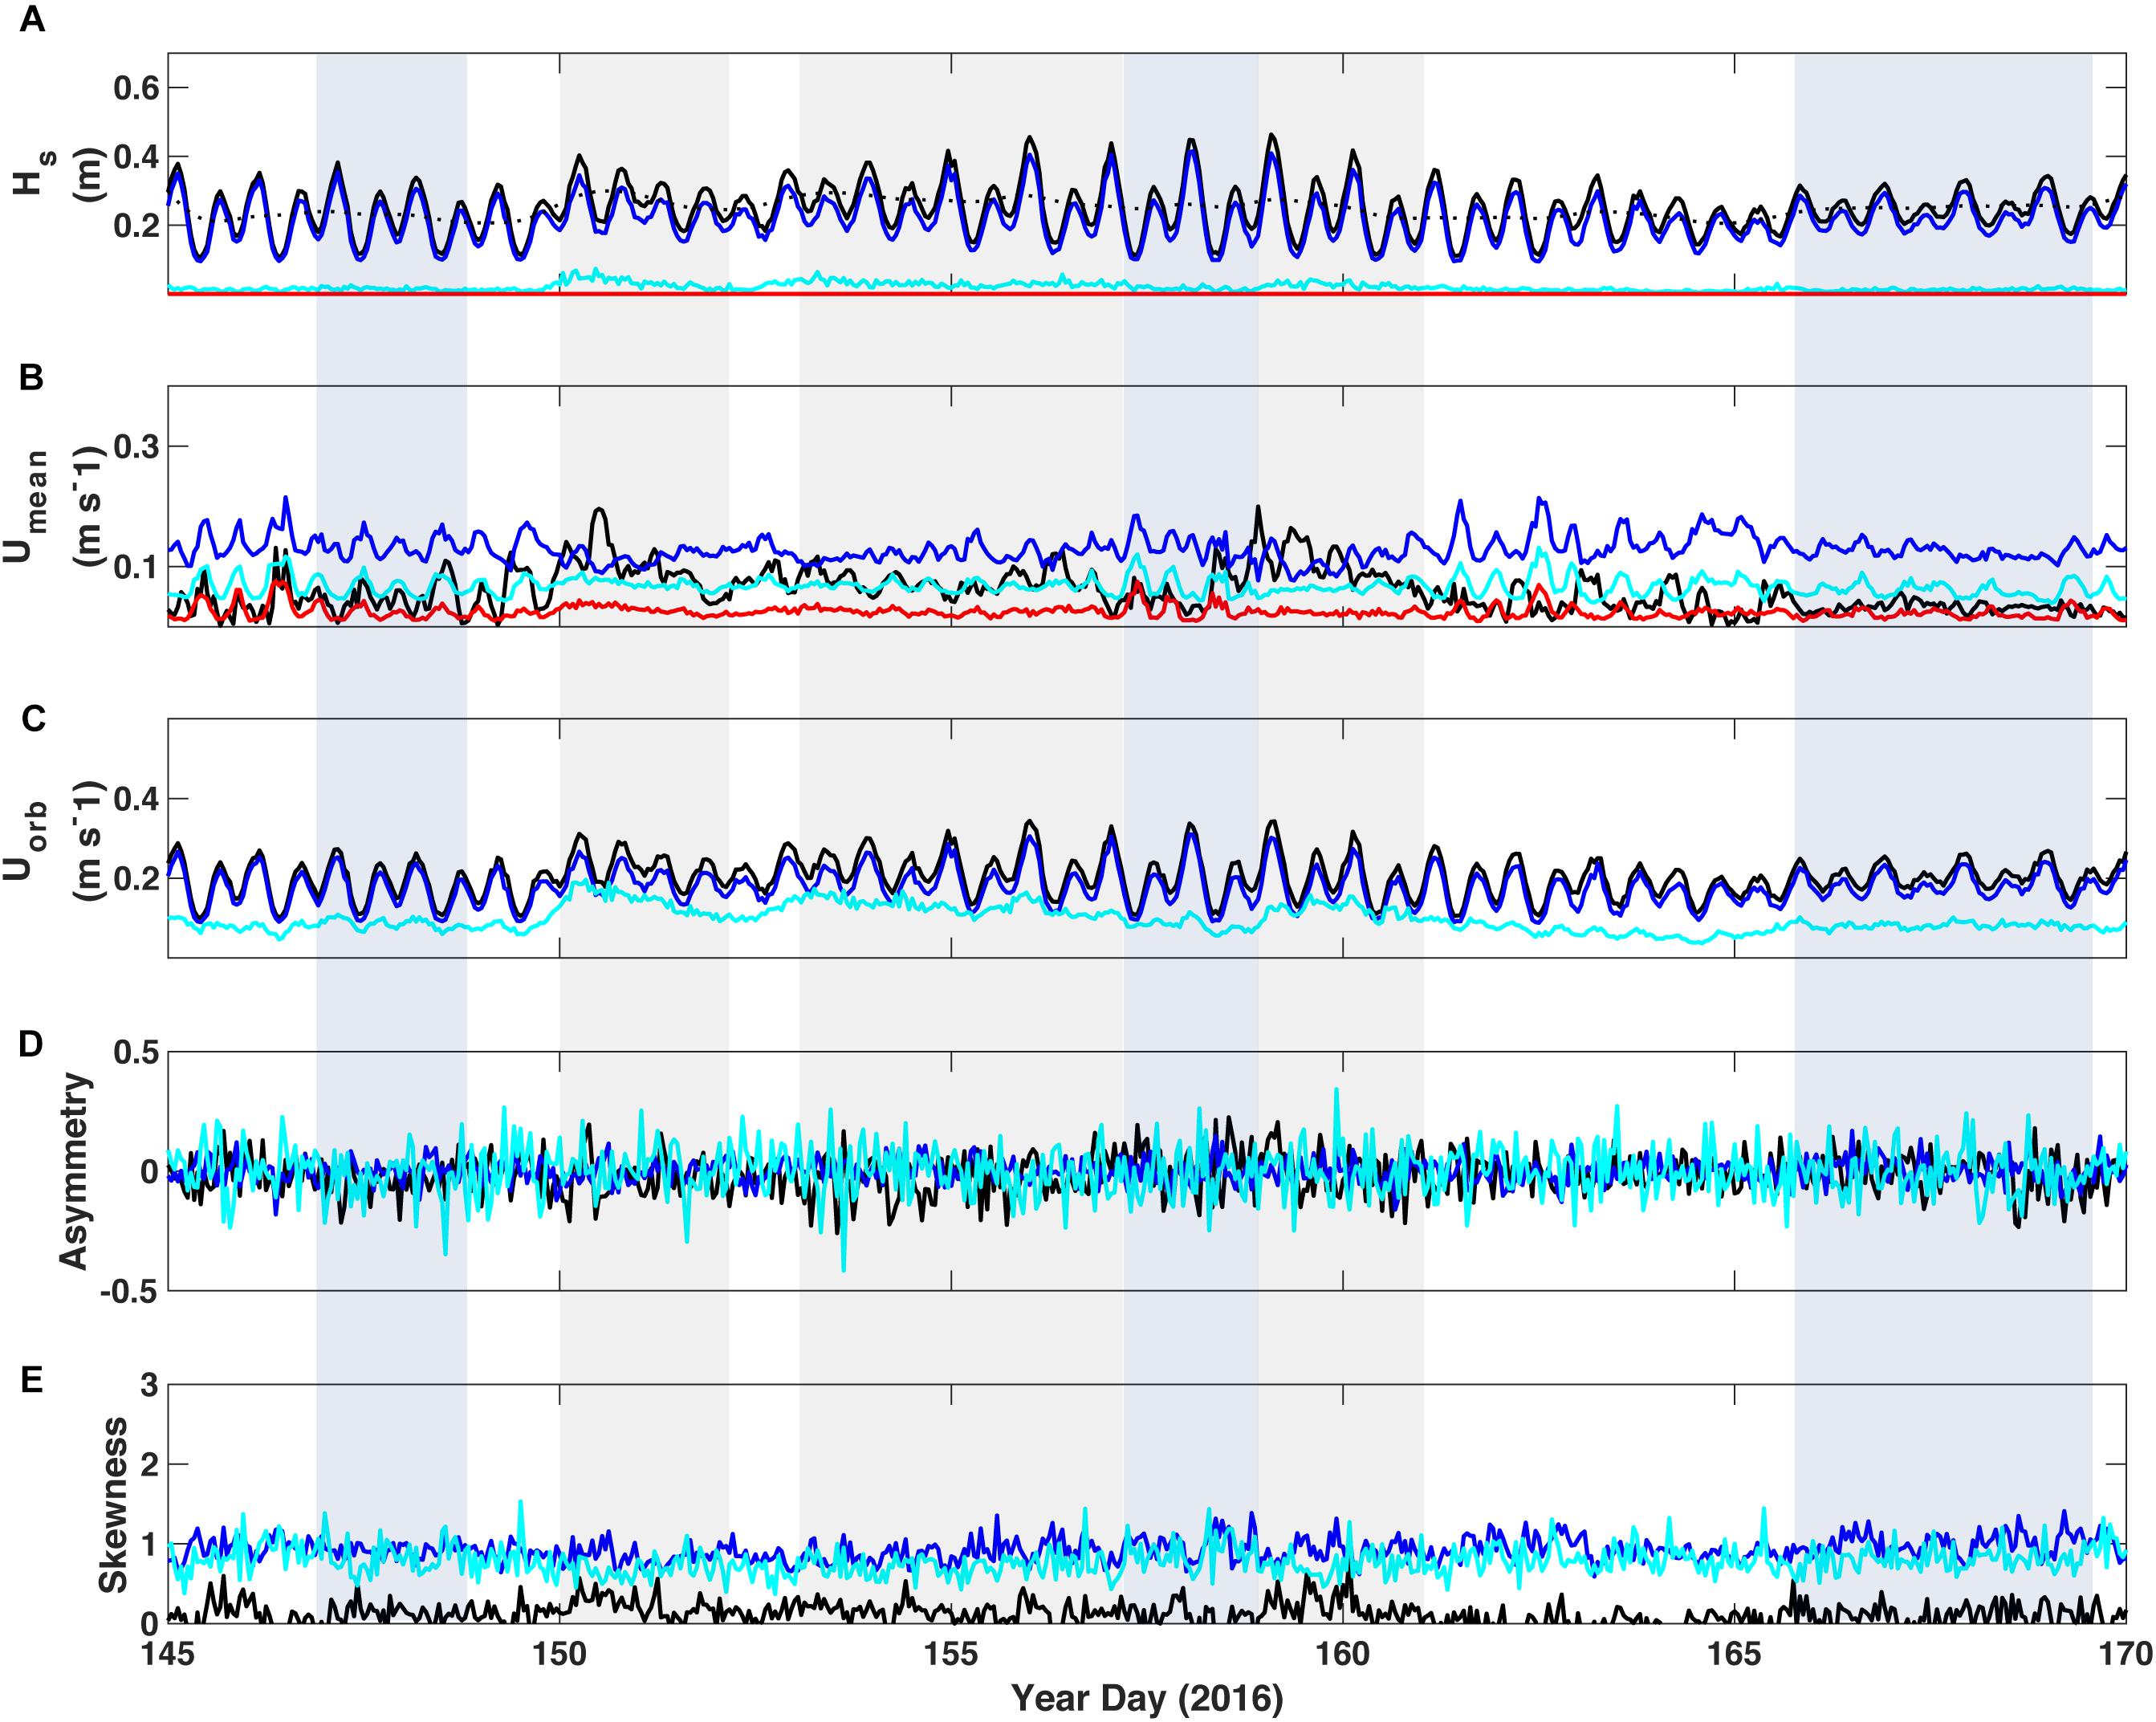
Figure 5. Wave and current parameters delineated by spectral bandwidth at TR3 in the lagoon. (A) Significant wave height; the black dotted line denotes the 40-h low-pass filtered wave height. (B) Burst mean near-bed current speed and (C) Near-bed wave-orbital velocity from 10 cm above bottom. (D) Wave asymmetry. (E) Wave skewness. Black = unfiltered data, blue = sea-swell band, cyan = infragravity band, and red = very-low frequency band. Parameters were calculated from hour-long bursts of continuous data; mean current speed of unfiltered data was derived from the vector sum of the burst mean U and V. Energy in the VLF band was significantly lower, if not zero, and is therefore not plotted in Uorb, asymmetry or skewness.
A gradient in the relative contribution of the lower frequency motions was present across the reef and lagoon. SS-band motions dominate the spectrum near the reef crest (TR1), in Hs, Umean, and Uorb (Figure 3). Umean and Uorb in the IG band represented a significant portion of the total velocity, particularly during periods of increased incident wave energy, even if the Hs in this band were small relative to the total Hs. Otherwise, when waves were moderate or calm, energy due to SS-band waves was dominant and typically elevated, and seemingly enough to keep sediment in motion (as noted in elevated backscatter). Apart from a small contribution to Umean during swell events, energy in the VLF band was substantially lower, and often negligible. Wave asymmetry and skewness were quite variable at both TR1 and TR2 (Figures 3, 4, respectively), with the most significant changes in these parameters (particularly in the SS-band wave skewness) occurring during swell events. Asymmetry of the total, unfiltered wave record at TR2 did show some significant increases on a semi-tidal basis (approximately diurnal), particularly during periods of sustained incident waves not associated with swell events (shaded light blue).
The IG component relative to the other frequencies was greater for Umean and Uorb in the lagoon than on the reef, though its amplitude was small (Figure 5). However, the amplitude of the IG and VLF Umean in the lagoon was nearly as high as on the outer reef flat near the reef crest, though SS amplitude was considerably smaller. The amplitude and variance of asymmetry in the IG band was higher than both the SS band and the unfiltered data. Skewness of both SS and IG were consistently higher than the unfiltered data, as well. However, overall the variance of asymmetry and skewness was lower in the lagoon than on the reef crest, and there was almost no detectable change in these parameters during swell events, in contrast to the reef crest. Wave asymmetry and skewness did not increase toward the shore at this site, in contrast to the results of Cheriton et al. (2016), which may be due to the increase in water depth from the reef flat to the lagoon.
Currents
Currents on the reef respond both to water levels and incident Hs. Umean was usually strongest on the reef flat (Figure 4B) and weakest in the lagoon (Figure 5B), however, there were instances when the reverse was also observed (such as YD 163-165). Strong Umean developed during both swell events (YD 150-152 and 158-162), with the wave setup gradients generated by the breaking waves driving a net onshore flow across the reef that returned to the channels on either side of the reef. The currents also tended to occur at lower water levels due to greater wave dissipation at the reef crest. This was evident during both swell events and average wave conditions alike, such as YD 145-150. The response time of setup-driven Umean on the reef was rapid; Umean across the reef increased from near-zero to peak flow within 1 day (YD 150) and this increase coincided first with the arrival of longer-period incident waves, and secondly with higher-amplitude waves (Figure 4B). Umean receded quickly as incident wave energy decreased. The current direction was almost exclusively toward the shore (averaging 100 deg T), except during periods of very weak flow (not shown).
Sediment Dynamics
Sediment Characteristics
Cuttler et al. (2017) calculated a range of grain density of 2.51–2.76 g/cm3 for the bioclastic sediment on Ningaloo reef from bottom grab samples. We determined grain densities of 1.92, 2.08, and 2.5 g/cm3 and median grain sizes of 0.95, 0.86, and 0.67 mm from samples collected at sites TR1, TR2 and TR3, respectively; these were used to calculate the Shields parameters at each site.
Bed Elevation Changes Across the Reef/Lagoon
Bed elevation changes varied considerably across the reef/lagoon complex. Near the reef crest at Site TR1, there was little apparent accumulation or loss of sediment; the bed level rarely varied more than a few centimeters (Figure 6C). When bed level variation did occur, the variation was detected across all three altimeters simultaneously. This represented whole-scale bed change and not the formation or propagation of bedforms. We interpret that sheet-flow conditions (or suspended sediment transport) dominated at TR1 due to the absence of bedforms, despite a clear source of sediment.
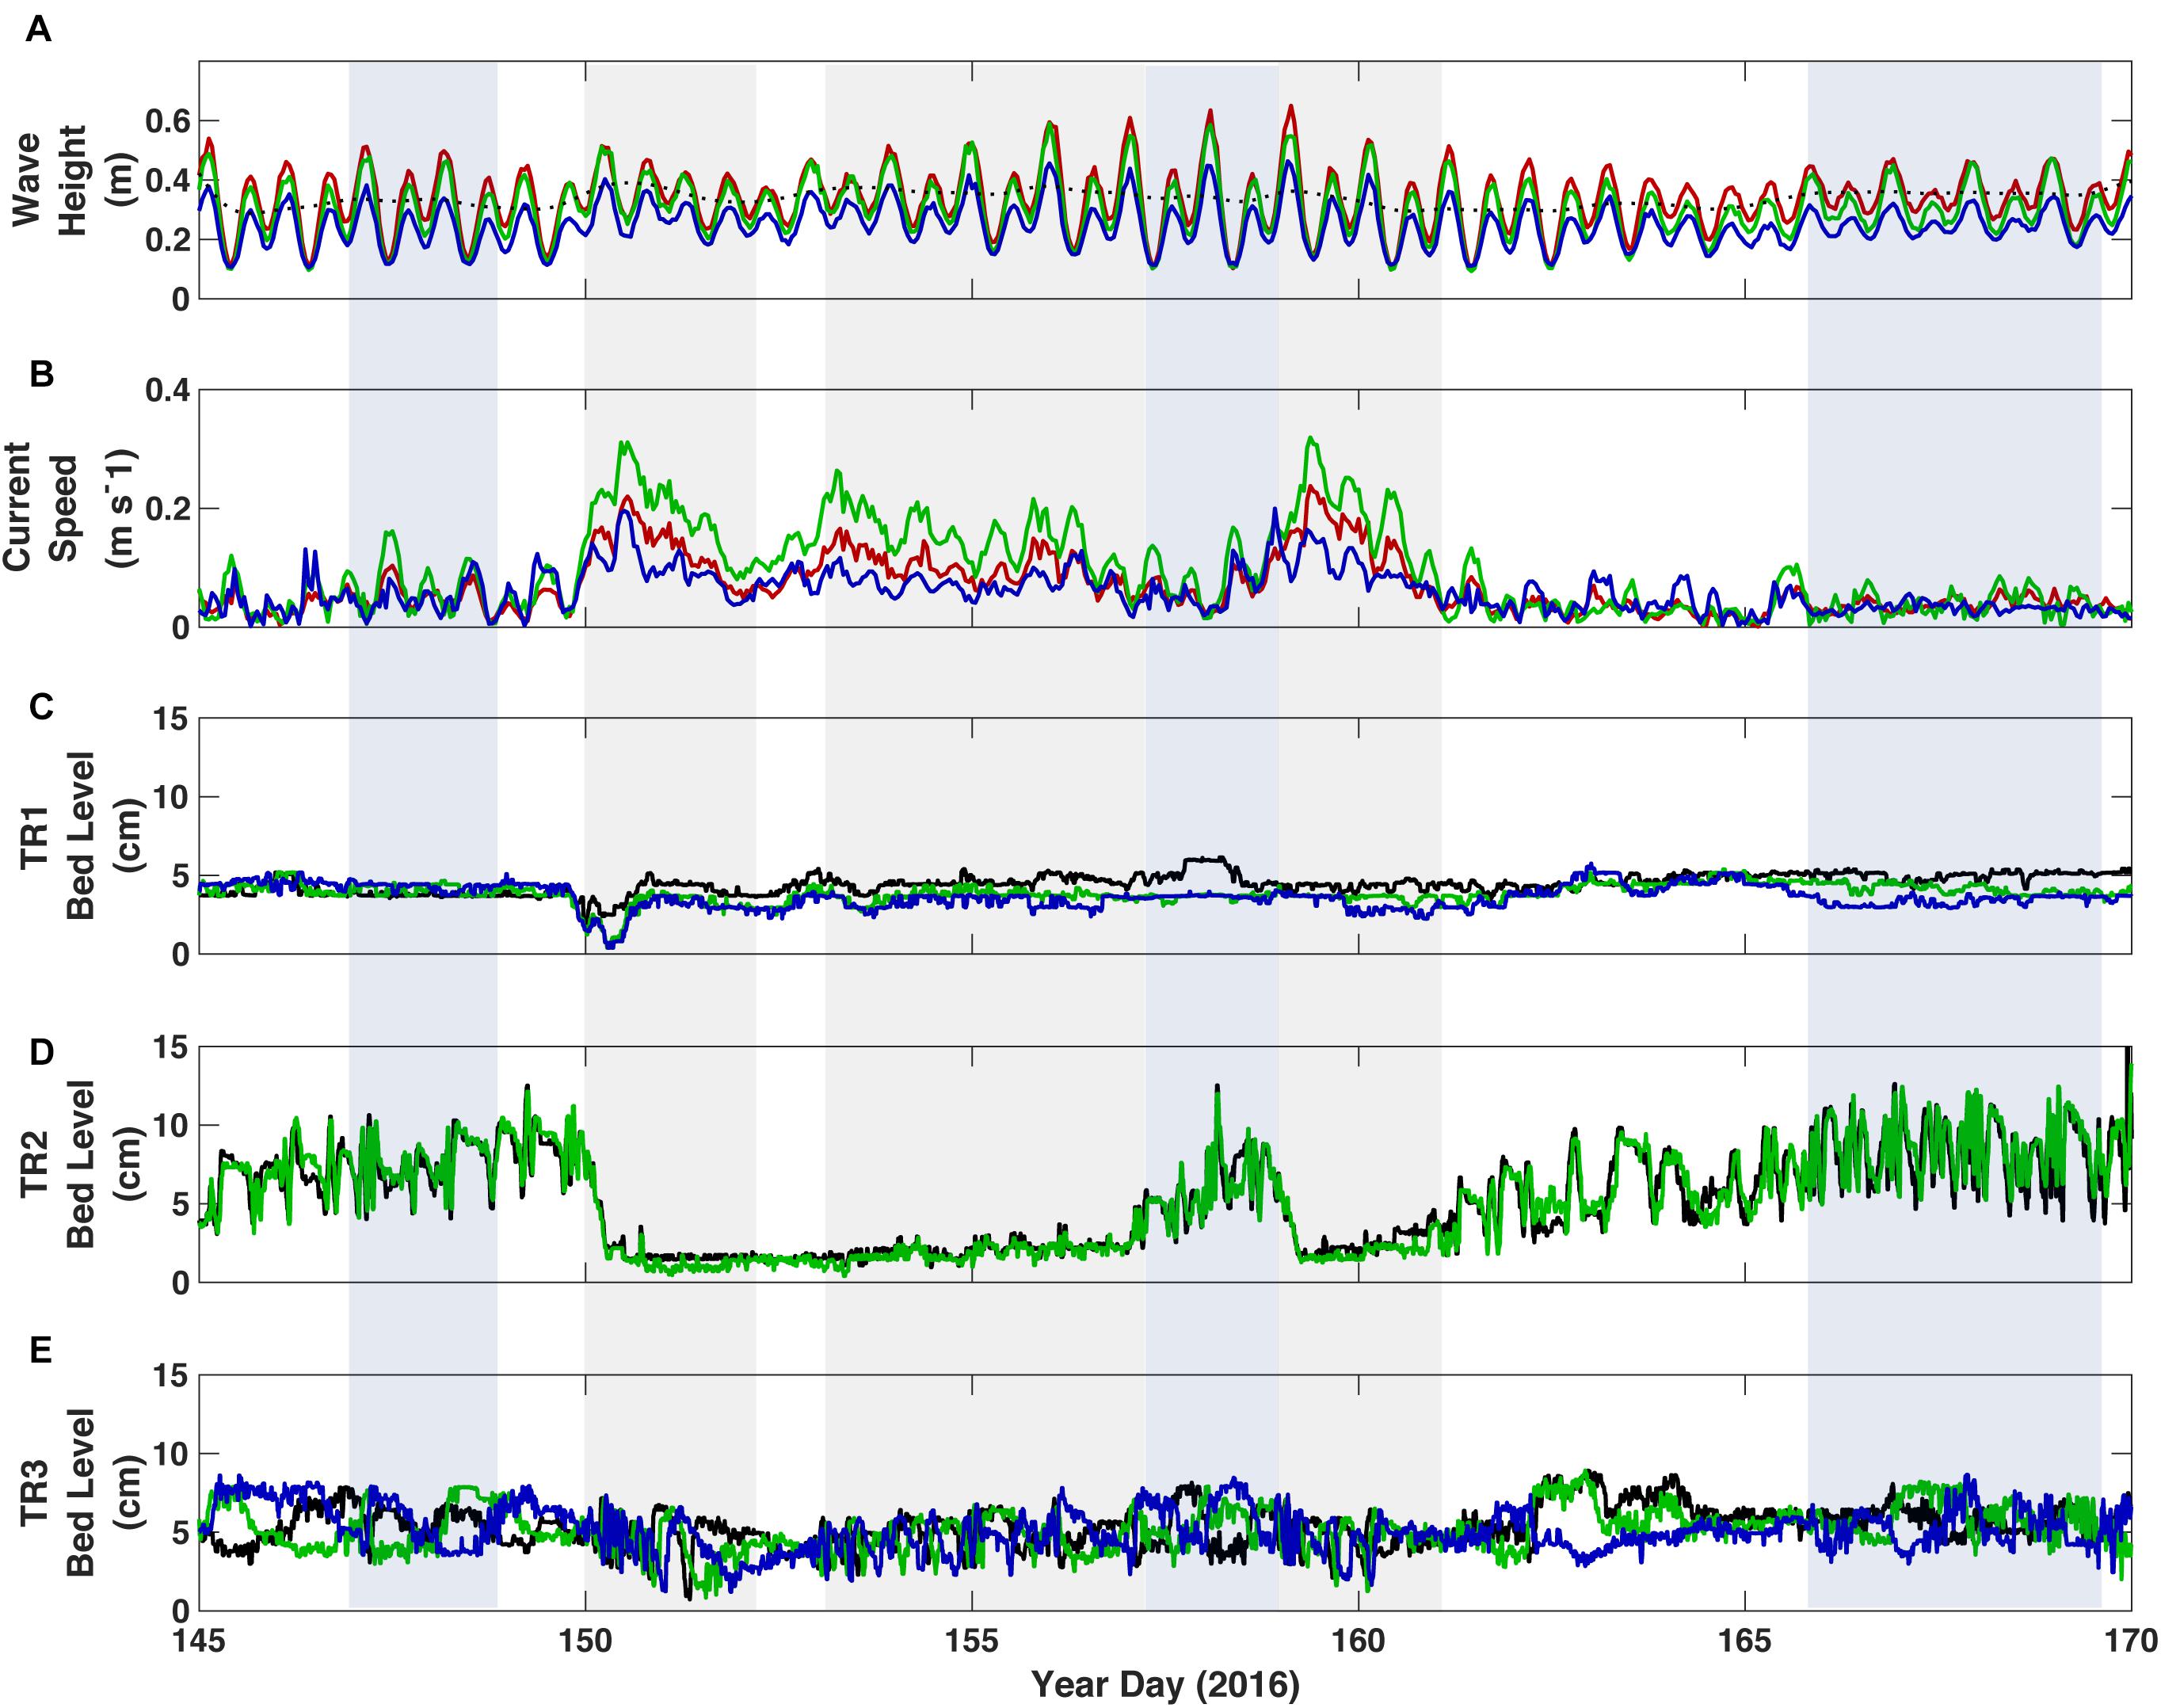
Figure 6. Response of the reef to forcing. (A) Significant wave height; the black dotted line denotes the 40-h low-pass filtered wave height at TR1. (B) Depth-averaged current speed. (C) Bed elevation from the three in-line altimeters at TR1 on the outer reef flat near the reef crest. (D) Bed elevation from the two in-line altimeters at TR2 on the inner reef flat. (E) Bed elevation from the three in-line altimeters at TR3 in the lagoon. In A and B, color represents the site location: Red = TR1 on the outer reef flat near the reef crest, blue = TR2 on the inner reef flat, and green = TR3 in the lagoon. In panels (C–E) colors represent data from individual altimeters, in order from offshore to onshore, black, green and blue.
The greatest variability in bed elevation was observed on the inner reef flat, Site TR2 (Figure 6D). On multiple occasions, sediment accumulated (indicated by an increase in bed elevation across all three altimeters, Figure 6D) and bedforms developed, migrated, and were washed out (indicated by differential changes in bed elevation between adjacent altimeters; Figure 6D). We interpret this to mean that sediment was eroded down to reef pavement at this site. A baseline layer of ∼5 cm of sediment subsequently accumulated under moderate forcing conditions, on top of which bedforms of up to 7.8 cm in amplitude developed and migrated. The migration of bedforms was highly variable and dependent upon wave energy. Bedforms typically migrated for a short period of time and then stalled. Thus bedform migration peaked when Hs was consistent and moderate in amplitude. All of the accumulated sediment (bedforms and the baseline layer) was completely washed off the reef flat when strong currents developed and coincided with larger in situ Hs. This was a rapid process; on two occasions the reef flat was completely stripped of accumulated sediment in less than 1 day (YD 150 and 158). The baseline layer would redevelop once the offshore Hs decreased, strong currents over the reef ceased, and moderate wave conditions returned. The bedforms returned to equilibrium conditions within several days to a week.
In the lagoon, bedforms appeared to be present throughout the study (i.e., the washout of bedforms that was observed on the inner reef flat did not occur), and there was little variability in average bed elevation (Figure 6E). The migration of bedforms was highly variable, and usually only occurred during periods of largest offshore Hs. There were extended periods where seemingly no bedform migration occurred; this is explored further below.
The discrepancy in sediment response between TR1 and TR2, despite similar hydrodynamics is confounding, and our primary explanation is the presence/absence of vegetation and/or reef roughness elements that act to trap sediment. It is possible that the lower frequency waves at the reef crest form in standing waves, and that Site TR1 sits at an antinode. To investigate this, we calculated coherence between horizontal velocity and pressure, vertical velocity and pressure, and horizontal and vertical velocity, both during swell events (when IG energy tends to be higher) and non-swell events. The results indicate that in the IG band, the system behaves as a progressive wave at both sites TR1 and TR2. During swell events, there is strong coherence between U and P in the IG band, and the phase is between 0 and 45 degrees, suggesting a progressive wave. There is also strong coherence between U and W in the IG band in these periods, but the phase is more like 90 degrees, again suggestive of a progressive wave (per Dean and Dalrymple, 1991). Thus, the idea of a standing wave in the IG band does not appear to be the case here.
Bedform Migration and Bedload Transport
The rate of bedform migration, as measured by sequential altimeters, was highly variable in time, and ranged from 1–14 m/d on the reef flat to 1–9 m/d in the lagoon (Figure 7). On the inner reef flat, the maximum in ripple migration rate did not coincide with peak incident wave energy, as these larger wave events lead to washout conditions. Migration on the inner reef flat was highly variable even when the incident wave energy was consistent, such as during the latter part of the study period (YD 165-170). Acceleration in migration rate was both gradual and sudden on the reef flat; at times migration rate gradually increased and decreased, while at other times the change in migration rate was sudden. Notably, bedforms on the reef flat were predominantly linear (i.e., not two-dimensional or bifurcated), and the orientation was almost exclusively normal to the array of transducers, as confirmed by plan-view video data of the seabed collected by the tripods (not shown). Video data also confirm that migration was exclusively toward the shoreline. Given that there was potential for bedform orientation to change over the course of the deployment, migration rates reported here represent a minimum and could have been larger if bedforms were migrating obliquely to the transducer array.
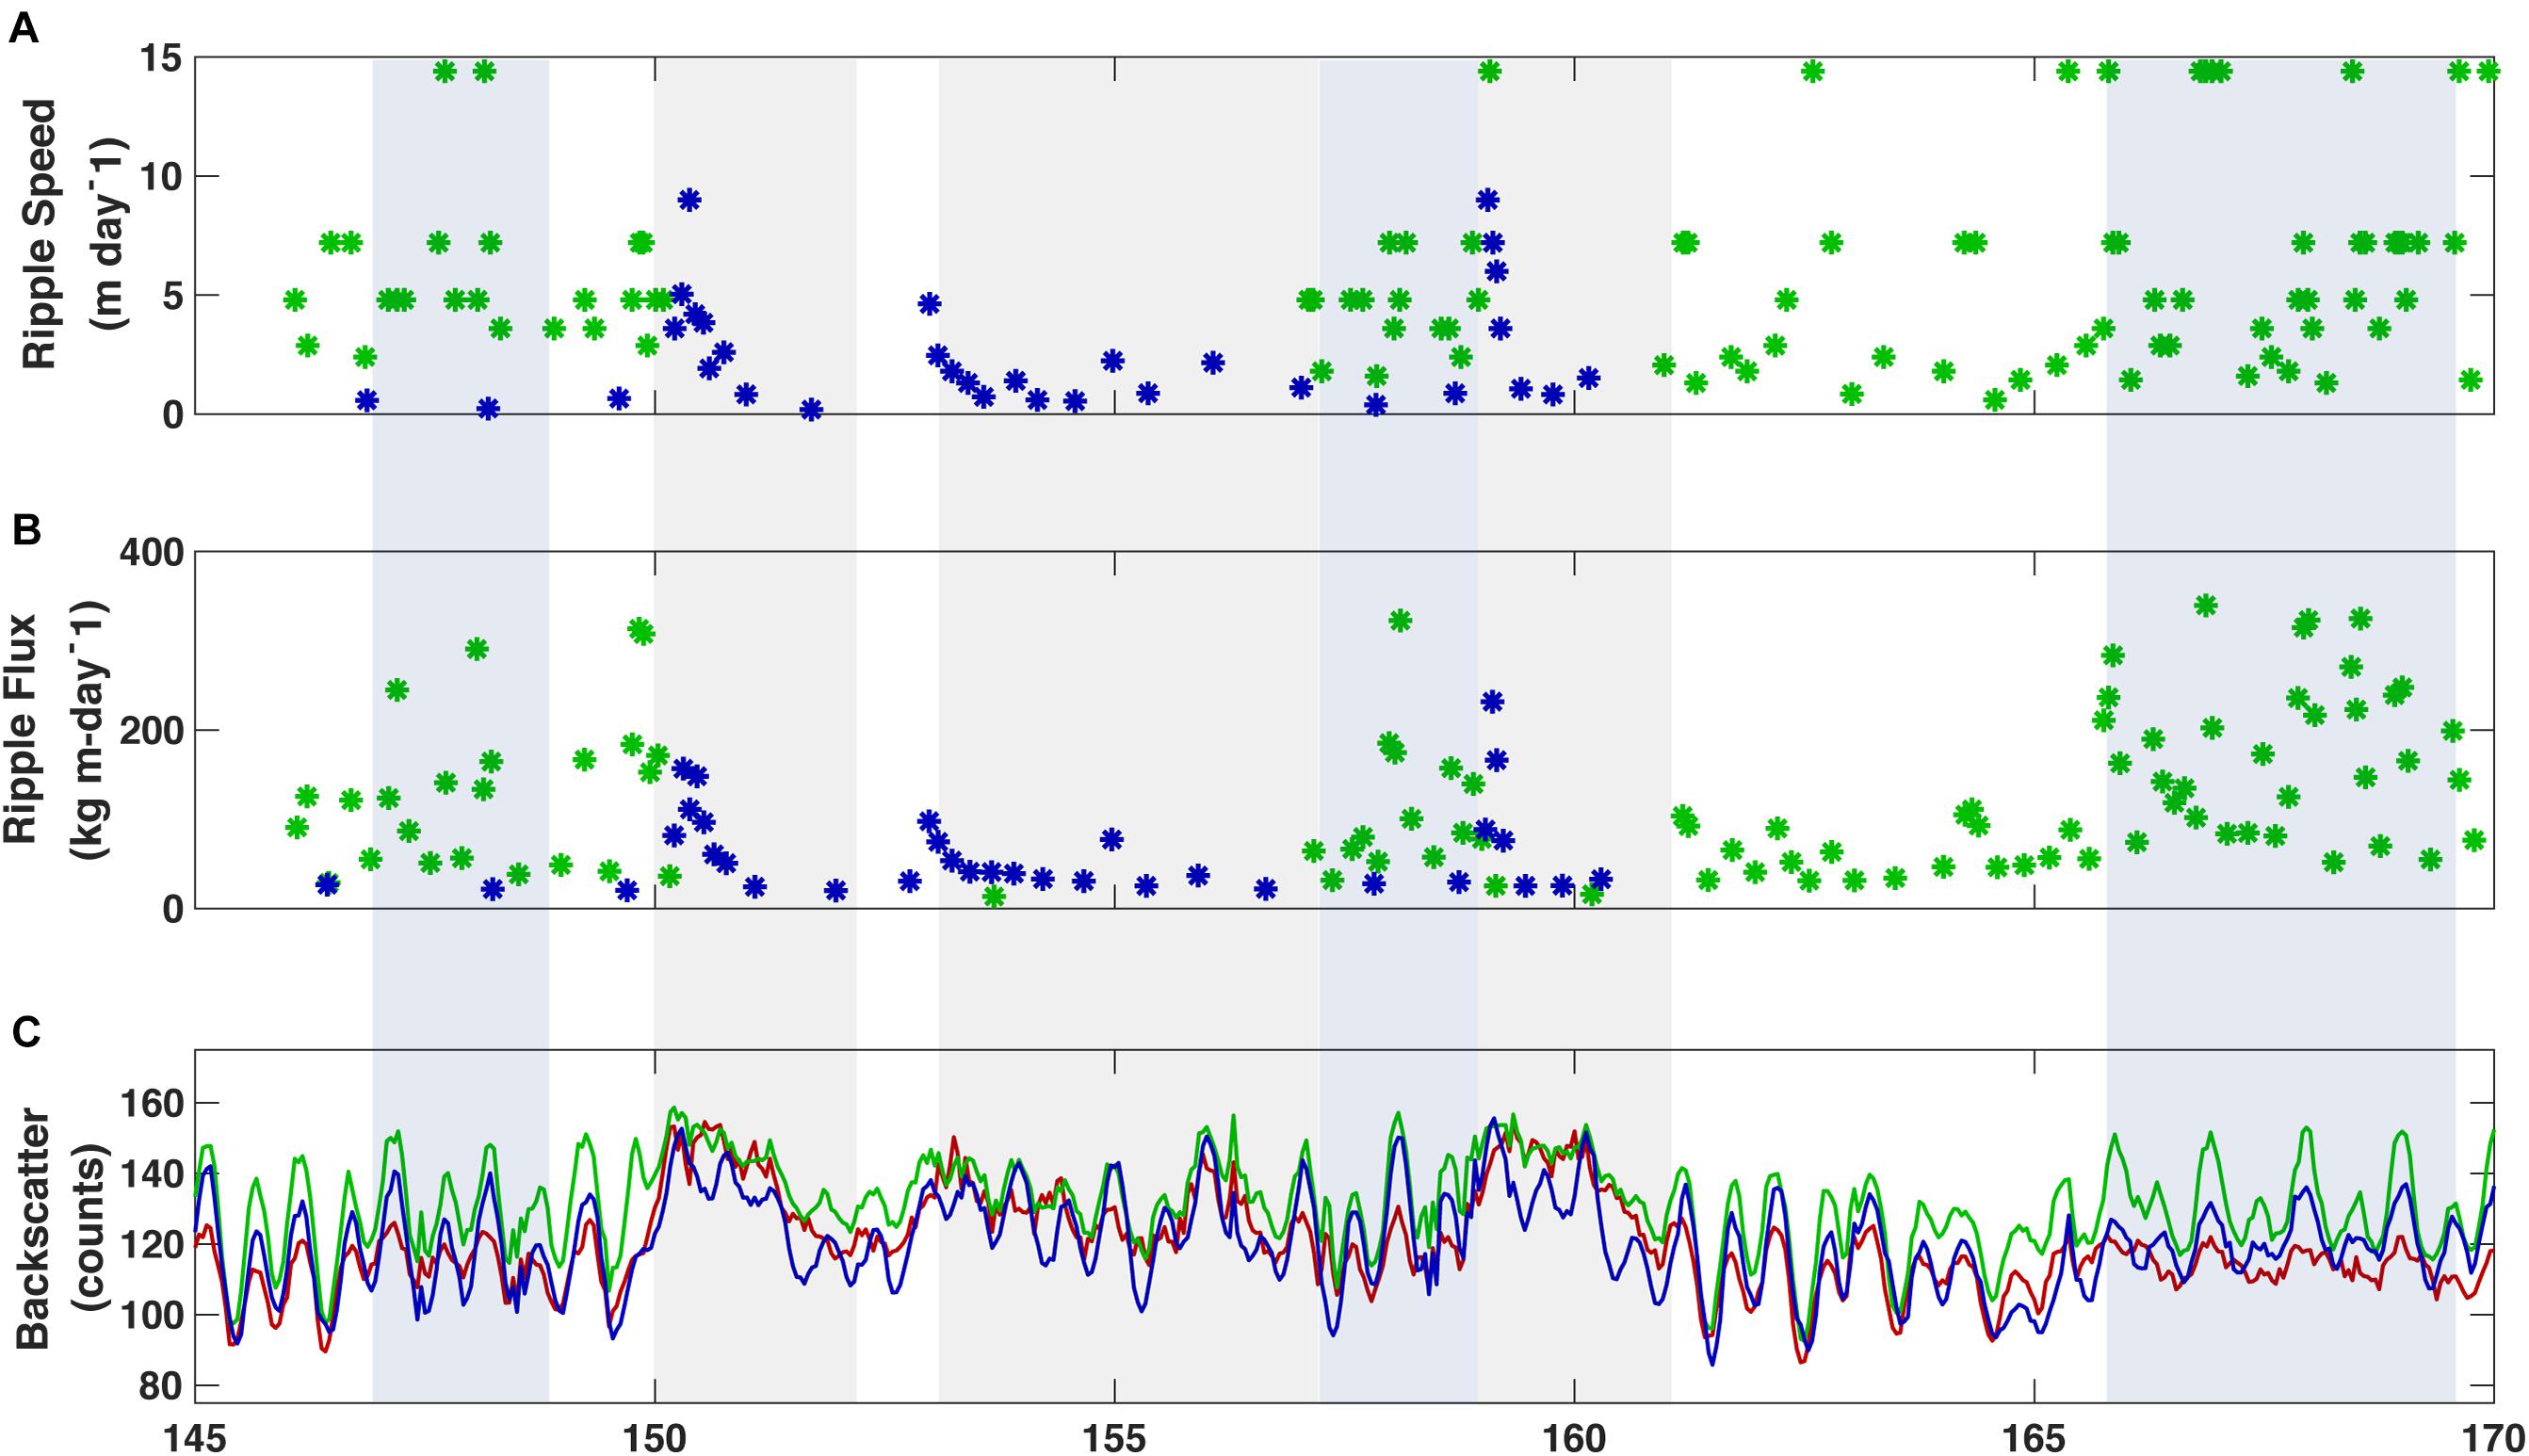
Figure 7. Sediment flux parameters measured at the three sites across the reef flat and lagoon. (A) Bedform migration rate. (B) Total sediment flux by migrating bedform. (C) Near-bed acoustic backscatter from 10 cm above bottom, a proxy for suspended sediment. Color represents the site location: Red = TR1 on the outer reef flat near the reef crest, blue = TR2 on the inner reef flat, and green = TR3 in the lagoon.
The flux of sediment toward the shore associated with bedform migration on the reef flat at TR2 ranged from 13 to 485 kg/m/d, with an average daily rate of 61 kg/m/d. This average does not include the time period after ripples had washed out on sheetflow conditions (YD 150-157). Periods of higher average sediment flux due to ripple migration did not always coincide with instantaneous peaks in ripple migration rate, highlighting the ephemeral nature of migration. Near-bottom average acoustic backscatter on the reef flat illustrates the degree to which the transport is tidal, particularly when bedforms were present. When bedforms washed out, near-bottom backscatter was consistently elevated, demonstrating a shift to transport by suspended load on the reef flat under high-energy forcing.
In the lagoon, bedforms appeared to be present throughout the study (i.e., washout of bedforms did not occur, as was observed on the inner reef flat), and the average bed elevation varied little. Migration would peak at the onset of a swell event, gradually slowing, and eventually ceasing altogether (Figure 7A). While bedform migration and transport was observed on the inner reef flat in the latter half of the study period, after the swell events, there was no detectable bedform migration in the lagoon for several days. This is not to say that there was no change in bed elevation; there was still variability of up to 5 cm in the ∼1-week period after the second swell event on YD 162-170 (Figures 6D,E). This change was slow and variable between altimeters such that it was difficult to identify coherent peaks in bedforms. Bedform sediment flux toward the shore was reduced in the lagoon relative to the reef flat and when bedform migration was detected ranged from 20 to 231 kg/m/d, with an average daily rate of 34 kg/m/d when migrating bedforms were detected (Figure 6B). The average daily rate calculated for the lagoon over the same 23-day period that bedform migration was detected on the reef flat is half as much as that measured on the reef flat (19 kg/m/d).
Near-bed suspended-sediment levels (using ADP acoustic backscatter from 10 cm above bottom as a proxy) on the reef varied with higher wave energy and enhanced currents (Figure 7C). Suspended sediment levels were generally higher on the reef flat than near the reef crest or in the lagoon. During periods of highest incident wave energy (such as YD 150-152 and YD 158-162), suspended sediment tended to remain elevated throughout the system. This is coincident with the period when bedforms were washed out, and suggests a transition from bedload to suspended load dominated transport. In the interim period between swell events when incident Hs were large (1–2 m), suspended sediment on the reef remained elevated in the lagoon but demonstrated more tidal variability. During periods of lower to moderate forcing, suspended sediment on the reef flat displayed a strong tidal signature; this is especially evident when bedforms were present. This is interpreted as the result of ejection of sediment higher into the water column off the faces of bedforms. The tidal nature of near-bottom suspended sediment is more prevalent in the lagoon, as the suspended load increased and decreased with the tide even during peak incident wave forcing.
Discussion
Primary Modes of Transport
The dimensions and rate of change of bedforms in shelf seas has been shown to scale with the imparted shear stress whether it be due to the wave-orbital diameter or average current velocity (Baas, 1993; Traykovski, 2007; Soulsby et al., 2012), and we expect the same to be true on a coral reef. Cacchione et al. (1999) showed that bedform migration rate in a reef channel on Kailua, Oahu, was proportional to the power of the near-bottom combined wave-current speed cubed (approximately). However, in this study no clear relationship was found between migration rate and imparted shear stress due to currents alone on the reef or in the lagoon (not shown). The same was true for combined wave-current stress on the reef flat – both low and high ripple migration rates occurred over a wide range of shear stress and water levels (Figure 8). This was observed for the SS and the IG bands, as well as total combined shear stress, although there were more instances of moderate migration rate when compared to IG shear stress at lower water levels. A better correlation between imparted shear stress and migration rate existed in the lagoon; higher migration rates almost exclusively occurred at higher stresses and water levels, particularly for combined total shear stresses.
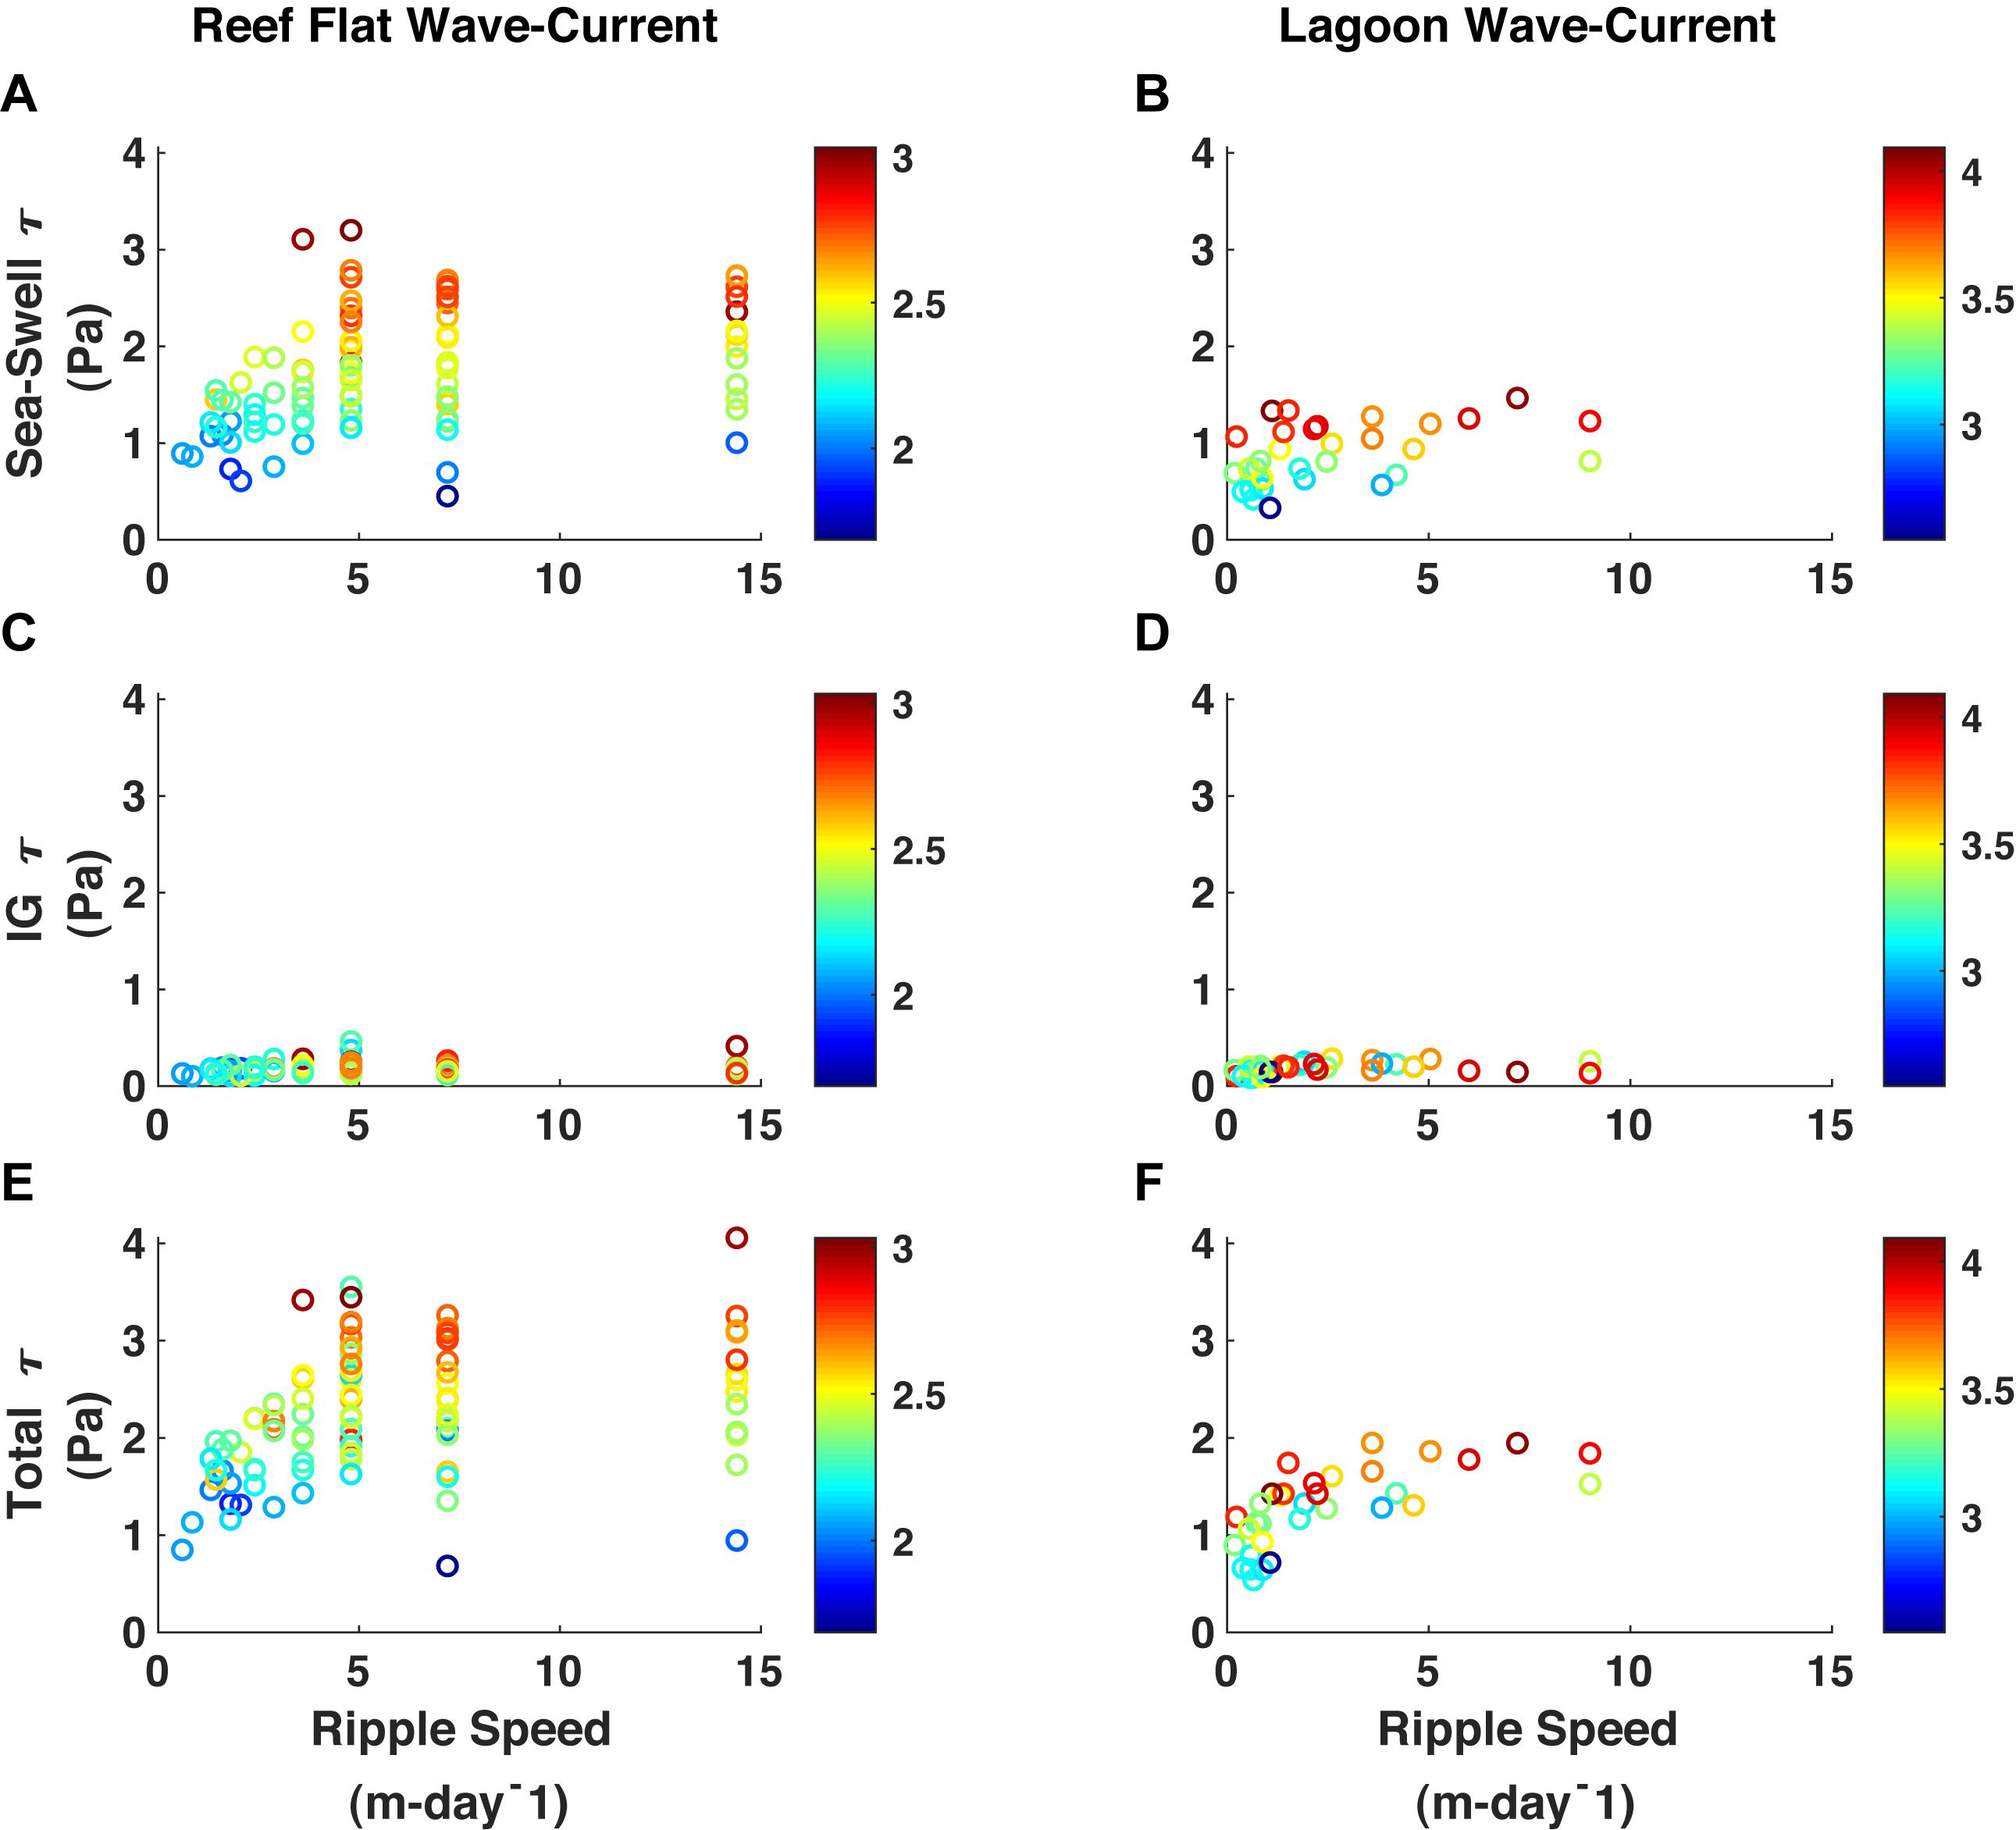
Figure 8. Shear stress (τ) versus ripple speed as a function of water level. (A) τ due to sea-swell waves at TR2 on the inner reef flat. (B) τ due to sea-swell waves at TR3 in the lagoon. (C) τ due to infragravity waves at TR2 on the inner reef flat. (D) τ due to infragravity waves at TR3 in the lagoon. (E) Total τ at TR2 on the inner reef flat. (F) Total τ at TR3 in the lagoon. Color denotes the total water level, in meters.
Given the lack of relationship between imparted shear stress and bedform migration rate on the reef flat, we postulate that the supply of sediment plays an important role in controlling migration rate. The washout of all bedforms and sediment confirms that the supply of sediment on the reef was not consistent. After the first instance of washout on YD 150, it took several days for a baseline of sediment to accumulate on the reef again, during which time migration rates were average even though incident Hs remained elevated. Similarly, after the second washout period on YD 159, the highest bedform migration rates on the reef flat did not occur until an established baseline of sediment had accumulated and incident Hs were once again elevated.
Bedform migration in the lagoon also appeared to be related to the supply of sediment, even if there was a slightly stronger relationship between migration rate and shear stress. The two periods of highest ripple migration in the lagoon occurred immediately after the reef flat had been cleared of sediment (YD 150 and YD 158, Figure 6). In the first event, an increase in offshore Hs began around YD 149.75 and resulted in higher Uorb both on the reef flat and in the lagoon (Figure 9). There was a corresponding migration of bedforms on the reef flat at this time, but not in the lagoon. The bed level on the reef flat dropped quickly as shear stresses due to Umean increased and sediment was washed off the reef flat (YD 150.00-150.25). Once the sediment was completely washed off the reef flat and local Uorb began to increase with the rising tide, bedforms began to migrate quickly in the lagoon, subsequently slowing once Uorb began to decrease again. When the local Uorb increased again to the previous level, bedforms in the lagoon again began to migrate, albeit at a much slower pace. Although the shear stresses were seemingly the same, bedform migration was not nearly as prominent without an influx of new sediment.
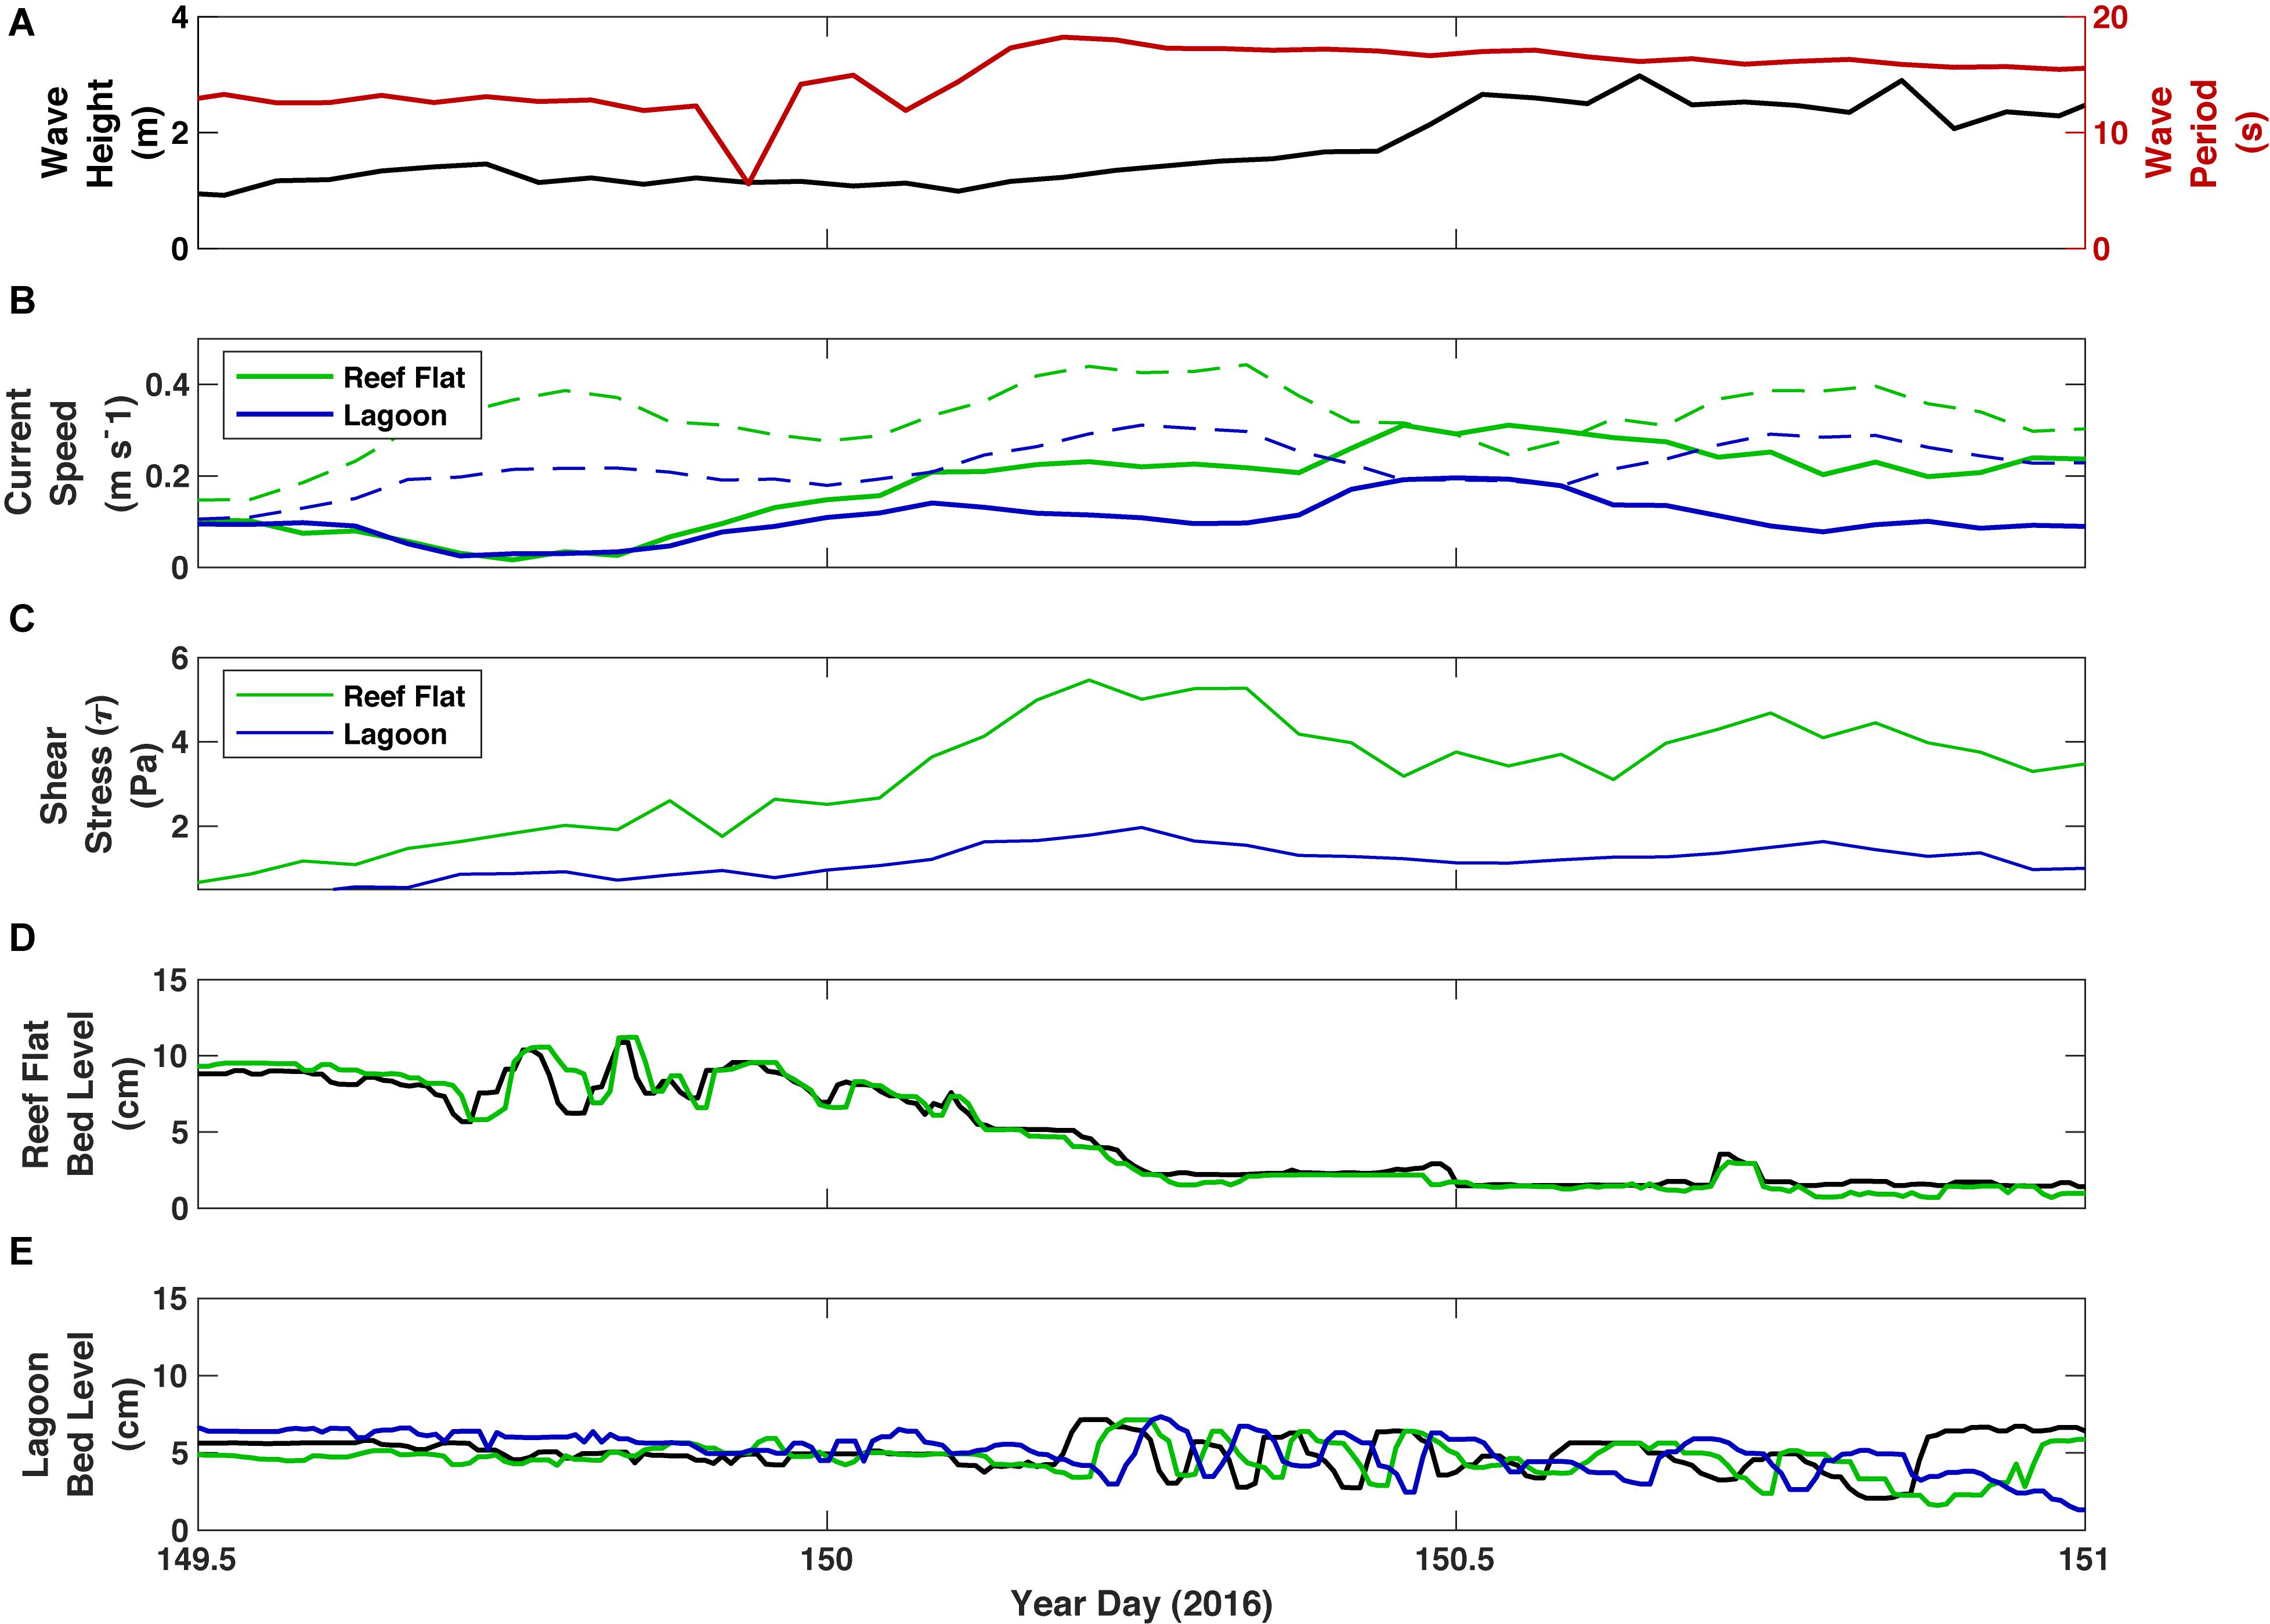
Figure 9. Wave and current parameters and bed elevation from TR2 on the inner reef flat and TR3 in the lagoon during a transition period when ripples on the reef flat were washed out and sediment input to the lagoon peaked. (A) Offshore significant wave height (black) and peak wave period (red). (B) Burst mean current speed (solid) and wave orbital velocity (dashed) on the reef. (C) Total shear stress (τ) (D) Bed altimetry at TR2 on the inner reef flat. (E) Bed altimetry at TR3 in the lagoon. Colors in panels (D,E) represent data from individual altimeters, in order from offshore to onshore, black, green and blue.
Infragravity Contribution to Bedload Transport
In a laboratory study using a physical model of a fringing reef, Pomeroy et al. (2015a) showed that the IG component of suspended-sediment flux in a laboratory setting can be as high, if not higher, than the SS component. In our study, it does not appear from the relationships of bedform migration rate to U* that the IG energy alone was responsible for moving sediment on the reef, but this does not mean that it is not important. Periods of enhanced bedform migration corresponded to periods of higher IG energy, both on the reef flat and in the lagoon. In particular, Uorb associated with IG waves comprised a significant portion of the total near-bed Uorb (Figure 5). For instance, SS-band Uorb during YD 152-155 were comparable to those during YD 162-165 in the lagoon, yet no detectable bedform migration was observed during the latter period. The difference is that offshore Hs, and subsequently local IG energy (both Umean and Uorb) was elevated during the former period. This was similarly noted on the reef flat; the SS wave energy during the period of YD 160-165 was comparable to that of the period of YD 165-170, yet the sediment flux by migrating bedforms was considerably smaller during the former. IG wave energy on the reef flat was elevated during the latter period in this instance.
Perhaps more important to sediment transport than the IG energy at a given time is the increased wave asymmetry and skewness under IG waves. Wave asymmetry results in a skewed near bottom velocity distribution (Ruessink et al., 2009; Tissier et al., 2015) and can contribute to net onshore or offshore transport, depending on sediment types (Aagaard and Greenwood, 2008; de Bakker et al., 2016). A transition to higher wave asymmetry and skewness toward the shore (particularly in the IG and VLF frequency bands) has been shown to occur in reef environments (Cheriton et al., 2016; Pomeroy et al., 2015a). Thus, while the shear stress associated with individual IG waves may not be high enough to mobilize sediment alone, the contribution of IG waves with higher asymmetry to the background SS energy may result in bedload transport both on the reef flat and in the lagoon.
Wave- vs. Current-Dominated Transport
The Soulsby et al. (2012) critical Shields parameters were accurate predictors of washout and sheetflow conditions at the reef flat site (Figure 10). The washout of bedforms coincided with current Shields parameter (θcur) surpassing the washout Shields parameter (θwo), and when θcur dropped below θwo around YD 157, bedforms began to form again on the reef flat. The timing of the wave Shields parameter (θwv) surpassing the critical Shields parameter for sediment mobilization (θcrit) was consistent with bedform migration on the reef flat. The Shields parameter did not seem to be an accurate predictor of sediment behavior at the reef crest, however. Even though sediment was not observed to accumulate at the reef crest (presumably due to sheetflow conditions), θcur only exceeded θwo on two occasions. Nevertheless, θwv was often above critical for sediment movement at this location.
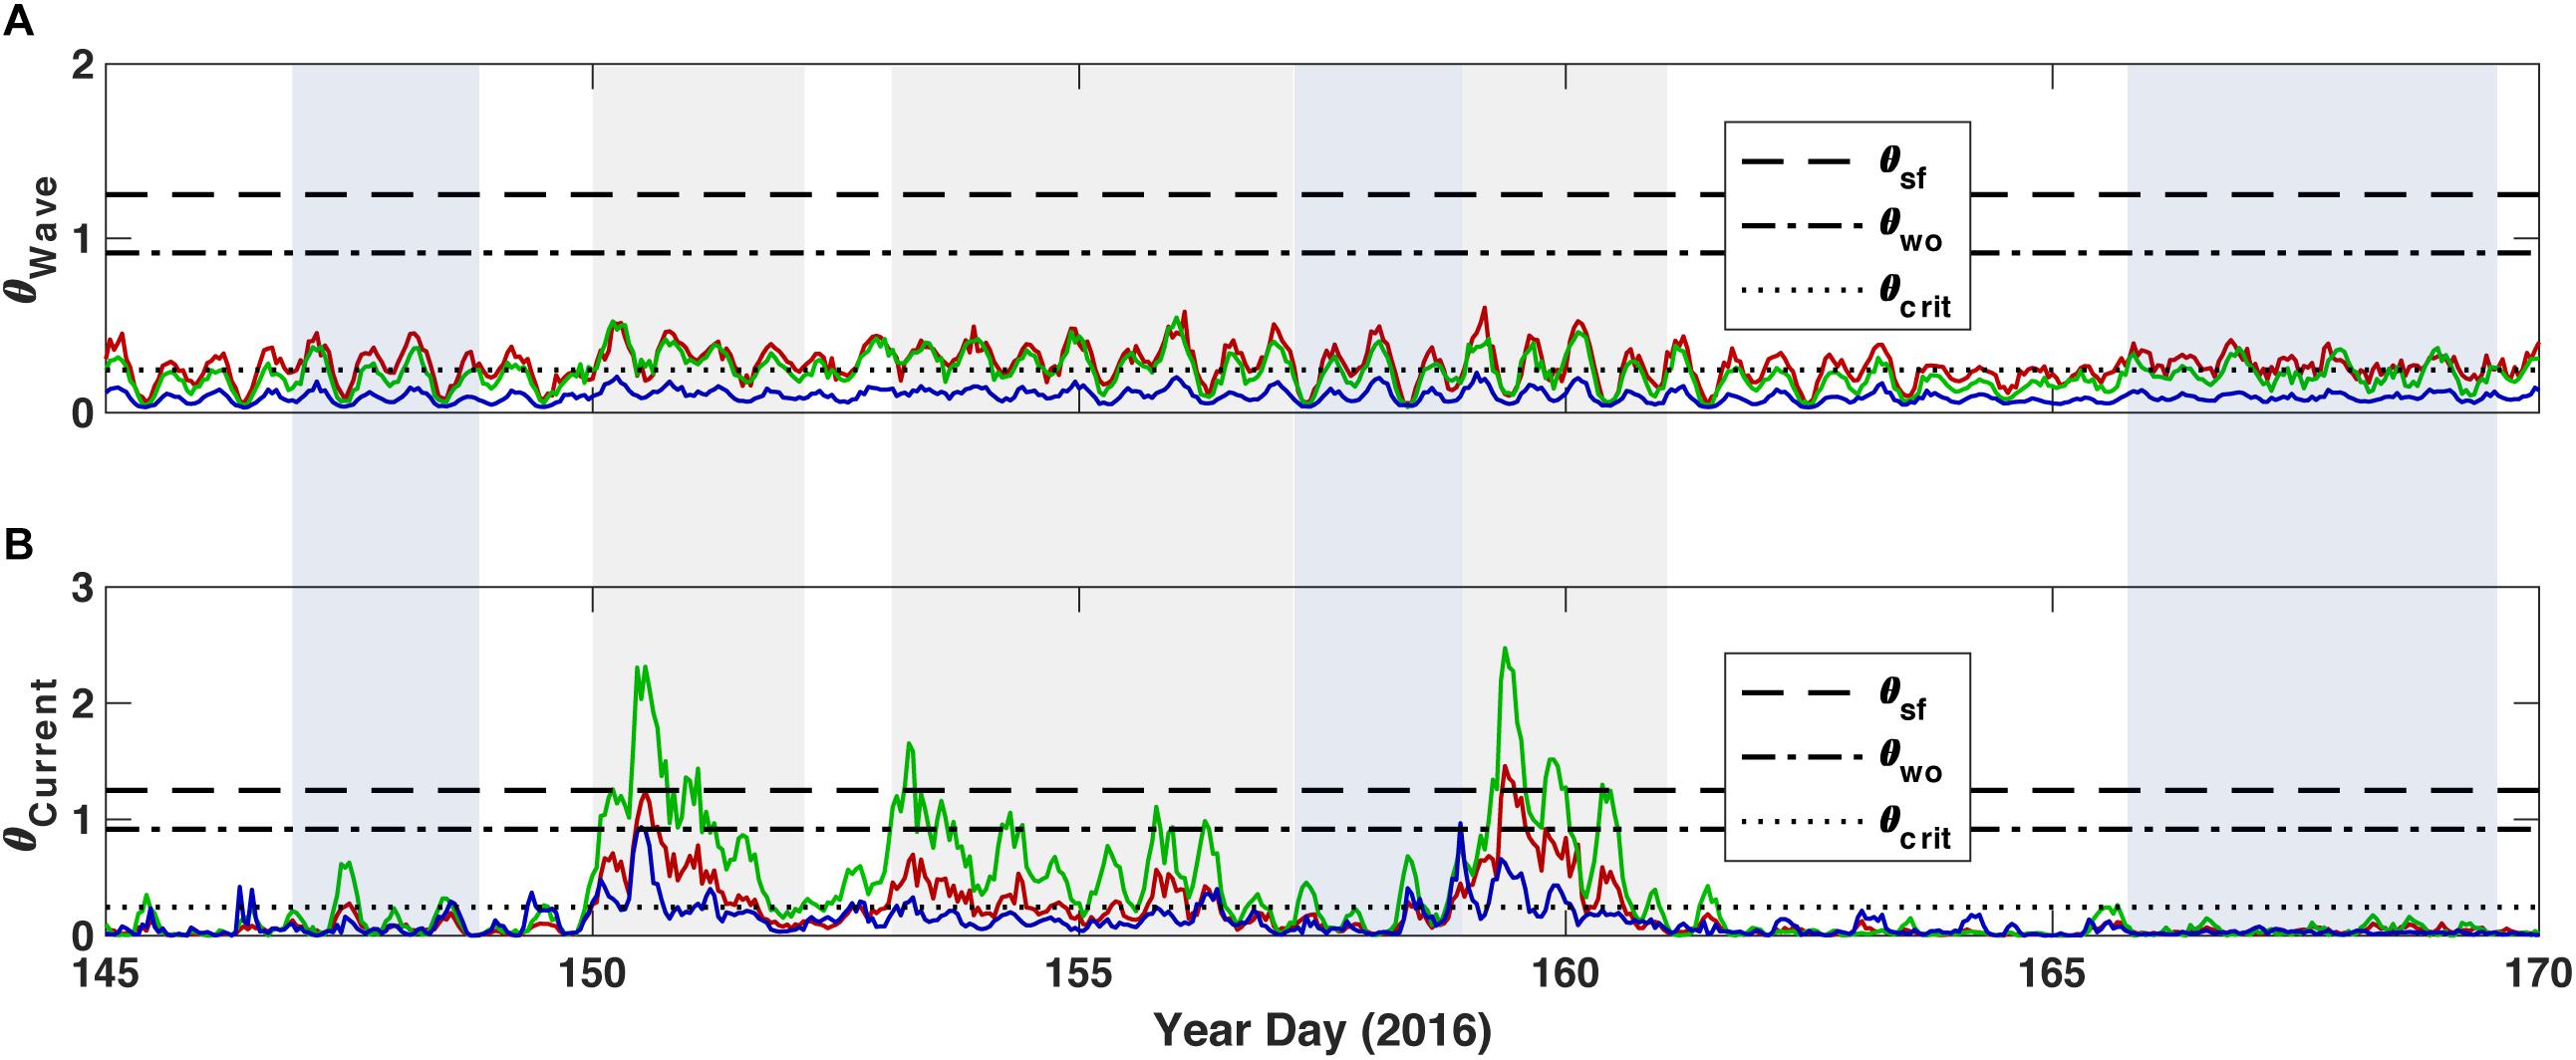
Figure 10. Shields parameters by forcing mechanism for the three sites. (A) Waves. (B) Currents. Color represents the site location: Red = TR1 on the outer reef flat near the reef crest, green = TR2 on the inner reef flat, and blue = TR3 in the lagoon.
In the lagoon, θwv rarely exceeded θcrit, demonstrating that waves alone were probably not responsible for bedload sediment movement. The timing of when θcur exceeded θcrit matched the timing of bedform migration well. Peaks in θcur generally did not correspond to peaks in θwv, again demonstrating that Umean was mainly dependent upon mean wave-driven currents and not SS-band velocities that peaked at high tides. The Shields parameter for currents in the lagoon never exceeded θwo, despite the drop in average bed level that occurred on occasion (such as YD 152 and YD 158), indicating net loss of the sediment in the lagoon.
Applicability of Equilibrium Bedform Models
We could only to test predictors for bedform height, η, as we only have data from vertical altimeters. The Wiberg and Harris (‘W-H’) formula (that depends only on wave height and wave-orbital diameter) generally overestimated η on the reef flat by a factor of two (Figure 11). The O’Donaghue formula (‘OD’), which uses the mobility parameter, Ψ, which is a function of the non-dimensional grain size, over-predicted η almost by an order of magnitude. The Styles and Glenn (‘S-G’) formula is the best predictor for η, albeit often under-predicting it. In the lagoon, the S-G formula was the best predictor, with both the W-H and OD formulae greatly overpredicting η. These models of bedform development assume unlimited sediment supply. This is clearly not the case on the reef flat at Ningaloo where all sediment on the flat appears to be stripped off during large wave events. It isn’t until the system reaches equilibrium conditions (such as the latter 2 weeks) that we would expect an equilibrium model to accurately predict bedform development.
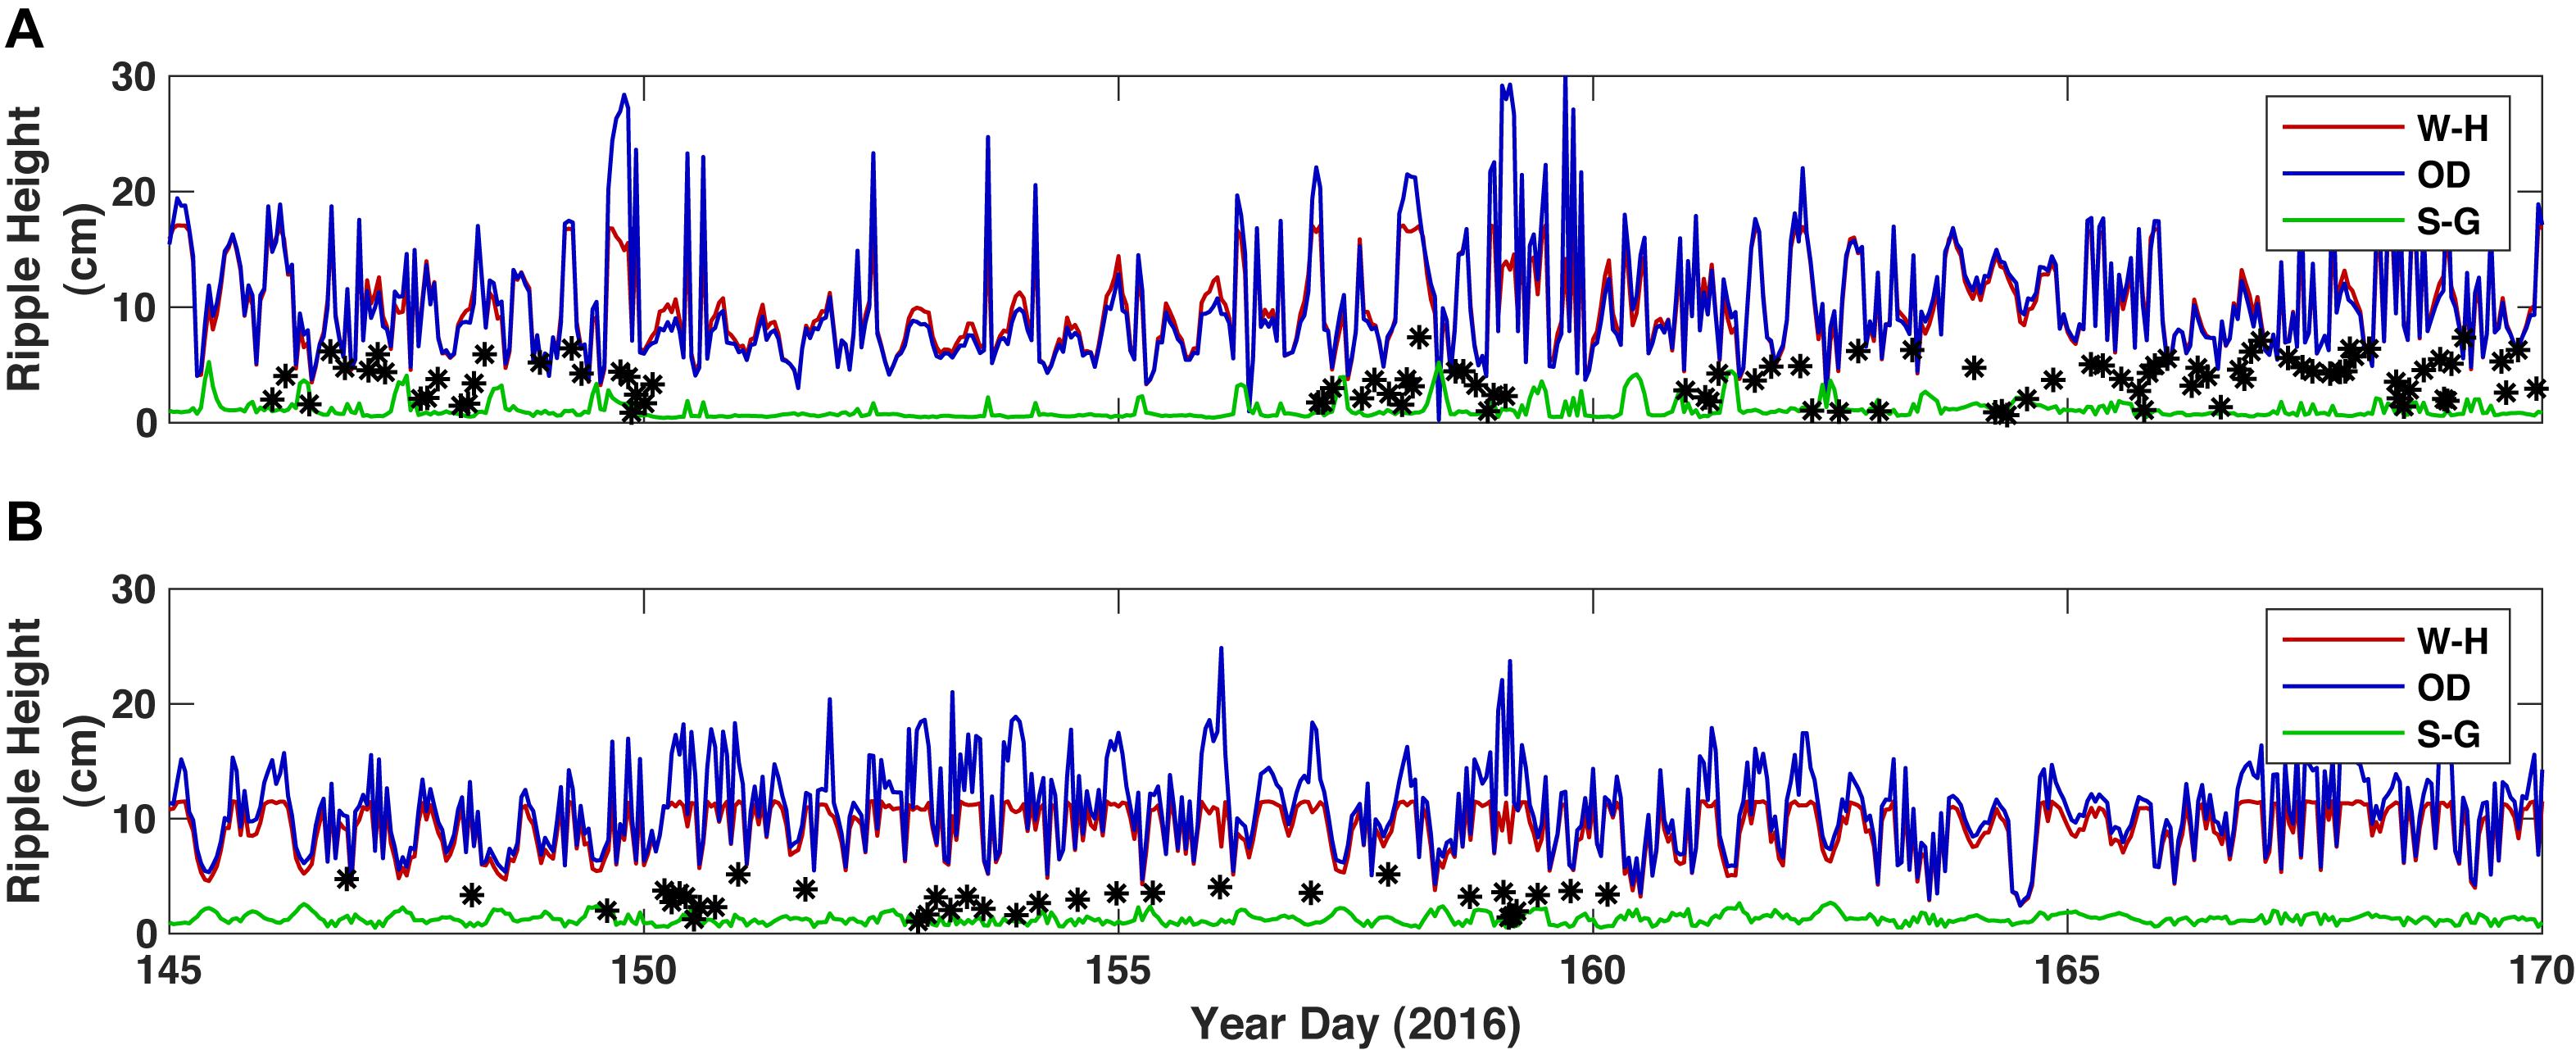
Figure 11. Comparison of measured and modeled equilibrium bedform dimensions. (A) TR2 on the inner reef flat. (B) TR3 in the lagoon. Color represents the equilibrium bedform model: Red = Wiberg and Harris, 1994, green = Styles and Glenn (2002), and blue = O’Donoghue et al. (2006). Black stars denote ripple amplitudes as measured by altimeter.
Gradients in Accumulation and Bedload Transport
A gradient in the volume of bedload transport from the inner reef to the lagoon suggests that not all of the bedload constituent reaches the salient at the shoreline. Total bedload transport over the study period was calculated to be 1,565 and 485 kg/m, on the reef flat and in the lagoon, respectively, while the estimated yearly transport was 2 × 10⁴ and 7 × 10³ kg/m on the reef flat and in the lagoon, respectively. Thus, the shoreward bedload transport over the reef flat is more than 3 times that of the lagoon. Modeled circulation patterns on the reef show strong return flow through the north and south channels via the lagoon (Cuttler et al., 2018b). This does not mean that all the sediment is being exported out of the reef system through the channels. At least some of this excess sediment is most likely being spread out on either side of the salient, eventually being transported toward the shore by asymmetrical waves. Indeed, Cuttler et al. (2018b) showed that mean wave direction north and south of the salient is normal to the shoreline, not the reef crest, and hence the refraction of waves affects the direction of bedload transport and bedform migration. Shoreline accretion rates of ∼1 m/year were estimated by Cuttler et al. (2018a). Assuming a beach slope of 45 degrees, mean depth of the lagoon of 3 m, and a bulk density of sediment of 1,600 kg/m3, a total of 7,200 kg of sediment would be required to accrete 1 m of shoreline (in the alongshore direction) out 1 m. A mean daily bedload transport rate of 34 kg/m/d in the lagoon over a year-long period results in 12,645 kg of transport over 1 m of reef flat, 1.75 times the previously noted shoreline accretion rates.
Nevertheless, there is a large discrepancy in bedload transport rate on the reef flat (61 kg/m/d) and previously reported estimates of sediment production on the reef by bioerosion (5 kg/m/d, per Langdon, 2012). The fact that wave and current energy was comparable on the reef flat near the reef crest and near the lagoon, but that no apparent sediment accumulation was occurring near the reef crest, indicates that some sediment storage occurs on the reef flat. It has been shown that high roughness due to the presence of coral can significantly reduce both mean and oscillatory flow, thus reducing near-bottom shear stresses (Pomeroy et al., 2017). Higher roughness due to coral rubble and vegetation on the reef flat at Ningaloo may contribute to this process, thus allowing sediment to accumulate and bedforms to develop on the reef flat.
Estimating the area of the reef flat to be ∼2 km2 and assuming the accumulation of sediment across the entire reef flat is comparable to that of our site TR2 (∼5 cm), the volume of sediment washed off the reef in one large wave event would be ∼105 m3. This is an overestimate of sediment contribution to the lagoon during washout events, given that sediment did not cover the entire reef flat at all times. Nevertheless, sediment at this site was replaced within a few days once waves and currents subsided on the reef flat. So the question is, from where is this sediment coming? Sediment production from bioerosion of reef framework alone cannot produce this volume in such a short period. Is it possible that sediment is being brought up the fore reef and over the reef crest? If so, is it possible that that sediment was once washed off the reef and out through the channels, thereby being recycled in the system? More study on the sources and sinks of sediment in a fringing reef with a lagoon and channels will help to answer these important questions.
Conclusion
Understanding the transport of sediment in coral reef environments is critical to forecasting future change on coral-reef-lined coasts. Models that rely solely on bulk wave statistics or idealized spectra may not accurately describe the forcing on reefs and, therefore, may incorrectly estimate the pathways and rates of sediment transport from the reef to the shoreline. Low-frequency IG-band motions may or may not mobilize sediment alone depending on the reef geometry, but the combination of IG-band motions with incident SS-band motions is clearly important in mobilizing sediment as well to the migration of bedforms on the seafloor toward the shoreline. Ignoring the IG constituent could result in underestimation of bedload transport on a coral reef.
Bedload transport on the Ningaloo Reef flat alternates between being predominantly current-driven during large swell events when washout of bedforms occurs, and wave-driven during average offshore wave conditions when bedform migration is greatest. Transport in the lagoon is due to a combination of current and wave forcing; bedform migration occurs when the summation of the two exceeds the sediment’s critical shear stress.
Existing equilibrium models of bedform development do not predict the observed dimensions of bedforms either on the reef flat or in the lagoon, although the Styles and Glenn (2002) formulae that employs the observed sediment grain density perform the best. This discrepancy may also be due to the fact that these models use bulk wave statistics and not the full energy spectrum in their formulations and therefore do not account for the lower-frequency, IG-band energy that commonly occurs on reefs. Variations in the supply of sediment also affect the accuracy of an equilibrium model. Nevertheless, using accurate estimates of grain density may be important not only for modeling the formation of bedforms, but also for predicting washout conditions on a reef.
Sediment budgets of bedload transport across Ningaloo Reef indicate that although large volumes of sediment are transported across the reef flat, not all of the sediment migrates to the shoreline. The source of the relatively large volumes of sediment that accumulates on reef flat is still not well understood. It is possible that sediment is being recycled in the system; sediment is brought up onto the reef by large waves, transported across the reef by SS- and IG-band energy, and a percentage is then exported from the reef system through adjacent channels. Despite seemingly similar hydrodynamic conditions and sources of sediment between two nearby sites on the reef flat, we still don’t fully understand why bedforms generate at one site and not the other. More research on the sources and sinks of carbonate sediment on reefs would help answer some of these questions.
Although this study has demonstrated that IG waves are important to bedload transport in a coral reef/lagoon complex, the results here may or may not apply to the great variety of geometries in coral reef environments observed around the world. The average water depth, reef flat width, and fore-reef slope all factor into the proportion of IG energy that exists on the reef flat (Cheriton et al., 2020). Incorporating low-frequency energy, wave asymmetry and skewness, and accurate estimates of grain density will greatly improve future models of sediment transport on coral reefs. In addition, better relationships between bedform migration and input forcing could be made with more comprehensive sonar measurements (spatially and temporally) of bedforms and their transformation and migration, such as could be made with time series of sector scanning sonar data. Given how important sediment supply is to bedform formation and migration, more studies on the sources and supply of sediment on coral reefs (including studies of sediment dynamics on the fore reef) will be necessary to accurately forecast the bedload constituent.
Data Availability Statement
The datasets analyzed in this manuscript are available from ScienceBase at https://doi.org/10.5066/P9PEIA2S.
Author Contributions
KR performed the analyses and wrote the manuscript with CS, OC, AP, JH, RL, and MB. All authors contributed to the article and approved the submitted version.
Funding
This work was funded by the U.S. Geological Survey’s Coastal/Marine Hazards and Resources Program, the Western Australia Marine Science Institute (WAMSI) Dredging Science Node (Theme 2/3), an Australian Research Council Future Fellowship (FT110100201), and an Australian Research Council Discovery Project grant (DP140102026).
Conflict of Interest
The authors declare that the research was conducted in the absence of any commercial or financial relationships that could be construed as a potential conflict of interest.
Acknowledgments
We would like to thank Carlin Bowyer (UWA), Anton Kuret (UWA), and Joshua Logan (USGS) for their logistical and field work in support of this project. We also would like to thank Bruce Jaffe (USGS) for an initial review of this manuscript, and Chris Sherwood (USGS) for his routines and insight into the calculation of modeled bedform dimensions. Any use of trade, firm, or product names is for descriptive purposes only and does not imply endorsement by the U.S. Government.
References
Aagaard, T., and Greenwood, B. (2008). Infragravity wave contribution to surf zone sediment transport — The role of advection. Mar. Geol. 251, 1–14.
ASTM International (2010). Standard Test Methods for Specific Gravity of Soil Solids by Water Pycnometer. West Conshohocken, PA: ASTM International.
Baas, J. H. (1993). Dimensional Analysis of Current Ripples in Recent and Ancient Depositional Environments. Ph.D. Thesis, University of Utrecht, The Netherlands, 199.
Becker, J. M., Firing, Y. L., Aucan, J., Holman, R., Merrifield, M., and Pawlak, G. (2007). Video-based observations of nearshore sand ripples and ripple migration. J. Geophys. Res. 112:C01007. doi: 10.1029/2005JC003451
Buckley, M. L., Lowe, R. J., Hansen, J. E., van Dongeren, A. R., and Storlazzi, C. D. (2018). Mechanisms of wave-driven water level variability on reef-fringed coastlines. J. Geophys. Res. Oceans 123, 3811–3831. doi: 10.1029/2018JC013933
Cacchione, D., Richmond, B., Fletcher, C., Tate, G., and Ferreira, J. (1999). “Sand transport in a reef channel off Kailua, Oahu, Hawaii,” in Proceedings of The Non-Steady State of the Inner Shelf and Shoreline: Coastal Change on the Time Scale of Decades to Millennia in the Late Quaternary, Abstracts with Programs, (Honolulu: University of Hawaii).
Camenen, B. (2009). Estimation of the wave-related ripple characteristics and induced bed shear stress. Estar. Coast Shelf Sci. 553–564. doi: 10.1016/j.ecss.2009.07.022
Cheriton, O. M., Storlazzi, C. D., and Rosenberger, K. J. (2016). Observations of wave transformation over a fringing coral reef and the importance of low-frequency waves and offshore water levels to runup, overwash, and coastal flooding. J. Geophys. Res. Oceans 121, 3121–3140. doi: 10.1002/2015JC011231
Cheriton, O. M., Storlazzi, C. D., and Rosenberger, K. J. (2020). In situ observations of wave transformation and infragravity bore development across reef flats of varying geomorphology. Front. Mar. Sci. 7:351. doi: 10.3389/fmars.2020.00351
Cuttler, M. V. W., Hansen, J. E., Lowe, R. J., and Drost, E. J. F. (2018a). Response of a fringing reef coastline to the direct impact of a tropical cyclone. Limnol. Ocean. Lett. 3, 31–38. doi: 10.1002/lol2.10067
Cuttler, M. V. W., Hansen, J. E., Lowe, R. J., Trotter, J. A., and McCulloch, M. T. (2018b). Source and supply of sediment to a shoreline salient in a fringing reef environment. Earth Surf. Process. Landforms 44, 552–564. doi: 10.1002/esp.4516
Cuttler, M. V. W., Lowe, R. J., Falter, J. L., and Buscombe, D. (2017). Estimating the settling velocity of bioclastic sediment using common grain-size analysis techniques. Sedimentology 64, 987–1004. doi: 10.1111/sed.12338
de Bakker, A. T. M., Brinkkemper, J. A., van der Steen, F., Tissier, M. F. S., and Ruessink, B. G. (2016). Cross-shore sand transport by infragravity waves as a function of beach steepness. J. Geophys. Res. Ear. Surf. 121, 1786–1799.
Dean, R. D., and Dalrymple, R. A. (eds) (1991). “Water wave mechanics for engineers and scientists,” in Advanced Series on Ocean Engineering, Vol. 2, (Singapore: World Scientific Publishing Co. Ltd).
Deltares Systems (2019). Delft3D-WAVE User Manual, V 3.05, Deltares, Boussinesqweg, 1 2629 HV. Delft: Deltares Systems.
Drost, E. J. F., Lowe, R. J., Ivey, G. N., Jones, N. L., and Pequignet, C. A. (2017). The effects of tropical cyclone characteristics on the surface wave fields in Australia’s North West region. Cont. Shelf Res. 35–53. doi: 10.1016/j.csr.2017.03.006
Grant, W. D., and Madsen, O. S. (1979). Combined wave and current interaction with a rough bottom. J. Geophys. Res. 84, 1797–1808. doi: 10.1029/JC084iC04p01797
Karimpour, A., and Chen, Q. (2017). Wind wave analysis in depth limited water using OCEANLYZ, a MATLAB toolbox. Comput. Geosci. 181–189. doi: 10.1016/j.cageo.2017.06.010
Kramer, K., and Winter, C. (2016). Predicted ripple dimensions in relation to the precision of in situ measurements in the southern North Sea. Ocean Sci. 12, 1221–1235. doi: 10.5194/os-12-1221-2016
Langdon, M. W. (2012). The Ecology of the Grazing Urchin Echinometramathaei at Ningaloo Marine Park. Murdoch University.
Madsen, O. S. (1994). “Spectral wave-current bottom boundary layer flows. Coastal Engineering 1994,” in Proceedings, 24th International Conference Coastal Engineering Research Council, New York, NY, 384–398.
Nielsen, P. (1981). Dynamics and geometry of wave-generated ripples. J. Geophys. Res. 86, 6467–6472.
O’Donoghue, T., Doucette, J. S., van der Werf, J. J., and Ribberink, J. S. (2006). The dimensions of sand ripples in full-scale oscillatory flows. Coast. Eng. 997–1012. doi: 10.1016/j.coastaleng.2006.06.008
Pomeroy, A., Lowe, R., Symonds, G., Van Dongeren, A., and Moore, C. (2012). The dynamics of infragravity wave transformation over a fringing reef. J. Geophys. Res. 117:C11022. doi: 10.1029/2012JC008310
Pomeroy, A. W. M., Lowe, R. J., Dongeren, A. R., Ghisalberti, M., Bodde, W., and Roelvink, D. (2015a). Spectral wave-driven sediment transport across a fringing reef. Coast. Eng. 98, 78–94. doi: 10.1016/j.coastaleng.2015.01.005
Pomeroy, A. W. M., Lowe, R. J., Ghisalberti, M., Storlazzi, C. D., Cuttler, M., and Symonds, G. (2015b). “Mechanics of sediment suspension and transport within a fringing reef,” in Proceedings of the Coastal Sediments Conference, 2015, (Singapore: World Scientific Publishing).
Pomeroy, A. W. M., Lowe, R. J., Ghisalberti, M., Storlazzi, C. D., Symonds, G., and Roelvink, D. (2017). Sediment transport in the presence of large reef bottom roughness. J. Geophys. Res. Oceans 122, 1347–1368.
Pomeroy, A. W. M., Lowe, R. J., Ghisalberti, M., Winter, G., and Storlazzi, C. D. (2018). Spatial variability of sediment transport processes over intra- and subtidal time-scales within a fringing coral reef. J. Geophys. Res. Ear. Surf. 123, 1013–1010. doi: 10.1002/2017JF004468
Reguero, B. G., Secaira, F., Toimil, A., Escudero, M., Díaz-Simal, P., Beck, M. W., et al. (2019). The risk reduction benefits of the mesoamerican reef in Mexico. Front. Earth Sci. 7:125. doi: 10.3389/feart.2019.00125
Ruessink, B. G., van den Berg, T. J. J., and van Rijn, L. C. (2009). Modeling sediment transport beneath skewed asymmetric waves above a plane bed. J. Geophys. Res. 114:C11021. doi: 10.1029/2009JC005416
Soulsby, R. L., and Whitehouse, R. J. S. (2005). Prediction of Ripple Properties in Shelf Seas. Mark 1 Predictor. Report TR150. Wallingford: HR Wallingford.
Soulsby, R. L., Whitehouse, R. J. S., and Marten, K. V. (2012). Prediction of time-evolving sand ripples in shelf seas. Cont. Shelf Res. 47–62. doi: 10.1016/j.csr.2012.02.016
Storlazzi, C. D., Reguero, B. G., Cole, A. D., Lowe, E., Shope, J. B., Gibbs, A. E., et al. (2019). Rigorously Valuing the Role of U.S. Coral Reefs in Coastal Hazard Risk Reduction. U.S. Geological Survey Open-File Report 2019–1027. Reston: U.S. Geological Survey.
Styles, R., and Glenn, S. M. (2002). Modeling bottom roughness in the presence of wave-generated ripples. J. Geophys. Res. 107:3110. doi: 10.1029/2001JC000864
Taebi, S., Lowe, R. J., Pattiaratchi, C. B., Ivey, G. N., Symonds, G., and Brinkman, R. (2011). Nearshore circulation in a tropical fringing reef system. J. Geophys. Res. Oceans 116:C02016. doi: 10.1029/2010JC006439
Tissier, M. F. S., Bonneton, P., Michallet, H., and Ruessink, B. G. (2015). Infragravity-wave modulation of short-wave celerity in the surf zone. J. Geophys. Res. Oceans 120, 6799–6814.
Traykovski, P. (2007). Observations of wave orbital scale ripples and a non-equillibrium time-dependent model. J. Geophys. Res. Oceans 112, 1–19. doi: 10.1029/2006JC003811
Traykovski, P., Hay, A. E., Irish, J. D., and Lynch, J. F. (1999). Geometry, migration, and evolution of wave orbital ripples at LEO-15. J. Geophys. Res. Oceans 104, 1505–1524. doi: 10.1029/1998JC900026
Wengrove, M. E., Foster, D. L., Lippmann, T. C., de Schipper, M. A., and Calantoni, J. (2018). Observations of time-dependent bedform trans- formation in combined wave-current flows. J. Geophys. Res. Oceans 123, 7581–7598. doi: 10.1029/2018JC014357
Wiberg, P. L., and Harris, C. K. (1994). Ripple geometry in wave-dominated environments. J. Geophys. Res. 99, 775–789. doi: 10.1029/93JC02726
Wiberg, P. L., and Sherwood, C. R. (2008). Calculating wave-generated bottom orbital velocities from surface wave parameters. Comput. Geosci. 34, 1243–1262. doi: 10.1016/j.cageo.2008.02.010
Appendix A: Definitions of Parameters Used in Calculations
the mobility parameter, where Uw is the orbital velocity
the non-dimensional grainsize
where, s= ρsed/ρwater is the relative sediment density, and υ is the viscosity of the seawater
The Shields parameters were calculated following Soulsby et al. (2012):
where z0 = d50/12,
and 𝒰 is the depth averaged velocity
The wave skewness and asymmetry were calculated following Pomeroy et al. (2015a):
where is the near-bed oscillatory velocity, and H is the Hilbert transform.
Keywords: coral, reef, sediment, bedform, bedload, migration
Citation: Rosenberger KJ, Storlazzi CD, Cheriton OM, Pomeroy AWM, Hansen JE, Lowe RJ and Buckley ML (2020) Spectral Wave-Driven Bedload Transport Across a Coral Reef Flat/Lagoon Complex. Front. Mar. Sci. 7:513020. doi: 10.3389/fmars.2020.513020
Received: 18 November 2019; Accepted: 28 September 2020;
Published: 22 October 2020.
Edited by:
William J. Skirving, National Oceanic and Atmospheric Administration (NOAA), United StatesReviewed by:
Anne-Christine Pequignet, Met Office, United KingdomDano Roelvink, IHE Delft Institute for Water Education, Netherlands
Copyright © 2020 Rosenberger, Storlazzi, Cheriton, Pomeroy, Hansen, Lowe and Buckley. This is an open-access article distributed under the terms of the Creative Commons Attribution License (CC BY). The use, distribution or reproduction in other forums is permitted, provided the original author(s) and the copyright owner(s) are credited and that the original publication in this journal is cited, in accordance with accepted academic practice. No use, distribution or reproduction is permitted which does not comply with these terms.
*Correspondence: Kurt J. Rosenberger, a3Jvc2VuYmVyZ2VyQHVzZ3MuZ292