 Gabriella La Manna
 Fabio Ronchetti
 Gianluca Sarà1,3
 Giulia Ceccherelli
- 1Environmental Research and Conservation, MareTerra Onlus, Alghero, Italy
- 2Area Marina Protetta Capo Caccia - Isola Piana, Alghero, Italy
- 3Dipartimento di Scienze della Terra e del Mare, Università degli Studi di Palermo, Palermo, Italy
- 4Dipartimento di Chimica e Farmacia, Università degli Studi di Sassari, Sassari, Italy
Indicators for preserving marine biodiversity include knowledge of how the spatial distribution and critical habitats of species overlap with human activities and impacts. Such indicators are key tools for marine spatial planning, a process that identifies and resolves conflicts between human uses and the conservation of marine environments. The common bottlenose dolphin in the Mediterranean Sea is considered a vulnerable species by the IUCN Red List and a priority species of the EU Habitat Directive. Here, we estimated spatio-temporal patterns of the species occurrence in the area around one Marine Protected Area (MPA) and two Sites of Community Importance (SCI) of the North western Sardinia, with the aim to predict the species distribution and the main links with the environmental factors and boat traffic. To evaluate whether dolphin groups with calves showed any habitat preference different from groups without calves, separate models for both type of groups were done. The most important contributing variables to the dolphin habitat suitability models were the likelihood of boat presence, habitat type and mean sea surface temperature. Different model outputs were obtained depending on dolphin group composition. The area of high likelihood of dolphin presence ranged between 30 and 60 km2 and was smaller for groups with calves. Further, the area of highest dolphin habitat suitability overlaps with the area of high boat traffic, suggesting that boating in the study site is a potential relevant anthropogenic threat to dolphins. Particularly, boating is concentrated inside and around the MPA/SCIs, indicating the need for stronger restriction measures. We propose updated SCI boundaries for effective protection of common bottlenose dolphins. These areas and the suggestions of regulation are specifically aimed at reducing the impact of boating on dolphins, especially for groups with calves. Synthesis and applications. Management measures should be designed based on the data here provided, and then implemented and enforced to decrease dolphin-boat interactions, especially for mother-calf pairs. The creation of new coastal SCIs should be considered especially where boat traffic overlaps with areas most suitable for dolphins. In these SCIs, boating should be managed to limit disturbance, avoidance or alterations of dolphin vital behavior.
Introduction
Indicators for preserving marine biodiversity include knowledge of how the spatial distribution and critical habitats of target species overlap with human activities, pressure and impacts. Such indicators are key tools for marine spatial planning, a process used around the world to identify and resolve conflicts between human uses and the natural marine environment (UNESCO-Intergovernmental Oceanographic Commission, 2017). In order to achieve the goals of the Maritime Spatial Planning Directive of the EU (2014/89), the development of a full suite of ecological descriptors is needed for assessing the status of ecosystem components under anthropogenic pressures. This has become an ambitious mission for coastal marine systems, an environment highly impacted by human pressure (Micheli et al., 2013). In coastal systems, the main form of protection is the establishment of marine protected areas (MPAs). In EU countries, national MPAs and the protected areas of the Natura 2000 Network (e.g., Site of Community Importance ‘SCI’ and Special Area of Conservation ‘SAC’) offer protection for benthic species and habitat. Protected area boundaries often consider species distribution, although these areas may have limited conservation effect on species capable of wide ranging, such as cetaceans (Fortuna et al., 2018). Incorporating regional cetacean presence and distribution information collected over time (seasons, years) is necessary to adequately protect these species.
In general, protected area design should be based on the importance of ecological features of the species to protect. Indeed, the establishment of protected areas for cetaceans must encompass the critical areas necessary for feeding, reproduction and rest (Ashe et al., 2010; Williams et al., 2015), including management purposes (Alessi and Fiori, 2014). As part of the marine spatial plan, decisions should also consider the potential conflict between human demands and biodiversity conservation. Moreover, gathering scientifically sound data to generate accurate predictions of marine spatial assessment of overlapping areas between fauna distribution and human activities reinforces the science-policy interface (Mangano and Sarà, 2017). This would adapt restrictions of protected areas to the species actually included within boundaries and increase effectiveness of wildlife management (Braunisch et al., 2011) to achieve the objectives of the Maritime Spatial Planning Directive.
In biodiverse and/or scenic regions, tourism dominates the economy. For example, in the Mediterranean island of Sardinia tourism has grown quickly in the last three decades due to the wild scenic coasts, white beaches and crystal-clear waters. All these features attract boaters and contribute to make Sardinia one of the Italian regions with the largest concentration of boat berths, tourist ports and marinas (ONN, 2011). However, ocean tourism and recreational boating are still scantly regulated. In fact, recreational boating is still considered not harmful to the environment. However, boat presence and related noise can contribute to morphological, behavioral and physiological trait changes in several marine organisms (Lloret et al., 2008; Juanes et al., 2017; Slabbekoorn et al., 2018).
Bottlenose dolphins are key components of regional marine biodiversity, and populations are declining throughout the Mediterranean Sea (Bearzi et al., 2012) due to overfishing, habitat loss, chemical and acoustic pollution, costal development, human disturbance (e.g., tourism, recreational activities, and shipping), incidental mortality due to marine debris (e.g., fishing gear), and climate change (Bearzi et al., 2012). The bottlenose dolphin is considered vulnerable by the IUCN (International Union for Conservation of Nature) Red List and is in the Annex IV of the priority species of the EU Habitat Directive (92/43/EEC).
According to Article 1 of the Habitats Directive, sites (SCI and than SAC) selected for wide ranging species, “shall correspond to the places within their natural range” with “the physical or biological factors essential to their life and reproduction.” In the North western Sardinia, even if the presence of the bottlenose dolphins is well documented and the species is among those to be protected, the current boundaries of both MPA and the SCIs have not been drawn to include dolphin presence and distribution; this may impair the efforts to protect the species. Thus identifying the spatio-temporal variability of the preferred coastal habitats of bottlenose dolphins, especially where their distribution widely overlaps with human activities is pivotal for: (i) supporting the decision making to adapt MPA/SCI boundaries to the distribution of the species, (ii) addressing management restrictions.
Here, we measured spatio-temporal patterns of common bottlenose dolphin (Tursiops truncatus) occurrence in the area around one MPA and two SCIs of the North western Sardinia. We aimed to predict the species distribution and to verify the relationship with environmental factors and boat traffic. Applying a MaxEnt modeling approach (Maximum Entropy; Braunisch et al., 2011), we used boat presence data to predict the spatial distribution patterns of boating in one of the most popular tourist destinations in Sardinia. We used the likelihood of boat presence and other environmental variables to predict the habitat use of bottlenose dolphins at different temporal scales (Virzi, 2010; Pendleton et al., 2012). We selected environmental variables related to topographic features (slope, depth, and aspect), environmental conditions and proxies of prey availability (sea surface temperature, Chlorophyll-a concentration and habitat type) since they can influence habitat selection. Further, we modeled dolphin presence as a function of the presence of calves, to estimate how group composition influences species distribution. With this information, we propose adjusting existing boundaries to expand SCIs for the purpose of enhancing the protection of common bottlenose dolphin and we suggest regulation specifically aimed at reducing the impact of boating on dolphins.
Materials and Methods
Study Area
The study was done in a 400 km2 area in northwest Sardinia, Italy (40.5580° N, 8.3193° E, Figure 1) near Alghero. The seafloor in this area is covered by a mixture of habitats (Table 1). This area includes three coastal protection measures (the Capo Caccia - Isola Piana MPA, the SCI ‘Capo Caccia e Punta del Giglio’ ITB010042 and the SCI ‘Entroterra e zona costiera tra Bosa, Capo Marargiu e Porto Tangone’ ITB020041) and Alghero, the largest port on the western coast of Sardinia (with about 2000 berths). The MPA Capo Caccia - Isola Piana extends for 26.31 km2. The SCI ‘Capo Caccia e Punta del Giglio’ is located in the northern part of the Alghero bay and extends for 74 km2. The SCI ‘Entroterra e zona costiera tra Bosa, Capo Marargiu e Porto Tangone’ is located in the southern part of the Alghero Bay and it extends for 29.62 km2. The MPA and SCIs were established mainly for the protection of endemic Mediterranean seagrass (Posidonia oceanica), coralligenous habitat, and several protected species, including the common bottlenose dolphin. In this area, the local economy relies on summer tourism and ocean tourism activities (La Manna et al., 2016). With respect to boating, the only existing regulation is foreseen by the provisional regulation of the MPA and concerns boat speed limitation, while interactions between boats and dolphins are still not restricted or regulated.
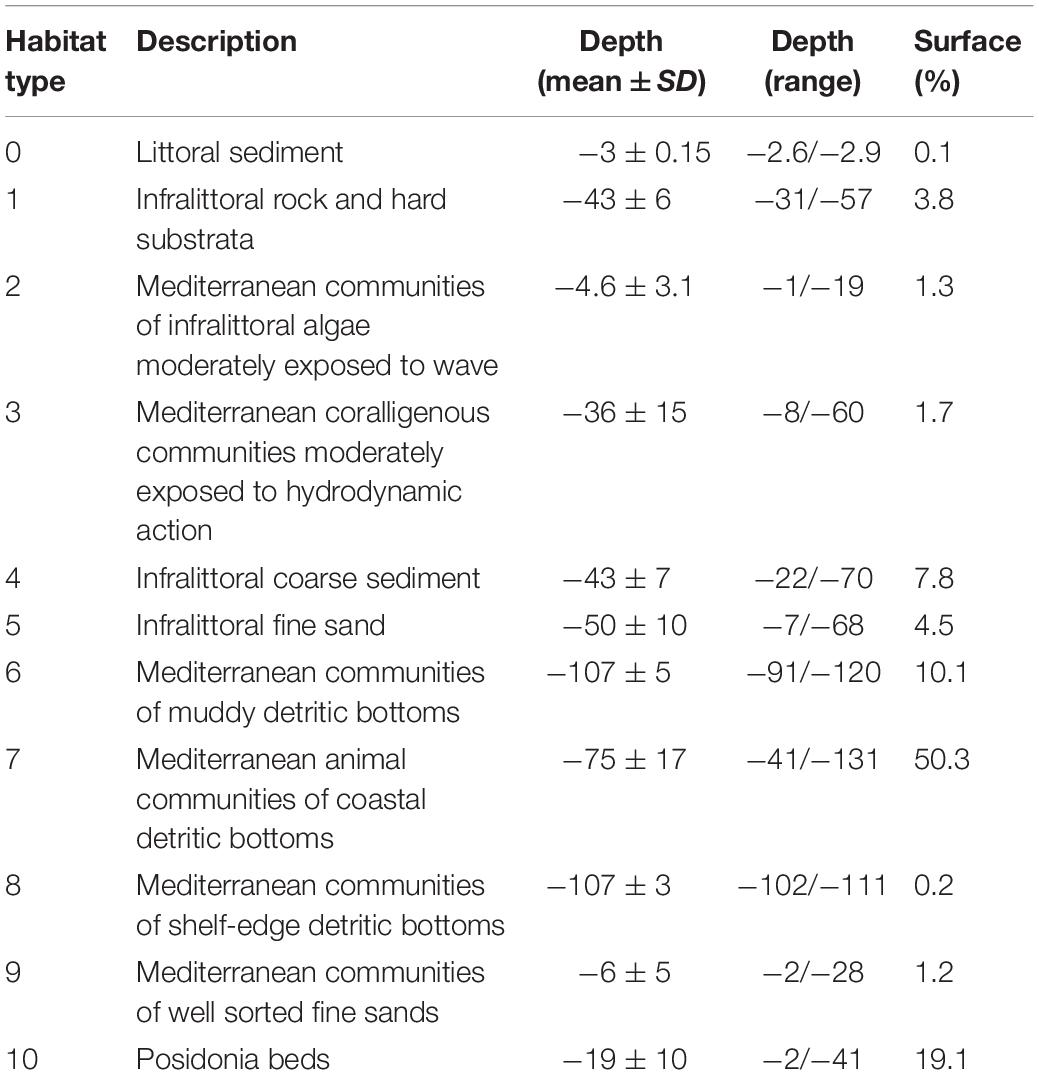
Table 1. Description, depth, and relative surface percentage of the habitat types.
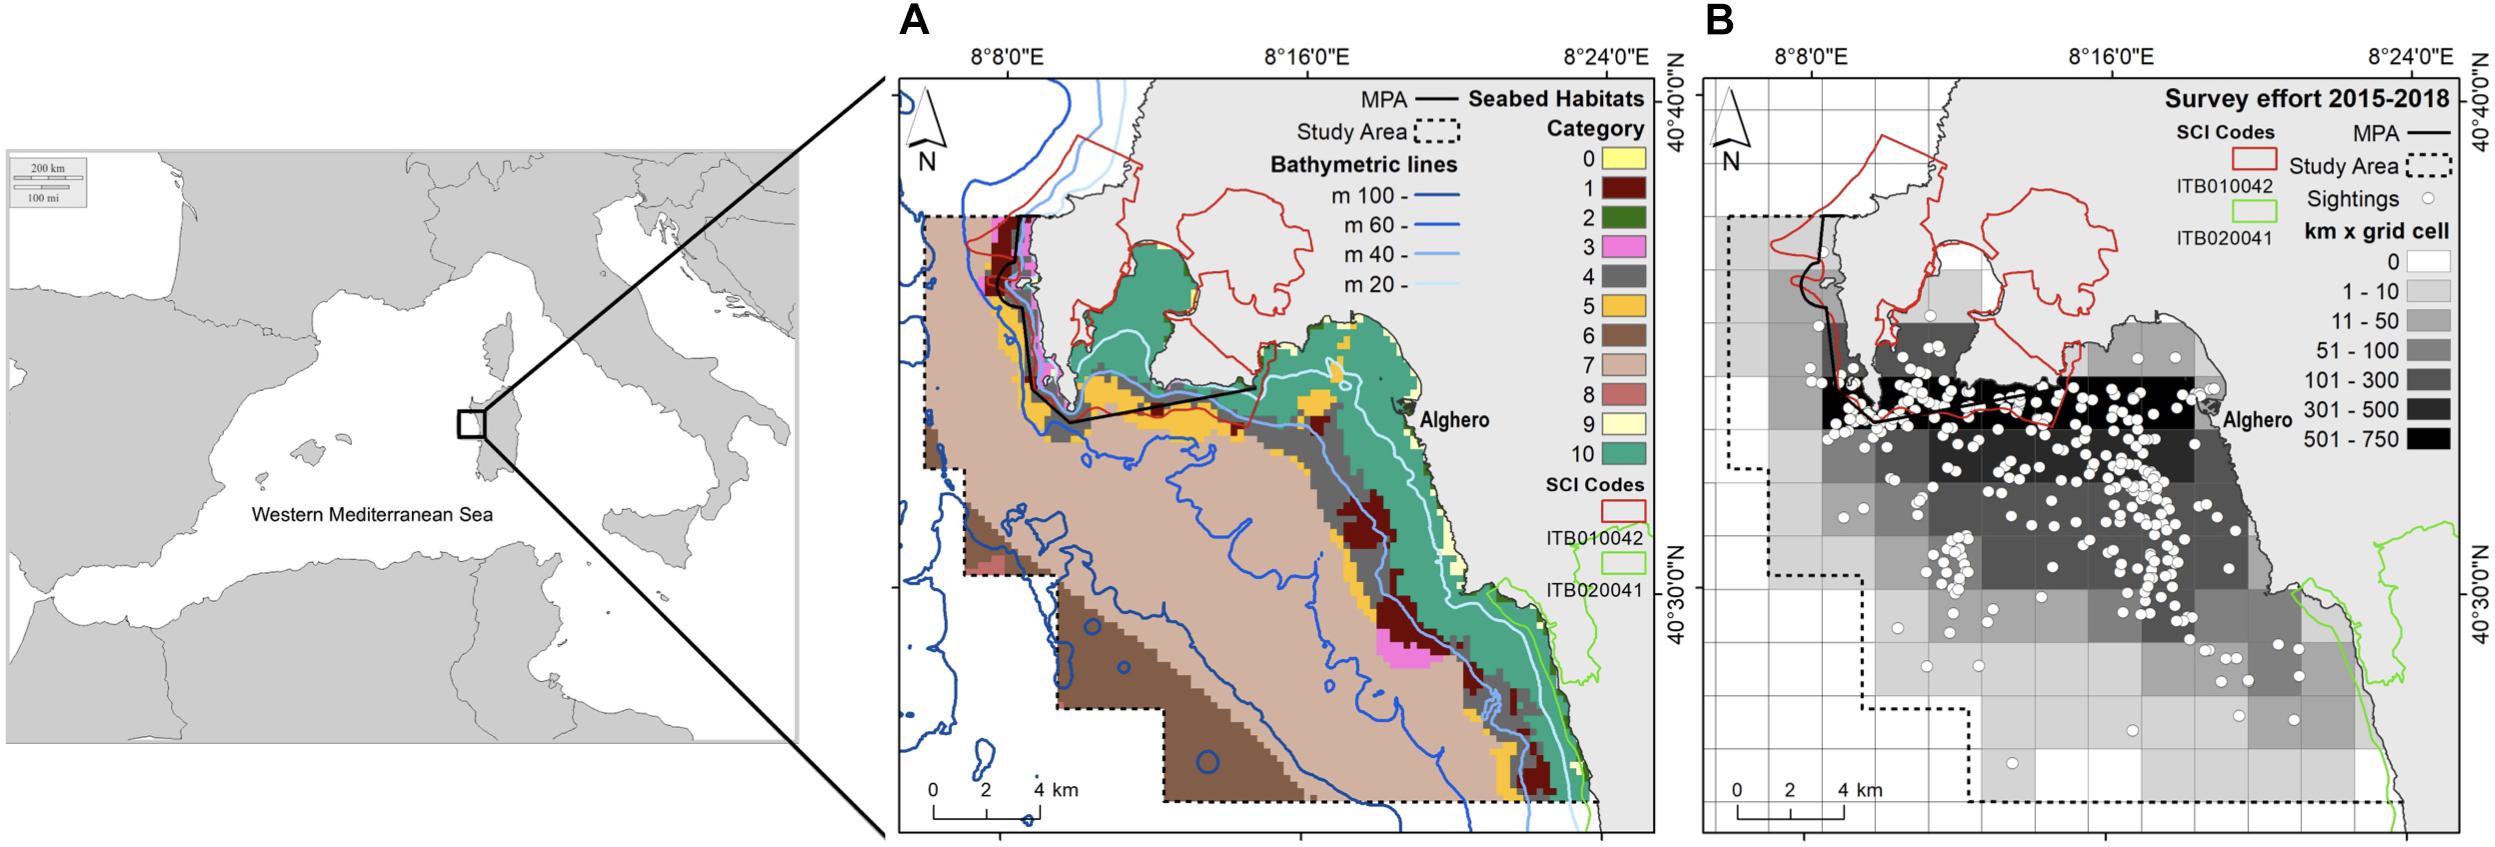
Figure 1. Maps of the study area: (A) the habitat types and bathymetric lines; (B) the total sampling effort pooled into grid cells (2 km × 2 km) and the dolphin sightings (white dots) for the period 2015–2018.
Dolphin and Boat Samplings
From 2015 to 2018, we conducted daily surveys from April to October and we collected data on boat traffic and sightings of the common bottlenose dolphin. We conducted systematic standardized surveys from 9.7 m motor boats. Survey routes followed a random sampling procedure (La Manna et al., 2016), with a generally perpendicular direction with respect to the coast and depth contours. In each survey, two experienced observers scanned the sea surface underway at a boat speed between 10 and 16 km per hour. Scans occurred during daylight (from 9 am to 6 pm), every day with a visibility of over 3 miles and with good sea condition (sea state ≤ 2 Douglas; wind force ≤ 2 Beaufort). The position of the research boat was automatically recorded every minute using a Garmin GPS chart-plotter. Using binoculars (10× power magnification, 42 mm objective lens), trained observers counted boats, both moored and underway, encountered within 300 m during the survey, recording their position using GPS. Boat classification were: recreational boats (inflatable boats, speed boats, cabin cruisers, and sail boats), tourist boats (excursion/diving boats and tourist ferry boats) and commercial fishing boats. During a dolphin sighting, animals were approached to collect data about dolphin group size and geographic position, and calf presence.
Environmental Predictors
We incorporated data on environmental variables, dolphin presence and boat presence into a Geographic Information System (GIS) using the software ArcMap 10.4.1. The GIS was build using the World Geodetic System 1984 (WGS84) and the Universal Transverse Mercator (UTM) 32 N projection. Based on previous cetacean habitat studies (Canadas et al., 2002; Azzellino et al., 2012; Marini et al., 2014; Bohrer do Amaral et al., 2015; La Manna et al., 2016), we selected the following environmental variables: water depth (m), mean sea surface temperature (SST mean), difference between the maximum and the minimum sea surface temperature (SST range), Chlorophyll-a concentration (Chl-a - mg/m3), seafloor slope (degree), distance to the coast (m), aspect (Table 2) and habitat type (Table 1). All data were pooled into grids with a resolution of 250 m and averaged for every year (from 2015 to 2018) and for the whole period (2015–2018).
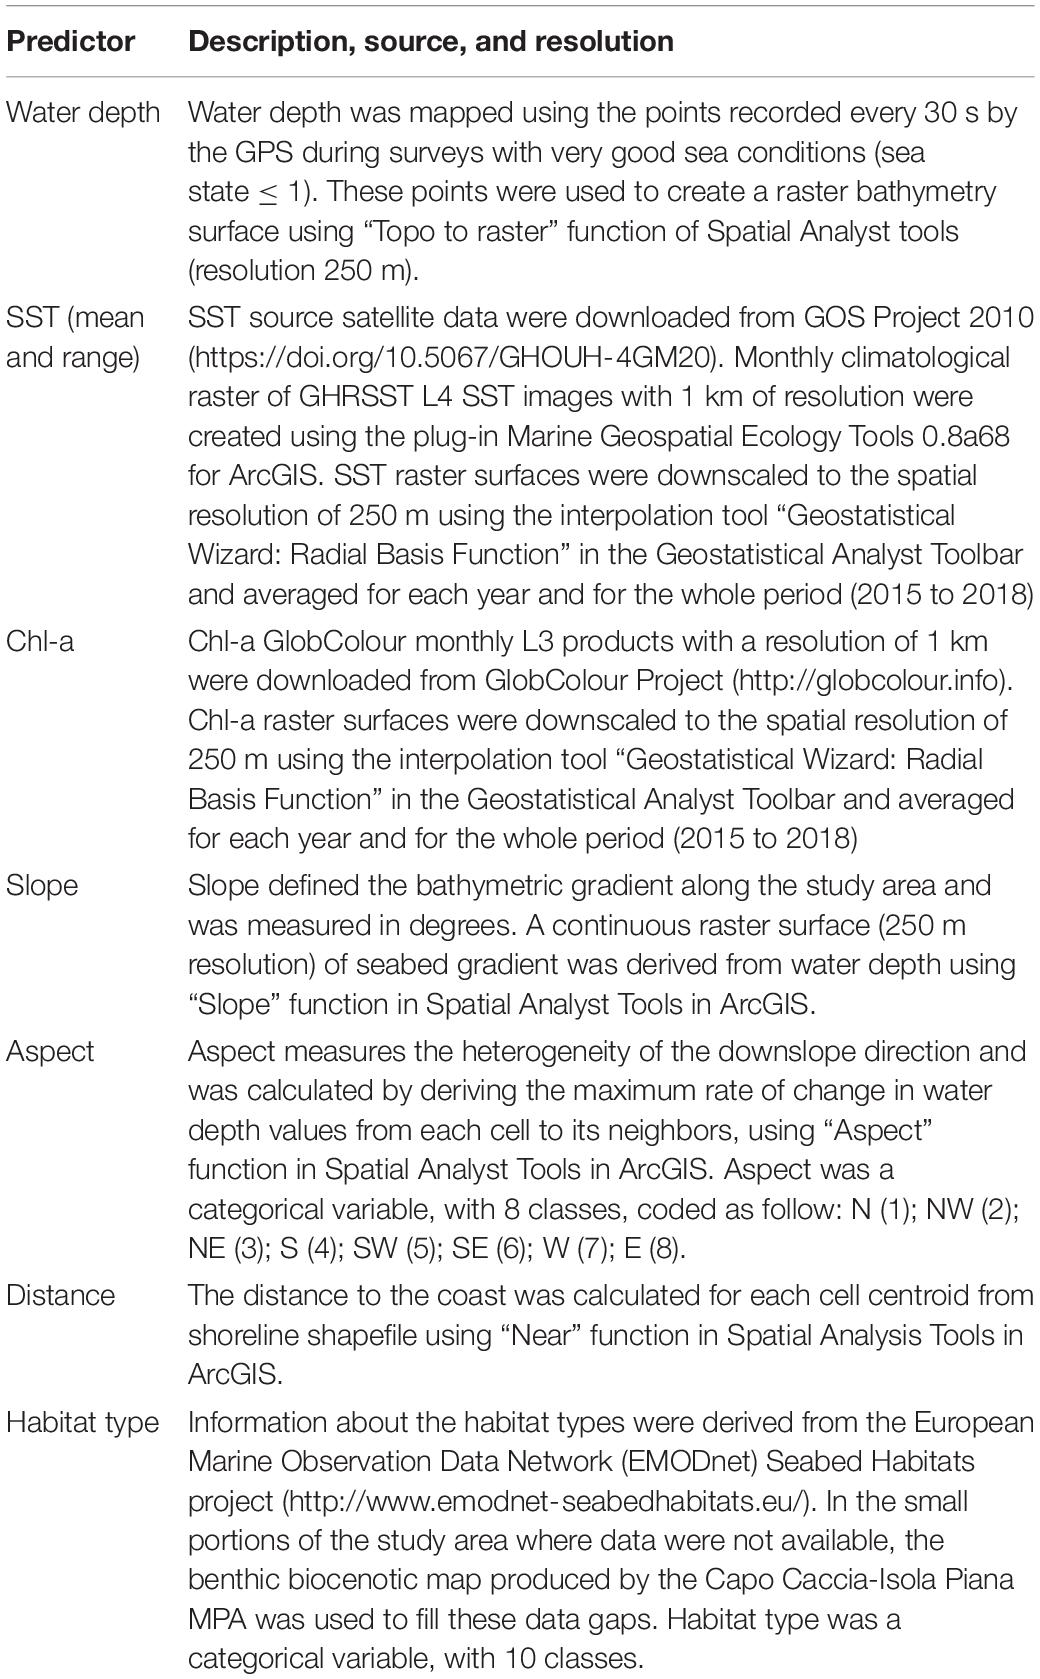
Table 2. Predictors used for modeling boat traffic and dolphin occurrence.
Before running SDMs (Species Distribution Modeling), we used ‘Raster Correlations and Summary Statistics’ tools of the plug-in SDMtoolbox 2.1 for ArcGis to create a correlation matrix of the Pearson correlation coefficients (r) between the environmental predictors (Brown, 2014; Brown et al., 2017). In case of collinearity (Kumar and Stohlgren, 2009; Kramer-Schadt et al., 2013), only one environmental predictor, between the two, was included in the model (Kumar and Stohlgren, 2009). In the modeling exercise, we interpolated some environmental variables (SST and Chl-a) to fill spatial gaps (about 40 km2) along the coastline (Table 2). These interpolations and the limited number of predictors have constrained interpretation of the results only in terms of the likelihood of presence within the range of these environmental conditions (La Manna et al., 2016).
Model Generation and Validation
The accurate prediction of presences in a modeling processes requires avoiding the use of absences when absence data are not available or not sufficiently reliable, the so-called methodological absences (Lobo et al., 2010). In the case of Cetacean sampling, many locations cannot be surveyed systematically or may receive little survey effort, leading to the lack of true absence data. This lack is higher in areas where environmentally favorable localities are placed nearest to the known presence points (Lobo et al., 2010). Due to the small spatial scale of the present study, the mobility of the studied species and the limited temporal scale of the sampling effort (from April to October), it would be risky to use presence-absence algorithms (Oviedo Correa et al., 2019). Thus, we modeled boat presence and dolphin occurrence at different temporal scales (each year from 2015 to 2018 and the whole period 2015–2018) by MaxEnt (version 3.4.1, Phillips et al., 2020). SDM based on Maximum Entropy (MaxEnt) is one of the most reliable tools (Elith et al., 2006, 2011), especially when presence-only data (Guisan and Thuiller, 2005) are available. In fact, MaxEnt estimates a probability distribution (i.e., relative likelihood of presence; McClellan et al., 2014) for a species by contrasting occurrence data with background data, rather than true absence data (Thorne et al., 2012). Thus, MaxEnt does not assume that the absence precludes the likelihood of occurrence.
Three types of dolphin distribution models were built: models with the occurrence data of (i) all groups sighted, (ii) only groups without calves and (iii) only groups with calves. Calves were defined as dolphins less than or equal to two-thirds the length of an adult and usually associated with an adult female.
For modeling the likelihood of boat presence, we used location points of all boats (recreational, fishing, and tourist boats) recorded during the surveys as presence data and the raster surface of depth, slope, aspect, and distance to the coast as explanatory variables (Table 2). Since distance to the coast and depth were collinear, only depth was included in the models. Boat presence data were averaged for each year and for the whole period (2015–2018). For modeling the likelihood of dolphin presence, we considered five continuous variables (SST mean, SST range, Chl-a, depth and slope) and two categorical variables (aspect and habitat type) to be environmental predictors (Tables 1, 2); we considered the likelihood of boat presence (the raster output of 250 m resolution, modeled by MaxEnt) to be an anthropogenic predictor. We preferred calculating the likelihood of boat presence instead of using the presence of boats as predictors since boat movement varies temporally and spatially as a function of human behavior (Cummins et al., 2008; Tallis et al., 2012). For both models, MaxEnt settings were chosen in relation to the specific questions of the study and data limitations (Merow et al., 2013): (i) the cloglog output most appropriate for estimating likelihood of presence (Phillips et al., 2017), (ii) hinge features (Phillips and Dudík, 2008), (iii) default regularization parameters, and (iv) 10-fold cross-validation to assess the average behavior of the algorithms randomly partitioning the occurrence data in ten random subsets (Phillips et al., 2006). The geographical extent of the models coincides with the monitored area that includes the typical and known habitat of bottlenose dolphins (Bearzi et al., 2012). Thus, we used all the background sites available (5,358) to increase the predictive performance (Phillips and Dudík, 2008).
We ran a jack-knife analysis to estimate the contribution of each variable to the MaxEnt run, obtaining alternative estimates of variable importance for our models. The performance of each MaxEnt model was assessed using the AUC (area under the receiver operating characteristic curve; Phillips et al., 2006). The AUC provides a threshold-independent metric of overall accuracy and ranges between 0 and 1. Models with moderate-to-good discrimination ability correspond to AUC higher than 0.7 (Swets, 1988). Additionally, we verified the model robustness by computing: (i) the test-AUC standard deviation (SD) and (ii) the difference between the train-AUC values (using all presences) and the mean test-AUC values. Low test-AUC SD and/or small difference between the train-AUC and mean test-AUC values indicate model robustness (Herkt et al., 2016). The AUC provides an adequate evaluation of model performance (Phillips et al., 2006); however, in the case of presence-only distribution models, AUC will compare presences with background points and cannot be considered a perfect measure of model accuracy (Lobo et al., 2008; Merow et al., 2013).
Using MaxEnt from the cloglog output (Phillips et al., 2017), we produced maps of each year (from 2015 to 2018) and of the whole period (2015–2018) for the likelihoods of dolphin and boat presence.
Overlap Analysis
In order to explore the relationship between the likelihood of dolphin presence and the likelihood of boat presence, we used binary maps using threshold values provided by MaxEnt. Thus, we considered the maximum training sensitivity plus specificity threshold, a method that balances the chance of correctly identifying suitable areas (sensitivity) with the chance of correctly assigning unsuitable areas (specificity - Ramirez-Reyes et al., 2016). Maximizing the sum of sensitivity and specificity (MSSS) is one of the best threshold selection methods with presence-only data (Liu et al., 2013). By these threshold values, we obtained binary maps reclassifying the dolphin and boat model outputs (for the total period 2015–2018) using the ‘Reclassify’ function of Spatial Analyst Tool (York et al., 2011). For the dolphin models we set: (i) prediction values below the MSSS threshold as 1 (low dolphin habitat suitability) and (ii) prediction values above the MSSS threshold as 2 (high dolphin habitat suitability). Similarly, for the boat models we set: (i) prediction values below the MSSS threshold as 3 (low boat traffic) and (ii) prediction values above the MSSS threshold as 4 (high boat traffic). We multiplied the reclassified dolphin model output with the reclassified boat model output using the ‘Raster Calculator’ function of Spatial Analyst Tool. This raster calculation resulted in habitat overlap analysis raster layer classes: (i) low dolphin habitat suitability and low boat traffic, (ii) low dolphin habitat suitability and high boat traffic, (iii) high dolphin habitat suitability and low boat traffic and (iv) high dolphin habitat suitability and high level of boat traffic (York et al., 2011). We calculated the surface and relative proportion occupied by each class within the study area for the total period 2015–2018, and for each one of the dolphin models type (all groups, groups with calves and groups without calves).
Finally, based on the overlap analysis we mapped the boundaries of two proposed SCIs: SCI-A in the area of Alghero and SCI-B in the area that connects SCI-A to the closest SCIs in northern and southern Alghero. We identified the SCI-A as the area that contains and connects all the high dolphin suitability cells obtained by superimposing the overlap analysis of each year. As the boundary of this area approximates the isobath of 100 m, the 100 m-contour was used as a limit to define the boundaries of the SCI-B. Thus, in compliance with the request of the Italian Ministry of the Environment and the European Commission, the present study responds to the need of the Sardinia Region to scientifically support the proposal of new coastal SCIs for the protection of bottlenose dolphins by enlarging already existing protected areas.
Results
Likelihood of Boat Presence
During the sampling period we counted a total of 5545 boats. The majority (78%) were recreational boats, while 8% were commercial fishing boats and 14% were tourist boats. Since the likelihood of recreational and tourist boat presence were correlated and the likelihood of fishing boat presence was correlated with the likelihood of recreational boat presence, the models here presented were built considering the likelihood of all boat types presence. Based on AUC, the accuracy of MaxEnt in predicting the likelihood of boat presence was higher than 0.75 in any investigated years (Table 3). The most important contributor in predicting the likelihood of boat presence was depth (Table 3). The probability of finding boats was higher between −60 and −20 m of depth and decreased deeper than −80 and shallower than −20, regardless of the years. Overall, the highest likelihood of boat presence was inside the boundaries of the MPA/SCI (Figure 2).
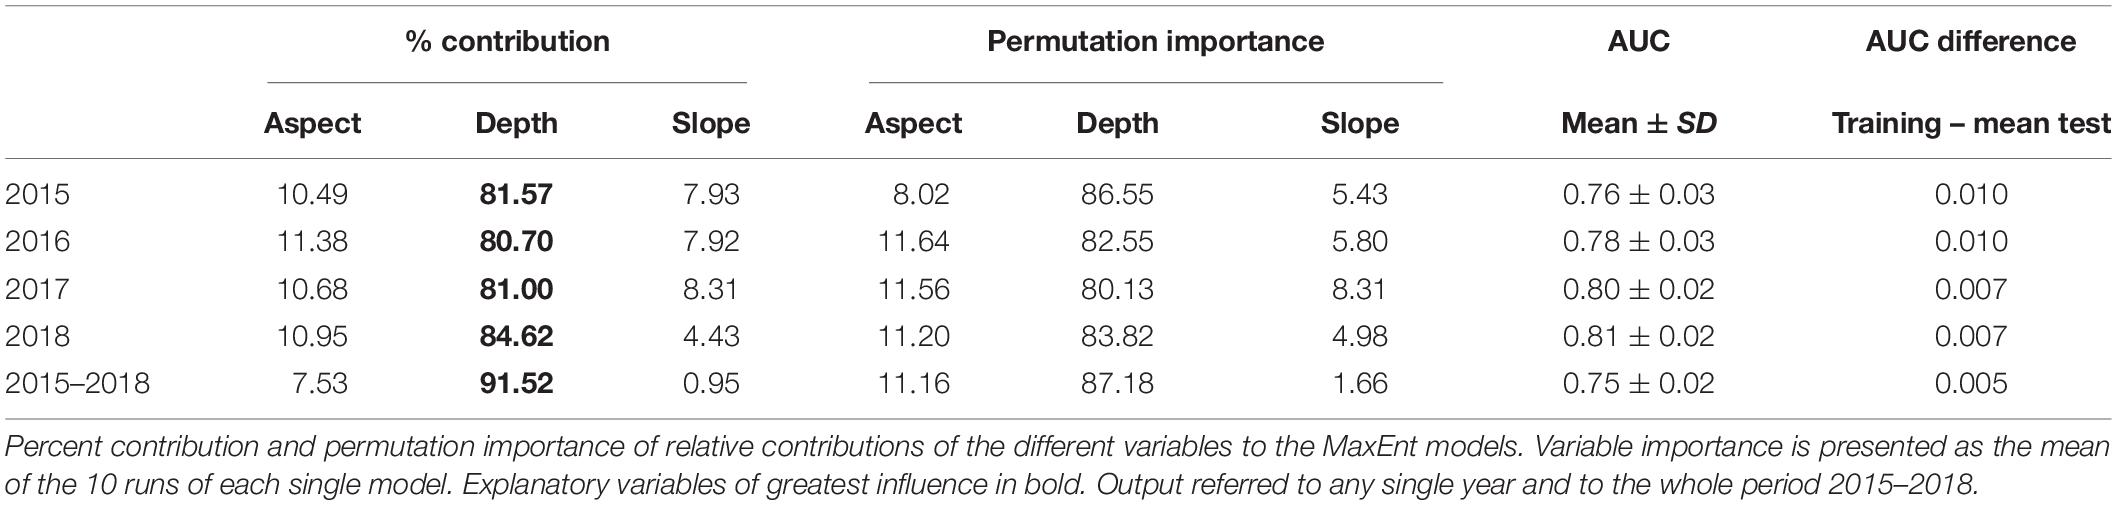
Table 3. Boat presence prediction.
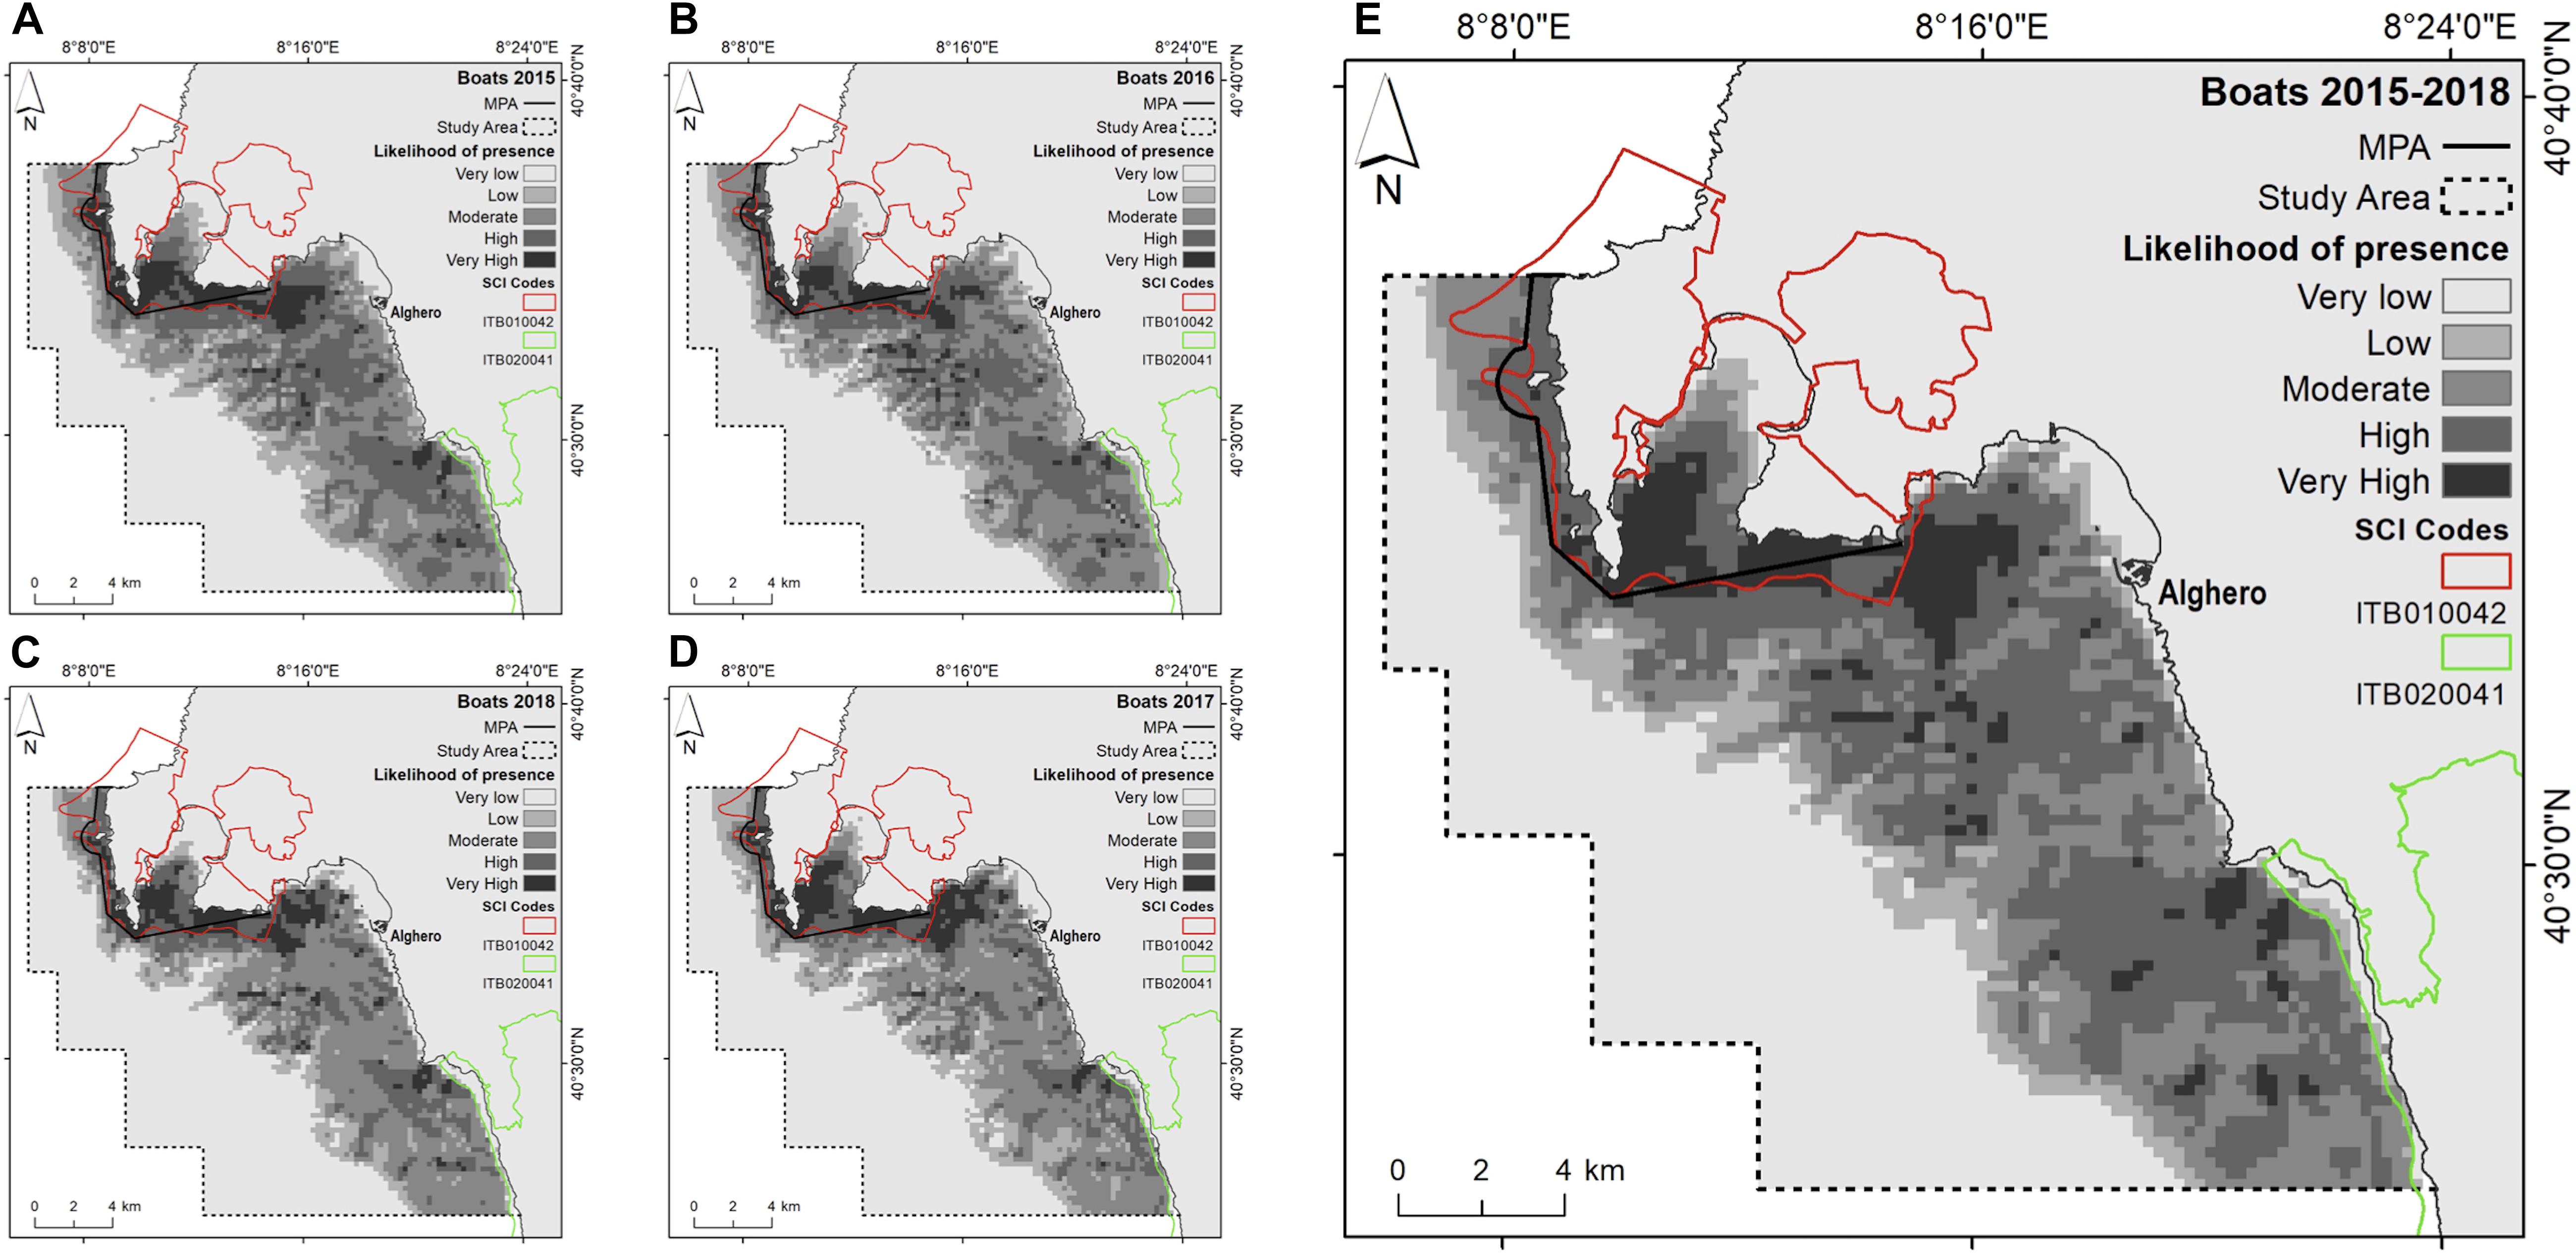
Figure 2. Likelihood of boat presence (cloglog output) as a function of the environmental predictors for yearly: (A) 2015; (B) 2016; (C) 2017; (D) 2018; and (E) the entire study period (2015–2018).
Likelihood of Dolphin Presence
Across all years, 307 dolphin groups were sighted in about 11,000 km of navigation and 391 surveys (Supplementary Material 1 and Figure 1). All MaxEnt models obtained AUC higher than 0.75, with the only exception of the model referring to groups with calves in 2016; this indicates high accuracy in predicting dolphin presence (Table 4). The difference between mean AUC values from test-SDMs and the corresponding training AUC from the SDM was generally low (Table 4), indicating overall model robustness.
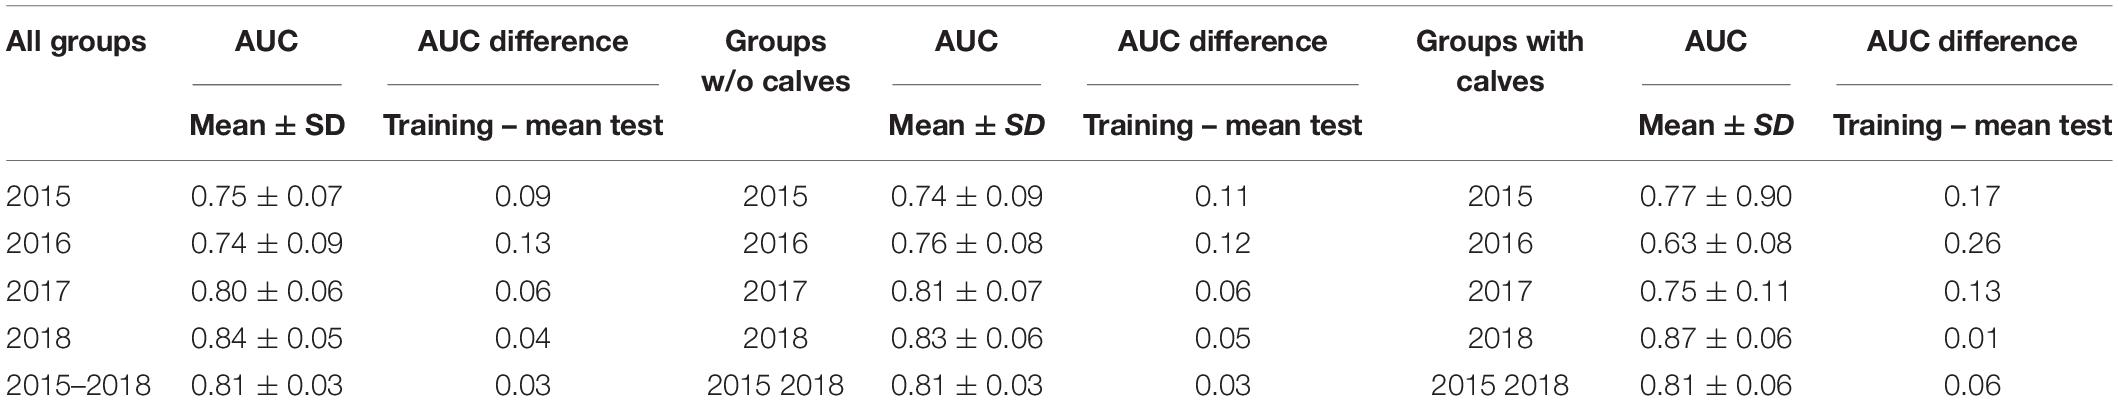
Table 4. Mean test AUC and standard deviation and AUC difference (training – mean test) for the dolphin presence predictions, distinguished by dolphin social group type.
The most important contributing variables to the dolphin habitat suitability models were the likelihood of boat presence, habitat type and mean SST (Figure 3). Particularly, the probability of finding dolphins: (i) remained low as the probability of boat occurrence increased; (ii) was high for all habitat types with the sole exception of the habitat “Mediterranean animal community of coastal detritic bottoms” (number 7); (iii) decreased when the mean SST increased (Supplementary Material 2). The most suitable areas for dolphins are inside Alghero Bay, both along its southern coast and inside/around the boundaries of the MPA and the SIC ITB010042 (Figure 4); these areas extend for about 51 km2, ranging from 59 km2 in 2015 to 37 km2 in 2017 (Table 5).
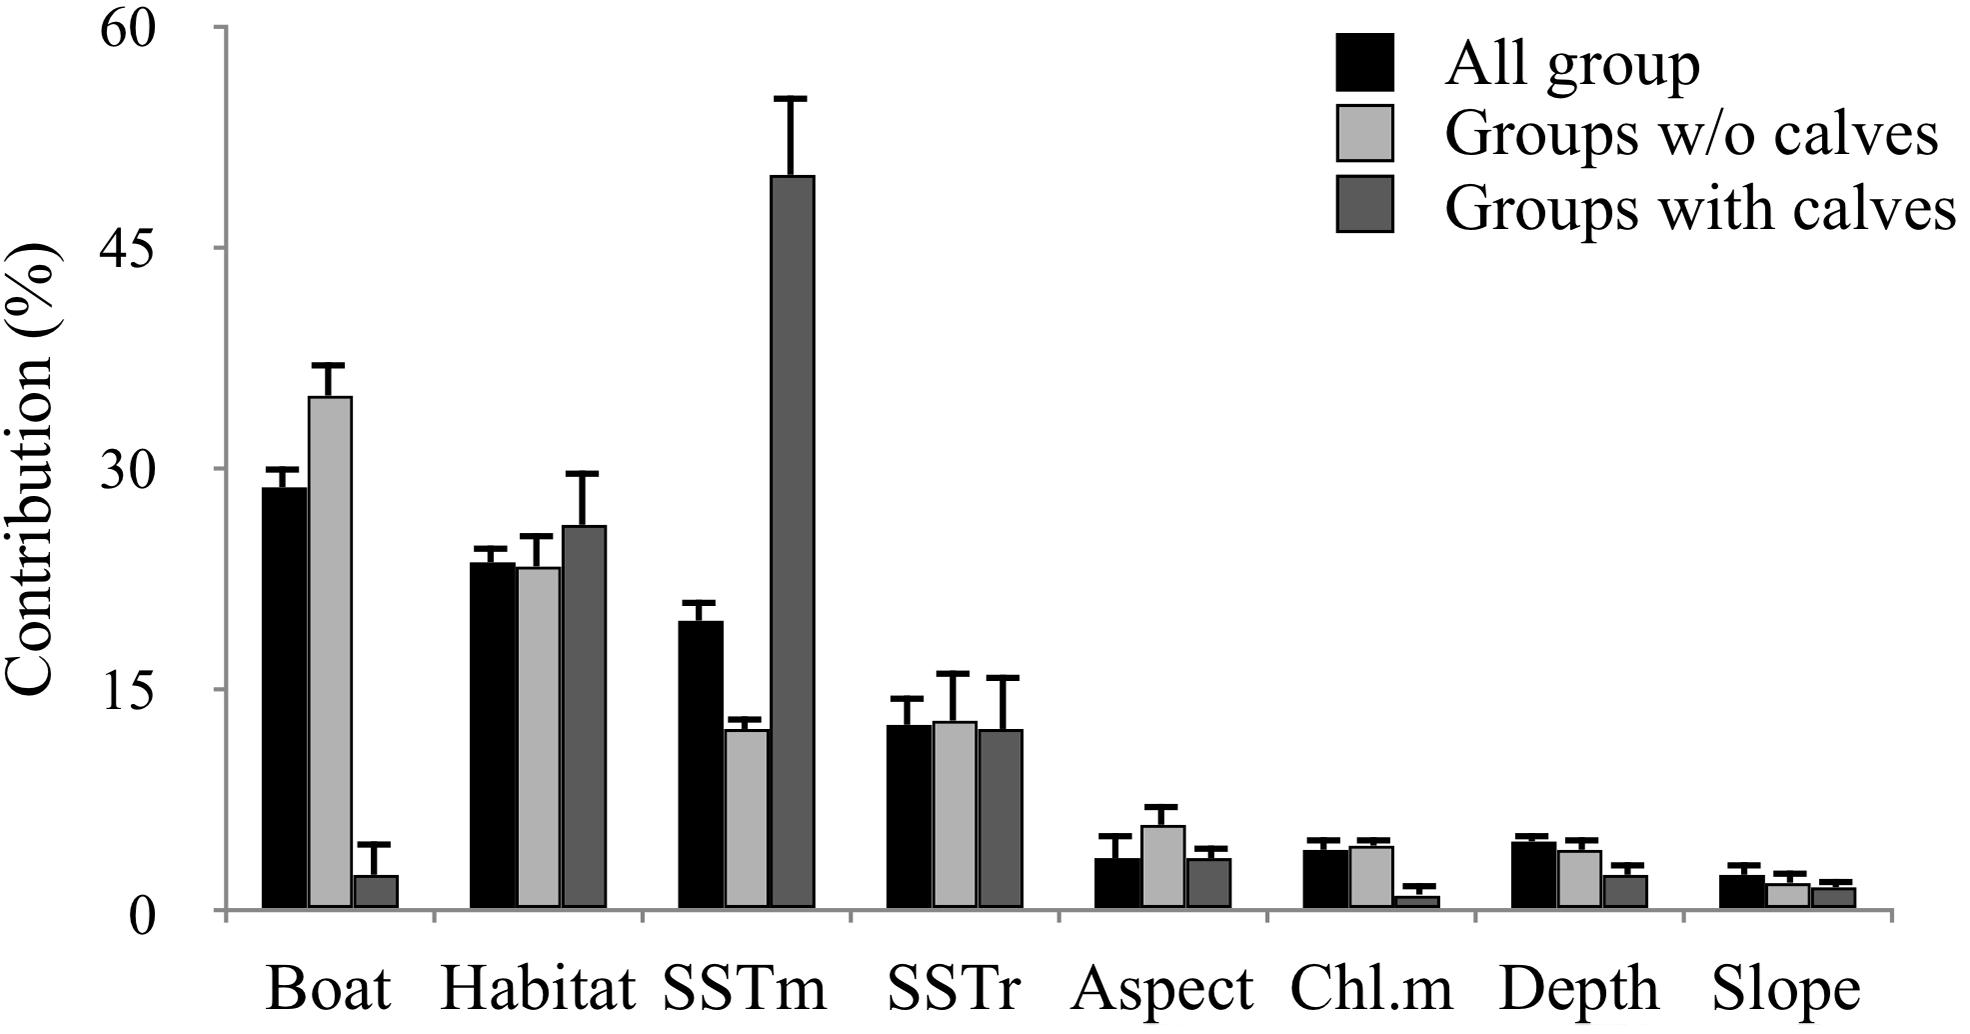
Figure 3. Percent contribution (±SD) of the different variables to the MaxEnt models run with (i) all groups (black bars); (ii) groups without calves (light gray bars); (iii) groups with calves (dark gray bars). Period: 2015–2018.
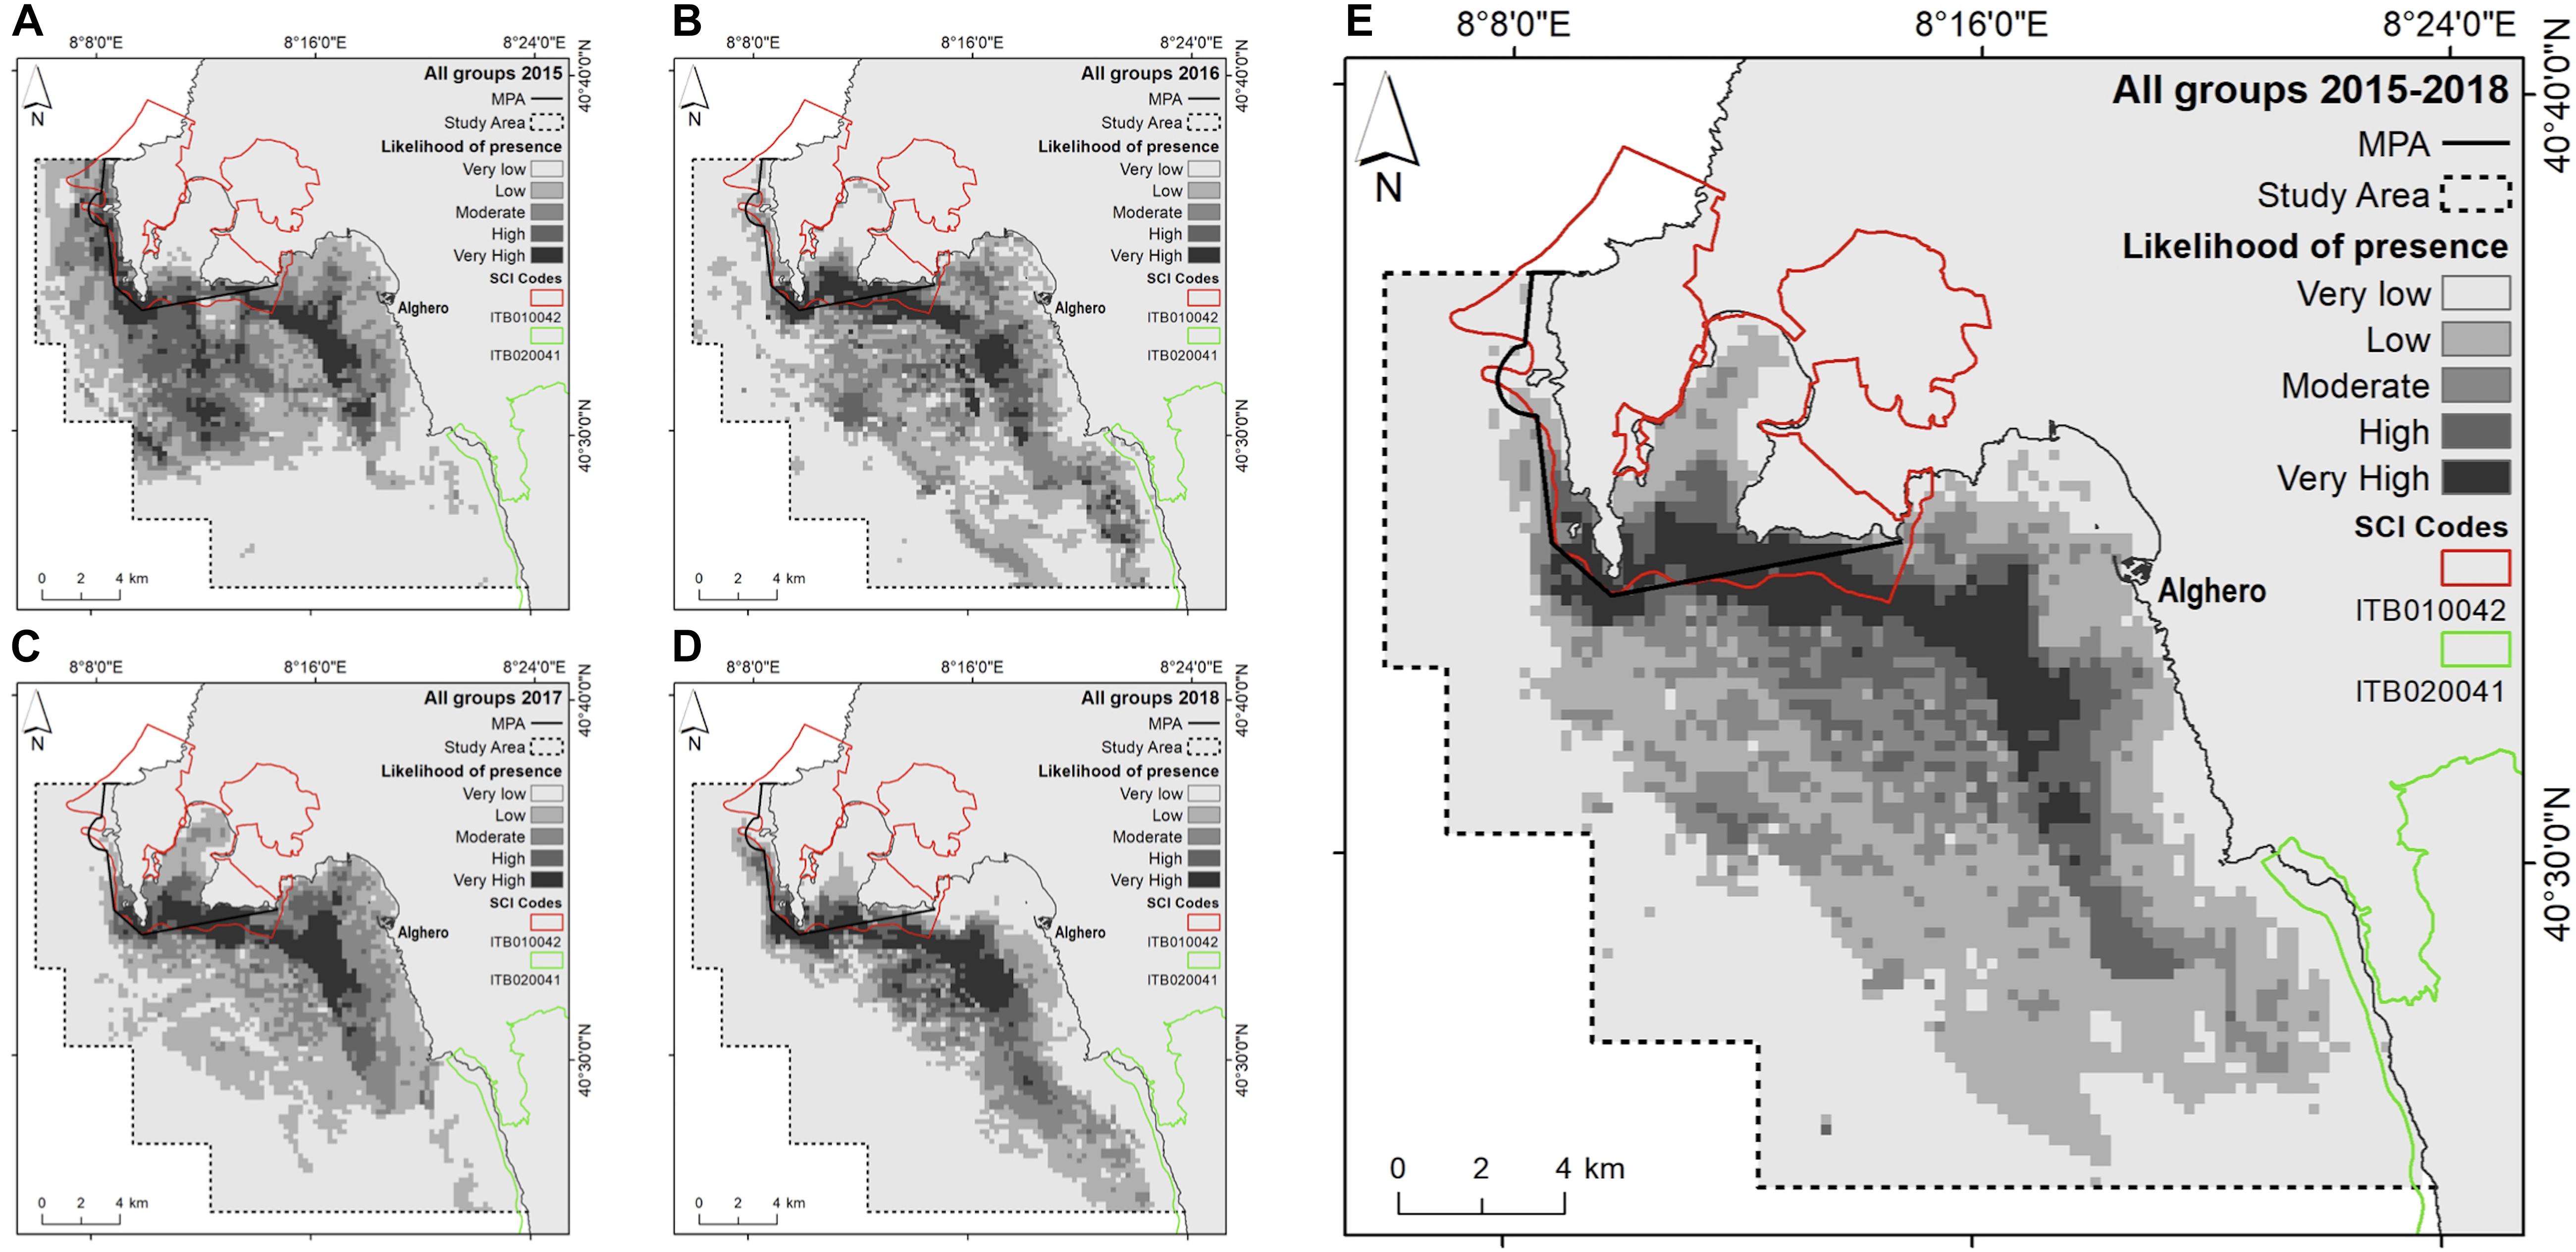
Figure 4. Likelihood of dolphin presence (cloglog output) as a function of the environmental predictors for all groups. (A) 2015; (B) 2016; (C) 2017; (D) 2018; (E) the entire study period (2015–2018).
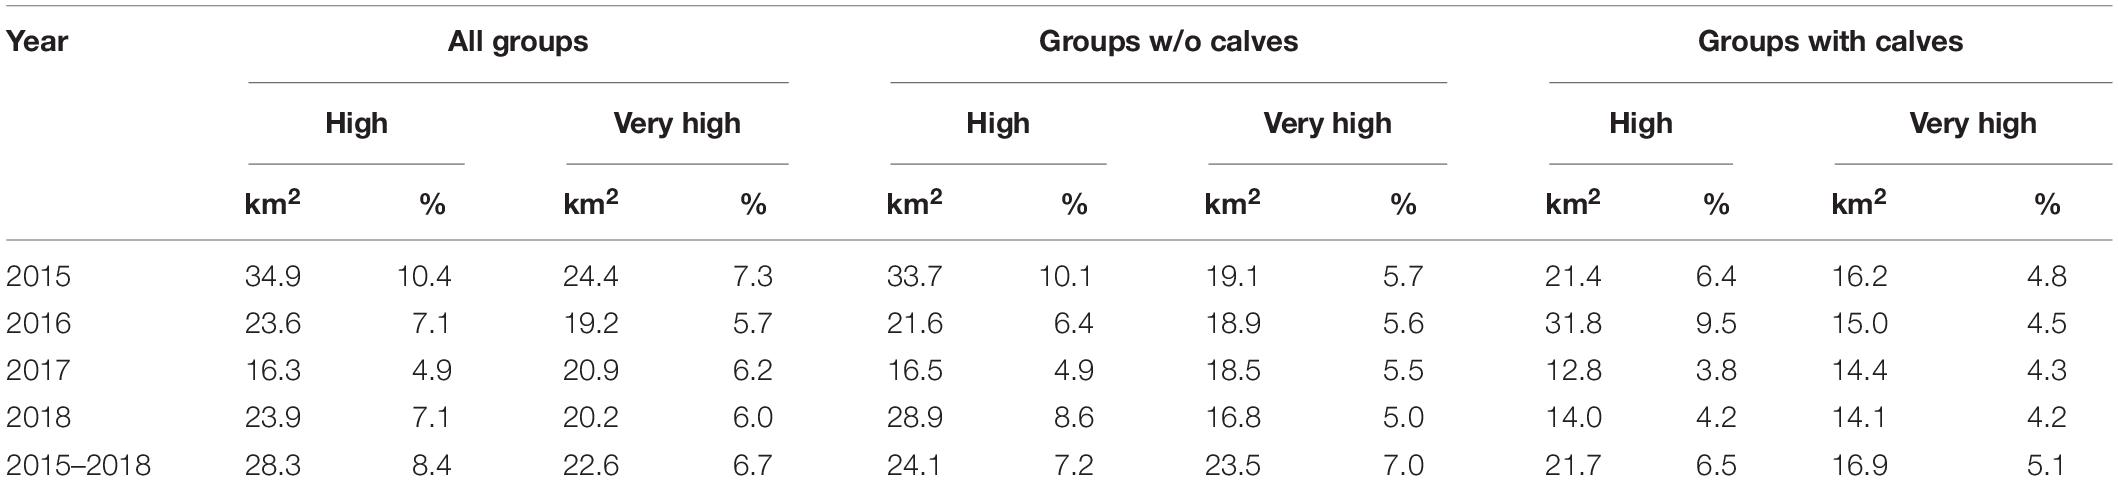
Table 5. Area (km and %) associated with classes of high (0.6–0.8) and very high (0.8–1.0) likelihood of dolphin presence as a function of year, distinguished by dolphin group composition.
Influence of Dolphin Group Composition
Different model outputs were obtained depending on the type of dolphin group composition (Figures 5, 6). The overall likelihood of finding groups without calves did not change as the likelihood of boat presence increased; the likelihood of finding groups with calves was lower at higher likelihood of boat presence (Supplementary Material 2). Furthermore, while the likelihood of finding groups without calves was high for almost all habitat types, for groups with calves it was high exclusively in three habitat types: (i) “infralittoral rock and hard substrata” (number 1), (ii) “infralittoral coarse sediment” (number 4) and (iii) “infralittoral fine sand” (number 5). For both types of dolphin groups, the likelihood of presence decreased with mean SST increase in all years (Supplementary Material 2).
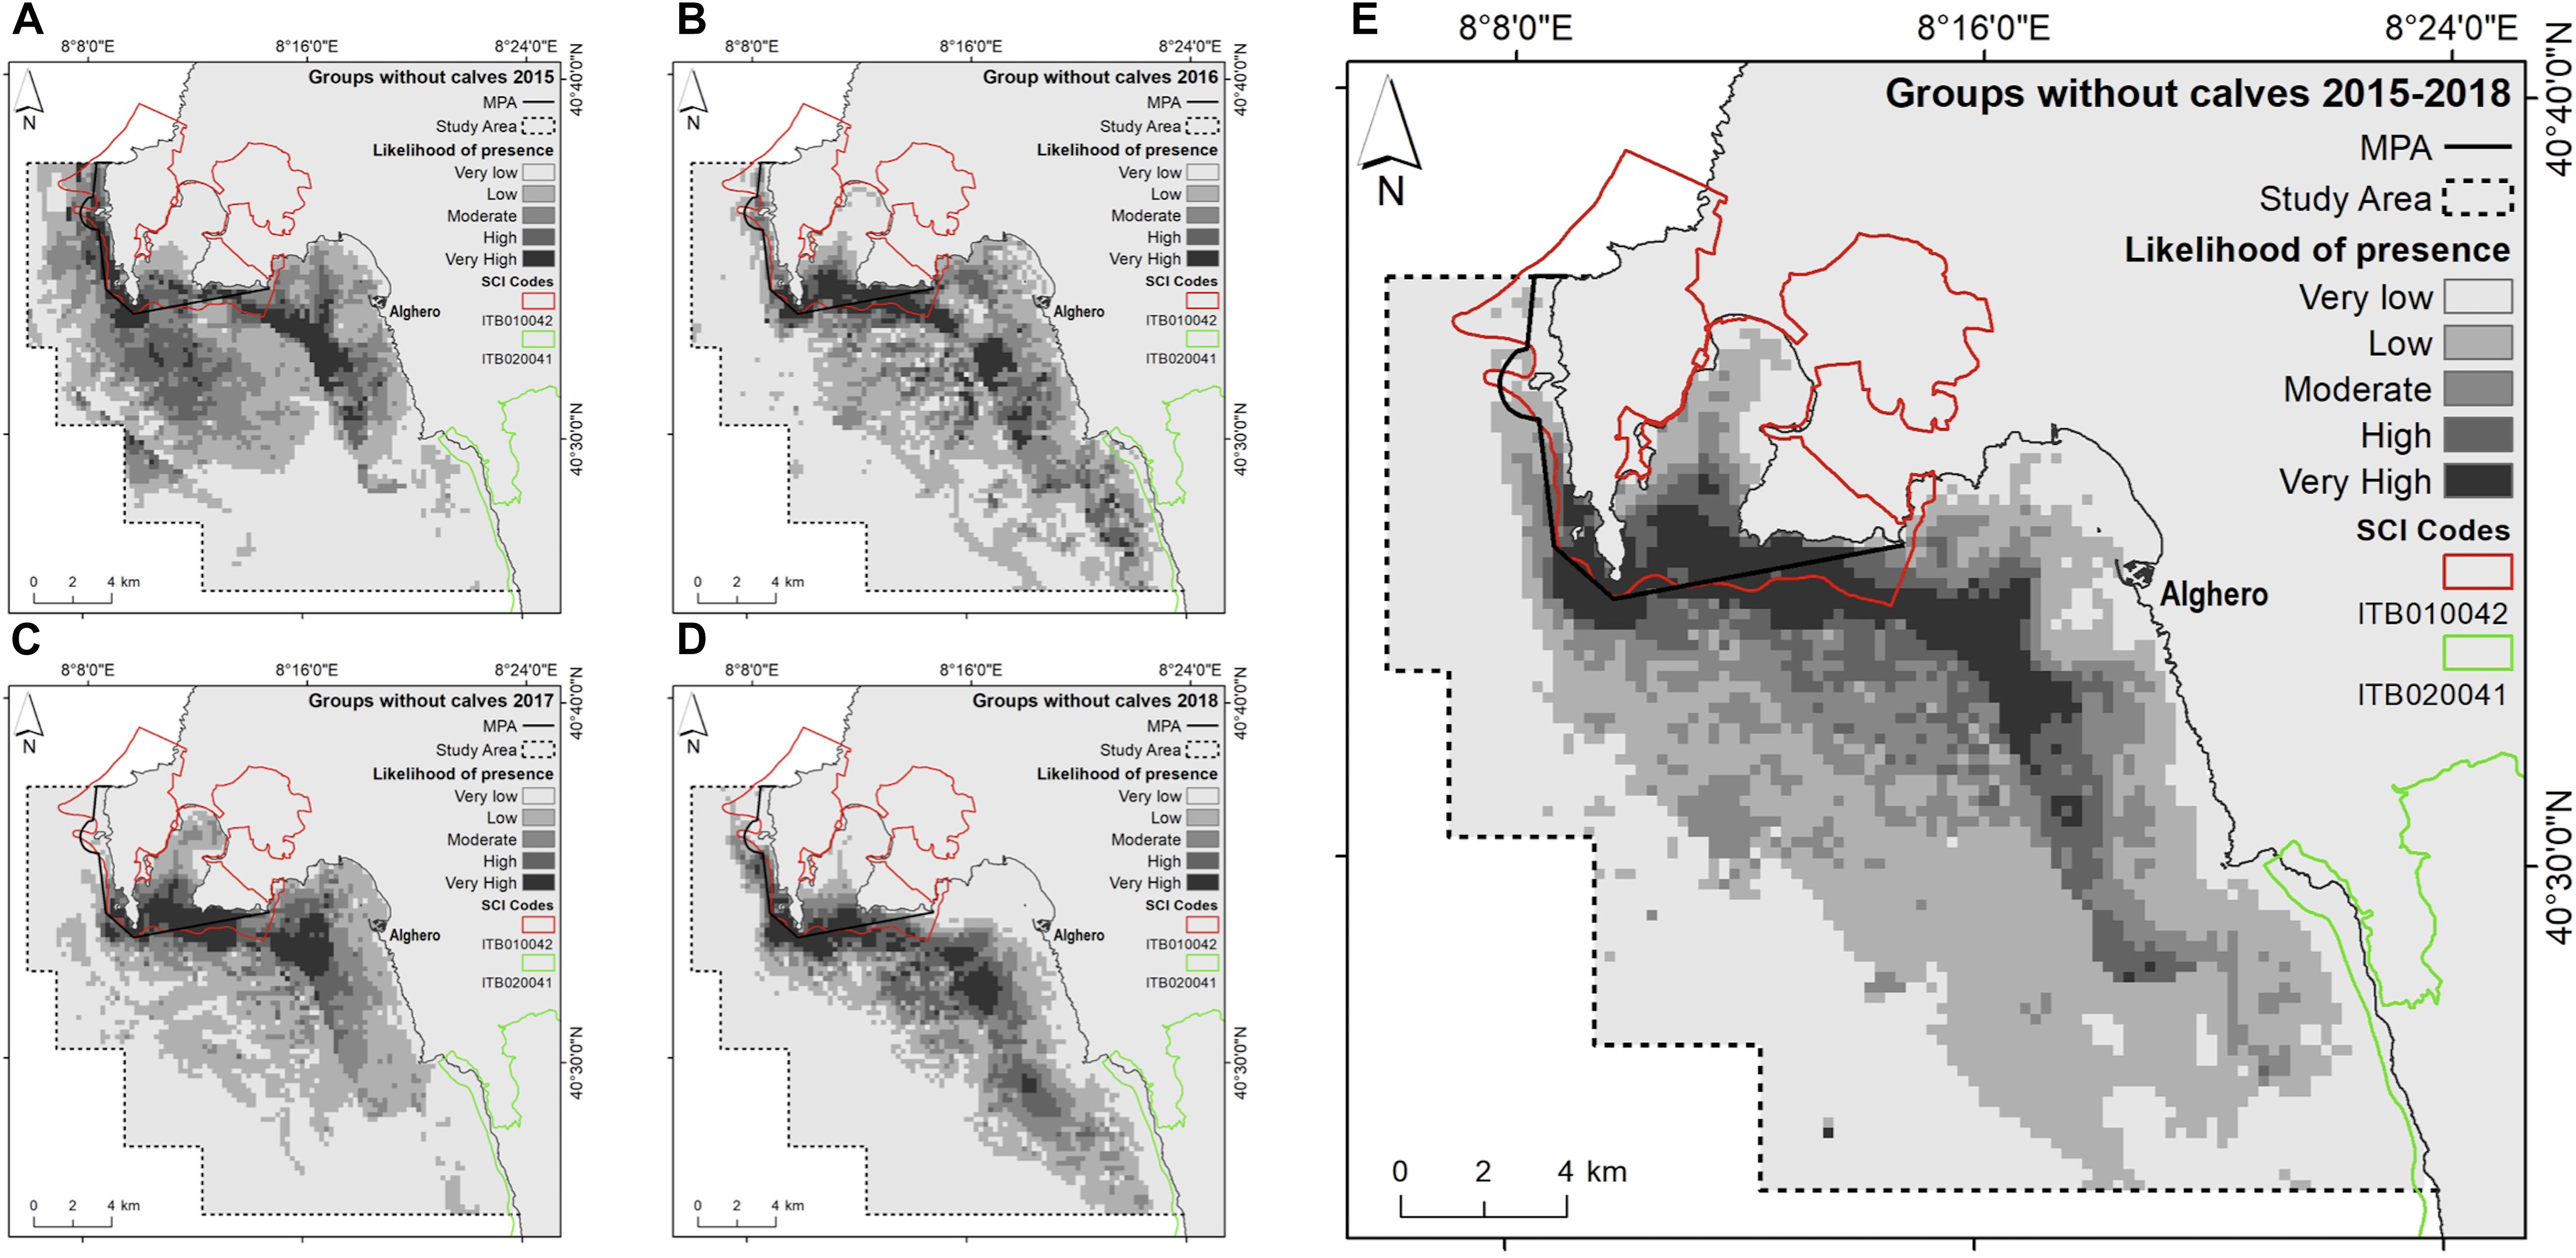
Figure 5. Likelihood of dolphin presence (cloglog output) as a function of the environmental predictors for groups without calves. (A) 2015; (B) 2016; (C) 2017; (D) 2018; (E) the entire study period (2015–2018).
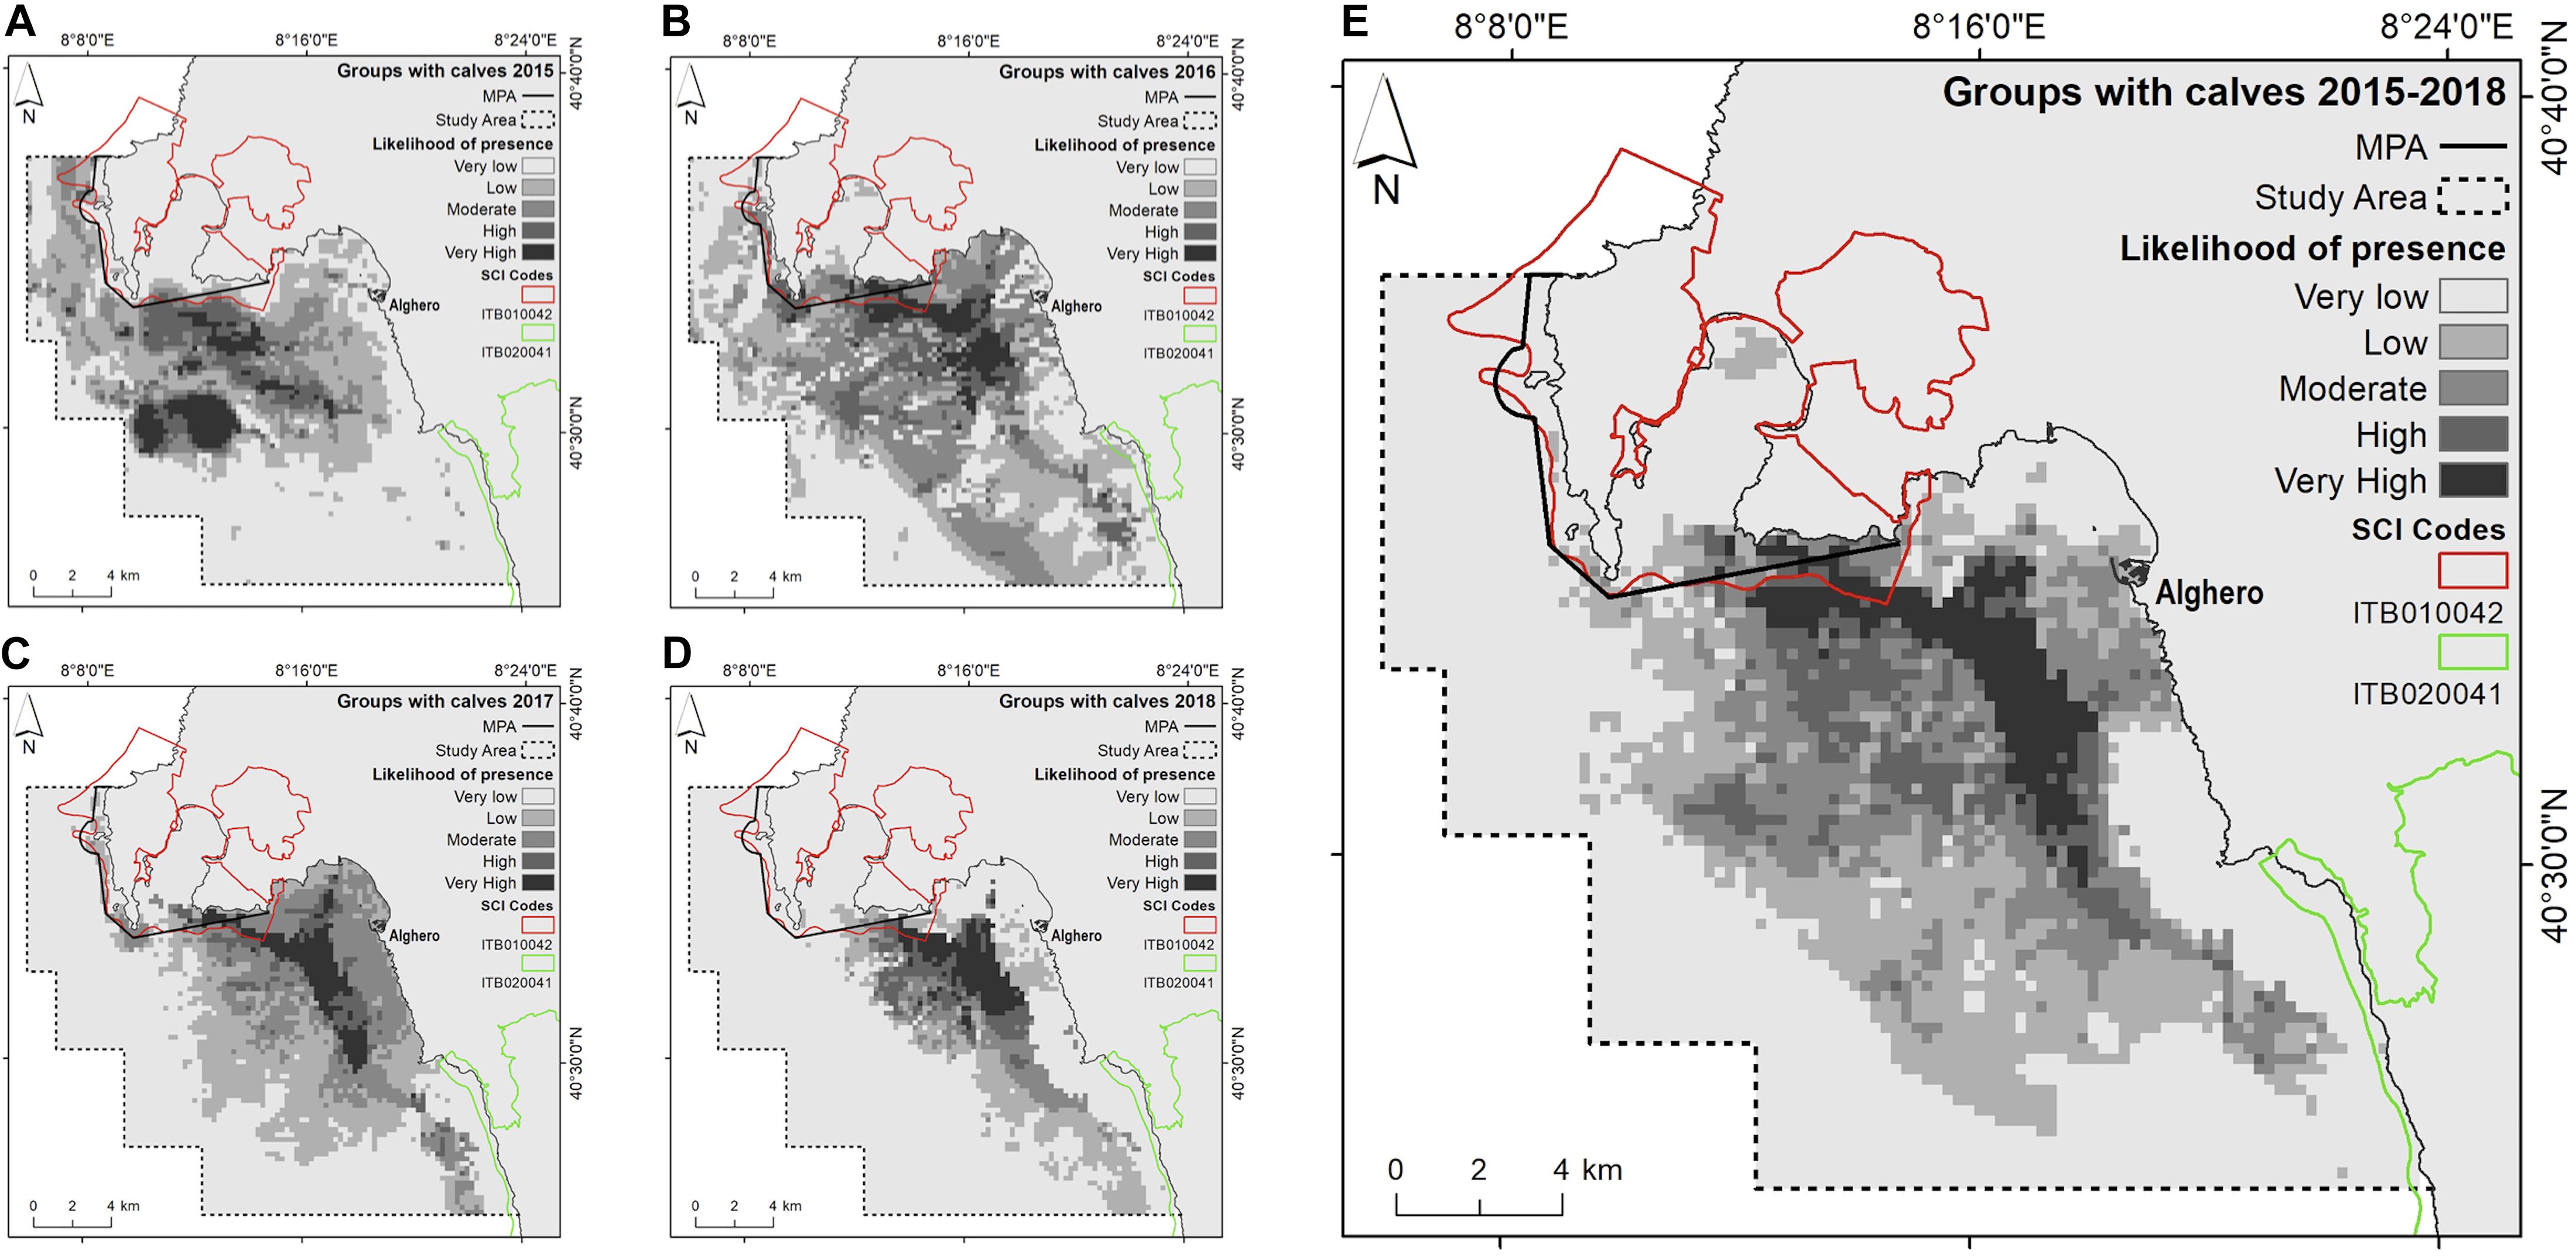
Figure 6. Likelihood of dolphin presence (cloglog output) as a function of the environmental predictors for groups with calves. (A) 2015; (B) 2016; (C) 2017; (D) 2018; (E) the entire study period (2015–2018).
Considering all dolphin groups, across all years, 15.1% of the study area was characterized by high (between 0.6 and 0.8) and very high (between 0.8 and 1) likelihood of dolphin presence. In groups with calves, this area was smaller than in groups without calves (Table 5). The areas inside and around the boundaries of the MPA/SCI correspond to a lower likelihood of dolphin presence for groups with calves (Figure 6).
Overlap Analysis
Based on the overlap analysis, considering all dolphin groups, 24% of the study area (79.6 km2) was characterized by high dolphin habitat suitability, across all years. The area of high dolphin habitat suitability for groups with calves was smaller (60.3 km2). More than 85% of the high dolphin habitat suitability areas overlapped with the high boat traffic area (Table 6 and Figure 7).
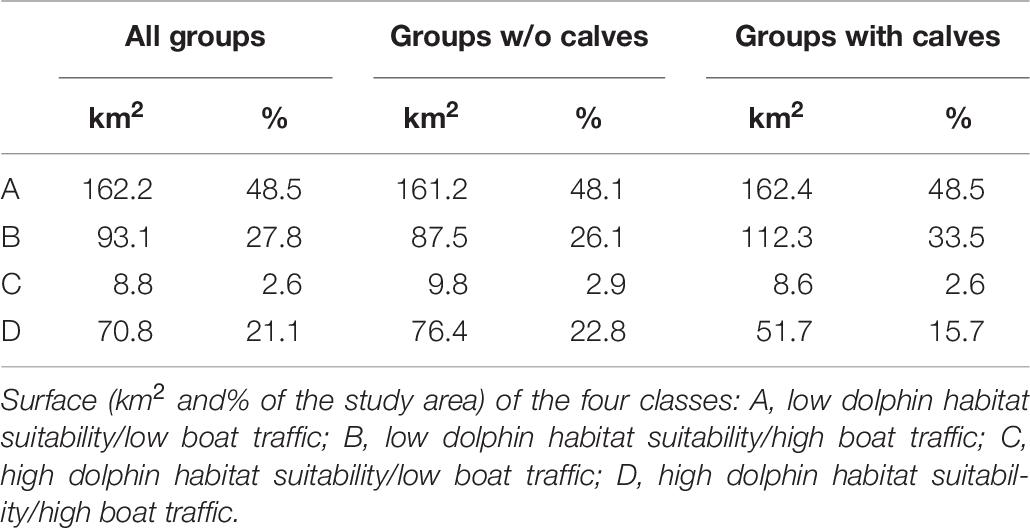
Table 6. Output of the overlap analysis.
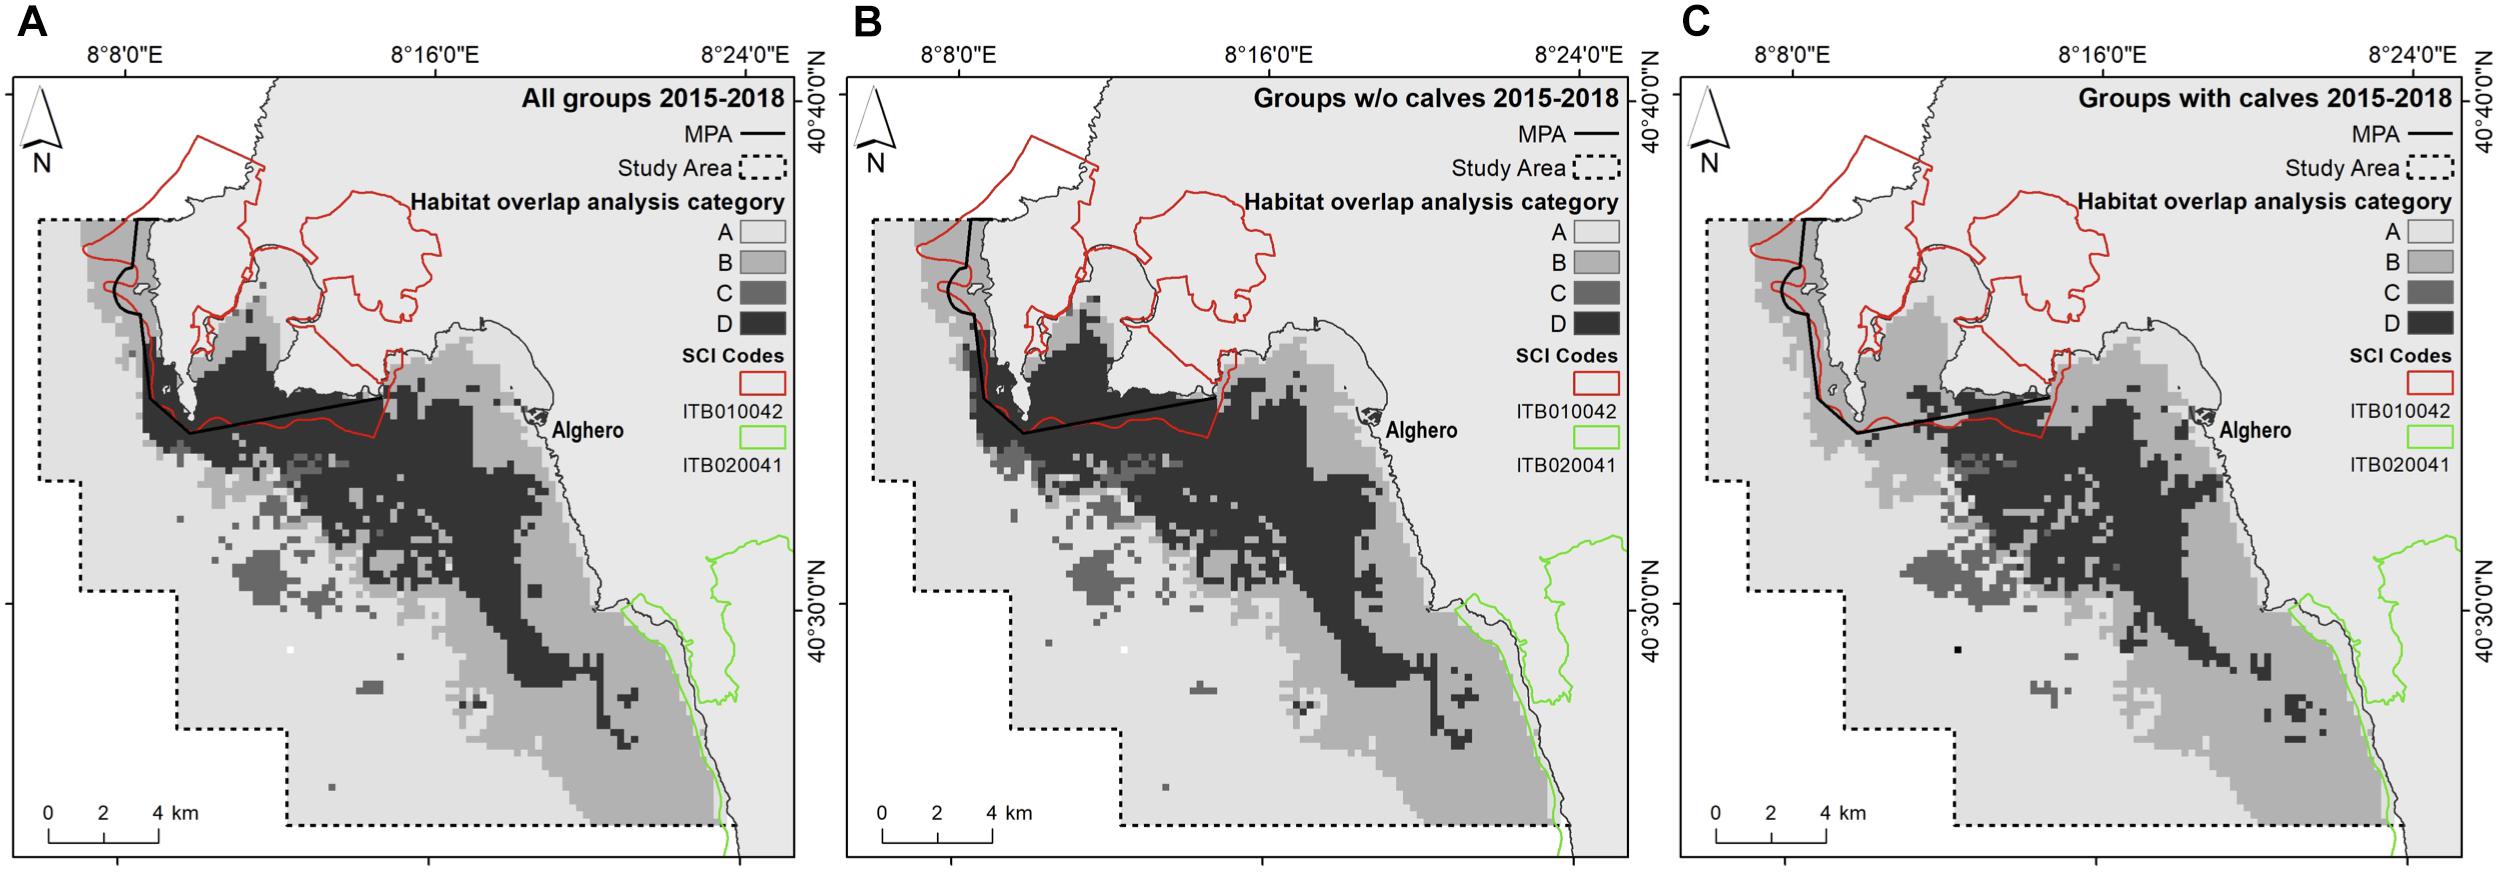
Figure 7. Output of the overlap analysis. The maps show the areas of low and high dolphin habitat suitability and areas of low and high boat traffic, for (A) all groups, (B) groups without calves, and (C) groups with calves. (A) Low dolphin habitat suitability and low boat traffic; (B) low dolphin habitat suitability and high boat traffic; (C) high dolphin habitat suitability and low boat traffic; (D) high dolphin habitat suitability and high level of boat traffic.
In order to comprise and connect all cells with high dolphin habitat suitability, we obtained SCI area of 290 km2 (SCI-A; Figure 8), representing about 72% of the study area. Extending the boundaries of the proposed SCI-A to the closest SCIs in northern and southern Alghero, following approximately the bathymetric limit of the SCI-A area (100 m), we obtained an enlarged area of 1,120 km2 (SCI-B; Figure 8).
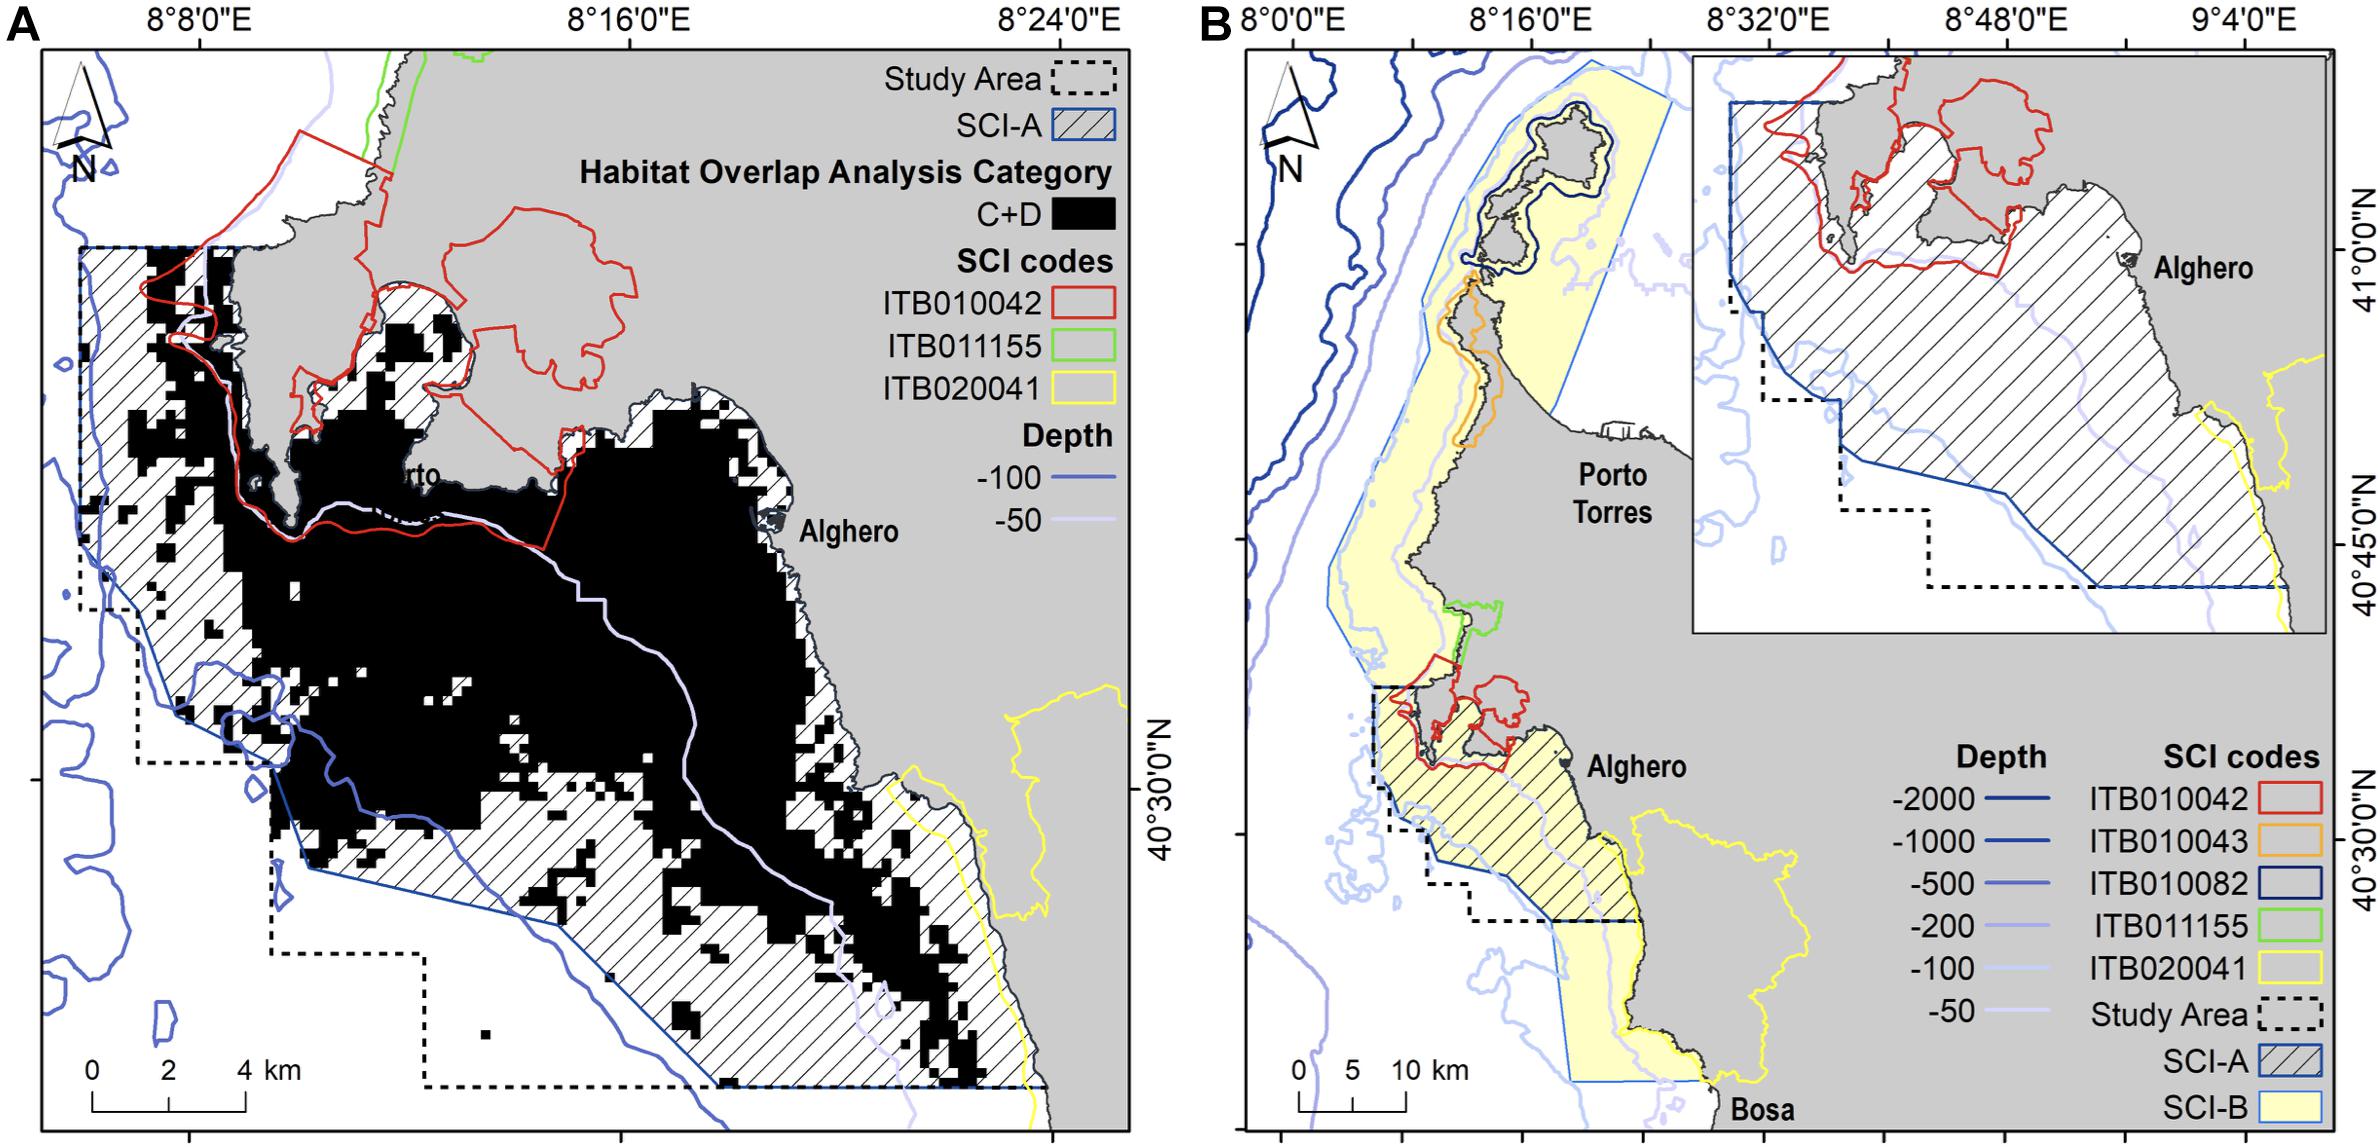
Figure 8. Boundaries of the proposed SCIs (A,B) for the protection of bottlenose dolphin, in comparison with the existent SCIs inside and outside the study area. (A) SCI-A is the area that contains and connects all the high dolphin suitability cells obtained by superimposing the overlap analysis of each year (black area in the map A). (B) SCI-B includes the area that connect the SCI-A to the closest SCIs in the North and South of Alghero; as the boundary of SCI-A approximates the isobath of 100 m, the 100 m-contour was used as a limit to define the boundaries of the SCI-B.
Discussion
In the present study, more than 85% of the area with high dolphin habitat suitability overlaps with the high boat traffic area. Further, a distinct use of core areas of different size between dolphin groups with and without calves was found. Although the groups with calves preferred certain habitat types (infralittoral rock and hard substrata, infralittoral coarse sediment, and infralittoral fine sand), they avoided those within and around the boundaries of the existing MPA/SCI; these areas are characterized by the highest likelihood of boat presence. Indeed, boating is concentrated within the MPA/SCI, which represents the only management tool available for bottlenose dolphin protection. Nevertheless, the only existing restriction to boat traffic concerns the limitation of boat speed in some MPA’s zones. These findings may suggest that boating in Alghero is a potentially relevant anthropogenic threat to dolphins. This could be the result of a compromise between the need of finding resources in the most productive habitats and the need to reducing the disturbance of boating activities (Frid and Dill, 2002), in terms of noise and risk of physical injuries (Pirotta et al., 2015). Moreover, human disturbance may be perceived by dolphins as a predation risk (Frid and Dill, 2002) and may alter the access to food resources (Allen et al., 2001), effectively reducing habitat availability (Carlucci et al., 2016; Coppes et al., 2017). Another possible scenario is that mothers avoid the busiest areas because these imply a high energy expenditure due to vigilance (Frid and Dill, 2002) or interruption of natural behavior, such as suckling (Elwen and Best, 2004).
Disturbance from boating seems to be better tolerated by groups without calves; model output and overlap analysis indicated an overlap between the areas that are most suitable for the species and those areas that are most used by boaters. Nevertheless, chronic exposure to human disturbance, especially during feeding, may elicit an alteration of the energy budget of the individuals; this could have consequences at the individual and population levels that should be carefully investigated (New et al., 2013).
Dolphin Habitat Preference
Over the entire study period (2015–2018), the most important predictors of dolphin distribution were the habitat type, the likelihood of boat presence and SST. In other Mediterranean studies, the most common predictors of bottlenose dolphin distribution were depth and distance from the coast, two variables often correlated. Namely, bottlenose dolphins prefer areas close to the 100 m isobath (Blasi and Boitani, 2012; Marini et al., 2014; La Manna et al., 2016), but they can be distributed in coastal areas with seafloor no deeper than 400 m (Azzellino et al., 2012; Carlucci et al., 2016; Bonizzoni et al., 2019). Conversely, in this study, the model suggests that dolphins prefer habitat type rather than variables related to the geophysical properties of the seabed (depth, aspect, and slope). A habitat preference could be due to different prey availability (Heithaus and Laurence, 2002; Lambert et al., 2017; Zanardo et al., 2017) and/or physical conditions of physiological importance (Guisan and Zimmermann, 2000). In fact, cetacean distribution is mainly influenced by attempts to optimize foraging efficiency in areas where prey availability is high (Hastie et al., 2004; Palacios et al., 2006, 2013; Redfern et al., 2006; Gilles et al., 2016). Prey availability can also be linked to water temperature, which is among the environmental variables that influence dolphin distribution (Bearzi et al., 2008; Hartel et al., 2014; Lambert et al., 2017). Sea surface temperature is the most important driver of trophic dynamics in marine food webs, which are essentially based on ectotherms (La Manna et al., 2016). To date, no information is available concerning the abundance and distribution of fish communities in the study area. A study conducted on the Spanish Mediterranean coast (Blanco et al., 2001) found that demersal and benthic fish of soft bottom were the most abundant dolphin preys, followed by octopodids of hard rocky bottom and of soft sand/coarse substrata.
Furthermore, dolphin distribution varied depending on calf presence. The difference in habitat suitability as a function of the presence and age of calves has been noted for other cetaceans (Weir et al., 2008; Cartwight et al., 2012; Hartman et al., 2014; Rayment et al., 2014; Pace et al., 2018). Consistently, different studies found that the diet of bottlenose dolphin can change in terms of species and size of prey as a function of individual sex and age; for females, it can also depend on their association with calves and juveniles (Blanco et al., 2001). This supports the differences in dolphin distribution as a function of habitat type depending on calf presence.
In the present study, we were only able to model the annual distribution of the bottlenose dolphin and could not consider seasonal trends in environmental variables or boating activity. Thus, we cannot infer whether the habitat preferences of bottlenose dolphins can change as a consequence of the seasonality of human presence and the environment. We also do not yet fully understand how the requirements of different reproductive stages or calf age affect habitat preference. Furthermore, even if we produced ecologically plausible results, we cannot exclude that the presented models could be improved through the inclusion of information related to the differential use of the several habitat types (Hastie et al., 2004; Forney et al., 2012). We also acknowledge that proximal predictors such as prey availability would improve model predictability, rather than the derived proxies of prey distribution considered in this study, such as SST and Chl-a.
Management Implications
The development of efficient conservation strategies for the bottlenose dolphin should encompass an accurate description of its distribution (Lambert et al., 2017). Species distribution model predictions should include human activities that can overlap with the habitat use of the species. Coastal tourism is exerting an increasing pressure on coastal ecosystems (Douvere and Ehler, 2007) and knowing the spatial distribution of tourism related boat traffic, especially within and around MPAs/SCIs, should become prerequisite for effective human activities management in tourist areas. In particular, the potential biological cost of boat impacts on female dolphins and calves should be a main concern for MPA/SCI management as stressors caused by boating can influence pregnancy success, calf survival, and population stability (Moberg, 2000).
This study posits that the boundaries of the existing SCIs in the Alghero region should be tailored to include high dolphin suitability areas and should connect with the other contiguous SCIs along the north western Sardinian coast. Implementing and enforcing a spatial plan in the Alghero area that includes bottlenose dolphin protection would be possible by considering the results of modeling exercise. The overlap analysis presented here is the result of the spatial interaction between humans and dolphins, and identifies the need to balance human use and species conservation needs in the Alghero region. Therefore, adjusting the MPA and/or SCI boundaries could help reduce anthropogenic impacts to dolphins (Cartwight et al., 2012).
Furthermore, the MPA/SCIs management plans should be accurately implemented and enforced to decrease dolphin-boat interactions, especially for mother-calf pairs. Particularly, the maximum number of boats, the maximum distance of boats to dolphin groups and boat speed in presence of dolphins should be restricted in MPA/SCI, as already be done in other Italian MPAs. Additional investigations should address dolphin reactions to boats, in terms of distribution, habitat use and behavioral alterations.
Data Availability Statement
The datasets generated for this study are available on request to the corresponding author.
Ethics Statement
Ethical review and approval was not required for the animal study because the study is observational and was approved by the Marine Protected Area Capo Caccia Isola Piana.
Author Contributions
GLM, FR, GS, and GC conceived the ideas and designed methodology. GLM, FR, and AR collected the data. GLM and FR analyzed the data. GLM, GS, and GC led the writing of the manuscript. All authors contributed critically to the drafts and gave final approval for publication.
Conflict of Interest
The authors declare that the research was conducted in the absence of any commercial or financial relationships that could be construed as a potential conflict of interest.
Acknowledgments
We want to thank the Capo Caccia - Isola Piana MPA for the permit to conduct the study, and MARETERRA GROUP for financial and logistic support during this study. Information contained here has been derived from data available under the European Marine Observation Data Network (EMODnet) Seabed Habitats project.
Supplementary Material
The Supplementary Material for this article can be found online at: https://www.frontiersin.org/articles/10.3389/fmars.2020.542648/full#supplementary-material
References
Alessi, J., and Fiori, C. (2014). From science to policy - a geostatistical approach to identifying potential areas for cetacean conservation: a case study of bottlenose dolphins in the Pelagos sanctuary (Mediterranean Sea). J. Coast. Conserv. 18, 449–458. doi: 10.1007/s11852-014-0330-333
Allen, M. C., Read, A. J., Gaudet, J., and Sayigh, L. S. (2001). Fine-scale habitat selection of foraging bottlenose dolphins Tursiops truncatus near Clearwater, Florida. Mar. Ecol. Prog. Ser. 222, 253–264. doi: 10.3354/meps222253
Ashe, E., Noren, D. P., and Williams, R. (2010). Animal behaviour and marine protected areas: incorporating behavioural data into the selection of marine protected areas for an endangered killer whale population. Anim. Conserv. 13, 196–203. doi: 10.1111/j.1469-1795.2009.00321.x
Azzellino, A., Panigada, S., and Lanfredi, C. (2012). Predictive habitat models for managing marine areas: spatial and temporal distribution of marine mammals within the Pelagos Sanctuary (Northwestern Mediterranean sea). Ocean Coast. Manag. 67, 63–74. doi: 10.1016/j.ocecoaman.2012.05.024
Bearzi, G., Fortuna, C., and Reeves, R. (2012). Tursiops truncatus. IUCN Red List Threat. Spec. 2012:e.T22563A2782611.
Bearzi, G., Azzellino, A., Politi, E., Costa, M., and Bastianini, M. (2008). Influence of seasonal forcing on habitat use by bottlenose dolphins Tursiops truncatus in the Northern Adriatic Sea. Ocean Sci. J. 43, 175–182. doi: 10.1007/bf03029922
Blanco, C., Salomon, O., and Raga, J. A. (2001). Diet of the bottlenose dolphin (Tursiops truncatus) in the western Mediterranean Sea. J. Mar. Biol. Assoc. U.K. 81, 1053–1058. doi: 10.1017/s0025315401005057
Blasi, M., and Boitani, L. (2012). Modelling fine-scale distribution of the bottlenose dolphin Tursiops truncatus using physiographic features on Filicudi (southern Thyrrenian Sea, Italy). Endang. Spec. Res. 17, 269–288. doi: 10.3354/esr00422
Bohrer do Amaral, K., Alvares, D. J., and Heinzelmann, L. (2015). Ecological niche modelling of Stenella dolphins (Cetartiodactyla: Delphinidae) in the southwestern Atlantic ocean. J. Exp. Mar. Biol. Ecol. 472, 166–179. doi: 10.1016/j.jembe.2015.07.013
Bonizzoni, S., Furey, N. B., Santostasi, N. L., Eddy, L., Valavanis, V. D., and Bearzi, G. (2019). Modelling dolphin distribution within an Important Marine Mammal Area in Greece to support spatial management planning. Aquat. Conserv. Mar. Freshw. Ecosyst. 29, 1665–1680. doi: 10.1002/aqc.3148
Braunisch, V., Patthey, P., and Arlettaz, R. (2011). Spatially explicit modeling of conflict zones between wildlife and snow sports: prioritizing areas for winter refuges. Ecological Applications 21, 955–967. doi: 10.1890/09-2167.1
Brown, J. L. (2014). SDMtoolbox: a python-based GIS toolkit for landscape genetic, biogeographic and species distribution model analyses. Methods Ecolo. Evol. 5, 694–700. doi: 10.1111/2041-210x.12200
Brown, J. L., Bennett, J. R., and French, C. M. (2017). SDMtoolbox 2.0: the next generation Python-based GIS toolkit for landscape genetic, biogeographic and species distribution model analyses. PeerJ. 5:e4095. doi: 10.7717/peerj.4095
Canadas, A., Sagarminaga, R., and Garcıa-Tiscar, S. (2002). Cetacean distribution related with depth and slope in the Mediterranean waters off southern Spain. Deep Sea Res. 49, 2053–2073. doi: 10.1016/s0967-0637(02)00123-1
Carlucci, R., Fanizza, C., Cipriano, G., Paoli, C., Russo, T., and Vassallo, P. (2016). Modeling the spatial distribution of the striped dolphin (Stenella coeruleoalba) and common bottlenose dolphin (Tursiops truncatus) in the Gulf of Taranto (Northern Ionian Sea, Central-eastern Mediterranean Sea). Ecol. Indic. 69, 707–721. doi: 10.1016/j.ecolind.2016.05.035
Cartwight, R., Gillespie, B., LaBonte, K., Mangold, T., Venema, A., Eden, K., et al. (2012). Between a rock and a hard place: habitat selection in female-calf humpback whale pairs on the Hawaiian breeding grounds. PLoS One 7:e38004. doi: 10.1371/journal.pone.0038004
Coppes, J., Burghardt, F., Hagen, R., Suchant, R., and Braunisch, V. (2017). Human recreation affects spatio-temporal habitat use patterns in red deer (Cervus elaphus). PLoS One 12:e0175134. doi: 10.1371/journal.pone.0175134
Cummins, V., Gault, J., and O’Mahony, C. (2008). “Establishing information needs for planning and assessment of recreation activity in the coastal environment: a case study from cork harbour, Ireland,” in Proceedings of the International Pluridisciplinary Conference “The Littoral: Challenge, Dialogue, Action” - Lille, France.
Douvere, F., and Ehler, C. N. (2007). International workshop on marine spatial planning, UNESCO, Paris, 8-10 November 2006: a summary. Mar. Policy 31, 582–583. doi: 10.1016/j.marpol.2007.02.001
Elith, J., Graham, C. H., and Anderson, R. P. (2006). Novel methods improve prediction of species’ distributions from occurrence data. Ecography 29, 129–151.
Elith, J., Phillips, S. J., and Hastie, T. (2011). A statistical explanation of MaxEnt for ecologists. Diver. Distrib. 17, 43–57. doi: 10.1111/j.1472-4642.2010.00725.x
Elwen, S. H., and Best, P. B. (2004). Female southern right whales: are there reproductive benefits associated with their coastal distribution off South Africa? Mar. Ecol. Prog. Ser. 269, 289–295. doi: 10.3354/meps269289
Forney, K. A., Ferguson, M. C., Becker, E. A., Fiedler, P. C., Redfern, J. V., Barlow, J., et al. (2012). Habitat-based spatial models of cetacean density in the eastern Pacific Ocean. Endang. Spec. Res. 16, 113–133. doi: 10.3354/esr00393
Fortuna, C. M., Cañadas, A., Holcer, D., Brecciaroli, B., Donovan, G. P., Lazar, B., et al. (2018). The coherence of the European union Marine Natura 2000 network for wide-ranging charismatic species: a Mediterranean case study. Front. Mar. Sci. 5:356. doi: 10.3389/fmars.2018.00356
Frid, A., and Dill, L. (2002). Human-caused disturbance stimuli as a form of predation risk. Conserv. Ecol. 6:11.
Gilles, A., Viquerat, S., and Becker, E. A. (2016). Seasonal habitat-based density models for a marine top predator, the harbor porpoise, in a dynamic environment. Ecosphere 7:e01367.
Guisan, A., and Thuiller, W. (2005). Predicting species distribution: offering more than simple habitat models. Ecol. Lett. 8, 993–1009. doi: 10.1111/j.1461-0248.2005.00792.x
Guisan, A., and Zimmermann, N. E. (2000). Predictive habitat distribution models in ecology. Ecol. Model. 135, 147–186. doi: 10.1016/s0304-3800(00)00354-9
Hartel, E. F., Constantine, R., and Torres, L. G. (2014). Changes in habitat use patterns by bottlenose dolphins over a 10-year period render static management boundaries ineffective. Aquat. Conserv. Mar. Freshw. Ecosyst. 25:2465. doi: 10.1002/aqc.2465
Hartman, K. L., Fernandez, J. M. N., and Azevedo, J. M. N. (2014). Spatial segregation of calving and nursing Risso’s dolphins (Grampus griseus) in the Azores, and its conservation implications. Mar. Biol. 161, 1419–1428. doi: 10.1007/s00227-014-2430-x
Hastie, G. D., Wilson, B., Wilson, L. J., Parsons, K. M., and Thompson, P. M. (2004). Functional mechanisms underlying cetacean distribution patterns: hotspots for bottlenose dolphins are linked to foraging. Mar. Biol. 144, 397–403. doi: 10.1007/s00227-003-1195-4
Heithaus, M., and Laurence, M. D. (2002). Food availability and tiger shark predation risk influence bottlenose dolphin habitat use. Ecology 83, 480–491. doi: 10.1890/0012-9658(2002)083[0480:faatsp]2.0.co;2
Herkt, K. M. B., Barnikel, G., Skidmore, A. K., and Fahr, J. (2016). A high-resolution model of bat diversity and endemism for continental Africa. Ecol. Model. 320, 9–28. doi: 10.1016/j.ecolmodel.2015.09.009
Juanes, F., Cox, K., Brennan, L., and Dudas, S. (2017). The effect of anthropogenic and biological noise on fish behavior and physiology: A meta-analysis. J. Acoust. Soc. Am. 141, 3862–3862. doi: 10.1121/1.4988626
Kramer-Schadt, S., Niedballa, J., and Pilgrim, J. D. (2013). The importance of correcting for sampling bias in MaxEnt species distribution models. Divers. Distribut. 19, 1366–1379.
Kumar, S., and Stohlgren, T. J. (2009). Maxent modeling for predicting suitable habitat for threatened and endangered tree Canacomyrica monticola in New Caledonia. J. Ecol. Nat. Environ. 1, 94–98.
La Manna, G., Ronchetti, F., and Sarà, G. (2016). Predicting common bottlenose dolphin habitat preference to dynamically adapt management measures from a Marine Spatial planning perspective. Ocean Coast. Manag. 130, 317–327. doi: 10.1016/j.ocecoaman.2016.07.004
Lambert, C., Laran, S., David, L., Dorémus, G., Pettex, E., VanCanneyt, O., et al. (2017). How does ocean seasonality drive habitat preferences of highly mobile top predators? Part I: the north-western Mediterranean Sea. Deep Sea Res. 141, 133–154. doi: 10.1016/j.dsr2.2016.06.011
Liu, C., White, M., and Newell, G. (2013). Selecting thresholds for the prediction of species occurrence with presence-only data. J. Biogeogr. 40, 778–789. doi: 10.1111/jbi.12058
Lloret, J., Zaragoza, N., Caballero, D., and Riera, V. (2008). Impacts of recreational boating on the marine environment of Cap de Creus (Mediterranean Sea). Ocean Coast. Manag. 51, 749–754. doi: 10.1016/j.ocecoaman.2008.07.001
Lobo, J. M., Jiménez-Valverde, A., and Hortal, J. (2010). The uncertain nature of absences and their importance in species distribution modelling. Ecography 33, 103–114. doi: 10.1111/j.1600-0587.2009.06039.x
Lobo, J. M., Jimenez-Valverde, A., and Real, R. (2008). AUC: a misleading measure of the performance of predictive distribution models. Glob. Ecol. Biogeogr. 17, 145–151. doi: 10.1111/j.1466-8238.2007.00358.x
Mangano, M. C., and Sarà, G. (2017). Collating science-based evidence to inform public opinion on the environmental effects of marine drilling platforms in the Mediterranean Sea. J. Environ. Manag. 188, 195–202. doi: 10.1016/j.jenvman.2016.12.013
Marini, C., Fossa, F., and Paoli, C. (2014). Predicting bottlenose dolphin distribution along Liguria coast (northwestern Mediterranean Sea) through different modelling techniques and indirect predictors. J. Environ. Manag. 150, 9–20. doi: 10.1016/j.jenvman.2014.11.008
McClellan, C. M., Brereton, T., Dell’Amico, F., Johns, D. G., Cucknell, A.-C., Patrick, S. C., et al. (2014). Understanding the distribution of marine megafauna in the english channel region: identifying key habitats for conservation within the busiest seaway on earth. PLoS One 9:e89720. doi: 10.1371/journal.pone.0089720
Merow, C., Smith, M. J., and Silander, J. A. (2013). A practical guide to MaxEnt for modeling species’ distributions: what it does, and why inputs and settings matter. Ecography 36, 1058–1069. doi: 10.1111/j.1600-0587.2013.07872.x
Micheli, F., Halpern, B. S., Walbridge, S., Ciriaco, S., Ferretti, F., Fraschetti, S., et al. (2013). Cumulative human impacts on mediterranean and black sea marine ecosystems: assessing current pressures and opportunities. PLoS One 8:e79889. doi: 10.1371/journal.pone.079889
Moberg, G. P. (2000). “Biological response to stress: implications for animal welfare,” in The Biology of Animal Stress, eds G. P. Moberg, and J. A. Mench (Cambridge: CAB International), 1–21. doi: 10.1079/9780851993591.0001
New, L. F., Harwood, J., Thomas, L., Donovan, C., Clark, J. S., Hastie, G., et al. (2013). Modeling the biological significance of behavioral change in coastal bottlenose dolphins in response to disturbance. Funct. Ecol. 27, 314–322. doi: 10.1111/1365-2435.12052
ONN (2011). Osservatorio Nautico Nazionale, Rapporto sul Turismo Nautico. Genova: Osservatorio Nautico Nazionale.
Oviedo Correa, L., Fernandez, M., Pacheco-Polanco, J. D., and Herra-Miranda, D. (2019). Spatial analysis on the occurrence of inshore and offshore bottlenose dolphins (Tursiops truncatus) in Osa Peninsula waters and Golfo Dulce, Costa Rica. J. Cetacean Res. Manag. 20, 1–11. doi: 10.47536/jcrm.v20i1.233
Pace, D. S., Arcangeli, A., and Mussi, B. (2018). Habitat suitability modeling in different sperm whale social groups. J. Wildlife Manag. 82, 1062–1073. doi: 10.1002/jwmg.21453
Palacios, D. M., Baumgartner, M. F., Laidre, K. L., and Gregr, E. J. (2013). Beyond correlation: integrating environmentally and behaviourally mediated processes in models of marine mammal distributions. Endanger. Species Res. 22, 191–203. doi: 10.3354/esr00558
Palacios, D. M., Bograd, S. J., Foley, D. G., and Schwing, F. B. (2006). Oceanographic characteristics of biological hot spots in the North Pacific: a remote sensing perspective. Deep Sea Re. II Top. Stud. Oceanogr. 53, 250–269. doi: 10.1016/j.dsr2.2006.03.004
Pendleton, D. E., Sullivan, P. J., Brown, M. V., Cole, T. V. N., Good, C. P., Mayo, C. A., et al. (2012). Weekly predictions of North Atlantic right whale Eubalaena glacialis habitat reveal influence of prey abundance and seasonality of habitat preferences. Endang. Species Res. 18, 147–161. doi: 10.3354/esr00433
Phillips, S. J., Anderson, R. P., Miroslav, D., Schapire, R. E., and Blair, M. E. (2017). Opening the black box: an open-source release of Maxent. Ecography 40, 887–893. doi: 10.1111/ecog.03049
Phillips, S. J., Anderson, R. P., and Schapire, R. E. (2006). Maximum entropy modeling of species geographic distributions. Ecol. Model. 190, 231–259. doi: 10.1016/j.ecolmodel.2005.03.026
Phillips, S. J., and Dudík, M. (2008). Modeling of species distributions with Maxent: new extensions and a comprehensive evaluation. Ecography 31, 161–175. doi: 10.1111/j.0906-7590.2008.5203.x
Phillips, S. J., Dudík, M., and Schapire, R. E. (2020). MaxentSoftware for Modeling Species Niches and Distributions (Version 3.4.1). Available online at: http://biodiversityinformatics.amnh.org/open_source/maxent/ (accessed October 28, 2020).
Pirotta, E., Marchant, N., Thompson, P. M., Barton, T. R., and Lusseasu, D. (2015). Quantifying the effect of boat disturbance on bottlenose dolphin foraging activity. Biol. Conserv. 181, 82–89. doi: 10.1016/j.biocon.2014.11.003
Ramirez-Reyes, C., Bateman, B. L., and Radeloff, V. C. (2016). Effects of habitat suitability and minimum patch size thresholds on the assessment of landscape connectivity for jaguars in the Sierra Gorda, Mexico. Biol. Conserv. 204, 296–305. doi: 10.1016/j.biocon.2016.10.020
Rayment, W., Dawson, S., and Webster, T. (2014). Breeding status affects fine-scale habitat selection of southern right whales on their wintering grounds. J. Biogeogr. 42, 463–474. doi: 10.1111/jbi.12443
Redfern, J. V., Ferguson, M. C., and Becker, E. A. (2006). Techniques for cetacean-habitat modeling. Mar. Ecol. Prog. Ser. 310, 271–295. doi: 10.3354/meps310271
Slabbekoorn, H., Dooling, R. J., Popper, A. N., and Fay, R. R. (2018). Effects of Anthropogenic Noise on Animals. Berlin: Springer.
Swets, J. A. (1988). Measuring the accuracy of diagnostic systems. Science 240, 1285–1293. doi: 10.1126/science.3287615
Tallis, H., Lester, S. E., and Ruckelshaus, M. (2012). New metrics for managing and sustaining the ocean’s bounty. Mar. Policy 36, 303–306. doi: 10.1016/j.marpol.2011.03.013
Thorne, L. H., Johnston, D. W., Urban, D. L., Tyne, J., Bejder, L., Baird, R. W., et al. (2012). Predictive modeling of spinner dolphin (Stenella longirostris) resting habitat in the main Hawaiian Islands. PLoS One 7:e43167. doi: 10.1371/journal.pone.0043167
UNESCO-Intergovernmental Oceanographic Commission (2017). MSP Around the Globe. Available online at: http://msp.ioc-unesco.org/world-applications/overview/ (accessed October 28, 2020).
Virzi, T. (2010). The effect of human disturbance on the local distribution of American Oystercatchers breeding on barrier island beaches. Wader Study Group Bull. 117, 19–26.
Weir, J. S., Duprey, N. M. T., and Wursig, B. (2008). Dusky dolphin subgroup distribution: are shallow waters a refuge for nursery groups? Can. J. Zool. 86, 1225–1234. doi: 10.1139/z08-101
Williams, R., Wright, A. J., Ashe, A., Bligth, L. K., Bruinties, R., Canessa, R., et al. (2015). Impacts of anthropogenic noise on marine life: publication patterns, new discoveries, and future directions in research and management. Ocean Coast. Manag. 115, 17–24. doi: 10.1016/j.ocecoaman.2015.05.021
York, P., Evangelista, P., Kumar, S., Graham, G., Flather, C., and Stohlgren, T. (2011). A habitat overlap analysis derived from Maxent for Tamarisk and the South-western Willow Flycatcher. Front. Earth Sci. 5:120–129. doi: 10.1007/s11707-011-0154-155
Keywords: marine protected areas, marine spatial planning, overlap analysis, protection effectiveness, species distribution modeling, Tursiops truncatus
Citation: La Manna G, Ronchetti F, Sarà G, Ruiu A and Ceccherelli G (2020) Common Bottlenose Dolphin Protection and Sustainable Boating: Species Distribution Modeling for Effective Coastal Planning. Front. Mar. Sci. 7:542648. doi: 10.3389/fmars.2020.542648
Received: 13 March 2020; Accepted: 19 October 2020;
Published: 12 November 2020.
Edited by:
Laura Airoldi, University of Padova, ItalyReviewed by:
Cecilia Passadore, Flinders University, AustraliaLindsey Eleanor Peavey Reeves, National Oceanic and Atmospheric Administration (NOAA), United States
Copyright © 2020 La Manna, Ronchetti, Sarà, Ruiu and Ceccherelli. This is an open-access article distributed under the terms of the Creative Commons Attribution License (CC BY). The use, distribution or reproduction in other forums is permitted, provided the original author(s) and the copyright owner(s) are credited and that the original publication in this journal is cited, in accordance with accepted academic practice. No use, distribution or reproduction is permitted which does not comply with these terms.
*Correspondence: Gabriella La Manna, Z2FicmllbGxhLmxhbWFubmFAZ21haWwuY29t