 Muhammad Zubair Ghouri1,2†
 Muhammad Ismail3†Muhammad Asif Javed1,3
 Sultan Habibullah Khan1Nayla Munawar4Abdullah Bin Umar2 Mehr-un-Nisa5†Syed Ovais Aftab2Shazia Amin5†Zulqurnain Khan6
 Aftab Ahmad1,7*
- 1Center for Advanced Studies in Agriculture and Food Security (CAS-AFS), University of Agriculture, Faisalabad, Pakistan
- 2Centre of Agricultural Biochemistry and Biotechnology (CABB), University of Agriculture, Faisalabad, Pakistan
- 3Department of Forestry and Range Management, Faculty of Agriculture, University of Agriculture, Faisalabad, Pakistan
- 4Department of Chemistry, United Arab Emirates University, Al-Ain, United Arab Emirates
- 5Department of Zoology, Wildlife and Fisheries, Faculty of Science, University of Agriculture, Faisalabad, Pakistan
- 6Institute of Plant Breeding and Biotechnology (IPBB), MNS University of Agriculture, Multan, Pakistan
- 7Department of Biochemistry, University of Agriculture, Faisalabad, Pakistan
Fish is a fundamentally healthy food, loaded with essential nutrients, high protein content, vitamin D, and omega-three fatty acid. Mislabeling is a common problem in the fish industry that causes an imbalance in prices and fluctuation in the market. DNA barcoding is a potential technique for authentication of mislabeled and misidentified fish species. In this study, 11 freshwater and 6 marine fish species were used for DNA barcoding and further authentication using the mitochondrial cytochrome b (Cyt b) gene. Cyt b was amplified using PCR, producing an average read length of 1,141 bp. The obtained sequences were compared to the National Center for Biotechnology Information database (NCBI) using the Basic Local Alignment Search Tool (BLAST). The average AT content (55.20%) was higher than the average GC content (44.78%) in marine and freshwater fish species. The mean genetic Kimura 2-parameter distances for species, genus, families, and orders were 0.311, 0.308, 0.023, and 0.337, respectively. Phylogenetic tree analysis revealed that most of the freshwater fish species clustered together due to the fact that they were in the same order or family, while the marine fish species clustered distantly. Single nucleotide polymorphism (SNP) analysis of all species in the study revealed distinct features regarding unique sites. All fish species could be identified based on their unique SNP profiles. Based on SNP data, DNA sequence based QR codes were developed for accurate identification of fish species. This is the first study to develop DNA-based QR barcodes for proper authentication of species during the chain of custody using simple technology.
Introduction
Fish are the most abundant vertebrate group on the earth, consisting of 50% of the vertebrate species. Fish consumption is often a staple of the human diet with high digestibility and good taste. Fisheries also play an essential role in generating income for many communities (Rafique, 2007; Rafique and Khan, 2012). So far, 33,000 fish species have been identified throughout the world (Di Pinto et al., 2015). In Pakistan, 531 species of fish have been identified, among which 233 are freshwater and the remaining 298 are marine fish species. According to studies conducted by Rafique (2007) and Rafique and Khan (2012), 78 of the 233 freshwater fish in Pakistan are economically important species.
Recent studies conducted by Armani et al. (2015) and Pollack et al. (2018) identified multifarious challenges in the fish market with issues of mislabeling, fraud, and substitutions that prevent the expansion of the market. Some mislabeling issues are a result of the close resemblance between different fish in terms of appearance, topology, texture, taste, and other morphometric characters. However, in some cases, low-quality fish is advertently mixed with or mislabeled as higher quality fish to fetch a better price for otherwise commercially unimportant fish species (Cawthorn et al., 2012). These fraudulent practices negatively impact the fish market, demanding suitable control measures to protect the local food industry. Initiatives are required to raise public awareness and develop effective means for authentication programs that can detect and prevent fish mislabeling (Ali et al., 2018).
The authentic and reliable identification of fish is essential to prevent mislabeling in the fish markets. One of the leading techniques for authentication of fish is to identify species based on morphological and morphometric features (Bottero and Dalmasso, 2011). Fish have extremely diverse morphological characteristics as they transition through ontogenetic metamorphism, and thus, morphometric characteristics change during the process of ontogenetic development (Zhang and Hanner, 2011). Similarly, convergent and divergent adaptations impose further challenges in the identification process (Keskin and Atar, 2013). The use of molecular approaches for identifying fish species has been suggested to mitigate the limitations associated with morphological based identification systems and the lack of local fish identification expertise (Zhang and Hanner, 2011; Keskin and Atar, 2013; Di Pinto et al., 2015). With advancements in the modern taxonomic system, features such as internal anatomy, physiology, genes, isozymes, behavior, and geography have been introduced for appropriate identification (Costa and Carvalho, 2007). DNA barcoding, a technique that applies genetically variable DNA sequences with low intraspecific but high interspecific variability to discriminate between species, has been used as a practical approach in food traceability (Galimberti et al., 2013). DNA can be isolated from processed meat for DNA barcoding and thus, can be performed at any stage within the chain of custody (Khaksar et al., 2015).
Various DNA biomarkers have been used for fish identification. The DNA barcoding approach has high reproducibility and can be tested or verified at any point in a chain of custody, as long as the bridge between DNA sequences and voucher specimens are validated (Nicolè et al., 2011). Additionally, genomic DNA extraction and amplification of genetic markers are technically simple and usually non-destructive; thus, this approach does not require the destruction of valuable samples (Nicolè et al., 2013). DNA barcoding has been extensively applied in sectors including fish authentication, labeling, and biodiversity, conservation, ecological, and forensic studies (Sullivan et al., 2013; Di Pinto et al., 2015; Verzeletti et al., 2015; Pollack et al., 2018).
It can be difficult to recover a sufficient quantity and quality of nuclear DNA molecules from raw or processed meat; thus, the use of nuclear DNA is limited compared to organelle DNA (Asif and Cannon, 2005). Almost 500 plus species have been targeted, and most of them belong to gadoids, scombroids, and salmonids. One of the most familiar and most targeted DNA markers is mitochondrial cytochrome b, which has its common applications in forensic, taxonomic, and ecological fields (Beamish and Rothschild, 2009; Teletchea, 2009; Kochzius et al., 2010). Use of Cyt b gene is a wise choice for identification of fish species, chickens, praomyin rodents, and many researchers reported its wide acceptance in systematics and molecular ecology (Kartavtsev, 2011; Nicolas et al., 2012; Yacoub et al., 2015; Fernandes et al., 2017). Other studies included use of Cyt b regions for phylogenetics and population analyses in fish species (Beamish and Rothschild, 2009; Li et al., 2018). However, other genes such as cytochrome c oxidase subunit I (COI) have also proven useful (Hebert et al.,, 2003; Prieto et al., 2003). Compared to nuclear genes, mitochondrial DNA (mtDNA) is more suitable for DNA barcoding due to high copy numbers, lack of introns, low recombination, and maternal inheritance (Nicolè et al., 2013). Hebert et al., (2003) used the mitochondrial cytochrome c oxidase subunit I (COI) gene sequence for DNA barcoding. The intraspecific diversity of the COI gene in animals had lower resolving power than interspecific diversity as a DNA barcode. The COI gene is used extensively for DNA barcoding in other biological groups, but less so for fish (Doña et al., 2015).
The Cyt b gene has been used extensively in fish barcoding studies (Fernandes et al., 2017) and is considered the best mitochondrial gene for phylogenetic analysis concerning protein function and structure (Degli Esposti et al., 1993). The slowly evolving codon positions and variable domains of Cyt b are ideal for examining the systematic diversity of phylogeny (Kumazawa and Nishida, 2000). The aim of this study is to determine the efficacy of the Cyt b gene for the identification of Pakistan’s freshwater and marine fish species. Moreover, the DNA sequence data generated from this study was used to develop a “Quick Response Code” (QRC).
Materials and Methods
Fish Sample Collection
The research was conducted at the Center for Advanced Studies in Agriculture and Food Security (CAS-AFS), University of Agriculture, Faisalabad, Pakistan. The fish for this experiment were collected from two cities in Pakistan: Faisalabad, Punjab (31.42° N, 73.08° E); and Karachi, Sindh, (24.91° N, 67.08° E) (Figure 1). Overall, eleven freshwater fish species belonging to six families and five orders, and six marine fish species belonging to five families and one order were collected (Table 1). The raw fish samples obtained were thoroughly washed, immediately transported to the laboratory in polythene bags and stored at –80°C until DNA extraction. These total 17 individuals (11 freshwater + 6 marine fish species) were further used for DNA extraction, PCR amplification, sequencing and DNA barcoding.
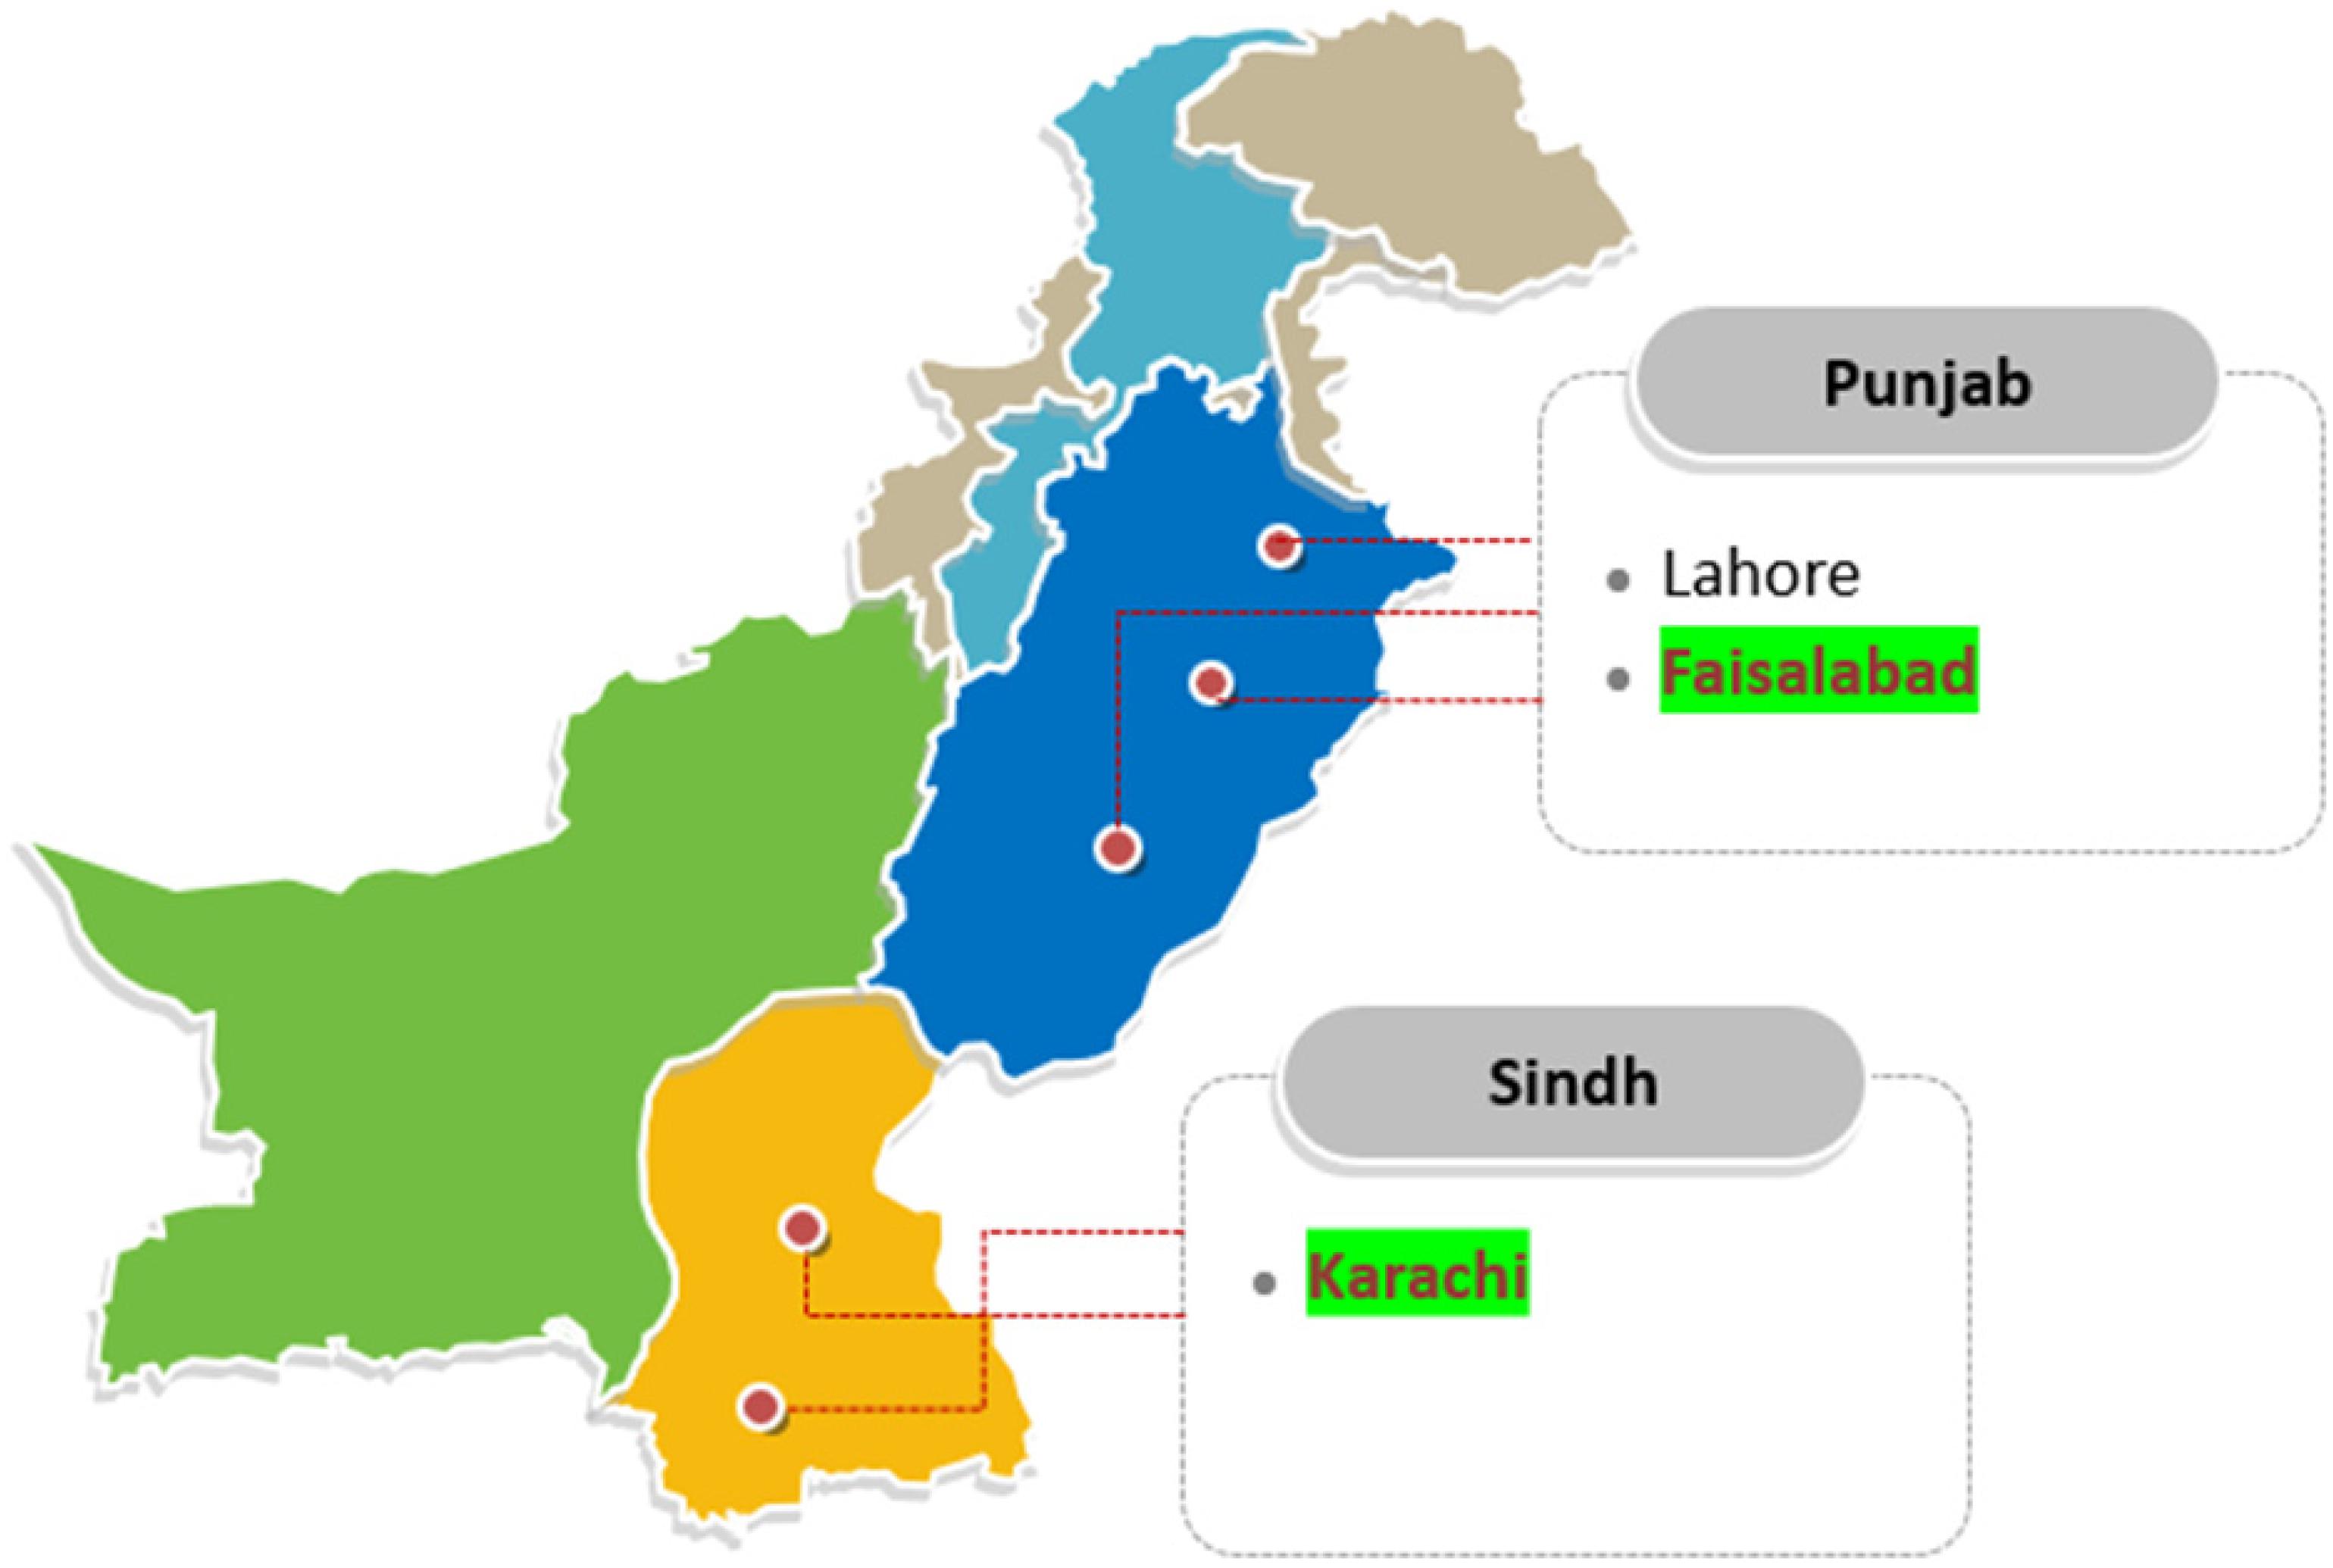
Figure 1. Location of freshwater and marine fish collection from different areas of Pakistan. Four locations were selected from the Faisalabad for freshwater species collection: Novelty pull fish markets, Metro mall, Kataria fish hatchery, and Satin fish farms, in Punjab, Pakistan. Marine fish species were collected from the Arabian Sea of Karachi, Sindh, Pakistan.
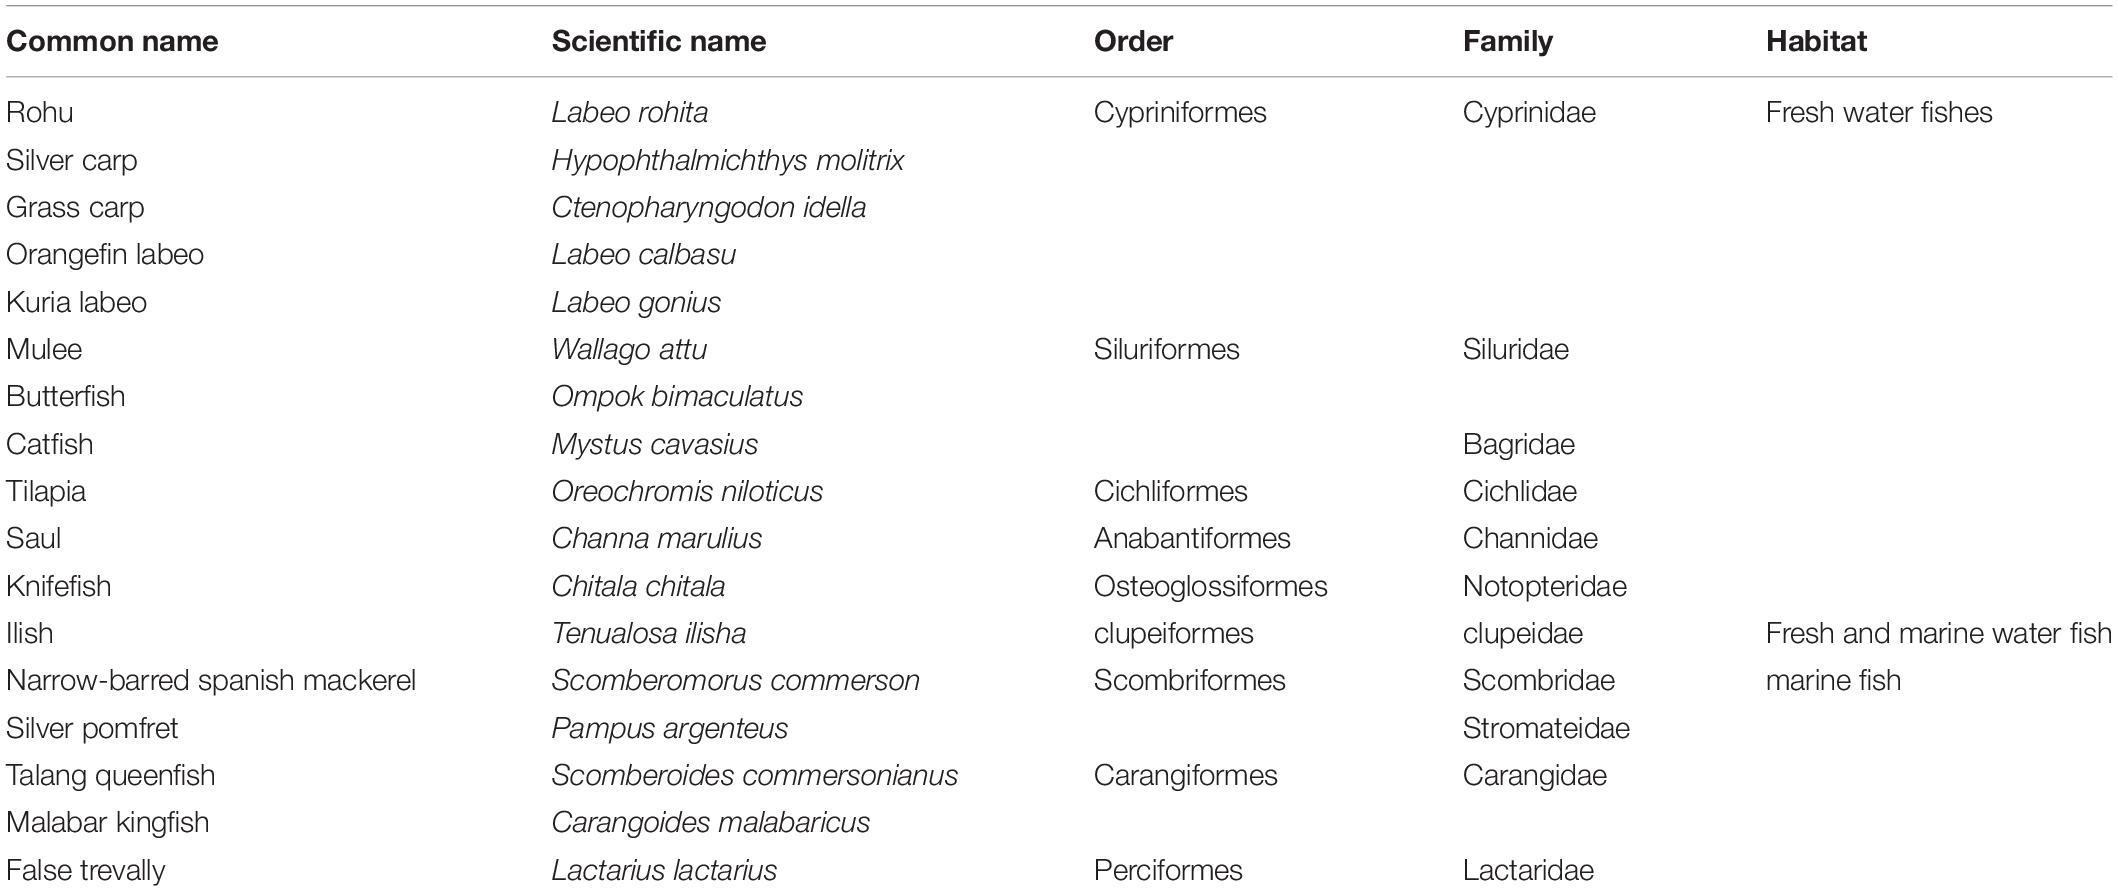
Table 1. Identification of freshwater and marine fish species sampled from a local market based on Cyt b gene sequence homology.
DNA Extraction, Visualization, and Quantification
DNA was extracted from a 30 mg muscle tissue sample using the GeneJet Genomic DNA Purification Kit (Thermo Fisher Scientific Cat. # K0721). Genomic DNA was visualized on 1% agarose gel and stored at –20°C for the downstream applications. Quantification and purity of the extracted DNA were determined using NanoDrop® -ND-8000 (Thermo-Scientific, Waltham, MA).
Amplification of Conserved Regions of Cyt b Gene and Sequencing
High-quality DNA was used for PCR amplification, as reported by Sevilla et al. (2007). Amplification was performed using a C1000 Touch Thermo Cycler (Bio-Rad). For this purpose, a 20 μl reaction mixture was combined in PCR tubes with 50 ng DNA template, 0.5 μl Taq DNA polymerase (5 U/μl, Thermo Scientific, America), 2 μl Taq Buffer (10X, Thermo Scientific, America), 2 μl MgCl2 (25 mM), 2 μl dNTP’s (10 mM, Thermo Scientific, America), 8 μl Milli-Q H2O and 1 μl of each primer (10 mM), (forward, 5′-AACCACCGTTGTTATTCAACTACAA-3′ and reverse 5′-CCGACTTCCGGATTACAAGACCG-3′). The PCR amplification of Cyt b consisted of the initial denaturation at 95°C for 30 s, followed by 40 cycles of denaturation at 94°C for 30 s, annealing at 50°C for 35 s, extension at 72°C for 120 s, a final extension at 72°C for 4 min, and then an infinite hold at 4°C. The amplified PCR products were visualized and sized on 1% agarose gel. Then, before Sanger sequencing, the amplified PCR products were purified using FavorPrep PCR Clean-Up Mini Kit (Cat. # FAPCK001-1). Sanger sequencing was performed uni-directionally for discrimination of freshwater and marine fish species.
SNP Detection and DNA Barcoding
A sequence file including only the experimental sequences (11 freshwater, 6 marine) was aligned through MEGAX using the MUSCLE alignment tool. Additionally, all sequences were edited manually, i.e., similar, highly mismatched sites and gaps were removed, and by using SeqMan software (DNAStar software); each base of the spliced sequence was checked before submission to GenBank (Bingpeng et al., 2018). Based on above alignment data and manual, single nucleotide polymorphism (SNPs) was detected for estimation of unique sites same as described by Fatima et al. (2019).
QR code is easily accessible two-dimensional barcode, readable by smartphones. It allows to encode over 4000 characters in a two-dimensional barcode. SNP data were used for the development of DNA barcodes for each species using an online QR code generator1. Each SNP fish sequence was pasted in online site described previously and QR codes were generated, respectively.
Data Analyses and BLAST Annotation
The Basic Local Alignment Search Tool (BLAST) database is a highly efficient tool for determining sequence similarities with reference sequences from GenBank. The edited sequences were confirmed by our expert taxonomist from Department of Zoology, Wildlife and Fisheries, University of Agriculture, Faisalabad, Pakistan; uploaded to BLASTn (BLAST nucleotide) on the National Center for Biotechnology Information (NCBI) database for validation and identification of the fish species. The input sequences were compared with the maximum similarity data sets of fish species based on the lowest significant E-values for the pairwise generated alignment. Hence, species were validated by our expert taxonomist based on high BLAST identity percentage with the lowest E-value.
The 17 validated reference sequences for all fish species were downloaded from GenBank for utilization in the construction of a phylogenetic evolutionary tree (neighbor-joining tree). Additionally, genetic distances between fish species were calculated from the neighbor-joining tree using MEGAX. The genetic Kimura 2-Parameter (K2P) distances of the Cyt b nucleotide bases between the fish species were also analyzed with MEGAX using the pairwise genetic distance method.
Results
Sequencing and Composition
The Cyt b primers produced a single amplification product with a read length of 1,141 bp (Figure 2). The sequence files were computed in two ways. The file with gaps removed after alignment was used for analyzing the evolutionary relationship among experimental species with reference to sequences downloaded from the NCBI database. The information generated through this sequence was used to trace the phylogeny of freshwater and marine fish species. The sequence file computed with only the experimental sequences was used to generate scannable QR codes.
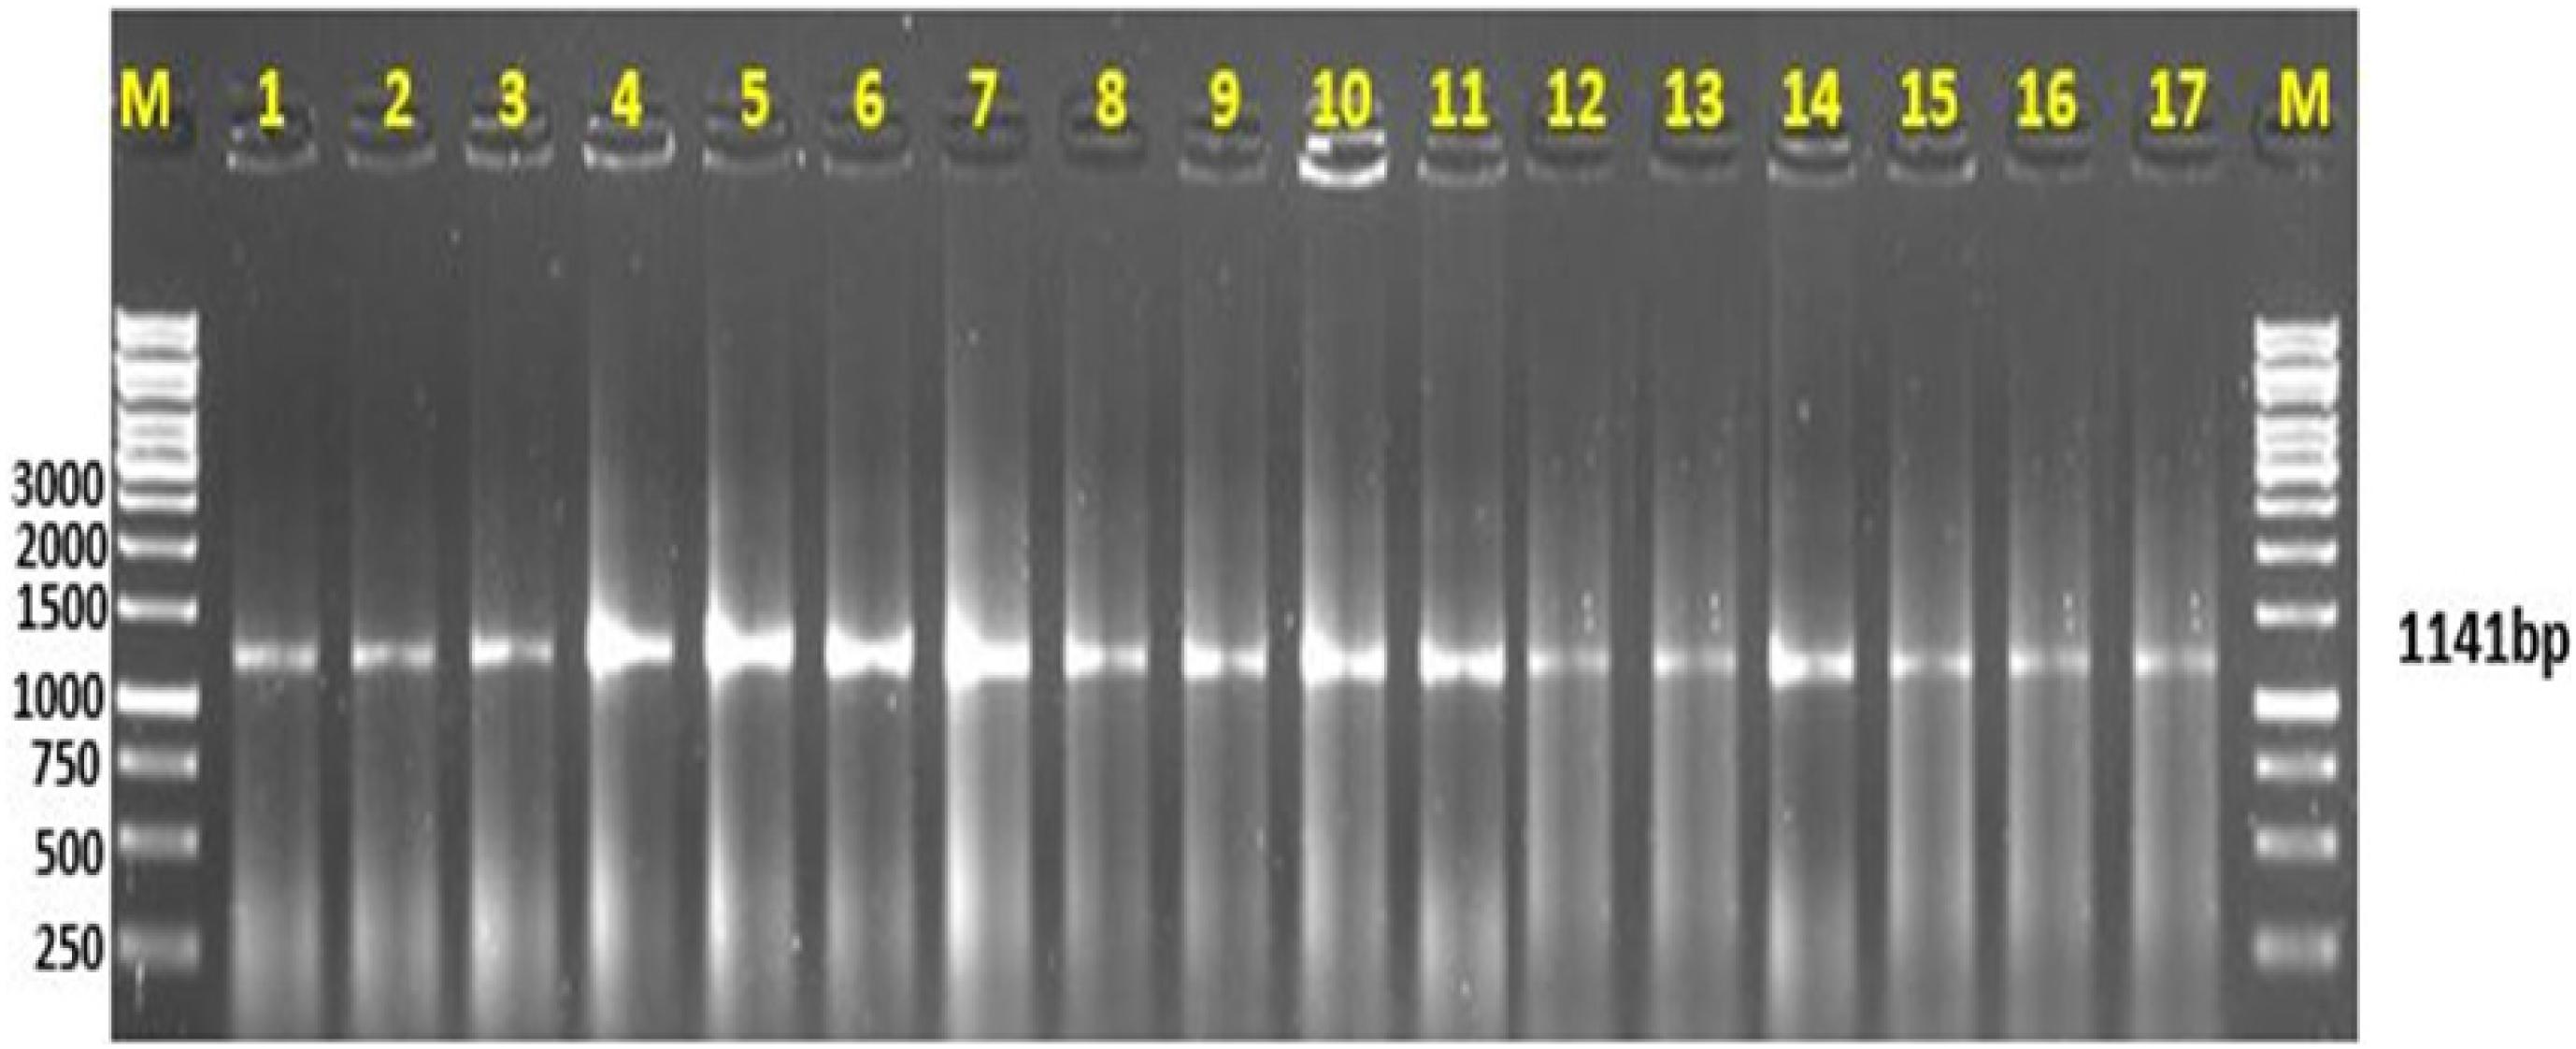
Figure 2. Amplification of mitochondrial Cyt b gene. (M) represents the DNA ladder; lanes 1–11 are the freshwater fish species, lanes 12–17 are the marine fish species representing a gene amplification of 1,141 bp.
The freshwater and marine fish species nucleotide discrimination revealed varied AT (adenine + thiamine) and GC (guanine + cytosine) contents. Among the 11 freshwater fish species, the observed nucleotide base composition of all analyzed sequences was 56.0% AT (range: 309–659) and 43.96% GC (range: 207–546) (Table 2). Similarly, in marine fish species, the nucleotide composition was 53.73% AT (range: 301–478) and 46.26% GC (range: 222–447), respectively (Figure 3). The results demonstrated that for these freshwater and marine fish species, the total nucleotide composition consisted of more AT than GC bases (Table 2).
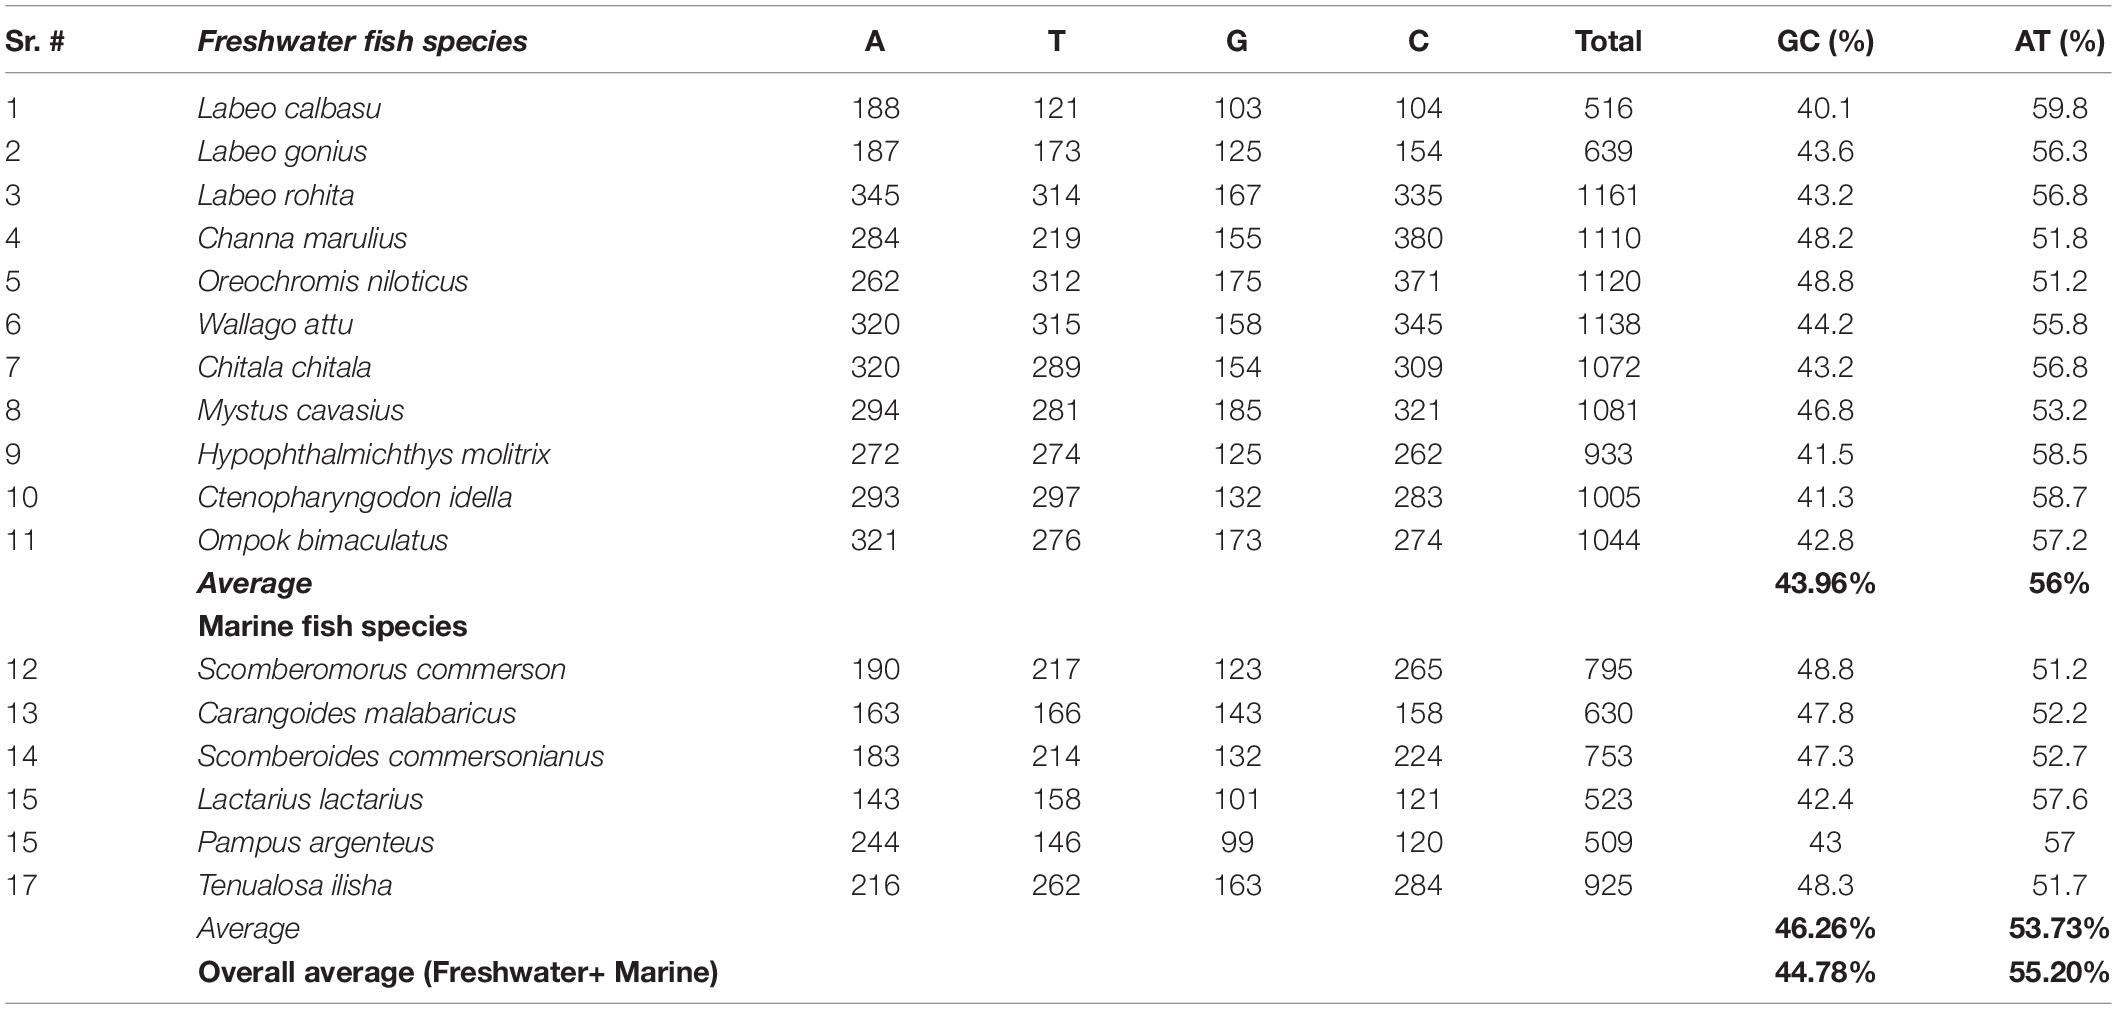
Table 2. Comparison of the average GC and AT nucleotide composition between freshwater and marine fish species.
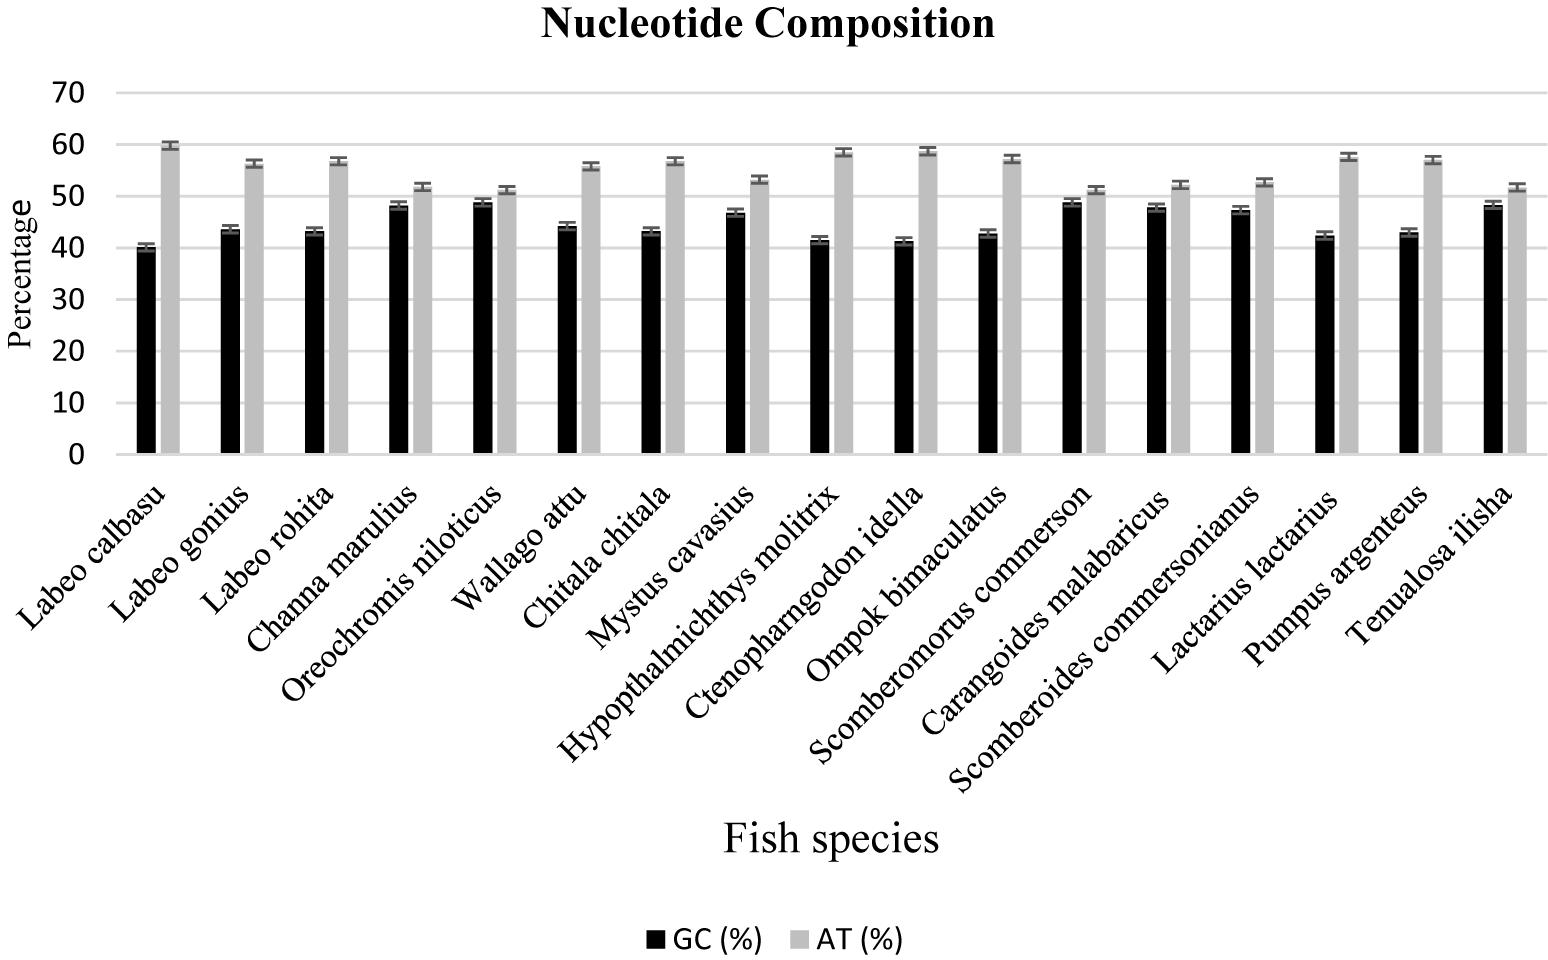
Figure 3. Comparison of the nucleotide compositions between freshwater and marine fish species.
The interspecies genetic distances were calculated with the K2P model using pairwise comparison to trace the evolutionary relationship between species. The K2P genetic distances between species are summarized in Table 3. The minimum genetic distance between species was 0.102 and the maximum distance was 0.789. The K2P distance range was 0.131–0.726 in families and 0.186–0.385 in orders. Overall, the mean (± standard error) genetic distance between families, orders, and species were 0.369 ± 0.023, 0.337 ± 0.016, and 0.311 ± 0.014, respectively (Table 3).
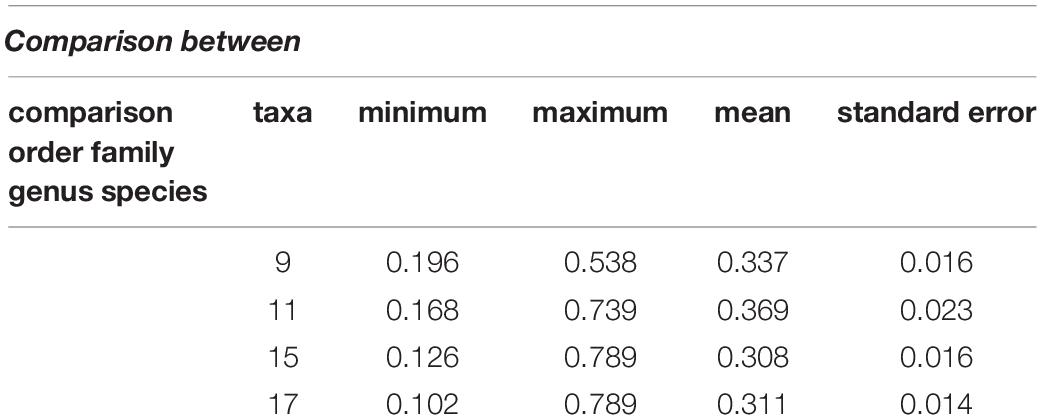
Table 3. Summary of genetic divergence (Kimura 2-parameter %) between taxonomic levels.
Evolutionary Relationship of Experimental Species
BLAST was used to perform a similarity-based search of the GenBank databases. Sequence-specific BLAST was performed for all fish (freshwater and marine) separately, and the species with maximum identity percent (ID) score and query cover were selected for further analysis. Additionally, sequences with maximum similarity (reference sequences with Accession numbers) from the BLAST search were downloaded from the NCBI database for comparison to the experimental species. BLAST search in reference to experimental sequences was performed in supervision of our expert taxonomist for clarification of any doubts in GenBank sequences. The reference sequences for the identification of fish species were Labeo calbasu (MF476904.1), Labeo gonius (MK573982.1), Labeo rohita (KF574612.1), Channa marulius (LT577206.1), Oreochromis niloticus (MH041459.1), Wallago attu (AF477828.1), Chitala ornate (AF201583.1), Sperata seenghala (KT306626.1), Hypophthalmichthys molitrix (MH938823.1), Ctenopharyngodon idella (KY949579.1), and Ompok bimaculatus (KJ646875.1) for the freshwater fish, and Scomberomorus commerson (DQ497866.1), Carangoides ferdau (KX512727.I), Scomberoides commersonianus (AY050755.1), Lactarius lactarius (NC045221.1), Epinephelus bleekeri (AY738238.1), and Lethrinus lentjan (AF381269.1) for the marine fish (Table 4). After arranging all the experimental sequences, a complete file was uploaded to MEGAX for further analysis, alignment, and phylogenic tree construction. An evolutionary neighbor-joining tree was used to validate all species (Figure 4). The sum of the tree branch lengths was 2.43; 500 bootstrap replicates with the same units that were used to measure the evolutionary distances were used in the phylogeny test. Kimura 2-parameter method was used to compute evolutionary distances. For the phylogenetic tree construction, all gaps were removed in order to determine the ancestral relationships among the species. A total of 17 nucleotide sequences were involved in the phylogenetic analysis. Moreover, 287 positions were present in the final dataset (Figure 4). The evolutionary relationships among species revealed that most of the fish species were clustered together, except for the marine species. The results reflected no taxonomic deviation, indicating that the majority of species can be authenticated using a barcode approach.
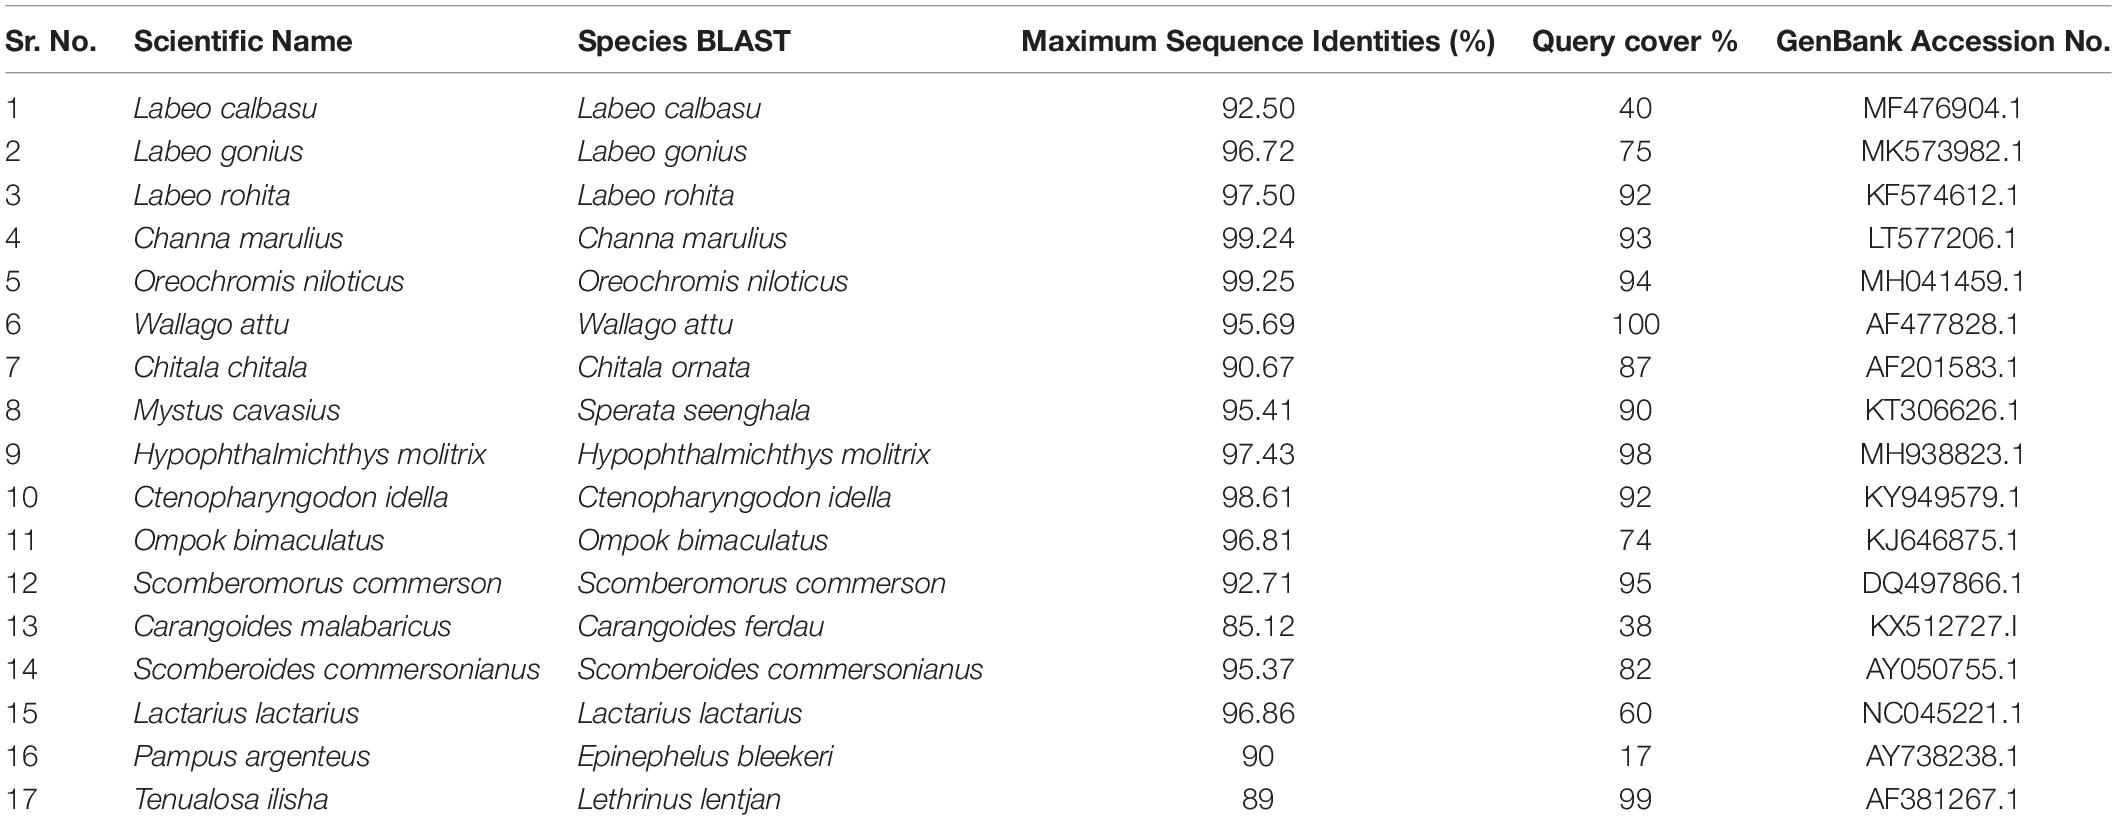
Table 4. Similarity results and reference sequence (Accession no.) for freshwater and marine fish species identified by BLAST/GenBank.
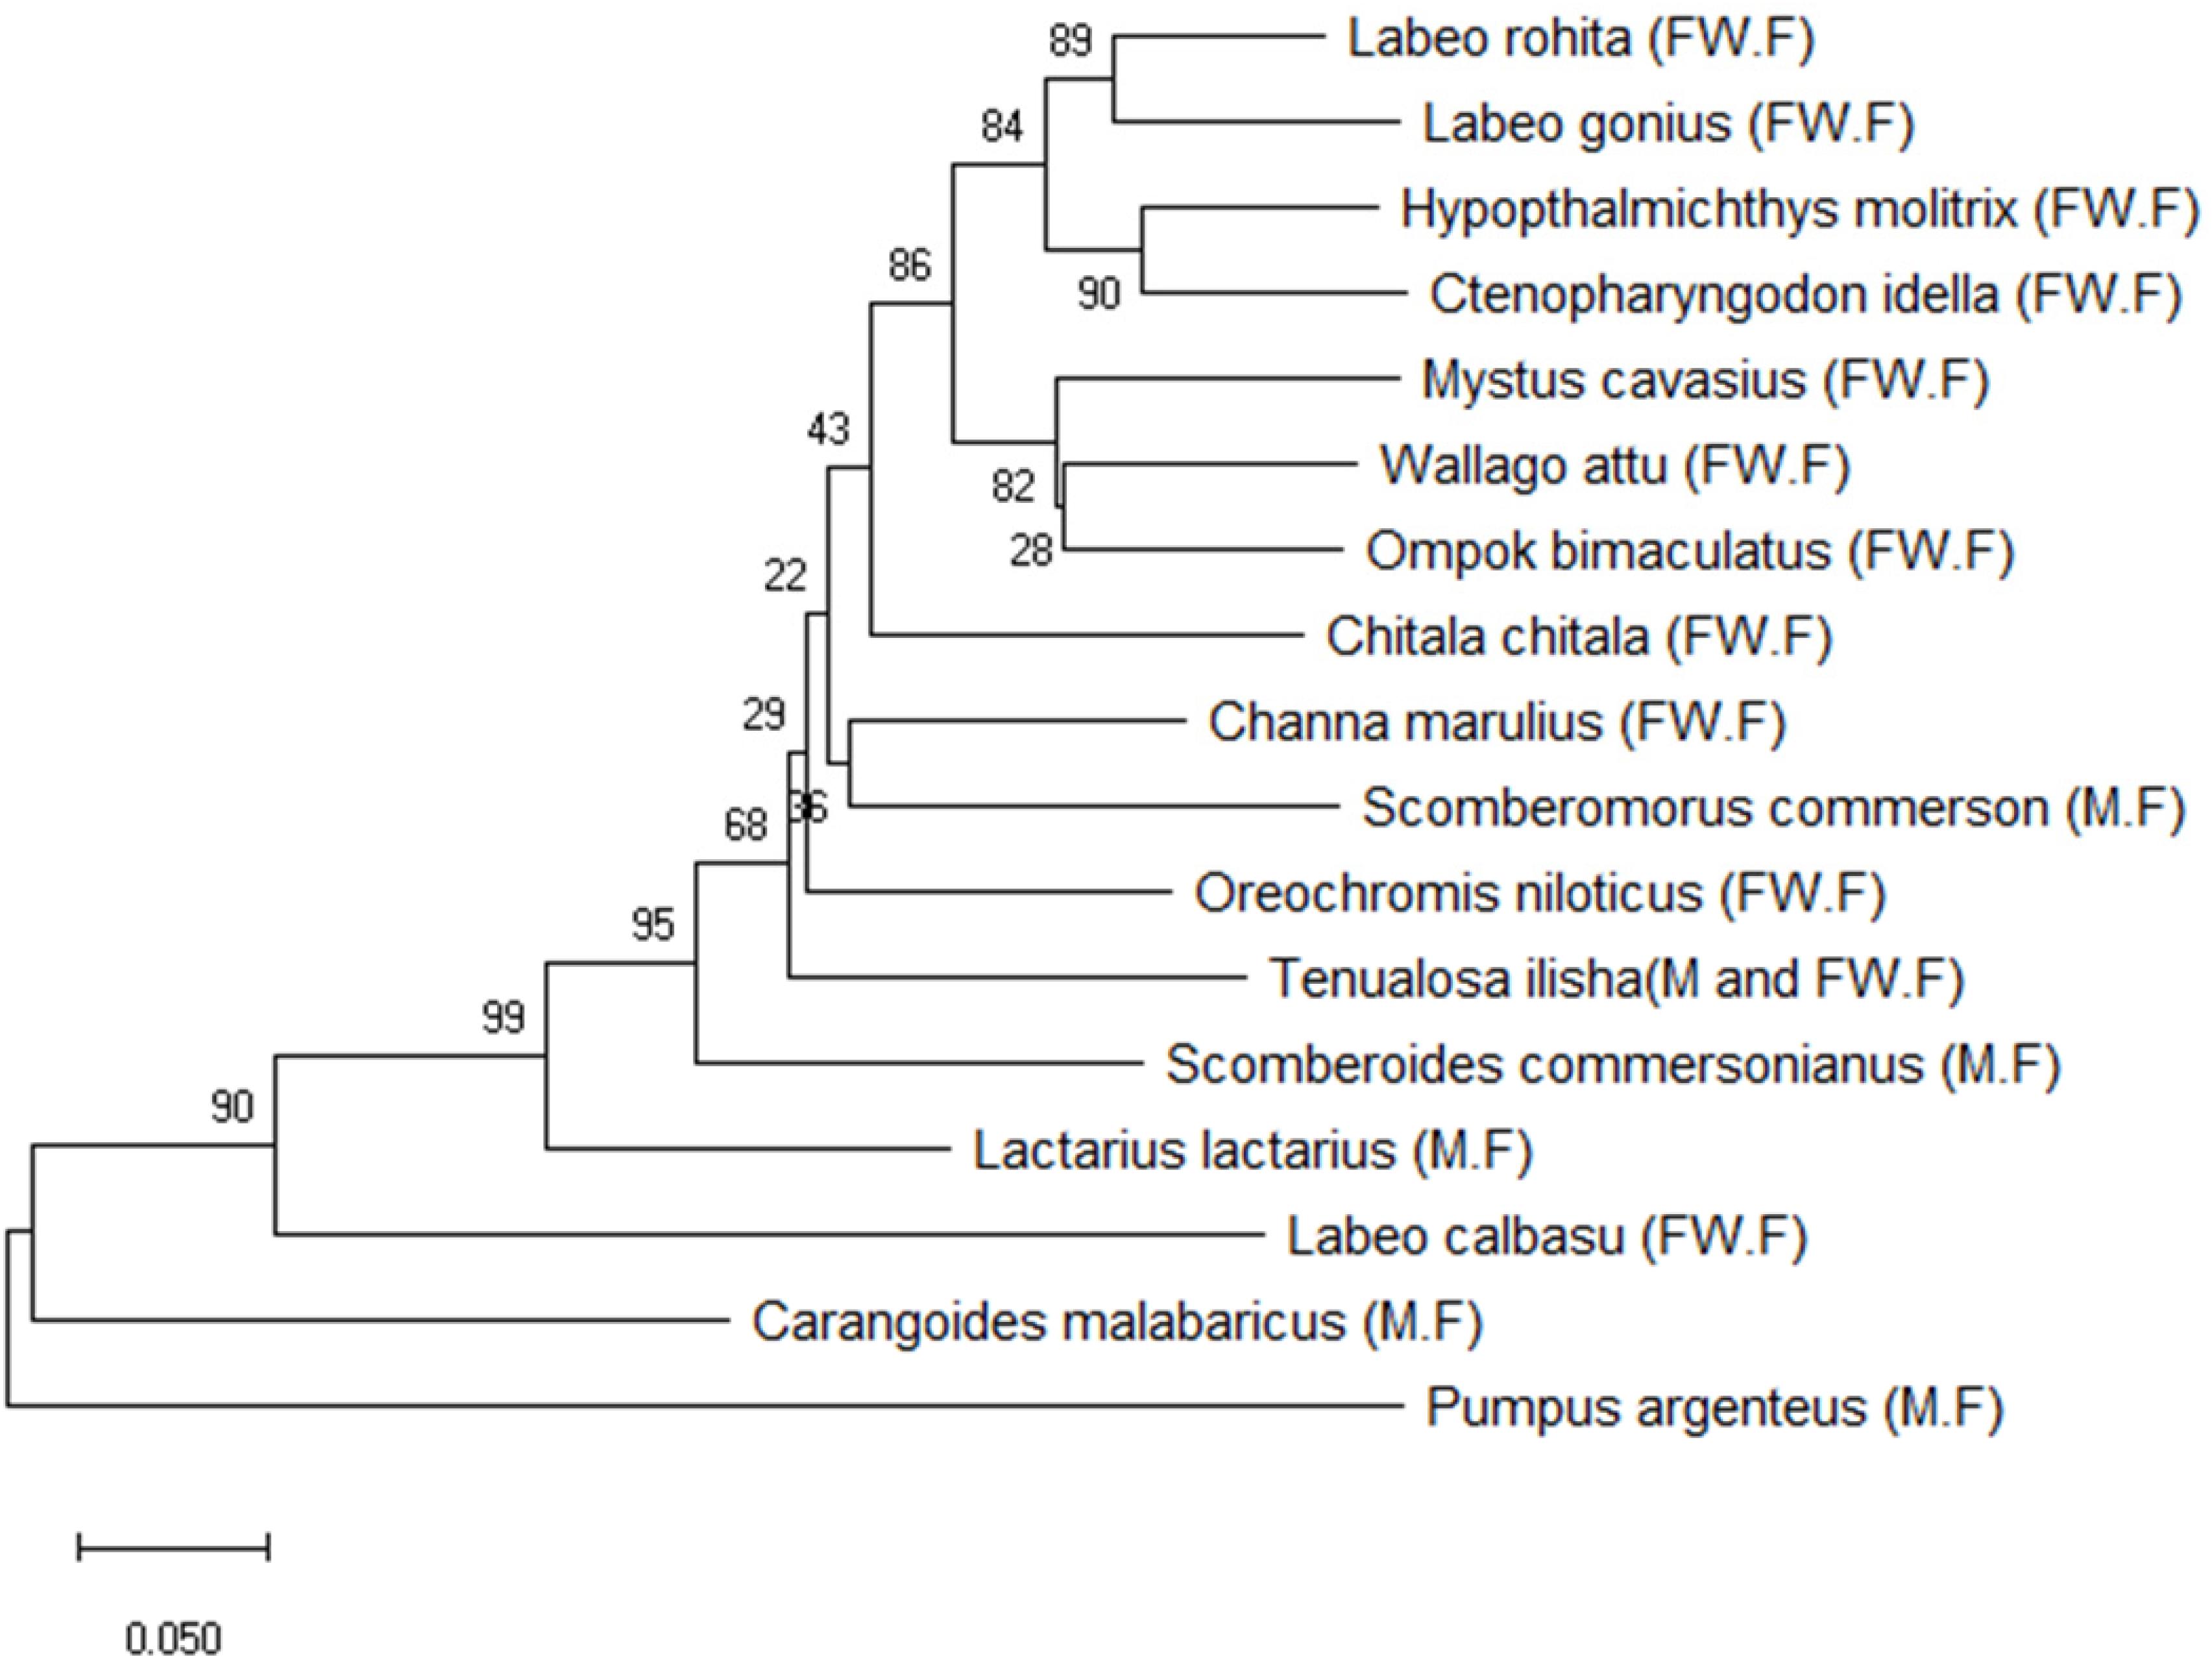
Figure 4. Phylogenetic analysis of freshwater and marine fish species based on the Cyt b gene. (FW.F = freshwater fish, M.F = marine fish).
Single Nucleotide Polymorphism Screening and Generation of Scannable QR Codes
Moreover, the sequences selected for SNP detection revealed single base pair differentiation in all freshwater and marine fish species (Table 1). In the case of freshwater fish species, a total of 52 unique sites were found in Labeo calbasu with Cyt b, more than all other species (Table 5). In Labeo rohita, Ctenopharyngodon idella, and Hypophthalmichthys molitrix, only one unique site was found, while Channa marulius contained two unique sites, Chitala chitala contained three sites, Labeo gonius contained four sites, Ompok bimaculatus and Oreochromis niloticus contained five sites each, and Mystus cavasius contained seven unique sites based on SNPs. Interestingly, no unique sites were identified in the Wallago attu sequence using SNP detection, which means it cannot be validated using the SNP method. For the marine fish species, 56 unique sites were found in Pampus argenteus, Tenualosa ilisha and Scomberoides commersonianus contained five unique sites each, Carangoides malabaricus had eighteen sites, Lactarius lactarius had ten sites, and Scomberomorus commerson contained thirteen unique sites (Table 6). Finally, all freshwater and marine fish SNP sequences were used to generate scannable QR codes. DNA sequence based QR codes for freshwater and marine fish species are given in Figures 5, 6, which can be scanned with simple mobile device applications.
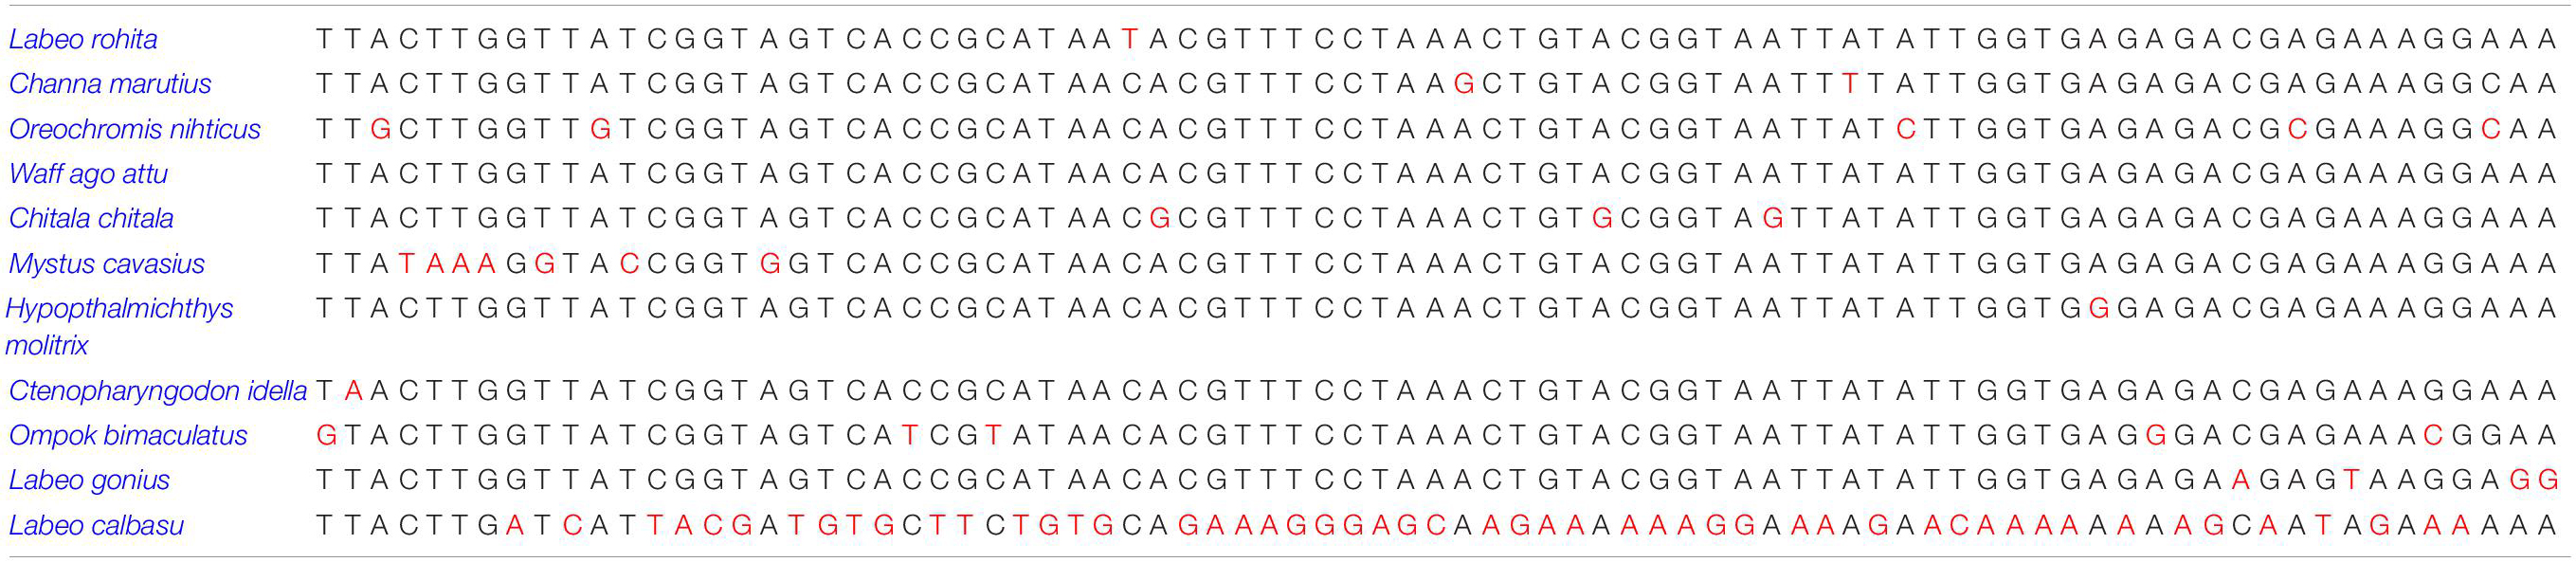
Table 5. Identification of freshwater fish species based on single nucleotide polymorphism data analysis.
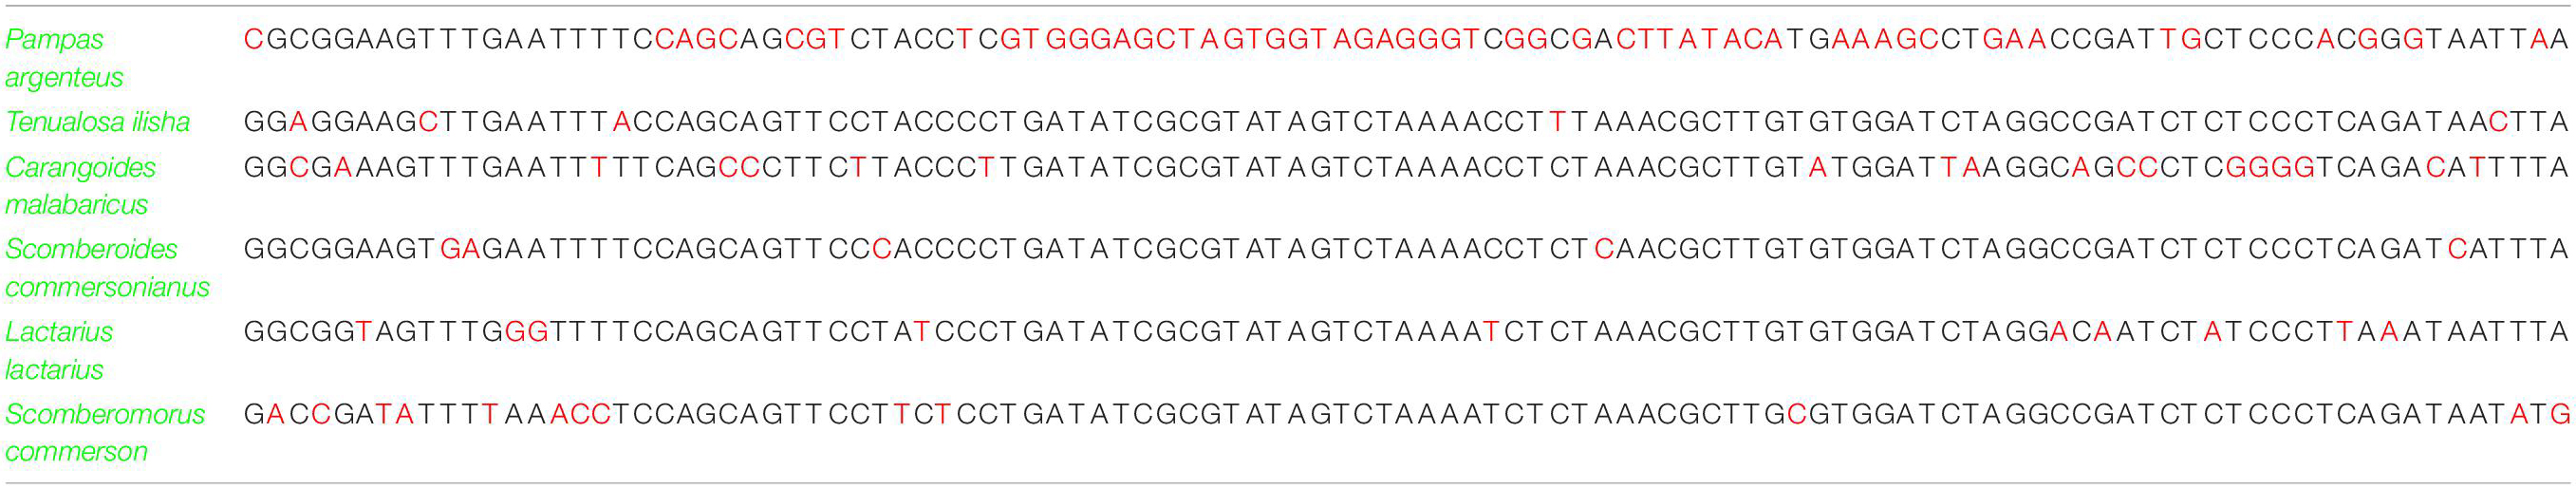
Table 6. Identification of marine fish species based on single nucleotide polymorphism data analysis.
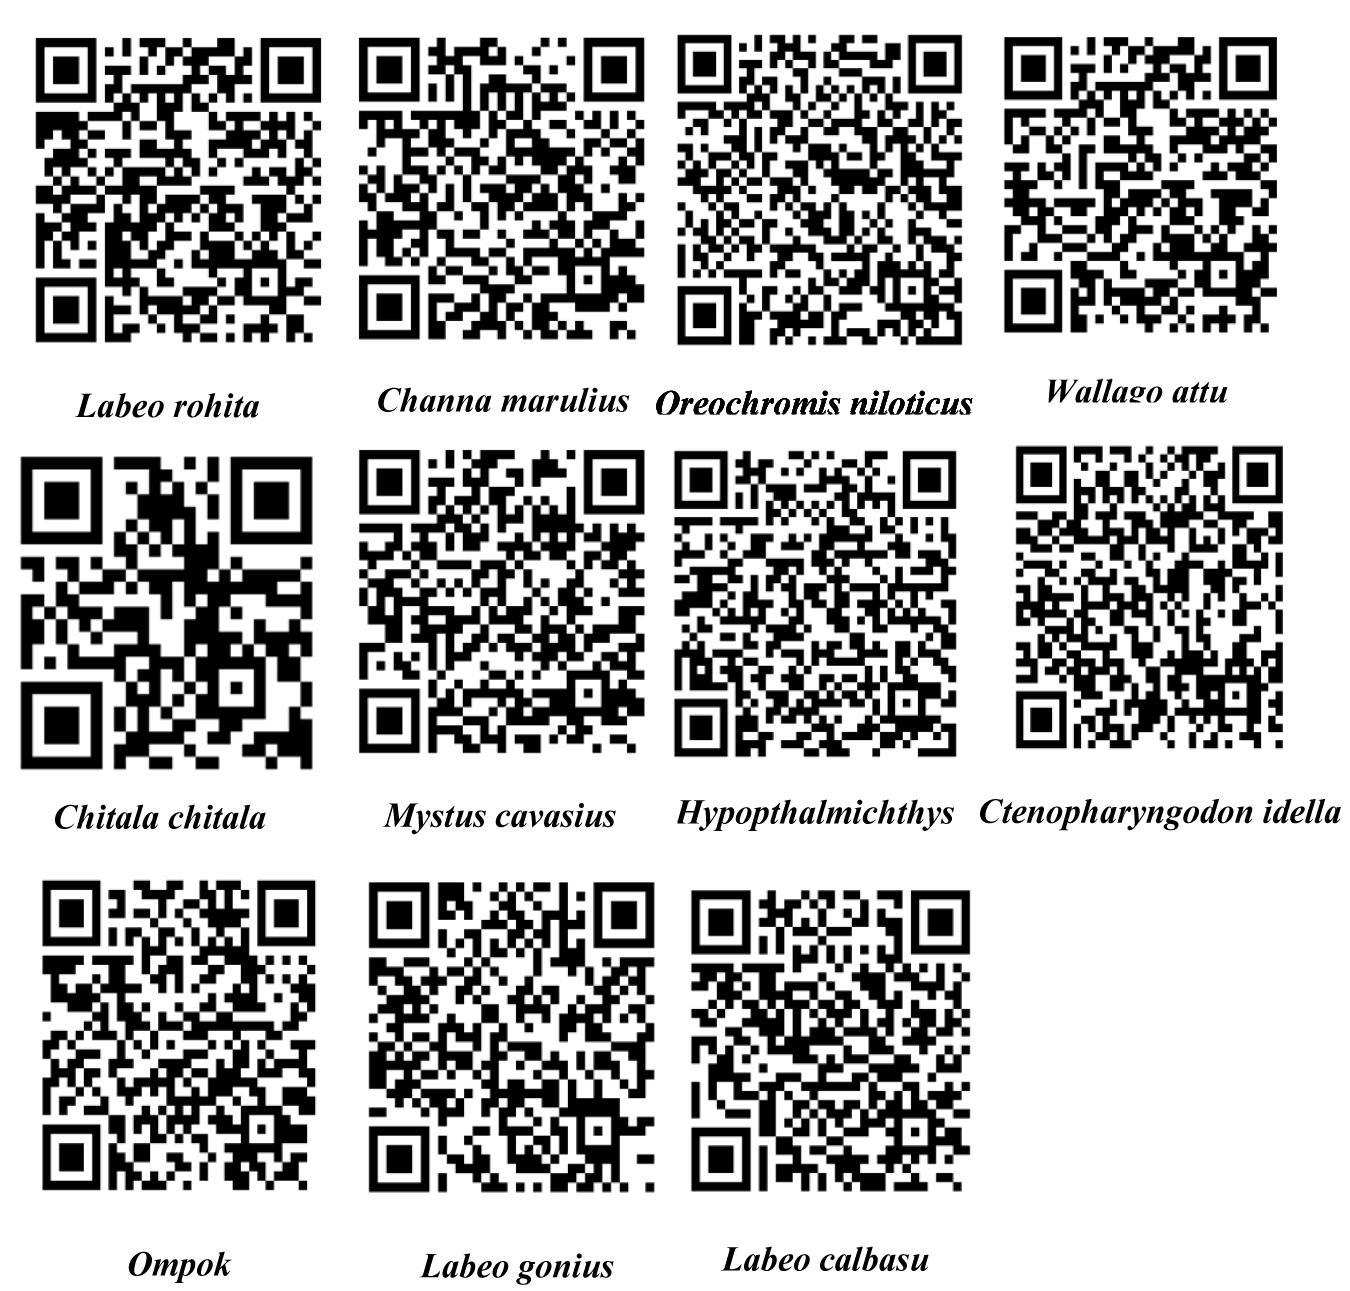
Figure 5. QR codes generated using unique single nucleotide polymorphism data for freshwater fish species.
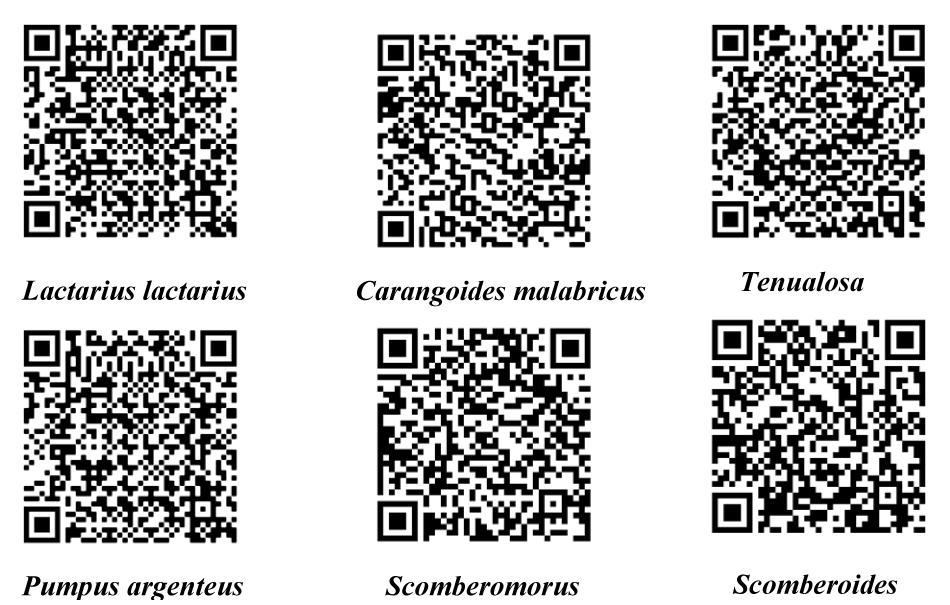
Figure 6. QR codes generated using unique single nucleotide polymorphism data for marine fish species.
Discussion
DNA Barcoding
Mitochondrial DNA fragments can be used for the authentic identification and discrimination of unknown or closely related species (Dawnay et al., 2007). Moreover, variations between populations can be detected through changes in mitochondrial DNA sequences such as cytochrome oxidase subunit 1 (COI) and Cyt b (Avise et al., 1987). Parson et al. (2000) reported use of Cyt b for efficient identification of species from 5 major vertebrate groups including fish. They used to trace similarities between species of choice through BLAST similarity. Our study is different than Parson et al. (2000) in freshwater and marine fish species recognition as we have used BLAST, phylogeny testing, SNPs detection and DNA barcoding for authentication of fish species.
In another study, Vergara-Chen et al. (2009) reported PCR-RFLP based identification of Cynoscion species in Bay of Panama. They used to amplify mitochondrial Cyt b gene for efficient identification of Cynoscion species. Cyt b marker shown promise in accurate identification of larval species of Cynoscion. This PCR-RFLP is an attractive approach in identification of species based on enzymes. Our study is different from Vergara-Chen et al. (2009), in species discrimination. We used modern sequencing, alignment and SNP detection methods for accurate identification of fish species. In addition, RFLP method does not work always for authentication of species. Therefore, our results are far better and authentic compared to Vergara-Chen et al. (2009).
Barcode analysis using the cytochrome-b locus could delineate fish for the identification of mysterious specimens in order to recognize unpredicted diversity between them (Meyer and Paulay, 2005; Kerr et al., 2009). The Cyt b gene sequence has no insertions, deletions, or stop codons, indicating that all amplified sequences are obtained from the functional mitochondrial gene sequences. Amplification of the Cyt b DNA fragment using PCR to achieve an average read length of 1,141 bp in 11 freshwater and 6 marine fish species is a significant indicator that DNA barcoding could be applied as a global standard for identifying fish species.
Nucleotide Discrimination Among Freshwater and Marine Fish Species
Our analysis revealed that the average nucleotide base composition was 56% AT and 43.96% GC in freshwater fish species. Similarly, the average AT content in marine fish species was 53.73% and the GC content was 46.26%. Overall, in freshwater and marine fish species, the average AT content (55.20%) was higher than average the GC content (44.78%). This result is consistent with previous studies that reported higher AT (59.60%) content than GC content with Cyt b gene amplification in Clupisoma garua species (Nei and Kumar, 2000; Saraswat et al., 2014).
Genetic Divergence (K2P) Among Taxa
In this study, the K2P model was used to evaluate the genetic distance between different taxonomic levels. The average interspecific genetic distance among species was 0.311%, compared with 0.308% for genera. Moreover, the mean genetic distance among families was 0.369% and among orders was 0.337%. In our study, the mean interspecific genetic distance among families was higher than orders, genus, and species, respectively. Our results are consistent with previous studies by Ardura et al. (2013), Ward et al. (2005), Hubert et al. (2008), and Lara et al. (2010), which report high interspecific genetic distances in marine fish species. Thus, the genetic distances sufficiently discriminated all freshwater and marine fish species.
Tree Construction and Lineage
The constructed phylogenetic tree provided similar classification concerning taxonomy and morphology, along with insignificant differences at the taxonomic levels. Our results highlighted the efficacy of barcoding for the identification and authentication of Pakistan fish. In this study, 11 freshwater and 6 marine fish species comprising 9 orders, 11 families, 15 genus, and 17 species of Pakistan fish were categorized. The phylogenetic relationship demonstrated that all morphologically similar or closely related species were clustered under the same nodes, while the distant species were clustered in distinct nodes.
In the phylogenetic tree, Labeo rohita and Labeo gonius are sister species that originate from the same cluster. The same is true for Hypophthalmichthys molitrix and Ctenopharyngodon idella, and all four species are closely related to each other, belonging to the same order (Cypriniformes) and family (Cyprinidae). However, Labeo calbasu is distantly related and clustered separately with respect to the other freshwater fish species. In addition, freshwater species Mystus cavasius, Wallago attu, and Ompok bimaculatus are also closely related to each other and belong to the same order (Siluriformes) and family (Siluridae), except Mystus cavasius, which belongs to the family Bagridae. Chitala chitala belongs to the order Osteoglossiformes and family Notopteridae. Channa marulius belongs to the order Anabantiformes, family Channidae; Scomberomorus commerson belongs to the order Perceformes and family Scombridae, which are closely linked with each other. Oreochromis niloticus belongs to the family Cichlidae and order Cichliformes. All the species discussed above are freshwater species, excluding Scomberomorus commerson. The marine fish species clustered separately and belong to different families and orders. The fish species Tenualosa ilisha and Lactarius lactarius belong to families Clupeidae and Lactaridae and orders Clupeiformes and Perciformes, respectively. The species Scomberoides commersonianus, Carangoides malabaricus, and belong to family Carangidae and order Carangiforms while Pampus argenteus, belongs to family Stromateidae, and order Scombriformes.
DNA Sequence-Based Development of QR Codes
We have developed DNA sequence- and SNP-based QR codes that can be scanned using mobile phone applications in the same way that barcodes are scanned in supermarkets (Figures 5, 6). To our knowledge, this is the first study to develop QR codes for the identification of fish species based on molecular approaches. Previously, Yang et al. (2019) developed a DNA barcode as an example for the precise identification of Teleost fish species. Our approach differs from that of Yang et al. (2019) as we developed DNA sequence based QR codes instead of using a Bio-Rad DNA barcode generator for generating barcodes.
The use of species authentication supported by DNA barcoding could provide an effective approach for monitoring, management, and conservation of the fisheries sector. This study was pioneer research, targeting 17 commercially available freshwater and marine fish species of Pakistan, based on a molecular approach rather than visible morphology. Species-level fish identification in Pakistan is not common; here we validate the DNA barcoding approach as a gateway for identification and authentication using QR barcodes.
Conclusion
The increased consumption and of fish and fish products and the morphological similarities between species has led to the inadvertent and deliberate mislabeling of fish in markets. Barcoding provides a novel technique for the authentication of fish species using sequencing of the Cyt b gene of mitochondrial DNA, without relying on morphological and meristic characteristics. Thus, DNA barcoding has been proven as a reliable tool for the detection of fish and the enhancement of food safety. Despite the high success rate of this technique, it is still in the infancy phase. The International Barcode of Life previously stated that “DNA sequence can be used to identify the various species, just as a supermarket scanner can use a familiar black strip that encodes the Universal Product Code (UPC) to recognize the purchase products”. A digital barcode hologram is ultimately needed to identify fish species by using a barcode reader swiftly. The digital data collected by the next-generation storage system can also be used to complement the barcode sequences for all fish species.
Data Availability Statement
The datasets presented in this study can be found in online repositories. The names of the repository/repositories and accession number(s) can be found below: Figshare (https://doi.org/10.6084/m9.figshare.12994073).
Ethics Statement
The fish used in this study were treated and handled according to the standard protocols and Ethics Committee of the University of Agriculture, Faisalabad, Pakistan.
Author Contributions
MN, SA, and AA performed practical work. MG, MI, MJ, and SK wrote the manuscript. AA, MG, AU, ZK, and SAf revised the manuscript. AA provided funds for this study. NM helped in English editing. All authors contributed to the article and approved the submitted version.
Funding
Work in lab of AA has been supported by Higher Education Commission, Islamabad, Pakistan under grant # NRPU-6350.
Conflict of Interest
The authors declare that the research was conducted in the absence of any commercial or financial relationships that could be construed as a potential conflict of interest.
Acknowledgments
We thank Office of Research, Innovation and Commercialization (ORIC), University of Agriculture, Faisalabad, Pakistan for their help in grant and research work.
References
Ali, E., Sultana, S., Hamid, S. B. A., Hossain, M., Yehya, W. A., Kader, A., et al. (2018). Gelatin controversies in food, pharmaceuticals, and personal care products: authentication methods, current status, and future challenges. Crit. Rev. Food Sci. 58, 1495–1511. doi: 10.1080/10408398.2016.1264361
Ardura, A., Planes, S., and Garcia-Vazquez, E. (2013). Applications of DNA barcoding to fish landings: authentication and diversity assessment. Zookeys 49, 49–65. doi: 10.3897/zookeys.365.6409
Armani, A., Guardone, L., Castigliego, L., D’Amico, P., Messina, A., and Malandra, R. (2015). DNA and mini-DNA barcoding for the identification of porgies species (family Sparidae) of commercial interest on the international market. Food Control 50, 589–596. doi: 10.1016/j.foodcont.2014.09. 025
Asif, M. J., and Cannon, C. H. (2005). DNA extraction from processed wood: a case study for the identification of an endangered timber species (Gonystylus bancanus). Plant Mol. Biol. Rep. 23, 185–192. doi: 10.1007/bf02772709
Avise, J. C., Arnold, J., Ball, R. M., Bermingham, E., Lamb, T., Neigel, J. E., et al. (1987). Intraspecific phylogeography: the mitochondrial DNA bridge between population genetics and systematics. Annu. Rev. Ecol. Sci. 18, 489–522. doi: 10.1146/annurev.es.18.110187.002421
Beamish, R. J., and Rothschild, B. J. (eds). (2009). The Future of Fisheries Science in North America. Berlin: Springer Science & Business Media.
Bingpeng, X., Heshan, L., Zhilan, Z., Chunguang, W., Yanguo, W., and Jianjun, W. (2018). DNA barcoding for identification of fish species in the Taiwan Strait. PLoS One 13:e0198109. doi: 10.1371/journal.pone.0198109
Bottero, M. T., and Dalmasso, A. (2011). Animal species identification in food products: evolution of biomolecular methods. Vet. J. 190, 34–38. doi: 10.1016/j.tvjl.2010.09.024
Cawthorn, D. M., Steinman, H. A., and Witthuhn, R. C. (2012). DNA barcoding reveals a high incidence of fish species misrepresentation and substitution on the South African market. Food Res. Int. 46, 30–40. doi: 10.1016/j.foodres.2011.11.011
Costa, F. O., and Carvalho, G. R. (2007). The barcode of life initiative: synopsis and prospective societal impacts of DNA barcoding of fish. Genom. Soc. Policy 3:29.
Dawnay, N., Ogden, R., McEwing, R., Carvalho, G. R., and Thorpe, R. S. (2007). Validation of the barcoding gene COI for use in forensic genetic species identification. Forensic Sci. Int. 173, 1–6. doi: 10.1016/j.forsciint.2006.09.013
Degli Esposti, M. D., De Vries, S., Crimi, M., Ghelli, A., Patarnello, T., and Meyer, A. (1993). Mitochondrial cytochrome b: evolution and structure of the protein. Biochim. Biophys. Acta 1143, 243–271.
Di Pinto, A., Marchetti, P., Mottola, A., Bozzo, G., Bonerba, E., and Ceci, E. (2015). Species identification in fish fillet products using DNA barcoding. Fish. Res. 170, 9–13. doi: 10.1016/j.fishres.2015.05.006
Doña, J., Diaz-Real, J., Mironov, S., Bazaga, P., Serrano, D., and Jovani, R. (2015). DNA barcoding and minibarcoding as a powerful tool for feather mite studies. Mol. Ecol. Resour. 15, 1216–1225. doi: 10.1111/1755-0998.12 384
Fatima, T., Srivastava, A., Somashekar, P. V., Hanur, V. S., and Rao, M. S. (2019). Development of DNA-based species identification and barcoding of three important timbers. Bull. Natl. Res. Cent. 43:76.
Fernandes, T. J., Costa, J., Oliveira, M. B., and Mafra, I. (2017). DNA barcoding coupled to HRM analysis as a new and simple tool for the authentication of Gadidae fish species. Food Chem. 230, 49–57. doi: 10.1016/j.foodchem.2017.03.015
Galimberti, A., De Mattia, F., Losa, A., Bruni, I., Federici, S., and Casiraghi, M. (2013). DNA barcoding as a new tool for food traceability. Food Res. Int. 50, 55–63. doi: 10.1016/j.foodres.2012.09.036
Hebert, P. D., Cywinska, A., Ball, S. L., and deWaard, J. R. (2003). Biological identifications through DNA barcodes. Proc. Biol. Sci. 270, 313–321. doi: 10.1098/rspb.2002.2218
Hubert, N., Hanner, R., Holm, E., Mandrak, N. E., Taylor, E., and Burridge, M. (2008). Identifying Canadian freshwater fishes through DNA barcodes. PLoS One 3:e2490. doi: 10.1371/journal.pone.0002490
Kartavtsev, Y. P. (2011). Divergence at Cyt-b and Co-1 mtDNA genes on different taxonomic levels and genetics of speciation in animals. Mitochondrial DNA 22, 55–65. doi: 10.3109/19401736.2011.588215
Kerr, K. C. R., Lijtmaer, D. A., Barreira, A. S., Hebert, P. D., and Tubaro, P. L. (2009). Probing evolutionary patterns in Neotropical birds through DNA barcodes. PLoS One 4:e4379. doi: 10.1371/journal.pone.0004379
Keskin, E., and Atar, H. H. (2013). DNA barcoding commercially important fish species of Turkey. Mol. Ecol. Resour. 13, 788–797. doi: 10.1111/1755-0998.12120
Khaksar, R., Carlson, T., Schaffner, D. W., Ghorashi, M., Best, D., and Jandhyala, S. (2015). Unmasking seafood mislabeling in US markets DNA bar coding as a unique technology for food authentication and quality control. Food Control 56, 71–76. doi: 10.1016/j.foodcont.2015.03.007
Kochzius, M., Seidel, C., Antoniou, A., Botla, S. K., Campo, D., Cariani, A., et al. (2010). Identifying fishes through DNA barcodes and microarrays. PLoS One 5:e12620. doi: 10.1371/journal.pone.0012620
Kumazawa, Y., and Nishida, M. (2000). Molecular phylogeny of osteoglossoids: a new model for Gondwanian origin and plate tectonic transportation of the Asian arowana. Mol. Biol. Evol. 17, 1869–1878. doi: 10.1093/oxfordjournals.molbev.a026288
Lara, A., Ponce de León, J. L., Rodríguez, R., Casane, D., Côté, G., Bernatchez, L., et al. (2010). DNA barcoding of Cuban freshwater fishes: evidence for cryptic species and taxonomic conflicts. Mol. Ecol. Resour. 10, 421–430. doi: 10.1111/j.1755-0998.2009.02785.x
Li, X., Shen, X., Chen, X., Xiang, D., Murphy, R. W., and Shen, Y. (2018). Detection of potential problematic Cytb gene sequences of fishes in GenBank. Front. Genet. 6:30. doi: 10.3389/fgene.2018.00030
Meyer, C. P., and Paulay, G. (2005). DNA barcoding: error rates based on comprehensive sampling. PLoS Biol. 3:e422. doi: 10.1371/journal.pbio.0030422
Nei, M., and Kumar, S. (2000). Molecular Evolution and Phylogenetics. Oxford: Oxford University Press.
Nicolas, V., Schaeffer, B., Missoup, A. D., Kennis, J., Colyn, M., Denys, C., et al. (2012). Assessment of three mitochondrial genes (16S, Cytb, CO1) for identifying species in the Praomyini tribe (Rodentia: Muridae). PLoS One 7:e36586. doi: 10.1371/journal.pone.0036586
Nicolè, S., Barcaccia, G., Erickson, D. L., Kress, J. W., and Lucchin, M. (2013). The coding region of the UFGT gene is a source of diagnostic SNP markers that allow single-locus DNA genotyping for the assessment of cultivar identity and ancestry in grapevine (Vitis vinifera L.). BMC Res. Notes 6:502. doi: 10.1186/1756-0500-6-502
Nicolè, S., Erickson, D. L., Ambrosi, D., Bellucci, E., Lucchin, M., and Papa, R. (2011). Biodiversity studies in Phaseolus species by DNA barcoding. Genome 54, 529–545. doi: 10.1139/g11-018
Parson, W., Pegoraro, K., Niederstätter, H., Föger, M., and Steinlechner, M. (2000). Species identification by means of the cytochrome b gene. Int. J. Leg. Med. 114, 23–28. doi: 10.1007/s004140000134
Pollack, S. J., Kawalek, M. D., Williams-Hill, D. M., and Hellberg, R. S. (2018). Evaluation of DNA barcoding methodologies for the identification of fish species in cooked products. Food Control 84, 297–304. doi: 10.1016/j.foodcont.2017.08.013
Prieto, L., Montesino, M., Salas, A., Alonso, A., Albarrán, C., Alvarez, S., et al. (2003). The 2000-2001 GEP-ISF collaborative exercise on mtDNA: assessing the cause of unsuccessful mtDNA PCR amplification of hair shaft samples. Forensic Sci. Int. 134, 46–53. doi: 10.1016/s0379-0738(03)00095-1
Rafique M. (2007). Biosystematics and Distribution of the Freshwater Fishes of Pakistan With Special References to the Subfamilies Noemacheilinae and Schizothoracinae. Ph.D. thesis, UAAR, 220.
Rafique, M., and Khan, N. U. H. (2012). Distribution and status of significant freshwater fishes of Pakistan. Rec. Zool. Surv. Pakistan 21, 90–95.
Saraswat, D., Lakra, W. S., Nautiyal, P., Goswami, M., Shyamakant, K., and Malakar, A. (2014). Genetic characterization of Clupisoma garua (Hamilton 1822) from six Indian populations using mtDNA cytochrome b gene. Mitochondrial DNA 25, 70–77. doi: 10.3109/19401736.2013.782014
Sevilla, R. G., Diez, A., Norén, M., Mouchel, O., Jérôme, M., and Verrez-Bagnis, V. (2007). Primers and polymerase chain reaction conditions for DNA barcoding teleost fish based on the mitochondrial cytochrome b and nuclear rhodopsin genes. Mol. Ecol. Notes 7, 730–734. doi: 10.1111/j.1471-8286.2007.01863.x
Sullivan, J. P., Muriel-Cunha, J., and Lundberg, J. G. (2013). Phylogenetic relationships and molecular dating of the major groups of catfishes of the Neotropical superfamily Pimelodoidea (Teleostei, Siluriformes). Proc. Acad. Natl. Sci. Phila. 162, 89–110. doi: 10.1635/053.162.0106
Teletchea, F. (2009). Molecular identification methods of fish species: reassessment and possible applications. Rev. Fish Biol. Fish. 19, 265–293. doi: 10.1007/s11160-009-9107-4
Vergara-Chen, C., González-Wangüemert, M., Bermingham, E., and D’Croz, L. (2009). Identification of weakfish Cynoscion (Gill) in the bay of panama with RFLP markers. J. Fish Biol. 75, 1101–1107. doi: 10.1111/j.1095-8649.2009.02356.x
Verzeletti, A., Cortellini, V., Cisana, S., Pretto, S., Cerri, N., and De Ferrari, F. (2015). Genetic approach for species identification: forensic application of DNA barcoding. Forensic Sci. Int. Genet. 5, 576–578.
Ward, R. D., Zemlak, T. S., Innes, B. H., Last, P. R., and Heber, P. D. (2005). DNA barcoding Australia’s fish species. Philos. Trans. R. Soc. Lond. B. Biol. Sci. 360, 1847–1857.
Yacoub, H. A., Fathi, M. M., and Sadek, M. A. (2015). Using cytochrome b gene of mtDNA as a DNA barcoding marker in chicken strains. Mitochondrial DNA 26, 217–223. doi: 10.3109/19401736.2013.825771
Yang, C. H., Wu, K. C., Chuang, L. Y., and Chang, H. W. (2019). Decision theory-based COI-SNP tagging approach for 126 Scombriformes species tagging. Front. Genet. 10:259. doi: 10.3389/fgene.2019.00259
Keywords: marine water, DNA barcoding, mislabeling, QR barcodes, fish, freshwater, SNPs, identification
Citation: Ghouri MZ, Ismail M, Javed MA, Khan SH, Munawar N, Umar AB, Nisa M, Aftab SO, Amin S, Khan Z and Ahmad A (2020) Identification of Edible Fish Species of Pakistan Through DNA Barcoding. Front. Mar. Sci. 7:554183. doi: 10.3389/fmars.2020.554183
Received: 21 April 2020; Accepted: 24 September 2020;
Published: 04 November 2020.
Edited by:
Rodrigo Vidal, University of Santiago, ChileReviewed by:
Carlos Vergara-Chen, Technological University of Panama, PanamaClaudio Oliveira, São Paulo State University, Brazil
Copyright © 2020 Ghouri, Ismail, Javed, Khan, Munawar, Umar, Nisa, Aftab, Amin, Khan and Ahmad. This is an open-access article distributed under the terms of the Creative Commons Attribution License (CC BY). The use, distribution or reproduction in other forums is permitted, provided the original author(s) and the copyright owner(s) are credited and that the original publication in this journal is cited, in accordance with accepted academic practice. No use, distribution or reproduction is permitted which does not comply with these terms.
*Correspondence: Aftab Ahmad, YWZ0YWIuYWhtYWRAdWFmLmVkdS5waw==; orcid.org/0000-0002-2792-9771
†These authors have contributed equally to this work