 Alan M. Downey-Wall1*
 Louise P. Cameron1
 Brett M. Ford1Elise M. McNally1
 Yaamini R. Venkataraman2
 Steven B. Roberts2Justin B. Ries1
 Katie E. Lotterhos1
- 1Department of Marine and Environmental Sciences, Northeastern University, Nahant, MA, United States
- 2School of Aquatic and Fishery Sciences, University of Washington, Seattle, WA, United States
Early evidence suggests that DNA methylation can mediate phenotypic responses of marine calcifying species to ocean acidification (OA). Few studies, however, have explicitly studied DNA methylation in calcifying tissues through time. Here, we examined the phenotypic and molecular responses in the extrapallial fluid and mantle (fluid and tissue at the calcification site) in adult eastern oyster (Crassostrea virginica) exposed to experimental OA over 80 days. Oysters were reared under three experimental pCO2 treatments (“control,” 580 μatm; “moderate OA,” 1,000 μatm; “high OA,” 2,800 μatm) and sampled at 6 time points (24 h−80 days). We found that high OA initially induced an increase in the pH of the extrapallial fluid (pHEPF) relative to the external seawater that peaked at day 9, but then diminished over time. Calcification rates were significantly lower in the high OA treatment compared to the other treatments. To explore how oysters regulate their extrapallial fluid, gene expression and DNA methylation were examined in the mantle-edge tissue of oysters from days 9 and 80 in the control and high OA treatments. Mantle tissue mounted a significant global molecular response (both in the transcriptome and methylome) to OA that shifted through time. Although we did not find individual genes that were significantly differentially expressed under OA, the pHEPF was significantly correlated with the eigengene expression of several co-expressed gene clusters. A small number of OA-induced differentially methylated loci were discovered, which corresponded with a weak association between OA-induced changes in genome-wide gene body DNA methylation and gene expression. Gene body methylation, however, was not significantly correlated with the eigengene expression of pHEPF-correlated gene clusters. These results suggest that OA induces a subtle response in a large number of genes in C. virginica, but also indicate that plasticity at the molecular level may be limited. Our study highlights the need to reassess our understanding of tissue-specific molecular responses in marine calcifiers, as well as the role of DNA methylation and gene expression in mediating physiological and biomineralization responses to OA.
Introduction
Ocean acidification (OA), a decrease in seawater pH due to the uptake of anthropogenic CO2, is expected to have substantial effects on marine species and ecosystems in the near future (Orr et al., 2005; Guinotte and Fabry, 2008; Doney et al., 2009). Specifically, OA is driving a shift in the carbonate system equilibrium, resulting in decreased availability of carbonate ions and lower calcium carbonate saturation state (Feely et al., 2004; Orr et al., 2005). This may be particularly problematic for marine calcifying species, which build their shells and skeletons from calcium and carbonate ions.
Substantial effort has been invested into evaluating the short- and long-term consequences of OA across taxa and life history stages. Prolonged exposure to OA tends to have negative effects on calcification, metabolism, and growth, as observed in corals (e.g., Anthony et al., 2008), pteropods (e.g., Bednaršek et al., 2012), gastropods (e.g., Melatunan et al., 2013), and bivalves (e.g., Talmage and Gobler, 2010). However, these negative effects are not universal, varying in direction (negative or positive) and intensity depending on taxon, severity of OA, and duration of exposure (Ries et al., 2009; Kroeker et al., 2010). Observed non-negative effects may be the result of individual resilience or the capacity of certain species to acclimatize to OA.
One way acclimation may occur is via the maintenance of pH homeostasis at the site of calcification, which is a polyphyletic response to OA that has been observed in scleractinian corals (Al-Horani et al., 2002; Ries, 2011; Venn et al., 2011; McCulloch et al., 2012; Holcomb et al., 2014), foraminifera (Rink et al., 1998; Köhler-Rink and Kühl, 2000; de Nooijer et al., 2008, 2009), calcareous green algae (De Beer and Larkum, 2001), coralline red algae (Donald et al., 2017; Anagnostou et al., 2019; Liu et al., 2020), coccolithophores (Liu et al., 2018), and bivalves (Ramesh et al., 2017; Liu et al., 2020). Recent evidence in bivalves suggests that this response may also be affected by other factors, including temperature (Cameron et al., 2019) and life-stage (Ramesh et al., 2017).
Under ambient conditions, adult bivalves tend to maintain their extra-pallial fluid pH (pHEPF) below that of seawater pH (pHseawater) (Crenshaw, 1972; Sutton et al., 2018), which has been attributed to the buildup of dissolved CO2 when the organism's valves are closed (Crenshaw, 1972; Michaelidis et al., 2005; Sutton et al., 2018; Liu et al., 2020). While under OA conditions, some bivalves will actually increase their pHEPF above that of pHseawater (e.g., Liu et al., 2020), potentially enabling them to continue calcifying even under highly acidic scenarios. Only recently have investigators studied the molecular mechanisms that regulate calcification within the mantle tissue (see reviews by Clark, 2020; Rajan and Vengatesen, 2020).
Transcriptomic studies have proven to be a powerful approach for identifying genes and understanding pathways that shape organismal the response to OA, and have been used to help elucidate the potential trade-offs that result from acclimatization (Evans and Hofmann, 2012), including genes associated with biomineralization, acid-base regulation, and metabolic function (Evans et al., 2013; Davies et al., 2016; Li et al., 2016; Goncalves et al., 2017; Wong et al., 2018; Griffiths et al., 2019; Strader et al., 2020). From this literature it has been hypothesized that there is a trade-off between maintaining calcification vs. other core functions (Wood et al., 2008), whereby increased or sustained calcification under continued exposure may become too costly over time. At the transcriptomic level, this cost can manifest as shifts in the expression of both calcification and metabolic genes over time (Li et al., 2016), suggesting that certain acclimatization responses may be unsustainable during extended exposure to OA. The precise mechanisms that mediate these changes in gene expression remain underexplored, but recent studies indicate that DNA methylation, an epigenetic modification, may be an important regulator of these responses (Liew et al., 2018; Bogan et al., 2020).
DNA methylation is an important mediator of gene regulation and physiological response across a diverse range of taxa (see reviews Zilberman et al., 2007; Zemach et al., 2010; Schübeler, 2015; Zhang et al., 2018). DNA methylation refers to the attachment of a methyl group to cytosine, and is most frequently studied in the context of the cytosine-guanine (CpG) motif. These modifications occur on top of the genome without altering the underlying DNA sequence (Richards, 2006; Bonduriansky and Day, 2018) and may be stable enough to be passed from parent to offspring (Jablonka and Lamb, 2002). Previous work has shown they can have an important role in determining an organism's phenotype across a range of species, including fur color and obesity in mice (Dolinoy et al., 2006), rat pup behavior as determined by parental care (Anier et al., 2014), response to phosphate starvation in Arabidopsis (Yong-Villalobos et al., 2015), and caste phenotypes in social insects (Lyko et al., 2010). Importantly, the precise manner in which DNA methylation serves to regulate phenotype is taxon-specific.
In invertebrates, association studies have begun to elucidate the relationship between DNA methylation, gene expression, and phenotype (e.g., Gavery and Roberts, 2013; Dixon et al., 2018; Liew et al., 2018). In basal invertebrates (e.g., corals and oysters), genomes are typically only sparsely methylated compared to vertebrates, and DNA methylation tends to be concentrated in CpGs within gene bodies (i.e., exons and introns). In this group, gene body methylation was positively correlated with gene expression and negatively correlated with the variation in expression among individuals (Gavery and Roberts, 2013; Liew et al., 2018). Based on these patterns, DNA methylation may be acting to regulate not only the level of expression, but also the amount of transcriptional noise among individuals (Huh et al., 2013). Furthermore, recent evidence suggests that unlike vertebrates, non-deuterostome invertebrate DNA methylation is not necessarily erased during embryogenesis, opening up the possibility for transmission of marks between generations (Xu et al., 2019).
Understanding the role of environment-induced DNA methylation in regulating gene expression and phenotypic plasticity is of particular interest in the context of marine systems and global change (see reviews Hofmann, 2017; Eirin-Lopez and Putnam, 2019). In corals, early evidence indicates that DNA methylation can be both sensitive to environmental change, including OA in some species (Putnam et al., 2016; Liew et al., 2018), and associated with gene expression (Dixon et al., 2018) suggesting a potential regulatory role of DNA methylation in coral response to OA. Liew et al. (2018) found OA-sensitive DNA methylation also corresponded with biomineralization-related traits in corals, supporting the idea that DNA methylation may have an important role in phenotypic plasticity and acclimatization to OA. Although these studies examined OA reponses in many different tissues, none of these studies quantified methylation responses to OA at base-pair resolution in calcifying tissue.
Here, we examine the molecular basis of eastern oyster (Crassostrea virginica) pHEPF regulation and calcification response to OA. Crassostrea virginica is a coastal marine bivalve that provides critical ecosystem services in the form of habitat structure and water filtration, and also serves as an economically important food source (Ekstrom et al., 2015; Gómez-Chiarri et al., 2015). Its genome has been recently sequenced (Gómez-Chiarri et al., 2015) and the species has been the subject of extensive OA studies. Consistent with other bivalve species, C. virginica at all life stages exhibit a largely negative calcification response to OA (e.g., Miller et al., 2009; Ries et al., 2009; Beniash et al., 2010; Waldbusser et al., 2011b; Dickinson et al., 2012), while metabolic and physiological responses tend to be more varied and dependent on life stage, experimental condition, and duration of exposure (Beniash et al., 2010; Dickinson et al., 2012; Ivanina et al., 2013; Matoo et al., 2013; Gobler and Talmage, 2014). Like other bivalve species, the chemical composition of C. virginica EPF is thought to be regulated via the active exchange of ions and other constituents through the mantle epithelium to promote calcification (Crenshaw and Neff, 1969; Crenshaw, 1972). A recent study by Liu et al. (2020) found that C. virginica had some ability to moderate their pHEPF in response to OA, however, the mechanisms that regulate this response have not been explored.
The primary goal of the present study was to investigate the molecular mechanisms underlying the biomineralization response of C. virginica to short- and long-term OA exposure. Specifically, we studied the role of DNA methylation in physiological and gene expression responses in C. virginica mantle-edge tissue. We performed a controlled laboratory experiment in which oysters were exposed to three levels of CO2-induced OA (control, moderate, and high) for 80 days and monitored the oysters' calcification rate and pHEPF. Based on patterns we observed in the pHEPF response, we examined gene expression and DNA methylation responses in mantle-edge tissue at two time points (days 9 and 80) for oysters exposed to control and high OA treatments. We predicted that the oysters mitigate the effects of OA by regulating pHEPF relative to pHseawater and that this process is associated with a molecular response in the oyster transcriptome and methylome. Specifically, we hypothesized that in C. virginica (i) OA will drive differential responses in both the transcriptome and methylome and up-regulation of pHEPF relative to the environment, (ii) pHEPF response will be coupled with the up-regulation of biomineralization related genes, (iii) gene expression will be associated with gene body DNA methylation, and (iv) differential expression will correspond to significant shifts in gene body methylation. By establishing the first integrated dataset on EPF carbonate chemistry, gene expression, and DNA methylation in a mollusk exposed to variable degrees of OA, our study provides new insights into the responses of bivalves to OA over short and long timescales.
Materials and Methods
Oyster Collection and Preparation
Adult C. virginica were collected from three intertidal sites within Plum Island Sound, Massachusetts, USA (Site 1, 42.751636, −70.837023; Site 2, 42.725186, −70.855022; Site 3, 42.681764, −70.813498) in late April 2017. These sites are all within 8 km of each other and the oysters from these sites are not distinct genetic populations. However, to compensate for any site effects, site was included as a random effect in applicable statistical models (see statistical analysis section for details).
In the lab, oysters were cleaned of epibionts and shell ports were installed over 8 days while being maintained in 50-L flow-through tanks. To measure the carbonate chemistry of the EPF, a 2 mm hole was drilled into the right valve ~2 cm from the hinge to expose the EPF cavity, without damaging the underlying mantle tissue. The drilled hole was gently rinsed with filtered seawater and patted dry. The barbed end of a nylon luer-lock coupling (McMaster-Carr 51525K123) was trimmed to the length of the shell thickness, inserted into the hole and sealed in place using marine-safe cyanoacrylate (Starbond EM-2000 CA USA). The coupling was then plugged with a nylon cap socket (McMaster-Carr 51525K315) to prevent exchange between seawater and the EPF via the port and limit the potential for increased dissolution near the site of the implant. Oysters were allowed to recover for 4 days, after which they were transferred to the experimental tank array (described below) for acclimation and exposure. During the transfer, oysters were assigned one of three pCO2 treatments: “control” (ca. 580 μatm)—corresponding to near-present-day conditions in the estuary where they were collected; “moderate OA” (ca. 1,000 μatm)—corresponding to end-of-century predictions (Intergovernmental Panel on Climate Change, 2007); and “high OA” (ca. 2,800 μatm)—corresponding to seawater conditions that are undersaturated with respect to calcite (Ωcalcite < 1). Importantly, high OA events are already regularly experienced in the coastal marine systems from which these oysters were collected, owing to daily tidal cycles, input of meteoric waters, and seasonal reoxidation of organic matter (Supplementary Figure 1.1). This trend is underappreciated in many coastal systems, where local processes are increasing the acidity of the seawater relative to the global average (Reum et al., 2014). The high OA treatment was also used to increase the inferential and statistical power of the study design (Whitlock and Schluter, 2014).
Experimental Design and Water Chemistry
The experiment was conducted at Northeastern University's Marine Science Center, using a flow-through seawater system that draws water from Broad Sound in Nahant, Massachusetts (42.416884, −70.907564). Each pCO2 treatment was replicated over two blocks, each containing three 42-L acrylic aquaria (total of 6 aquaria per treatment). Tanks within a block were connected via the recirculation and filtration system, while gas mixture, temperature, and incoming filtered seawater were regulated independently for each tank. A blocked randomized design was used to ensure an equal number of oysters from each location were distributed across all treatments and that there were no significant differences in initial oyster size across treatment (mean ± SD shell length: 9.70 ± 2.4 cm). Twelve oysters were placed into each aquarium, four from each location, resulting in 24 oysters per treatment per location (total of 72 oysters per treatment). Oysters were acclimated for 33 days in control pCO2 conditions at a temperature of 17°C. This extended acclimation period was used to (i) provide time for any acute field-induced changes due to local acidification events to reset, and (ii) ensure that the oysters had sufficient time to recover from the stress of being transported to the laboratory. Following acclimation, the moderate and high OA treatments were ramped up to target pCO2 over a 12-h period. This 12-h period was the minimum amount of time needed for the experimental OA system to equilibrate with the new pCO2 conditions and was chosen to simulate the rapid change in OA observed from the field (Supplementary Figure 1.1). Treatment conditions were maintained for 80 days.
Target pCO2 gases were formulated by mixing compressed CO2 with compressed CO2-free air (control treatment) or with compressed air (moderate and high OA treatments) using solenoid-valve-controlled mass flow controllers at flow-rates proportional to the target pCO2 conditions. Filtered seawater was introduced to each aquarium at a flow rate of 150 mL min−1. The temperature of all experimental tanks was maintained at 17°C and was slowly increased to 19.5°C (Supplementary Figure 1.2) on days 39–51 of the experiment in an effort to stimulate gonad development for a companion experiment. It should be noted that this is a small temperature shift relative to what these oysters experience seasonally in their native habitats (Supplementary Figure 1.1). Oysters were fed 1% Shellfish Diet 1800® twice daily following best practices outlined in Helm and Bourne (2004).
Temperature, pH, and salinity of all tanks were measured three times per week (M,W, and F) for the duration of the experiment. Seawater pH was measured with an Accumet solid state pH electrode (precision = 1 mV) calibrated with pH 7.01 and pH 10.01 NBS buffers (for calibration slope) and Dickson seawater Certified Reference Material (for calibration intercept). Complete carbonate chemistry was determined for each tank every 2 weeks. In brief, seawater samples were collected every 2 weeks in 250 ml borosilicate ground-glass stoppered bottles sealed with vacuum grease from each tank and immediately poisoned with 100 μl saturated HgCl2 solution, then refrigerated until analysis of dissolved inorganic carbon (DIC) and total alkalinity (TA) was performed. DIC, TA, salinity, and temperature were used to calculate calcite saturation state, pH, , , aqueous CO2, and pCO2 of each sample using CO2SYS version 2.1 (Pierrot et al., 2011). Additional details about the experimental design and calculation of carbonate system parameters is provided in Supplementary Method 1.
Oyster EPF and tissue were sampled at six discrete time points (ntotal = 108, n = 6 per treatment per time point, see Supplementary Figure 1.3 for a schematic of the experimental design) that decreased in frequency throughout the duration of the experiment (time post 12-h ramp up period: 24, 48 h, 9, 22, 50, and 80 days). This sampling schedule was designed to capture rapid physiological changes that occurred during the onset of exposure and to examine long-term stability of physiological and molecular responses.
Phenotypic Data
Extrapallial Fluid Chemistry
Oyster pHEPF was measured by removing each oyster from its tank, inserting a 5 mL syringe with a flexible 18-gauge polypropylene tip through the luer-lock port into the oyster's extrapallial cavity, and extracting ~0.5–2 mL of extrapallial fluid. Care was taken to avoid puncturing the mantle tissue and inadvertently sampling either the hemolymph or stomach fluid. The pHEPF was measured immediately after extraction with an Orion 91'10DJWP Double Junction micro-pH probe calibrated with pH 7.01 and 10.01 NBS buffers (for slope) and Dickson seawater Certified Reference Material (for intercept).
Calcification Rate
Net calcification rate was calculated for oysters surviving to either 50 or 80 days (ncalcification = 11, 12, and 12 for control, 1,000 ppm, and 2,800 ppm treatments, respectively) from dry weights obtained at the start of the exposure and on day 33 or 34. Dry weights were estimated from buoyant weight measurements using the linear relationship between oyster dry weight and oyster buoyant weight derived empirically for oysters investigated in the present study (see Ries et al., 2009, for details). The average daily change in dry weight was divided by initial dry weight to standardize calcification rate for allometric effects, and multiplied by 100 to convert that fraction into a percent. See Supplementary Method 2 for a complete description of the buoyant weight measurements and the estimation of the dry weights.
Tissue Collection
Patterns observed in pHEPF over time informed the decision to focus molecular analyses on mantle edge tissue extracted on days 9 and 80 of the exposure in the control and high OA treatments (ntissue = 6 per treatment per time point). For consistency and to minimize potential effects on mantle tissue arising from drilling of the oysters' right valves when installing the EPF extraction ports, mantle tissue was only collected from the left valve of the oysters (i.e., the side opposite of the EPF extraction port). Immediately following extraction of EPF at each time point, the oysters were shucked and the edge of the mantle tissue was sampled. Tissue was immediately flash frozen in liquid nitrogen before being transferred to a −80°C freezer for storage prior to DNA/RNA extraction.
Molecular Data
DNA Methylation Library Preparation and Quantification
DNA was isolated from the oyster mantle edge tissue samples using the E.Z.N.A. Mollusc Kit (Omega) pursuant to the manufacturer's instructions. Isolated DNA was quantified, sonicated, and fragmentation was verified using a 2200 TapeStation System (Agilent Technologies, Santa Clara, CA, USA). Samples were enriched for methylated DNA using MethylMiner kit (Invitrogen, CA, USA), then sent to Zymo Research (Zymo,CA,USA) for bisulfite-conversion, library preparation, and sequencing. Libraries were sequenced on an Illumina HiSeq1500 platform with paired-end 100 bp sequencing.
Raw sequences were trimmed using TrimGalore! (v0.6.4; Martin, 2011) and aligned using Bismark (v0.22.3; Krueger and Andrews, 2011). Bismark was also used to determine the methylation status, methylated or unmethylated, for all sequenced CpGs. Files were then processed by performing a median based normalization of methylation counts among samples, destranding CpGs loci, and filtering loci that did not have at least 5x coverage for each sample using the R package methylKit (v1.10.0; Akalin et al., 2012). Finally, CpG loci were annotated by feature (e.g., introns, exons, and intergenic regions) and genomic coordinates using feature tracks created based on methods outlined in Venkataraman et al. (2020) and gene annotation file available on NCBI (Accession: GCA_002022765.4). Hereafter, “gene body” is used to reference the transcriptional region of the gene, which includes exons, introns, and untranslated regions, but not promoters. See the Supplementary Method 3 for a detailed description of this pipeline.
RNA Library Preparation and Quantification
RNA was extracted from the same mantle tissues used for DNA methylation using TRI Reagent Protocol (Applied Biosystems) following manufacturer's instructions. A cDNA library was constructed for each sample using a TruSeq Stranded mRNA kit (Illumina, Cat# RS-122-2101) following manufacturer's instructions. Library fragment size was determined using a BioAnalyzer (RNA 6000 Nano Kit; Agilent, CA, USA) and concentration was quantified on a Qubit (Qubit High Sensitivity RNA Kit; Invitrogen,CA,USA). Samples were sent to Genewiz (NJ,USA) for library preparation and sequencing. Libraries were sequenced on two lanes (12 individuals/lane) of an Illumina HiSeq 3000 platform with paired-end 200 bp sequencing.
RNA reads were trimmed for quality using Trimmomatic (v0.32; Bolger et al., 2014) and mapped to the oyster genome (Accession: GCA_002022765.4) using STAR (v.2.7.0; Dobin et al., 2013). Expression levels for each gene were quantified using RSEM (v1.3.2; Li and Dewey, 2011). Single sample gene count estimates were combined into count matrices (number of samples × number of genes) using a custom shell script (see Data Accessibility for additional script information), then filtered to remove genes that did not contain at least 1 count per million transcripts in at least 80% of individuals within at least one treatment-time experimental level. Expression data was then normalized using the “TMMwsp” method, transformed into log2 counts per million (log2-cpm), and sampled weighted in the R package “limma” (v3.40.6; Ritchie et al., 2015). See the Supplementary Method 4 for a more detailed description of this pipeline.
Statistical Analyses
All statistical analysis was performed in R (v3.6.0; R Core Team 2019), using the graphical user interface RStudio (v1.2.1335; R Studio Team 2018). See Data Accessibility for R scripts.
Extrapallial Fluid pH (pHEPF) and Calcification Response
We tested the hypothesis that C. virginica pHEPF was associated with OA by using a linear mixed model. The full model included the explanatory variables of treatment, time, and their interaction as categorical fixed effects, and tank (nested within block) and oyster collection site as random effects. We conducted two analyses, one for each of the following response variables: (1) the measured value of pHEPF and (2) pHEPF relative to treatment pHseawater [ΔpH = pHEPF - pHseawater; a metric used previously by Liu et al. (2020) as a better indicator of active pHEPF regulation]. Each model was performed in R using the lme4 package (v1.1-21; Bates et al., 2015). A step-down strategy using likelihood ratio tests (based on the degrees of freedom estimated using the Satterthwaite method) was implemented in lmerTest, following the principle of marginality to select the most parsimonious model (v3.1-0; Kuznetsova et al., 2017). To evaluate significant differences in EPF chemistry (both pHEPF and ΔpH) between the moderate and high OA treatments compared to the control treatment for each time point, post-hoc comparisons with a Tukey correction were performed using the multcomp package (v1.4-10; Hothorn et al., 2008). In addition, single sample t-tests were performed to test whether ΔpH was significantly different from 0 (i.e., pHEPF was significantly different than pHseawater) for oysters under each treatment at each time point. We corrected for testing multiple hypotheses using a Benjamini-Hochberg correction (Benjamini and Hochberg, 1995).
We examined the effect of pCO2 on long-term EPF response (both measured pHEPF and ΔpH) using linear mixed effect models. The full models included EPF response (pHEPF or ΔpH) as the response variable, treatment and time and their interaction as categorical fixed effects, and tank (nested within block) and oyster collection site as random effects. Only samples from day-50 and day 80 time points were included in the model in order to investigate long-term trends in EPF response. Model selection and post-hoc comparisons were performed using the approach described in the previous paragraph.
We tested the hypothesis that calcification rate was associated with OA or pHEPF using linear-mixed effect models. The full models included calcification rate as the response variable, either pHEPF or treatment as a fixed effect, and tank (nested in block) and collection site as random effects. Time was not included as a fixed effect because calcification rate of oysters was measured across a single time interval (day 0 to day 33 or day 34). Treatment was handled as a continuous variable and was calculated as the average pCO2 for each tank between days 0 and 33 or 34. Model selection was performed using the approach described in the first paragraph of this section. Regression analysis was used to examine the effect of either treatment or pHEPF on calcification rate.
Genome-Wide Molecular Response
To test the hypothesis that OA-induced changes in the transcriptome and methylome, we examined genome-wide gene expression and gene body DNA methylation using a principal components analysis (PCA) and PERMANOVA approach to visualize and test for differences amongst treatments and time points. The PERMANOVA was based on Manhattan distances and tested the null hypothesis of no effect of treatment, time, or their interaction on global gene expression and DNA methylation patterns using the R package vegan (v2.5-5; Dixon, 2003). To further investigate the stability of changes in genome-wide variation (gene expression or DNA methylation) induced by OA over time, we used a discriminant analysis of principal components (DAPC) performed with the R package adegenet (v2.1.2; Jombart et al., 2010). For our analysis DAPC was used to generate a discriminant function that maximally differentiated between treatment using samples from day 9, then we predicted where samples from day 80 would fall along this discriminant function to evaluate whether samples exhibited similar patterns of molecular differentiation across time. This allowed us to evaluate if changes that differentiated molecular variation among treatments at day 9 were similarly differentiated at day 80 (i.e., stable through time). See the Supplementary Method 5 for additional information on specific parameters used for the PERMANOVA and DAPC analyses.
Next, we further examined the hypothesis that OA induced changes in global DNA methylation by using a linear model to look at the effect of treatment, time, and feature (i.e., exon, intron, and intergenic region) on global methylation. Global methylation in this case was summarized as the median methylation across all CpGs within a feature for each sample.
Differential Molecular Response
The hypothesis that individual genes within the transcriptome were sensitive to OA was tested via differential gene expression analysis performed using a generalized linear model approach implemented in the R package limma (v3.40.6; Ritchie et al., 2015), using treatment, time, and their interaction as fixed effects. Site was not considered in this analysis given that it did not have a significant effect on either the phenotypic or genome-wide responses. Genes with FDR ≤ 0.05 and absolute value of log2 fold ≥ 2 were considered differentially expressed.
We tested the hypothesis that OA induced changes in DNA methylation at individual CpGs (differentially methylated loci or DML) by performing a logistic regression using treatment as a fixed effect and time as a covariate implemented in the R package methylKit (v1.10.0; Akalin et al., 2012) using the default “slim” method to correct P-values. We also performed additional logistic regressions separately for each time point including treatment as a fixed effect. Only CpGs with coverage ≥5 for all samples were considered. Loci that had differential methylation of at least 50% between groups being compared and a q-value of <0.01 were considered significant. See the Supplementary Method 6 for additional information on the differential methylation and gene expression analyses.
Gene Co-expression Network Analysis
Clustering genes with similar levels of expression among individuals can help identify groups of genes that may be operating together, such as genes located within the same pathway. The response of these clusters to stress or stimulus can then be evaluated, which can potentially lead to the detection of transcriptomic responses that might otherwise be too subtle to be detected by standard gene-level differential expression analysis. We used a weight gene co-expression network analysis implemented in the R package WGCNA (v1.68; Langfelder and Horvath, 2008) to identify and cluster genes that co-express among individual oysters in order to reexamine the hypothesis that OA induced changes in gene expression and specifically evaluate whether particular clusters of genes respond to OA. We also used these gene clusters to evaluate the hypotheses that OA-induced changes in gene expression are (i) associated with shifts in DNA methylation and (ii) associated with regulation of the pHEPF. In brief, we followed a standard WGCNA pipeline which identified clusters of genes, termed modules, based on their level of dissimilarity among all individuals (regardless of treatment or time point) using the “Ward.D2” method for clustering (Murtagh and Legendre, 2014). Expression of each module for each individual was estimated as the eigenvalue (i.e., the first principal component value for each individual) from a PCA of an expression matrix generated from all genes included in the module for each individual. Similarly, DNA methylation was averaged for all CpGs located within genes included in a module to generate a single methylation value per individual. Linear regressions were used to identify gene expression modules that were significantly associated with EPF response (i.e., ΔpH) and to test whether the expression of these modules was also associated with gene body methylation. See Supplementary Method 7 for additional details on the steps used in the WGCNA analysis and follow-up statistical analyses.
Functional Enrichment Analysis
As part of the hypothesis that OA induces changes in both gene expression and DNA methylation, we performed a functional enrichment test to investigate whether particular gene ontology (GO) categories were enriched in OA-induced molecular responses (either in gene expression or methylation) using GO-MWU, a rank-based gene enrichment method developed by Wright et al. (2015). We performed this analysis separately for each time point using the log2-fold change in gene expression and the difference in mean methylation among treatments. Mean methylation was calculated as the mean among all CpG loci within a gene across all individuals within a particular treatment and time point. Only genes with at least 5 CpG loci were considered for the analysis to ensure mean methylation estimates were based on genes with at least moderate CpGs coverage. We also used this analysis to determine if gene modules that were significantly associated with EPF (as determined in the previous section) were enriched in particular GO categories based on the module membership values for each gene within the module. These scores represent a measure of strength for each gene's membership to that module and are used here to determine if particular GO categories are enriched in each module. This analysis was run separately for GO categories associated with molecular function, biological process, and cellular components. A 10% FDR correction (GO-MWU default) was used to adjust for multiple comparisons. See Supplementary Method 8 for additional details on the GO-MWU analysis.
Gene-Level Characterization of Gene Expression and DNA Methylation
The hypothesis that DNA methylation correlates gene expression was tested using a PCA-based approach (described in Gavery and Roberts, 2013) to examine the relationship between gene expression, DNA methylation, and gene attributes (e.g., gene length and number of exons). The following variables were used in the input matrix for the PCA: mean gene expression over all treatments (mean log2-cpm values); the coefficient of variation (CV) in gene expression among treatment means; mean DNA methylation level over all treatments; the DNA methylation CV among treatment means, gene length, exon number per gene; and the number of CpGs per gene (scripts for generating each variable within the matrix are available on the github repository). Gene attributes were normalized by log transformation.
Results
Experimental Seawater Chemistry
After a 33-day acclimation period (pCO2 547.3 ± 20.2 ppm), tanks were incrementally adjusted to the target pCO2 of the three experimental treatments (mean ± SEM, control: pCO2 579.1 ± 16.5 ppm, moderate OA: pCO2 1050.4 ± 47.5 ppm, high OA: pCO2 2728.6 ± 128.0 ppm, Supplementary Table 1.1).
Extrapallial Fluid Chemistry and Calcification Response
We tested the hypothesis that C. virginica pHEPF was associated with OA using a linear model that included both fixed effects (treatment and time), their interaction, and the random effect of tank nested within block. There was a significant effect of treatment (F2,14.783=5.8206; P = 0.0137) and the interaction between time and treatment (F10,74.002=2.412; P = 0.0153) on pHEPF evaluated across all 6 time points. Post-hoc tests revealed a significant decrease in pHEPF within the high OA treatment compared to the control condition at the onset of the exposure (48 h), no difference on days 9–22, and a significant decrease on the final two time points (days 50 and 80; Figure 1A).
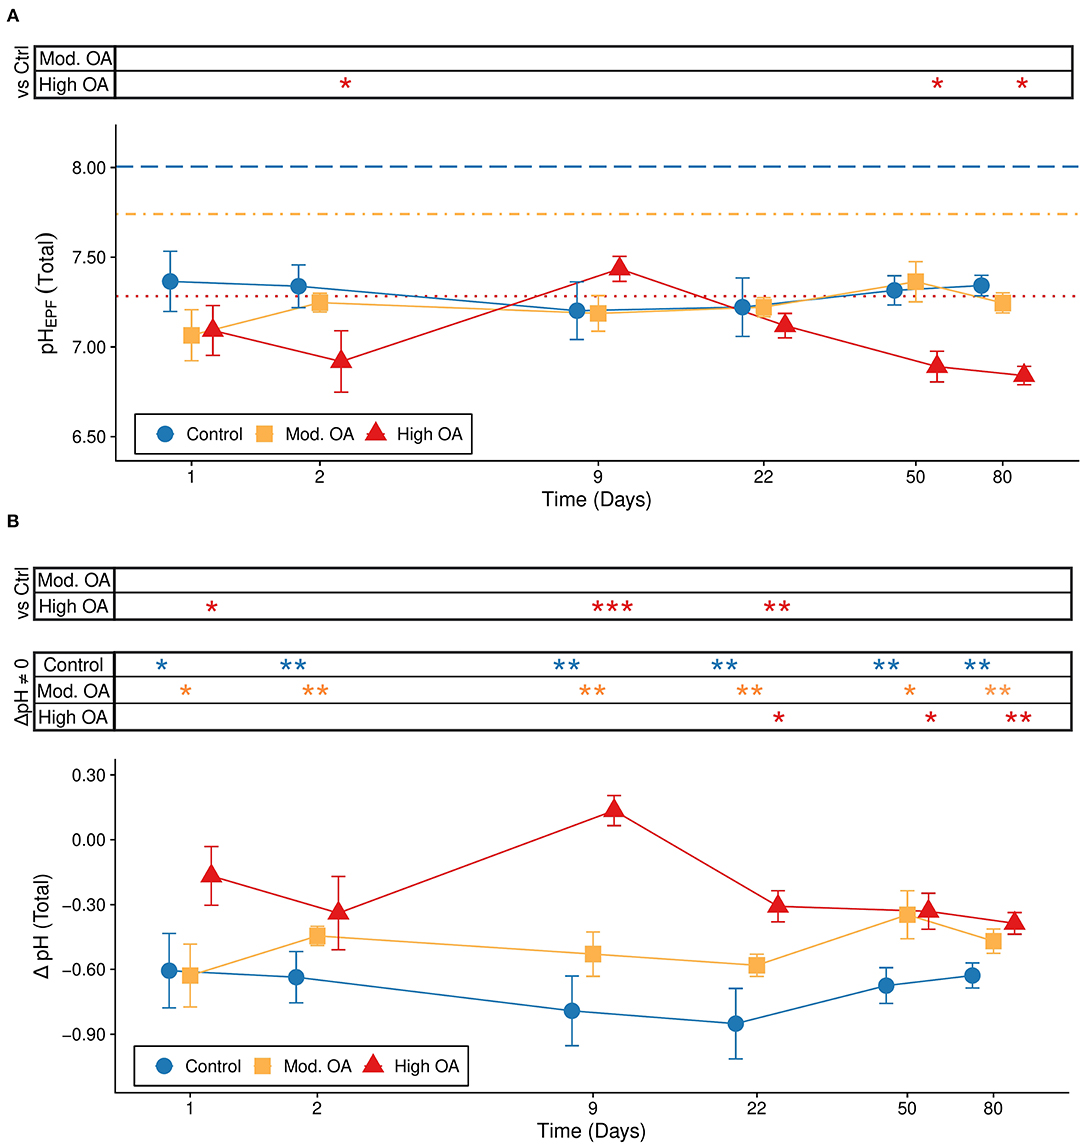
Figure 1. Extrapallial fluid pH over the 80 day experiment. (A) pHEPF (total scale) and (B) ΔpH (pHEPF – pHseawater) across time with standard error bars. (A) Colored lines represent each treatment level averaged over the duration of the exposure (dashed: control, dot-dashed: moderate OA, dotted: high OA) and symbols at the top of the graph indicate if the pHEPF in one of the OA treatments (“Mod. OA”, 1,000 μatm; “High OA”, 2,800 μatm) was significantly different from the pHEPF in the control treatment (“Control”, 580 μatm) for each time point (e.g., H0: Control pHEPF = High OA pHEPF). (B) Symbols at the top of the graph indicate significant post hoc tests. The “vs. Ctrl” comparisons indicate time points where ΔpH in one or both of the OA treatments was significantly different from the ΔpH in the control treatment (e.g., H0: Control ΔpH = High OA ΔpH), while “ΔpH ≠ 0” comparisons indicate time points where ΔpH in one of the treatments was significantly different from 0 (e.g., H0: Control ΔpH = 0). The latter comparison is equivalent to evaluating whether pHEPF of a particular treatment is significantly different from its respective pHseawater. Statistical significance is denoted by asterisks (***P < 0.001, **P < 0.01, *P < 0.05). Time points are presented on a non-linear scale and treatment points within time points were staggered along the x-axis to improve visualization.
A slightly different result was found when we examined ΔpH (pHEPF - pHseawater) using a model that included both fixed effects (treatment and time), their interaction, and the random effect of tank nested within block. Both treatment (F2,14.818=18.9487; P = 0.0001) and the interaction between treatment and time (F10,74.036=2.0117; P = 0.0439) were significant, while the independent effect of time (F5,74.050 = 0.935; P = 0.4637) was not significant (Figure 1B). Post-hoc comparisons between the control treatment and each OA treatment revealed a significant increase in ΔpH under the high OA treatment relative to the control treatment at the onset of the exposure (9–22 days, Figure 1B, “Trt”). By days 50 and 80, ΔpH was no longer statistically different amongst treatments, although mean ΔpH in both OA treatments were higher than ΔpH in the control. One-tailed t-tests showed that ΔpH of oysters in all treatments was significantly lower than 0 (i.e., the pHEPF was more acidic than the pHseawater) at almost all time points of the experiment (Figure 1B, “Env”), indicating a strong tendency for oysters to maintain a more acidic EPF fluid relative to their environment. The exception to the trend was the high OA treatment at day 9, where pHEPF was not significantly lower than pHseawater (Figure 1B).
We examined the long-term pHEPF and ΔpH responses (i.e., conditions on days 50 and 80) using a model that included treatment as a fixed effect. Treatment was a significant predictor of both pHEPF (F2,29 = 22.438, P < 0.0001) and ΔpH (F2,29= 7.982, P = 0.0018; Figures 2A,B). The post-hoc tests revealed a significant decrease in pHEPF in the high OA treatment relative to both the control and moderate OA treatments, and showed an increase in ΔpH in the two OA treatments relative to ΔpH in the control.
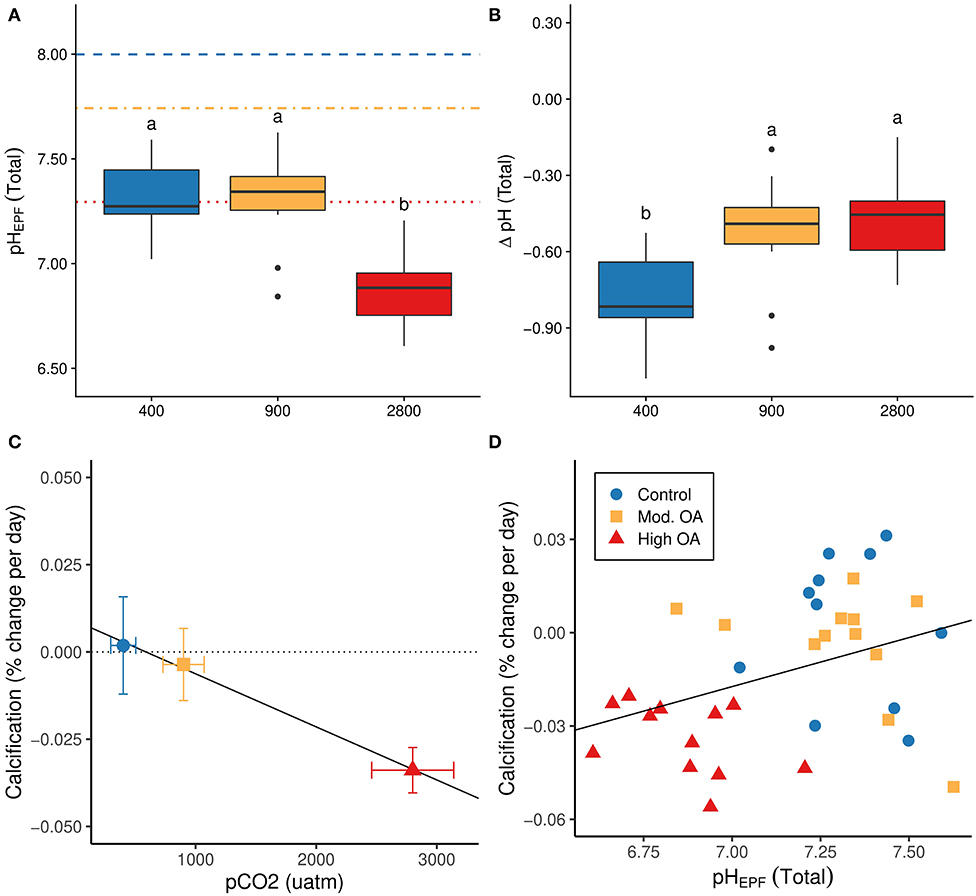
Figure 2. Long term trends in pHEPF, ΔpH, and calcification. (A) Long-term average pHEPF (total scale) by treatment; horizontal lines indicate mean seawater pH for the three treatments (dashed: control, dot-dashed: moderate OA, dotted: high OA). (B) Long-term average ΔpH (pHEPF – pHseawater; total scale) by treatment. (C) Percent daily calcification rate (%-change in shell mass/day) by treatment (slope = −1.751e-05, P < 0.0001, R2 = 0.409), dotted line indicates calcification rate of zero percent and solid black line represents fitted regression. (D) Calcification rate vs. pHEPF (slope = 0.032, P = 0.028, R2 = 0.112); solid black line represents fitted regression. pHEPF measured on day 50 or 80 (n = 35). Letters on first two panels (A,B) represent levels of significance based on post hoc testing, while bars on (C) represent standard errors.
Lastly, we found that calcification rate decreased in response to OA (R2 = 0.409, P = < 0.0001), which was driven largely by the substantial decline in calcification rate between the moderate and high OA treatments (Figure 2C). The decline in calcification rate was also associated with a significant decrease in pHEPF (R2 = 0.112, P = 0.028, Figure 2D).
DNA Methylation Responses to OA
Approximately 1.4 billion paired-end 80 bp reads of MBD-enriched, bisulfite treated DNA were obtained across the all sequenced samples (NCBI BioProject ID: PRJNA594029, see Supplementary Table 3.1 for sequence coverage details). A total of 622.4 million quality filtered reads mapped to the C. virginica genome (88.3% of all CpGs in the genome, Supplementary Table 3.2). A single individual within the control treatment on day 9 was removed from downstream analysis due to poor sequencing depth and a high rate of gene duplication error after mapping (ntissue = 23). After filtering, we retained 403,976 CpGs with at least 5x coverage for each of the remaining 23 samples (Supplementary Table 3.2). Of the CpGs with at least 5x coverage, 94.1% were located within gene bodies, with 59.9% CpGs located in exons among 27,932 genes (Figure 3A; “CpGs5”). CpGs with a minimum of 5x coverage in each sample were used for the downstream analyses.
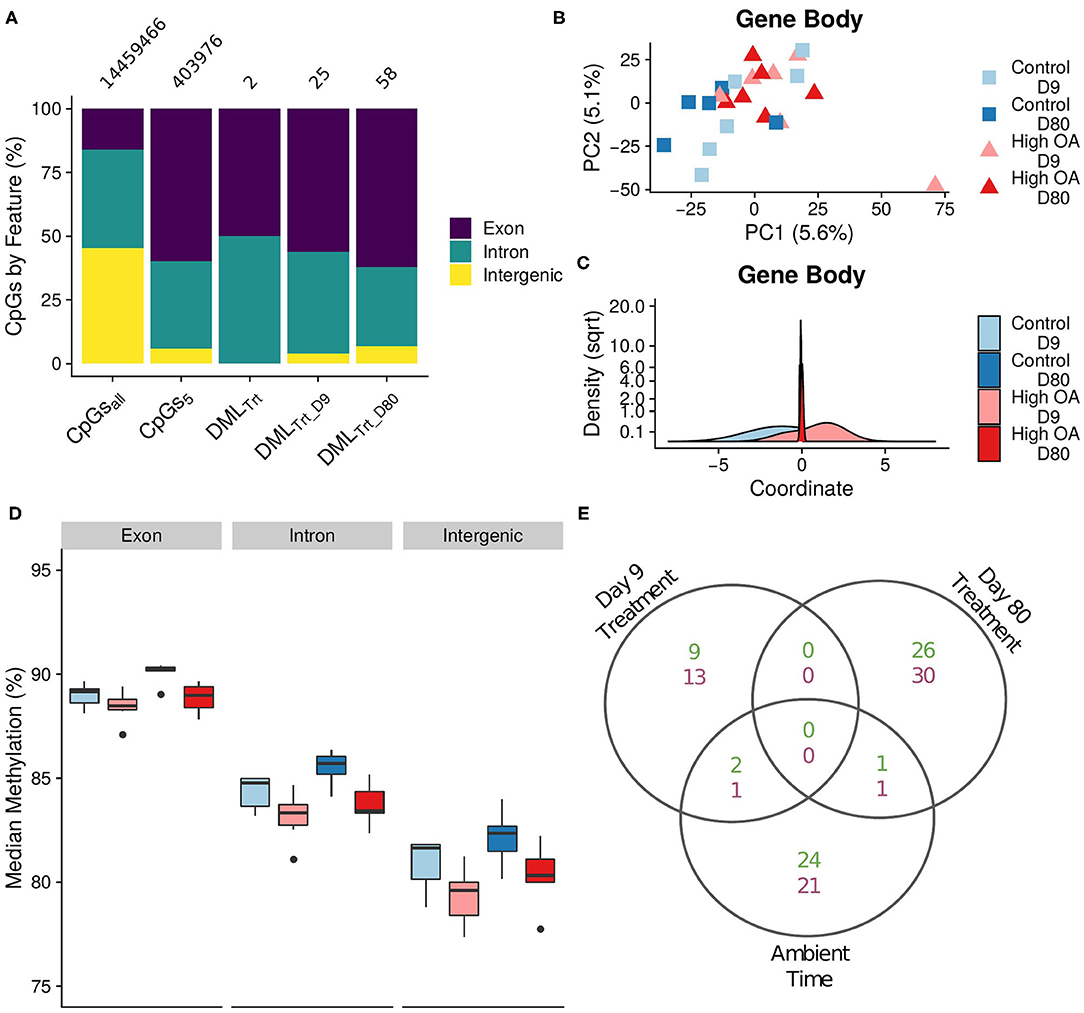
Figure 3. DNA methylation responses to OA. (A) Proportion of CpGs by feature across data subsets. CpGsall: all CpGs in genome; CpGs5: CpGs with at least 5X coverage for each individual; DMLTrt: differentially methylated loci (DMLs) between control and OA treatments across both time points; DMLTrt_09 and DMLTrt_80: DMLs between treatments on day 9 and 80, respectively. Numbers above the bars represent the total number of CpGs for each group. (B) Boxplot of median global methylation for each sample by genome feature (PTrt < 0.0001, PTime = 0.001, PFeature < 0.0001). (C) Plot of the first two principal components from a principal components analysis (PTrt = 0.027, PTime = 0.235, PTimexTrt = 0.364), and (D) density plot of the discriminant values from a DAPC based on gene body methylation (exons and introns). Discriminant values were determined by a function that maximally discriminates between treatment using samples from day 9, then the discriminant value for each sample from day 80 was predicted using the same discriminant function. (E) Venn diagram of DMLs among treatments for each day (Day 9 Treatment and Day 80 Treatment) and among time points in the control treatment (Control Time). Overlapping regions indicate DMLs shared among comparisons. Hypermethylated DMLs in green (top number), hypomethylated DMLs in purple (bottom number).
We used a PERMANOVA to test the hypothesis that OA induced changes in genome-wide gene body methylation. We found significant differences in global methylation due to treatment (Adonis PTrt = 0.027), but not due to time (Adonis PTime = 0.235) or the interaction between treatment and time (Adonis PTimexTrt = 0.364; Figure 3B). This was supported by the DAPC, which found gene body methylation that was differentiated at day 9 was not maintained at day 80 (Figure 3C). Moreover, global median methylation was significantly lower in the high OA treatment compared with the control treatment (hypomethylation, Figure 3D, PTrt < 0.0001), but significantly increased through time (hypermethylation, PTime = 0.001). However, this increase through time only led to a 1–5% shift in methylation when averaged over all loci in the genome. Feature had the greatest effect on global median methylation (PFeature < 0.0001), with exons exhibiting the highest levels of methylation.
The hypothesis that OA induced changes in the DNA methylation of specific CpGs was evaluated using a logistic regression approach implemented in methylKit. The initial model contained all samples and included treatment as the main effect and time as a covariate (Figure 3A; “DMLTrt”). Only 2 CpGs were found to be differentially methylated by treatment, both located in gene bodies. Next, we looked at each time point separately including only treatment as the main effect (Figure 3A; day 9—“DMLTrt_D09;” day 80—“DMLTrt_D80”). This led to the additional discovery of 83 DMLs by treatment (25 DML on day 9 and 58 DML on day 80; Figure 3A). An additional 50 DML were significant through time in the control treatment, although there was little overlap between these DML and those responding to OA (Figure 3E). Additionally, we saw no overlap of specific DML by treatment among days (Figure 3E), further illustrating that the loci induced by OA shifted through time as indicated by the DAPC (Figure 3C).
Of the 85 DML there was little functional overlap among DML at each time point, with the exception of several genes associated with the THO complex, a nuclear structure composed of multiple proteins involved in transcription elongation and mRNA maturation (Supplementary Table 3.3). On day 80, we found DML in several biomineralization and/or stress response related genes, including cadherin, protein ubiquitination, and death effector domain-containing genes. Two GO categories were enriched in hypomethylated CpGs, the cellular component “amidotransferase complex” on day 9 and the biological process “biosynthetic process” on day 80 (Table 1). No categories were shared among time points.
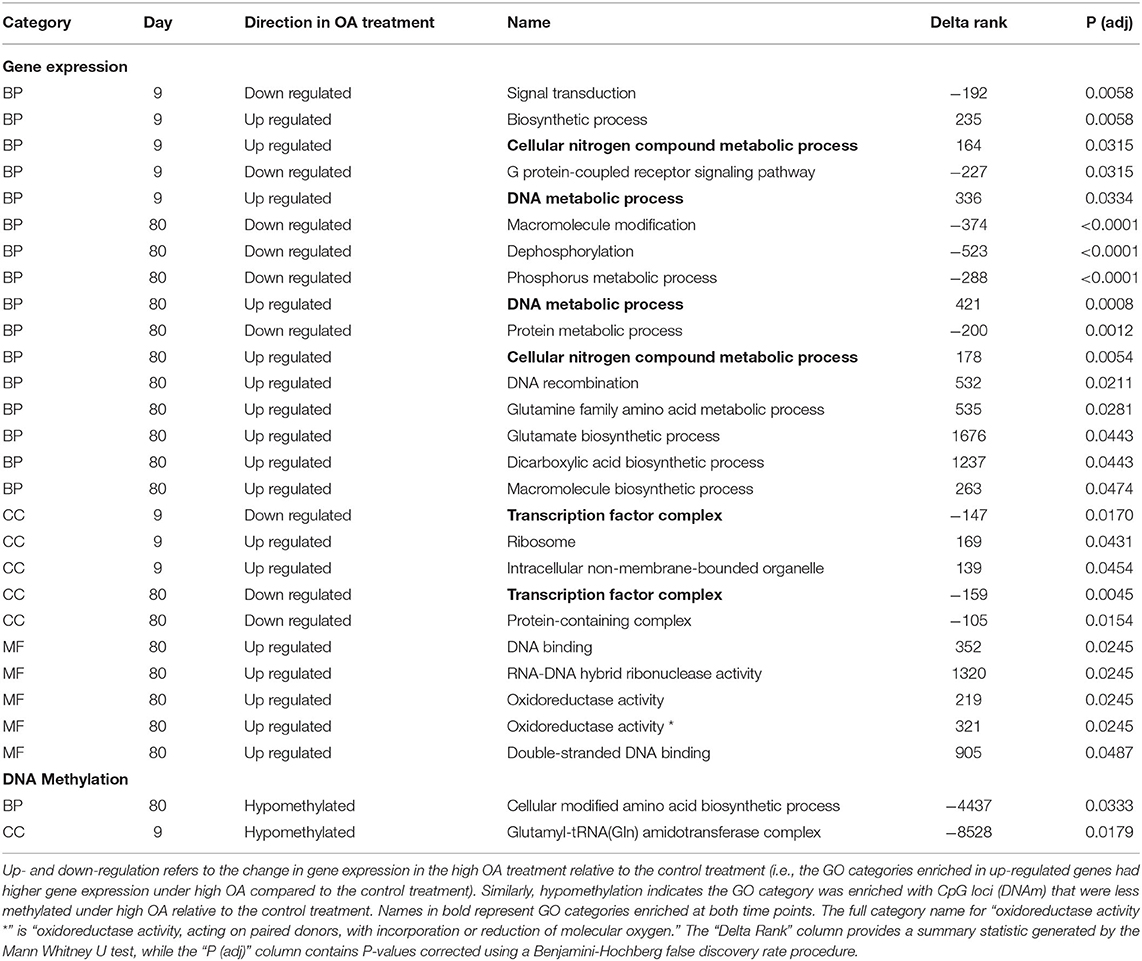
Table 1. Gene ontology (GO) categories enriched in differentially responsive genes by treatment, summarized by molecular function (MF), biological process (BP), and cellular component (CC).
Gene Expression Responses to OA
RNA sequencing yielded a total of 955 million paired-end reads (NCBI BioProject ID: PRJNA594029) from all sequenced samples (see Supplementary Table 4.1 for read coverage and mapping details). Reads mapped to 37,098 genes, of which 20,387 remained after filtering (Supplementary Table 4.2). An exploratory PCA highlighted a single individual in the day 80 control treatment as an outlier compared to all other samples, which was subsequently removed from downstream analysis (ntissue = 23).
The hypothesis that OA induced changes in genome-wide gene expression was evaluated with PERMANOVA. We found that treatment (R2 = 0.051, Adonis P = 0.037) and time (R2 = 0.067, Adonis P = < 0.001), but not their interaction (Adonis P = 0.214), had a subtle but statistically significant impact on genome-wide gene expression (Figure 4A). The DAPC showed that the global patterns of gene expression that differentiated the two treatments at day 9 were not maintained at day 80, with the strongest directional change along the discriminant function in the day 80 samples occurring in the high OA treatment (Figure 4B).
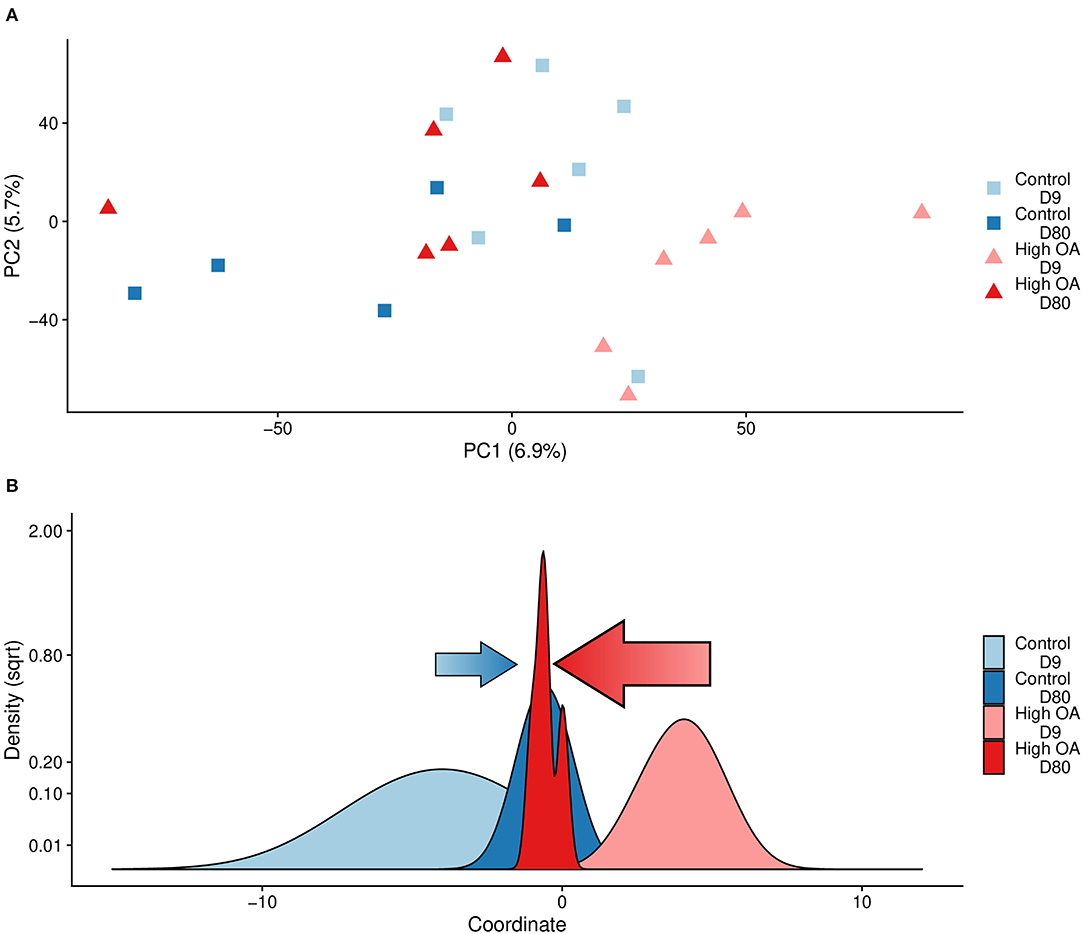
Figure 4. Global transcriptomic responses to OA. (A) Plot of the first two principal components from a principal components analysis (PTrt = 0.037, PTime < 0.001, PTimexTrt = 0.214). (B) Density plot of the discriminant values from a DAPC. Discriminant values were determined by using the DAPC package to estimate a function that maximally discriminates between treatment using samples from day 9, then the discriminant value for each sample from day 80 was predicted using the same discriminant function. Arrows indicate direction and degree of movement of expression patterns for control (blue) or OA (red) treatments along the discriminant function from day 9 to day 80. Both plots are based on log2-cpm gene expression.
We also tested the prediction that the transcriptome in oysters is sensitive to OA by looking at the response of individual genes using differential expression analysis. Interestingly, no individual genes were significantly differentially expressed between treatments, including a number of genes known from the literature to be associated with biomineralization (Supplementary Table 4.3; Supplementary Figure 4.1). However, biomineralization-associated genes tended to be overexpressed relative to the mean expression level for all genes in both control and OA treatments (Supplementary Figure 4.2), which suggests that their activity is elevated within the mantle tissue.
We also tested whether OA induced changes in particular GO categories using a GO enrichment analysis implemented in GO-MWU. Several GO categories were found to be enriched in genes both up- and down-regulated within the high OA treatment relative to the control treatment (Table 1), but few GO categories appeared to be shared among time points. The exceptions were two categories enriched in genes up-regulated (“DNA metabolic process” and “cellular nitrogen metabolic processes”) and one enriched in genes down-regulated (“transcription factor complex”) in the high OA treatment. Overall, more GO categories were enriched on day 80, including several metabolism and biosynthesis related biological processes. Several GO categories associated with oxidoreductase activity were also up-regulated on day 80.
Investigating Associations Between DNA Methylation, Gene Expression, and pHEPF
The following comparative analyses (next two sections) were performed using samples where gene expression and DNA methylation data overlapped (ntissue = 22). Only genes with at least 20% coverage of all CpGs were included in the analyses, which represents a reasonable trade-off between maximizing the number of retained genes in the analyses while removing genes with limited or no DNA methylation data (Supplementary Figure 3.1).
Associations Between DNA Methylation and Gene Expression
To test the hypothesis that DNA methylation is correlated with gene expression, we used a PCA that included measures of DNA methylation, gene expression, and other gene attributes. We found the first three PC axes explained >85% of the variance in the data (Figures 5A,B). PC1 was dominated by gene features, including a negative association with the length of the gene (PC axis loading, percent contribution to PC axis; gene_length: −0.504, 27%), the number of exons (exon: −0.454, 22%), the number of CpGs (totalCpG: −0.484, 25%). PC2 was loaded positively by mean methylation (−0.636, 40%), and negatively by methylation variation among treatments (Methylation_CV: 0.588, 33%), suggesting a negative relationship between percent methylation and the amount of variation in methylation among treatments. Finally, PC3 was dominated by gene expression (0.482, 23%), variation in expression among individuals (Gene_Expression_CV: −0.672, 46%), and methylation variation among treatments (Methylation_CV: 0.376, 15%), indicating a positive relationship between variation in methylation and gene expression and a negative relationship between gene expression and gene expression variation. Importantly, these patterns were robust even under increasingly stringent DNA methylation coverage scenarios (Supplementary Figures 3.2, 3.3). Finally, simple linear regression found that gene expression exhibited a significant positive relationship with gene body methylation (R2 = 0.0624, P < 0.0001; Figure 5C), while the variation in expression had a significant negative relationship with gene body methylation (R2 = 0.0658, P < 0.0001; Figure 5D).
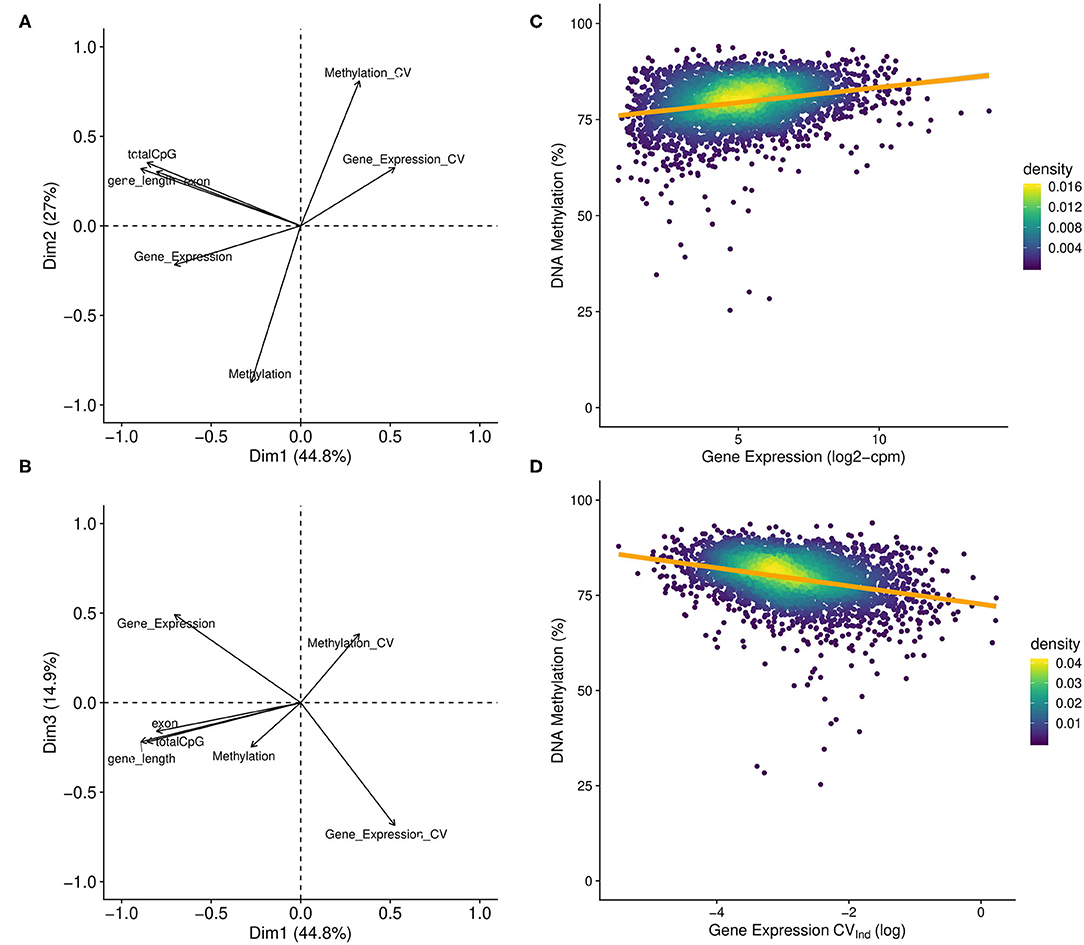
Figure 5. DNA methylation and gene expression correlations. (A) First two principal components and (B) the first and third components from a principle component analysis that included gene level summary variables for various attributes, expression, and methylation. Variable loadings plotted as arrows, with the length of the arrow corresponding to the relative contribution to PC variance. Significant loadings on the first two PCs included: mean methylation level (Methylation), the coefficient of variance of mean methylation levels among treatments (Methylation_CV), gene expression (Gene_Expression), the number of exons (exon), the number of CpG dinucleotides (totalCpGs), and the gene length in base pairs (gene_length). The CV of gene expression (Expression_CV) was not significant for the first two PCs but was the primary contributor to the third PC (see Supplementary Material S3.3) (C,D). Plot of gene level DNA methylation against either (C) gene expression or the (D) gene expression CV among individuals based samples collected in the control treatment at day 9 (Gene Expression – R2 = 0.0624, P < 0.0001; Gene Expression CVInd – R2 = 0.0658, P < 0.0001). Only genes with coverage for at least 20% of all CpGs within the gene were included (n = 3,604).
OA-Induced Shifts in DNA Methylation, Gene Expression, and pHEPF
We tested the hypothesis that shifts in DNA methylation were associated with OA-induced changes in gene expression using regression analysis, with log2-fold change in gene expression as the response variable and the percent change in mean gene methylation (i.e., average DNA methylation for all CpGs with coverage in a gene) as a fixed effect. We found there was a significant positive effect of gene methylation changes, but the slope was very small and <2% of the variance in the log2-fold change in gene expression was explained by gene methylation changes (day 9—slope = 0.0121, P < 0.0001, R2 < 0.012; day 80—slope = 0.0137, P < 0.0001, R2 = 0.014; Figure 6A). This indicates that there was a weak but statistically significant relationship between DNA methylation and gene expression.
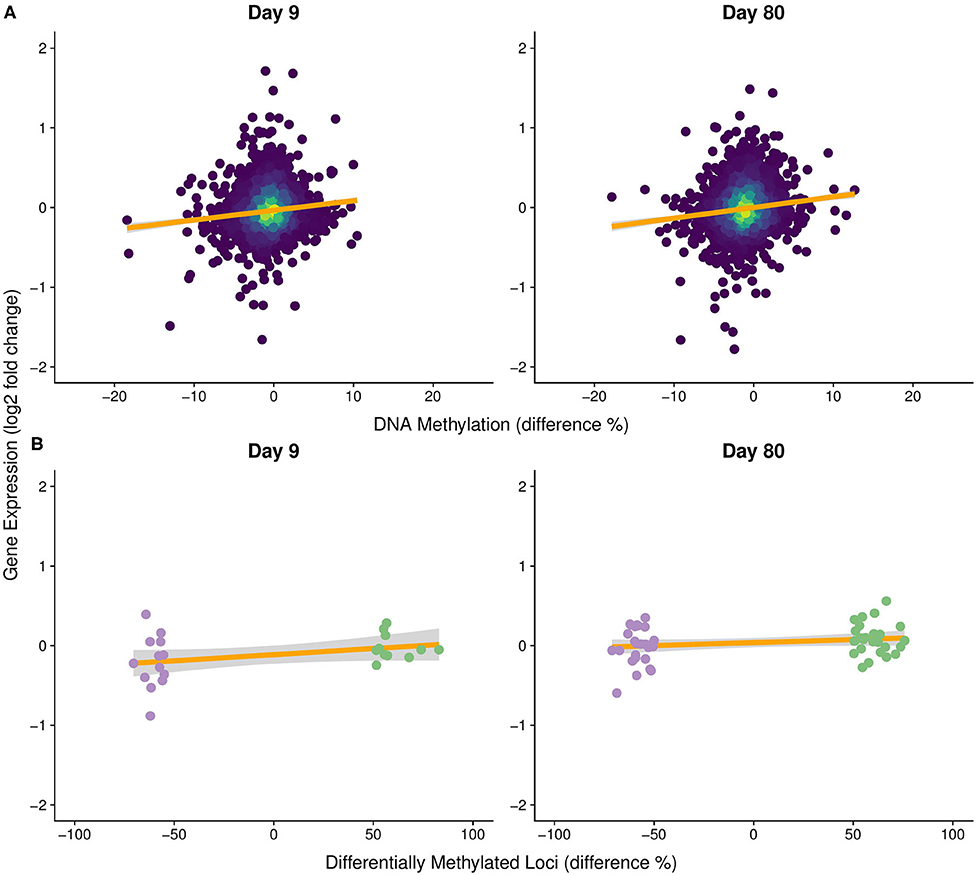
Figure 6. Gene expression change in response to OA as a function of DNA methylation change. Log2-fold change in gene expression compared to % difference in (A) mean gene methylation among treatments (Day 9 – slope = 0.0121, P < 0.0001, R2 = 0.012; Day 80 – slope = 0.0137, P < 0.0001, R2 = 0.014) and (B) significantly differentially methylated loci (DML) among treatments (Day 9 – slope = 0.0005, P = 0.0005, R2 = 0.406; Day 80 – slope = 0.00054, P = 0.0004, R2 = 0.276). Orange line represents the fitted linear model. Colors in (B) correspond to DMLs that were significantly hyper- (green) and hypomethylated (purple) in the OA treatment.
This weak relationship may have resulted from averaging methylation within each gene body, so regression analysis was used to examine the relationship between the change in methylation for each DML and the log2-fold change in expression of each corresponding gene. While we found a positive association between DML and corresponding log2-fold change in gene expression that explained a higher percent of the variation, the slope was substantially lower (slopeDay9 = 0.0005, slopeDay80 = 0.00054, PDay9 = 0.0005, PDay80 = 0.0004, = 0.406, = 0.276; Figure 6B) than in the previous gene-level methylation analysis. Thus, both analyses indicate that differential methylation had a substantially small effect on differential gene expression.
Gene co-expression network analysis identified 52 modules of co-expressed genes (i.e., genes that shared similar expression patterns among all 22 individuals) ranging from 36 to 5,059 genes in size (Supplementary Table 5.1). We used these modules to test the hypotheses that (i) pHEPF is associated with the expression of specific gene modules, (ii) the expression of these pHEPF-associated modules is also associated with DNA methylation, and (iii) that DNA methylation within these modules is sensitive to OA. Of the 52 modules, the eigengene expression of four modules was significantly associated with ΔpH (excluding one module that was driven by a single individual outlier; Figure 7A). We did not see a significant association between the eigengene expression of any of these four modules and mean gene body DNA methylation (Figure 7B). Although, mean gene body DNA methylation within these modules was significantly associated with treatment in three of the four modules, but not time or the interaction of treatment and time (Figure 7C). These modules were composed of a diverse collection of genes that were not significantly enriched in specific GO categories. There was, however, evidence of genes involved in pH regulation, ion transport, and other biomineralization-related processes included within the modules (Supplementary Table 5.1).
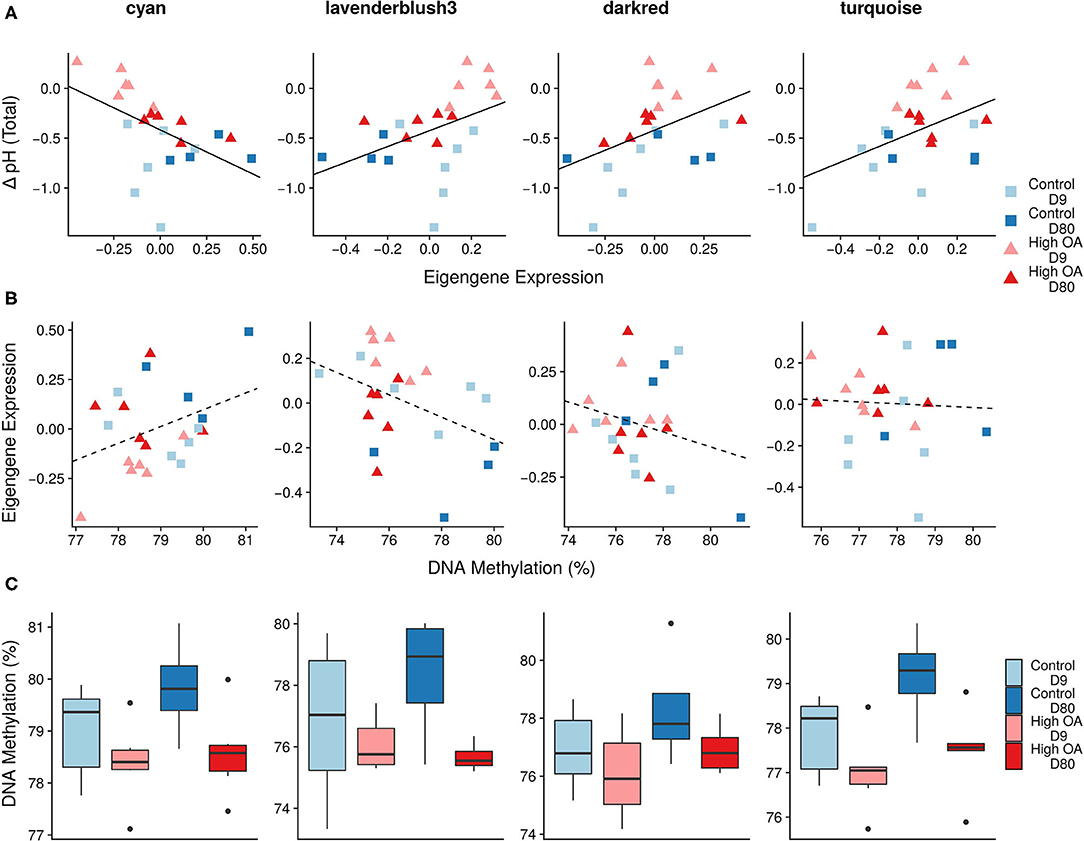
Figure 7. Co-expression and DNA methylation responses to OA. Four of the top five modules associated with oyster ΔpH (colors are randomly assigned by the WGCNA package and have no meaning). Scatterplots of (A) ΔpH by eigengene expression (Pcyan = 0.021, Plavenderblush3 = 0.044, Pdarkred = 0.037, Pturquoise = 0.042), (B) eigengene expression by mean module methylation (Pcyan = 0.087, Plavenderblush3 = 0.052, Pdarkred = 0.264, Pturquoise = 0.833), and boxplot of (C) mean module methylation by treatment and time point. For (C) there was a significant effect of treatment in three of the four modules (Pcyan = 0.035, Plavenderblush3 = 0.038, Pdarkred = 0.123, Pturquoise = 0.013), but neither time point or their interaction was significant for any of the modules. Mean module methylation was calculated as the mean methylation for all CpGs for each gene within a module. Solid lines indicate a significant relationship between explanatory (x-axis) and response variable (y-axis) using a linear model, while dotted lines indicate non-significant trends among variables.
Discussion
We conducted an integrative analysis of physiological, transcriptomic, and methylomic data in the mantle-edge tissue of eastern oysters exposed to a range of pCO2 conditions to elucidate the oyster's capacity to regulate pHEPF in response to OA and examine the molecular underpinnings of this response. At the physiological level, oysters maintained a pHEPF significantly lower than pHseawater in our control treatments, which is consistent with what has been shown previously in oysters and other species of bivalves (e.g., Crenshaw, 1972; Cameron et al., 2019). This trend was also seen in the OA treatments at most time points, the exception being exposure day 9 in the high OA treatment where oysters maintained pHEPF near pHseawater. On day 9 and 22 of the exposure, oysters in the high OA treatment also maintained a ΔpH significantly higher than ΔpH in the control, which resulted in a non-significant difference in the pHEPF between the high OA and control treatment on those days.
At a molecular level, C. virginica exhibited a subtle genome-wide response in both the methylome and transcriptome to OA, but surprisingly little response in individual gene expression or methylation. When genes were clustered, we found evidence of a significant association between gene clusters and ΔpH, suggesting subtle shifts in these genes could be responsible for regulating pHEPF in response to OA. However, gene body methylation within these gene clusters was not associated with gene expression, indicating that DNA methylation did not have a significant role in gene regulation. Below, we evaluate the short and long-term effects of OA on both phenotypic and molecular response, examine how these results link together and relate to the current model of EPF fluid regulation, and discuss possible explanations for the surprisingly subtle shifts in both the transcriptome and methylome.
pHEPF Response Through Time
Crassostrea virginica, like other coastal calcifiers, are experiencing OA due to a combination of local (Wallace et al., 2014) and global change-associated processes (e.g., Orr et al., 2005). In particular, local processes, such as excessive nutrient loading (Wallace et al., 2014), input from acidic river water (Salisbury et al., 2008), and upwelling of CO2 rich groundwater (Feely et al., 2008), are exposing oysters to more intense short-term acidification events well before global, anthropogenic CO2-induced acidification is predicted to impact these systems. Consistent with these findings, water chemistry data from our collection sites found substantial variation in pCO2, including intervals of acidification near the high OA scenario employed in the present study. Despite the apparent frequency of these short-term acidification events, few studies have examined the response of adult oysters to such high levels of OA (i.e. the high OA treatment in present study), relative to the lower levels of OA-associated with increasing anthropogenic pCO2 (i.e. the moderate OA treatment in present study).
Bivalve response to OA has received considerable attention over the past two decades (see review Gazeau et al., 2013), with a substantial focus on measuring calcification (Miller et al., 2009; Talmage and Gobler, 2009; Waldbusser et al., 2011a) and physiological responses (Beniash et al., 2010; Ivanina et al., 2013; Matoo et al., 2013; Gobler and Talmage, 2014) in C. virginica. Recent research has shown that bivalves can isolate and moderate the fluid at the site of calcification, and elevate the pH of this fluid relative to seawater under OA conditions (Cameron et al., 2019; Liu et al., 2020). It has been hypothesized that this may be a strategy for maintaining calcification even under increasingly acidic conditions. However, the degree to which a species can moderate its calcifying fluid pH under OA scenarios varies across taxa (e.g., McCulloch et al., 2012; Holcomb et al., 2014; Liu et al., 2020), life stage (e.g., Ramesh et al., 2017), and temperature (e.g., Cameron et al., 2019). Previous work with C. virginica found that they exhibited a moderate ability to regulate their pHEPF after an extended 60-day experimental exposure, elevating their pHEPF above pHseawater under most OA scenarios (Liu et al., 2020).
We predicted that similar to this previous study, C. virginica would increase its pHEPF relative to pHseawater in response to OA. Consistent with our prediction and with previous studies on C. virginica (Liu et al., 2020) and adult King scallops Pectens maximus (Cameron et al., 2019), we observed an increase in ΔpH under OA conditions. However, pHEPF remained below pHseawater at most time points under the different treatments, which is inconsistent with the prior work on C. virginica (Liu et al., 2020) and P. maximus (Cameron et al., 2019). One possible explanation for the lower pHEPF and ΔpH in the present study compared with Liu et al. (2020) was the choice of experimental temperatures (~18–19°C in the present study vs. 25°C in the other study), which has been shown in P. maximus to impact the relationship between pCO2 and pHEPF (Cameron et al., 2019). The lower pHEPF in the present study may also reflect increased respiration of CO2 into the EPF, potentially driven by increased metabolic activity and/or rates of feeding (Crenshaw, 1972; Sutton et al., 2018; Cameron et al., 2019). Comparing among treatments, we found that ΔpH was significantly higher in our high OA treatments relative to the control at days 9 and 22, indicating that OA prompted a response in pHEPF. This short-term response could be the result of stress-induced metabolic depression or increased removal of hydrogen ions from the EPF via proton transporters or other ion regulators. Moreover, the short-term elevation of ΔpH in OA treatments was not sufficient to prevent net shell loss (i.e., net dissolution) after 35 days of exposure. However, a prior study on C. virginica suggests that gross calcification does occur under comparably high OA conditions, despite net shell loss (Ries et al., 2016). Future studies that specifically consider the deposition rate of calcium carbonate and the impact of the interaction between temperature and OA on the regulation of EPF chemistry in C. virginica and other bivalves will offer substantial insight into the importance of EPF regulation on this species' calcification response to OA.
Biomineralization Response
Recent studies have begun to clarify the role of particular genes, pathways, and associated molecular mechanisms in the biomineralization process, and their responsiveness to OA across a diverse group of marine calcifiers (see review by Clark, 2020). In bivalves, a principal component of the biomineralization process is the transport of ions between the mantle epithelium and the EPF, in particular Ca2+ and , needed for the formation of calcium carbonate. The movement of Ca2+ ions into the EPF occurs both passively via paracellular pathways and by active transport through transporters in the mantle epithelium membrane (primarily Ca2+-ATPase and Na+/Ca2+ exchangers), while is shuttled into the EPF via transporters. Additionally, carbonic anhydrase is an important protein in the biomineralization process that catalyzes a reaction that generates and H+ ions from CO2 and water. The H+ ions produced in this reaction (among many others) serve a critical role in several of the transporter proteins both directly (e.g., Ca2+-ATPase) and indirectly (e.g., Na+/H+ exchanger) involved in biomineralization. In addition, reducing the amount of H+ ions in the EPF (measured as the pH of the fluid) causes to dissociate to , thereby increasing the calcium carbonate saturation state in support of calcification (Ries, 2011). A number of other marine calcifiers have also exhibited shifts in genes associated with these pathways of ion-transport in response to CO2-induced OA (Evans et al., 2013; Davies et al., 2016; Johnson and Hofmann, 2017; Griffiths et al., 2019).
We hypothesized that OA would elicit a response in genes involved in biomineralization in the mantle, particularly those involved in ion-transport. Based on the shift in ΔpH from days 9 to 80, we predicted a similar shift in biomineralization-related genes between these same time points. However, we found little evidence of differential gene expression or methylation corresponding to biomineralization or ion transport between these days or across treatments. Despite the lack of differentiation among treatments, biomineralization genes were well-represented in our data and overexpressed relative to all other genes, consistent with current biomineralization models in bivalves. Although carbonic anhydrase and several ion transporter genes were not significantly differentially expressed, they did display a subtle up-regulation in response to OA on day 9 relative to day 80 (Supplementary Figure 4.1), indicating that these subtle responses in biomineralization genes could have contributed to the significant global response to treatment that was observed. These results are surprising given the more pronounced gene expression responses seen in other marine calcifiers (Evans et al., 2013; Davies et al., 2016; Johnson and Hofmann, 2017; Griffiths et al., 2019). One possible explanation for the surprisingly weak response observed in the present study was the decision to examine a single tissue type, the mantle, rather than look at the transcriptomic response of the entire organism or multiple tissues (but see Hüning et al., 2013; Li et al., 2016). Moreover, these subtle responses appear to be fairly consistent with previous targeted gene expression studies examining C. virginica mantle tissue in response to OA exposure, which also did not find significant differential expression of biomineralization genes (Beniash et al., 2010; Richards, 2018). Thus, biomineralization-associated pathways in C. virginica mantle tissue may be relatively canalized compared to other marine calcifiers.
Stress and Metabolic Responses
A broad range of transcriptomic responses related to stress and metabolism have been noted in marine calcifiers in response to OA (see review by Strader et al., 2020). In particular, OA exposure has been shown to elicit an up-regulation of oxidoreductase-related genes and oxygen-stress related enzymes in a broad range of organisms, including corals (Kaniewska et al., 2012), sea urchins (Todgham and Hofmann, 2009), and oysters (Tomanek et al., 2011; Wang et al., 2016). In C. gigas, OA exposure led to a delayed antioxidant and oxidative stress response in gill tissue, suggesting that redox homeostasis was possible for short-term (up to 14 days) but not long-term (28 days) exposure to OA (Wang et al., 2016). Consistent with this response in C. gigas and paralleling the shift we observed in the partial maintenance of the pHEPF, we found several GO categories associated with metabolic response, in particular oxidative stress. In general, we observed a larger stress response over time, suggesting that OA induced a mild stress response in the mantle tissue, which was exacerbated over time. We did not find evidence of overlap between these GO categories in gene expression and DNA methylation, but we did observe DML within genes corresponding to a number of different stress responses, including hypomethylation of death-effector domain-containing genes and hypermethylation of a protein-ubiquitination related gene on day 80. Both types of genes are involved in cell apoptosis and possibly reflect a stress response to OA. Similar OA-induced responses in protein-ubiquitination genes were found in the gonadal tissue of C. virginica (Venkataraman et al., 2020), suggesting OA can induce parallel shifts in DNA methylation in the methylome of different tissues. However, general overlap of OA-induced DNA methylation was low among tissues (2 OA-induced DMLs among 85 identified in the mantle were also induced in the gonadal tissue; Supplementary Figure 3.4). Future studies focusing on OA-induced changes in gene expression and DNA methylation among tissues may help clarify if the subtle responses in C. virginica are the result of a relatively canalized response in the mantle tissue or represents a pattern unique to the species.
The Molecular Basis for pHEPF Response to OA
Ries (2011) proposed a model to describe the regulation of the calcifying fluid whereby the active pumping of protons out of the calcifying fluid elevates the calcifying fluid pH and maintains a favorable calcium carbonate saturation state (Ω > 1) even under highly acidic conditions. Empirical support for this model within oysters has been provided from shell-based boron-isotope estimates of oyster EPF (e.g., Sutton et al., 2018; Liu et al., 2020), but little is known about the molecular basis of this response. To test the predictions proposed by this model, we hypothesized that regulation of oyster pHEPF would be driven by changes in gene expression, particularly genes associated with biomineralization, ion transport, and proton pumping. In addition, we also hypothesized that OA-induced shifts in the transcriptome of C. virginica would correspond to shifts in the methylome. This was based on growing evidence in the DNA methylation literature indicating that DNA methylation is linked with gene regulation (Zilberman et al., 2007; Zemach et al., 2010; Gavery and Roberts, 2013; Olson and Roberts, 2014; Dixon et al., 2018; Zhang et al., 2020), is induced by OA and other environmental stressors (Putnam et al., 2016; Dixon et al., 2018; Bogan et al., 2020), and corresponds with calcification response to OA in marine invertebrates (Liew et al., 2018).
By clustering genes based on their co-expression, we found that gene expression was associated with EPF response (i.e., ΔpH) in four separate gene modules. This result, coupled with the lack of differential expression in individual genes, suggests that regulation of EPF occurs through subtle changes in a large number of genes. Interestingly, these correlated clusters were composed of a diverse collection of genes which were not significantly enriched in specific GO categories, although they did include genes involved in pH regulation, ion transport, and other biomineralization related processes.
Consistent with previous findings in marine invertebrates (Olson and Roberts, 2014; Liew et al., 2018), gene body DNA methylation in C. virginica mantle tissue exhibited a subtle but significant association with both gene expression (positive) and gene expression variation (negative). However, the small R2-values and slopes from the regressions indicate that changes in gene body DNA methylation had only a small effect on changes in gene regulation in C. virginica mantle tissue. Moreover, we found there was a weak positive association between OA-induced log2-fold changes in gene expression and shifts in gene body DNA methylation. Although, we found there was no overlap among enriched GO categories based on gene expression compared to DNA methylation data. We also found no evidence of an association between the eigen gene expression of the four ΔpH-associated modules and gene body DNA methylation, which suggests that an alternative mechanism might be regulating the expression of genes within those modules. Follow-up investigations that use a more targeted, gene-specific approach would clarify whether these weak signals represent an important part of oyster EPF regulation in response to OA.
Subtle Shifts and Constraints
The subtle transcriptomic response of C. virginica found in this study contrasted the more pronounced transcriptomic responses exhibited by other marine calcifying taxa in response to OA (e.g., Li et al., 2016). However, other examples of subtle gene expression shifts in response to environmental change do exist (Malik et al., 2020), and these minor shifts can still have phenotypic consequences (Wu et al., 2010). In C. virginica, these subtle molecular responses may be the result of: (i) extended evolution under regular extreme OA conditions; (ii) constrained plasticity of the mantle (e.g., an evolved canalization of gene expression in response to OA); and/or (iii) a highly polygenic genetic response architecture.
Crassostrea virginica inhabit coastal estuaries, which can experience regular, unpredictable, and rapid swings in acidity leading to conditions near or above the high OA scenario (Waldbusser and Salisbury, 2014). Since the high OA treatment is not unusual from the oyster's perspective, the subtle molecular responses we observed may reflect that the prescribed high OA treatment in the present study was not different enough from what oysters typically experience on diurnal and/or seasonal cycles to elicit a strong molecular response. On the other hand, highly uncertain environments, in which the frequency of fluctuations is much higher than what the organism can predict or respond to, can lead to the evolution of a single expressed phenotype (in this case, gene expression in the mantle) across all environments that maximizes the geometric mean fitness (Seger and Brockmann, 1987; Starrfelt and Kokko, 2012; Botero et al., 2015). The variable environments inhabited by the oysters in the present study may consequently select for constrained (e.g., canalized) responses in the transcriptome and methylome, in which the expression profile results from the evolution of a nearly fixed bet-hedging strategy, rendering the genome capable of only subtle shifts. From an energetic cost perspective, one would expect selective pressure against increases in mRNA and protein expression due to the costs associated with increased expression (Wagner, 2005; Weiße et al., 2015). Interestingly, calcification genes were associated with higher expression than the genome-wide background in the mantle tissue, suggesting that their expression may be maximized, which could constrain their ability to be further up-regulated in response to OA. Lastly, while we cannot completely exclude the possibility that prior acidification events in the field acclimated the oysters to OA prior to the start of the experiment, thereby limiting differences among treatments. This seems unlikely to completely explain our lack of differences since we performed a one month acclimation at control conditions prior to the experimental exposure. Moreover, if it is true that field-collected oysters show subtle, but significant physiological responses, then the studies that focus on organisms reared in control conditions may be biased toward larger responses than actually exist in nature.
Subtle shifts may also be observed if the traits responding to OA are highly polygenic (Pritchard et al., 2010) and/or there is a redundant genetic architecture (Yeaman, 2015). Although this body of literature is focused primarily on shifts in allele frequencies in response to selection rather than gene expression, the same principles about polygenic traits apply. In the case of plastic polygenic traits, the magnitude of response of individual genes may be relatively small and, therefore, not detectable via differential expression analysis. In the case of redundant genetic architecture, theory predicts that high genetic redundancy in a population occurs when individuals can reach a phenotypic outcome by a wide range of genes and pathways (see topic reviewed in Láruson et al., 2020), which could result in very large residual error and limited statistical power to detect differences amongst treatments (i.e., lack of a clear significant response because every individual does something different to achieve the same phenotype). Regardless of whether these results are more influenced by subtle shifts or constraints on gene expression, they show that a marine calcifier's drastic phenotypic responses to OA (i.e., pHEPF response and reduced calcification rate under high OA) can be associated with only subtle molecular responses within that organism's calcifying tissue.
Conclusion
Crassostrea virginica exhibited an overall negative response to long-term OA (e.g., reductions in calcification and pHEPF accompanied by the subtle emergence of stress related transcriptomic responses). Although elevation of ΔpH under the high OA treatment was enhanced at day 9, pHEPF was highly variable within all treatments during the first 22 days of the experiment—which indicates C. virginica may have a limited capacity to continue calcifying during ephemeral acidification events, such as those they already experience due to diurnal and seasonal fluctuations in seawater pH. Notably, we did not find a strong association between specific DML and differentially expressed genes or ΔpH, suggesting that the regulation of pHEPF may occur by more subtle or diverse shifts in the methylome and transcriptome or via alternative mechanisms. Since the majority of OA transcriptomic studies have not specifically targeted calcifying tissue, our results highlight a need for more studies to focus specifically on calcifying tissues in order to assess how flexible the bivalve calcification process is at the molecular level, particularly in oysters. In contrast to other studies, we did not find strong evidence that DNA methylation acted as a mediator to gene expression or EPF responses to OA, suggesting that the importance of DNA methylation may vary considerably among tissues within the same species, among studies, and among taxa. If the subtle shifts we observed in this study are common in the calcifying tissue of other taxa, it may be difficult to gain an unbiased understanding of this phenomenon due to publication bias against weak or non-significant results. Thus, our study provides a roadmap for others seeking to understand how the calcifying fluid is regulated at the molecular level, even when patterns in the resulting molecular data are relatively weak. Subtle shifts at the molecular level and the capacity for marine calcifiers to maintain these molecular changes provide important context for understanding the capacity of different taxa to respond to long-term OA.
Data Availability Statement
The datasets generated for this study can be found in online repositories. The names of the repository/repositories and accession number(s) can be found below: NCBI BioProject ID - PRJNA594029. Scripts and non-sequence data can be found at the online github repository: https://github.com/epigeneticstoocean/AE17_Cvirginica_MolecularResponse. The data can also be found on Dryad with link: https://doi.org/10.5061/dryad.8cz8w9gnk.
Author Contributions
Principle design of the experiment was done by AD-W, SR, JR, and KL. Field collections were done by AD-W, BF, and EM. The experiment was conducted by AD-W. During the experiment, extrapallial fluid was collected and analyzed by LC, while other phenotypic data and tissues were collected by AD-W. Water chemistry was analyzed by AD-W and EM. Tissues were prepared for RNAseq sequencing by BF and prepared for MBD-BSseq by YV and SR. All bioinformatic steps and statistical analyses were performed by AD-W. The manuscript was written by AD-W with assistance from KL, LC, JR, and YV. All authors contributed to editing and approving the final version of the manuscript.
Funding
This research was funded by the National Science Foundation (1635423). Resources purchased with funds from the NSF FMSL program (DBI 1722553, to Northeastern University) were used to generate data for this manuscript.
Conflict of Interest
The authors declare that the research was conducted in the absence of any commercial or financial relationships that could be construed as a potential conflict of interest.
Acknowledgments
We acknowledge Sara Schaal, Aki Laruson, Isaac Westfield, and other members of the Lotterhos and Ries labs for their helpful comments that improved the manuscript. This research was funded by the National Science Foundation (BIO-OCE 1635423). Resources purchased with funds from the NSF FMSL program (DBI 1722553, to Northeastern University) were used to generate data for this manuscript. We are also thankful for the help of many graduate students, undergraduates, technicians, and volunteers during the experiment, including Andrea Unzueta Martinez, Bodie Weedop, Isabel Gutowski, Jaxine Wolfe, Sandi Scripa, Kevin Wasko, Isaac Westfield, and Camila Cortina.
Supplementary Material
The Supplementary Material for this article can be found online at: https://www.frontiersin.org/articles/10.3389/fmars.2020.566419/full#supplementary-material
References
Akalin, A., Kormaksson, M., Li, S., Garrett-Bakelman, F. E., Figueroa, M. E., Melnick, A., et al. (2012). methylKit: a comprehensive R package for the analysis of genome-wide DNA methylation profiles. Genome Biol. 13:R87. doi: 10.1186/gb-2012-13-10-r87
Al-Horani, F. A., Al-Moghrabi, S. M., and de Beer, D. (2002). The mechanism of calcification and its relation to photosynthesis and respiration in the scleractinian coral Galaxea fascicularis. Mar. Biol. 142, 419–426. doi: 10.1007/s00227-002-0981-8
Anagnostou, E., Williams, B., Westfield, I., Foster, G. L., and Ries, J. B. (2019). Calibration of the pH-δ11B and temperature-Mg/Li proxies in the long-lived high-latitude crustose coralline red alga Clathromorphum compactum via controlled laboratory experiments. Geochim. Cosmochim. Acta 254, 142–155. doi: 10.1016/j.gca.2019.03.015
Anier, K., Malinovskaja, K., Pruus, K., Aonurm-Helm, A., Zharkovsky, A., and Kalda, A. (2014). Maternal separation is associated with DNA methylation and behavioural changes in adult rats. Eur. Neuropsychopharmacol. 24, 459–468. doi: 10.1016/j.euroneuro.2013.07.012
Anthony, K. R. N., Kline, D. I., Diaz-Pulido, G., Dove, S., and Hoegh-Guldberg, O. (2008). Ocean acidification causes bleaching and productivity loss in coral reef builders. Proc. Natl. Acad. Sci. U.S.A. 105, 17442–17446. doi: 10.1073/pnas.0804478105
Bates, D., Mächler, M., Bolker, B., and Walker, S. (2015). Fitting linear mixed-effects models using lme4. J. Stat. Softw. 67, 1–48. doi: 10.18637/jss.v067.i01
Bednaršek, N., Tarling, G. A., Bakker, D. C. E., Fielding, S., Jones, E. M., Venables, H. J., et al. (2012). Extensive dissolution of live pteropods in the Southern Ocean. Nat. Geosci. 5, 881–885. doi: 10.1038/ngeo1635
Beniash, E., Ivanina, A., Lieb, N. S., Kurochkin, I., and Sokolova, I. M. (2010). Elevated level of carbon dioxide affects metabolism and shell formation in oysters Crassostrea virginica (Gmelin). Mar. Ecol. Prog. Ser. 419, 95–108. doi: 10.3354/meps08841
Benjamini, Y., and Hochberg, Y. (1995). Controlling the false discovery rate: a practical and powerful approach to multiple testing. J. of Roy. Stat. Soc. B Met. 57, 289–300. doi: 10.1111/j.2517-6161.1995.tb02031.x
Bogan, S. N., Johnson, K. M., and Hofmann, G. E. (2020). Changes in genome-wide methylation and gene expression in response to future pCO2 extremes in the Antarctic pteropod Limacina helicina antarctica. Front. Mar. Sci. 6:788. doi: 10.3389/fmars.2019.00788
Bolger, A. M., Lohse, M., and Usadel, B. (2014). Trimmomatic: a flexible trimmer for illumina sequence data. Bioinformatics 30, 2114–2120. doi: 10.1093/bioinformatics/btu170
Bonduriansky, R., and Day, T. (2018). Extended Heredity: A New Understanding of Inheritance and Evolution. Princeton University Press. Available online at: https://play.google.com/store/books/details?id=HiNGDwAAQBAJ
Botero, C. A., Weissing, F. J., Wright, J., and Rubenstein, D. R. (2015). Evolutionary tipping points in the capacity to adapt to environmental change. Proc. Natl. Acad. Sci. U.S.A. 112, 184–189. doi: 10.1073/pnas.1408589111
Cameron, L. P., Reymond, C. E., Müller-Lundin, F., Westfield, I., Grabowski, J. H., Westphal, H., et al. (2019). Effects of temperature and ocean acidification on the extrapallial fluid pH, calcification rate, and condition factor of the King scallop Pecten maximus. J. Shellfish Res. 38:763. doi: 10.2983/035.038.0327
Clark, M. S. (2020). Molecular mechanisms of biomineralization in marine invertebrates. J. Exp. Biol. 223, 1–13. doi: 10.1242/jeb.206961
Crenshaw, M. A. (1972). The inorganic composition of molluscan extrapallial fluid. Biol. Bull. 143, 506–512. doi: 10.2307/1540180
Crenshaw, M. A., and Neff, J. M. (1969). Decalcification at the mantle-shell interface in molluscs. Am. Zool. 9, 881–885. doi: 10.1093/icb/9.3.881
Davies, S. W., Marchetti, A., Ries, J. B., and Castillo, K. D. (2016). Thermal and pCO2 stress elicit divergent transcriptomic responses in a resilient coral. Front. Mar. Sci. 3:112. doi: 10.3389/fmars.2016.00112
De Beer, D., and Larkum, A. W. D. (2001). Photosynthesis and calcification in the calcifying algae Halimeda discoidea studied with microsensors. Plant Cell Environ. 24, 1209–1217. doi: 10.1046/j.1365-3040.2001.00772.x
de Nooijer, L. J., Toyofuku, T., and Kitazato, H. (2009). Foraminifera promote calcification by elevating their intracellular pH. Proc. Natl. Acad. Sci. U.S.A. 106, 15374–15378. doi: 10.1073/pnas.0904306106
de Nooijer, L. J., Toyofuku, T., Oguri, K., Nomaki, H., and Kitazato, H. (2008). Intracellular pH distribution in foraminifera determined by the fluorescent probe HPTS. Limnol. Oceanogr. Methods 6, 610–618. doi: 10.4319/lom.2008.6.610
Dickinson, G. H., Ivanina, A. V., Matoo, O. B., Pörtner, H. O., Lannig, G., Bock, C., et al. (2012). Interactive effects of salinity and elevated CO2 levels on juvenile eastern oysters, Crassostrea virginica. J. Exp. Biol. 215, 29–43. doi: 10.1242/jeb.061481
Dixon, G., Liao, Y., Bay, L. K., and Matz, M. V. (2018). Role of gene body methylation in acclimatization and adaptation in a basal metazoan. Proc. Natl. Acad. Sci. U.S.A. 115, 13342–13346. doi: 10.1073/pnas.1813749115
Dixon, P. (2003). VEGAN, a package of R functions for community ecology. J. Veg. Sci. 14, 927–930. doi: 10.1111/j.1654-1103.2003.tb02228.x
Dobin, A., Davis, C. A., Schlesinger, F., Drenkow, J., Zaleski, C., Jha, S., et al. (2013). STAR: ultrafast universal RNA-seq aligner. Bioinformatics 29, 15–21. doi: 10.1093/bioinformatics/bts635
Dolinoy, D. C., Weidman, J. R., Waterland, R. A., and Jirtle, R. L. (2006). Maternal genistein alters coat color and protects Avy mouse offspring from obesity by modifying the fetal epigenome. Environ. Health Perspect. 114, 567–572. doi: 10.1289/ehp.8700
Donald, H. K., Ries, J. B., Stewart, J. A., Fowell, S. E., and Foster, G. L. (2017). Boron isotope sensitivity to seawater pH change in a species of Neogoniolithon coralline red alga. Geochimi Cosmochim. Acta 217, 240–253. doi: 10.1016/j.gca.2017.08.021
Doney, S. C., Fabry, V. J., Feely, R. A., and Kleypas, J. A. (2009). Ocean acidification: the other CO2 problem. Ann. Rev. Mar. Sci. 1, 169–192. doi: 10.1146/annurev.marine.010908.163834
Eirin-Lopez, J. M., and Putnam, H. M. (2019). Marine environmental epigenetics. Ann. Rev. Mar. Sci. 11, 335–368. doi: 10.1146/annurev-marine-010318-095114
Ekstrom, J. A., Suatoni, L., Cooley, S. R., Pendleton, L. H., Waldbusser, G. G., Cinner, J. E., et al. (2015). Vulnerability and adaptation of US shellfisheries to ocean acidification. Nat. Clim. Change 5, 207–214. doi: 10.1038/nclimate2508
Evans, T. G., Chan, F., Menge, B. A., and Hofmann, G. E. (2013). Transcriptomic responses to ocean acidification in larval sea urchins from a naturally variable pH environment. Mol. Ecol. 22, 1609–1625. doi: 10.1111/mec.12188
Evans, T. G., and Hofmann, G. E. (2012). Defining the limits of physiological plasticity: how gene expression can assess and predict the consequences of ocean change. Philos. Trans. R. Soc. Lond. B Biol. Sci. 367, 1733–1745. doi: 10.1098/rstb.2012.0019
Feely, R. A., Sabine, C. L., Hernandez-Ayon, J. M., Ianson, D., and Hales, B. (2008). Evidence for upwelling of corrosive “acidified” water onto the continental shelf. Science 320, 1490–1492. doi: 10.1126/science.1155676
Feely, R. A., Sabine, C. L., Lee, K., Berelson, W., Kleypas, J., Fabry, V. J., et al. (2004). Impact of anthropogenic CO2 on the CaCO3 system in the oceans. Science 305, 362–366. doi: 10.1126/science.1097329
Gavery, M. R., and Roberts, S. B. (2013). Predominant intragenic methylation is associated with gene expression characteristics in a bivalve mollusc. PeerJ 1:e215. doi: 10.7717/peerj.215
Gazeau, F., Parker, L. M., Comeau, S., Gattuso, J.-P., O'Connor, W. A., Martin, S., et al. (2013). Impacts of ocean acidification on marine shelled molluscs. Mar. Biol. 160, 2207–2245. doi: 10.1007/s00227-013-2219-3
Gobler, C. J., and Talmage, S. C. (2014). Physiological response and resilience of early life-stage Eastern oysters (Crassostrea virginica) to past, present and future ocean acidification. Conserv. Physiol. 2:cou004. doi: 10.1093/conphys/cou004
Gómez-Chiarri, M., Warren, W. C., Guo, X., and Proestou, D. (2015). Developing tools for the study of molluscan immunity: the sequencing of the genome of the eastern oyster, Crassostrea virginica. Fish Shellfish Immun. 46, 2–4. doi: 10.1016/j.fsi.2015.05.004
Goncalves, P., Jones, D. B., Thompson, E. L., Parker, L. M., Ross, P. M., and Raftos, D. A. (2017). Transcriptomic profiling of adaptive responses to ocean acidification. Mol. Ecol. 26, 5974–5988. doi: 10.1111/mec.14333
Griffiths, J. S., Pan, T.-C. F., and Kelly, M. W. (2019). Differential responses to ocean acidification between populations of Balanophyllia elegans corals from high and low upwelling environments. Mol. Ecol. 28, 2715–2730. doi: 10.1111/mec.15050
Guinotte, J. M., and Fabry, V. J. (2008). Ocean acidification and its potential effects on marine ecosystems. Ann. N. Y. Acad. Sci. 1134, 320–342. doi: 10.1196/annals.1439.013
Helm, M. M., and Bourne, N. (2004). Hatchery Culture of Bivalves: A Practical Manual. Food & Agriculture Organization. Available online at: https://books.google.com/books/about/Hatchery_Culture_of_Bivalves.html?hl=&id=hFUbAQAAIAAJ
Hofmann, G. E. (2017). Ecological epigenetics in marine metazoans. Front. Mar. Sci. 4, 1–7. doi: 10.3389/fmars.2017.00004
Holcomb, M., Venn, A. A., Tambutté, E., Tambutté, S., Allemand, D., Trotter, J., et al. (2014). Coral calcifying fluid pH dictates response to ocean acidification. Sci. Rep. 4:5207. doi: 10.1038/srep05207
Hothorn, T., Bretz, F., and Westfall, P. (2008). Simultaneous inference in general parametric models. Biom. J. 50, 346–363. doi: 10.1002/bimj.200810425
Huh, I., Zeng, J., Park, T., and Yi, S. V. (2013). DNA methylation and transcriptional noise. Epigenet. Chromatin 6:9. doi: 10.1186/1756-8935-6-9
Hüning, A. K., Melzner, F., Thomsen, J., Gutowska, M. A., Krämer, L., Frickenhaus, S., et al. (2013). Impacts of seawater acidification on mantle gene expression patterns of the Baltic Sea blue mussel: implications for shell formation and energy metabolism. Mar. Biol. 160, 1845–1861. doi: 10.1007/s00227-012-1930-9
Intergovernmental Panel on Climate Change (2007). Climate change 2007 - Mitigation of Climate Change: Working Group III Contribution to the Fourth Assessment Report of the IPCC. Cambridge University Press. Available online at: https://play.google.com/store/books/details?id=U_4ltxID60UC
Ivanina, A. V., Dickinson, G. H., Matoo, O. B., Bagwe, R., Dickinson, A., Beniash, E., et al. (2013). Interactive effects of elevated temperature and CO2 levels on energy metabolism and biomineralization of marine bivalves Crassostrea virginica and Mercenaria mercenaria. Comp. Biochem. Physiol. A Mol. Integr. Physiol. 166, 101–111. doi: 10.1016/j.cbpa.2013.05.016
Jablonka, E., and Lamb, M. J. (2002). The changing concept of epigenetics. Ann. N. Y. Acad. Sci. 981, 82–96. doi: 10.1111/j.1749-6632.2002.tb04913.x
Johnson, K. M., and Hofmann, G. E. (2017). Transcriptomic response of the Antarctic pteropod Limacina helicina antarctica to ocean acidification. BMC Genomics 18:812. doi: 10.1186/s12864-017-4161-0
Jombart, T., Devillard, S., and Balloux, F. (2010). Discriminant analysis of principal components: a new method for the analysis of genetically structured populations. BMC Genet. 11:94. doi: 10.1186/1471-2156-11-94
Kaniewska, P., Campbell, P. R., Kline, D. I., Rodriguez-Lanetty, M., Miller, D. J., Dove, S., et al. (2012). Major cellular and physiological impacts of ocean acidification on a reef building coral. PLoS ONE 7:e34659. doi: 10.1371/journal.pone.0034659
Köhler-Rink, S., and Kühl, M. (2000). Microsensor studies of photosynthesis and respiration in larger symbiotic foraminifera. I The physicochemical microenvironment of Marginopora vertebralis, Amphistegina lobifera and Amphisorus hemprichii. Mar. Biol. 137, 473–486. doi: 10.1007/s002270000335
Kroeker, K. J., Kordas, R. L., Crim, R. N., and Singh, G. G. (2010). Meta-analysis reveals negative yet variable effects of ocean acidification on marine organisms. Ecol. Lett. 13, 1419–1434. doi: 10.1111/j.1461-0248.2010.01518.x
Krueger, F., and Andrews, S. R. (2011). Bismark: a flexible aligner and methylation caller for Bisulfite-Seq applications. Bioinformatics 27, 1571–1572. doi: 10.1093/bioinformatics/btr167
Kuznetsova, A., Brockhoff, P. B., and Christensen, R. H. B. (2017). lmerTest package: tests in linear mixed effects models. J. Stat. Softw. 82, 1–26. doi: 10.18637/jss.v082.i13
Langfelder, P., and Horvath, S. (2008). WGCNA: an R package for weighted correlation network analysis. BMC Bioinformatics 9, 1–13. doi: 10.1186/1471-2105-9-559
Láruson, Á. J., Yeaman, S., and Lotterhos, K. E. (2020). The importance of genetic redundancy in evolution. Trend. Ecol. Evol. 35, 809–822. doi: 10.1016/j.tree.2020.04.009
Li, B., and Dewey, C. N. (2011). RSEM: accurate transcript quantification from RNA-Seq data with or without a reference genome. BMC Bioinformatics 12:323. doi: 10.1186/1471-2105-12-323
Li, S., Liu, C., Huang, J., Liu, Y., Zhang, S., Zheng, G., et al. (2016). Transcriptome and biomineralization responses of the pearl oyster Pinctada fucata to elevated CO2 and temperature. Sci. Rep. 6:18943. doi: 10.1038/srep18943
Liew, Y. J., Zoccola, D., Li, Y., Tambutté, E., Venn, A. A., Michell, C. T., et al. (2018). Epigenome-associated phenotypic acclimatization to ocean acidification in a reef-building coral. Sci. Adv. 4:eaar8028. doi: 10.1126/sciadv.aar8028
Liu, Y.-W., Eagle, R. A., Aciego, S. M., Gilmore, R. E., and Ries, J. B. (2018). A coastal coccolithophore maintains pH homeostasis and switches carbon sources in response to ocean acidification. Nat. Commun. 9:2857. doi: 10.1038/s41467-018-04463-7
Liu, Y.-W., Sutton, J. N., Ries, J. B., and Eagle, R. A. (2020). Regulation of calcification site pH is a polyphyletic but not always governing response to ocean acidification. Sci Adv 6:eaax1314. doi: 10.1126/sciadv.aax1314
Lyko, F., Foret, S., Kucharski, R., Wolf, S., Falckenhayn, C., and Maleszka, R. (2010). The honey bee epigenomes: differential methylation of brain DNA in queens and workers. PLoS Biol. 8:e1000506. doi: 10.1371/journal.pbio.1000506
Malik, A. A., Swenson, T., Weihe, C., Morrison, E. W., Martiny, J. B. H., Brodie, E. L., et al. (2020). Drought and plant litter chemistry alter microbial gene expression and metabolite production. ISME J. 14, 2236–2247. doi: 10.1038/s41396-020-0683-6
Martin, M. (2011). Cutadapt removes adapter sequences from high-throughput sequencing reads. EMBnet.J. 17, 10–12. doi: 10.14806/ej.17.1.200
Matoo, O. B., Ivanina, A. V., Ullstad, C., Beniash, E., and Sokolova, I. M. (2013). Interactive effects of elevated temperature and CO2 levels on metabolism and oxidative stress in two common marine bivalves (Crassostrea virginica and Mercenaria mercenaria). Comp. Biochem. Physiol. A Mol. Integr. Physiol. 164, 545–553. doi: 10.1016/j.cbpa.2012.12.025
McCulloch, M., Falter, J., Trotter, J., and Montagna, P. (2012). Coral resilience to ocean acidification and global warming through pH up-regulation. Nat. Clim. Chang. 2, 623–627. doi: 10.1038/nclimate1473
Melatunan, S., Calosi, P., Rundle, S. D., Widdicombe, S., and Moody, A. J. (2013). Effects of ocean acidification and elevated temperature on shell plasticity and its energetic basis in an intertidal gastropod. Mar. Ecol. Prog. Ser. 472, 155–168. doi: 10.3354/meps10046
Michaelidis, B., Haas, D., and Grieshaber, M. K. (2005). Extracellular and intracellular acid-base status with regard to the energy metabolism in the oyster Crassostrea gigas during exposure to air. Physiol. Biochem. Zool. 78, 373–383. doi: 10.1086/430223
Miller, A. W., Reynolds, A. C., Sobrino, C., and Riedel, G. F. (2009). Shellfish face uncertain future in high CO2 world: influence of acidification on oyster larvae calcification and growth in estuaries. PLoS ONE 4:e5661. doi: 10.1371/journal.pone.0005661
Murtagh, F., and Legendre, P. (2014). Ward's hierarchical agglomerative clustering method: which algorithms implement ward's criterion? J. Classif. 31, 274–295. doi: 10.1007/s00357-014-9161-z
Olson, C. E., and Roberts, S. B. (2014). Genome-wide profiling of DNA methylation and gene expression in Crassostrea gigas male gametes. Front. Physiol. 5:224. doi: 10.3389/fphys.2014.00224
Orr, J. C., Fabry, V. J., Aumont, O., Bopp, L., Doney, S. C., Feely, R. A., et al. (2005). Anthropogenic ocean acidification over the twenty-first century and its impact on calcifying organisms. Nature 437, 681–686. doi: 10.1038/nature04095
Pierrot, D. E., Wallace, D. W. R., and Lewis, E. (2011). MS Excel Program Developed for CO2 System Calculations. Oak Ridge, TN: Carbon Dioxide Information Analysis Center, Oak Ridge National Laboratory, US Department of Energy. doi: 10.3334/cdiac/otg.co2sys_xls_cdiac105a
Pritchard, J. K., Pickrell, J. K., and Coop, G. (2010). The genetics of human adaptation: hard sweeps, soft sweeps, and polygenic adaptation. Curr. Biol. 20, R208–R215. doi: 10.1016/j.cub.2009.11.055
Putnam, H. M., Davidson, J. M., and Gates, R. D. (2016). Ocean acidification influences host DNA methylation and phenotypic plasticity in environmentally susceptible corals. Evol. Appl. 9, 1165–1178. doi: 10.1111/eva.12408
Rajan, K. C., and Vengatesen, T. (2020). Molecular adaptation of molluscan biomineralisation to high-CO2 oceans – The known and the unknown. Mar. Environ. Res. 155:104883. doi: 10.1016/j.marenvres.2020.104883
Ramesh, K., Hu, M. Y., Thomsen, J., Bleich, M., and Melzner, F. (2017). Mussel larvae modify calcifying fluid carbonate chemistry to promote calcification. Nat. Commun. 8:1709. doi: 10.1038/s41467-017-01806-8
Reum, J. C. P., Alin, S. R., Feely, R. A., Newton, J., Warner, M., and McElhany, P. (2014). Seasonal carbonate chemistry covariation with temperature, oxygen, and salinity in a fjord estuary: Implications for the design of ocean acidification experiments. PLoS ONE 9:e89619. doi: 10.1371/journal.pone.0089619
Richards, E. J. (2006). Inherited epigenetic variation–revisiting soft inheritance. Nat. Rev. Genet. 7, 395–401. doi: 10.1038/nrg1834
Richards, M. L. (2018). The Impact of CO2-Related Ocean Acidification on the Molecular Regulation of Shell Development in the Eastern Oyster (Crassostrea virginica) Dissertation/master's thesis. Baton Rouge, LA: Louisiana State University.
Ries, J. B. (2011). A physicochemical framework for interpreting the biological calcification response to CO2-induced ocean acidification. Geochim. Cosmochim. Acta 75, 4053–4064. doi: 10.1016/j.gca.2011.04.025
Ries, J. B., Cohen, A. L., and McCorkle, D. C. (2009). Marine calcifiers exhibit mixed responses to CO2-induced ocean acidification. Geology 37, 1131–1134. doi: 10.1130/G30210A.1
Ries, J. B., Ghazaleh, M. N., Connolly, B., Westfield, I., and Castillo, K. D. (2016). Impacts of seawater saturation state (ΩA= 0.4–4.6) and temperature (10, 25°C) on the dissolution kinetics of whole-shell biogenic carbonates. Geochimi. Cosmochim. Acta 192, 318–337. doi: 10.1016/j.gca.2016.07.001
Rink, S., Kühl, M., Bijma, J., and Spero, H. J. (1998). Microsensor studies of photosynthesis and respiration in the symbiotic foraminifer Orbulina universa. Mar. Biol. 131, 583–595. doi: 10.1007/s002270050350
Ritchie, M. E., Phipson, B., Wu, D., Hu, Y., Law, C. W., Shi, W., et al. (2015). limma powers differential expression analyses for RNA-sequencing and microarray studies. Nucl. Acids Res. 43:e47. doi: 10.1093/nar/gkv007
Salisbury, J. E., Vandemark, D., Hunt, C. W., Campbell, J. W., McGillis, W. R., and McDowell, W. H. (2008). Seasonal observations of surface waters in two Gulf of Maine estuary-plume systems - relationships between watershed attributes, optical measurements and surface pCO2. Estuar. Coast. Shelf Sci. 77, 245–252. doi: 10.1016/j.ecss.2007.09.033
Schübeler, D. (2015). Function and information content of DNA methylation. Nature 517, 321–326. doi: 10.1038/nature14192
Seger, J., and Brockmann, H. J. (1987). What is bet-hedging? Oxford Surveys in Evolutionary Biology 4, 182–211.
Starrfelt, J., and Kokko, H. (2012). Bet-hedging—a triple trade-off between means, variances and correlations. Biol. Rev. Camb. Philos. Soc. 87, 742–755. doi: 10.1111/j.1469-185X.2012.00225.x
Strader, M. E., Wong, J. M., and Hofmann, G. E. (2020). Ocean acidification promotes broad transcriptomic responses in marine metazoans: a literature survey. Front. Zool. 17:7. doi: 10.1186/s12983-020-0350-9
Sutton, J. N., Liu, Y.-W., Ries, J. B., Guillermic, M., Ponzevera, E., and Eagle, R. A. (2018). δ11B as monitor of calcification site pH in divergent marine calcifying organisms. Biogeosciences 15, 1447–1467. doi: 10.5194/bg-15-1447-2018
Talmage, S. C., and Gobler, C. J. (2009). The effects of elevated carbon dioxide concentrations on the metamorphosis, size, and survival of larval Hard clams (Mercenaria mercenaria), Bay scallops (Argopecten irradians), and Eastern oysters (Crassostrea virginica). Limnol. Oceanogr. 54, 2072–2080. doi: 10.4319/lo.2009.54.6.2072
Talmage, S. C., and Gobler, C. J. (2010). Effects of past, present, and future ocean carbon dioxide concentrations on the growth and survival of larval shellfish. Proc. Natl. Acad. Sci. U.S.A. 107, 17246–17251. doi: 10.1073/pnas.0913804107
Todgham, A. E., and Hofmann, G. E. (2009). Transcriptomic response of sea urchin larvae Strongylocentrotus purpuratus to CO2-driven seawater acidification. J. Exp. Biol. 212, 2579–2594. doi: 10.1242/jeb.032540
Tomanek, L., Zuzow, M. J., Ivanina, A. V., Beniash, E., and Sokolova, I. M. (2011). Proteomic response to elevated pCO2 level in Eastern oysters, Crassostrea virginica: evidence for oxidative stress. J. Exp. Biol. 214, 1836–1844. doi: 10.1242/jeb.055475
Venkataraman, Y. R., Downey-Wall, A. M., Ries, J., Westfield, I., White, S. J., Roberts, S. B., et al. (2020). General DNA methylation patterns and environmentally-induced differential methylation in the Eastern oyster (Crassostrea virginica). Front. Mar. Sci. 7, 1–14. doi: 10.1101/2020.01.07.897934
Venn, A., Tambutté, E., Holcomb, M., Allemand, D., and Tambutté, S. (2011). Live tissue imaging shows reef corals elevate pH under their calcifying tissue relative to seawater. PLoS ONE 6:e20013. doi: 10.1371/journal.pone.0020013
Wagner, A. (2005). Energy constraints on the evolution of gene expression. Mol. Biol. Evol. 22, 1365–1374. doi: 10.1093/molbev/msi126
Waldbusser, G. G., and Salisbury, J. E. (2014). Ocean acidification in the coastal zone from an organism's perspective: multiple system parameters, frequency domains, and habitats. Ann. Rev. Mar. Sci. 6, 221–247. doi: 10.1146/annurev-marine-121211-172238
Waldbusser, G. G., Steenson, R. A., and Green, M. A. (2011a). Oyster shell dissolution rates in estuarine waters: effects of pH and shell legacy. J. Shellfish Res. 30, 659–669. doi: 10.2983/035.030.0308
Waldbusser, G. G., Voigt, E. P., Bergschneider, H., Green, M. A., and Newell, R. I. E. (2011b). Biocalcification in the Eastern oyster (Crassostrea virginica) in relation to long-term trends in Chesapeake Bay pH. Estuaries Coasts 34, 221–231. doi: 10.1007/s12237-010-9307-0
Wallace, R. B., Baumann, H., Grear, J. S., Aller, R. C., and Gobler, C. J. (2014). Coastal ocean acidification: The other eutrophication problem. Estuar. Coast. Shelf Sci. 148, 1–13. doi: 10.1016/j.ecss.2014.05.027
Wang, Q., Cao, R., Ning, X., You, L., Mu, C., Wang, C., et al. (2016). Effects of ocean acidification on immune responses of the Pacific oyster Crassostrea gigas. Fish Shellfish Immunol. 49, 24–33. doi: 10.1016/j.fsi.2015.12.025
Weiße, A. Y., Oyarzún, D. A., Danos, V., and Swain, P. S. (2015). Mechanistic links between cellular trade-offs, gene expression, and growth. Proc. Natl. Acad. Sci. U.S.A. 112, E1038–E1047. doi: 10.1073/pnas.1416533112
Whitlock, M., and Schluter, D. (2014). The Analysis of Biological Data. Roberts & Company. Available online at: https://books.google.com/books/about/The_Analysis_of_Biological_Data.html?hl=&id=Wm__oAEACAAJ
Wong, J. M., Johnson, K. M., Kelly, M. W., and Hofmann, G. E. (2018). Transcriptomics reveal transgenerational effects in purple sea urchin embryos: adult acclimation to upwelling conditions alters the response of their progeny to differential pCO2 levels. Mol. Ecol. 27, 1120–1137. doi: 10.1111/mec.14503
Wood, H. L., Spicer, J. I., and Widdicombe, S. (2008). Ocean acidification may increase calcification rates, but at a cost. Proc. Biol. Sci. 275, 1767–1773. doi: 10.1098/rspb.2008.0343
Wright, R. M., Aglyamova, G. V., Meyer, E., and Matz, M. V. (2015). Gene expression associated with white syndromes in a reef building coral, Acropora hyacinthus. BMC Genomics 16:371. doi: 10.1186/s12864-015-1540-2
Wu, C.-Y., Alexander Rolfe, P., Gifford, D. K., and Fink, G. R. (2010). Control of transcription by cell size. PLoS Biol. 8:e1000523. doi: 10.1371/journal.pbio.1000523
Xu, X., Li, G., Li, C., Zhang, J., Wang, Q., Simmons, D. K., et al. (2019). Evolutionary transition between invertebrates and vertebrates via methylation reprogramming in embryogenesis. Nat. Sci. Rev. 6, 993–1003. doi: 10.1093/nsr/nwz064
Yeaman, S. (2015). Local adaptation by alleles of small effect. Am. Nat. 186(Suppl. 1), S74–S89. doi: 10.1086/682405
Yong-Villalobos, L., González-Morales, S. I., Wrobel, K., Gutiérrez-Alanis, D., Cervantes-Peréz, S. A., Hayano-Kanashiro, C., et al. (2015). Methylome analysis reveals an important role for epigenetic changes in the regulation of the Arabidopsis response to phosphate starvation. Proc. Natl. Acad. Sci. U.S.A. 112, E7293–E7302. doi: 10.1073/pnas.1522301112
Zemach, A., McDaniel, I. E., Silva, P., and Zilberman, D. (2010). Genome-wide evolutionary analysis of eukaryotic DNA methylation. Science 328, 916–919. doi: 10.1126/science.1186366
Zhang, H., Lang, Z., and Zhu, J.-K. (2018). Dynamics and function of DNA methylation in plants. Nat. Rev. Mol. Cell Bio. 19, 489–506. doi: 10.1038/s41580-018-0016-z
Zhang, J., Luo, S., Gu, Z., Deng, Y., and Jiao, Y. (2020). Genome-wide DNA methylation analysis of mantle edge and mantle central from Pearl oyster Pinctada fucata martensii. Mar. Biotechnol. 22, 380–390. doi: 10.1007/s10126-020-09957-4
Keywords: DNA methylation, gene expression, ocean acidification, acclimatization, Crassostrea virginica, oyster, extrapallial fluid
Citation: Downey-Wall AM, Cameron LP, Ford BM, McNally EM, Venkataraman YR, Roberts SB, Ries JB and Lotterhos KE (2020) Ocean Acidification Induces Subtle Shifts in Gene Expression and DNA Methylation in Mantle Tissue of the Eastern Oyster (Crassostrea virginica). Front. Mar. Sci. 7:566419. doi: 10.3389/fmars.2020.566419
Received: 27 May 2020; Accepted: 09 September 2020;
Published: 13 November 2020.
Edited by:
Andrew Stanley Mount, Clemson University, United StatesReviewed by:
Gary H. Dickinson, The College of New Jersey, United StatesHao Chen, Institute of Oceanology (CAS), China
Copyright © 2020 Downey-Wall, Cameron, Ford, McNally, Venkataraman, Roberts, Ries and Lotterhos. This is an open-access article distributed under the terms of the Creative Commons Attribution License (CC BY). The use, distribution or reproduction in other forums is permitted, provided the original author(s) and the copyright owner(s) are credited and that the original publication in this journal is cited, in accordance with accepted academic practice. No use, distribution or reproduction is permitted which does not comply with these terms.
*Correspondence: Alan M. Downey-Wall, YWRvd25leXdhbGxAZ21haWwuY29t