 Kevin D. Friedland1*
 Ryan E. Morse1
 Nancy Shackell2
 Jamie C. Tam2Janelle L. Morano3
 John R. Moisan4
 Damian C. Brady5
- 1Narragansett Laboratory, National Marine Fisheries Service, Narragansett, RI, United States
- 2Fisheries and Oceans Canada, Bedford Institute of Oceanography, Dartmouth, NS, Canada
- 3Department of Natural Resources, Cornell University, Ithaca, NY, United States
- 4Wallops Flight Facility, National Aeronautics and Space Administration (NASA) Goddard Space Flight Center, Wallops Island, VA, United States
- 5School of Marine Sciences, University of Maine, Walpole, ME, United States
Sea surface temperature (SST), salinity, and chlorophyll concentration (CHL) have changed in the US Northeast Shelf ecosystem over recent decades. The changes in these parameters were distinctly marked by change points around the year 2012 resulting in a 0.83°C increase in SST, a 0.3 PSU increase in salinity, and decrease in CHL in excess of 0.4 mg m–3. Where temperature and salinity shifted in mean level around their respective change points, CHL declined in a more monotonic fashion. Modeled data suggest that the shift in CHL resulted in a greater contribution of pico- and nanophytoplankton and a decreased contribution of microphytoplankton to overall CHL. Complementary estimates of the contribution of different phytoplankton functional types suggest a diminished contribution of diatoms to the phytoplankton community. Hence, not only is there evidence of a decline in the overall primary production capacity of the ecosystem, but also evidence of a fundamental change in the size and quality of phytoplankton supporting food webs. Two ecosystem responses to the observed changes in SST, salinity, and CHL were analyzed. Both length and weight at age have declined for a number of species, and both measures of growth appear to be negatively associated with temperature and positively associated with CHL. Biomass of fish and macroinvertebrates has declined in recent years, with a decrease in pelagic species associated with a decrease in CHL, while the decline in demersal species was associated with an increase in temperature. Collectively, these ecosystem changes appear to be the result of the complex interactions of both thermal effects and changes at the base of the food web.
Introduction
Changing climate conditions are expected to impact the base of marine food webs by changing the seasonal timing and intensity of phytoplankton blooms (Lotze et al., 2019). The main mechanism governing this anticipated change is the shoaling of mixed layer depths due to increasing temperature, which in turn restricts vertical mixing (Somavilla et al., 2017) and inhibits the redistribution of dissolved nutrients leading to lower overall chlorophyll biomass (Henson et al., 2013). However, projections that incorporate physical mechanisms such as stratification and biogeochemical interactions require validation. Examination of changes in phytoplankton production in marine ecosystems subject to recent, rapid warming can provide the context to improve the modeled response of lower trophic levels to projected change in climate. Rapid climate change is already occurring and the associated warming is arguably the most evident change observed thus far (Cheng et al., 2019). Therefore, it is prudent to examine the response of both lower and upper trophic levels as proxies for the impacts of longer-term climate change effects.
Remote sensing data sources make it possible to consider contemporary change in the upper water column thermal dynamics and phytoplankton biomass in marine ecosystems. These data sources have matured to time series in excess of two decades (Groom et al., 2019) and now provide the ability to evaluate trends and shifts in ecosystem conditions (Friedland et al., 2018). Temperature can influence marine ecosystem function at both the system and individual levels. Increasing temperature can cause the metabolism in individuals to increase (Dantas et al., 2019), alter the population structure and phenology of phytoplankton communities (Moisan et al., 2002; Conversi et al., 2010), and result in changes in trait variation within populations (Salo et al., 2020). Consequently, marine ecosystems are reorganizing as temperature influences both range size and species richness (Batt et al., 2017). Increasingly, we see that where once fishing had the greatest influence on marine ecosystem structure and productivity (Shackell et al., 2012), climate effects are exacerbating forcing factors (Mérillet et al., 2020). The observational and remote sensing time series of temperature data predates estimates of chlorophyll biomass; hence, our thinking and investigations have tended to be skewed toward long-standing hypotheses of thermal control of marine ecosystem function. However, the base of the food web has not been static in response to climate factors resulting in changes in productivity (Roxy et al., 2016), phytoplankton community structure (Dutkiewicz et al., 2019), and bloom phenology (Friedland et al., 2018). While it is anticipated that climate change will alter the vertical structure of the water column, it is worth emphasizing that stratification has already undergone substantial change (Yamaguchi and Suga, 2019).
Change in the productivity of lower trophic levels can affect the stability and function of ecosystems and the production of surplus biomass to support fisheries. Ecosystem stability has been described as a function of energy flow (Huxel and McCann, 1998). For example, Ullah et al. (2018) described scenarios where trophic transfer is inhibited by thermally related factors and new equilibrium among phytoplankton functional groups are established. This can be particularly problematic when groups like cyanobacteria begin to dominate since they often tend to be refractory foods (Friedland et al., 2005) and some species pose a toxicity threat (Paerl, 2018). Perhaps of greater fundamental importance is how food web function changes if energy flow is modified in magnitude, timing, or becomes highly event driven. Terrestrial and aquatic species time their reproductive cycles to benefit from relatively constant seasonal production cycles. For example, cohort recruitment of fish species is affected by the timing and/or size of blooms (Asch et al., 2019). In much the same vein, subsequent growth and reproduction of cohorts will be impacted by the changing energy content and availability of forage species (Durant et al., 2019). The consequences of a loss of system stability and diversity all too often results in a concentration of fishing on lower trophic level target species, which tends to exacerbate the problem (Howarth et al., 2014). These perturbed ecosystems are often continental shelf large marine ecosystems, which play the dominant role in providing national and global food security compared to the relatively negligible role of high seas fisheries (Schiller et al., 2018). Hence, instability in production in marine systems can translate to instability in economic systems.
Climate change is expected to increase the frequency of extreme events, both transient and transformative in nature, that affect multiple aspects of marine ecosystems. Heatwaves have occurred worldwide and they are characterized as anomalously warm temperatures that persist and produce a myriad of follow-on effects (Holbrook et al., 2019; Pershing et al., 2019). Heatwaves can actuate change in community structure by stimulating emigration and causing regionalized mortality (Sanford et al., 2019). They have been associated with phytoplankton blooms and the development of hazardous blooms species that can cause fish mortality in other species (Roberts et al., 2019). Heatwaves can also impact fishery populations as they have been observed to play a role in the recruitment of both invertebrate (Chandrapavan et al., 2019) and vertebrate species (Smith et al., 2019).
The US Northeast Continental Shelf is a well-studied ecosystem that is already displaying warming induced changes in physical forcing and ecosystem response. It is a system that has experienced rapid temperature change (Pershing et al., 2015), has seen two prominent heatwaves in as many decades (Mills et al., 2013; Gawarkiewicz et al., 2019), and has experienced progressive warming in large measure due to change in basin scale circulation (Chen et al., 2020). Fish and macroinvertebrate species have undergone significant shifts in their distribution (Friedland et al., 2019), which is already impacting human populations (Rogers et al., 2019). Rising temperatures appears to have increased the available occupancy habitat for most species and concomitant with this expansion of habitat, there has been an increase in upper trophic level biomass across a range of functional groups (Friedland et al., 2020). The principal multi-species fisheries in the region were greatly reduced by over-fishing in the 1990s, and much of the economic space is now occupied by single species fisheries on invertebrate taxa (Goode et al., 2019; Wiedenmann and Jensen, 2019).
The aim of this study was to examine contemporary trends in sea surface temperature and chlorophyll concentration from remote sensing data sources, and salinity from observational data for the US Continental Shelf ecosystem. Furthermore, these trends are scrutinized for time series change points as an indication of potential regime change. The phytoplankton community was characterized by its size fraction composition, functional type contributions, and seasonal bloom patterns. Ecosystem response to both trend and events in the physical forcing and phytoplankton change was evaluated using growth and abundance data for fish and macroinvertebrates from a concomitant fisheries independent trawl survey.
Materials and Methods
Study Site
We studied physical and biological changes occurring in the Northeast US Continental Shelf ecosystem (NES). The shaded portion of the continental shelf shown in Figure 1 denotes the study area. We characterized conditions and responses of the ecosystem based on five subdivisions as described in Friedland et al. (2015a). The five subareas were Georges Bank (GBK), Gulf of Maine east and west (GOMe and GOMw, respectively), and Middle Atlantic Bight north and south (MABn and MABs, respectively). These five areas capture much of the variability of the system, especially as related to the distribution and dynamics of primary producers and the fish populations that rely on them.
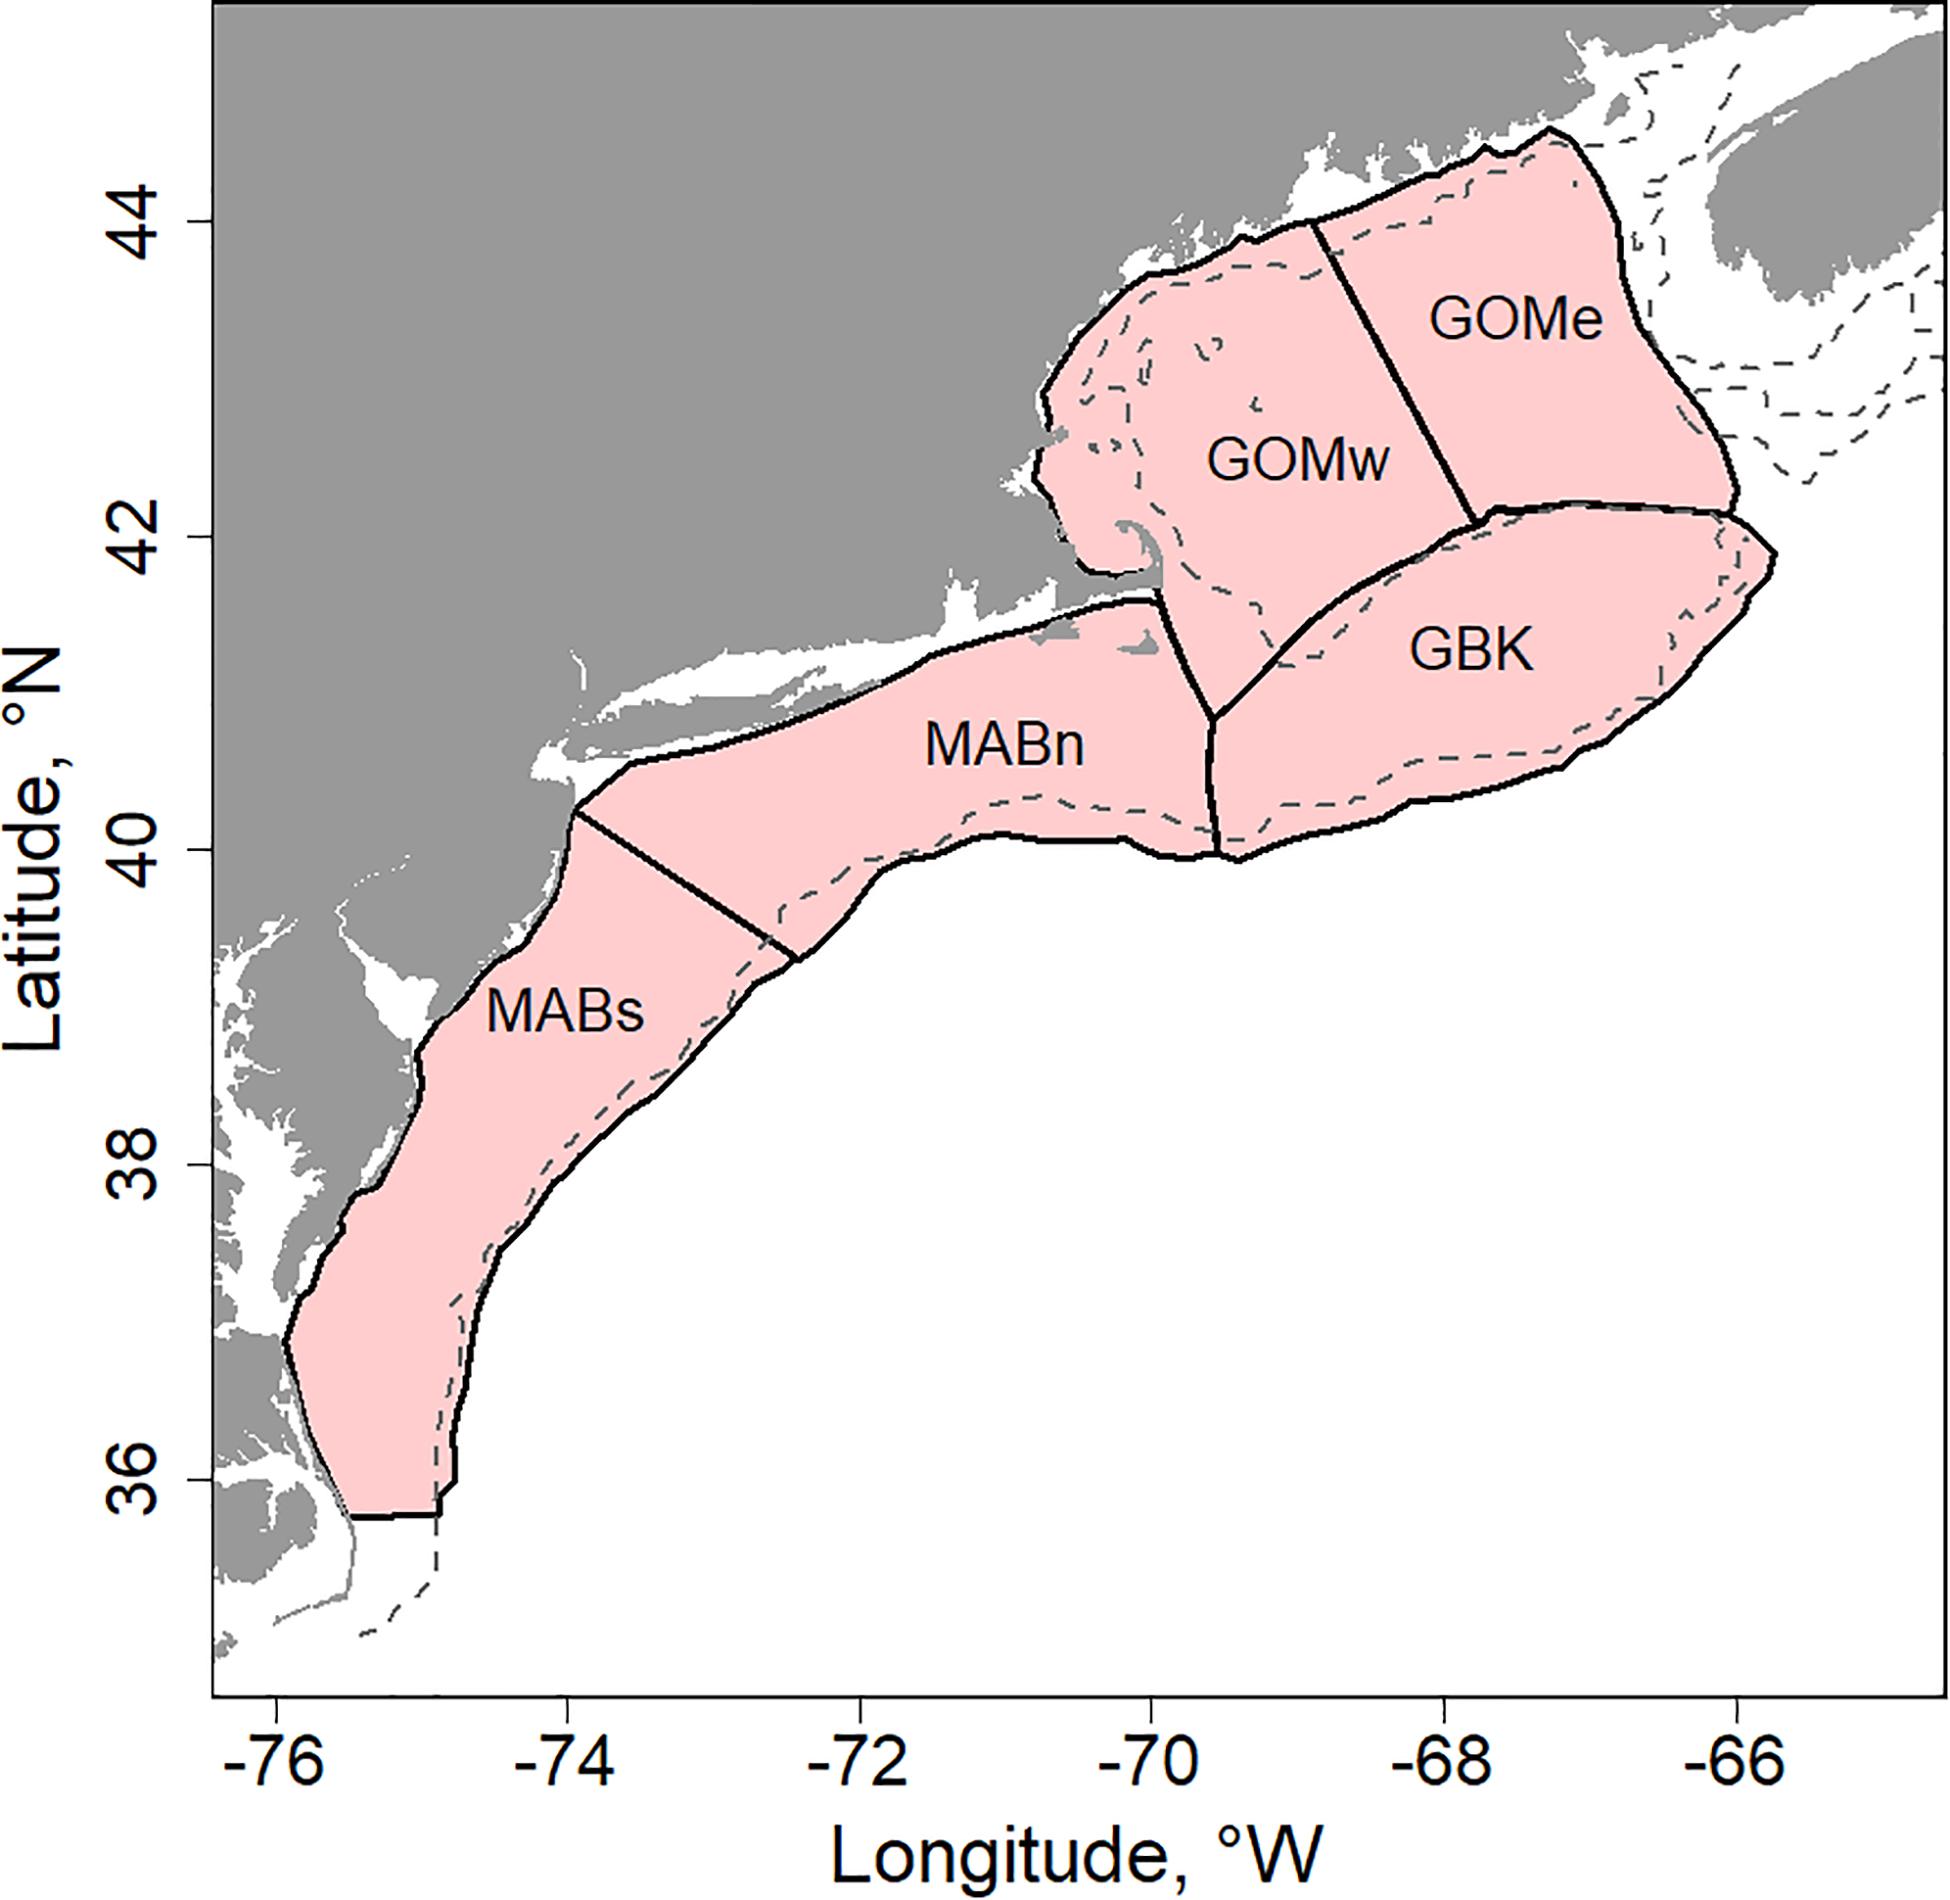
Figure 1. US Northeast Shelf study area (NES) highlighted with shading and delimited to five subareas including: Georges Bank (GBK); Gulf of Maine east and west (GOMe and GOMw, respectively); and, Middle Atlantic Bight north and south (MABn and MABs, respectively), dashed line is the 100 m depth contour.
Sea Surface Temperature
High resolution sea surface temperature (SST) data for the ecosystem and subdivisions were sourced from the NOAA Optimum Interpolation (OISTT) 0.25 Degree Daily Sea Surface Temperature Analysis dataset (Reynolds et al., 2007). For the purposes of this study, we calculated monthly means from the daily data while retaining its spatial resolution (see “Data Availability Statement”).
Salinity
Salinity in practical salinity units (PSU) for the NES was sourced from shipboard data and estimated using an interpolation method described in Friedland et al. (2019). The main source of the data was ongoing resource and ecosystem surveys of the NES conducted by the Northeast Fisheries Science Center (NEFSC) of the National Marine Fisheries Service (see “Data Availability Statement”). Water column temperature and salinity have been collected contemporaneously with tows associated with the fall seasonal bottom trawl survey beginning in 1963 with the spring survey starting 5 years later (Desprespatanjo et al., 1988). In addition, data was also collected in two comprehensive ecosystem surveys over the study period including the Marine Resources Monitoring Assessment and Prediction program or MARMAP (1977–1987) and the Ecosystem Monitoring program or EcoMon (1992-present), both providing shelf-wide observations (Sherman et al., 1998; Kane, 2007). These data provide time series of spring and fall salinity in all the subareas. The spring and fall salinity time series were correlated (Spearman rank order correlation, p < 0.05); hence, we combined the seasonal time series to produce an annual PSU time series by taking the mean.
Chlorophyll Concentration
Chlorophyll concentration (CHL) data were extracted from a merged multi-sensor ocean color data product from the Hermes GlobColour (see “Data Availability Statement”). This product includes measurements made with the Sea-viewing Wide Field of View Sensor (SeaWiFS), Moderate Resolution Imaging Spectroradiometer on the Aqua satellite (MODIS), Medium Resolution Imaging Spectrometer (MERIS), and Visible and Infrared Imaging/Radiometer Suite (VIIRS) sensors during the period 1998–2019. The data were merged using the Garver, Siegel, Maritorena Model (GSM) algorithm (Maritorena et al., 2010). CHL was summarized as annual and seasonal means; the spring or first half of year seasonal was the average CHL from January through June; and, fall or second half of the year was the average CHL from July through December. The two halves of the year reflect the bloom patterns found in the NES that includes both spring and fall blooms (Friedland et al., 2016). Seasonal CHL time series were plotted as Z-scores (observation minus the mean and divided by the standard deviation) as were the phytoplankton size fraction and phytoplankton functional type data described below.
Time Series Change Points and Trend
We identified change in study time series as both discreet change points and trends, both of which may potentially indicate underlying processes such as a regime shift. We applied two parametric modeling approaches to identify potential change points in the annual means of SST, salinity, and CHL data. First, discrete change points or a change in signal level within a single time step were identified with the sequential averaging algorithm called STARS or “sequential t-test analysis of regime shifts” (Rodionov, 2004, 2006; Thomson and Emery, 2014). The STARS algorithm parameters were specified a priori to detect change in thermal, salinity, and chlorophyll regimes (alpha level α = 0.05; the length criteria was set to 10; and, the Huber weight was set to 1). To be consistent with the terminology associated with the STARS algorithm, the change in a parameter level before and after a change point is referred to as the change in regime means, which may have the units of°C, PSU, or mg m–3. Second, we fit piecewise linear relationships using the R package “segmented” (version 1.1-0), which fits the data as segmented linear models while identifying time series break-points (Muggeo, 2003, 2017). The performance of these approaches was compared for an individual time series with Akaike information criterion (AIC) using the simplified form intended for model comparison.
Where RSS is the residual sum of squares, n is the number of observations, and k is the number of independent parameters (Burnham and Anderson, 2004). To evaluate trends in the data, we applied a non-parametric test of time series trend using the R package “zyp” (version 0.10–1.1). We used the Yue and Pilon method to estimate Theil-Sen slopes and performs an auto-correlation corrected Mann-Kendall test of trend (Yue et al., 2002).
Phytoplankton Size Fractions
Estimates of phytoplankton size fraction contribution to total CHL were based on the three-component model of phytoplankton size classes (Lamont et al., 2019) using the global parameters from Brewin et al. (2015). The model provides estimates of the contribution of microphytoplankton (> 20 μm), nanophytoplankton (2–20 μm), and picophytoplankton (< 2 μm) to total CHL. Model equations provide an estimate of the CHL fraction that is associated with combined contribution of pico- and nanoplankton:
and picoplankton only:
Which by difference yield the nano- and the microplankton fractions, Cn and Cm, respectively. The model was parameterized using the following global model estimates.
These parameters are similar to the average across regional and other global study estimates.
Phytoplankton Functional Types
Three complimentary approaches are considered for estimating Phytoplankton Functional Types (PFTs) to evaluate change in the quality of phytoplankton entering the food web of the NES. First, we used the method presented in Moisan et al. (2017) for studying spatial distributions of PFTs, their phenology, and ecotones along the U.S. east coast. That study utilized a total of 172 independent measurements of phytoplankton absorption spectra and High-Performance Liquid Chromatography (HPLC) pigment measurements to develop a satellite-based model for PFTs. Pigment-specific absorption spectra for 18 phytoplankton pigments were obtained by inverting the observed pigment concentrations and the total phytoplankton absorption at each wavelength using Singular Value Decomposition, SVD (Press et al., 1987). The resulting pigment-specific absorption spectra were then used with individual phytoplankton absorption spectra with the Non-Negative Least Squares, NNLS (Lawson and Hanson, 1995) inversion method to estimate the pigment concentrations. The individual phytoplankton absorption spectra values at each wavelength were modeled as a second order function with chlorophyll a as the independent variable.
In this study, the resulting SVD-derived pigment-specific absorption spectra and the wavelength-dependent, second order model coefficients for absorption spectra from Moisan et al. (2011) are used with the annual mean 1998–2019 chlorophyll a estimates for each of the five subareas to estimate the PFT time series. The chlorophyll a values are used with the second-order linear model to estimate the phytoplankton absorption spectra. These spectra are then used with the SVD-derived pigment-specific absorption spectra in the NNLS inverse process to estimate the 18 different phytoplankton pigments.
Once maps of the 18 phytoplankton pigments were derived, they were used to generate estimates of the various PFTs by using the estimation formulas outlined in Table 1 of Hirata et al. (2011) for diatoms, dinoflagellates, prymnesiophytes, prokaryotes, and green algae. The pigments necessary as inputs for these algorithms included: fucoxanthin, peridinin, chlorophyll-b, 19-butanoyloxyfucoxanthin, 19-hexanoyloxyfucoxanthin, alloxanthin, and zeaxanthin. A time series of these functional types were calculated for all five subareas.
The second approach used was an algorithm designed to estimate the dominant PFTs at a location. The method is called PHYSTWO and is described in Correa-Ramirez et al. (2018). The approach uses Empirical Orthogonal Function (EOF) decomposition to relate pigment signatures to water-leaving radiances. It applies normalized radiances at seven wavelengths including 412, 443, 469, 488, 531, 547, and 555 nm. The analysis was based on the monthly 25 km merged reflectance data retrieved from the same source as the CHL data. The PFT estimates were made for the period 2003 through 2019, which corresponds to the sensor collections for these wavelengths. Reflectance at 488 nm was estimated based on an interpolation of reflectance data for 469 and 490 nm. The PFT identified Nanoeucaryotes (typically chlorophytes and cryptophytes), Diatoms, Coccolithophorids, Phaeocystis-like (typically haptophytes), and two cyanobacteria, Prochloroccocus and Synechococcus. Following the approach used in Alvain et al. (2008), the percent contribution of a PFT was estimated as the ratio of the area of NES with each PFT to the total. Monthly means of the percent contributions of PFT were calculated over the course of each year.
Finally, as verification of modeled PFT data, we queried the abundance of total diatoms and dinoflagellates from the Continuous Plankton Recorder (CPR) Survey dataset. The CPR collects continuous measurements of zooplankton and phytoplankton taxa retained on the CPR mesh, hence it includes a partial sampling of the microphytoplankton (Batten et al., 2003). Monthly samples were collected in the NES during the period of 1998–2018, however, not all NES subareas were sampled over the entire period. The GBK and MABn subareas were sampled in all 21 years the time series and GOMe was sample in 20 years, however, GOMw and MABs were sampled in less than 7 years each. The average number of annual sample units was 138; a sample consisted of a total number of diatoms and dinoflagellates from 68 to 35 taxa, respectively (see “Data Availability Statement”).
Survey Growth Trends
Change in the size at age of fish in the NES was assessed using biological data collected during the Northeast Fisheries Science Center (NEFSC) bottom trawl survey (Desprespatanjo et al., 1988). Catch weight was collected during the full duration of the survey, however, individual weight measurements began in 1992 (see “Data Availability Statement”). From these data, changes in length and weight at age were examined. The size at age metrics were computed for a subset of survey species having sufficient age samples. Annual growth indices were computed using a general linear model (GLM) following the approaches applied to estimate catch per unit effort (Forrestal et al., 2019). The general form of the size at age GLM was:
Moreover, it was also partitioned by season and sex. Year factor coefficients were used to represent the rate of change over time. The change in size at age was assessed with canonical correlation with temperature, salinity, and chlorophyll concentration as environmental covariates. The canonical correlation was fit using the CCA package in R (version 1.2).
Survey Biomass by Functional Groups
Seasonal time series trends in biota were represented by the CPUE for biomass of all taxa from the bottom trawl survey (see “Data Availability Statement”), and by assignment to functional groups based on their adult prey preferences and vertical distribution (Friedland et al., 2020). The functional groupings included benthivores, demersal piscivores, pelagic piscivores, and planktivores. Catches were standardized for various correction factors related to vessels and gears used in the time series (Miller et al., 2010). The spring and fall CPUE time series were correlated with Spearman rank order correlation reasoning that since many taxa are known to undertake seasonal migrations, correlated spring and fall signals could be considered an indication of more reliable abundance data. Similar to the change in size at age analysis, the change in biomass was assessed with canonical correlation with temperature, salinity, and chlorophyll concentration as environmental covariates.
Results
Trends in SST, PSU, and CHL
The main result of the trend analysis is that CHL declined in the Northeast Shelf as both SST and salinity increased, with change points in these data around the year 2012. We found that SST in the NES increased from ∼12 to 13°C in a stepwise fashion with a change point in 2012 (Figure 2A), which was also the highest SST in the time series. Salinity also increased in a stepwise fashion by ∼0.3 PSU, albeit in the year after the SST shift, noting there were no local maxima in salinity around the year 2012 (Figure 2B). The non-parametric trend test for NES SST yielded a significant positive Theil–Sen slope, however, the positive slope for salinity was non-significant at p = 0.1 (Table 1). In contrast, CHL decreased from ∼1.5 to 1.1 mg m–3 in a segmented linear fashion, with a change point in 2012 (Figure 2C); and, the highest system-wide CHL level occurred in 2011. The Theil–Sen slope for NES CHL was negative and significant.
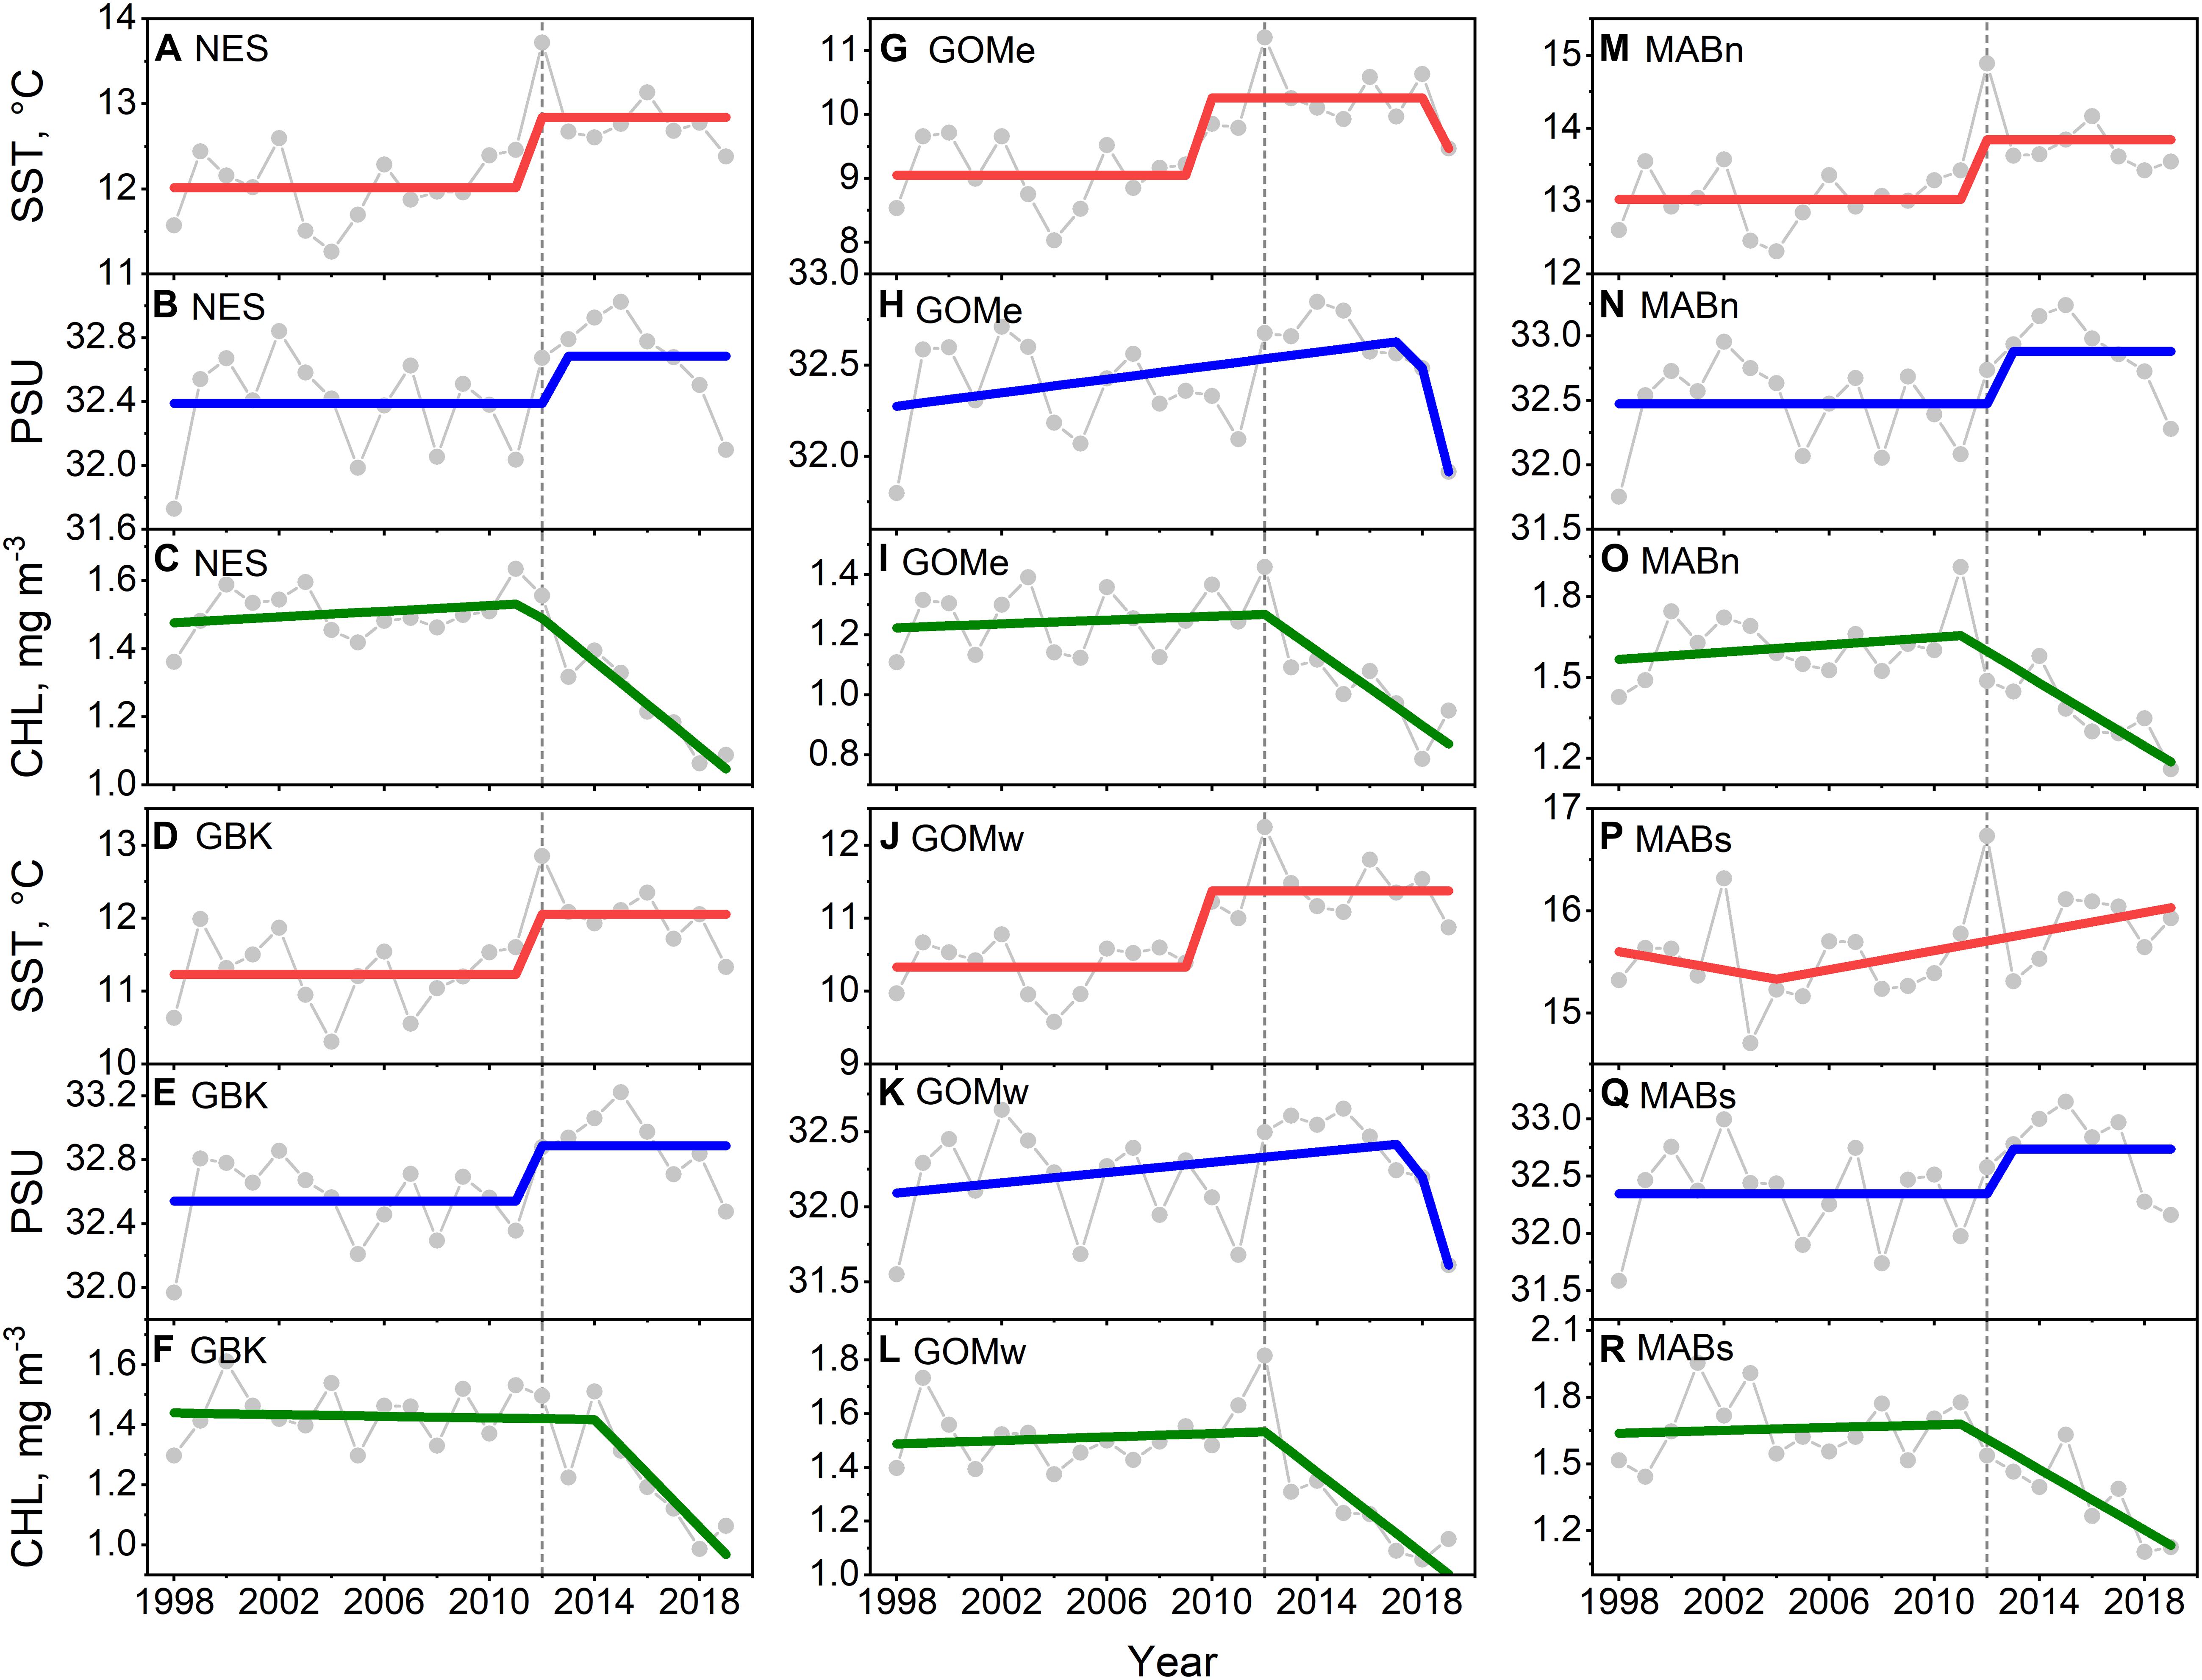
Figure 2. Mean annual SST (A,D,G,J,M,P) for the Northeast Shelf (NES) and NES subareas (NES, GBK, GOMe, GOMw, MABn, and MABs, respectively), mean annual PSU (B,E,H,K,N,Q) and mean annual CHL (C,F,I,L,O,R) for the same areas, respectively. Lines are either STARS or segmented regression model fits; 2012 is highlighted with vertical dotted line.
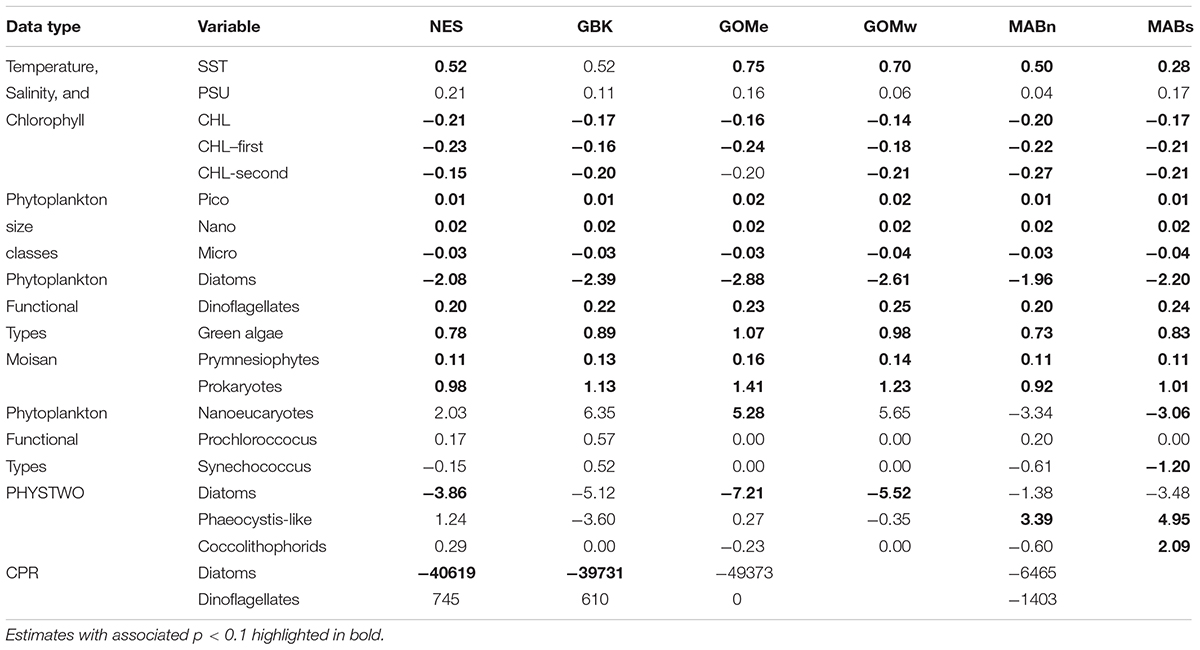
Table 1. Theil–Sen slope estimates expressed in decadal rate of change for environmental variables by NES and NES subareas (NES, GBK, GOMe, GOMw, MABn, and MABs).
Similar patterns were found in the NES subareas time series of SST, salinity, and CHL. The pattern found for the NES as a whole was reflected in Georges Bank (Figures 2D–F) and MABn (Figures 2M–O). The SST change points in Gulf of Maine east (Figures 2G–I), and Gulf of Maine west (Figures 2J–L) subareas initiated earlier than the NES as a whole or in the neighboring Georges Bank area. In addition, the GOMe and GOMw salinity time series were modeled marginally better with a segment regression suggesting a less distinct transition in salinity. The segmented regression depiction of change in CHL in these areas was similar to the other parts of the ecosystem. The SST time series in the MABs was modeled best with segmented regression, and though 2012 was the warmest year in the time series, there was no evidence of a change in SST level as seen in the more northerly subareas (Figures 2P–R). The Theil–Sen slopes for the subareas follow the NES trend with the exception of Georges Bank SST, which had a positive trend that was non-significant. To summarize, the NES and its regional subareas experienced a shift in SST, salinity, and CHL around 2012. Both SST and salinity started increasing around this change point while CHL decreased, noting that the change in SST and salinity were generally more stepwise whereas the change in CHL was gradual.
Seasonal CHL
Seasonal CHL generally followed the patterns established in the annual means suggesting that spring and fall blooms have been affected by a similar set of factors. CHL for the first half of the year followed a coherent pattern of decline after 2012, similar to the CHL annual trend for the NES (Figure 3A). The Theil–Sen slopes for the first half of the year CHL were all negative and significant (Table 1). The CHL for the second half of the year were also coherent among the subareas, but had features that varied from the first half of the year (Figure 3B). In particular, localized minima around 2004 and maxima around 2011 varied between the data series. The Theil–Sen slopes for the second half of the year CHL were all negative and significant with exception of the data for Gulf of Maine east.
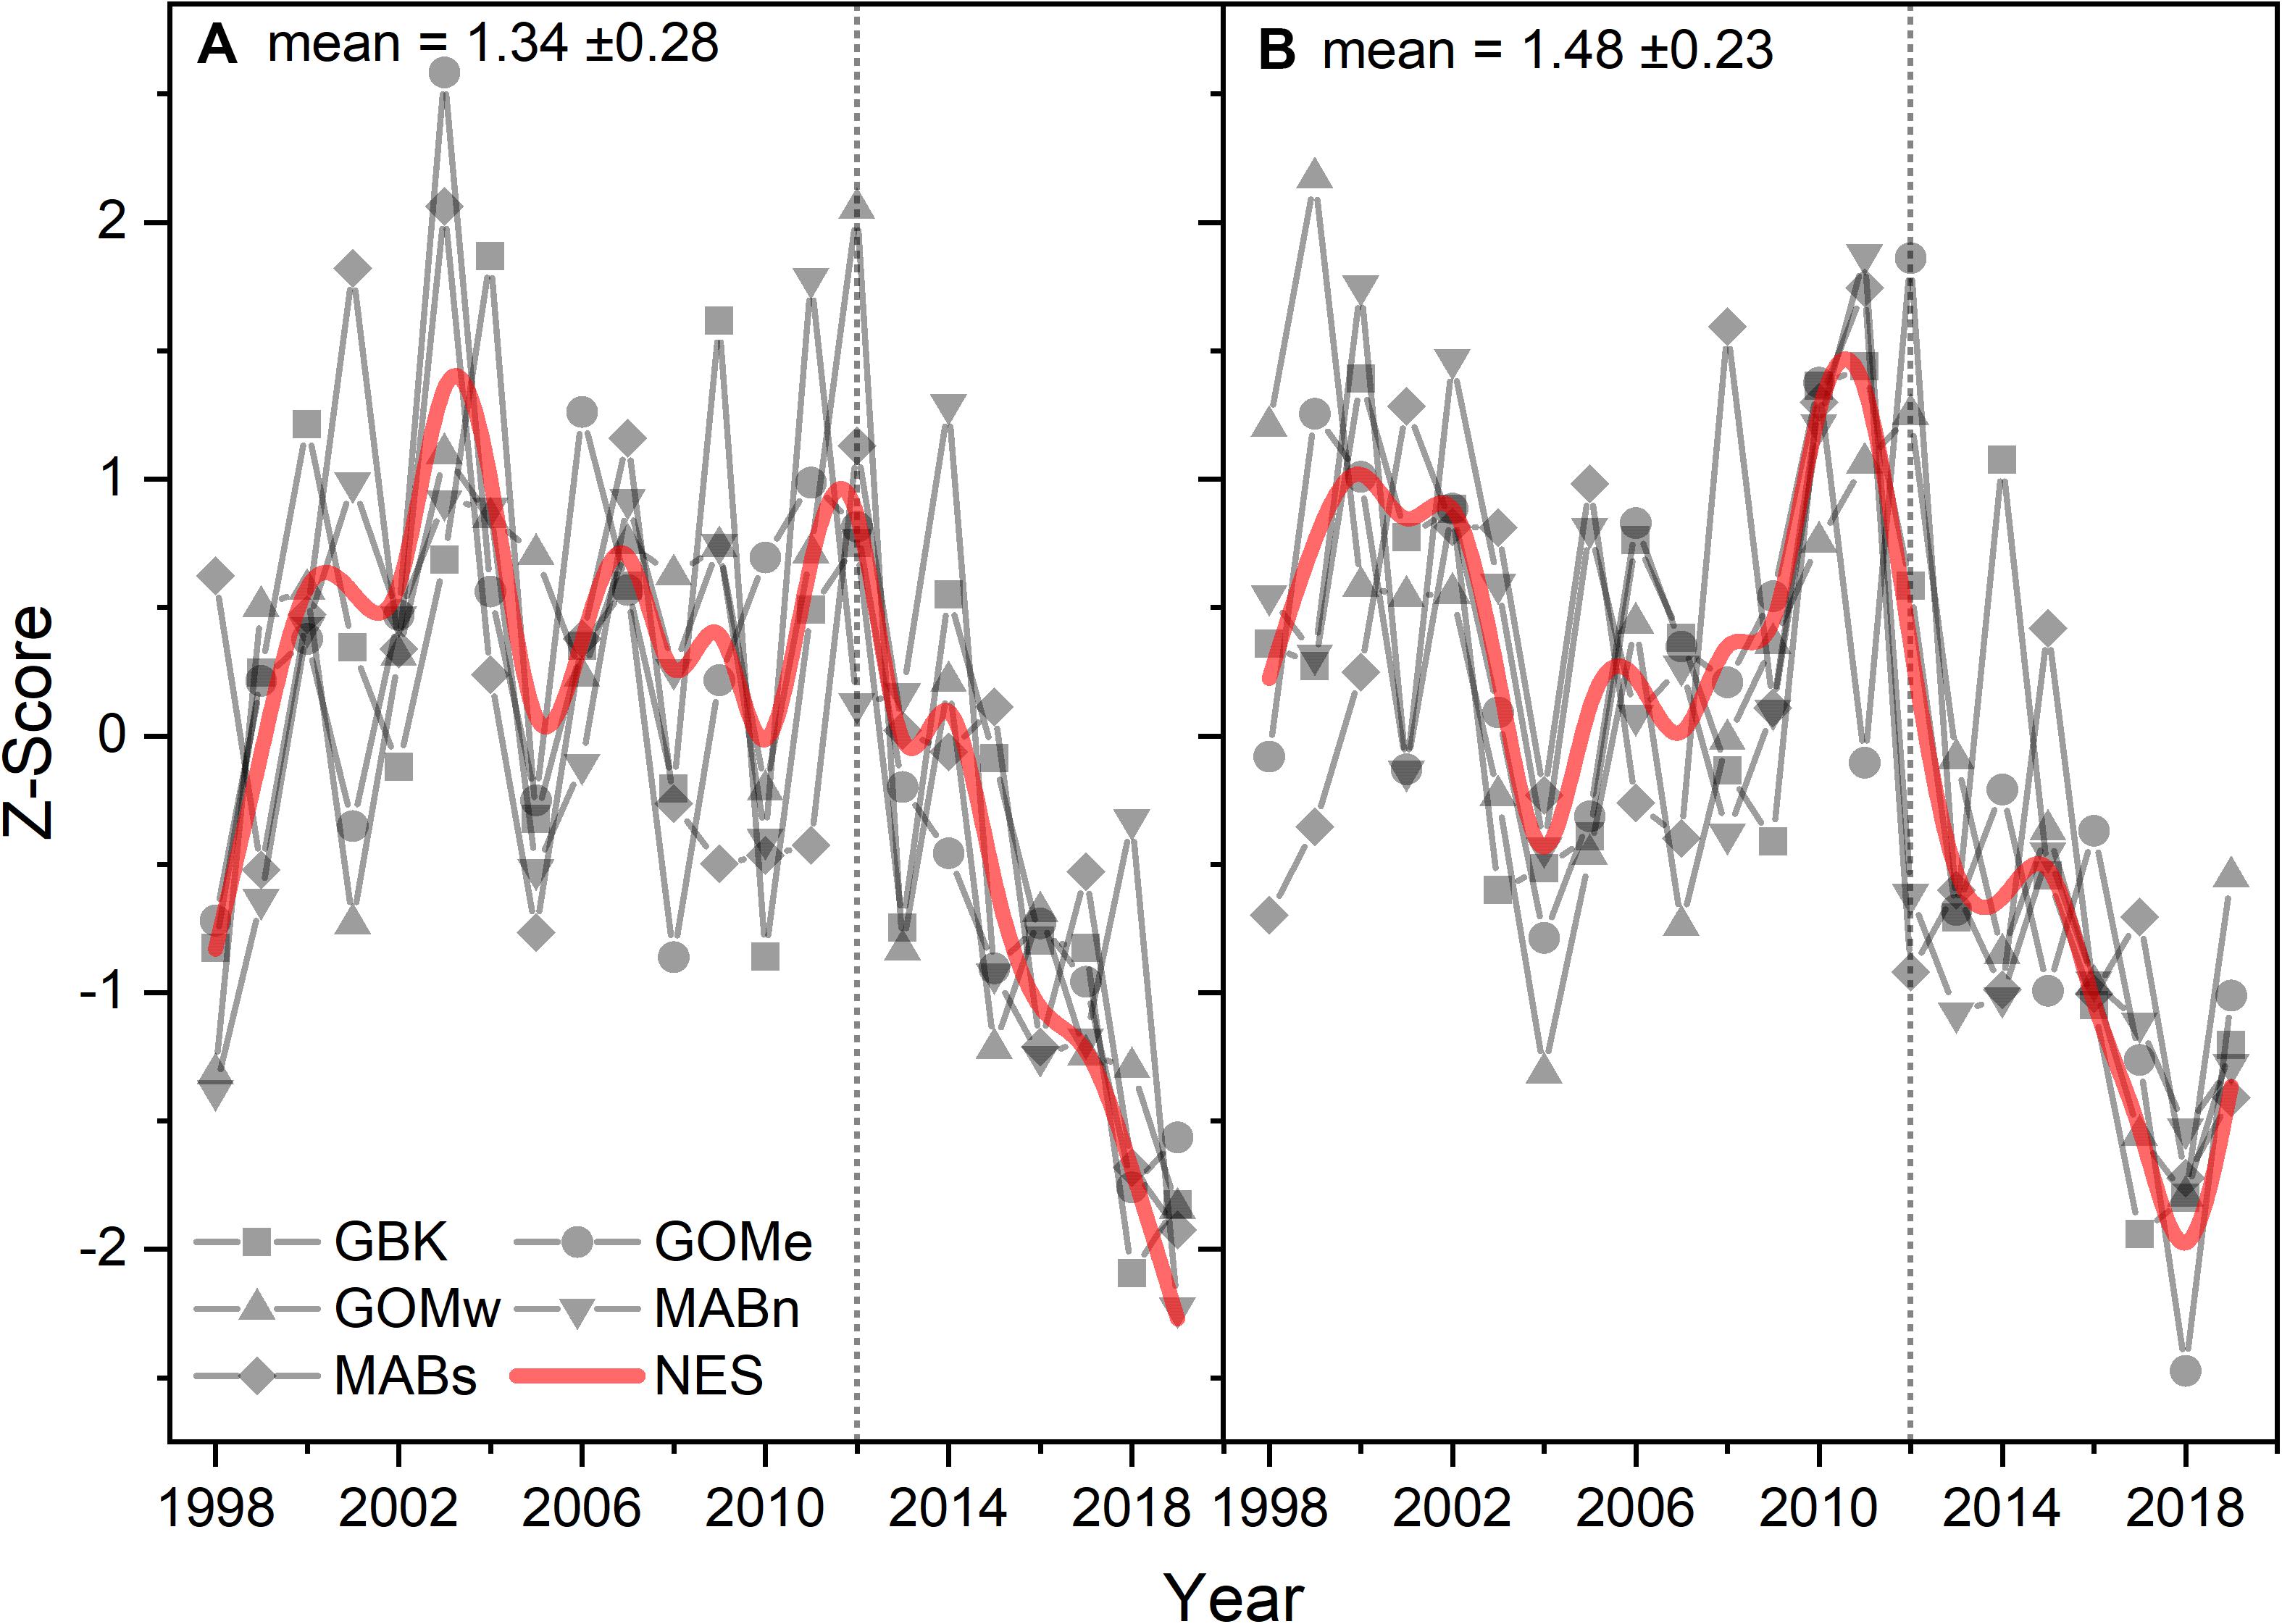
Figure 3. Z-score of CHL for the first (A) and second (B) half of the year for the Northeast Shelf (NES) and NES subareas (NES, GBK, GOMe, GOMw, MABn, and MABs). The mean for each size class shown in the panel title with ± 1 SD; the NES time series is shown as a b-spline; 2012 is highlighted with vertical dotted line.
Phytoplankton Size Classes
The decrease in CHL throughout the ecosystem after 2012 was associated with a change in the size-class composition of the phytoplankton community. The estimates of the percent contribution to total CHL by picophytoplankton shifted from ∼10 to 14% after 2012, or a 40% increase in the contribution (Figure 4A). Similarly, nanophytoplankton exhibited a shift in composition from ∼23 to 28%, or a 22% increase in the contribution (Figure 4B). The increase in the contribution of smaller phytoplankton appears to come at the expense of microphytoplankton, which shifted from a contribution of 67 to 58%, or a 13% decline in contribution (Figure 4C). The Theil–Sen slopes for the trends in pico- and nanophytoplankton were all positive and significant; whereas, the trends for microphytoplankton were negative and significant (Table 1). In summary, the shift in NES CHL likely also represents a shift in the size class composition of the phytoplankton community driven by the increasing availability of smaller cells vs. larger cell taxa.
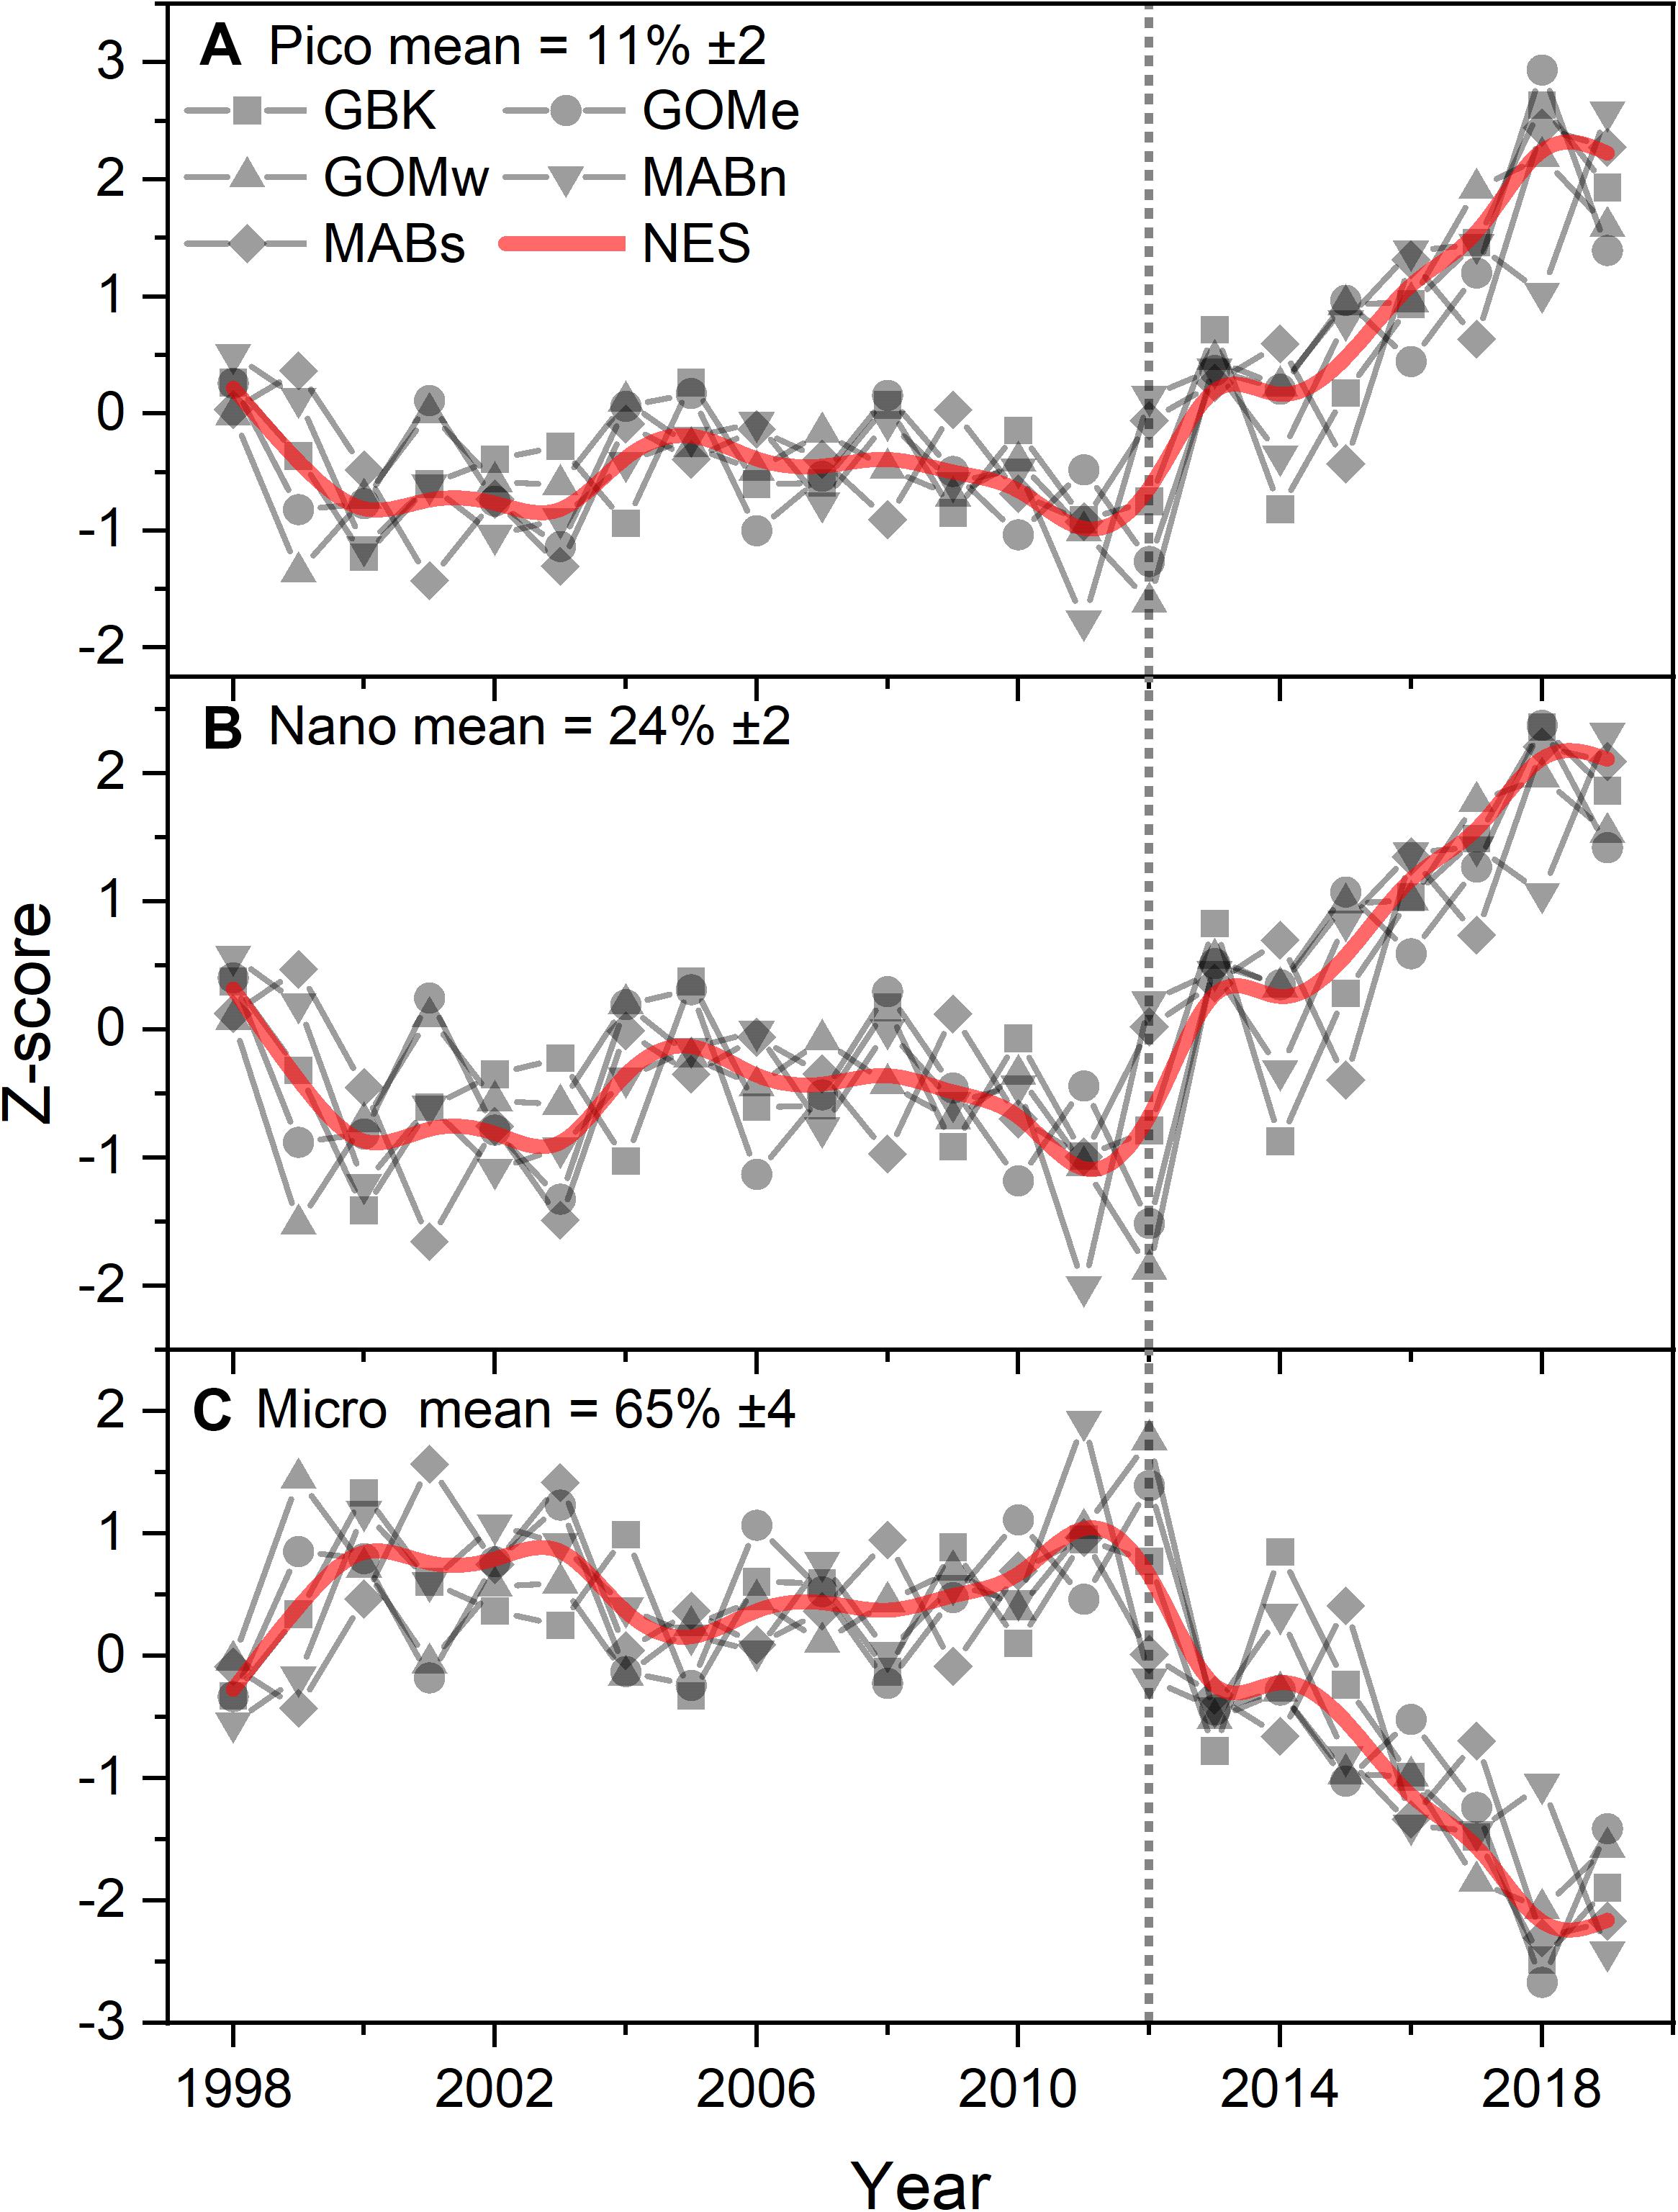
Figure 4. Z-score of estimated phytoplankton size fractional contribution percentage of pico (A), nano (B), and micro (C) plankton to total chlorophyll for the Northeast Shelf (NES) and NES subareas (NES, GBK, GOMe, GOMw, MABn, and MABs). The mean percentage for each size class shown in the panel title with ± 1 SD; the NES time series is shown as a b-spline; 2012 is highlighted with vertical dotted line.
Phytoplankton Functional Types
Analysis of the PFT time series using the Moisan method suggests phytoplankton populations were relatively stable from 1998 to 2012. In the NES region, diatoms, dinoflagellates, green algae, prymnesiophytes and prokaryotes comprised nearly 63, 11, 13, 2, and 12 percent of the phytoplankton biomass in terms of chlorophyll a, respectively (Figures 5A–E). In 2012, all of these populations of phytoplankton show a dramatic linear trend away from the prior relatively stable levels. Specifically, the diatom population shows a decrease while all of the other functional types show increases in their relative percent biomass. These changes were consistent with a shift away from high production coastal phytoplankton populations to a more open ocean, less productive domain. These estimated changes were supported by the observed nearly 50% decrease in the chlorophyll a levels. These changes in phytoplankton composition were further corroborated by the phytoplankton size class estimates which show stable size class population levels prior to 2012 and decreasing microplankton with increasing nanoplankton and picoplankton levels after 2012, indicating a population shift away from a eutrophic coastal productive population to a more oligotrophic and less productive population. The Theil–Sen slopes for PFT in the analysis were significant and were positive trends except for diatoms, which had negative trends (Table 1).
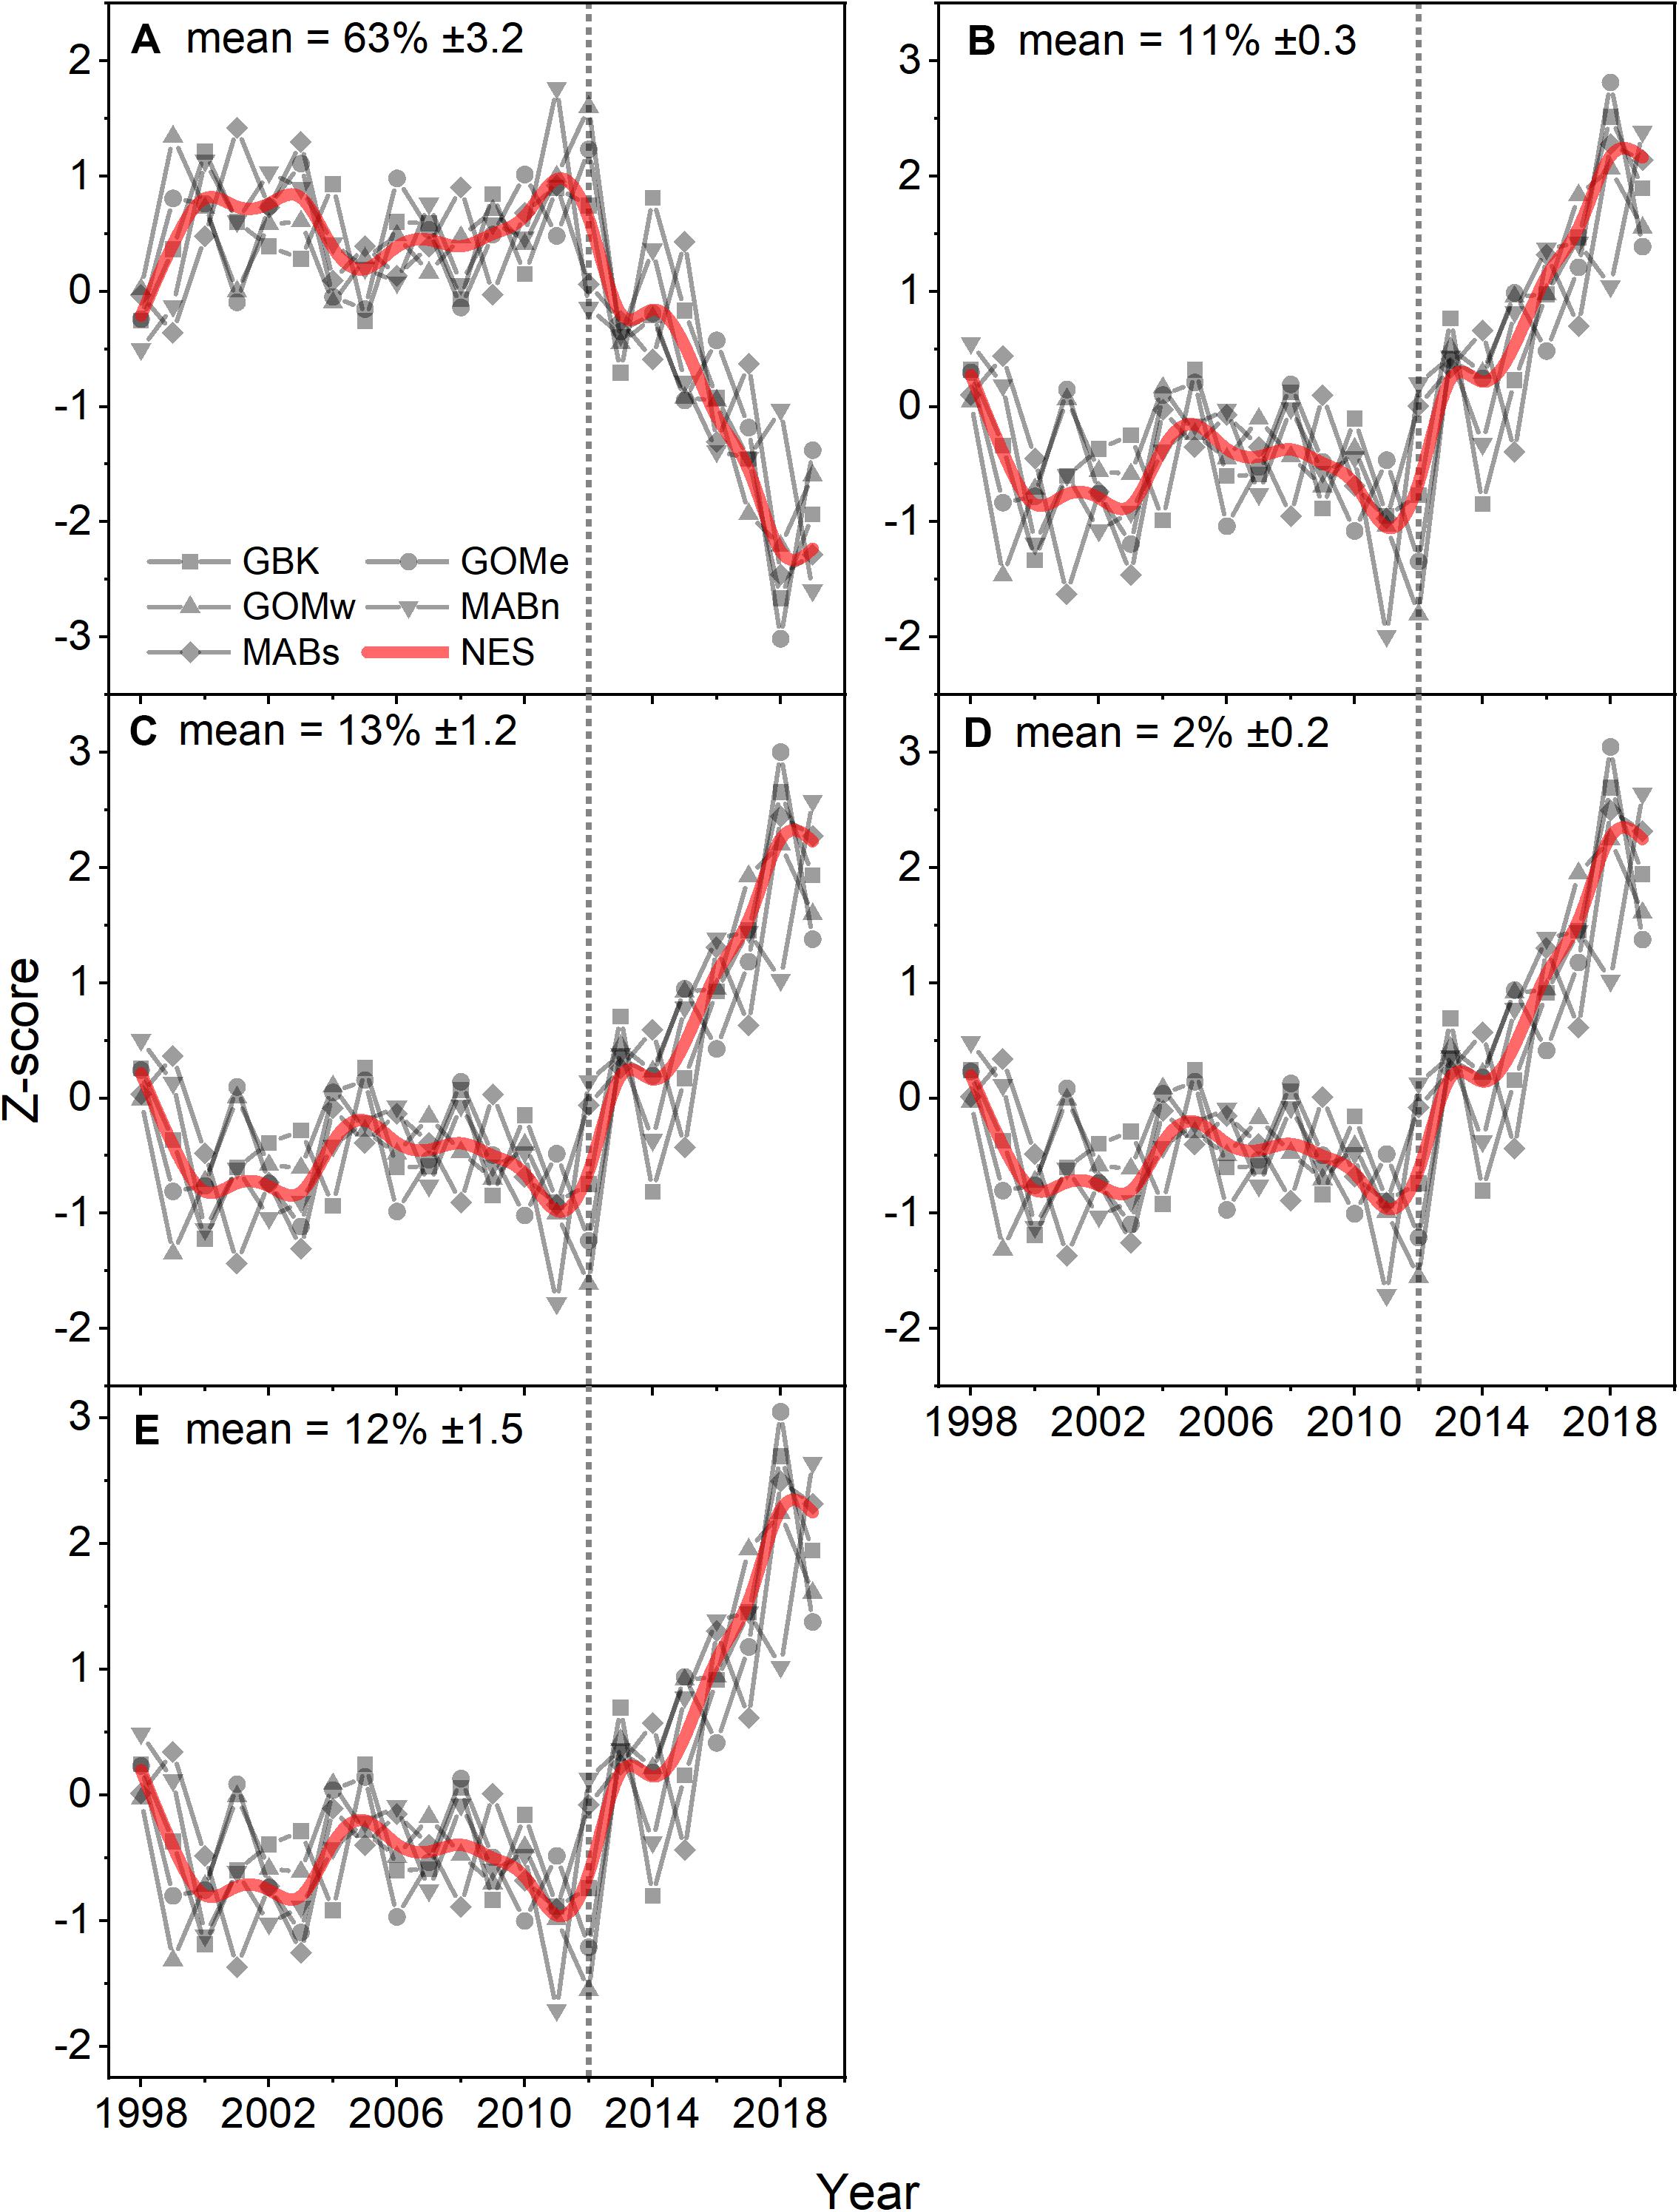
Figure 5. Z-score of estimated percent contribution of PFT diatoms (A), dinoflagellates (B), green algae (C), prymnesiophytes (D), and prokaryotes (E) for the Northeast Shelf (NES) and NES subareas (NES, GBK, GOMe, GOMw, MABn, and MABs). The mean percentage for each PFT shown in the panel title with ± 1 SD; the NES time series is shown as a b-spline; 2012 is highlighted with vertical dotted line.
Analysis of Phytoplankton Functional Types using the PHYSTWO method largely corroborated the changes identified by the Moisan method and had the advantage of identifying changes in the dominant PFT by subarea. For the NES, Nanoeucaryotes and Diatoms were the most important functional types with average percentages of 43% in all areas (Figures 6A,B). Phaeocystis-like forms, Coccolithophorids, and cyanobacteria were low contributors with mean percentages of only 8, 3, and > 1–2%, respectively (Figures 6C–F). The only consistent trend observed was a decrease in the contribution of diatoms, however, this trend was only significant in the NES and the Gulf of Maine subareas (Table 1). The other dominant group, Nanoeucaryotes, had a significant positive trend in the Gulf of Mine east and a negative trend in the Middle Atlantic Bight south.
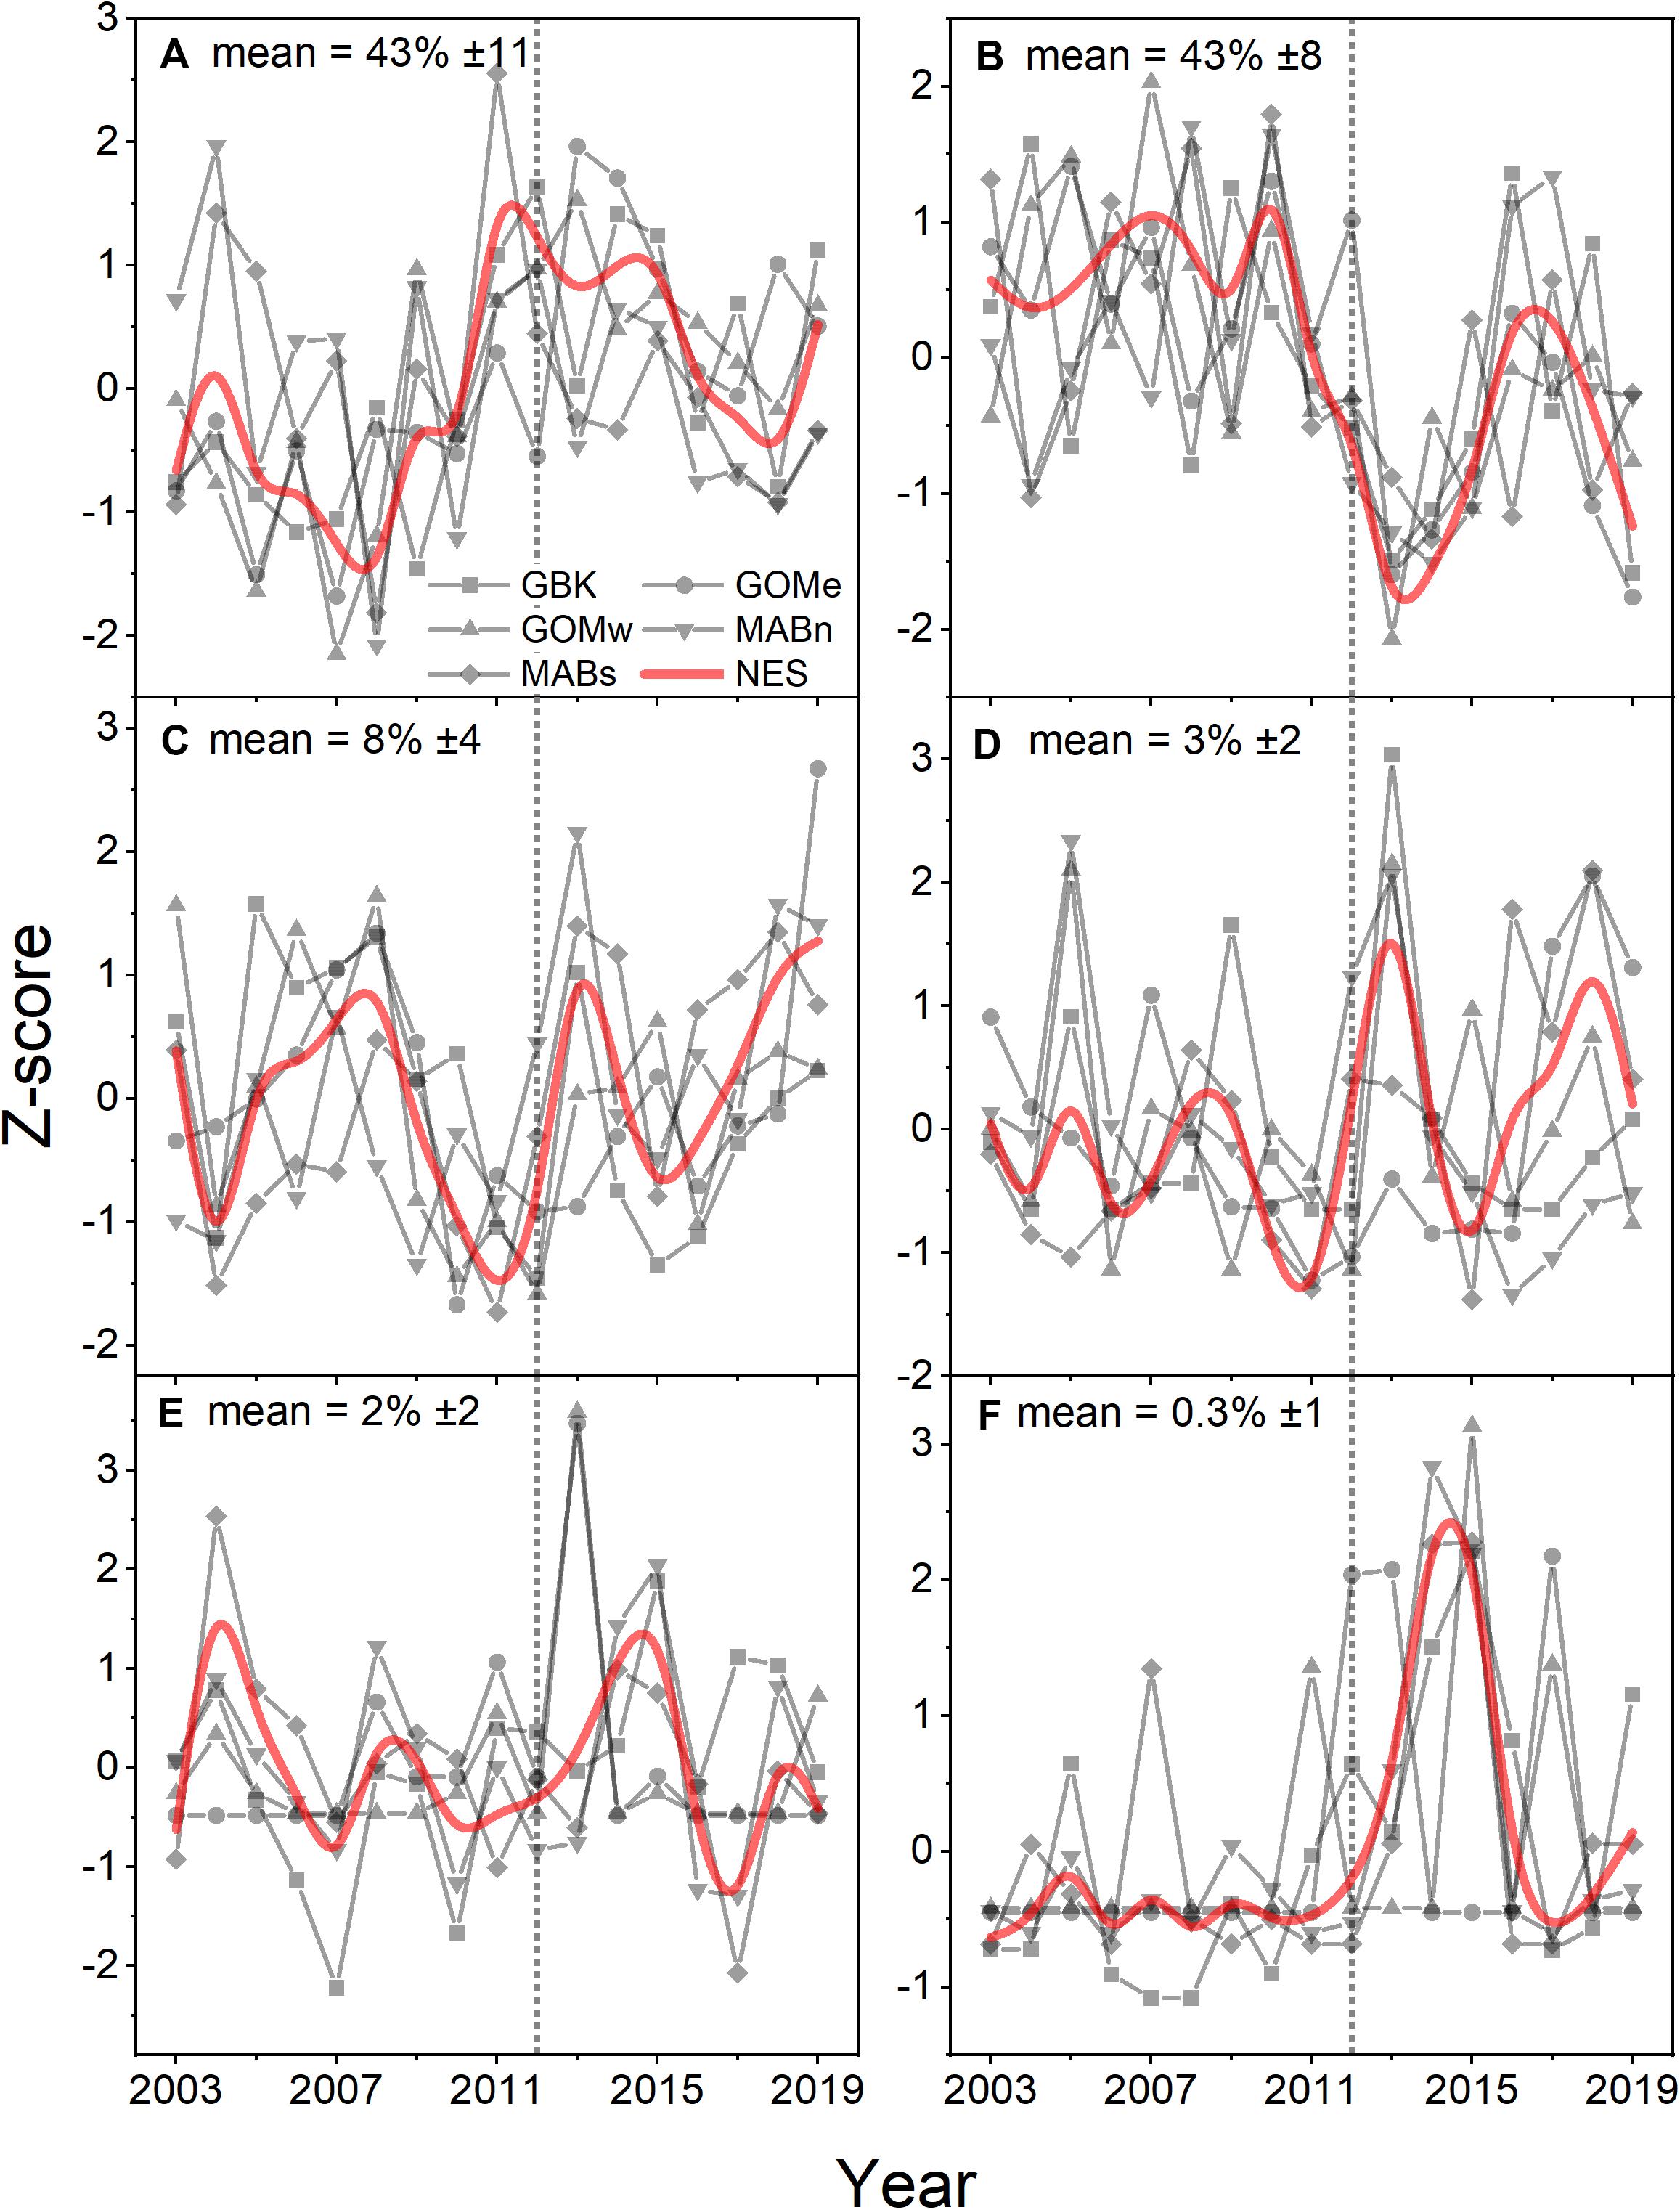
Figure 6. Z-score of percentage area where Nanoeucaryotes (A), Diatoms (B), Phaeocystis-like (C), Coccolithophorids (D), Synechococcus (E), Prochloroccocus (F) were the dominant PFT for the Northeast Shelf (NES) and NES subareas (NES, GBK, GOMe, GOMw, MABn, and MABs). The mean percentage for each PFT shown in the panel title with ± 1 SD; the NES time series is shown as a b-spline; 2012 is highlighted with vertical dotted line.
The time series CPR abundances support the conclusion that there was a change in diatom populations, but were inconclusive in respect to any change in dinoflagellates. Diatom abundances on a CPR sample unit averaged over 89,000 cells and in all the time series with sufficient data trended downward over the study period (Figure 7A). The Theil–Sen slopes were all negative for diatom trends and significant for the GBK and NES areas (Table 1). There were no apparent trends in the dinoflagellate time series (Figure 7B) and Theil–Sen slopes for these time series were of mixed sign and all non-significant. In summary, using two model-based methods to characterize Phytoplankton Functional Types, a shift was observed in functional types associated with the change in CHL in 2012 and most notably evidence to suggest a decline in diatoms in the plankton community. The conclusion of a change in diatom population based on the model-based data is in part supported by in situ sampling data.
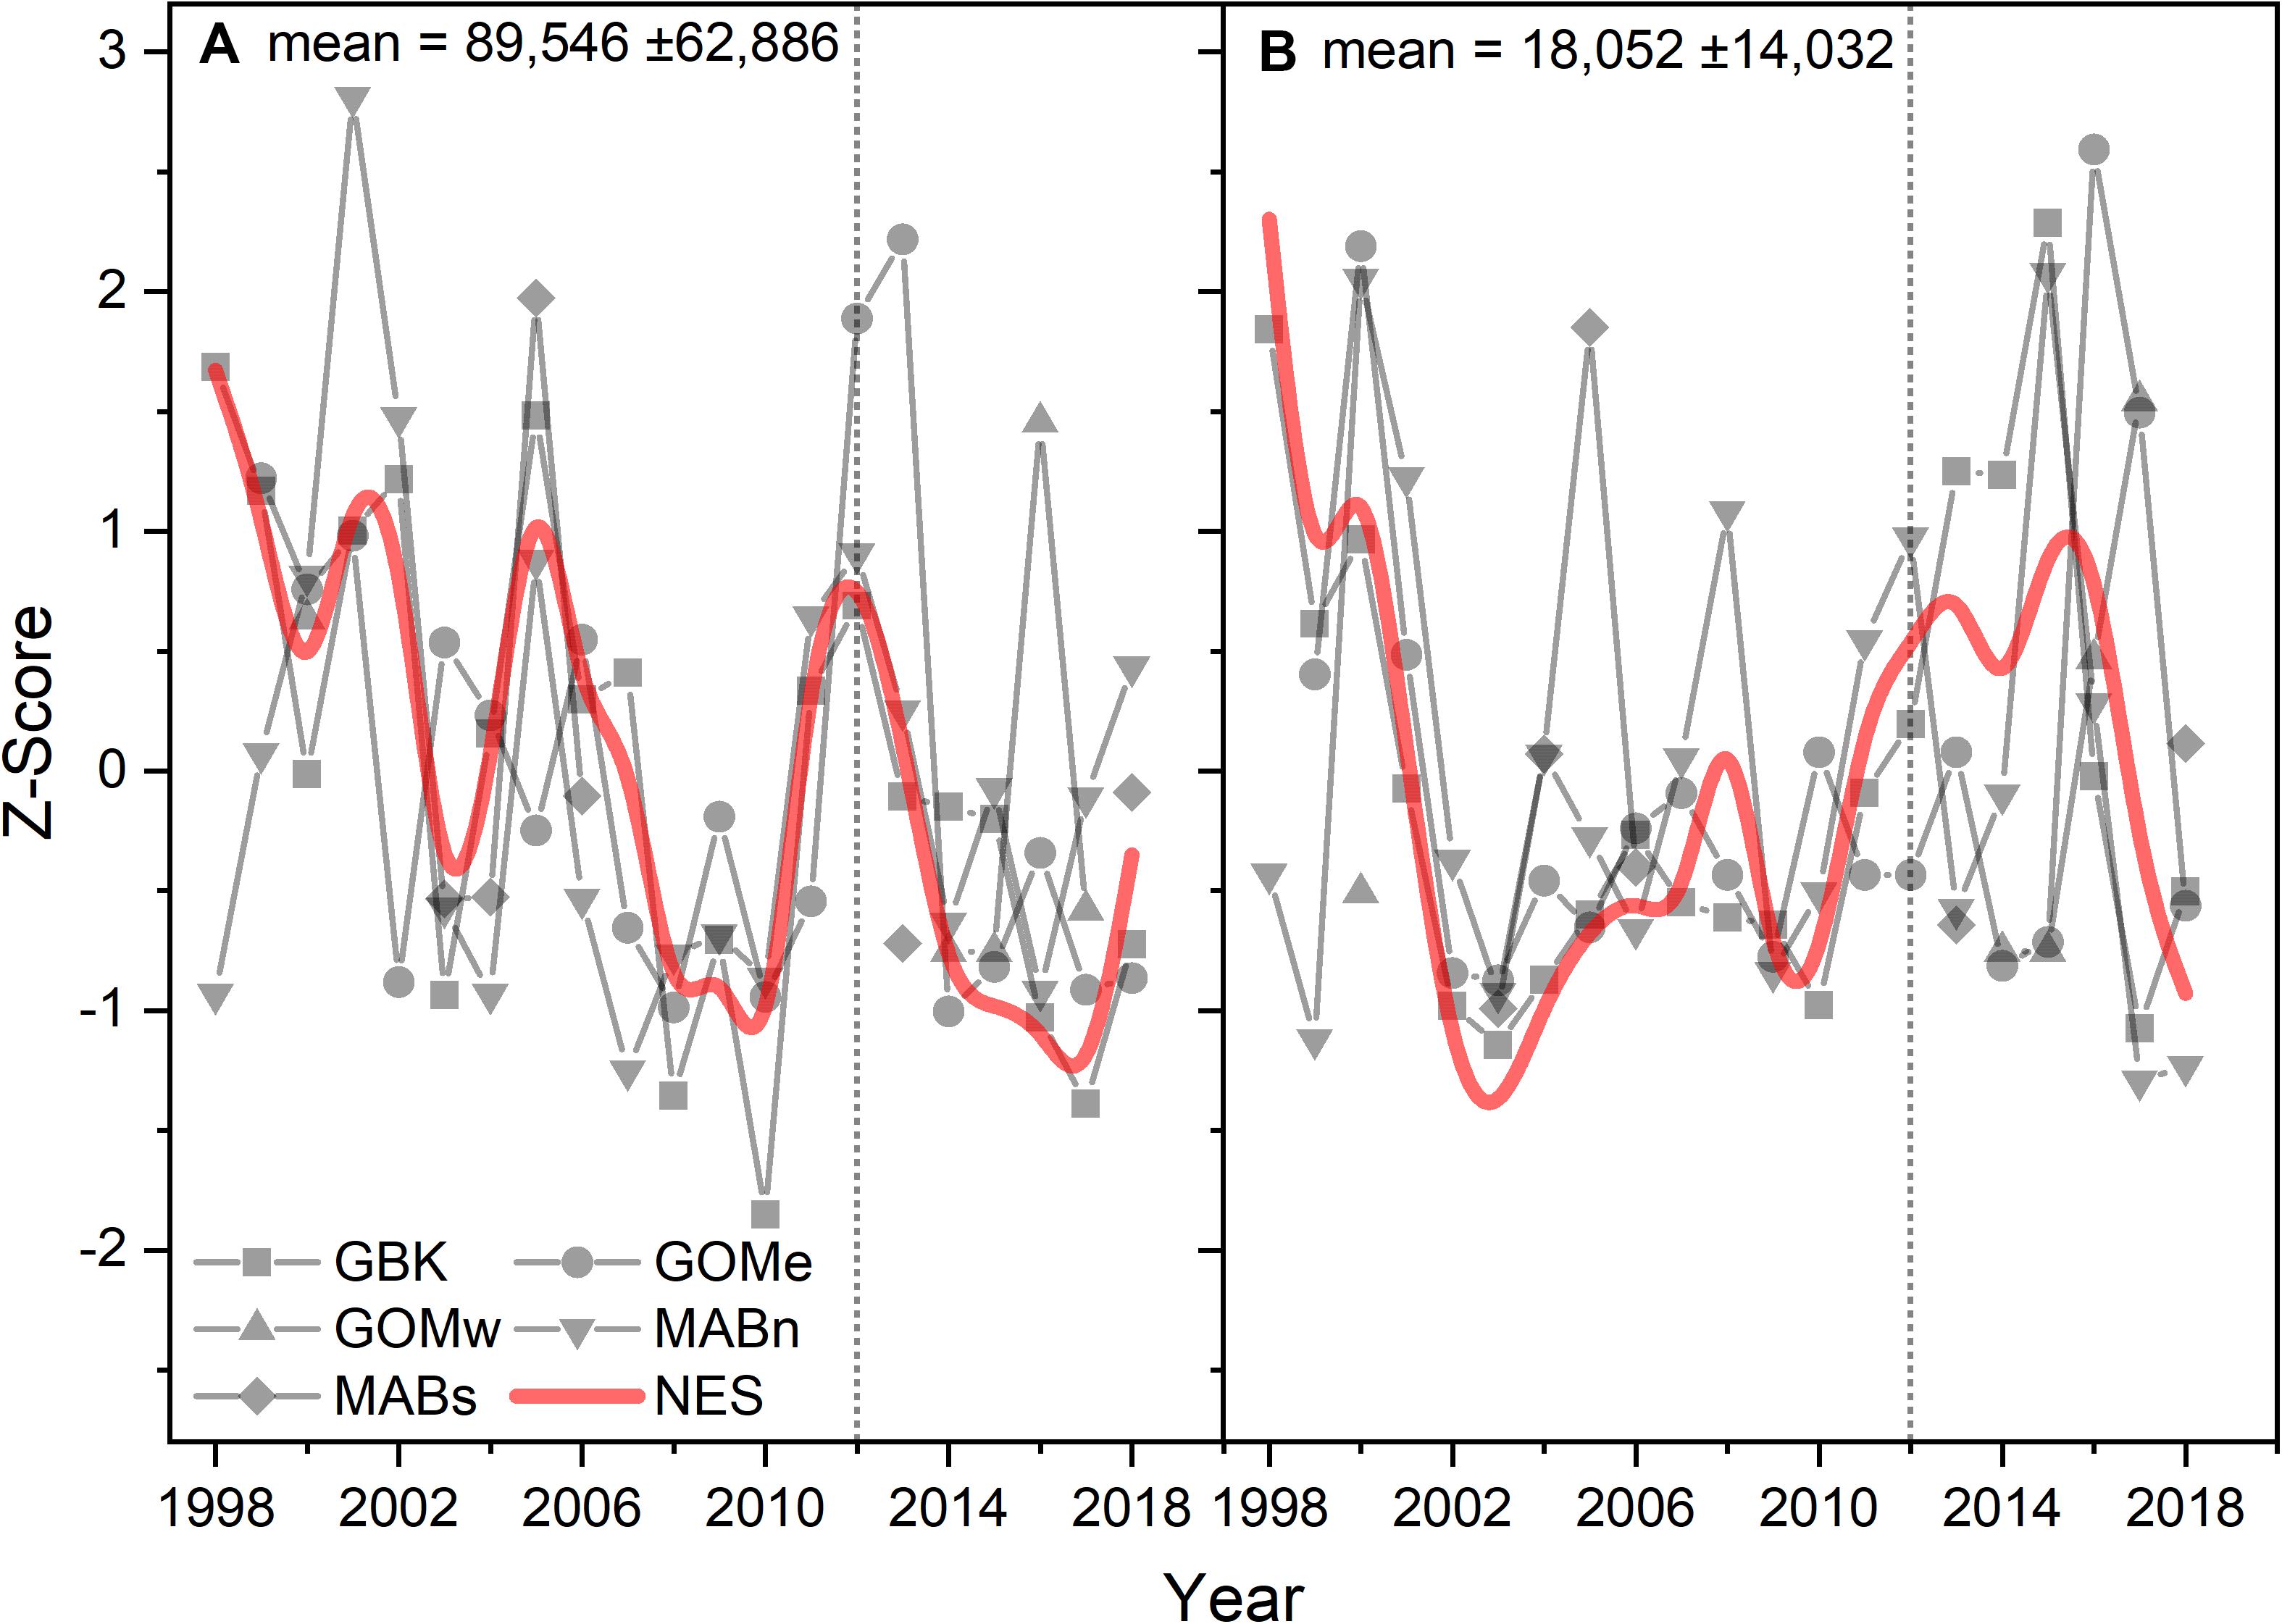
Figure 7. Z-score of the abundance of diatoms (A) and dinoflagellates (B) in a CPR sample unit for the Northeast Shelf (NES) and NES subareas (NES, GBK, GOMe, GOMw, MABn, and MABs). The mean for each abundance shown in the panel title with ± 1 SD; the NES time series is shown as a b-spline; 2012 is highlighted with vertical dotted line.
Change in Fish Growth
Size at age has declined for a number of fish species in the NES. GLM coefficients indicate that length at age for males declined during spring (Figure 8A), however, the decline in female length at age was not significant (Table 2). Spring weight at age declined for both sexes (Figure 8B). Similar to spring, fall length at age for males showed a decline, whereas females did not decline significantly (Figure 8C). Fall weight at age declined for both sexes (Figure 8D). These GLM results are a composite trend of a number of important groundfish species. Two change points emerge from these data, one in the spring male length at age data in 2009 and in the fall male weight at age data in 2005. When we decomposed the analysis to the species level, we found that not all species had declining trends in growth. For example, two species, silver hake Merluccius bilinearis and butterfish Peprilus triacanthus, were consistently increasing in length and weight at age for both sexes and seasonal categories (Table 2). The canonical correlation analysis between environmental and growth variables for the composite fish sizes yielded two significant dimensions at p < 0.1 (Table 3). The growth variables were positively correlated with CHL and negatively related to temperature (Figure 9A); salinity produced weaker correlative relationships.
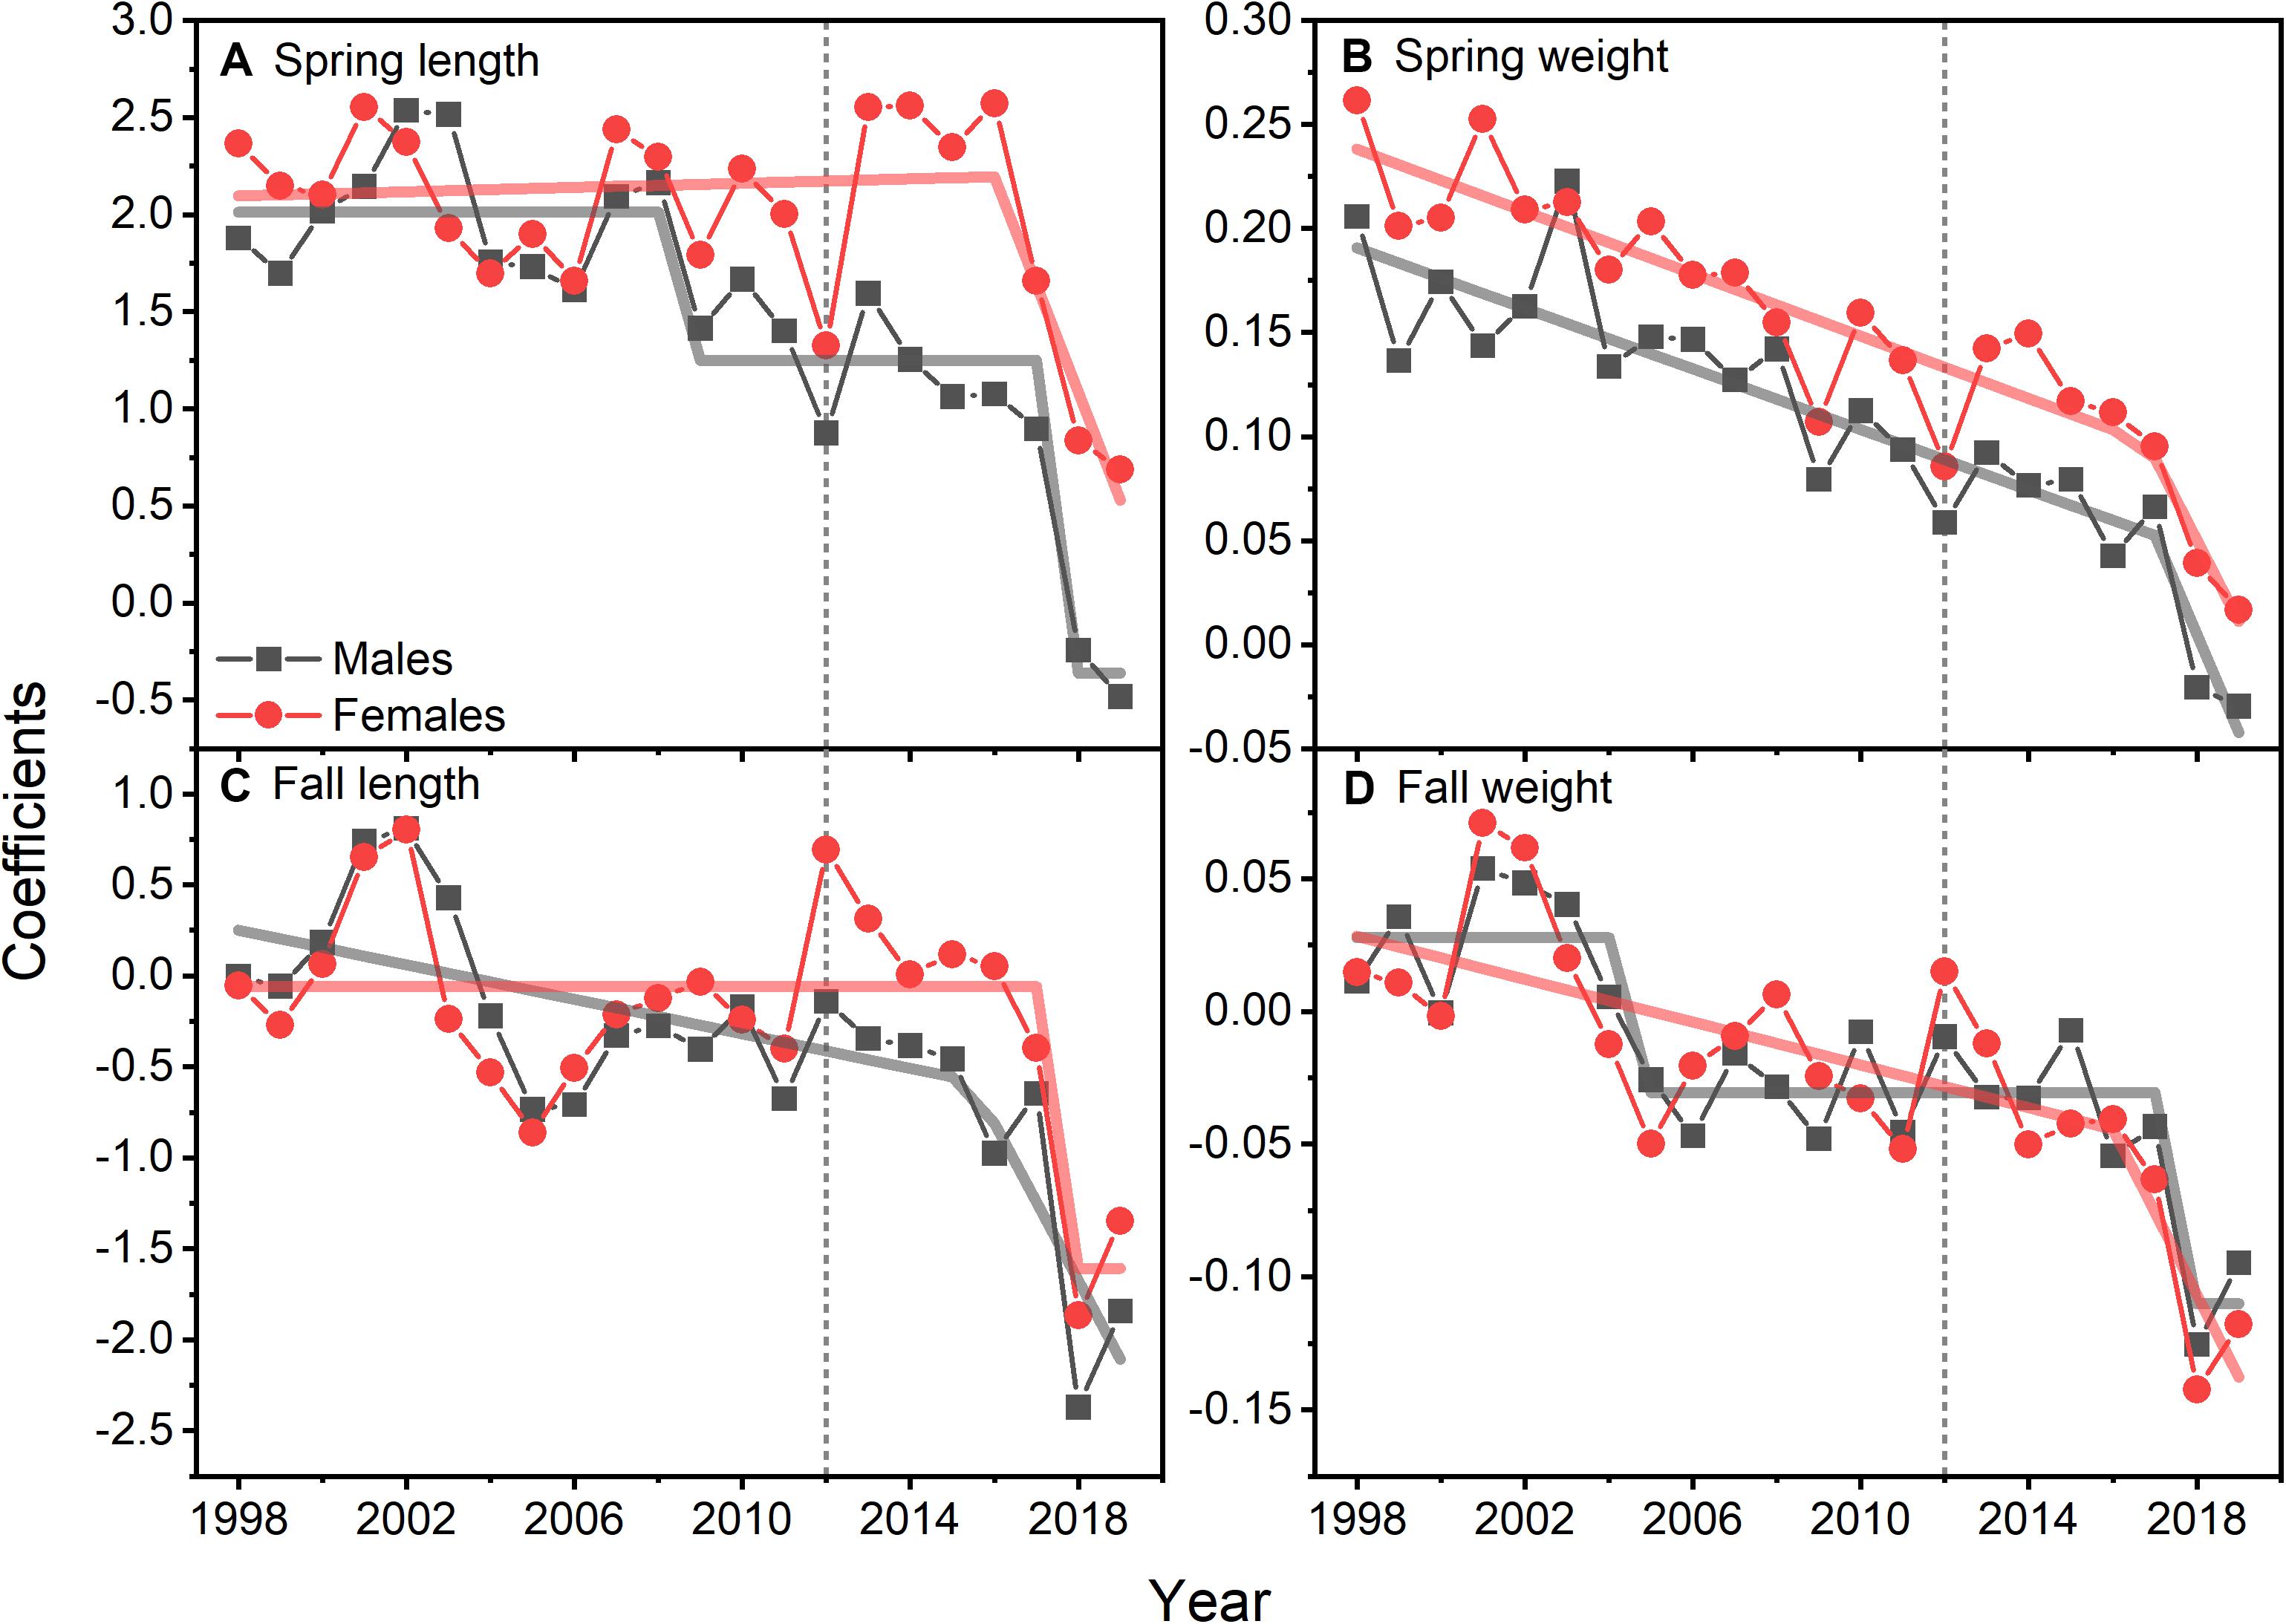
Figure 8. GLM model coefficients of length (A) and weight (B) for males and females of 15 species of fish during spring. GLM model coefficients of length (C) and weight (D) for males and females of 15 species of fish during fall. Lines are either STARS or segmented regression model fits; vertical dotted line marks 2012.
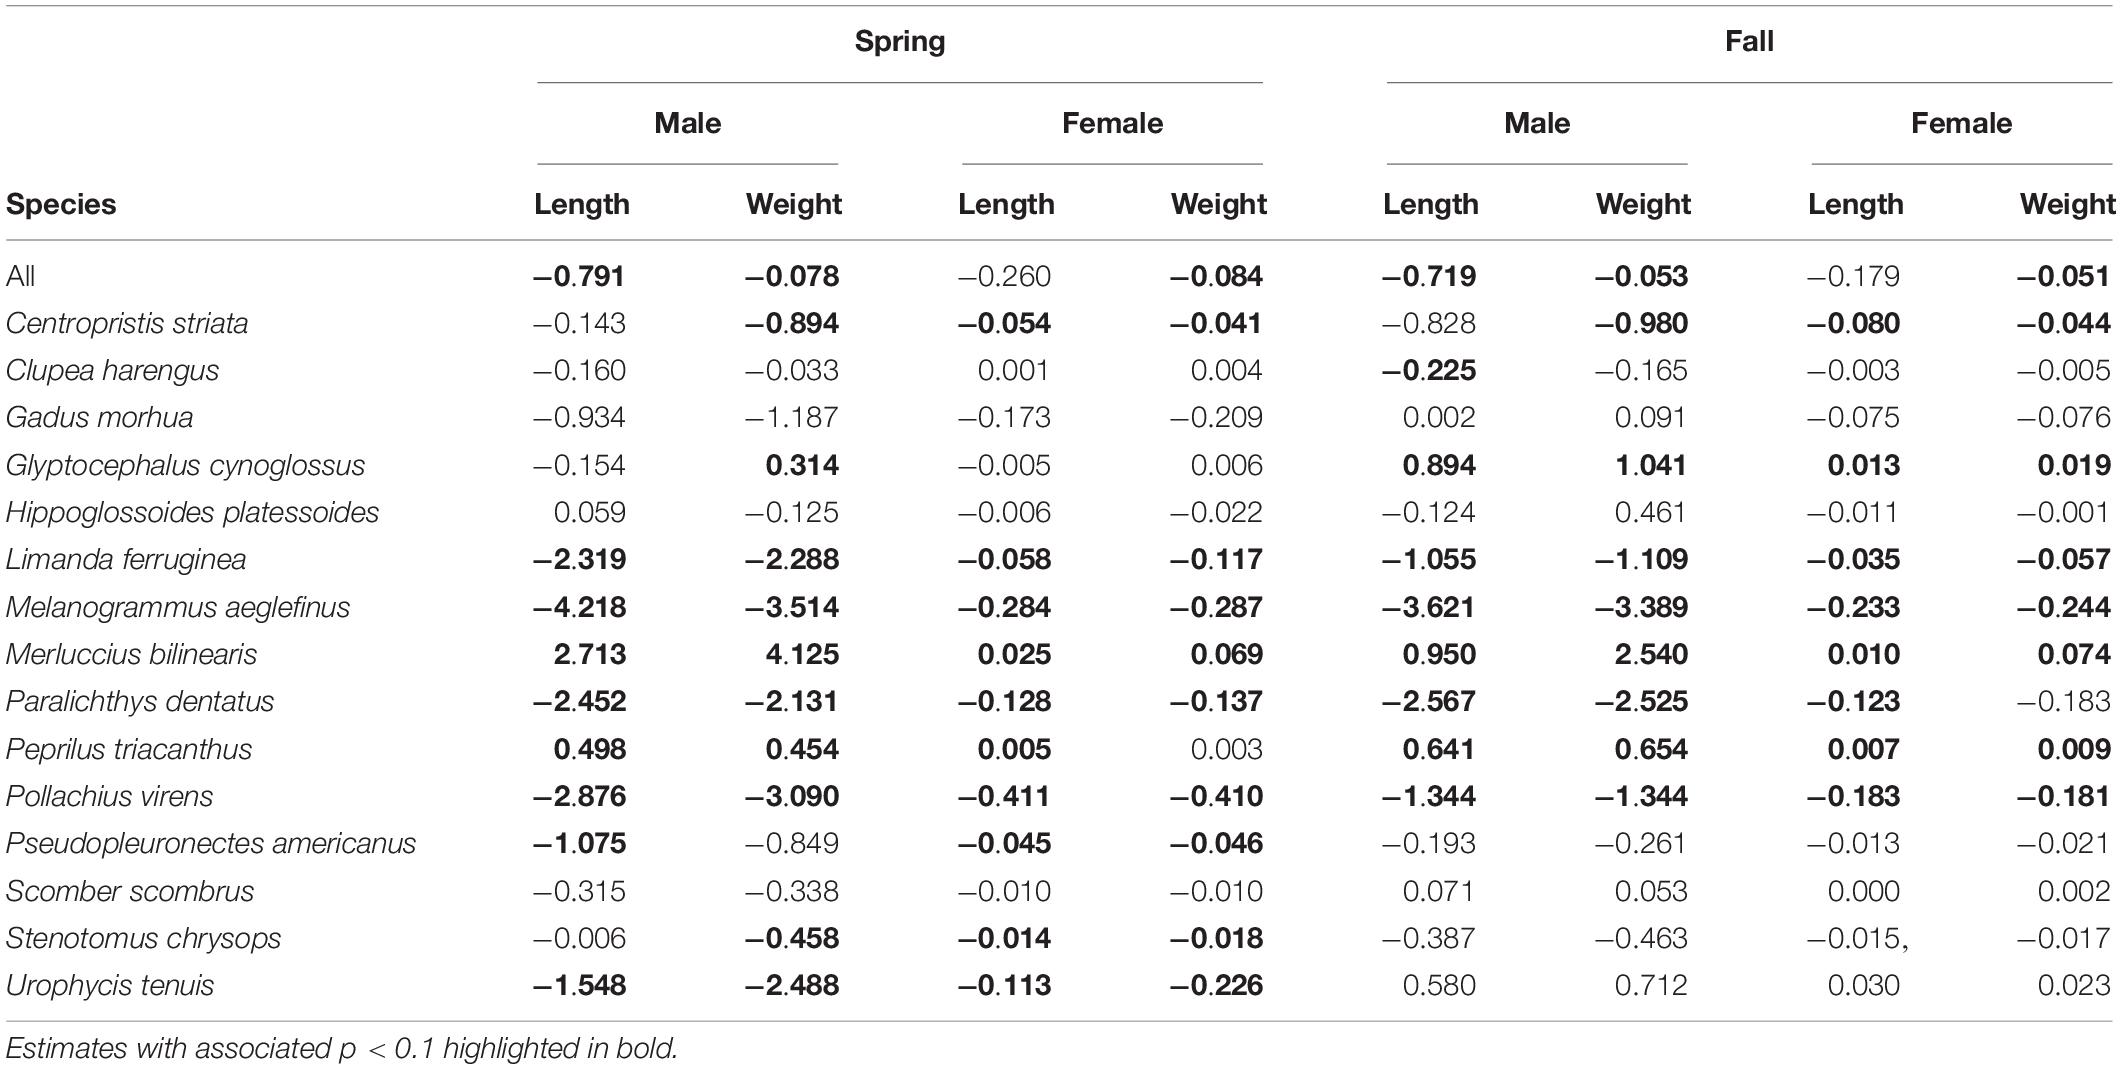
Table 2. Theil–Sen slope estimates expressed in decadal rates of change for growth variables by season and sex for the results of GLM models and by species.
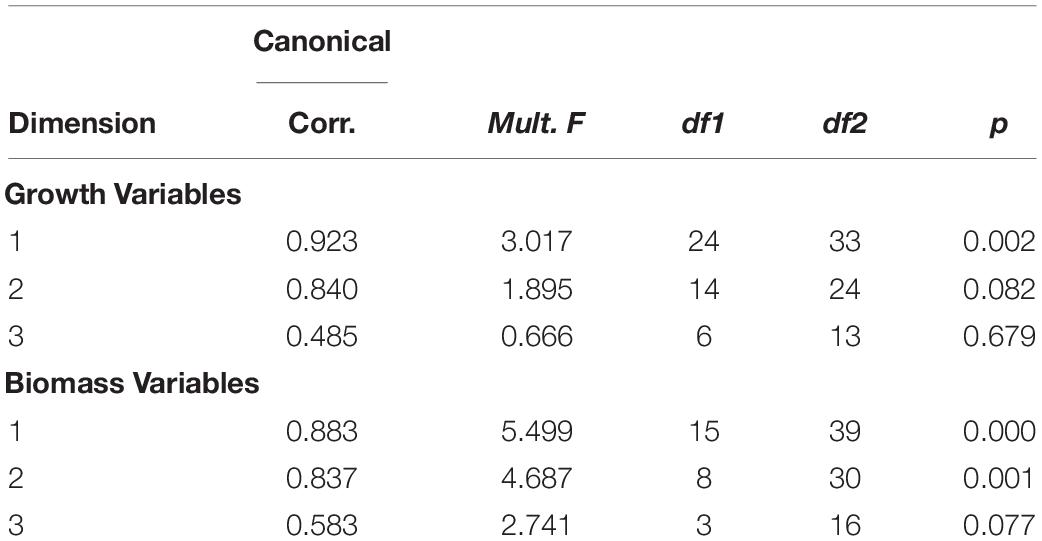
Table 3. Tests of Canonical Dimensions for environmental and growth and biomass data.
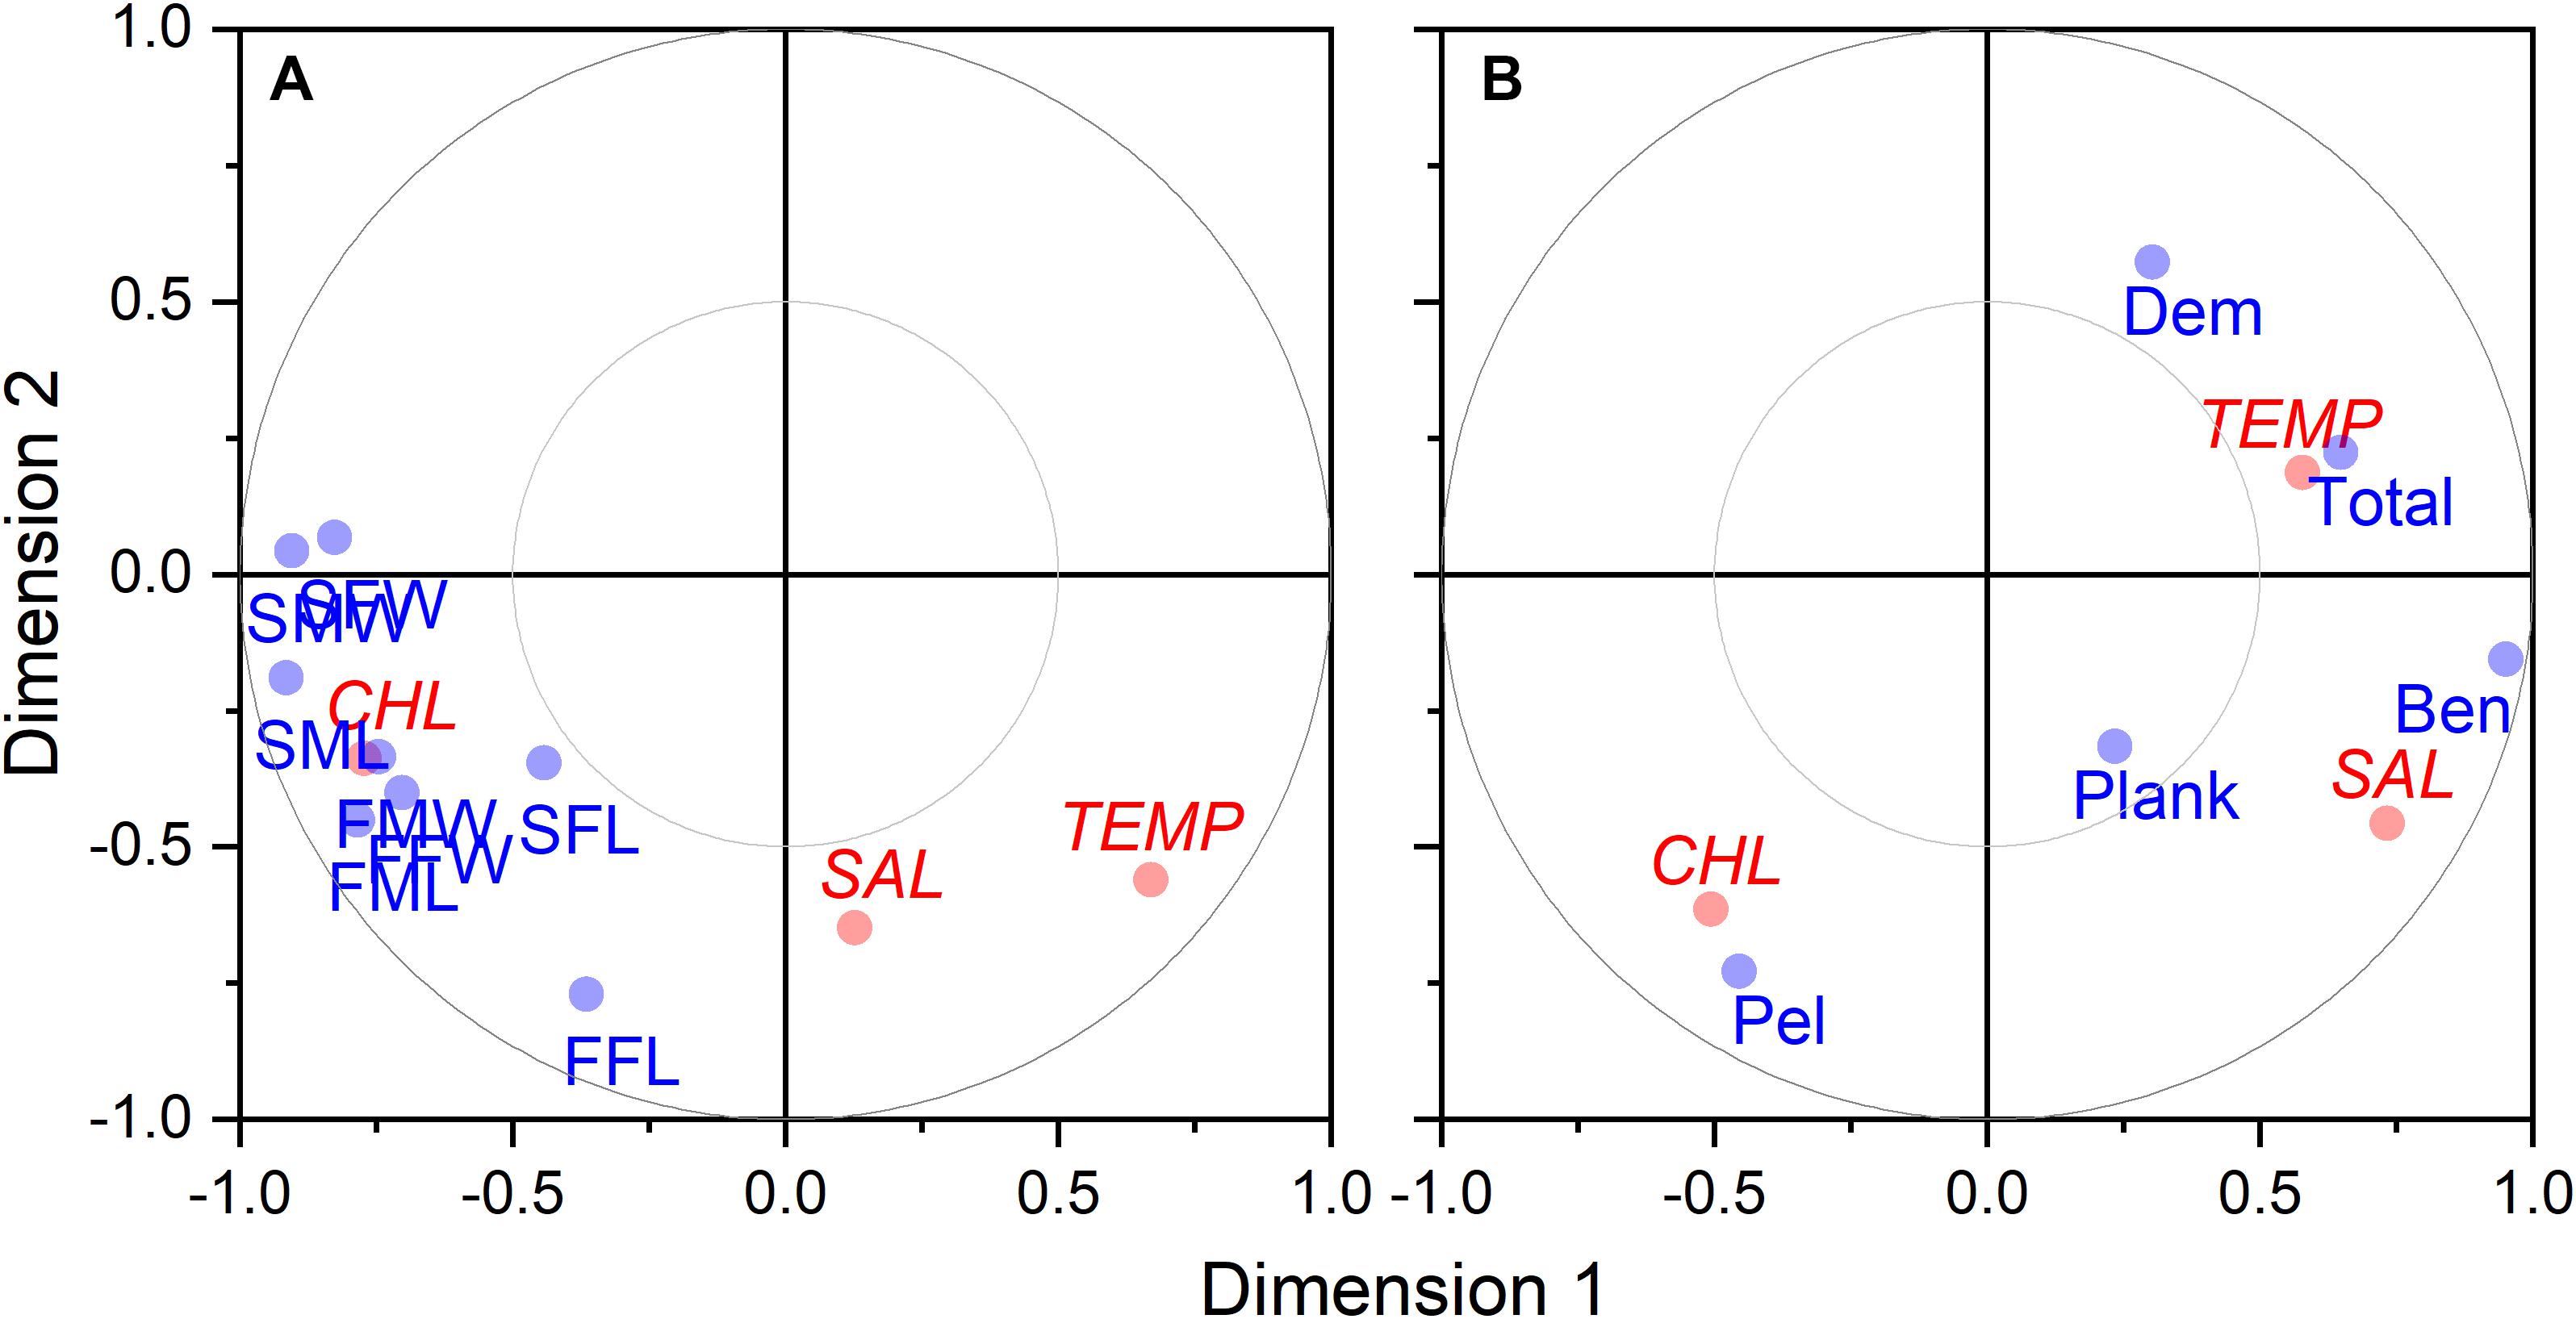
Figure 9. Canonical correlation two-dimensional plot of environmental factors vs. growth (A) and biomass (B) variables. Environmental variable (shown in red) include temperature (TEMP), salinity (SAL), and CHL. Growth variables (shown in blue) are coded with first position as S for spring and F for fall, second position as M for males and F for females, and third positons as W for weight and L for length. Biomass variables (shown in blue) include benthivores (BEN), demersal piscivores (DEM), pelagic piscivores (PEL), planktivores (PLANK), and total biomass (TOTAL).
Change in Survey Biomass by Functional Groups
Time series of biomass constructed from scientific surveys are difficult to interpret since they are shaped by a number of different factors and often dependent upon the catch of migratory species. It would appear the total biomass for the system has increased over time (Figure 10E). The biomass of the functional groups, benthivores, pelagic piscivores, and planktivores, seem to suggest a recent decline in biomass (Figures 10A,C,D). In contrast, the biomass of demersal piscivores appears to have remained high, although the level of biomass has been highly variable from year to year (Figure 10B); this variability may be due to the influence of migratory species. Two functional groups, benthivores and planktivores, had spring and fall signals that were correlated suggesting the same populations were sampled between seasons. These time series show similar patterns, namely that biomass increased to high levels within the last decade and has been declining since around 2015. The benthivore time series was the only CPUE time series with the suggestion of a change point, which occurred in 2012. The analysis of overall trend suggests the increase in CPUE has been higher in the spring and that the increase in total biomass may be driven by changes in benthivore and demersal piscivore populations (Table 4). The canonical correlation analysis between environmental and biomass variables yielded two significant dimensions at p < 0.1 (Table 3). The biomass of benthivores and demersal piscivores were positively related to temperature whereas pelagic piscivores were correlated with CHL (Figure 9B); planktivores appear to be uncorrelated with these factors.
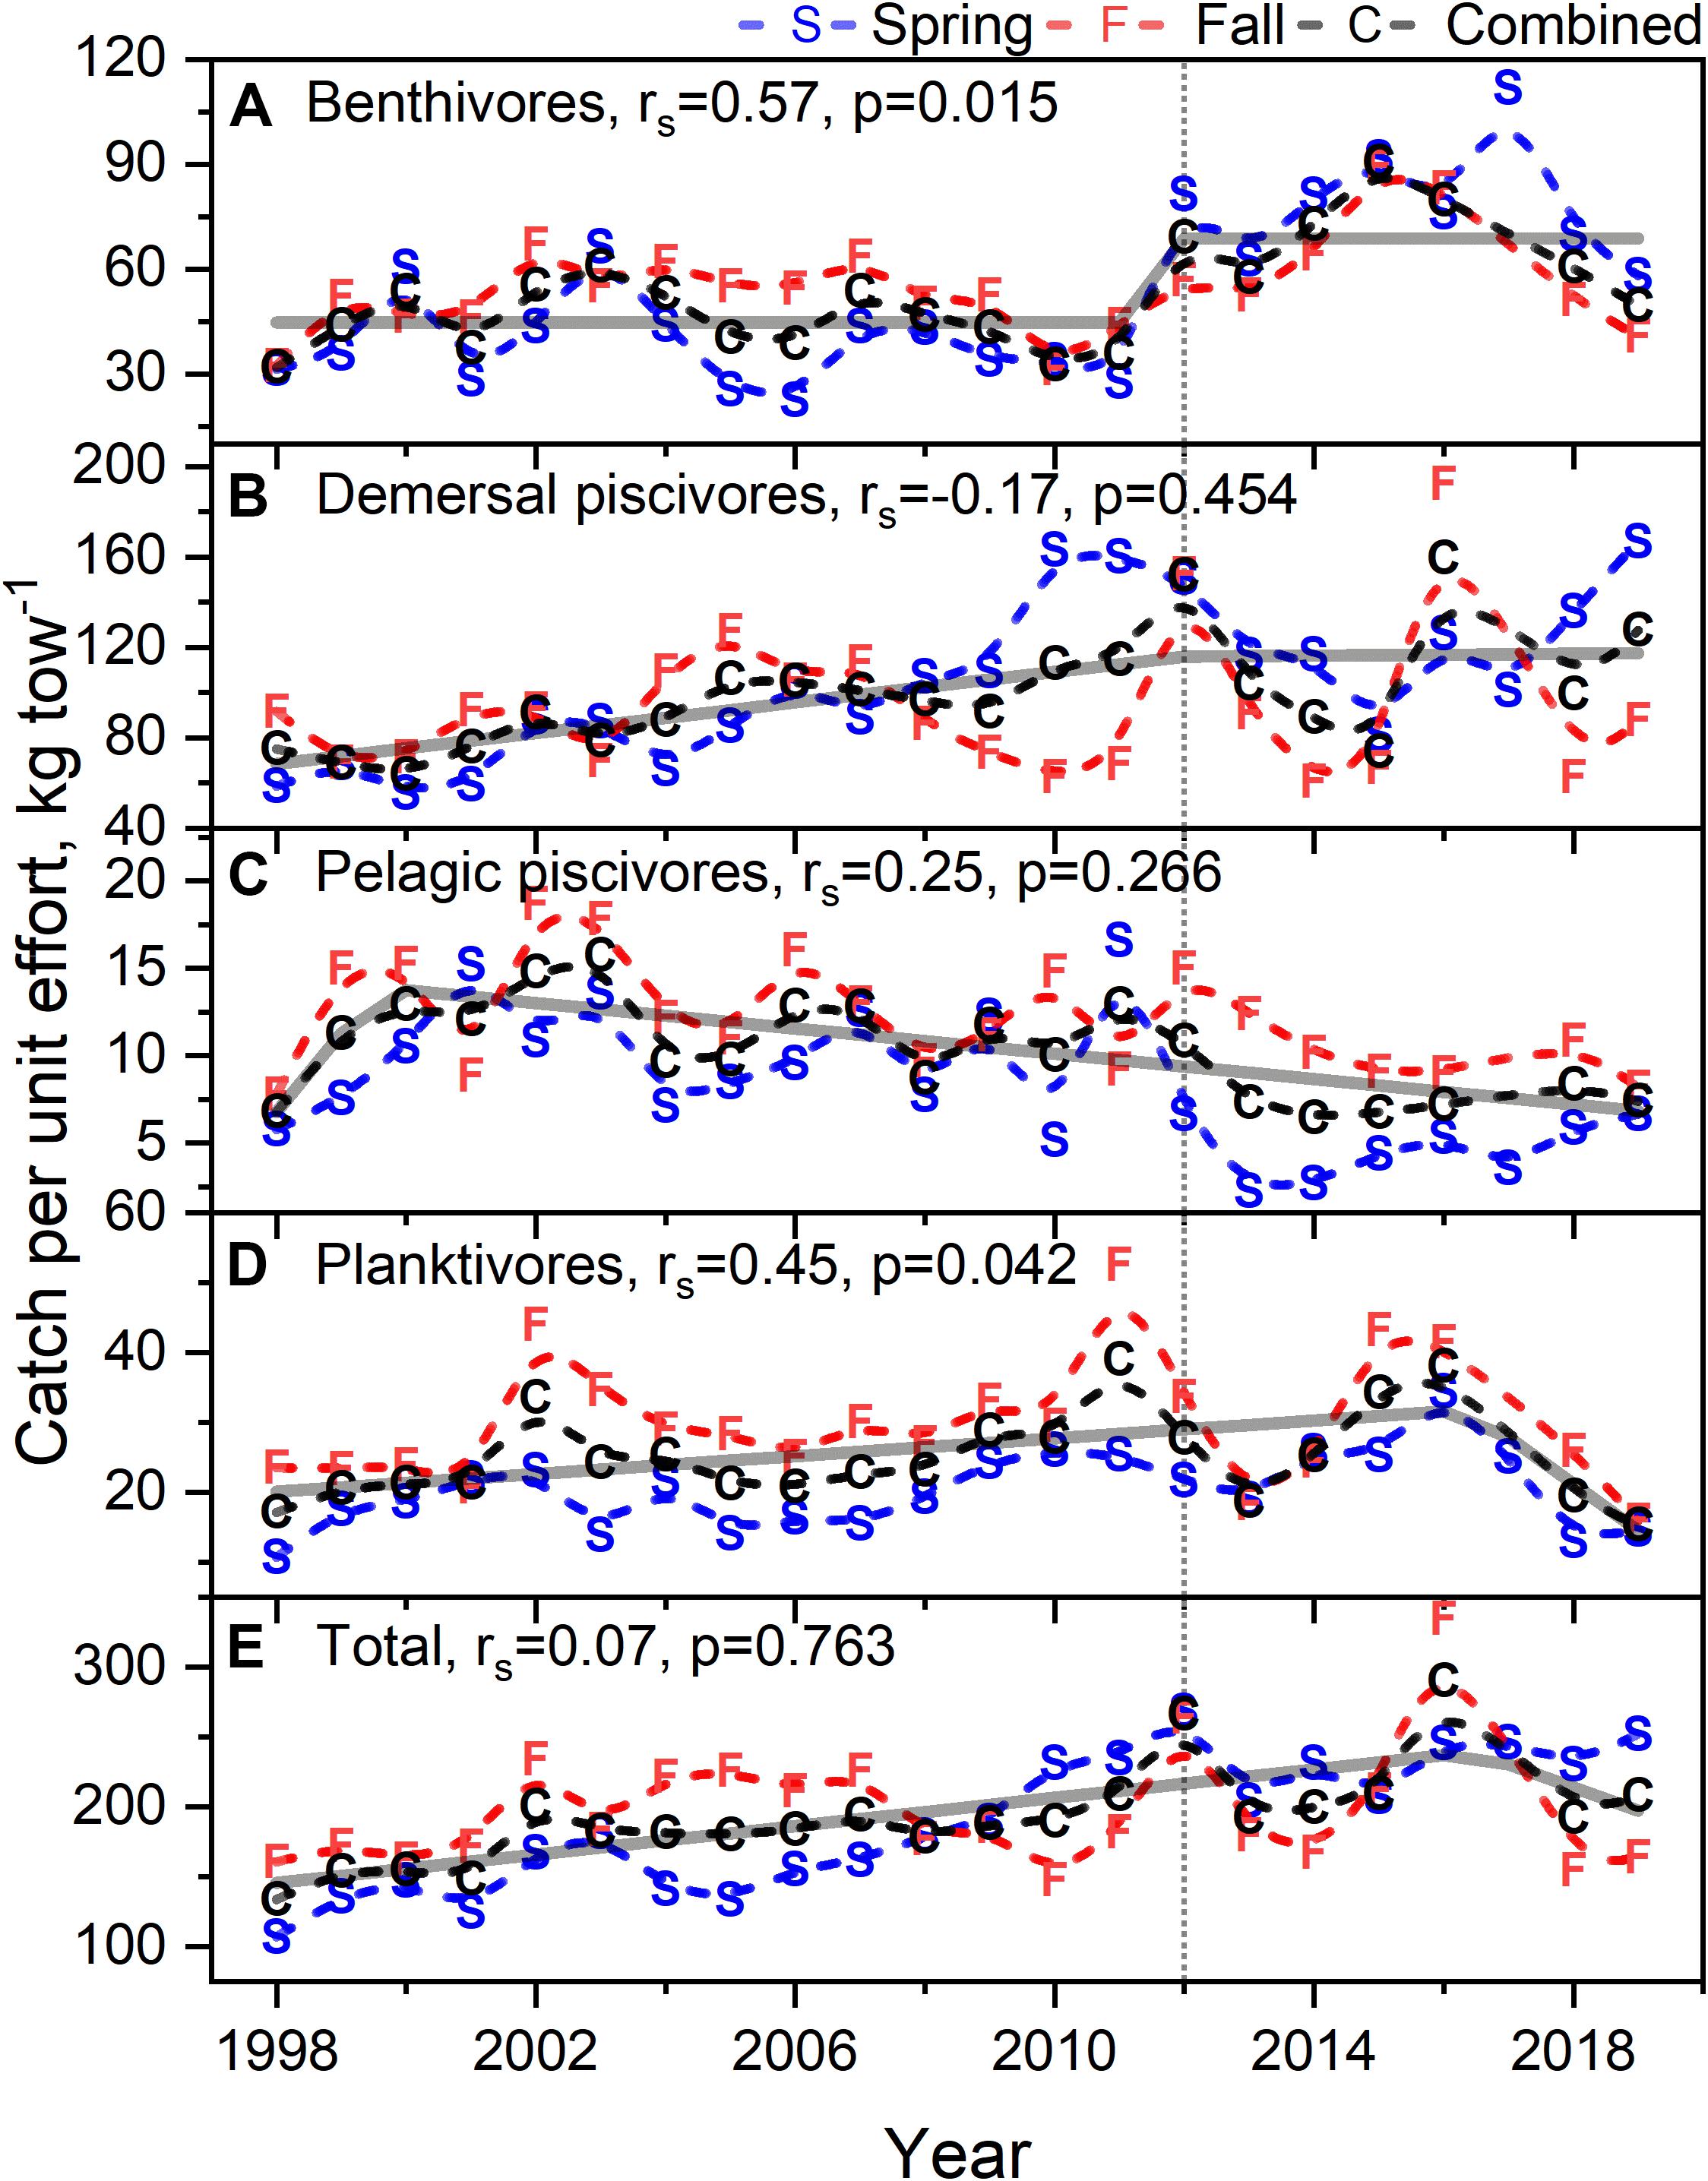
Figure 10. Biomass as catch per unit effort for benthivores (A), demersal piscivores (B), pelagic piscivores (C), planktivores (D), and total biomass (E) during spring and fall time frames. Dashed black line is mean of spring and fall curves. In each caption, rs is the Spearman correlation with associated p-value. Dashed line are b-splines; solid line either STARS or segmented regression models; vertical dotted line marks 2012.
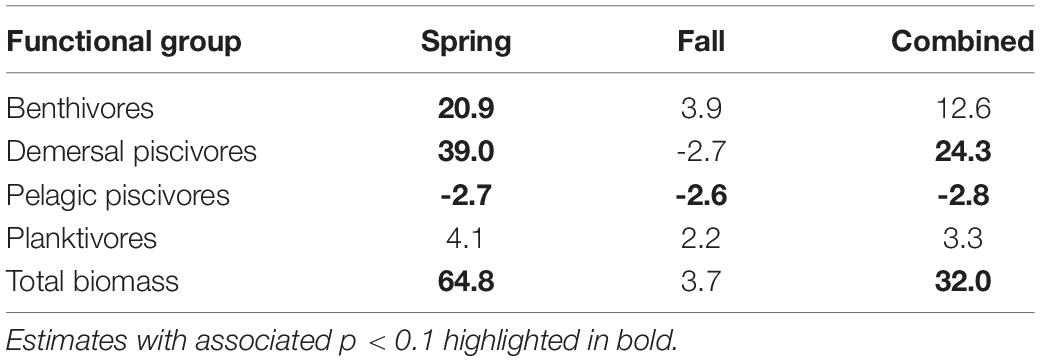
Table 4. Theil–Sen slope estimates expressed in decadal rates of change for CPUE variables by functional groups.
Discussion
The US Northeast Shelf ecosystem has gone through a transformational change in thermal state, primary producer biomass levels, and functional group assemblages over the past two decades. The upper part of the water column increased in temperature around the year 2012 and has since remained at a temperature level nearly 1°C higher than prior to 2012. The year 2012 was an exceptionally warm year and is recognized as the warmest year in the historical record of SST measurements for the ecosystem (Chen et al., 2014). Salinity has also increased on the order of 0.3 PSU, indicating a change in advective source water in the upper water column and photic zone of the ecosystem (Austin et al., 2019). Coincident with this transition in temperature and salinity, chlorophyll biomass peaked in 2011, and then declined from a relatively stable pre-2011 level in excess of 1.5 mg m–3 progressively to a low value of ∼1.0 mg m–3. These broad scale ecosystem level changes were most evident in the northern segments of the ecosystem, specifically in the Gulf of Maine and on Georges Bank.
The link between climate-induced warming and CHL is extremely complex. If warming was primarily driven by internal heating processes, then we might expect that phytoplankton communities will shift to a warm tolerant assemblage over time (Barton et al., 2016). However, warming in the NES is often the result of changing offshore water masses entering the system and these water masses can have significantly different nutrient concentrations and ratios. For example, Townsend et al. (2015) documented more frequent incursions of low-nutrient Scotian shelf waters into the Gulf of Maine and Georges Bank over a ten year period. Shifts in the nature of incoming water masses may exert strong and unpredictable controls on NES productivity. However, stratification, another important driver of phytoplankton production, is generally expected to increase due to increases in freshwater inflow from the Arctic and associated warming (Greene, 2012; Li et al., 2015). Enhanced stratification can potentially reduce the depth of the photic zone, thereby increasing the light exposure of phytoplankton in the surface mixed layer, however, it can also disconnect surface phytoplankton from bottom waters limiting the availability of nutrients, particularly nitrate. The importance of vertical mixing for the delivery of bottom water nitrate for phytoplankton production is well documented in the NES (Townsend, 1998) and enhanced stratification induced uncoupling of the water column may be a reason for the 0.4 mg m–3 reduction in CHL observed in this analysis since 2011. However, Li et al. (2015) points out that stratification dynamics in the Northwest Atlantic shelf systems can vary considerably with more haline control of stratification in the Gulf of Maine and thermal control in the Mid-Atlantic bight. A recent model analysis by Shin and Alexander (2019) using downscaled Global Climate Models contends that the rate of bottom water warming may outstrip surface water warming. Ultimately, a comprehensive analysis of stratification in recent high resolution downscaled models of the region coupled to the biogeochemical processes controlled by vertical mixing will be necessary step in projecting future climate induced changes in the productivity of the NES.
In addition to the change in chlorophyll biomass observed in recent years, evidence suggest there has been a dramatic change in the phytoplankton structure of the NES that portends ecosystem impacts (Flombaum et al., 2020). The size structure of the NES phytoplankton community has shifted to smaller sized cells, which due to functional trait-environment interactions and the saturation of productivity of these smaller cells would be expected to have a negative effect on primary production (Chen et al., 2019). The shift in cell size may be related to the pulsed uptake of resources during winter months just prior to the development of the spring bloom that favor small cells relative to larger celled phytoplankton (Lin et al., 2020). As systems become more oligotrophic there tends to be a shift to dominance by picophytoplankton that produces a size-dependent change in food quality associated with low grazing pressure (Branco et al., 2020). For example, it is well known that important secondary producers in the NES, such as Calanus finmarchicus and other large copepods, do not graze on cells less than 10 μm (Marshall and Orr, 1955; Frost, 1972; Bundy et al., 1998). In addition to Calanus finmarchicus (a keystone species in the Gulf of Maine), the filter feeding by commercially harvested bivalves in the NES declines when feeding on particle sizes below 10 microns as seen in blue mussels Mytilus edulis (Strohmeier et al., 2012), bay scallops Argopecten irradians and eastern oyster Crassostrea virginica (Palmer and Williams, 1980), and sea scallops Placopecten magellanicus (Brillant and MacDonald, 2000). The opposite occurs in nutrient-rich waters that favor larger phytoplankton species and higher grazing pressure. In the Southern Ocean, warm, stratified conditions in the surface waters are dominated by picophytoplankton and a zooplankton community dominated by small bodied crustaceans (Venkataramana et al., 2019). Aquatic food webs utilize greater than 50% of their primary production owning to the higher turnover rates associated with phytoplankton, making variation in phytoplankton production that much more critical to the production of secondary consumers and higher trophic level organisms (Barbier and Loreau, 2019).
In addition to an apparent shift in cell size fractions of phytoplankton, the dominant functional types of phytoplankton appear to have shifted, most notably a putative decline in diatoms. Diatoms play a pivotal role in marine food-webs shaping the productivity of ecosystems and are an important link in biogeochemical cycling (Harvey et al., 2019). Since diatoms are often chain forming and large-celled, a decline in diatoms may be synonymous with the size fraction shifts posited for the NES. And as with the factors associated with the development of size fraction patterns, vertical mixing is associated with the presence of larger phytoplankton like diatoms (Fragoso et al., 2019). The source phytoplankton that generates the flux of organic matter to the benthos is typically reflective of the dominant functional types in a given area on a global basis (Durkin et al., 2016), but since the NES phytoplankton community consists largely of diatoms, the contribution of diatoms to the POC is that much more critical. And since diatoms are passively buoyant, unlike other actively mobile flagellated phytoplankton, diatom blooms represent active transport of fixed carbon to the benthos (Gemmell et al., 2016). This effect is most pronounced with the fall bloom, which is known to produce enhanced rates of particulate organic carbon flux. Zooplankton grazing communities are in a transitional state in fall and can leave portions of aggressive blooms underutilized (Fujiwara et al., 2018). The fall period is also associated with changeover in the phytoplankton community leading to functional types that more readily tend to settle to the benthos (Kemp et al., 2000). We would expect that the Gulf of Maine and Georges Bank would be most impacted by the change in diatom populations since they more reliably have fall bloom activity (Friedland et al., 2015b). As with any set of modeling results, it is critical be circumspect about the reliability of the model fits and data output; hence, we also stress that the model results are at lease consistent with the observational counts of diatoms from the CPR samples.
The new levels of CHL and the associated potential decline in POC deposition in the NES may represent a stressor or critical production limitation for this ecosystem, and in particular, ecosystem services related to resource species. Though not well studied, it would appear large marine ecosystems may have a threshold of CHL associated with fishery yields. In LMEs with an average annual CHL over 1.0 mg m–3, fishery total catch or fisheries production on an areal basis tend to be over twice the level of ecosystems with annual CHL less than 1.0 mg m–3 (Friedland et al., 2012). Much of the NES is now at or below this threshold, which we would anticipate would result in lower productivity of higher trophic level organisms. In contemporary research, the most demonstrative effects of phytoplankton biomass and production relate to the feeding and condition of larval fish and its effect on year class strength. Over many decades in the North Sea, primary production measurements suggest a gradual decline in the base of the food chain and is implicated in the decline of secondary producers, notably small copepods including the genera Temora, Acartia, Pseudocalanus, and Paracalanus (Capuzzo et al., 2018). Small copepods often play a pivotal role in the first feeding of larval fish (Buckley and Durbin, 2006), hence the concern that recruitment levels have eroded as a consequence. Over shorter time series and with the benefit of remote sensing datasets, interannual variation in blooms and primary production levels have been associated with recruitment success of Pacific herring, Clupea pallasi, which seem to benefit from the proximity of the spring bloom to adult spawning (Boldt et al., 2019) and pre-metamorphic growth of rockfish (Sebastes spp.) larvae (Wheeler et al., 2017). Finally, in walleye pollock (Gadus chalcogrammus), whose recruitment is governed by thermally mediated predation effects (Uchiyama et al., 2020), bloom activity can serve as an event level forcing factor affecting year class strength (Gann et al., 2016).
It is difficult to predict the specific ecological response to any change in habitat (Friedland et al., 2020) due to the complexity of interactions and pressures in the region. Our observations indicate that there is an expansion of fish biomass in the NES, but at the same time, growth is slowing for many species. There are clear examples of the inverse relationship between fish growth and temperature, particularly at range edges (von Biela et al., 2015). Thus, while expanded thermal habitat is associated with higher recruitment, under the same temperature regime there is an expectation of a loss of larger fish as oxygen supply restricts increases in body size (Neuheimer et al., 2011). Long-term impacts of declining growth rates are also likely to reduce fecundity and egg quality, which varies with female fish size, and increases the risk of predation and starvation. For species such as silver hake Merluccius bilinearis that has shown a steady increase in growth over time in the NES, there is some evidence that they are able to supplement their diet with invertebrates such as Northern shrimp (Pandalus borealis) and avoid starvation (Link and Idoine, 2009). Thus, defining winners and losers under a thermal habitat regime shift, especially those coupled to changes in primary production, depends on more than just an individual species’ thermal tolerance; other ecological considerations need to be considered to fully understand and manage species under such changes to the habitat.
While the concept of regime change or shift in marine ecosystems has been extensively reviewed (Collie et al., 2004; Jiao, 2009), the definition of what constitutes a regime change varies by the ecosystem function under investigation. Regime change has been used in both formal and informal contexts. In the informal context, many practitioners simply associate a step change in conditions to be a regime change; and in many cases, the change in conditions is represented by a shift in a single factor (van Putten et al., 2019). However, in a more formal application of the term, a change of regime is considered a demonstration of a change in not only a suite of environmental indicators, but also evidence of a change in ecosystem function and productivity (Mollmann et al., 2015). In exploring the notion of high magnitude regime shifts, Scheffer and Carpenter (2003) considered what might cause a catastrophic shift in ecosystem state and conditions. They made the observation that a large change, or one with hysteresis, may be the result of accumulated gradual change that arrives at a threshold level and then the shift occurs. Another important distinction can be made between consumer and producer effects on transformative change (Connell et al., 2011). The producer level effects on the NES ecosystem state would appear to be dominant since the physical forcing and production level biology are associated with concomitant change points. Consumer effects would appear to be moderated by multiyear time lags in the sense the impacts of a change in growth and recruitment persists over the life cycle of the organism. This sharpens our focus on the shifts in temperature and salinity. The proximity of change on the NES to basin scale circulation (Kwon et al., 2019) would suggest the accumulated effects of climate perturbation resulted in a change point in ocean dynamics, which will likely be seen elsewhere beyond the confines of the NES. What should not be lost in the detail of the proximate response to change in physical and biological factors is that this climate change event on the NES simultaneously impacted the niche space of many species. What we do not know as of yet is whether the extent of niche change has or will actuate a change in biodiversity and fisheries productivity (Trisos et al., 2020).
Data Availability Statement
Publicly available datasets were analyzed in this study. This data can be found here: The data used in this analysis is available from the following sources: Sea surface temperature is available from the OISST website https://www.ncdc.noaa.gov/oisst; NEFSC survey salinity data is available from the National Center for Environmental Information https://www.nodc.noaa.gov/oads/stewardship/data_assets.html; CHL and water leaving radiance data is available from the Hermes GlobColour website http://hermes.acri.fr/index.php; NEFSC Survey length and weight at age and biomass is from the InPort NMFS Data Management Program https://inport.nmfs.noaa.gov/inport/; CPR data is from the Marine Biological survey site https://www.cprsurvey.org/
Author Contributions
KF led the analysis and drafting of the manuscript. RM and JRM assisted with data analysis and along with NS, JT, DB, and JLM contributed to the drafting of the manuscript. All authors contributed to the article and approved the submitted version.
Funding
Funding for JM’s effort was provided by the NASA Ecosystem Forecasting Program, The Gordon and Betty Moore Foundation under Grant No. 3292, and the NASA Applied Information Systems Technology Program under NNH18ZDA001N-AIST.
Conflict of Interest
The authors declare that the research was conducted in the absence of any commercial or financial relationships that could be construed as a potential conflict of interest.
Acknowledgments
We thank M. Correa-Ramirez and C. Melrose for help in estimating phytoplankton functional type data. J. Langan for comments on an early draft of the manuscript. P. Kostovick for assistance with data.
References
Alvain, S., Moulin, C., Dandonneau, Y., and Loisel, H. (2008). Seasonal distribution and succession of dominant phytoplankton groups in the global ocean: a satellite view. Glob. Biogeochem. Cycles 22:GB3001. doi: 10.1029/2007GB003154
Asch, R. G., Stock, C. A., and Sarmiento, J. L. (2019). Climate change impacts on mismatches between phytoplankton blooms and fish spawning phenology. Glob. Change Biol. 25, 2544–2559. doi: 10.1111/gcb.14650
Austin, A. M., Bisagni, J. J., and Schmidt, A. (2019). Inter-annual variability of shelf water volume on the northeastern Canadian and United States continental shelf, 1973–2013. Cont. Shelf Res. 187:103962. doi: 10.1016/j.csr.2019.103962
Barbier, M., and Loreau, M. (2019). Pyramids and cascades: a synthesis of food chain functioning and stability. Ecol. Lett. 22, 405–419. doi: 10.1111/ele.13196
Barton, A. D., Irwin, A. J., Finkel, Z. V., and Stock, C. A. (2016). Anthropogenic climate change drives shift and shuffle in North Atlantic phytoplankton communities. Proc. Natl. Acad. Sci. U.S.A. 113, 2964–2969. doi: 10.1073/pnas.1519080113
Batt, R. D., Morley, J. W., Selden, R. L., Tingley, M. W., and Pinsky, M. L. (2017). Gradual changes in range size accompany long-term trends in species richness. Ecol. Lett. 20, 1148–1157. doi: 10.1111/ele.12812
Batten, S. D., Clark, R., Flinkman, J., Hays, G., John, E., John, A. W. G., et al. (2003). CPR sampling: the technical background, materials and methods, consistency and comparability. Prog. Oceanogr. 58, 193–215. doi: 10.1016/j.pocean.2003.08.004
Boldt, J. L., Thompson, M., Rooper, C. N., Hay, D. E., Schweigert, J. F., Quinn, T. J., et al. (2019). Bottom-up and top-down control of small pelagic forage fish: factors affecting age-0 herring in the strait of Georgia, British Columbia. Mar. Ecol. Prog. Ser. 617, 53–66. doi: 10.3354/meps12485
Branco, P., Egas, M., Hall, S. R., and Huisman, J. (2020). Why do phytoplankton evolve large size in response to grazing? Am. Nat. 195, E20–E37. doi: 10.1086/706251
Brewin, R. J. W., Sathyendranath, S., Jackson, T., Barlow, R., Brotas, V., Airs, R., et al. (2015). Influence of light in the mixed-layer on the parameters of a three-component model of phytoplankton size class. Remote Sens. Environ. 168, 437–450. doi: 10.1016/j.rse.2015.07.004
Brillant, M. G. S., and MacDonald, B. A. (2000). Postingestive selection in the sea scallop, Placopecten magellanicus (Gmelin): the role of particle size and density. J. Exp. Mar. Biol. Ecol. 253, 211–227. doi: 10.1016/S0022-0981(00)00258-6
Buckley, L. J., and Durbin, E. G. (2006). Seasonal and inter-annual trends in the zooplankton prey and growth rate of Atlantic cod (Gadus morhua) and haddock (Melanogrammus aeglefinus) larvae on Georges Bank. Deep Sea Res. Part II Top. Stud. Oceanogr. 53, 2758–2770. doi: 10.1016/j.dsr2.2006.08.009
Bundy, M. H., Gross, T. F., Vanderploeg, H. A., and Rudi Strickler, J. (1998). Perception of inert particles by calanoid copepods: behavioral observations and a numerical model. J. Plankton Res. 20, 2129–2152. doi: 10.1093/plankt/20.11.2129
Burnham, K. P., and Anderson, D. R. (2004). Multimodel Inference: understanding AIC and BIC in model selection. Soc. Methods Res. 33, 261–304. doi: 10.1177/0049124104268644
Capuzzo, E., Lynam, C. P., Barry, J., Stephens, D., Forster, R. M., Greenwood, N., et al. (2018). A decline in primary production in the North Sea over 25 years, associated with reductions in zooplankton abundance and fish stock recruitment. Glob. Change Biol. 24, E352–E364. doi: 10.1111/gcb.13916
Chandrapavan, A., Caputi, N., and Kangas, M. I. (2019). The decline and recovery of a crab population from an extreme marine heatwave and a changing climate. Front. Mar. Sci. 6:510. doi: 10.3389/fmars.2019.00510
Chen, B., Smith, S. L., and Wirtz, K. W. (2019). Effect of phytoplankton size diversity on primary productivity in the North Pacific: trait distributions under environmental variability. Ecol. Lett. 22, 56–66. doi: 10.1111/ele.13167
Chen, K., Gawarkiewicz, G. G., Lentz, S. J., and Bane, J. M. (2014). Diagnosing the warming of the Northeastern US Coastal Ocean in 2012: a linkage between the atmospheric jet stream variability and ocean response. J. Geophys. Res.-Oceans 119, 218–227. doi: 10.1002/2013jc009393
Chen, Z., Kwon, Y.-O., Chen, K., Fratantoni, P., Gawarkiewicz, G., and Joyce, T. M. (2020). Long-term SST variability on the northwest Atlantic Continental shelf and slope. Geophys. Res. Lett 47:e2019GL085455. doi: 10.1029/2019GL085455
Cheng, L., Abraham, J., Hausfather, Z., and Trenberth, K. E. (2019). How fast are the oceans warming? Science 363:eaax1875. doi: 10.1126/science.aax1875
Collie, J. S., Richardson, K., and Steele, J. H. (2004). Regime shifts: can ecological theory illuminate the mechanisms? Prog. Oceanogr. 60, 281–302. doi: 10.1016/j.pocean.2004.02.013
Connell, S. D., Russell, B. D., and Irving, A. D. (2011). Can strong consumer and producer effects be reconciled to better forecast “catastrophic” phase-shifts in marine ecosystems? J. Exp. Mar. Biol. Ecol. 400, 296–301. doi: 10.1016/j.jembe.2011.02.031
Conversi, A., Umani, S. F., Peluso, T., Molinero, J. C., Santojanni, A., and Edwards, M. (2010). The mediterranean sea regime shift at the end of the 1980s, and intriguing parallelisms with other European basins. PLoS One 5:e10633. doi: 10.1371/journal.pone.0010633
Correa-Ramirez, M., Morales, C. E., Letelier, R., Anabalón, V., and Hormazabal, S. (2018). Improving the remote sensing retrieval of Phytoplankton functional types (PFT) using empirical orthogonal functions: a case study in a coastal upwelling region. Remote Sens. 10:498. doi: 10.3390/rs10040498
Dantas, D. D. F., Caliman, A., Guariento, R. D., Angelini, R., Carneiro, L. S., Lima, S. M. Q., et al. (2019). Climate effects on fish body size-trophic position relationship depend on ecosystem type. Ecography 42, 1579–1586. doi: 10.1111/ecog.04307
Desprespatanjo, L. I., Azarovitz, T. R., and Byrne, C. J. (1988). 25 years of fish surveys in the Northwest Atlantic - the Nmfs northeast fisheries centers bottom Trawl survey program. Mar. Fish. Rev. 50, 69–71.
Durant, J. M., Molinero, J.-C., Ottersen, G., Reygondeau, G., Stige, L. C., and Langangen, Ø. (2019). Contrasting effects of rising temperatures on trophic interactions in marine ecosystems. Sci. Rep. 9:15213. doi: 10.1038/s41598-019-51607-w
Durkin, C. A., Mooy, B. A. S. V., Dyhrman, S. T., and Buesseler, K. O. (2016). Sinking phytoplankton associated with carbon flux in the Atlantic Ocean. Limnol. Oceanogr. 61, 1172–1187. doi: 10.1002/lno.10253
Dutkiewicz, S., Hickman, A. E., Jahn, O., Henson, S., Beaulieu, C., and Monier, E. (2019). Ocean colour signature of climate change. Nat. Commun. 10:578. doi: 10.1038/s41467-019-08457-x
Flombaum, P., Wang, W.-L., Primeau, F. W., and Martiny, A. C. (2020). Global picophytoplankton niche partitioning predicts overall positive response to ocean warming. Nat. Geosci. 13, 116–120. doi: 10.1038/s41561-019-0524-2
Forrestal, F. C., Schirripa, M., Goodyear, C. P., Arrizabalaga, H., Babcock, E. A., Coelho, R., et al. (2019). Testing robustness of CPUE standardization and inclusion of environmental variables with simulated longline catch datasets. Fish. Res. 210, 1–13. doi: 10.1016/j.fishres.2018.09.025
Fragoso, G. M., Davies, E. J., Ellingsen, I., Chauton, M. S., Fossum, T., Ludvigsen, M., et al. (2019). Physical controls on phytoplankton size structure, photophysiology and suspended particles in a Norwegian biological hotspot. Prog. Oceanogr. 175, 284–299. doi: 10.1016/j.pocean.2019.05.001
Friedland, K. D., Ahrenholz, D. W., and Haas, L. W. (2005). Viable gut passage of cyanobacteria through the filter-feeding fish Atlantic menhaden, Brevoortia tyrannus. J. Plankton Res. 27, 715–718. doi: 10.1093/plankt/fbi036
Friedland, K. D., Langan, J. A., Large, S. I., Selden, R. L., Link, J. S., Watson, R. A., et al. (2020). Changes in higher trophic level productivity, diversity and niche space in a rapidly warming continental shelf ecosystem. Sci. Total Environ. 704:135270. doi: 10.1016/j.scitotenv.2019.135270
Friedland, K. D., Leaf, R. T., Kane, J., Tommasi, D., Asch, R. G., Rebuck, N., et al. (2015a). Spring bloom dynamics and zooplankton biomass response on the US Northeast Continental Shelf. Cont. Shelf Res. 102, 47–61. doi: 10.1016/j.csr.2015.04.005
Friedland, K. D., Leaf, R. T., Kristiansen, T., and Large, S. I. (2015b). Layered effects of parental condition and larval survival on the recruitment of neighboring haddock stocks. Can. J. Fish. Aquat. Sci. 72, 1672–1681. doi: 10.1139/cjfas-2015-0084
Friedland, K. D., McManus, M. C., Morse, R. E., and Link, J. S. (2019). Event scale and persistent drivers of fish and macroinvertebrate distributions on the Northeast US Shelf. ICES J. Mar. Sci. 76, 1316–1334. doi: 10.1093/icesjms/fsy167
Friedland, K. D., Mouw, C. B., Asch, R. G., Ferreira, A. S. A., Henson, S., Hyde, K. J. W., et al. (2018). Phenology and time series trends of the dominant seasonal phytoplankton bloom across global scales. Glob. Ecol. Biogeogr. 27, 551–569. doi: 10.1111/geb.12717
Friedland, K. D., Record, N. R., Asch, R. G., Kristiansen, T., Saba, V. S., Drinkwater, K. F., et al. (2016). Seasonal phytoplankton blooms in the North Atlantic linked to the overwintering strategies of copepods. Elementa 4:99.
Friedland, K. D., Stock, C., Drinkwater, K. F., Link, J. S., Leaf, R. T., Shank, B. V., et al. (2012). Pathways between primary production and fisheries yields of large marine ecosystems. Plos One 7:e28945. doi: 10.1371/journal.pone.0028945
Frost, B. W. (1972). Effects of size and concentration of food particles on the feeding behavior of the marine Planktonic copepod Calanus Pacificus1. Limnol. Oceanogr. 17, 805–815. doi: 10.4319/lo.1972.17.6.0805
Fujiwara, A., Nishino, S., Matsuno, K., Onodera, J., Kawaguchi, Y., Hirawake, T., et al. (2018). Changes in phytoplankton community structure during wind-induced fall bloom on the central Chukchi shelf. Polar Biol. 41, 1279–1295. doi: 10.1007/s00300-018-2284-7
Gann, J. C., Eisner, L. B., Porter, S., Watson, J. T., Cieciel, K. D., Mordy, C. W., et al. (2016). Possible mechanism linking ocean conditions to low body weight and poor recruitment of age-0 walleye pollock (Gadus chalcogrammus) in the southeast Bering Sea during 2007. Deep Sea Res. Part II Top. Stud. Oceanogr. 134, 115–127. doi: 10.1016/j.dsr2.2015.07.010
Gawarkiewicz, G., Chen, K., Forsyth, J., Bahr, F., Mercer, A. M., Ellertson, A., et al. (2019). Characteristics of an advective marine heatwave in the middle atlantic bight in early 2017. Front. Mar. Sci. 6:712. doi: 10.3389/fmars.2019.00712
Gemmell, B. J., Oh, G., Buskey, E. J., and Villareal, T. A. (2016). Dynamic sinking behaviour in marine phytoplankton: rapid changes in buoyancy may aid in nutrient uptake. Proc. R. Soc. B Biol. Sci. 283:20161126. doi: 10.1098/rspb.2016.1126
Goode, A. G., Brady, D. C., Steneck, R. S., and Wahle, R. A. (2019). The brighter side of climate change: how local oceanography amplified a lobster boom in the Gulf of Maine. Glob. Change Biol. 25, 3906–3917. doi: 10.1111/gcb.14778
Greene, C. (2012). Recent arctic climate change and its remote forcing of northwest Atlantic shelf ecosystems. Oceanography 25, 208–213. doi: 10.5670/oceanog.2012.64
Groom, S., Sathyendranath, S., Ban, Y., Bernard, S., Brewin, R., Brotas, V., et al. (2019). Satellite ocean color: current status and future perspective. Front. Mar. Sci. 6:485. doi: 10.3389/fmars.2019.00485
Harvey, B. P., Agostini, S., Kon, K., Wada, S., and Hall-Spencer, J. M. (2019). Diatoms dominate and alter marine food-webs when CO2 rises. Diversity 11:242. doi: 10.3390/d11120242
Henson, S., Cole, H., Beaulieu, C., and Yool, A. (2013). The impact of global warming on seasonality of ocean primary production. Biogeosciences 10, 4357–4369. doi: 10.5194/bg-10-4357-2013
Hirata, T., Hardman-Mountford, N. J., Brewin, R. J. W., Aiken, J., Barlow, R., Suzuki, K., et al. (2011). Synoptic relationships between surface Chlorophyll-a and diagnostic pigments specific to phytoplankton functional types. Biogeosciences 8, 311–327. doi: 10.5194/bg-8-311-2011
Holbrook, N. J., Scannell, H. A., Sen Gupta, A., Benthuysen, J. A., Feng, M., Oliver, E. C. J., et al. (2019). A global assessment of marine heatwaves and their drivers. Nat. Commun. 10:2624. doi: 10.1038/s41467-019-10206-z
Howarth, L. M., Roberts, C. M., Thurstan, R. H., and Stewart, B. D. (2014). The unintended consequences of simplifying the sea: making the case for complexity. Fish Fish. 15, 690–711. doi: 10.1111/faf.12041
Huxel, G. R., and McCann, K. (1998). Food web stability: the influence of trophic flows across habitats. Am. Nat. 152, 460–469. doi: 10.1086/286182
Jiao, Y. (2009). Regime shift in marine ecosystems and implications for fisheries management, a review. Rev. Fish Biol. Fish. 19, 177–191. doi: 10.1007/s11160-008-9096-8
Kane, J. (2007). Zooplankton abundance trends on Georges Bank, 1977-2004. ICES J. Mar. Sci. 64, 909–919. doi: 10.1093/icesjms/fsm066
Kemp, A. E. S., Pike, J., Pearce, R. B., and Lange, C. B. (2000). The “Fall dump” - a new perspective on the role of a “shade flora” in the annual cycle of diatom production and export flux. Deep Sea Res. Part II Top. Stud. Oceanogr. 47, 2129–2154. doi: 10.1016/S0967-0645(00)00019-9
Kwon, Y.-O., Seo, H., Ummenhofer, C. C., and Joyce, T. M. (2019). Impact of multidecadal variability in Atlantic SST on winter atmospheric blocking. J. Clim. 33, 867–892. doi: 10.1175/JCLI-D-19-0324.1
Lamont, T., Barlow, R. G., and Brewin, R. J. W. (2019). Long-term trends in Phytoplankton chlorophyll a and size structure in the Benguela upwelling system. J. Geophys. Res. Oceans 124, 1170–1195. doi: 10.1029/2018jc014334
Lawson, C. L., and Hanson, R. J. (1995). “Solving least squares problems,” in Society for Industrial and Applied Mathematics (Philadelphia, PA: SIAM Publications). doi: 10.1137/1.9781611971217
Li, Y., Fratantoni, P. S., Chen, C., Hare, J. A., Sun, Y., Beardsley, R. C., et al. (2015). Spatio-temporal patterns of stratification on the Northwest Atlantic shelf. Prog. Oceanogr. 134, 123–137. doi: 10.1016/j.pocean.2015.01.003
Lin, F.-S., Ho, P.-C., Sastri, A. R., Chen, C.-C., Gong, G.-C., Jan, S., et al. (2020). Resource availability affects temporal variation of phytoplankton size structure in the Kuroshio east of Taiwan. Limnol. Oceanogr. 65, 236–246. doi: 10.1002/lno.11294
Link, J. S., and Idoine, J. S. (2009). Estimates of predator consumption of the northern shrimp Pandalus borealis with implications for estimates of population biomass in the gulf of maine. North Am. J. Fish. Manag. 29, 1567–1583. doi: 10.1577/M08-233.1
Lotze, H. K., Tittensor, D. P., Bryndum-Buchholz, A., Eddy, T. D., Cheung, W. W. L., Galbraith, E. D., et al. (2019). Global ensemble projections reveal trophic amplification of ocean biomass declines with climate change. Proc. Natl. Acad. Sci. U.S.A. 116, 12907–12912. doi: 10.1073/pnas.1900194116
Maritorena, S., d’Andon, O. H. F., Mangin, A., and Siegel, D. A. (2010). Merged satellite ocean color data products using a bio-optical model: characteristics, benefits and issues. Remote Sens. Environ. 114, 1791–1804. doi: 10.1016/j.rse.2010.04.002
Marshall, S. M., and Orr, A. P. (1955). On the biology of Calanus finmarchicus VIII. Food uptake, assimilation and excretion in adult and Stage V Calanus. J. Mar. Biol. Assoc. U.K. 34, 495–529. doi: 10.1017/S0025315400008778
Mérillet, L., Kopp, D., Robert, M., Mouchet, M., and Pavoine, S. (2020). Environment outweighs the effects of fishing in regulating demersal community structure in an exploited marine ecosystem. Glob. Change Biol. 26, 2106–2119. doi: 10.1111/gcb.14969
Miller, T. J., Das, C., Politis, P. J., Miller, A. S., Lucey, S. M., Legault, C. M., et al. (2010). Estimation of albatross IV to henry B. NEFSC Ref. Doc. 10-05, 238.
Mills, K. E., Pershing, A. J., Brown, C. J., Chen, Y., Chiang, F. S., Holland, D. S., et al. (2013). Fisheries management in a changing climate lessons from the 2012 ocean heat wave in the Northwest Atlantic. Oceanography 26, 191–195.
Moisan, J. R., Moisan, T. A., and Abbott, M. R. (2002). Modelling the effect of temperature on the maximum growth rates of phytoplankton populations. Ecol. Model. 153, 197–215. doi: 10.1016/S0304-3800(02)00008-X
Moisan, J. R., Moisan, T. A. H., and Linkswiler, M. A. (2011). An inverse modeling approach to estimating phytoplankton pigment concentrations from phytoplankton absorption spectra. J. Geophys. Res. Oceans 116:C09018. doi: 10.1029/2010JC006786
Moisan, T. A., Rufty, K. M., Moisan, J. R., and Linkswiler, M. A. (2017). Satellite observations of Phytoplankton functional type spatial distributions, phenology, diversity, and ecotones. Front. Mar. Sci. 4:189. doi: 10.3389/fmars.2017.00189
Mollmann, C., Folke, C., Edwards, M., and Conversi, A. (2015). Marine regime shifts around the globe: theory, drivers and impacts. Philos. Trans. R. Soc. B Biol. Sci. 370, 1–5. doi: 10.1098/rstb.2013.0260
Muggeo, V. M. R. (2003). Estimating regression models with unknown break-points. Stat. Med. 22, 3055–3071. doi: 10.1002/sim.1545
Muggeo, V. M. R. (2017). Interval estimation for the breakpoint in segmented regression: a smoothed score-based approach. Aust. N.Z. J. Stat. 59, 311–322. doi: 10.1111/anzs.12200
Neuheimer, A. B., Thresher, R. E., Lyle, J. M., and Semmens, J. M. (2011). Tolerance limit for fish growth exceeded by warming waters. Nat. Clim. Change 1, 110–113. doi: 10.1038/nclimate1084
Paerl, H. W. (2018). Mitigating toxic planktonic cyanobacterial blooms in aquatic ecosystems facing increasing anthropogenic and climatic pressures. Toxins 10:76. doi: 10.3390/toxins10020076
Palmer, R. E., and Williams, L. G. (1980). Effect of particle concentration on filtration efficiency of the bay scallop Argopecten irradians and the oyster Crassostrea virginica. Ophelia 19, 163–174. doi: 10.1080/00785326.1980.10425514
Pershing, A. J., Alexander, M. A., Hernandez, C. M., Kerr, L. A., Le Bris, A., Mills, K. E., et al. (2015). Slow adaptation in the face of rapid warming leads to collapse of the Gulf of Maine cod fishery. Science 350, 809–812. doi: 10.1126/science.aac9819
Pershing, A. J., Record, N. R., Franklin, B. S., Kennedy, B. T., McClenachan, L., Mills, K. E., et al. (2019). Challenges to natural and human communities from surprising ocean temperatures. Proc. Natl. Acad. Sci. U.S.A. 116, 18378–18383. doi: 10.1073/pnas.1901084116
Press, W. H., Flannery, B. P., Teukolsky, S. A., Vetterling, W. T., and Gould, H. (1987). Numerical recipes, The art of scientific computing. Am. J. Phys. 55, 90–91. doi: 10.1119/1.14981
Reynolds, R. W., Smith, T. M., Liu, C., Chelton, D. B., Casey, K. S., and Schlax, M. G. (2007). Daily high-resolution-blended analyses for sea surface temperature. J. Clim. 20, 5473–5496. doi: 10.1175/2007jcli1824.1
Roberts, S. D., Van Ruth, P. D., Wilkinson, C., Bastianello, S. S., and Bansemer, M. S. (2019). Marine heatwave, harmful algae blooms and an extensive fish kill event during 2013 in South Australia. Front. Mar. Sci 6:610. doi: 10.3389/fmars.2019.00610
Rodionov, S. N. (2004). A sequential algorithm for testing climate regime shifts. Geophys. Res. Lett. 31, 1–4. doi: 10.1029/2004gl019448
Rodionov, S. N. (2006). Use of prewhitening in climate regime shift detection. Geophys. Res. Lett. 33, 1–4. doi: 10.1029/2006gl025904
Rogers, L. A., Griffin, R., Young, T. L., Fuller, E., St Martin, K., and Pinsky, M. L. (2019). Shifting habitats expose fishing communities to risk under climate change. Nat. Clim. Change 9, 512-516. doi: 10.1038/s41558-019-0503-z
Roxy, M. K., Modi, A., Murtugudde, R., Valsala, V., Panickal, S., Kumar, S. P., et al. (2016). A reduction in marine primary productivity driven by rapid warming over the tropical Indian Ocean. Geophys. Res. Lett. 43, 826–833. doi: 10.1002/2015gl066979
Salo, T., Mattila, J., and Eklöf, J. (2020). Long-term warming affects ecosystem functioning through species turnover and intraspecific trait variation. Oikos 129, 283–295. doi: 10.1111/oik.06698
Sanford, E., Sones, J. L., Garcia-Reyes, M., Goddard, J. H. R., and Largier, J. L. (2019). Widespread shifts in the coastal biota of northern California during the 2014-2016 marine heatwaves. Sci. Rep. 9:4126. doi: 10.1038/s41598-019-40784-3
Scheffer, M., and Carpenter, S. R. (2003). Catastrophic regime shifts in ecosystems: linking theory to observation. Trends Ecol. Evol. 18, 648–656. doi: 10.1016/j.tree.2003.09.002
Schiller, L., Bailey, M., Jacquet, J., and Sala, E. (2018). High seas fisheries play a negligible role in addressing global food security. Sci. Adv. 4:4216. doi: 10.1126/sciadv.aat8351
Shackell, N. L., Bundy, A., Nye, J. A., and Link, J. S. (2012). Common large-scale responses to climate and fishing across Northwest Atlantic ecosystems. ICES J. Mar. Sci. 69, 151–162. doi: 10.1093/icesjms/fsr195
Sherman, K., Solow, A., Jossi, J., and Kane, J. (1998). Biodiversity and abundance of the zooplankton of the Northeast Shelf ecosystem. Ices J. Mar. Sci. 55, 730–738. doi: 10.1006/jmsc.1998.0377
Shin, S.-I., and Alexander, M. A. (2019). Dynamical downscaling of future hydrographic changes over the Northwest Atlantic Ocean. J. Clim. 33, 2871–2890. doi: 10.1175/JCLI-D-19-0483.1
Smith, K. A., Dowling, C. E., and Brown, J. (2019). Simmered then boiled: multi-decadal Poleward shift in distribution by a temperate fish accelerates during marine heatwave. Front. Mar. Sci 6:407. doi: 10.3389/fmars.2019.00407
Somavilla, R., Gonzalez-Pola, C., and Fernandez-Diaz, J. (2017). The warmer the ocean surface, the shallower the mixed layer. How much of this is true?. J. Geophys. Res. Oceans 122, 7698–7716. doi: 10.1002/2017jc013125
Strohmeier, T., Strand, Ø, Alunno-Bruscia, M., Duinker, A., and Cranford, P. J. (2012). Variability in particle retention efficiency by the mussel Mytilus edulis. J. Exp. Mar. Biol. Ecol 412, 96–102. doi: 10.1016/j.jembe.2011.11.006
Thomson, R. E., and Emery, W. J. (2014). “Chapter 5 - Time Series Analysis Methods,” in Data Analysis Methods in Physical Oceanography, 3rd Edn, eds R. E. Thomson and W. J. Emery, (Boston: Elsevier), 425–591. doi: 10.1016/B978-0-12-387782-6.00005-3
Townsend, D. W. (1998). Sources and cycling of nitrogen in the Gulf of Maine. J. Mar. Syst. 16, 283–295. doi: 10.1016/S0924-7963(97)00024-9
Townsend, D. W., Pettigrew, N. R., Thomas, M. A., Neary, M. G., McGillicuddy, D. J., and O’Donnell, J. (2015). Water masses and nutrient sources to the Gulf of Maine. J. Mar. Res. 73, 93–122. doi: 10.1357/002224015815848811
Trisos, C. H., Merow, C., and Pigot, A. L. (2020). The projected timing of abrupt ecological disruption from climate change. Nature 580, 496–501. doi: 10.1038/s41586-020-2189-9
Uchiyama, T., Mueter, F. J., and Kruse, G. H. (2020). Multispecies biomass dynamics models reveal effects of ocean temperature on predation of juvenile pollock in the eastern Bering Sea. Fish. Oceanogr. 29, 10–22. doi: 10.1111/fog.12433
Ullah, H., Nagelkerken, I., Goldenberg, S. U., and Fordham, D. A. (2018). Climate change could drive marine food web collapse through altered trophic flows and cyanobacterial proliferation. Plos Biol 16:e2003446. doi: 10.1371/journal.pbio.2003446
van Putten, I., Boschetti, F., Ling, S., and Richards, S. A. (2019). Perceptions of system-identity and regime shift for marine ecosystems. ICES J. Mar. Sci. 76, 1736–1747. doi: 10.1093/icesjms/fsz058
Venkataramana, V., Anilkumar, N., Naik, R. K., Mishra, R. K., and Sabu, P. (2019). Temperature and phytoplankton size class biomass drives the zooplankton food web dynamics in the Indian Ocean sector of the Southern Ocean. Polar Biol. 42, 823–829. doi: 10.1007/s00300-019-02472-w
von Biela, V. R., Kruse, G. H., Mueter, F. J., Black, B. A., Douglas, D. C., Helser, T. E., et al. (2015). Evidence of bottom-up limitations in nearshore marine systems based on otolith proxies of fish growth. Mar. Biol. 162, 1019–1031. doi: 10.1007/s00227-015-2645-5
Wheeler, S. G., Anderson, T. W., Bell, T. W., Morgan, S. G., and Hobbs, J. A. (2017). Regional productivity predicts individual growth and recruitment of rockfishes in a northern California upwelling system. Limnol. Oceanogr. 62, 754–767. doi: 10.1002/lno.10458
Wiedenmann, J., and Jensen, O. P. (2019). Could recent overfishing of New England groundfish have been prevented? A retrospective evaluation of alternative management strategies. Can. J. Fish. Aquat. Sci. 76, 1006–1018. doi: 10.1139/cjfas-2018-0129
Yamaguchi, R., and Suga, T. (2019). Trend and variability in global upper-ocean stratification since the 1960s. J. Geophys. Res. Oceans 124, 8933–8948. doi: 10.1029/2019jc015439
Keywords: temperature, chlorophyll, biomass, growth, production, regimes
Citation: Friedland KD, Morse RE, Shackell N, Tam JC, Morano JL, Moisan JR and Brady DC (2020) Changing Physical Conditions and Lower and Upper Trophic Level Responses on the US Northeast Shelf. Front. Mar. Sci. 7:567445. doi: 10.3389/fmars.2020.567445
Received: 29 May 2020; Accepted: 24 August 2020;
Published: 15 September 2020.
Edited by:
Jose Luis Iriarte, Austral University of Chile, ChileReviewed by:
Christian Reiss, Restoration Center, United StatesClaudio Vasapollo, Independent Researcher, Ancona, Italy
Copyright © 2020 Friedland, Morse, Shackell, Tam, Morano, Moisan and Brady. This is an open-access article distributed under the terms of the Creative Commons Attribution License (CC BY). The use, distribution or reproduction in other forums is permitted, provided the original author(s) and the copyright owner(s) are credited and that the original publication in this journal is cited, in accordance with accepted academic practice. No use, distribution or reproduction is permitted which does not comply with these terms.
*Correspondence: Kevin D. Friedland, a2V2aW4uZnJpZWRsYW5kQG5vYWEuZ292