 Daniele Brigolin1,2*†
 Christophe Rabouille3†
 Clément Demasy3Bruno Bombled3Gaël Monvoisin4Roberto Pastres2
- 1Department of Architecture and Arts, Università IUAV di Venezia, Venezia, Italy
- 2Department of Environmental Sciences, Informatics and Statistics, Università Ca’ Foscari Venezia, Venezia, Italy
- 3Laboratoire des Sciences du Climat et de l’Environnement, UMR CEA-CNRS-UVSQ et IPSL, Université Paris-Saclay, Gif-sur-Yvette, France
- 4CNRS, GEOPS, Université Paris-Saclay, Orsay, France
This work focuses on sediments of a shallow water lagoon, located in a densely populated area undergoing multiple stressors, with the goal of increasing the understanding of the links between diagenetic processes occurring in sediments, the dynamics of dissolved oxygen (DO) in the water column, and potential consequences of hypoxia. Sediment data were collected over three consecutive years, from 2015 to 2017, during spring–summer, at five stations. Measured variables included: sediment porosity, grain size and organic carbon content, porewater microprofiles of O2, pH and H2S, porewater profiles of dissolved inorganic carbon (DIC), total alkalinity (TA), NH4+, NO3–, dissolved Fe, and SO42–. In addition, long-term time series of oxygen saturations in the water column (years 2005–2017) were utilized in order to identify the occurrence and duration of hypoxic periods. The results show that the median DO saturation value in summer months was below 50% (around 110 μmol L–1), and that saturation values below 25% (below the hypoxic threshold) can persist for more than 1 week. Sediment stations can be divided in two groups based on their diagenetic intensity: intense and moderate. At these two groups of stations, the average DIC net production rates, estimated trough a steady-state model (Profile) were, respectively, of 2.8 and 1.0 mmol m–2 d–1, SO42– consumption rates were respectively 1.6 and 0.4 mmol m–2 d–1, while diffusive oxygen uptake fluxes, calculated from the sediment microprofile data, were of 28.5 and 17.5 mmol m–2 d–1. At the stations characterized by intense diagenesis, total dissolved sulfide accumulated in porewaters close to the sediment-water interface, reaching values of 0.7 mM at 10 cm. Considering the typical physico-chemical summer conditions, the theoretical time required to consume oxygen down to the hypoxic level by sediment oxygen demand ranges between 5 and 18 days, in absence of mixing and re-oxygenation. This estimation highlights that sediment diagenesis may play a crucial role in triggering and maintaining hypoxia of lagoon waters during the summer season in specific high intensity diagenesis zones. This role of the sediment could be enhanced by changes in regional climate conditions, such as the increase in frequency of summer heat waves.
Introduction
In shallow coastal and marine environments, sediment is expected to have a primary role in controlling the water column biogeochemistry, by influencing the dynamics of oxygen, carbon and macronutrients (N and P) (Schlesinger and Bernhardt, 2013). Hypoxic conditions, in which dissolved oxygen (DO) concentration falls below 2 mg L–1 (62 μmol L–1), represent a major threat for coastal ecosystems worldwide (Zhang et al., 2010; Breitburg et al., 2018), because low levels of oxygen affects the metabolism and survival of the less mobile macrofauna (Rabalais et al., 2002; Vaquer-Sunyer and Duarte, 2008), and because the release of toxic compounds from sediments (e.g., H2S) can harm vertebrate species (Vaquer-Sunyer and Duarte, 2010). The interaction between sediment biogeochemistry and hypoxia has been thoroughly investigated in ecosystems where large areas are hypoxic or become periodically hypoxic (Diaz and Rosenberg, 2008; Middelburg and Levin, 2009), and is also receiving increasing attention in landlocked stratified environments (e.g., Friedrich et al., 2014; Zhu et al., 2017). Less attention has been given, however, to non-stratified shallow water systems where wind is expected to have a major role in water mixing and reoxygenation (Chapelle et al., 2000, 2001). Nonetheless, the coupling between sediment and water column biogeochemical processes is expected to be significant in these highly productive environments, characterized by intense patterns of deposition/resuspension and accumulation of organic debris in specific areas. As a result of organic matter mineralization, the oxygen demand of surface sediment and the potential release of H2S, accumulated as a by-product of anoxic diagenesis, could be very high (Burdige, 2006). Moreover, an increase in the frequency of summer heat waves due to climate change, which is currently being observed in the Mediterranean region (MerMex Group, 2011; Galli et al., 2017), could lead to increased stratification and therefore duration and severity of hypoxic events, as already reported for European freshwater lakes during the 2003 heat wave (Jankowski et al., 2006).
Lagoons are good examples of vulnerable shallow ecosystems characterized by multiple pressures (Kennish and Paerl, 2010), as they are often located in close proximity of urban areas and megacities (e.g., Gu et al., 2013). In many instances, these systems are protected by international treaties (e.g., Ramsar Convention, 1971) and directives aimed at preserving water quality (e.g., WFD, European Community, 2000). Indeed, they represent valued natural environments and provide goods and services to coastal communities (Millennium Ecosystem Assessment, 2005; Rova et al., 2019). The Venice lagoon (Italy) represents an ecosystem located in a densely populated area with multiple stressors such as massive tourism, aquaculture, industry, maritime circulation (Solidoro et al., 2010), in which the links between sediment and water column dynamics may play an important role in defining ecosystem functioning.
Previous studies on Venice lagoon sediments have emphasized the mapping and evolution of organic carbon (OC) and contaminants in the solid phase of the sediments (Lucchini et al., 2002; Sfriso et al., 2005) in the context of past eutrophication (Pastres et al., 2004) and its relation to oxygen dynamics (Lovato et al., 2013). Other studies (Gieskes et al., 2015) investigated early diagenesis and porewater composition of lagoon sediments, including dissolved sulfide in relation with dredging and disposal of contaminated sediments. The mineralization of organic matter from sewage discharge in the canals network within the historical city, and its contribution to sulfide release was also investigated (Zaggia et al., 2007; Azzoni et al., 2015). Yet, a comprehensive knowledge of organic matter diagenesis in areas of the lagoon which are not directly influenced by the city discharges is missing.
The goal of the current study is to understand the link between diagenetic processes occurring in sediments and the dynamics of DO in lagoon waters. We set three objectives: (i) measure the oxygen demand of surface sediment in different lagoon depositional systems and understand its relationship with hypoxia in the bottom waters; (ii) categorize lagoon areas with respect to the intensity of early diagenesis and associated oxygen demand, and (iii) assess the potential for H2S release from sediments during hypoxic events. In order to achieve these goals, sediment data were collected, in spring–summer 2015, 2016, and 2017, at five stations, located in open shallow areas of the lagoon (depth, 1 ± 0.5 m) belonging to different Water Framework Directive (WFD) water bodies, and characterized by different depositional environments in terms of exposure to the winds and riverine influence. The results of the field surveys were interpreted using a set of modeling tools and based on the analysis of long-term time series of oxygen saturation data in the water column (2005–2017), collected by the Ministero delle Infrastrutture e dei Trasporti, formerly Venice Water Authority (Magistrato alle Acque).
Study Site Description: The Venice Lagoon
The Venice lagoon is a shallow water body, covering an area of approximately 432 km2 (Sfriso et al., 2019). Its average depth is approximately 1 m, with only 5% deeper than 5 m (some navigable channels are deeper than 15 m). The lagoon is connected to the Northern Adriatic Sea through three inlets: the tidal exchange can reach 20,000 m3 s–1 at peak flow during spring tides (Umgiesser, 2020). On average, water residence time ranges from a few days in the areas close to the inlets to about one month in the inner part, close to the river tributaries (Cucco and Umgiesser, 2006). Notwithstanding the high anthropogenic impact, the Venice lagoon ecosystem still shows a good resilience, providing a broad range of ecosystem services (Rova et al., 2015, 2019). In compliance with the implementation of the Water Framework Directive 2000/60/EC (European Community, 2000), the lagoon was divided into 11 water bodies, based on a combination of hydrological descriptors, existing pressures and chemical, and ecological status (Hydrographic district of Oriental Alps, HDOA; Autorità di bacino dell’Adige e dell’Alto Adriatico, 2010).
Surface sediment was sampled at the five stations shown in Figure 1. With respect to the WFD water bodies, stations ALG1, ALG2, and TRES are located in PNC1, VIG in ENC2, and GIU in ENC4. PNC1 stands for Polyhaline Non-Confined 1 water body, with salinity ranging between 20 and 30, while ENC2 and ENC4 are Eurhaline Non-Confined 2 and 4, with salinity between 30 and 40; the three water bodies are NC-non-confined, to differentiate them from those located in the inner parts of the lagoon, characterized by higher water residence time. All stations were located in shallow areas, about 1 m deep. Station ALG2 was located near a Manila clam (Ruditapes philippinarum) farming area (Pessa et al., 2018). Stations ALG2, GIU, and TRES were more exposed to wind, with respect to ALG1 and VIG, which are protected, respectively, by an island and a saltmarsh, with the prevalent winds in this area blowing from North-East (Bora) and South-East (Scirocco). The water residence time was higher at stations TRES and ALG1: the latter is also directly affected by freshwater discharges. Four water quality monitoring stations were selected, belonging to the Ministero delle Infrastrutture e dei Trasporti network (Figure 1). One of these stations, VE02, was located nearby the ALG2 station.
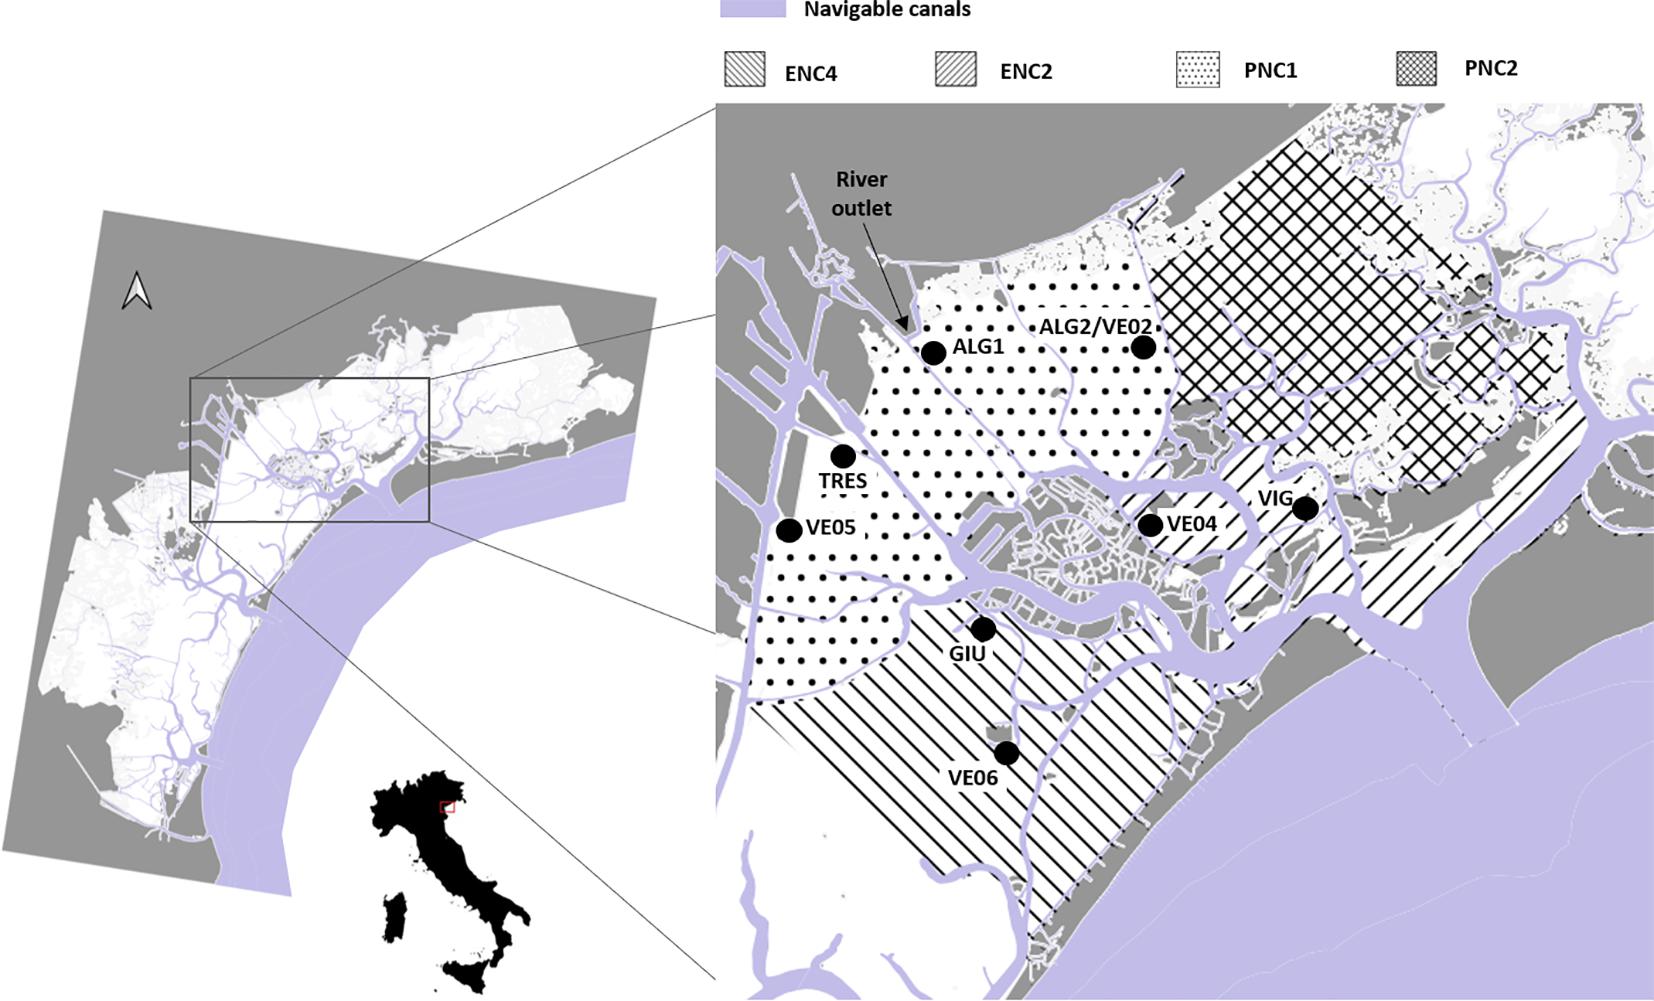
Figure 1. Sediment sampling stations (ALG1, ALG2, TRES, GIU, and VIG), and oxygen monitoring stations (VE 02-04-05-06) reported in the framework of the subdivision adopted by the management plan HDOA (see references in text).
Materials and Methods
Field Campaigns and Data Analysis
The five stations in the central part of the lagoon were sampled in 2015, 2016, and 2017 (Figure 1 and Table 1). At each station, water column was sampled at a depth of 0.5 m with a 5-L Niskin® bottle. At least three 20–40 cm long sediment cores were collected using an Uwitech single tube corer attached to a coring stick. Cores were capped and stored in the shade before returning to the laboratory.
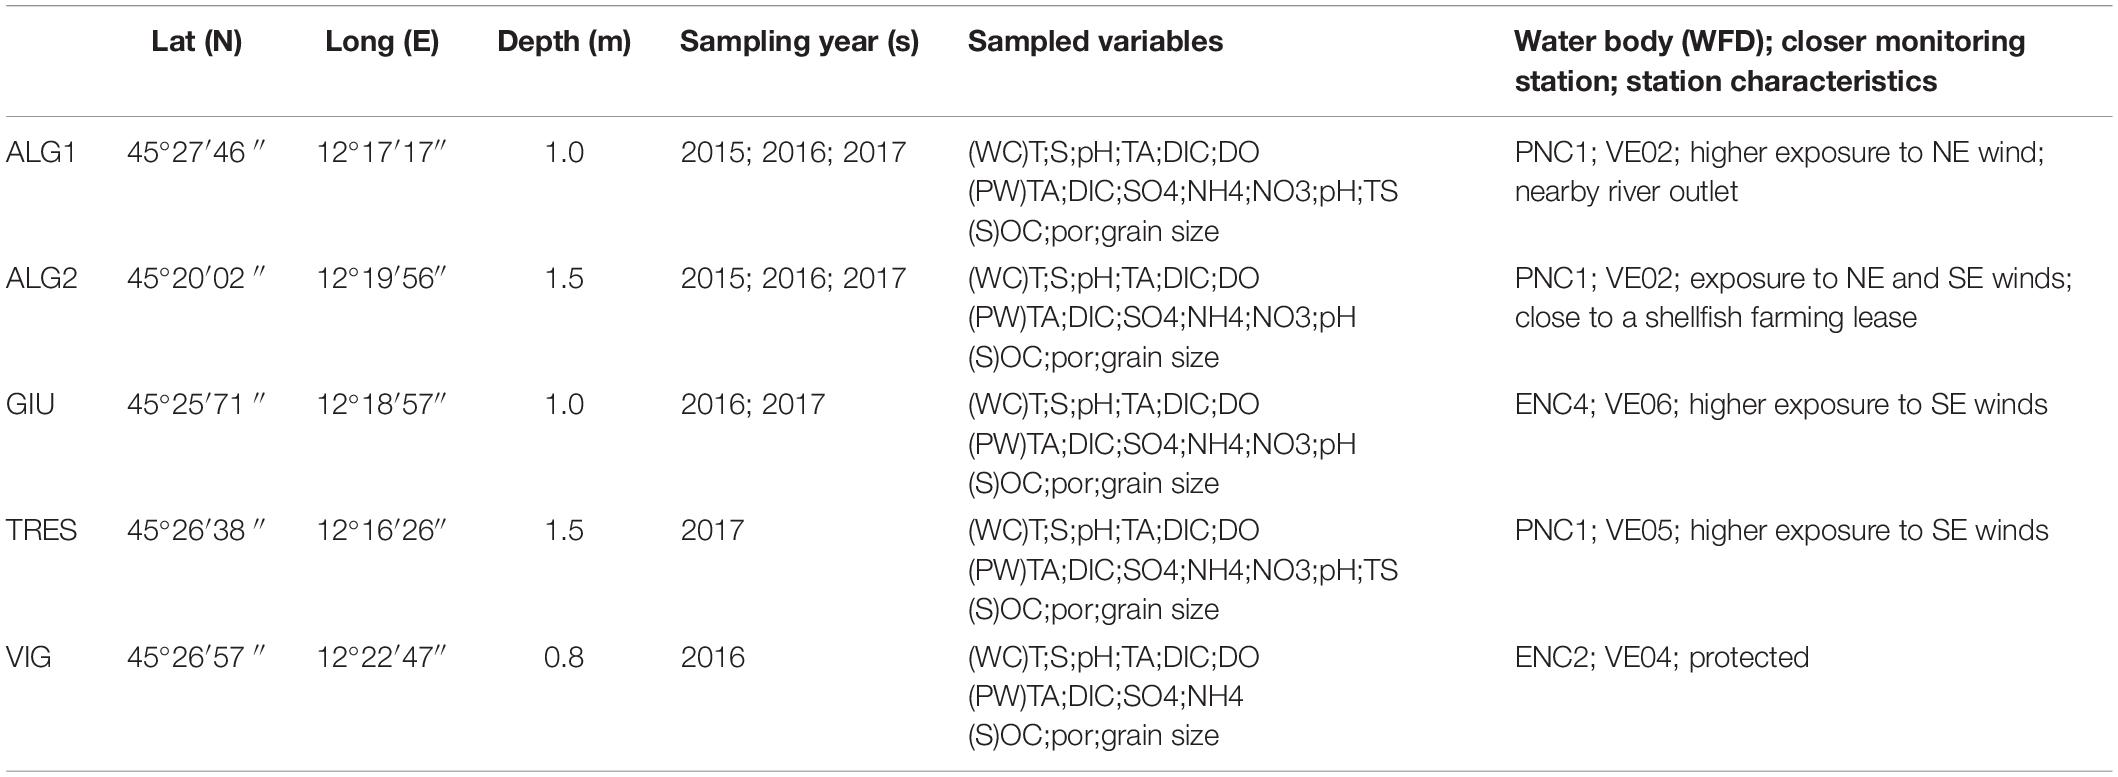
Table 1. Positions of the five sampling stations and field surveys.
Water Sampling and Analyses
Water temperature was measured with a precision of 0.1°C and salinity with a thermo-salinometer with a precision of 0.1. pH measurements were carried out in 2017 in triplicate within 1 h after sampling by spectrophotometry with unpurified m-cresol purple as indicator dye (Clayton and Byrne, 1993). They are reported on the total proton scale (pHT) with an uncertainty of ±0.01 pH units. Samples for dissolved inorganic carbon (DIC) and total alkalinity (TA) analysis were stored in 50 ml “grease sealed” glass stoppered bottles, and preserved by adding 100 μl of saturated HgCl2. One bottle was collected at each station, each expedition. TA was measured on 20 ml samples by open cell titration with 0.01 N HCl (Dickson et al., 2007). DIC concentration was analyzed with a DIC analyzer (Apollo/SciTech®) on repeated 1 ml samples (Rassmann et al., 2016). Both measurements showed an uncertainty below 0.5%. Both measurements were calibrated every day using Seawater Reference Material (standard batch #136) provided by the Scripps Institution of Oceanography (A.G. Dickson Laboratory). In 2016, pH was recalculated from DIC, TA, T, and S using the CO2Sys software (Lewis and Wallace, 1998). DO concentrations were determined by Winkler titration (Grasshof et al., 1983) with a precision of ±0.5 μM.
Porosity, Organic Carbon Content, and Grain Size
Sediment porosity profiles were determined by slicing one of the cores with a 2 mm resolution until 10 mm depth, a 5 mm resolution until 60 mm (Cathalot et al., 2010), and a 10 mm resolution down to the bottom of the core. Porosity was calculated as the weight difference between wet and dried sediment after 1 week at 60°C, using average sediment density (2.65 g cm–3) and a salt correction based on lagoon water salinity at the site. Organic carbon was measured after removing inorganic carbon using HCl 1.2 N as a wet treatment. Drying was made at 60°C after rinsing and centrifugation. Around 1 g of sediment was decarbonated and the sample size for measurement, in triplicate, was 15–20 mg. Standards for the CHN analyzer calibration were made of pure acetanilide. Measurements were performed on a Fisons Instrument NA 1500 Element Analyzer at LSCE (Cathalot et al., 2013) with a precision of 0.1% dry weight. For grain-size determination, bulk sediment was treated with 0.1 N aqueous solutions of hydrogen peroxide (H2O2) and acetic acid (25%) to remove organic materials and carbonate fractions, respectively. The mixture was then rinsed several times (about five rinse cycles) to remove acetic acid residues and gently shaken to achieve deflocculation of sediment. Grain-size distribution of carbonate- and organic-free terrigenous particles in the range of 1.0–2000 μm in the suspension was determined using a Malvern Mastersizer 2000 Particle Size Analyzer at the Laboratoire Géosciences Paris-Sud (GEOPS, Université Paris-Sud/Paris-Saclay). In order to reduce quantity errors, each sample was measured five times and the average of these five measurements was employed to represent the grain-size distribution of each sample.
Porewater Microprofiles of O2, pH, and H2S
One of the three cores was used for determining oxygen, pH, and H2S microprofiles at the three sites, using micro-electrodes (Unisense®) (Rabouille et al., 2003; Cathalot et al., 2012; Rassmann et al., 2016). Cores were maintained at in situ temperature using a cooling device and gently bubbled with air, in order to ensure overlying water oxygenation and stirring. Three to four oxygen profiles, two pH profiles, and one H2S profile were measured within the portion of the core in which no shell debris and macrobenthos were visible at the surface. Vertical profiles were measured with a 200 μm resolution near the sediment-water interface (SWI) and 500–3000 μm resolution below 2 cm to (for pH and H2S). O2 microelectrodes were calibrated with a two-point calibration technique using O2 concentration in the water determined by Winkler titration and the anoxic pore waters. The pH microelectrodes were calibrated using three NBS buffers (pH 4.00, 7.00, and 9.00 at 20°C) for the electrode slope which was recalculated at in situ T. The pH variation was then added to the bottom water pH measured at the station for the absolute value (pHT scale). Signal drift of O2 and pH microelectrodes during profiling was checked to be less than 5%. Diffusive Oxygen Uptake rates (DOU) were calculated for each micro-profile using the observed O2 concentration gradient calculated over 400 μm in the sediment, the measured porosity value and the diffusion coefficient at in situ temperature (Broecker and Peng, 1974) corrected for tortuosity. Clark-type microsensors (Cathalot et al., 2012), with a platinum guard cathode to ensure a low and stable readings in the absence of sulfide were used for determining sulfides. They were calibrated using H2S standards prepared daily from a main solution and preserved with TiCl3. The main sulfide solution was re-titrated every day using the classical sulfide titration (Grasshof et al., 1983). The position of the SWI for sulfide electrode was determined visually and the measurement step (initially 200 μm) was adapted to adequately capture the sulfide gradient and measure deeper concentrations (with a 1–3 mm step). Total sulfide (TS) was recalculated using pH and measured H2S (Jeroschewski et al., 1996).
Porewater Profiles: DIC, Alk, NH4+, NO3–, Fe2+, SO42–
The extraction of sediment pore waters was conducted immediately after returning to the air-conditioned laboratory (1–2 h after core collection) using Rhizon filters with a mean pore size of 0.1 μm (Seeberg-Elverfeldt et al., 2005) in a glove bag flushed with N2 to create an anoxic atmosphere. The sampling interval was 2 cm in the top 10 and 4 cm underneath. Immediately after collection, pore waters were analyzed for dissolved Fe2+ using the ferrozine technique (Stookey, 1970) and total dissolved iron concentrations the next morning after reduction of total dissolved iron with hydroxylamine. Porewater and water samples were poisoned with HgCl2 for TA and DIC laboratory analysis, acidified for sulfate, and stored in the dark at 4°C until analysis in the laboratory. Subsamples for NH4+ were frozen. Another core was sectioned and centrifuged at room temperature for the determination of nitrate (NO3–) at higher depth resolution near the SWI (0.5 cm) down to 2 cm, and 1 cm resolution down to 5 cm. After centrifugation, porewaters were filtered using 0.45 μm pore size Minisart and kept frozen until analysis. TA was measured on 3 ml samples by open cell titration with 0.01 N HCl (Dickson et al., 2007). DIC concentrations were analyzed with a DIC analyzer (Apollo/SciTech®) on 1 ml samples as previously described (Rassmann et al., 2016). Certified reference materials were used to calibrate the TA and DIC methods (oceanic CO2 measurements, Scripps Institution of Oceanography-batch n°136). The relative uncertainty for DIC and TA was ±0.5% of the final value. Sulfate (SO42–) concentration was quantified after dilution by a factor of 100 by ion chromatography on an ICS 1000 chromatograph (Dionex) with a relative uncertainty of ±1.6% (Rassmann et al., 2020). To measure ammonium (NH4+) concentrations, samples were diluted and analyzed using the indophenol blue method (Grasshof et al., 1983). The uncertainty of the method with small porewater volume was about 5%. NO3– was determined using the Vanadium chloride reductant as described in Schnetger and Lehners (2014) followed by the NEDD/sulphanilamide addition and colorimetric measurement. Precision on total NOx was around 2%.
Time Series of Water Quality Monitoring Data
Bi-hourly time series of DO saturation, water temperature, and salinity, were provided by Ministero delle Infrastrutture e dei Trasporti (provveditorato generale alle OO PP del Veneto, Trentino Alto Adige, Friuli Venezia Giulia, già Magistrato alle Acque di Venezia). Data were collected from March 2005 to December 2018 by the monitoring network SAMANet, set up and managed by the same water authority. Time series pertaining to stations VE02, VE04, VE05, VE06 (Figure 1), which were located in the three WFD water bodies, were considered as representative of the water quality at the five stations in which the sediments were collected, VE02 for ALG1 and ALG2, VE04 for VIG, VE06 for GIU, and VE05 for TRES (Table 1). Data collected 2 weeks before the field surveys were used for characterizing the hydrological conditions in which sediment samplings were carried out. The time-series of oxygen saturation in summertime (June to September) were reanalyzed for estimating: (i) the weekly average DO saturation (values exceeding ±2.7σ were discarded as outliers), and (ii) the number of consecutive days with minimum O2 values <25% saturation, which was taken as an indicator of the persistence of an hypoxic event. Indeed, at the average summer temperatures (>20°C) and salinities (>25), this saturation threshold (<55 μmol L–1) is below the hypoxic level (62 μmol L–1).
Porewater Profiles Averaging and Reaction Rate Calculations
The rates of DIC production and SO42– consumption were estimated using the Profile software (Berg et al., 1998), using as input the average profiles of DIC and SO42– at ALG1 and ALG2 with a resolution of 1 cm. These were obtained by linearly interpolating each profile, and averaging them. The set of input data included also files containing different levels of bio-irrigation. Fits to the measured concentration profiles were optimized and the integrated reaction rates converted in mmol m–2 d–1. The uncertainty for the rate calculations is estimated as ±50%.
Results
Water Column, Porewater, and Sediment Profiles
Water physico-chemical parameters measured during the three sampling campaigns, Jun 2015, May 2016, and Sep 2017 (here-in 2015; 2016; 2017) are reported in Table 2. Temperature ranged from 17.2°C (ALG2-2016) to 26.2°C (ALG1-2015), while salinity varied from 26 psu (ALG2-2015) to 33.1 psu (GIU-2016). Salinity showed limited within-station variability, with the exception of ALG-1 in 2015. DO concentrations were close to saturation except at ALG1 in 2015 (356.3 μM). TA and DIC were markedly larger at stations ALG1 (3067–3417 TA; 2784–2915 DIC) and ALG2 (3036–3281 TA; 2868–2882 DIC), compared with the other stations (min TA 2917, min DIC 2583 at TRES in 2017), accompanied by a lower pH at ALG1 (min 7.72 at ALG1, max 7.95 at TRES). Water column physico-chemical parameters recorded at the monitoring station VE 02 during the fortnight preceding each sampling campaign are shown in Figure 2. Water temperatures ranged from 14.3°C in late April 2016, to 28.9°C in June 2015 and showed marked differences of environmental conditions during these 3 years. Summer conditions, with water temperatures going above 29°C were present in late June 2015, while transition water temperatures were recorded in May 2016, raising from 12.5 to 22°C, and indicating a spring rapid warming of the water column, approaching a pre-summer condition. The opposite situation was recorded in late September 2017, with water temperatures decreasing from 24 to 15°C, and stabilizing around 18°C during the sampling campaign. Salinity shows large daily variability among the 3 years, being mainly influenced by tidal exchanges and river inputs. Regarding DO, 2015 presents remarkable differences with respect to the two consecutive years, with daily values reaching 250% saturation, and indicating intense primary production.
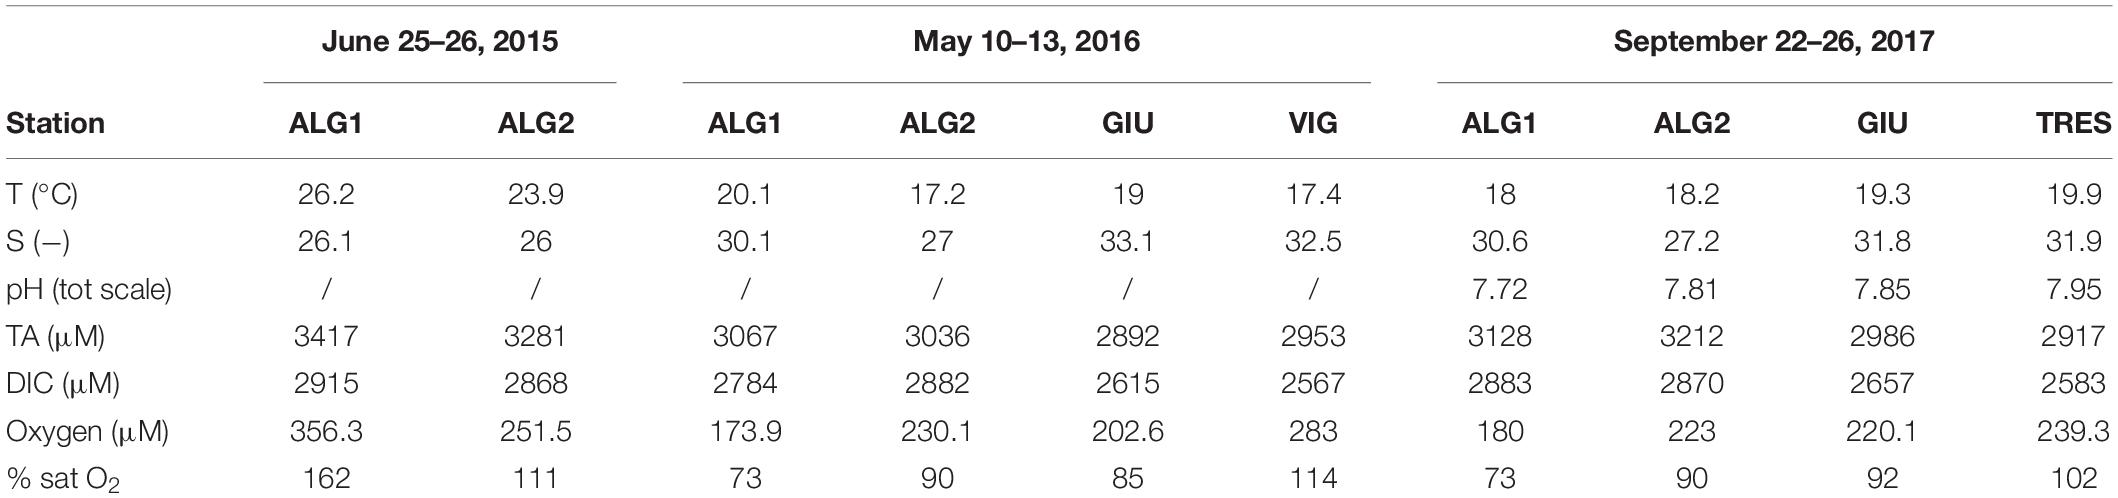
Table 2. Water physico-chemical parameters at the five sampled stations, years 2015–2017.
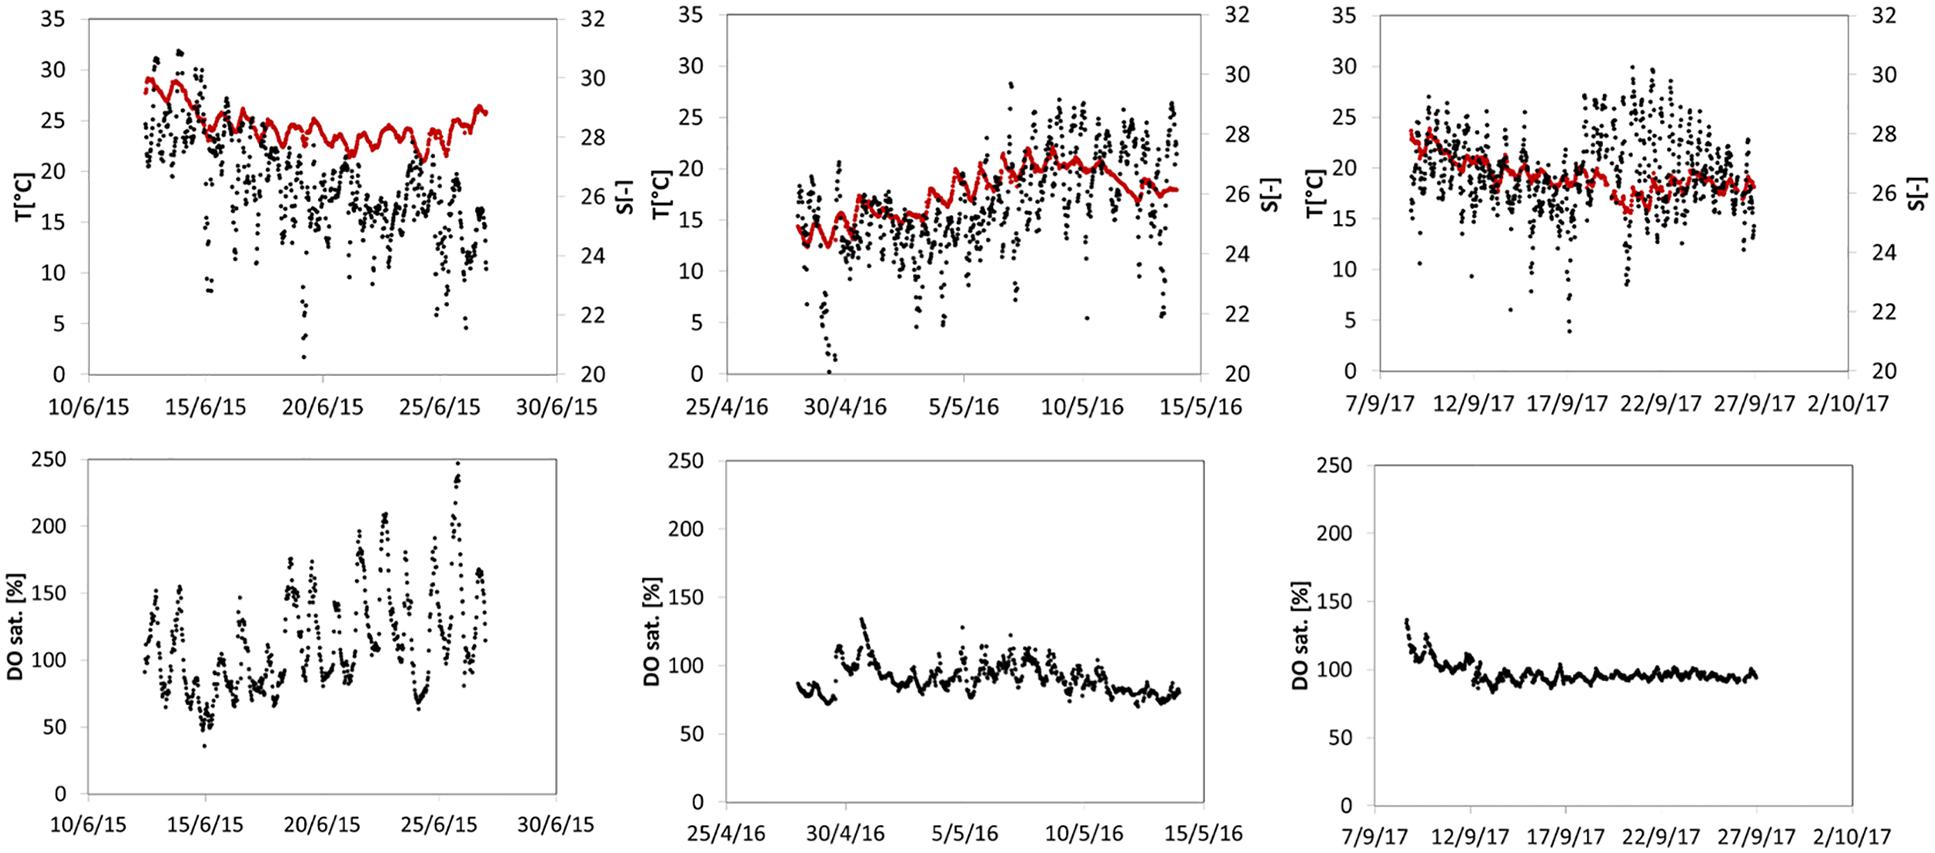
Figure 2. Water column monitoring data at stations VE02 during sampling periods and on the 14 days preceding each campaign. Upper panel: water temperature (red) and salinity (black); lower panel: dissolved oxygen concentration – % with respect to saturation value.
Figures 3, 4 show the pore water profiles, respectively for the years 2015–2016 and 2017. The core length ranged from 15 to 45 cm, due to the compactness of the sediment and the associated difficulty to sample long cores. DO, DIC, TA, NH4+, and SO42– were measured on all cores from the initial measurements in 2015 with the addition of pH in 2016 and NO3–, Fe2+, and TS profiles in 2017. DIC and TA concentration profiles (Figures 2, 3) showed increasing values downcore at all stations with higher maxima at stations ALG1 and TRES (>10 mM) and lower ones at stations ALG2, GIU, and VIG, where concentrations ranged from 5 to 7 mM. A similar pattern was observed for NH4+,with asymptotic concentrations above 500 μM at ALG1 and TRES and lower ones at the other stations (ALG2, GIU, and VIG) except GIU in 2016. In most cases, sulfate depletion was also larger at station ALG1 and TRES (except for ALG1 in 2015), with downcore concentrations lower than 5 mM at station ALG1 in 2016 and 2017 and around 12 mM at TRES. All other stations showed porewater SO42– concentrations at depth near or above 20 mM. pH profiles at all stations showed a marked decrease (−0.5 to −0.7 pH unit) just below the SWI, followed by an increase below the oxygen penetration depth and stabilization at depth. NO3– concentrations decreased rapidly with depth, and fell below the detection limit below the first centimeter. Dissolved iron (II) profiles were characterized by subsurface maxima, located at a depth ranging from 1 to 3 cm: the highest peak was observed at station ALG1. Total dissolved sulfide, calculated from measured H2S and pH, showed measurable concentrations in the top layers at two stations (ALG1 and TRES) and exceeded 0.5 mM at the bottom of the core. Vertical distributions of porosity (one profile per station per year), OC content and granulometry (one profile per station in 2017 except VIG in 2016) are shown in Figure 5. These parameters were measured in order to provide a background characterization of the stations. Porosity (Figure 5) decreased with depth, with the exception of ALG2. The steeper gradient was observed within the upper 20 mm at all sites. OC content ranged from 0.5 to 2%, with largest values in ALG1 and TRES, where algal macro-debris were observed during slicing. These two stations were characterized by the presence of fine silts. Stations GIU and VIG showed very low OC content (0.5%), which correlated negatively with coarser grain size at these stations. ALG2 profile showed a decrease in grain size with depth from coarse to fine silts, which was accompanied by an increase of OC content, from 0.5 to 1%.
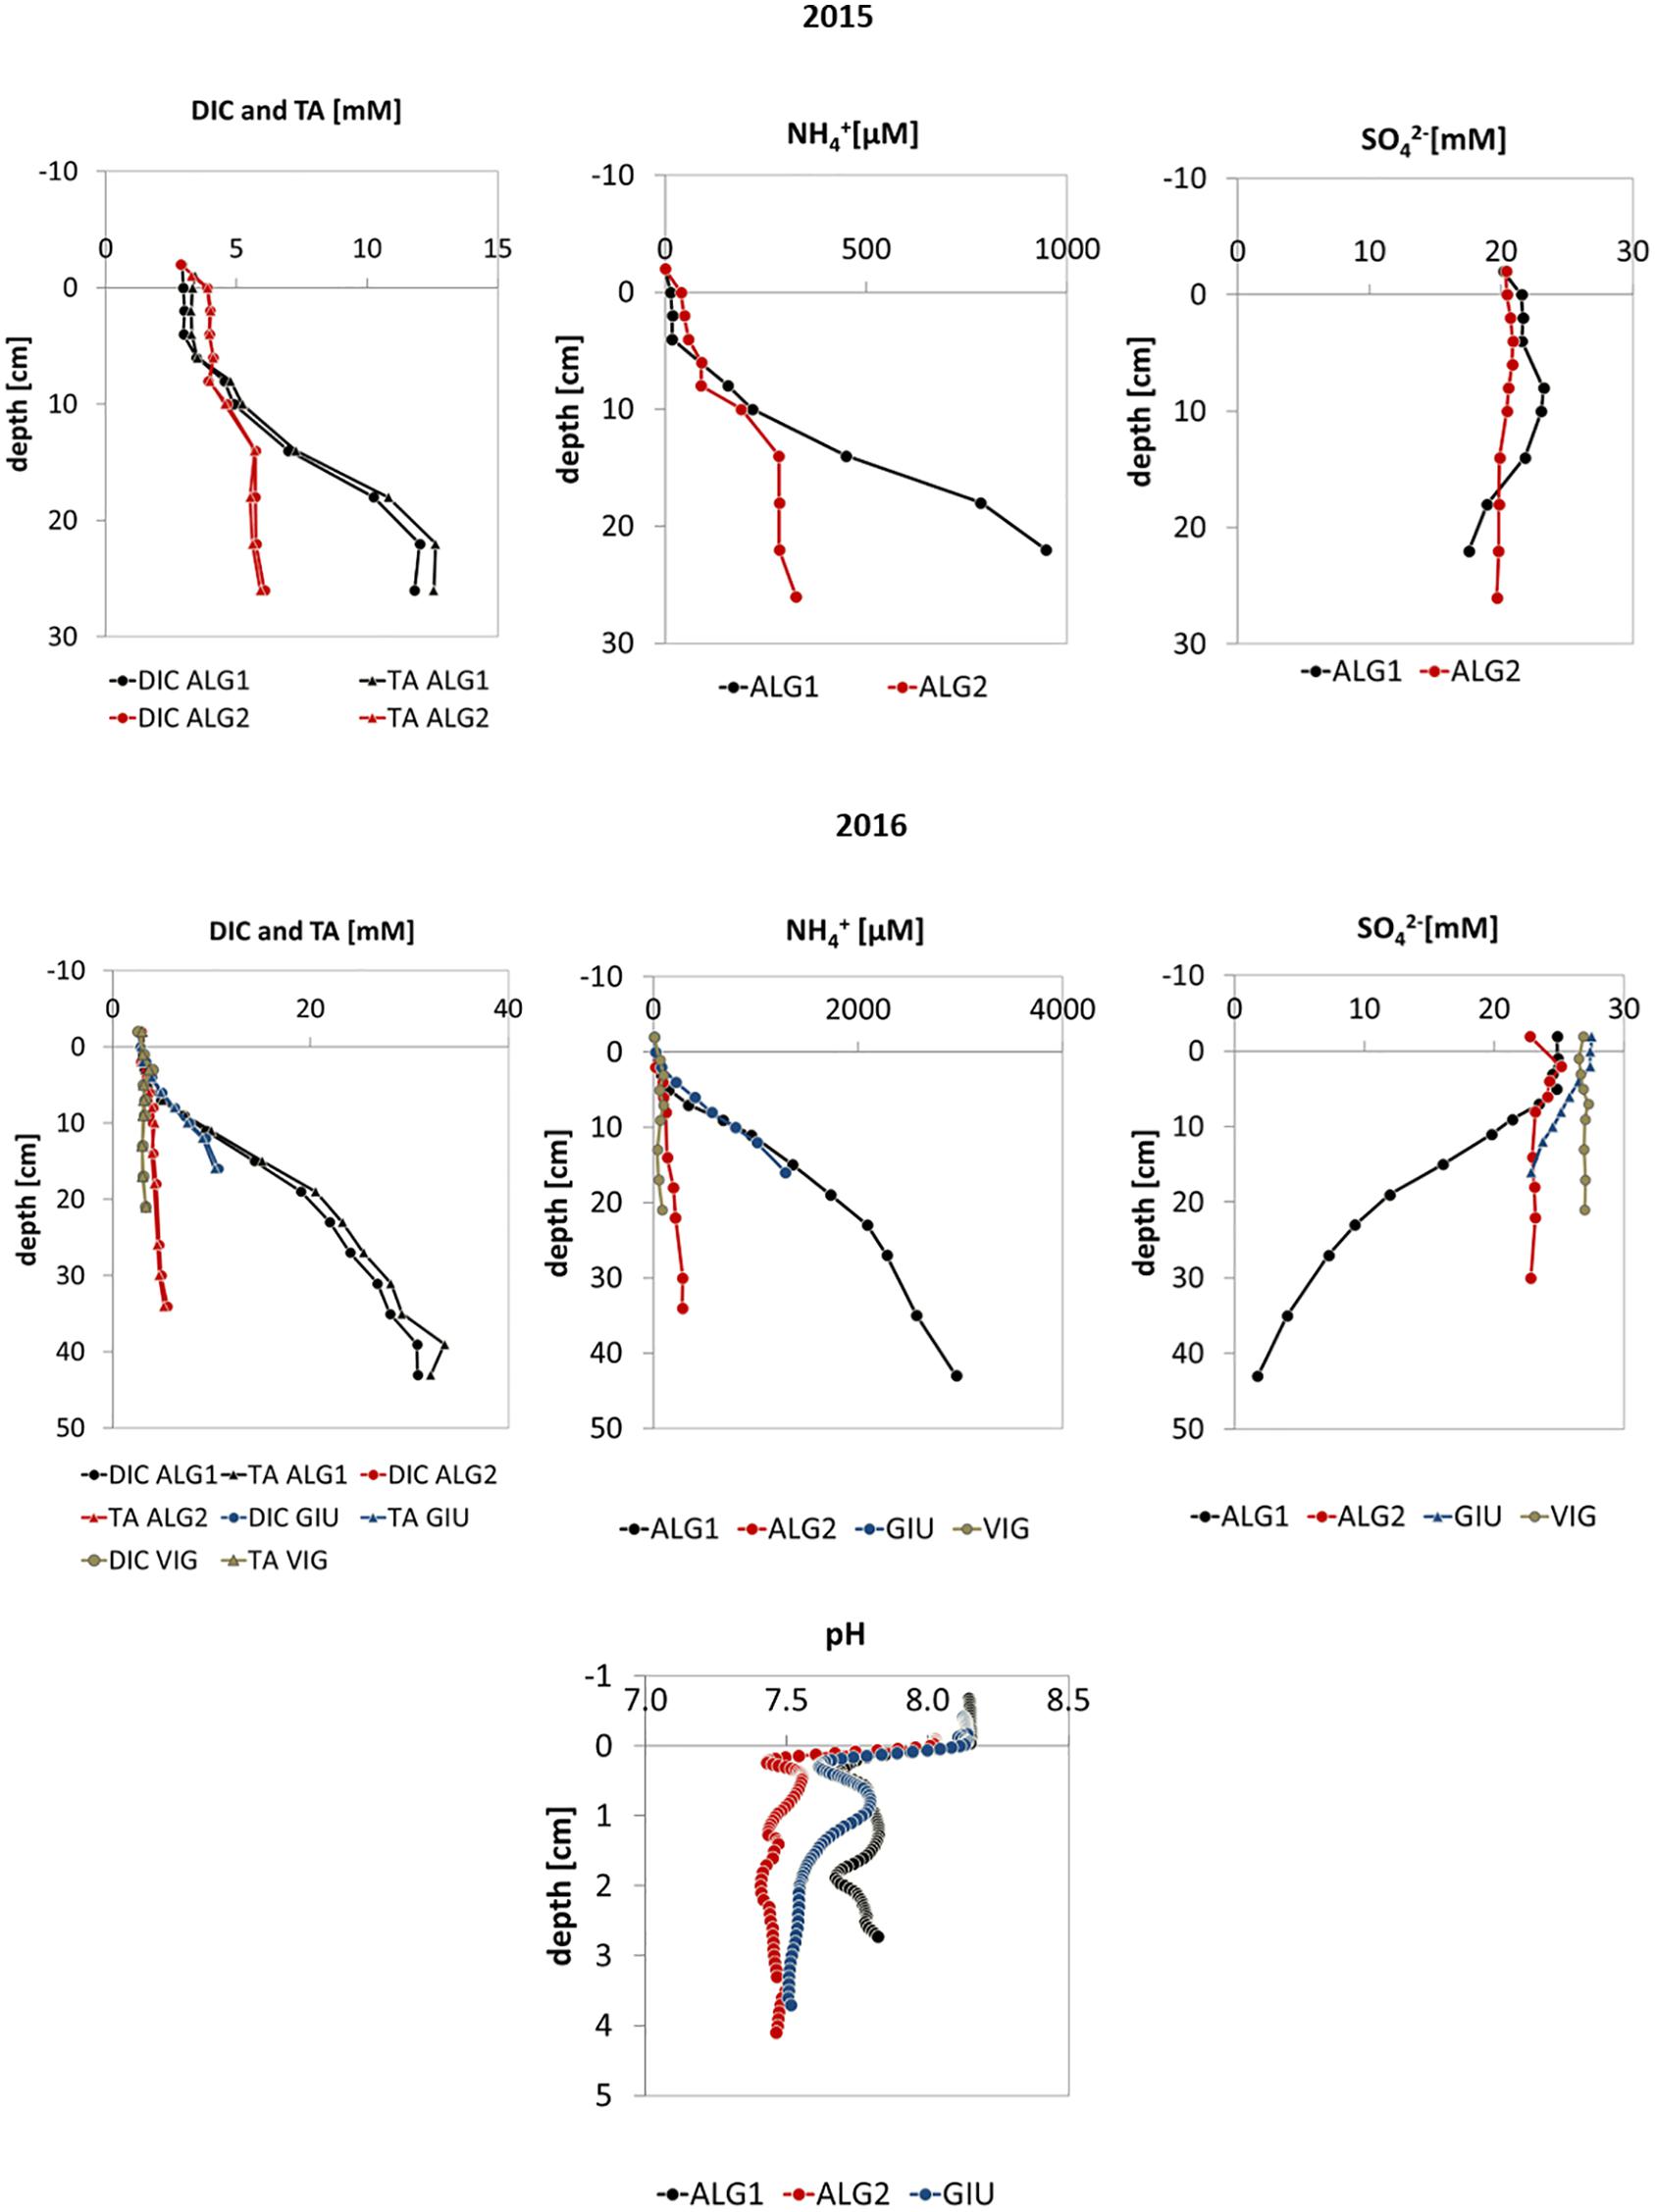
Figure 3. Profiles of DIC, TA, NH4+, SO42–, and pH in pore waters measured in 2015 and 2016.
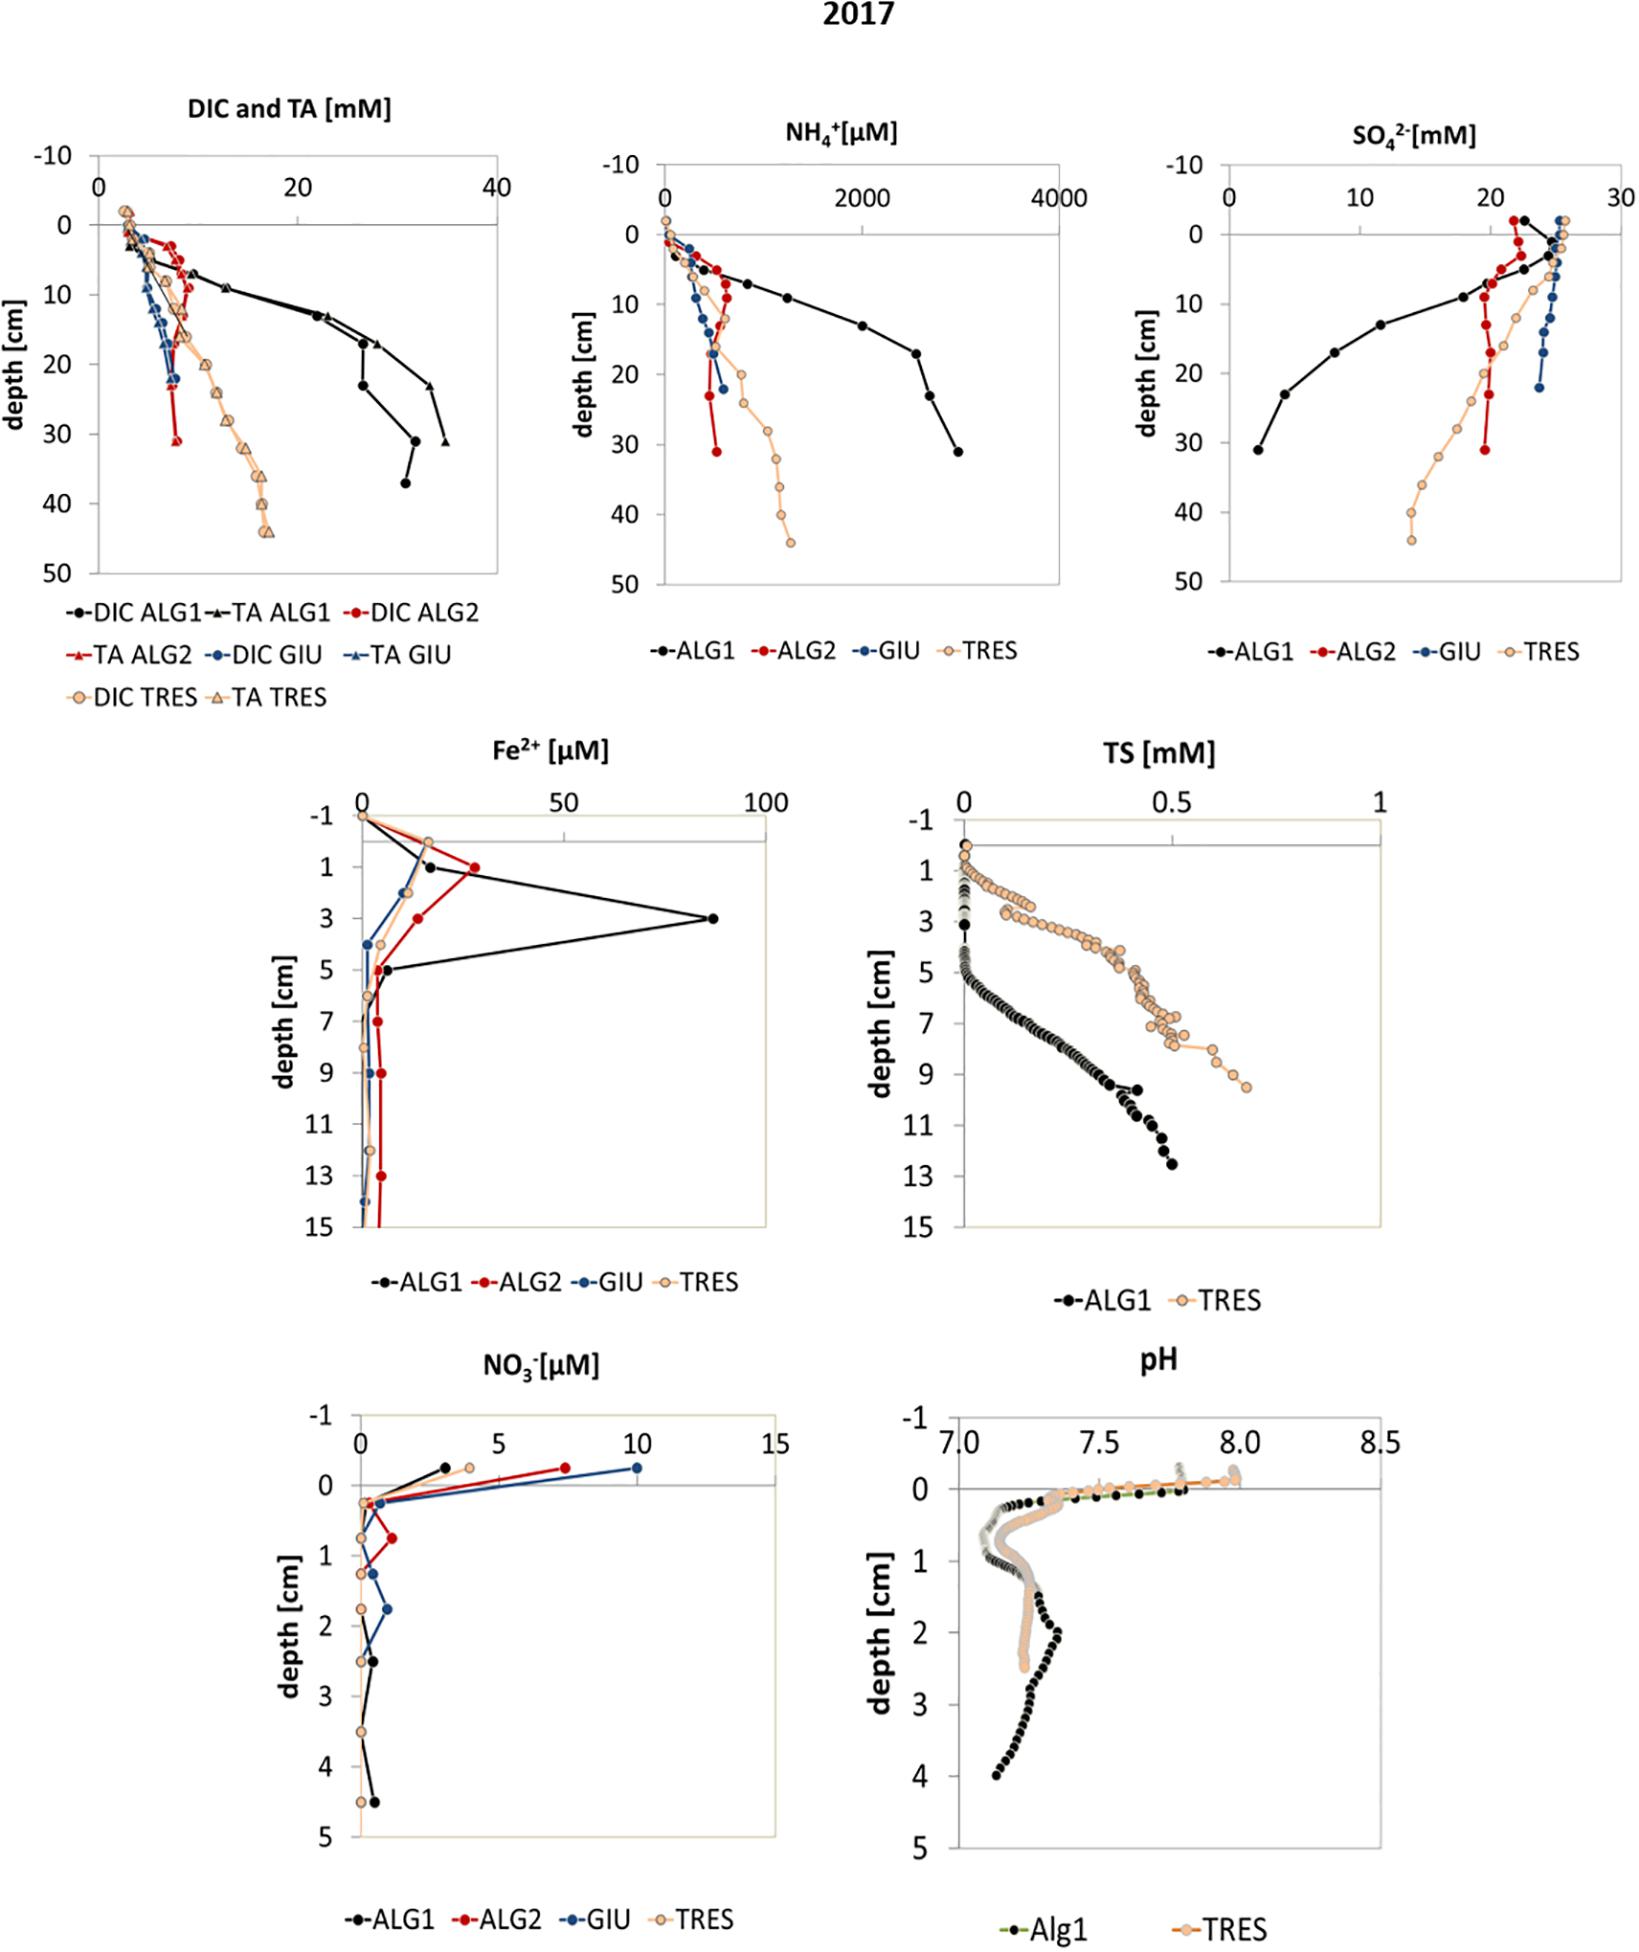
Figure 4. Profiles of DIC, TA, NH4+, SO42–, Fe2+, and Total Dissolved Sulfide (TS), NO3–, and pH in pore waters measured in 2017.
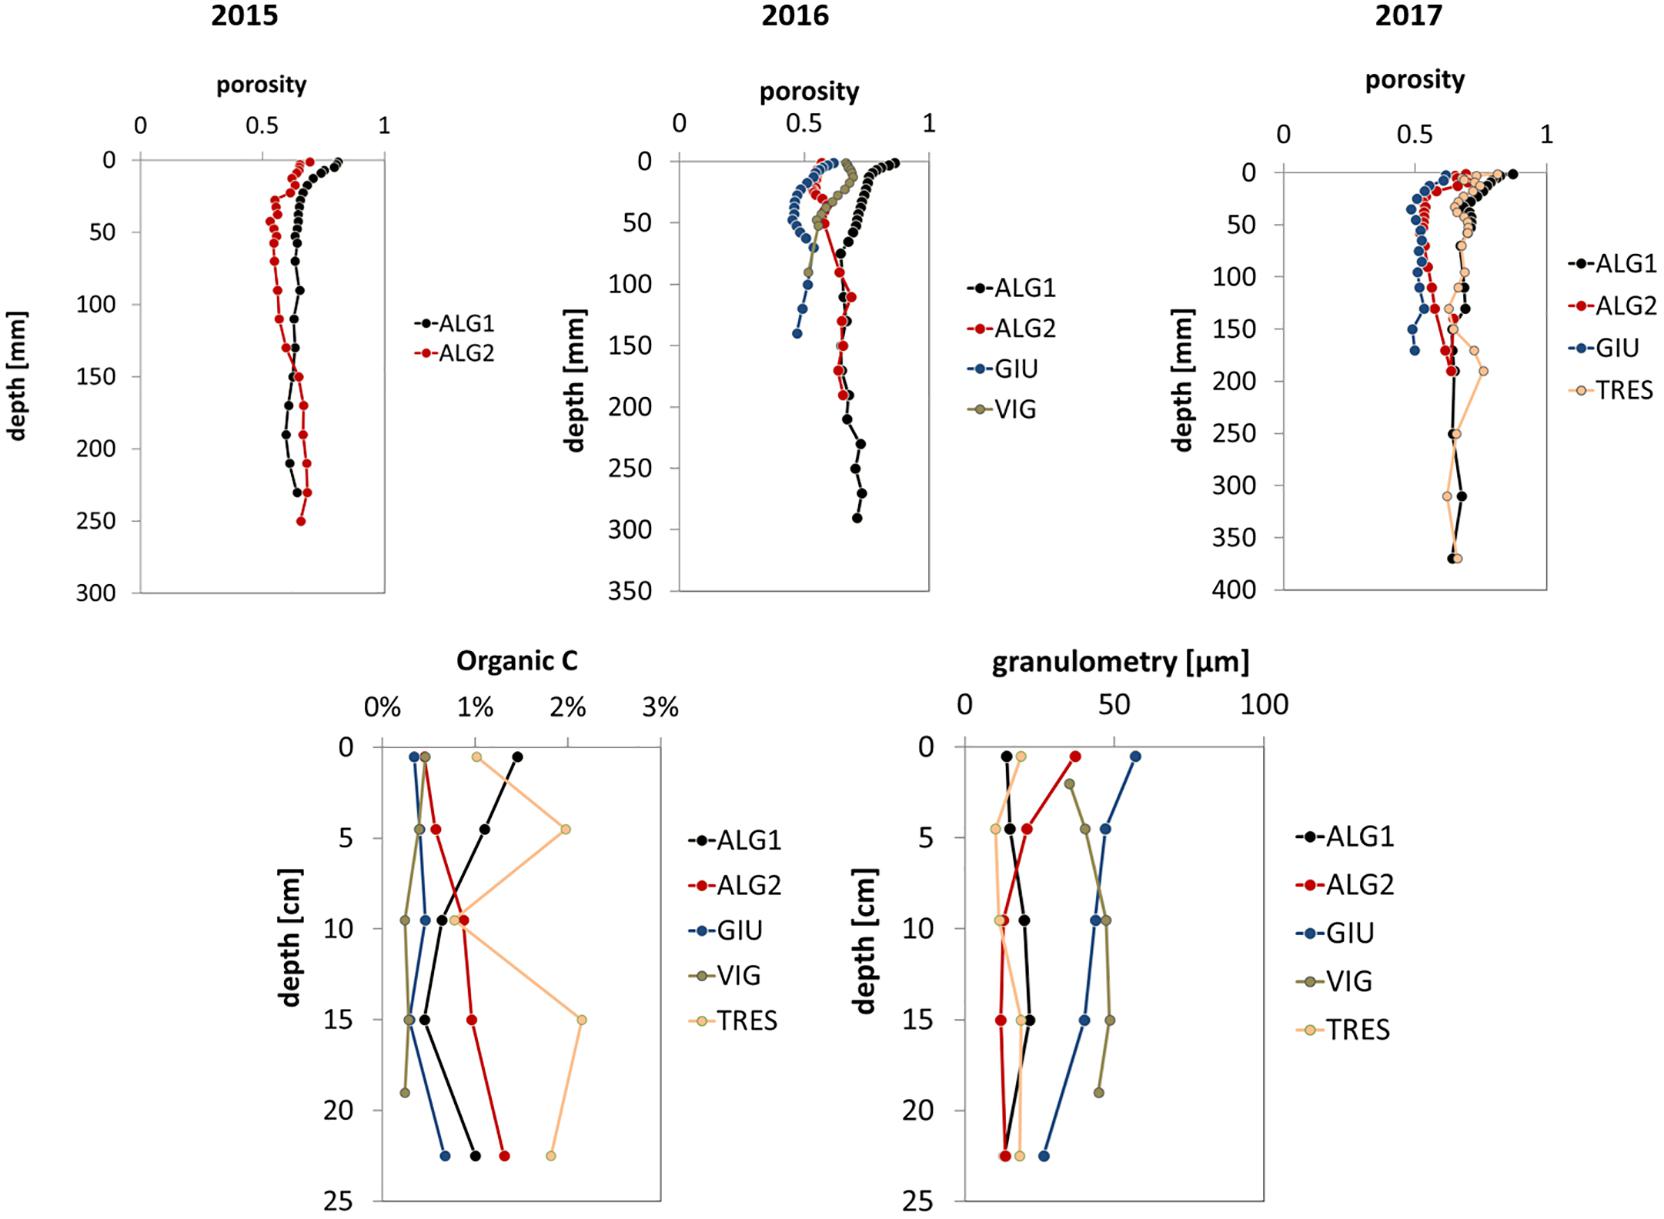
Figure 5. Sediment micro-porosity (2015–2017), OC content (2016–2017), and granulometry (2016–2017) at the five sampling stations.
Overall, 38 O2 microprofiles were collected at the five stations. As one can see in Figure 6, O2 concentrations show quasi-monotonic downward decreases, with oxygen penetration depth ranging from 1 to 1.7 mm. Deviations from this general pattern were observed at ALG1 in 2015 with visible burrows and, to a lower extent, at ALG2 in 2017, most likely due to bioirrigation activity. Larger penetration depth and variability were observed at ALG1 in 2015, related to very high concentration of oxygen in the water column (O2 saturation of 160%), indicating high primary production and intense biological activity during the end of the spring 2015. Diffusive oxygen fluxes (DOU) (Table 3) ranged between 8.8 ± 2.7 mmol m–2 d–1 at GIU and 28.5 ± 12 mmol m–2 d–1 at ALG1. Stations ALG1 and TRES showed the largest average DOU, although the difference with ALG2 was not significant, due to large seasonal variations.
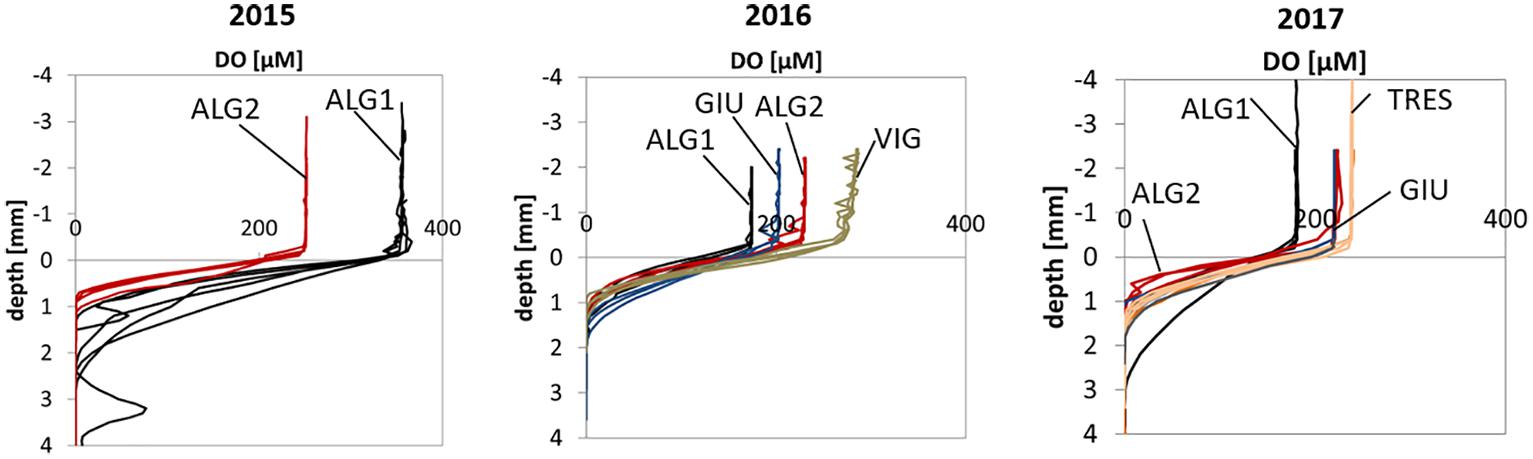
Figure 6. Oxygen microprofiles in porewaters from the years 2015, 2016, 2017: ALG1 black, ALG2 red, GIU blue, VIG gray, TRES orange.

Table 3. Diffusive oxygen uptake for the Venice lagoon stations.
Long-Term DO Monitoring
The box-plot presented in Figure 7 summarizes the average weekly distribution of DO in summertime at station VE02, based on 12 years of monitoring data. The DO median and minimum values were lower in August, but the last 2 weeks of June also presented critical conditions, with minima below 20% saturation. Figure 8 presents the index of hypoxia duration for the period comprised between June 1 and September 31, at the four monitoring stations. As can be seen, stations VE02 and VE05, located in the water body PNC1, presented the highest values of the index, up to 23 days at VE02 in 2013.
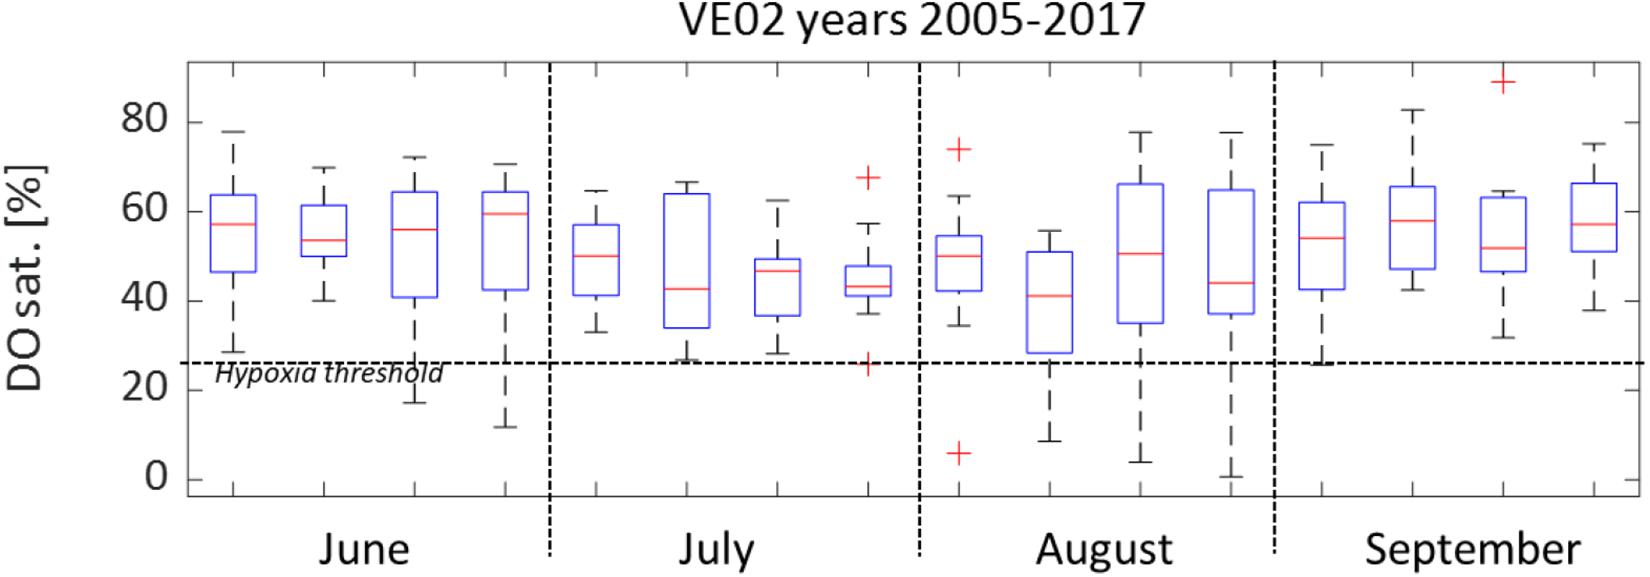
Figure 7. DO saturation at VE02 monitoring station: – box edges indicate the 1st and 3rd quartiles, the central line marks the median, while whiskers indicate extreme (max–min) data points not considered outliers (plotted individually using the “+” symbol).
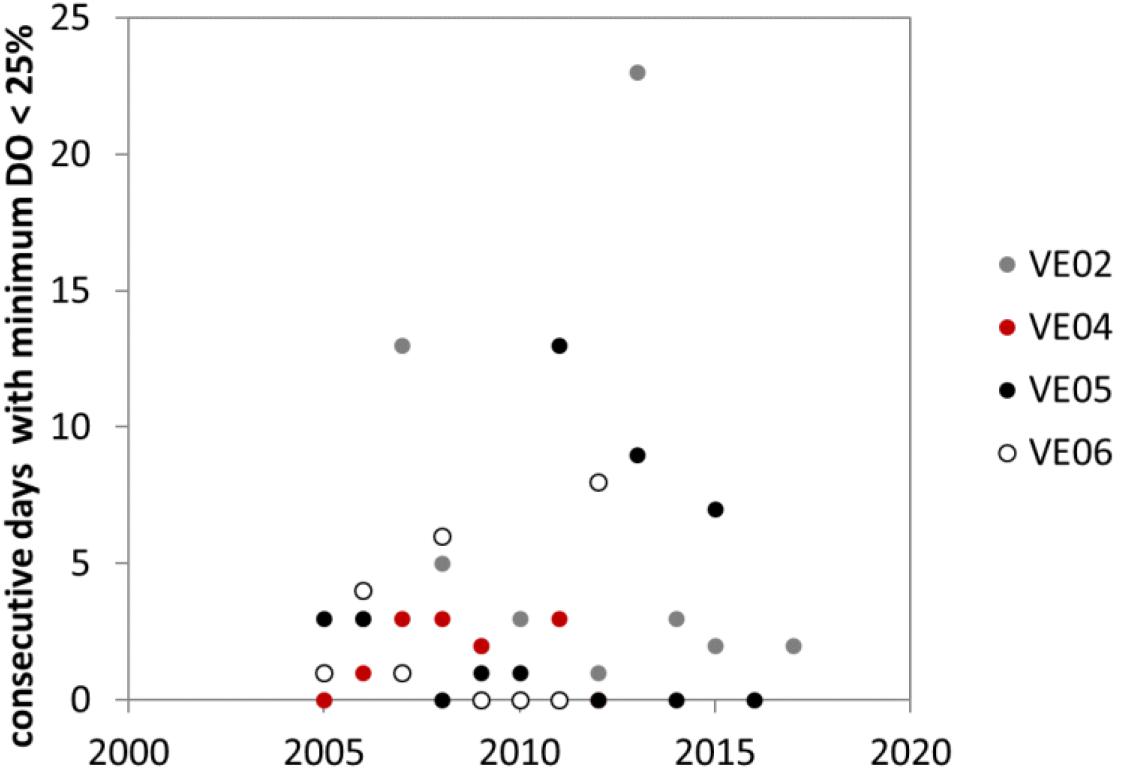
Figure 8. Number of consecutive days with minimum O2 concentration below 25%.
Discussion
Diagenetic Pathways and Intensity
The oxygen porewater profiles showed limited differences among the five stations, which displayed oxygen penetration depth of 1–1.7 mm. On the contrary, larger DOU values were calculated at stations ALG1, TRES, and ALG2, likely linked to aerobic mineralization and re-oxidation of reduced compounds (Dedieu et al., 2007b; Glud, 2008).
NO3– profiles indicated that denitrification was occurring at all sites. However, denitrification did probably not represent a significant diagenetic pathway, given the low concentration of NO3– in the water column (<10 μM; Dedieu et al., 2007a). The peaks in Fe2+ concentration observed in porewater profiles at all stations indicated that the iron reduction pathway was active at all sites (van Cappellen and Wang, 1996) and, in particular at station ALG1. This is consistent with the increase in pH below the oxic zone at all station (Figures 2, 3), which can be due to iron and probably manganese oxide reduction. The low Fe2+ concentration at depth below 5 cm can be explained by the precipitation of FeS or FeS2 (Rassmann et al., 2020). Sulfate reduction was the most important diagenetic pathway at stations ALG1 and TRES, where the largest SO42– gradients and integrated consumptions, as well as the largest increases of dissolved sulfide were observed (Figure 4). The difference between the TS increase, about 0.5 mM, and the decrease in porewater sulfate concentration, ranging from 2 to 20 mM, can be explained by the precipitation of iron sulfides (Metzger et al., 2007; Rassmann et al., 2020).
ALG1 and ALG2 were more thoroughly investigated and were visited over 3 consecutive years, in different months over the spring–summer season. Consequently, they were selected as master stations (MS) of this study, on which we attempted to define differences regarding the intensity in sediment early diagenesis. DIC and SO42– were considered as key variables, given the importance of sulfate reduction pathway in organic matter diagenesis in marine sediment. Results from this exercise are presented in Figure 9, which shows the average DIC and SO42– concentration profiles at the two MS, and marks the two regions in which these parameters were ranging in the different years. It can be seen from the gray envelopes of the DIC and SO42– concentration profiles that ALG1 and ALG2 showed clear differences which reflected a variable intensity of diagenesis. By using ΔDIC and ΔSO42– defined as the absolute value of the difference between their concentration at the sediment surface and that at the deepest layer of each core, we compared ALG1 and ALG2. The test revealed statistically larger values of ΔDIC and ΔSO42– for ALG1 with respect to ALG2 (Mann–Whitney one-tailed; n1 = n2 = 3, W = 9, p = 0.05).
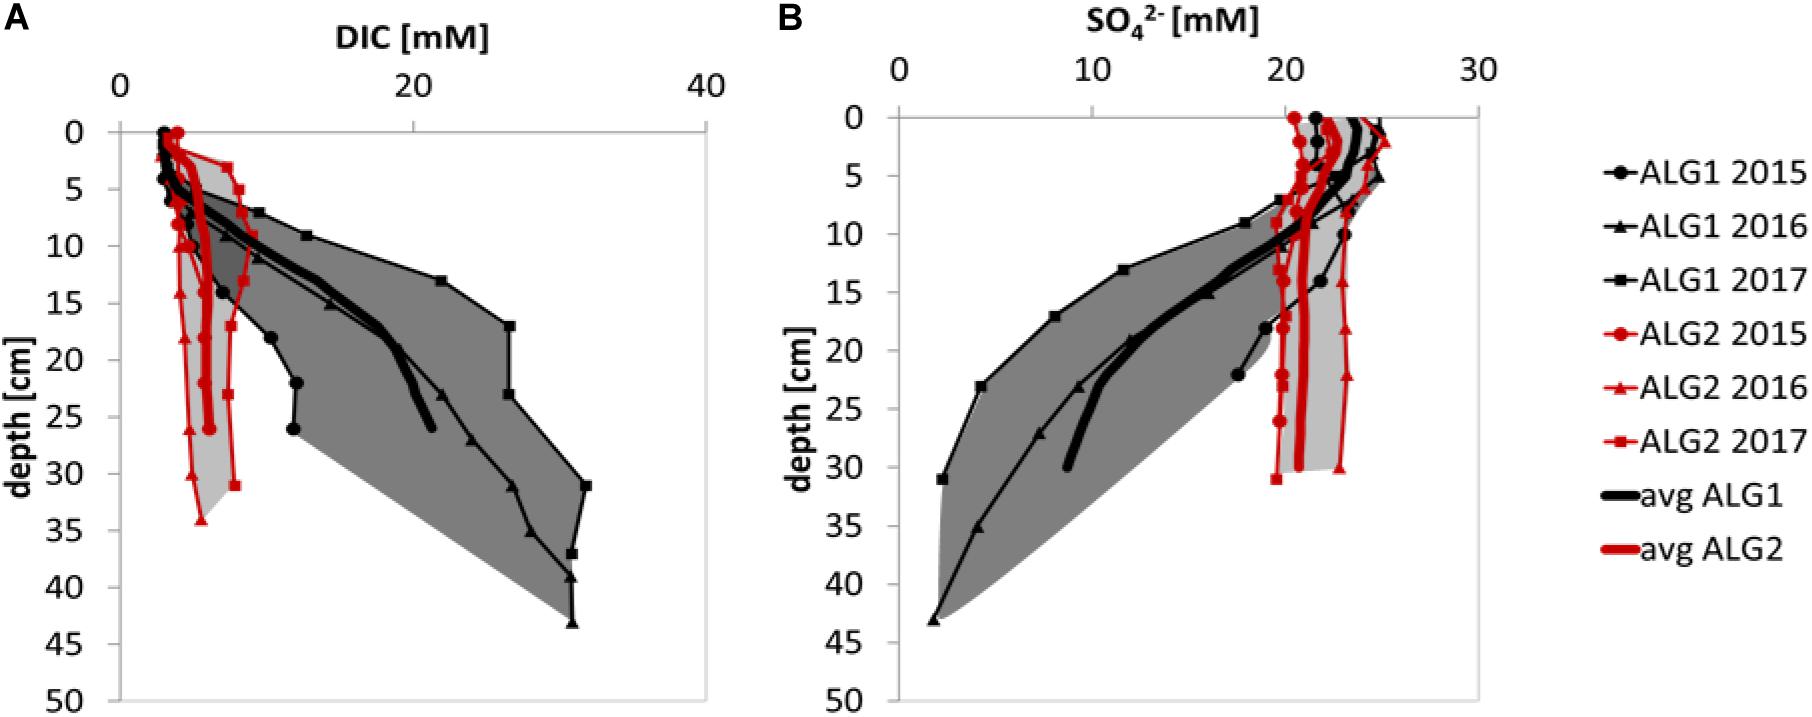
Figure 9. Inter-annual consistency of the sets of data collected at the two CS stations: (A) DIC profiles at ALG1 and ALG2; (B) SO42– profiles at ALG1 and ALG2.
The DIC integrated productions were significantly larger at ALG1 (2.8 mmol m–2 d–1) compared to ALG2 (1.0 mmol m–2 d–1), as well as the SO42– integrated consumption (1.6 mmol m–2 d–1 at ALG1 vs 0.4 mmol m–2 d–1 at ALG1). The ratio among integrated rates of DIC production and SO42– consumption was 1.8 at ALG1 and 2.3 at ALG2, which brackets the theoretical ratio of 2 (Rassmann et al., 2016). Along with the DIC and SO42– integrated rates, DOU calculated from the microelectrode profiles were used to differentiate the MS (28.5 ± 12 mmol m–2 d–1 at ALG1 and 17.5 ± 7.4 mmol m–2 d–1 at ALG2). Based on the differences observed in these three quantities, the two MS presented an “intense diagenesis” behavior (ALG1), and a “moderate diagenesis” behavior (ALG2). The two categories proposed here are consistent with the findings by Gieskes et al. (2015). The authors found TA values around 50 mM and complete consumption of SO42– within the upper 40 cm at two of the investigated stations, while the other sites displayed TA values below 10 mM and presented a limited SO42– depletion. According to the authors, these differences were primarily related to sediment dredging and subsequent disposal. This constitutes an aspect of primary relevance in the comparison of the two works, since in our case no recent reworking was observed in sampled sediments, and all the sampled cores presented intact visual biogenic structures at the core surface. Furthermore, they were collected in shallow water areas which, to the knowledge of the authors, did not experience recent reworking and were placed at a minimum distance of 50 m from the edge of the canals.
Once the difference of the two MS was established, an attempt was made to group the other stations investigated during the three consecutive field campaigns, dividing them between intense diagenesis, at stations resembling ALG1, and moderate diagenesis, at stations closer to ALG2 characteristics. Grouping stations could be relevant for, at least, three reasons: (1) providing information for planning monitoring of crucial sites; (2) guiding data collection for developing a spatial model of lagoon sediments; (3) informing the differential management of sites. Station VIG, sampled in 2016, and station GIU, sampled in 2016 and 2017, show characteristics that are closer to those of MS ALG2 than ALG1, especially in 2017. Indeed, their asymptotic DIC concentration are much lower than the range 12–30 mM, observed at ALG1 (Figures 2, 3). This observation would place the VIG and GIU stations in the “moderate intensity” diagenesis group, which is confirmed by the maximum of NH4+ concentration achieved in these two stations. Furthermore, the difference between ALG1 and VIG/GIU is clearly visible in the sulfate profiles: SO42– concentration was roughly constant at station VIG and showed a few mM decrease with depth at station GIU. On the contrary, station TRES displays a larger SO42– decrease of 10 mM and larger maximal DIC and NH4+ concentrations, which reach 16 mM and 1200 μM, respectively. In that respect, even if the highest concentrations of ALG1 are not met at station TRES, this last station is closer to the characteristics of MS ALG1 (intense diagenesis) than ALG2. The difference between the two groups is corroborated by the organic content of surface sediments which is larger at stations ALG1 and TRES than the three other stations.
Indeed, differences in diagenetic intensity among these stations can be related to patterns of organic matter source and accumulation, driven by the spatial heterogeneity in primary producer assemblages. The spatial distribution of macroalgae coverage and standing crop (Sfriso and Facca, 2007), depends on different environmental conditions. One example is the abundance and productivity of Gracilariaceae and Ulva rigida, respectively in the areas of TRES and ALG1stations (Sfriso and Sfriso, 2017). These two stations are located close to each other (in absolute terms the two closest stations sampled in this study), but placed on the two sides of the bridge connecting the historical town to the mainland, and characterized by different wind exposures and hence turbidities. Beside differences in biomass density, phenology and degradability, macroalgae coverages can have contrasting impacts on the intensity of diagenesis in terms of reinforcing sediment cohesion and preventing resuspension, in combination with the microphytobenthos community (Yallop et al., 2000; Facca et al., 2002). In terms of physical processes, wind induced resuspension is likely to be more active at station ALG2, as the other stations are partly protected by the bridge (ALG1, and to a lower extent TRES), an island (VIG) or the city of Venice (GIU). This observation is based on a general consideration about the fetch exposure to the two main winds, Bora and Scirocco, and the related bottom shear stress. However, although Scirocco provides the most frequent meteorological forcing, Bora wind blows at speed of 30–40 m/s and is considered to be the geomorphically dominant meteorological condition (Carniello et al., 2009). One relevant mechanism could therefore be related to the resuspension and deposition of organic matter of allochthonous origin during Bora events, in an exchange pattern that could occur between ALG2 and ALG1, which according to the simulations performed by Carniello et al. (2009) belong respectively to areas of erosion and deposition. Anthropogenic drivers also exert an influence in the erosion-sedimentation patterns – e.g., ALG2 is located in proximity of a Manila clam farming area, were dredging could periodically perturb the deposition pattern, while in ALG1, ALG2, and TRES boat traffic and ship wakes can contribute to sediment resuspension and deposition (e.g., Scarpa et al., 2019; Braga et al., 2020).
Overall, it seems reasonable to relate the higher intensity in diagenesis observed in ALG1 and TRES to differences in macroalgal coverage (primary production; sediment cohesion) and fetch exposure. Nonetheless, it seems difficult to delineate the role and interplay among all the natural and anthropogenic drivers controlling organic matter accumulation without performing dedicated in situ measurements, and/or applying models capable of representing lateral transport of suspended particles in different areas of the lagoon (e.g., Ferrarin et al., 2008).
Hypoxia in Venice Lagoon and Potential for Sulfide Release
The analysis of time series indicates that the lagoon waters experience low oxygen concentrations in summer months, with median values of weekly average DO saturation below 50% (Figure 7). In conditions of limited mixing, the sediment oxygen demand may contribute to deplete DO in the water column and achieve hypoxia. As an example, considering an oxygen stock at saturation of 220 mmol m–2 in 1 m water column (T = 25°C and S = 30 ppt), the theoretical time required for achieving hypoxia would range between 5 and 18 days (DOU respectively of 28.5 mmol m–2 day–1, ALG1-avg, and 8.8 mmol m–2 day–1, GIU-avg). This basic estimation does not consider oxygen renewal associated to primary production, exchange with the atmosphere and advection, but is a conservative estimate of sediment oxygen consumption by accounting for DOU values only, which represent a fraction only of the total oxygen uptake (Glud, 2008). Interestingly, Figure 8, shows that hypoxic events in Venice lagoons last 5–15 days, which is consistent with the time scale of oxygen consumption by sediment diagenesis calculated above. Similar timescales for oxygen depletion have been observed in the Gulf of Mexico (GOM), one of the most documented hypoxic environment in the coastal ocean. Although located in a different coastal setting (open shelf, deeper waters), long term monitoring of DO in bottom water showed that, after mixing events and bottom water oxygen reset, in situ oxygen consumption can lead to hypoxia within a few days (Rabalais and Turner, 2019).
The time series analysis showed that in seven events, the number of consecutive hypoxic days exceeded 1 week, twice at VE02 and VE06, and three times at VE05. The fact that stations located in different water bodies experienced prolonged hypoxia supports the hypothesis that the onset of hypoxic conditions is governed by a combined effect of the degradation of planktonic, macroalgae, and microphytobenthos debris (Facca et al., 2002; Sfriso and Facca, 2007), which may occur in surface sediment, and the intensity of water mixing, due to the short term variability of wind conditions (Carniello et al., 2011).
A second aspect of relevance concerns the consequences of hypoxia on water bodies through the release of sulfide. In shallow marine water environments, it represents a major threat for living biota (Vaquer-Sunyer and Duarte, 2010). Release of sulfide is linked to (i) the intensity of diagenesis which increases sulfate-reduction and sulfide production (Cathalot et al., 2012), (ii) the buffer potential of iron as it combines with sulfide to precipitate as FeS and FeS2 in coastal sediments (Beckler et al., 2016; Rassmann et al., 2020), (iii) the oxygen concentration in the water column (Roden and Tuttle, 1992) as oxygen fuels the re-oxidation loop of H2S directly or through the iron buffer. In organic rich sediments, such as the Thau lagoon in oyster farms, sulfide production exceeds the buffer iron potential and sulfides are diffuses very close to the SWI (Metzger et al., 2007). H2S benthic flux also dramatically increases oxygen depletion in the water column during hypoxic phases as H2S is a strong oxygen sink with 2 moles of O2 consumed by 1 mole of H2S, therefore contributing to the spread of oxygen depletion in the stratified water column (Roden and Tuttle, 1992).
Our findings show that sulfate reduction is intense at stations ALG1 and TRES, with TS concentrations higher than 0.5 mM at 10–13 cm. Sulfide profiles shows that the concentration rapidly increases with depth (e.g., station TRES in Figure 4). Therefore, sulfide could be released to the water column, in case of reduced oxygenation at the SWI. Larger dissolved sulfide concentrations are expected at depth around 20 cm where measurements with micro-electrode could not be carried out. Indeed, as sulfate is nearly completely depleted at station ALG1, sulfide production is likely to be larger below 20 cm depth at this station as already documented at the organic-rich station C5 in the Thau lagoon (Metzger et al., 2007). Stations ALG2, GIU, and VIG, characterized by “moderate diagenesis,” showed limited sulfate depletion and little sign of sulfide in porewaters. This is probably the consequence of lower inputs of organic matter and the non-linear interaction with iron which buffers sulfide concentration through Fe-S interactions. In order to improve the management of anoxic crisis in the Venice lagoon and its consequences on the lagoon ecosystem, it would be important to locate and study sulfide occurrence in porewaters and efflux potential. This would help forecasting the consequences of hypoxic crisis on fish and macrobenthos, and potentially remediate in extreme cases.
Conclusion
The analysis performed on a >10 years long time-series of monitoring data highlighted the repeated occurrence of low oxygen events during summer, with several consecutive days showing water column saturation values below 25% (in 7 times >1 week). In shallow aquatic systems, the composition of the water column is largely controlled by the exchanges with the sediment. As an illustration, the oxygen uptake values calculated from microelectrode profiles in this study (8.8 and 28.5 mmol m–2 day–1), indicate that sediments can have an important role in the onset/maintenance of hypoxic conditions of the water column with a theoretical “consumption time” of water column oxygen ranging from 5 to 18 days. Stations investigated during this study presented different characteristics in terms of intensity of early diagenesis processes, which lead to an attempt of grouping them: (i) intense diagenesis stations, ALG1, TRES, and (ii) moderate diagenesis stations, ALG2, VIG, and GIU. This was performed on the DIC and SO42– profiles, considering that the main contrast in diagenetic intensities for the sediment of the Venice lagoon, is reflected in sulfate reduction. The potential for sulfide release in these conditions is higher at stations with higher diagenetic intensities, having large concentrations of total dissolved sulfide near the SWI. This represents a potential threat to the lagoon ecosystems related to the occurrence of hypoxic events, and should be monitored as such. We also remark that the role of the sediment diagenesis in generating/maintaining hypoxia and contributing to sulfide occurrence in the water column could be enhanced by changes in regional climate conditions, such as the increase in frequency of summer heat waves. Results could constitute a basis for improving existing biogeochemical models of the lagoon (e.g., Lovato et al., 2013), by including a more accurate representation of organic matter degradation processes in sediment (Arndt et al., 2013; Paraska et al., 2014). The future development of existing biogeochemical models in this direction could enhance the capacity of simulating the evolution of the hypoxic conditions, and, therefore, of assessing the risk of hypoxic events.
Data Availability Statement
The datasets presented in this study can be found in online repositories. The names of the repository/repositories and accession number(s) can be found below: Data availability: Data for the sediment part of this article are available on the SEANOE data base as Brigolin Daniele, Rabouille Christophe, Demasy Clément, Bombled Bruno, Pastres Roberto, Brethous Laurie, Monvoisin Gaël (2020). Early diagenesis in sediments of a Mediterranean lagoon (Venice lagoon, Italy) and its relationship to hypoxia. SEANOE. https://doi.org/10.17882/72890. Data for water monitoring are available upon request to Ministero delle Infrastrutture e dei Trasporti – provveditorato generale alle OO PP del Veneto, Trentino Alto Adige, Friuli Venezia Giulia, già Magistrato alle QWNxdWVkaVZlbmV6aWEub29wcC50cml2ZW5ldG8tdWZmMUBwZWMubWl0Lmdvdi5pdA==.
Author Contributions
DB, CR, BB, and RP conceptualized the study. DB, CR, CD, BB, and GM performed the field work and laboratory analysis. DB and CR wrote the manuscript. RP, DB, and CR provided funding to the study. All authors contributed to the article and approved the submitted version.
Conflict of Interest
The authors declare that the research was conducted in the absence of any commercial or financial relationships that could be construed as a potential conflict of interest.
Funding
DB, CR, and BB mobilities were supported by a grant from the Department of Environmental Science, Informatics and Statistics of the University of Venice Ca’ Foscari (IRIDE-DHAMACO project).
Acknowledgments
Water quality data were kindly provided by Ministero delle Infrastrutture e dei Trasporti – provveditorato generale alle OO PP del Veneto, Trentino Alto Adige, Friuli Venezia Giulia, già Magistrato alle Acque di Venezia. We acknowledge the logistic support of Università Ca’ Foscari for the sampling activities carried out in the Venice lagoon in 2015, 2016, and 2017, and Prof. F. Pranovi for providing access to his laboratory and to the boat. We also thank L. Brethous for her help during field work and laboratory analysis in 2017, and E.M.D. Porporato for the help with the processing of geospatial data in QGIS.
References
Arndt, S., Jørgensen, B. B., Larowe, D. E., Middelburg, J. J., Pancost, R. D., and Regnier, P. (2013). Quantifying the degradation of organic matter in marine sediments: a review and synthesis. Earth Sci. Rev. 123, 53–86. doi: 10.1016/j.earscirev.2013.02.008
Autorità di bacino dell’Adige e dell’Alto Adriatico (2010). Piano di Gestione dei Bacini Idrografici Delle Alpi Orientali. Subunità Idrografica Bacino Scolante, Laguna di Venezia e Mare Antistante. Available online at: http://www.alpiorientali.it/documenti/list_doc/pub/PdP_doc/04_PG_laguna_di_Venezia_2010_02_24.pdf
Azzoni, R., Nizzoli, D., Bartoli, M., Christian, R. R., and Viaroli, P. (2015). Factors controlling benthic biogeochemistry in urbanized coastal systems: an example from venice (Italy). Estuar. Coasts 38, 1016–1031. doi: 10.1007/s12237-014-9882-6
Beckler, J. S., Kiriazis, N., Rabouille, C., Stewart, F. J., and Taillefert, M. (2016). Importance of microbial iron reduction in deep sediments of river-dominated continental-margins. Mar. Chem. 178, 22–34. doi: 10.1016/j.marchem.2015.12.003
Berg, P., Risgaard-Petersen, N., and Rysgaard, S. (1998). Interpretation of measured concentration profiles in sediment pore water. Limnol. Oceanogr. 43, 1500–1510. doi: 10.4319/lo.1998.43.7.1500
Braga, F., Scarpa, G. M., Brando, V. E., Manfè, G., and Zaggia, L. (2020). COVID-19 lockdown measures reveal human impact on water transparency in the Venice Lagoon. Sci. Total Environ. 736:139612. doi: 10.1016/j.scitotenv.2020.139612
Breitburg, D., Levin, L. A., Oschlies, A., Grégoire, M., Chavez, F. P., Conley, D. J., et al. (2018). Declining oxygen in the global ocean and coastal waters. Science 359:eaam7240.
Broecker, W. S., and Peng, T.-H. (1974). Gas exchange rates between air and sea. Tellus 26, 21–35. doi: 10.1111/j.2153-3490.1974.tb01948.x
Burdige, D. J. (2006). Geochemistry of Marine Sediments. Princeton, NJ: Princeton University Press 609.
Carniello, L., D’Alpaos, A., and Defina, A. (2011). Modeling wind waves and tidal flows in shallow micro-tidal basins Estuarine. Coast. Shelf Sci. 92, 263–276. doi: 10.1016/j.ecss.2011.01.001
Carniello, L., Defina, A., and D’Alpaos, L. (2009). Morphological evolution of the Venice lagoon: Evidence from the past and trend for the future. J. Geophys. Res. 114:F04002. doi: 10.1029/2008JF001157
Cathalot, C., Lansard, B., Hall, P. O. J., Tengberg, A., Almroth-Rosell, E., Apler, A., et al. (2012). Spatial and temporal variability of benthic respiration in a scottish sea loch impacted by fish farming: a combination of in situ techniques. Aquat. Geochem. 18, 515–541. doi: 10.1007/s10498-012-9181-4
Cathalot, C., Rabouille, C., Pastor, L., Deflandre, B., Viollier, E., Buscail, R., et al. (2010). Temporal variability of carbon recycling in coastal sediments influenced by rivers: assessing the impact of flood inputs in the Rhone River prodelta. Biogeosciences 7, 1187–1205. doi: 10.5194/bg-7-1187-2010
Cathalot, C., Rabouille, C., Tisnerat-Laborde, N., Toussaint, F., Kerherve, P., Buscail, R., et al. (2013). The fate of river organic carbon in coastal areas: a study in the Rhone River delta using multiple isotopic (delta C-13, Delta C-14) and organic tracers. Geochim. Cosmochim. Acta 118, 33–55. doi: 10.1016/j.gca.2013.05.001
Chapelle, A., Lazure, P., and Souchu, P. (2001). Modélisation numérique des crises anoxiques (malaïgues) dans la lagune de Thau (France). Oceanol. Acta 24, S87–S97.
Chapelle, A., Menesguen, A., Deslous-Paoli, J. M., Souchu, P., Mazouni, N., Vaquer, A., et al. (2000). Modelling nitrogen, primary production and oxygen in a Mediterranean lagoon: impact of oysters farming and inputs from the watershed. Ecol. Model. 127, 161–181. doi: 10.1016/s0304-3800(99)00206-9
Clayton, T. D., and Byrne, R. H. (1993). Spectrophotometric seawater pH measurements: total hydrogen ion concentration scale calibration of m-cresol purple and at-sea results. Deep Sea Res. Part I 40, 2115–2129. doi: 10.1016/0967-0637(93)90048-8
Cucco, A., and Umgiesser, G. (2006). Modeling the Venice Lagoon residence time. Ecol. Model. 193, 34–51. doi: 10.1016/j.ecolmodel.2005.07.043
Dedieu, K., Rabouille, C., Gilbert, F., Soetaert, K., Metzger, E., Simonucci, C., et al. (2007a). Coupling of carbon, nitrogen and oxygen cycles in sediments from a Mediterranean lagoon: a seasonal perspective. Mar. Ecol. Prog. Ser. 346, 45–59. doi: 10.3354/meps07031
Dedieu, K., Rabouille, C., Thouzeau, G., Jean, F., Chauvaud, L., Clavier, J., et al. (2007b). Benthic O-2 distribution and dynamics in a Mediterranean lagoon (Thau, France): an in situ microelectrode study. Estuar. Coast. Shelf Sci. 72, 393–405. doi: 10.1016/j.ecss.2006.11.010
Diaz, R. J., and Rosenberg, R. (2008). Spreading dead zones and consequences for marine ecosystems. Science 321, 926–929. doi: 10.1126/science.1156401
Dickson, A. G., Sabine, C. L., and Christian, J. R. (eds) (2007). Guide to Best Practices for Ocean CO2 Measurements. London: PICES Special Publication.
European Community (2000). Directive 2000/60/EC of the European Parliament and of the Council of 23 October 2000 Establishing a Framework for Community Action in the Field of Water Policy. Brussels: European Community.
Facca, C., Sfriso, A., and Socal, G. (2002). Changes in abundance and composition of phytoplankton and microphytobenthos due to increased sediment fluxes in the Venice lagoon, Italy. Estuar. Coast. Shelf Sci. 54, 773–792. doi: 10.1006/ecss.2001.0848
Ferrarin, C., Umgiesser, G., Cucco, A., Hsu, T.-W., Roland, A., and Amos, C. L. (2008). Development and validation of a finite element morphological model for shallow water basins. Coast. Eng. 55, 716–731. doi: 10.1016/j.coastaleng.2008.02.016
Friedrich, J., Janssen, F., Aleynik, D., Wehrli, B., and Wenzhöfer, F. (2014). Investigating hypoxia in aquatic environments: diverse approaches to addressing a complex phenomenon. Biogeosciences 11, 1215–1259. doi: 10.5194/bg-11-1215-2014
Galli, G., Solidoro, C., and Lovato, T. (2017). Marine heat waves hazard 3D maps and the risk for low motility organisms in a warming mediterranean sea. Front. Mar. Sci. 4:136. doi: 10.3389/fmars.2017.00136
Gieskes, J. M., Han, S., Rathburn, A., Rothwell, G., Pérez, M. E., Porrachia, M., et al. (2015). Anthropogenic contaminants in Venice lagoon sediments and their pore fluids: results from the SIOSED project. Mar. Chem. 174, 73–84. doi: 10.1016/j.marchem.2015.05.008
Glud, R. N. (2008). Oxygen dynamics of marine sediments. Mar. Biol. Res. 4, 243–289. doi: 10.1080/17451000801888726
Grasshof, K., Ehrhardt, M., and Kremling, K. (1983). Methods of Seawater Analysis, 2nd Edn, Weinheim: Verlag Chemie GmbH.
Gu, J., Salem, A., and Chen, Z. (2013). Lagoons of the Nile delta, Egypt, heavy metal sink: with a special reference to the Yangtze estuary of China. Estuar. Coast. Shelf Sci. 117, 282–292. doi: 10.1016/j.ecss.2012.06.012
Jankowski, T., Livingstone, D. M., Bührer, H., Forster, R., and Niederhauser, P. (2006). Consequences of the 2003 European heat wave for lake temperature profiles, thermal stability, and hypolimnetic oxygen depletion: implications for a warmer world. Limnol. Oceanogr. 51, 815–819. doi: 10.4319/lo.2006.51.2.0815
Jeroschewski, P., Steuckart, C., and Kuhl, M. (1996). An amperometric microsensor for the determination of H2S in aquatic environments. Anal. Chem. 68, 4351–4357. doi: 10.1021/ac960091b
Kennish, M. J., and Paerl, H. W. (eds) (2010). Coastal Lagoons: Critical Habitats of Environmental Change. Boca Raton, FL: CRC press.
Lewis, E., and Wallace, D. W. R. (1998). Program Developed for CO2 System Calculations, ORNL/CDIAC-105. Oak Ridge, TE: Carbon Dioxide Information Analysis Center, Oak Ridge National Laboratory.
Lovato, T., Ciavatta, S., Brigolin, D., Rubino, A., and Pastres, R. (2013). Modelling dissolved oxygen and benthic algae dynamics in a coastal ecosystem by exploiting real-time monitoring data. Estuar. Coast. Shelf Sci. 119, 17–30. doi: 10.1016/j.ecss.2012.12.025
Lucchini, F., Frignani, M., Sammartino, I., Dinelli, E., and Bellucci, L. G. (2002). Composition of Venice lagoon sediments: distributions, sources, settings and recent evolution. GeoActa 1, 1–14.
MerMex Group (2011). Marine ecosystems’ responses to climatic and anthropogenic forcings in the Mediterranean. Prog. Oceanogr. 91, 97–166.
Metzger, E., Simonucci, C., Viollier, E., Sarazin, G., Prevot, F., and Jezequel, D. (2007). Benthic response to shellfish farming in Thau lagoon: porewater signature. Estuar. Coast. Shelf Sci. 72, 406–419. doi: 10.1016/j.ecss.2006.11.011
Middelburg, J. J., and Levin, L. A. (2009). Coastal hypoxia and sediment biogeochemistry. Biogeoscience 6, 1273–1293. doi: 10.5194/bg-6-1273-2009
Millennium Ecosystem Assessment (2005). Ecosystems and Human Well-being: Synthesis. Washington, DC: Island Press.
Paraska, D. W., Hipsey, M. R., and Salmon, S. U. (2014). Sediment diagenesis models: review of approaches, challenges and opportunities. Environ. Modell. Softw. 61, 297–325. doi: 10.1016/j.envsoft.2014.05.011
Pastres, R., Solidoro, C., Ciavatta, S., Petrizzo, A., and Cossarini, G. (2004). Long-term changes of inorganic nutrients in the Lagoon of Venice (Italy). J. Mar. Syst. 51, 179–189. doi: 10.1016/j.jmarsys.2004.05.011
Pessa, G., Fischetti, D., and Saggese, A. (2018). Piano d’uso delle aree in Concessione per Venericoltura (Management Plan for Shellfish Farming, in Italian). Available online at: http://amministrazionetrasparente.gral.venezia.it (accessed September 10, 2020).
Rabalais, N. N., and Turner, R. E. (2019). Gulf of Mexico Hypoxia: past, present, and future. Limnol. Oceanogr. Bull. 28, 117–124. doi: 10.1002/lob.10351
Rabalais, N. N., Turner, R. E., and Wiseman, W. J. (2002). Gulf of Mexico hypoxia, a.k.a. “the dead zone”. Annu. Rev. Ecol. Syst. 33, 235–263. doi: 10.1146/annurev.ecolsys.33.010802.150513
Rabouille, C., Denis, L., Dedieu, K., Stora, G., Lansard, B., and Grenz, C. (2003). Oxygen demand in coastal marine sediments: comparing in situ microelectrodes and laboratory core incubations. J. Exper. Mar. Biol. Ecol. 285, 49–69. doi: 10.1016/s0022-0981(02)00519-1
Ramsar Convention (1971). Convention on Wetlands of International Importance, Especially as Waterfowl Habitat. Ramsar: United Nations Educational, Scientific and Cultural Organization (UNESCO).
Rassmann, J., Eitel, E., Cathalot, C., Brandily, C., Lansard, B., Taillefert, M., et al. (2020). Benthic alkalinity and DIC fluxes in the Rhône River prodelta generated by decoupled aerobic and anaerobic processes. Biogeosciences 17, 13–33. doi: 10.5194/bg-17-13-2020
Rassmann, J., Lansard, B., Pozzato, L., and Rabouille, C. (2016). Carbonate chemistry in sediment pore waters of the Rhône River delta driven by early diagenesis (NW Mediterranean). Biogeoscience 13, 5379–5394. doi: 10.5194/bg-13-5379-2016
Roden, E. E., and Tuttle, J. H. (1992). Sulfide release from estuarine sediments underlying anoxic bottom water. Limnol. Oceanogr. 37, 725–738. doi: 10.4319/lo.1992.37.4.0725
Rova, S., Müller, F., Meire, P., and Pranovi, F. (2019). Sustainability perspectives and spatial patterns of multiple ecosystem services in the Venice lagoon: possible roles in the implementation of the EU water framework directive. Ecol. Indic. 98, 556–567. doi: 10.1016/j.ecolind.2018.11.045
Rova, S., Pranovi, F., and Müller, F. (2015). Provision of ecosystem services in the lagoon of Venice (Italy): an initial spatial assessment. Ecohydrol. Hydrobiol. 15, 13–25. doi: 10.1016/j.ecohyd.2014.12.001
Scarpa, G. M., Zaggia, L., Manfè, G., Lorenzetti, G., Parnell, K., Soomere, T., et al. (2019). The effects of ship wakes in the Venice Lagoon and implications for the sustainability of shipping in coastal waters. Sci. Rep. 9:19014.
Schlesinger, W. H., and Bernhardt, E. S. (2013). Biogeochemistry: An Analysis of Global Change, 3rd Edn, Amsterdam: Elsevier.
Schnetger, B., and Lehners, C. (2014). Determination of nitrate plus nitrite in small volume marine water samples using vanadium(III)chloride as a reduction agent. Mar. Chem. 160, 91–98. doi: 10.1016/j.marchem.2014.01.010
Seeberg-Elverfeldt, J., Schlüter, M., Feseker, T., and Kölling, M. (2005). Rhizon sampling of porewaters near the sediment-water interface of aquatic systems. Limnol. Oceanogr. Methods 3, 361–371. doi: 10.4319/lom.2005.3.361
Sfriso, A., Buosi, A., Mistri, M., Munari, C., Franzoi, P., and Sfriso, A. A. (2019). Long-term changes of the trophic status in transitional ecosystems of the northern Adriatic Sea, key parameters and future expectations: the lagoon of Venice as a study case. Nat. Conserv. 34, 193–215. doi: 10.3897/natureconservation.34.30473
Sfriso, A., Favaretto, M., Ceoldo, S., Facca, C., and Marcomini, A. (2005). Organic carbon changes in the surface sediments of the Venice lagoon. Environ. Int. 31, 1002–1010. doi: 10.1016/j.envint.2005.05.010
Sfriso, A., and Facca, C. (2007). Distribution and production of macrophytes and phytoplankton in the lagoon of Venice: comparison of actual and past situation. Hydrobiologia 577, 71–85. doi: 10.1007/s10750-006-0418-3
Sfriso, A. A., and Sfriso, A. (2017). In situ biomass production of Gracilariaceae and Ulva rigida: the Venice Lagoon as a study case. Bot. Mar. 60, 271–284.
Solidoro, C., Bandelj, V., Bernardi, F. A., Tagliapietra, D., and Torricelli, P. (2010). “Response of the Venice Lagoon ecosystem to natural and anthropogenic pressures over the last 50 years,” in Coastal Lagoons: Critical Habitats of Environmental Change, eds J. K. Michael and H. W. Paerl (Boca Raton, FL: CRC Press), 483–511. doi: 10.1201/ebk1420088304-c19
Stookey, L. L. (1970). Ferrozine-A new spectrophotometric reagent for iron. Anal. Chem. 42, 779–781. doi: 10.1021/ac60289a016
Umgiesser, G. (2020). The impact of operating the mobile barriers in Venice (MOSE) under climate change. J. Nat. Conserv. 54:125783. doi: 10.1016/j.jnc.2019.125783
van Cappellen, P., and Wang, Y. F. (1996). Cycling of iron and manganese in surface sediments: a general theory for the coupled transport and reaction of carbon, oxygen, nitrogen, sulfur, iron, and manganese. Am. J. Sci. 296, 197–243. doi: 10.2475/ajs.296.3.197
Vaquer-Sunyer, R., and Duarte, C. M. (2008). Thresholds of hypoxia for marine biodiversity. Proc. Natl. Acad. Sci. U.S.A. 105, 15452–15457. doi: 10.1073/pnas.0803833105
Vaquer-Sunyer, R., and Duarte, C. M. (2010). Sulfide exposure accelerates hypoxia-driven mortality. Limnol. Oceanogr. 55, 1075–1082. doi: 10.4319/lo.2010.55.3.1075
Yallop, M. L., Paterson, D. M., and Wellsbury, P. (2000). Interrelationships between rates of microbial production, exopolymer production, microbial biomass, and sediment stability in biofilms of intertidal sediments. Microb. Ecol. 39, 116–127. doi: 10.1007/s002489900186
Zaggia, L., Rosso, J., and Zonta, R. (2007). Sulphate reduction in the sediment of the Venice canals (Italy). Mar. Pollut. Bull. 55, 415–424. doi: 10.1016/j.marpolbul.2007.09.004
Zhang, J., Gilbert, D., Gooday, A. J., Levin, L. A., Naqvi, W. A., Middelburg, J. J., et al. (2010). Natural and human-induced hypoxia and consequences for coastal areas: synthesis and future development. Biogeoscience 7, 1443–1467. doi: 10.5194/bg-7-1443-2010
Keywords: early diagenesis, hypoxia, sulfide, shallow water, coastal urban ecosystems, Adriatic sea
Citation: Brigolin D, Rabouille C, Demasy C, Bombled B, Monvoisin G and Pastres R (2021) Early Diagenesis in Sediments of the Venice Lagoon (Italy) and Its Relationship to Hypoxia. Front. Mar. Sci. 7:575547. doi: 10.3389/fmars.2020.575547
Received: 23 June 2020; Accepted: 09 November 2020;
Published: 05 January 2021.
Edited by:
Richard Alan Feely, Pacific Marine Environmental Laboratory (NOAA), United StatesCopyright © 2021 Brigolin, Rabouille, Demasy, Bombled, Monvoisin and Pastres. This is an open-access article distributed under the terms of the Creative Commons Attribution License (CC BY). The use, distribution or reproduction in other forums is permitted, provided the original author(s) and the copyright owner(s) are credited and that the original publication in this journal is cited, in accordance with accepted academic practice. No use, distribution or reproduction is permitted which does not comply with these terms.
*Correspondence: Daniele Brigolin, ZGJyaWdvbGluQGl1YXYuaXQ=
†These authors have contributed equally to this work