 Laura Weber1,2*†
 Maickel Armenteros3,4†
 Melissa Kido Soule1
 Krista Longnecker1
 Elizabeth B. Kujawinski1†
 Amy Apprill1*†
- 1Department of Marine Chemistry and Geochemistry, Woods Hole Oceanographic Institution, Woods Hole, MA, United States
- 2Massachusetts Institute of Technology-Woods Hole Oceanographic Institution Joint Program in Oceanography/Applied Ocean Science and Engineering, Biological Oceanography, Cambridge, MA, United States
- 3Centro de Investigaciones Marinas, Universidad de La Habana, La Habana, Cuba
- 4Instituto de Ciencias del Mar y Limnología, Universidad Nacional Autónoma de México, Ciudad de México, Mexico
Coral reef ecosystems are incredibly diverse marine biomes that rely on nutrient cycling by microorganisms to sustain high productivity in generally oligotrophic regions of the ocean. Understanding the composition of extracellular reef metabolites in seawater, the small organic molecules that serve as the currency for microorganisms, may provide insight into benthic-pelagic coupling as well as the complexity of nutrient cycling in coral reef ecosystems. Jardines de la Reina (JR), Cuba is an ideal environment to examine extracellular metabolites across protected and high-quality reefs. Here, we used liquid chromatography mass spectrometry (LC-MS) to quantify specific known metabolites of interest (targeted metabolomics approach) and to survey trends in metabolite feature composition (untargeted metabolomics approach) from surface and reef depth (6 – 14 m) seawater overlying nine forereef sites in JR. We found that untargeted metabolite feature composition was surprisingly similar between reef depth and surface seawater, corresponding with other biogeochemical and physicochemical measurements and suggesting that environmental conditions were largely homogenous across forereefs within JR. Additionally, we quantified 32 of 53 detected metabolites using the targeted approach, including amino acids, nucleosides, vitamins, and other metabolic intermediates. Two of the quantified metabolites, riboflavin and xanthosine, displayed interesting trends by depth. Riboflavin concentrations were higher in reef depth compared to surface seawater, suggesting that riboflavin may be produced by reef organisms at depth and degraded in the surface through photochemical oxidation. Xanthosine concentrations were significantly higher in surface reef seawater. 5′-methylthioadenosine (MTA) concentrations increased significantly within the central region of the archipelago, displaying biogeographic patterns that warrant further investigation. Here we lay the groundwork for future investigations of variations in metabolite composition across reefs, sources and sinks of reef metabolites, and changes in metabolites over environmental, temporal, and reef health gradients.
Introduction
Coral reefs are productive and regenerative ecosystems that generally exist in oligotrophic waters. Rapid nutrient recycling by planktonic microorganisms and benthic productivity by corals, algae, sponges, and their symbionts sustain an incredible biomass and diversity of vertebrates and invertebrates on reefs (Hatcher, 1988; Atkinson, 2011). At depth, reef organisms, like corals, macroalgae, and sponges, release dissolved and particulate organic matter (DOM and POM, respectively) into the surrounding seawater (Wild et al., 2004; Tanaka et al., 2009; Haas et al., 2011; De Goeij et al., 2013). Microorganisms living within the seawater degrade this benthic-derived OM and recycle limiting nutrients like nitrogen and phosphorous back into the dissolved phase, making these nutrients available for primary producers like eukaryotic phytoplankton and picoplanktonic cyanobacteria (Azam and Malfatti, 2007). Furthermore, bulk exudates from reef organisms impact seawater microbial community composition and function (Haas et al., 2011, 2013; Nelson et al., 2013). Reef composition also influences microbial community structure and function at the level of the ecosystem (Kelly et al., 2014; Haas et al., 2016).
Metabolites, or compounds produced by metabolic reactions, serve as the chemical currency for life and are transferred among microbes as growth substrates as well as for communication and chemical defense (Kujawinski, 2011). Metabolites are also secreted and released into the environment from eukaryotic organisms and their activities (e.g., waste excretion, viral lysis, feeding activities). The study of metabolites can reveal the intracellular metabolic responses of cells to different conditions and extracellular interactions between cells, or macro-microorganismal extracellular interactions at the scale of the environment. In the context of coral reef ecology, understanding the flux of extracellular metabolites, regardless of source, through the intricate microbial loop may help tease apart the importance of benthic-pelagic coupling on reefs as well as reveal essential yet cryptic chemical transactions between reef macroorganisms and surrounding seawater microorganisms. While bulk approaches for measuring the flux of carbon, nitrogen, and phosphorous through coral reefs have provided fundamental information about nutrient cycling and ecosystem metabolism (Atkinson, 2011), such studies do not provide a molecular-level understanding of the extracellular, environmental metabolite landscape nor information about the minutiae and intricacies of chemical transactions across the water column. Research approaches that combine bulk chemical measurements with analyses of environmental metabolites made possible by recent methodological advances provide insight into the complexity and diversity of molecules across coral reefs and permit scientists to link dynamics of individual metabolites to larger-scale organic matter cycling.
Metabolomics studies are usually divided into two complementary analytical strategies, each with their own trade-offs. The targeted strategy identifies and quantifies environmental concentrations of known metabolites whereas the untargeted strategy provides semi-quantitative information about all the observable metabolic features (a unique combination of a mass-to-charge ratio and retention time) within a sample (Kido Soule et al., 2015). When the identities of specific metabolites are known and concentrations need to be monitored throughout the course of an investigation, the targeted approach is most suitable. In contrast, the untargeted method can be used to investigate multivariate patterns across a dataset and for putative metabolite discovery, but is only semi-quantitative and metabolite identifications require follow-up analyses (Kido Soule et al., 2015; Schrimpe-Rutledge et al., 2016). Metabolomic investigations may use a combination of these methods in order to comprehensively query the questions of interest.
Identification and quantification of coral-associated intracellular metabolites have recently been performed to resolve the response of corals to stressors like bleaching and ocean acidification (Sogin et al., 2016) and competitive interactions with other coral species, fungal mats, and different types of macroalgae (Quinn et al., 2016). Coral tissue intracellular metabolomes are also correlated with coral microbiomes and their dinoflagellate symbionts and are specific to coral species (Sogin et al., 2017; Vohsen et al., 2019), implying an intricate connection between the coral microbiome and coral nutrition and metabolism.
In contrast, the composition of dissolved extracellular metabolites in reef seawater has not been as widely investigated and is an emerging area of research for coral reef microbial ecologists (Wegley Kelly et al., 2018). A study of extracellular metabolites in sponge inhalant and exhalant seawater compared to off reef seawater found that the sponge exhalant had a higher diversity of untargeted metabolite features as well as higher concentrations of nucleosides (Fiore et al., 2017). In another study, extracellular metabolites extracted from seawater sampled along a gradient (0 to 5 cm away from the coral surface) surrounding two different coral species in the Arabian Gulf demonstrated differences in elemental composition across the gradient and putatively identified infochemicals involved in quorum sensing and chemical defense (Ochsenkühn et al., 2018). Despite the contributions of these studies, baseline information regarding the metabolite landscape across reefs, especially healthier reefs, and how the metabolite composition changes along various spatial or environmental gradients is limited. Primary questions remain such as: what are the extracellular metabolites that can be identified in reef seawater and what are their environmental concentrations? Are there spatial or biogeographical patterns in the distribution of specific metabolites across the water column and different reefs within the same reef system?
To obtain this baseline understanding of dissolved metabolite composition in coral reef seawater, we surveyed the benthic substrate composition and collected seawater from surface and reef depths across nine shallow forereefs within the protected Cuban reef system of Jardines de la Reina (JR). JR is a reef system that is relatively sheltered from anthropogenic activity due to distance from shore and government protection and enforcement of no-take fishing regulations. Paired surface and reef depth seawater samples were collected from each reef in order to investigate depth-related changes in metabolite composition that were potentially driven by proximity to benthic organisms or photochemical degradation. Furthermore, to explore potential benthic-pelagic coupling between the reef and seawater metabolites, the benthic composition of each reef was surveyed and compared to the seawater metabolite composition. The metabolites in reef seawater were extracted and subjected to both targeted and untargeted metabolomics using liquid chromatography mass spectrometry (LC-MS). Additionally, inorganic and organic macronutrient concentrations, chlorophyll a and phaeophytin concentrations, and picoplankton cell abundances were obtained from the seawater samples in order to relate coral reef seawater exometabolome composition to physicochemical and bulk biogeochemical measurements from the same seawater samples. These combined analytical approaches allowed us to provide an in-depth evaluation and comparison of the biogeochemistry and metabolic composition of seawater across reefs within JR.
Materials and Methods
Coral Surveys and Sample Collection
Reef composition and seawater microbial biogeochemistry were surveyed at nine, shallow (6 – 14 m in depth) forereef sites during a cruise to JR, Cuba in November of 2017 (Figure 1 and Supplementary Table 1). Reef surveys were conducted by scuba divers at all sites using the line-intercept survey method (Obura, 2014). The percent cover of corals, algae, sponges, rocks, and sand were recorded on each reef by divers who conducted between 10 and 20 transects (10 m in length) across the reef substrate. In addition to surveying forereefs, we also visited two surface “off reef” sites (800 – 1600 m depth) to make comparisons between reef and off reef samples.
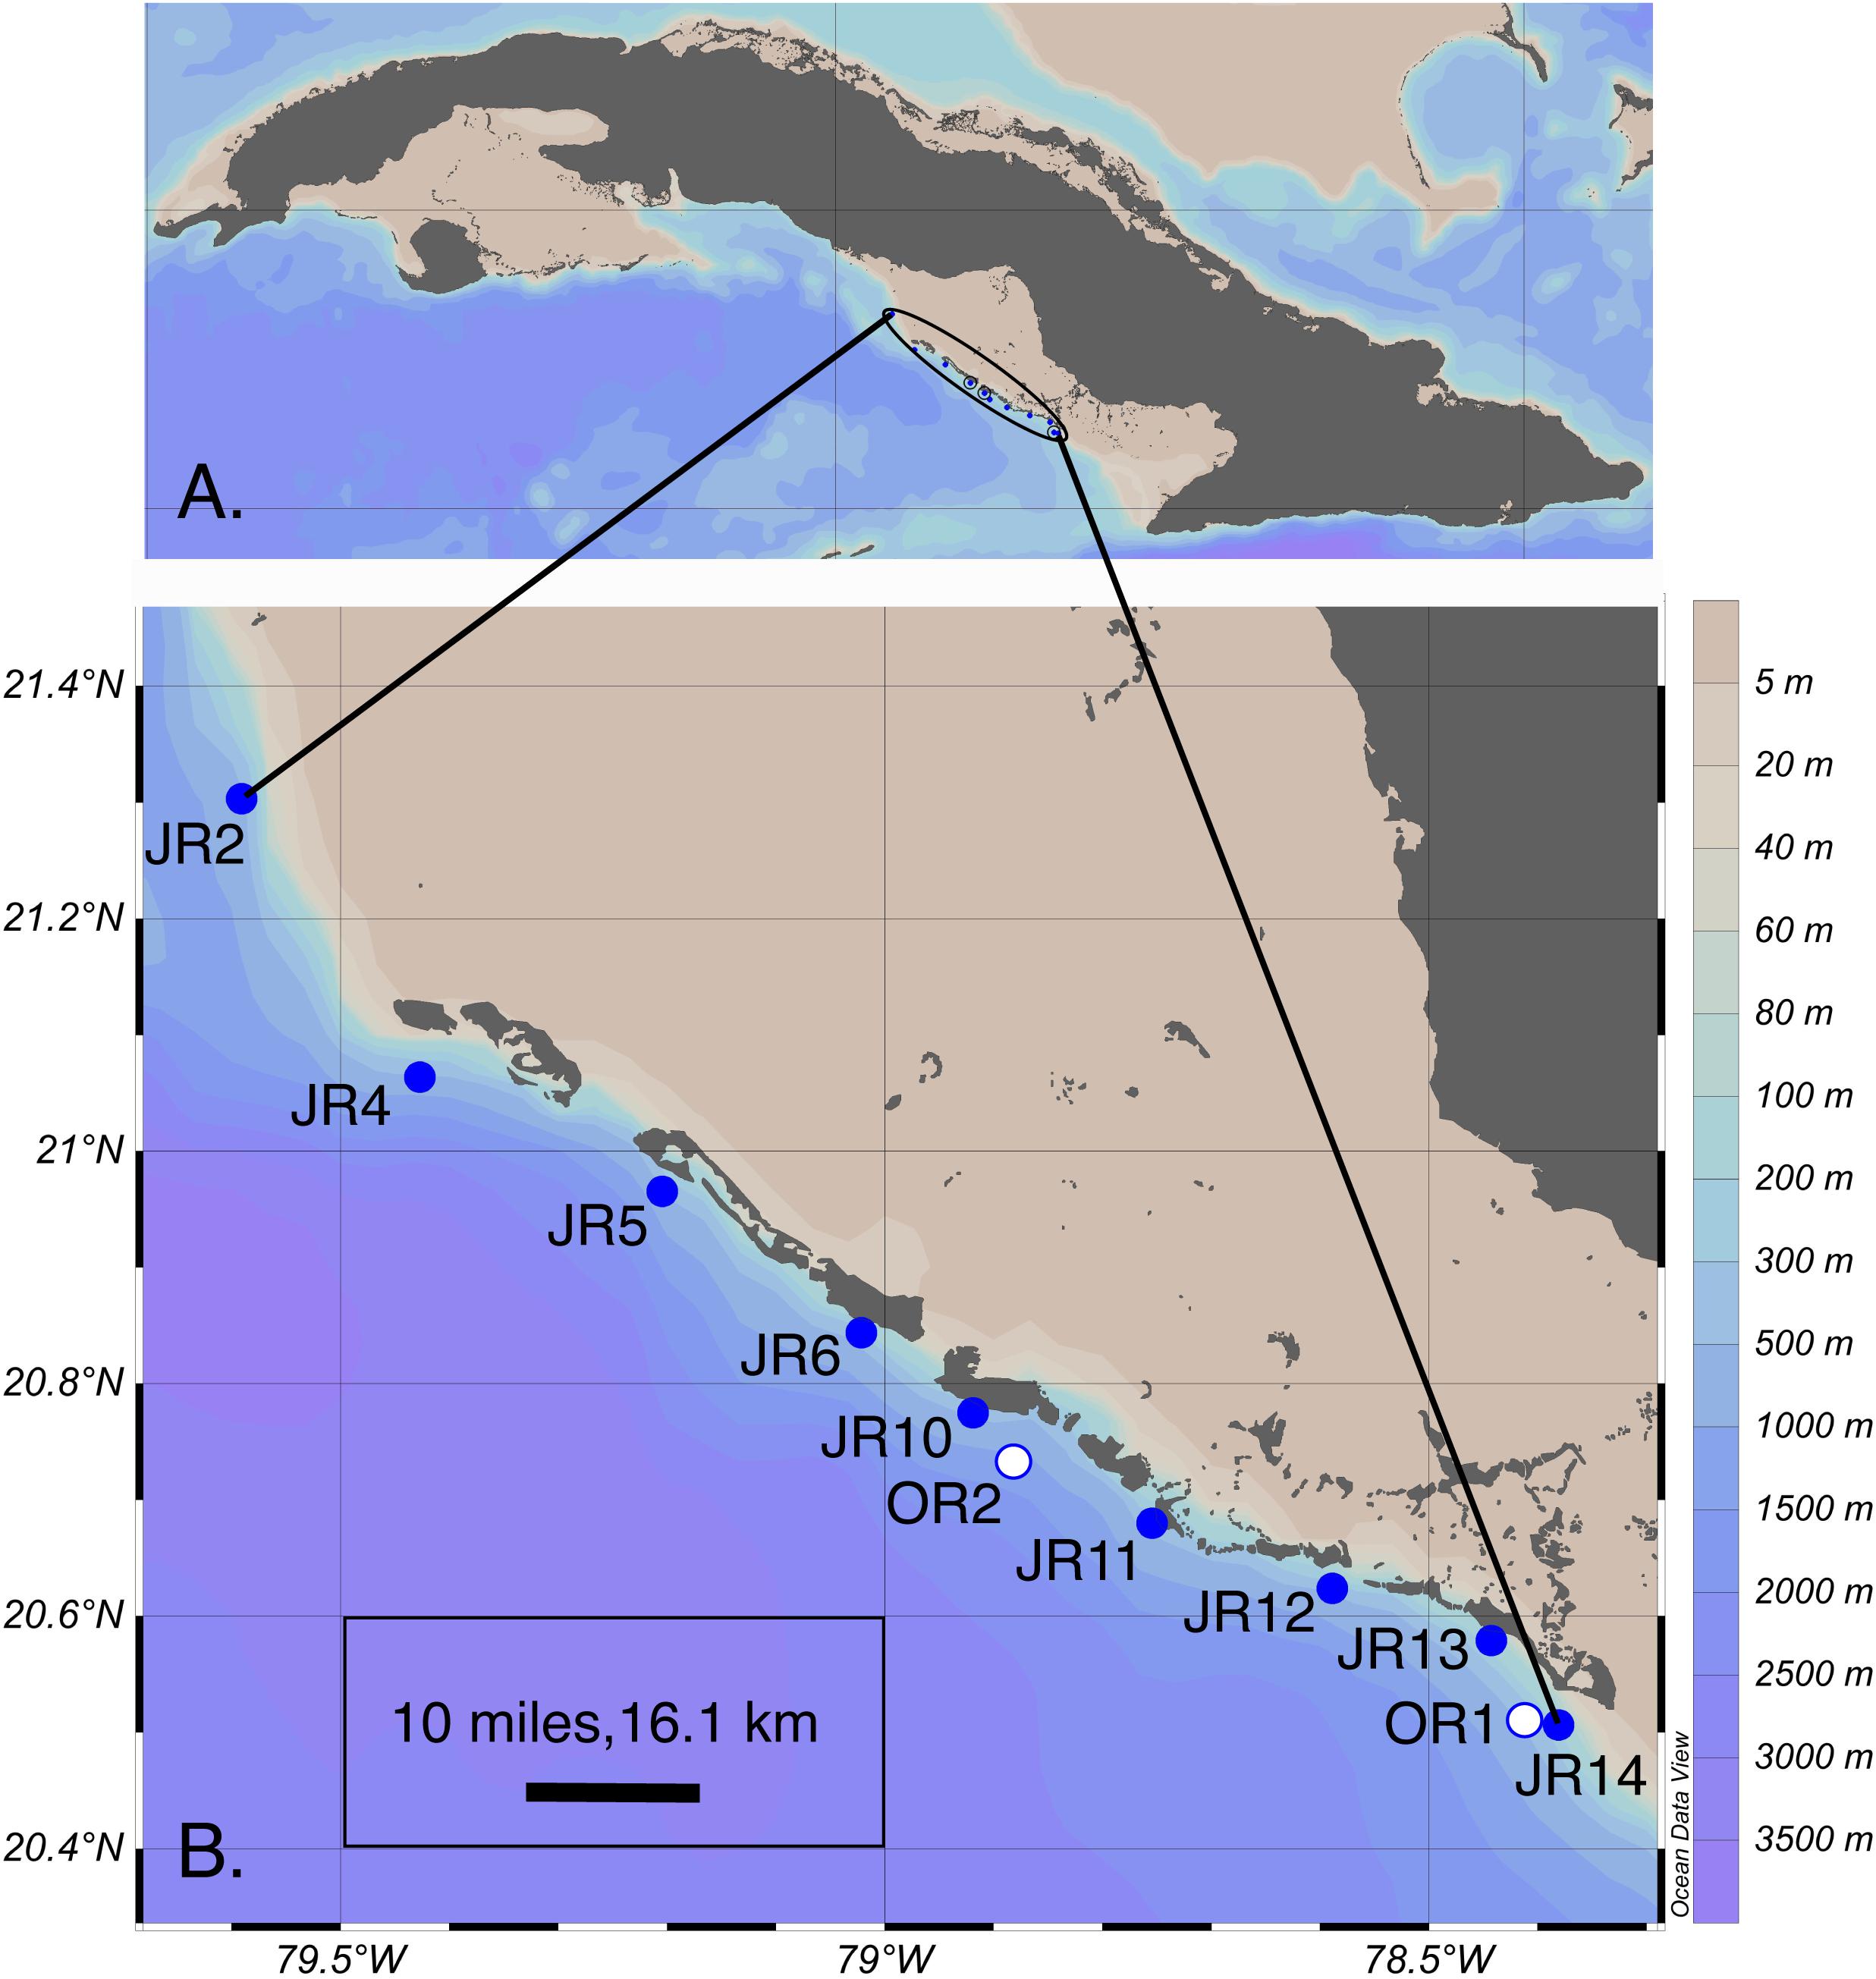
Figure 1. (A) Overview of the encircled Jardines de la Reina (JR) archipelago adjacent to Cuba. (B) Coral reef forereef (blue circles) and off reef (white circles) sites sampled for extracellular metabolites across the archipelago. Symbols represent sites and are labeled with the site name. This map graphic was originally generated using Ocean Data View (v. 4) (Schlitzer, 2018). OR = off reef.
At each reef, CTD casts were completed (YSI Exo Sonde, Xylem Inc., Yellow Springs, OH, United States) to measure the physicochemical properties (e.g., temperature, salinity, dissolved oxygen, and pH) of the water column (Supplementary Table 1). CTD casts were not completed at the off reef sites. Surface (1 m) and reef depth (1 m above reef; 5 – 13 m depth) seawater was sampled from nine JR forereef sites and surface seawater was sampled from two off reef sites adjacent to the forereefs (Figure 1). Seawater samples collected for cell counts (1 mL) and macronutrient concentration analyses (30 mL for inorganic macronutrient and 40 mL for organic carbon and total nitrogen) were collected from surface and reef depths using a submersible groundwater pump. Additionally, samples collected for chlorophyll a and phaeophytin analysis (4 L) were obtained from off reef and reef depth seawater.
A scuba diver collected reef depth seawater in an acid-washed, Teflon-lined 8 L Niskin Bottle (General Oceanics, Miami, Florida, United States). Specifically, a diver descended with the Niskin bottle in the cocked position and left the Niskin on a barren part of the reef (i.e., sand patch) for 30 – 50 min while reef surveys were completed. At the end of each dive, the diver retrieved the Niskin bottle, thoroughly rinsed the Niskin with reef depth seawater, located an area of the reef that was topographically complex (i.e., densely covered with hard and soft corals as well as sponges), and triggered the Niskin to close, capturing reef depth seawater within the Niskin chamber. Upon ascent, the Niskin was immediately placed within a cooler filled with ice. Before leaving the site, surface seawater was collected by hand from the back of the dive boat into acid-washed and autoclaved 2 L polycarbonate bottles (NalgeneTM, Thermo ScientificTM, Waltham, MA, United States). For surface reef water collections, two acid-washed and autoclaved 2 L polycarbonate bottles were triple-rinsed with surface seawater prior to water collection, samples were collected, and the bottles were filled to the brim and capped. At the two off reef sites, surface seawater was collected in duplicate using the same process. Surface samples were stored in the iced cooler until processing. Processing of seawater samples collected for metabolomics was initiated within one hour of collection. Samples were collected daily over the course of 2.5 weeks.
Sample Processing
Aboard the research vessel, surface and reef depth seawater samples collected for total organic carbon (TOC) and nitrogen (including particulate and dissolved) analyses were acidified with 75 μL of concentrated phosphoric acid, capped, and stored at room temperature. Surface and reef depth seawater samples collected for analyses of inorganic macronutrient concentrations (30 mL) were frozen after subsamples (1 mL) of unfiltered seawater were collected for quantifying picoplankton cell abundances. Seawater, collected for enumeration of Prochlorococcus, Synechococcus, picoeukaryotic cells, and unpigmented cells (heterotrophic bacteria and archaea) using flow cytometry, was fixed with paraformaldehyde (1% final volume), incubated at 4°C in the dark for 30 min, frozen at −50°C on the research vessel, and then stored at −80°C prior to analysis.
For metabolomics analyses, 4 L of reef depth seawater collected within the Niskin bottle was transferred into two acid-washed and autoclaved 2 L polycarbonate bottles using acid-washed thermoplastic elastomer (TPE) tubing (PharMedBPT MasterflexTM, Cole – Parmer, Vernon Hills, IL, United States) within an hour after collection. These aliquots of reef depth seawater from the same location were treated as technical duplicate samples during data analyses. Reef depth and surface seawater were filtered separately through polytetrafluoroethylene (PTFE) 0.2 μm pore size, 47 mm filters (Omnipore, EMD Millipore Corporation, Billerica, MA, United States) using peristalsis (MasterFlex L/S pump and pump heads, Cole-Parmer, Vernon Hills, IL, United States). TPE tubing and acid-washed fluorinated ethylene propylene (FEP) tubing (890 Tubing, NalgeneTM, Thermo ScientificTM, Waltham, MA, United States) were used to transfer pumped seawater through the filter membrane and into acid-washed and autoclaved polycarbonate collection bottles. Filters were encased in acid-washed and autoclaved 47 mm, perfluoroalkoxy alkane (PFA) in-line filter holders (Advantec, Cole-Parmer, Vernon Hills, Illinois, United States).
Subsamples of the filtrate were collected for analysis of dissolved organic carbon (DOC), and were acidified to a pH of ∼3 using 12 M trace-metal grade hydrochloric acid (HCl, OptimaTM, Fisher Chemical, Fisher Scientific, Hampton, NH, United States). During filtering, the flow rate was kept low to minimize the lysis of cells on the surface of the filter, but we noted an increase of approximately 5 μM in DOC concentrations in the filtrate compared to the corresponding unfiltered TOC concentrations for each sample, indicating potential contamination from handling or filters.
We performed solid phase extraction (SPE) to concentrate and extract metabolites [e.g., low molecular weight dissolved organic matter (DOM)] from the filtered seawater using a vacuum manifold (Waters Corporation, Milford, MA, United States). Prior to and after SPE, the bottles were weighed in order to calculate the volume of seawater that passed through the SPE cartridges. The acidified filtrate was then passed through acid-washed FEP tubing and 1 g/6 cc PPL cartridges (BondElut; Agilent, Santa Clara, CA, United States) that were pre-conditioned with 100% HPLC-grade methanol using gentle vacuum pressure (Kido Soule et al., 2015; Fiore et al., 2017). After filtrate passed through the cartridge, cartridges were removed from the manifold, wrapped with combusted aluminum foil, placed within sterile Whirl-PakTM bags (Nasco, Fisher Scientific, Hampton, NH, United States), and frozen at −50°C. Wrapped cartridges were shipped frozen to the Woods Hole Oceanographic Institution and then stored at −80°C until the DOM could be eluted off of the cartridges. To finish the extraction process, cartridges were rinsed with 4 bed-volumes of 0.01 M HCl, dried using gentle vacuum pressure for 5 min, and then eluted into combusted glass vials using 100% methanol (volume of eluents was 6 mL). Methanol extracts were transferred into combusted glass amber vials using combusted glass pipettes, and stored at −20°C.
To prepare the samples for LC-MS analysis, methanol extracts were dried down using a vacuum centrifuge. Dried extracts were re-suspended in 200 μl of a 95:5 (v/v) MilliQ water: acetonitrile (ACN) solution with deuterated biotin (final concentration 0.05 mg mL–1) and vortexed. The extracts were then divided into three different preparations: 100 μL was transferred into a separate analysis vial containing a combusted glass insert for targeted metabolite analysis, 50 μL was transferred into a combusted 4 mL vial to be used for a pooled sample, and 25 μL was transferred into a 4 mL vial to be diluted and prepared for the untargeted metabolite analysis. The pooled sample was a combination of aliquots from each sample and was used as a quality control measure during the instrument runs. Untargeted extracts were diluted with 600 μL of the deuterated biotin standard and water: ACN solution and vortexed. A 100 μL subsample of this diluted extract was then transferred into an analysis vial and 75 μL of the dilution was diverted into a “pooled” sample. Prepared extracts were stored at −20°C until they were run on the instruments after two weeks of storage.
Macronutrient and Chlorophyll Analyses and Quantification of Cells
Non-purgeable total organic carbon (TOC, unfiltered), dissolved organic carbon (DOC, 0.2 μm filtered), total nitrogen (TN, unfiltered), and total dissolved nitrogen (TDN, 0.2 μm filtered) concentrations were analyzed using a Shimadzu TOC-VCSH TOC analyzer (Hansell and Carlson, 2001) with a TNM-1 module. Inorganic macronutrient (phosphate, nitrite + nitrate, nitrite, ammonium, silicate) concentrations were measured with a continuous segmented flow system (as used in Apprill and Rappé, 2011). Nitrite was subtracted from the nitrite + nitrate concentrations to obtain the nitrate concentrations. Concentrations of total organic nitrogen were obtained by subtracting the sum of the inorganic nitrogen species (nitrite + nitrate and ammonium) from the total nitrogen concentrations per sample. If the measured concentrations fell beneath the detection limits of the instrument (ammonium = 0.02 μM, phosphate = 0.01 μM, nitrite + nitrate = 0.07 μM, nitrite = 0.01 μM), these measurements were removed from the analysis.
Chlorophyll a and phaeophytin were extracted from GFF filters using 90% acetone in water and the optical density (OD) values were measured on a calibrated spectrophotometer using standard optics (Lambda 18, Perkin Elmer, Waltham, MA, United States). The concentration ratios of chlorophyll a to phaeophytin were calculated and incorporated into the analyses. Enumeration of Prochlorococcus, Synechococcus, picoeukaryotes, and unpigmented cells was conducted via flow cytometry using a collinear analyses method and a UV wavelength of 488 nm on an Altra flow cytometer at the University of Hawaii. Each sample was divided so that pigmented, fluorescent cells and unpigmented cells could be run separately. Unpigmented cells were stained with Hoechst stain at a final concentration of 1 μg mL–1. Abundances of each cell type were estimated by binning populations using FlowJo (v. 6.4.7) software.
Untargeted Analysis of Metabolites
Untargeted metabolite analysis was performed using an ultra-high performance liquid chromatography system (Vanquish UHPLC, Thermo ScientificTM) coupled with an Orbitrap Fusion Lumos Tribid mass spectrometer (Thermo ScientificTM). A Waters Acquity HSS T3 column (2.1 mm × 100 mm, 1.8 μm), equipped with a Vanguard pre-column, was used for chromatographic separation at 40 °C. The column was eluted at 0.5 mL min–1 with a combination of solvents: A) 0.1% formic acid in water and B) 0.1% formic acid in ACN. The chromatographic gradient was as follows: 1% B (1 min), 15% B (1 – 3 min), 50% B (3 – 6 min), 95% B (6 – 9 min), 95% B (10 min). The column was washed and re-equilibrated with 1% B (2 min) between injections. Individual autosampler injections (5 μL each) were taken for negative ion mode analyses. The electrospray voltage was set to 2600 V for negative mode. Settings for source gases were 55 (sheath) and 20 (auxiliary) and these settings are presented in arbitrary units. The heated capillary temperature was 375°C and the vaporizer temperature was 400°C. MS data were collected in the Orbitrap analyzer with a mass resolution of 120,000 FWHM at m/z 200. The automatic gain control (AGC) target was 4e5, the maximum injection time was 50 seconds, and the scan range was 100 – 1000 m/z. All data were collected in profile mode. Samples were run in a random order and the pooled sample was run after every six samples to assess instrument performance and drift over the sample run.
Raw data files were obtained from the instrument and converted into mzML files using msConvert and then processed using XCMS (Smith et al., 2006). Peak-picking was performed using the CentWave algorithm and a Gaussian fit with the following parameters: noise = 10000, peak-width = 3 – 15, ppm = 15, prefilter = c(4, 10000), integrate = 2, mzdiff = −0.005, snthresh = 100. Retention times were then adjusted using Orbiwarp and correspondence between the peaks was conducted. The coefficient of variation across the eight untargeted pooled sample features was 0.044, demonstrating good agreement between the pooled samples, and the pooled samples were removed from further analyses. Untargeted peak intensities were normalized by dividing the peak intensities by the total sample volume as well as the DOC concentration for each sample. In the untargeted analyses, MS1 features were defined as unique combinations of mass-to-charge ratios (m/z) and retention times (RT). This analysis yielded a table of MS1 features (m/z x RT) and their peak intensities across each sample.
Targeted Analysis of Metabolites
Extracts prepared for targeted metabolomics were analyzed using UPLC (Accela Open Autosampler and Accela 1250 Pump, Thermo ScientificTM) coupled to a heated electrospray ionization source (H-ESI) and a triple stage quadrupole mass spectrometer (TSQ Vantage, Thermo Fisher ScientificTM), operated in selective reaction monitoring (SRM) mode. The same chromatography column, column conditions, gradient, and flow rates were used for both targeted and untargeted analyses. Autosampler injections of 5 μL each were made separately for positive and negative modes. Samples were analyzed in a random order and pooled samples were run between every six samples to assess instrument drift. SRM parameters were optimized for each target compound using an authentic standard as described in Kido Soule et al. (2015) and two SRM transitions (precursor – product ion pairs) were monitored for quantification and confirmation. Target metabolites included a range of environmentally relevant vitamins, amino acids, and other metabolites that have been detected in marine microorganisms, their culture media, and reef seawater (Fiore et al., 2015, 2017; Kido Soule et al., 2015). The resulting XCalibur raw files (MS/MS data) were then converted into mzML files using msConvert (Chambers et al., 2012) and processed with the open-source program MAVEN (v.774) (Melamud et al., 2010). Using MAVEN, calibration curves based on integrated peak area were generated for each compound (8 points). Environmental concentrations of metabolites were determined by dividing each concentration by the original sample collection volume. Next, metabolites that met the threshold limits of detection and quantification for the UPLC-MS/MS analysis (Kido Soule, Longnecker, Swarr, unpublished) were corrected for extraction efficiency by dividing the concentrations by extraction efficiencies that have been reported for each metabolite in seawater (Johnson et al., 2017).
Data Availability
The raw XCalibur files and mzML files for both untargeted and targeted metabolomics data are available at the MetaboLights (Haug et al., 2020) online database1 using accession number MTBLS1820. Additionally, a table of untargeted features (m/z x RT) following peak-picking and retention time correction and a table of targeted metabolite identifiers are provided through the MetaboLights online database. The data are also linked to the BCO-DMO repository2.
Statistical Analyses
Reef Composition and Environmental Analyses
The average percent cover of corals, algae, sponges, sand, and rocks as well as the associated 95% confidence intervals were calculated for each reef site. Prior to conducting ANOVA tests on the benthic data, angular transformations were employed to ensure data normality. ANOVA tests were then used to check for significant differences in the benthic cover by substrate type across reef sites. If significant differences were detected (p < 0.05), post-hoc Tukey’s honestly significant difference (HSD) tests were used to reveal significantly different pairwise comparisons by site (adjusted p-value < 0.05).
Principal components analysis (PCA) was conducted to visualize multivariate patterns in the environmental data (macronutrients and chlorophyll a concentrations, chlorophyll a to phaeophytin ratios, picoplankton cell abundances, and physicochemical measurements) across sites using the “FactoMineR” R package (Lê et al., 2008). Prior to conducting the PCA, all data were log-transformed to ensure normality. Additionally, significant differences in macronutrient and chlorophyll a concentrations, chlorophyll a: phaeophytin, and cell abundances were investigated on log-transformed data using ANOVA tests followed by Tukey’s HSD tests when appropriate.
A permutational PERMANOVA (function “adonis” in the “Vegan” R Package) (Oksanen, 2017) was used to investigate if depth (surface vs. reef depth), general reef region (central, east, and west), or biome (reef vs. off reef) significantly (p < 0.05) influenced Bray-Curtis dissimilarity across the environmental data. Reef seawater samples were categorized into off reef (OR1 and OR2), eastern (JR 2, 4, and 5), central (JR 6, 10, and 11), and western (JR 12, 13, and 14) forereef groupings to examine broader, regional patterns in nutrient concentrations, cell abundances, and metabolite concentrations across the archipelago. Lastly, to investigate if there were statistically significant differences between nutrient concentrations, cell abundances, and physicochemical measurements between surface and reef depth seawater regardless of reef location, the differences between surface and reef depth measurements were calculated for each reef. These differences were inspected for normality using quantile-quantile plots. Following inspection, one-tailed t-tests were conducted to examine if the differences were significantly different (p < 0.05) from zero.
Untargeted Metabolite Feature Analyses
Non-metric-multidimensional scaling ordination (NMDS) was performed on the Bray-Curtis dissimilarity matrix yielded from square-root transformed untargeted metabolite feature peak intensities using the function “metaMDS” from the “Vegan” R package (Oksanen, 2017). A NMDS was also performed to inspect variability in untargeted feature composition across the pooled samples (Supplementary Figure 1). Additionally, a permutational PERMANOVA was used to test the effects of three factors on the Bray-Curtis dissimilarities that were calculated from untargeted feature peak intensities across samples. The tested factors were depth (surface vs. reef depth), general reef region (central, east and west), or biome (reef vs. off reef). We used the function “indval” from the “labdsv” R package (Roberts, 2016) to perform indicator feature analysis on normalized and log-transformed untargeted feature peak intensities. This test was conducted to identify features significantly (p < 0.05, FDR corrected) indicative of either reef surface or reef depth seawater. The p-values generated from this analysis represent the probability of obtaining indicator feature scores from randomized permutations (n = 1000, default setting) that are as high as the scores from the non-randomized matrix. Prior to visualization with a heatmap, the original untargeted peak intensities of these indicator features were log-transformed and scaled using z-scoring.
Pairwise Pearson correlations were conducted to explore potential relationships between the averaged untargeted feature peak intensities by site and depth and microbial cell abundances as well as inorganic and organic macronutrient concentrations. Peak intensities were averaged across site and depth replicates because replicate measurements of environmental data were not collected. Prior to the analyses, all data were log-transformed to ensure data normality. The “Hmisc” R Package (Harrell, 2019) was then used to compute correlations and generate p-values. P-values were adjusted using the false discovery rate (FDR) and corrected p-values < 0.05 were noted as significant. Due to the high number of significant co-correlations between untargeted features, only correlations between environmental data and untargeted features were explored at Pearson’s r cut-off values of <−0.70 for negative correlations and r >0.70 for positive correlations. Additionally, a separate correlative analysis was run between untargeted metabolite features and the benthic cover of algae, corals, sponges, rocks, and sand.
Targeted Metabolite Analyses
Overall patterns in targeted metabolite concentrations were investigated and a subset of these metabolites were chosen for further analyses. Using the methods outlined above for the untargeted features, Pearson correlations were conducted between averaged, targeted metabolites that could be quantified and environmental data to assess (1) co-correlations between targeted metabolites and (2) correlations with environmental parameters. Metabolite concentrations were averaged across replicate samples because replicate measurements of the environmental parameters were not collected. Additionally, a Monte Carlo simulation was conducted on 10,000 iterations of correlations based on a matrix of randomized values across reef locations to verify that the significant correlations did not arise by chance. This simulation yielded the following results: 88% of the randomized iterations yielded no significant correlations, 10.2% of the iterations yielded 2 significant correlations, 1.6% of the iterations yielded four significant correlations, and less than <0.20% of the iterations yielded 6 and 8 significant correlations. After creating a distribution of the results and applying z-scoring, this simulation revealed that it was highly unlikely for the correlations to have occurred by chance and that the correlations were extremely significant (p < 0.005). Separate Pearson correlations were run between targeted metabolite concentrations in reef depth seawater and total chlorophyll a, total chlorophyll a: phaeophytin as well as the percent cover of corals, algae, sponges, rocks, and sand.
Specific trends in targeted metabolite concentrations were investigated. Independent two-group t-tests or Wilcoxon rank sum tests were used to identify significant differences in metabolite concentrations between surface and reef depth seawater (p < 0.05). ANOVA tests followed by Tukey’s HSD tests (when appropriate) were used to identify significant differences in metabolite concentrations by reef location in data that were normally distributed (p < 0.05). Additionally, differences between surface and reef depth concentrations were computed for all targeted metabolites that could be quantified. Following this calculation, one-tailed t-tests were conducted to test if the deltas for any metabolite significantly differed (p < 0.05) from zero.
Results
Reef Composition, Biogeochemistry, and Cell Abundances
Substrate composition varied across forereef sites (Figure 2) and there were some significant differences in the coverage of algae, corals, sponges, rocks, and sand (ANOVA, p < 0.05). Coral cover ranged from 11 to 35%. Sites JR2 and 12 had significantly lower coral cover (Tukey’s HSD, p < 0.05) compared to the other reefs (Figure 2). Algal cover ranged from 24 to 41%, and one significant difference was detected between JR2 and JR6 (Tukey’s HSD, p < 0.05) (Figure 2). Sponge cover was generally low (4% average cover) compared to coral and algal cover across all surveyed reefs (Figure 2). One site, JR5, had significantly greater sponge cover compared to JR10 and 11 (Tukey’s HSD, p < 0.05). A majority of the bare substrate on sites consisted of rock (average cover of 30%) (Figure 2).
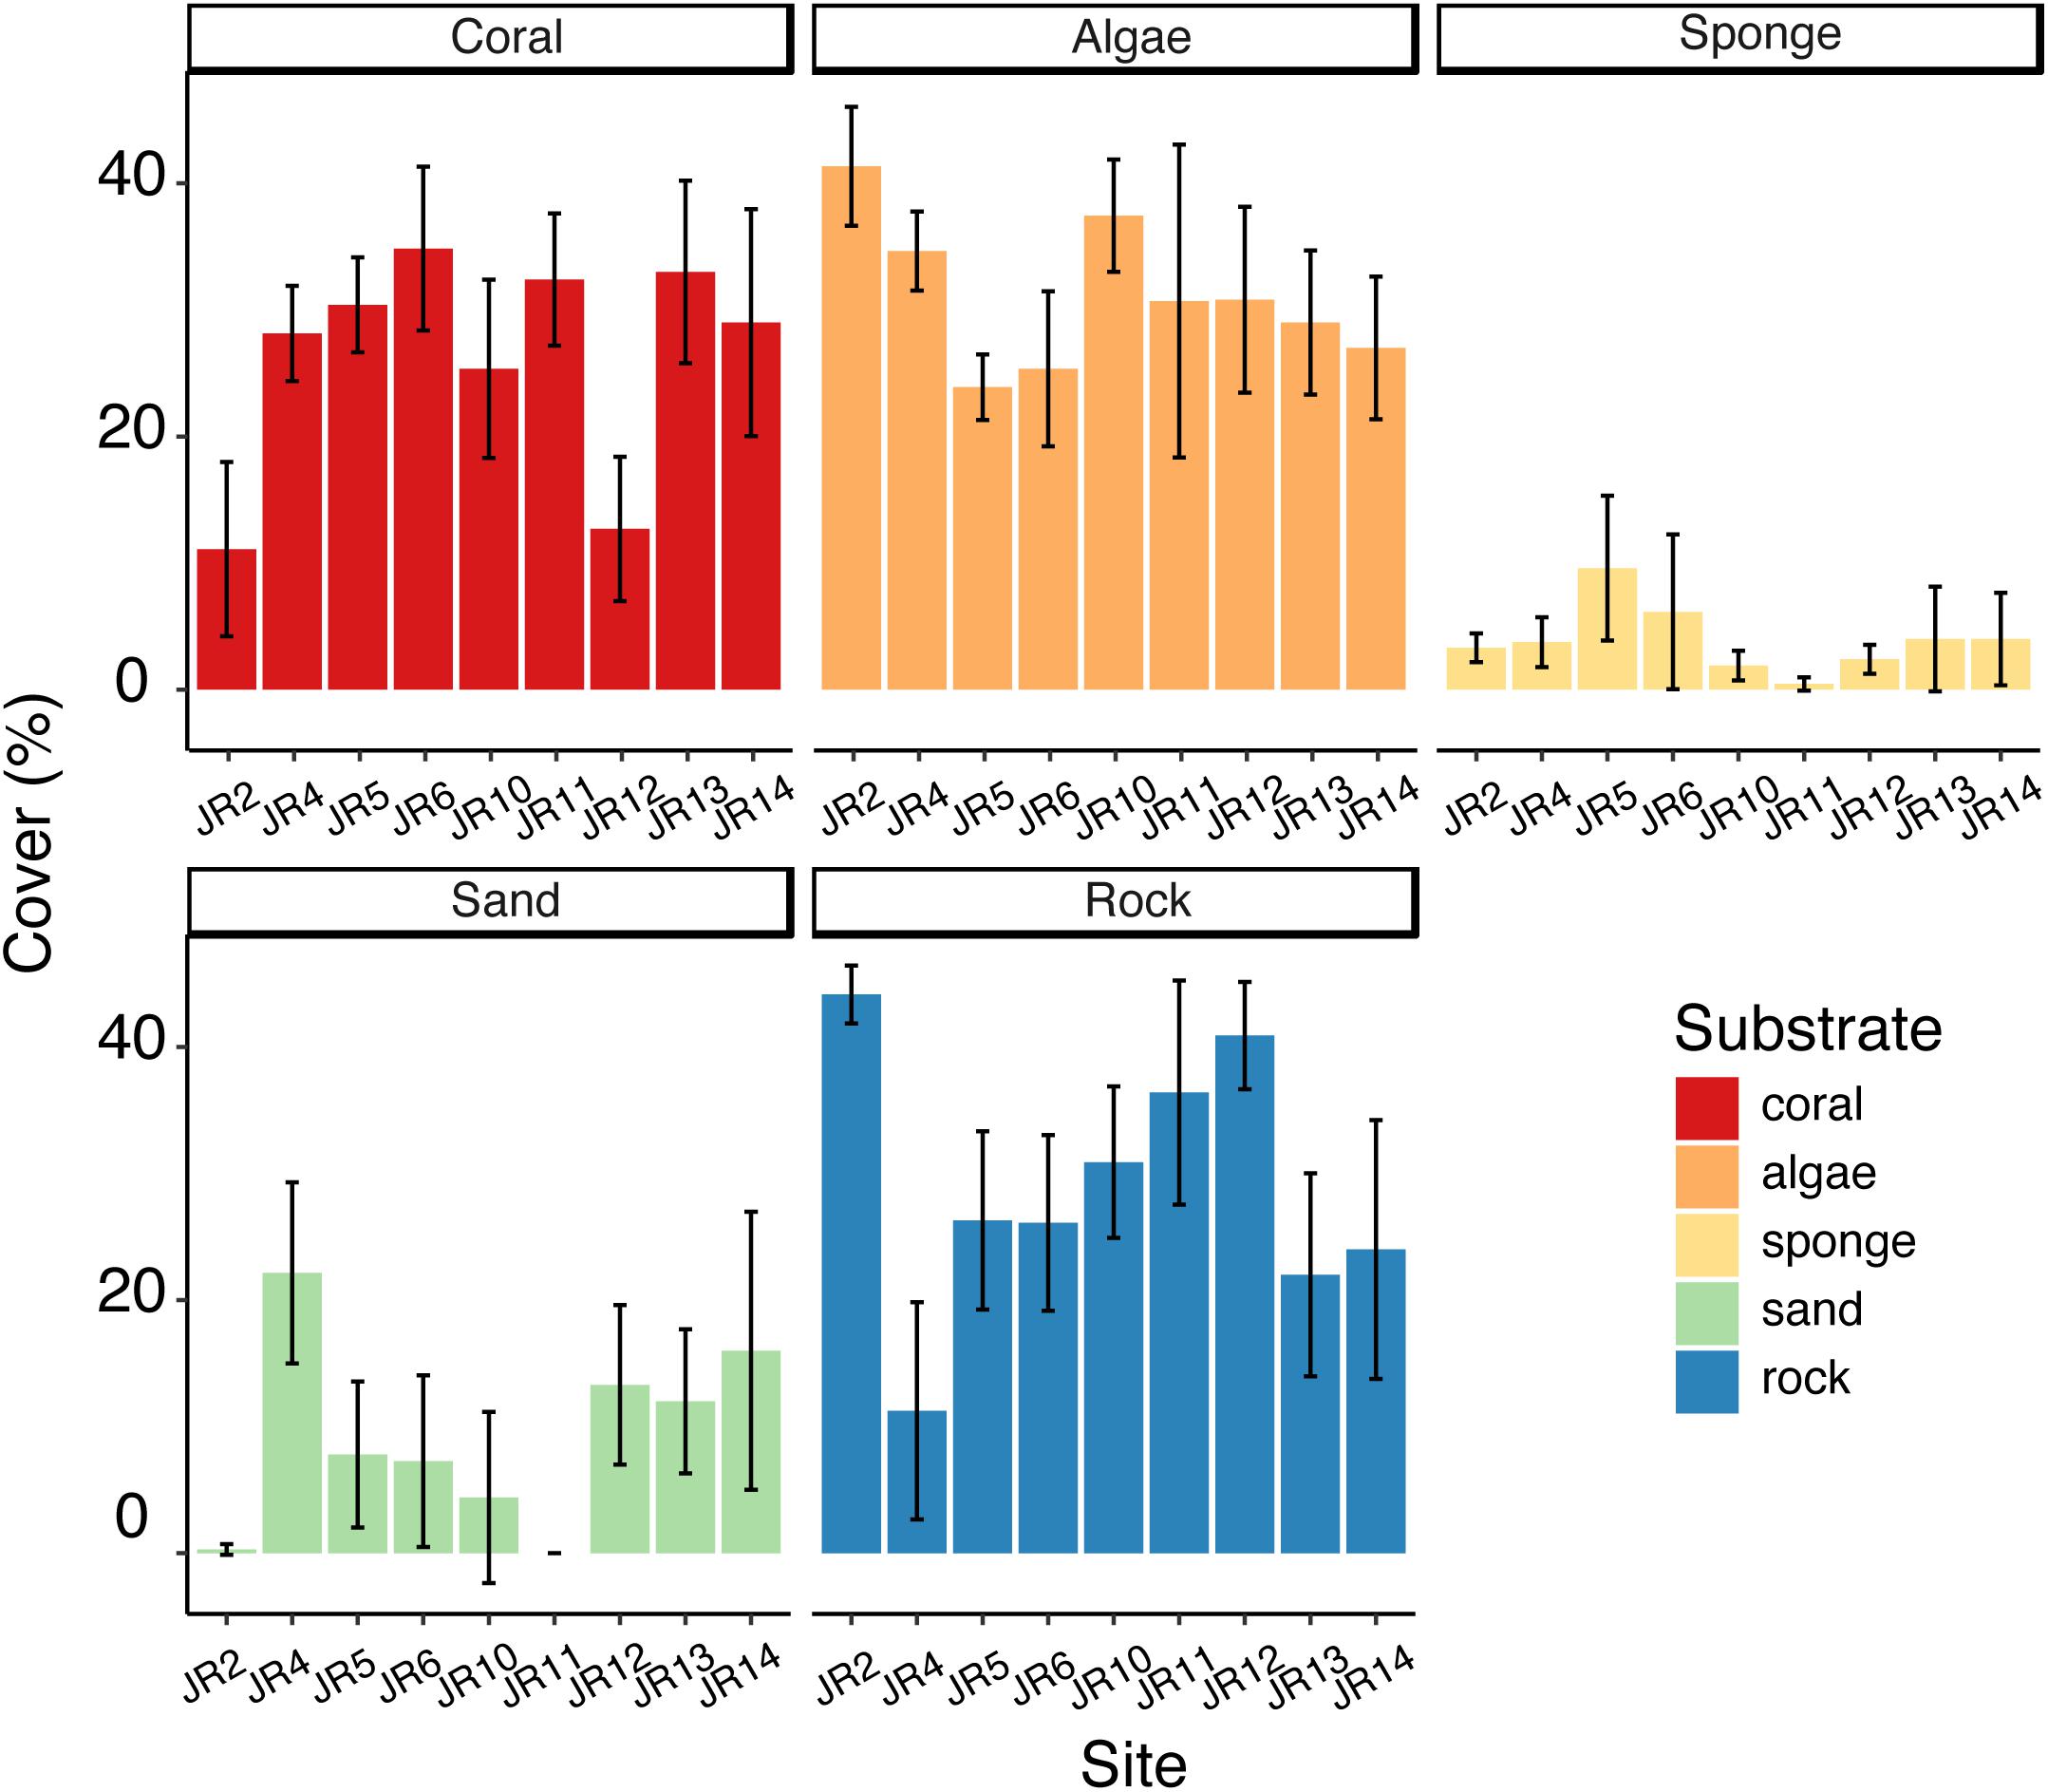
Figure 2. Average percent cover of corals, algae, sponges, sand, and rock across Jardines de la Reina (JR) forereefs. Error bars reflect 95% confidence intervals for measurements at each site. Colors indicate substrate type.
Physicochemical conditions in surface and reef depth seawater were generally similar across all the sites with the exception of dissolved oxygen and pH (Supplementary Table 1). Dissolved oxygen was higher in surface samples (t = 2.87, df = 8, p = 0.021) and pH was higher in reef depth samples (t = −3.55, df = 8, p = 0.0076). Inorganic and organic nutrient concentrations were similar regardless of geographic location (eastern, central, western, off reef) and depth (surface vs. reef depth) (ANOVA, p > 0.05).
While the abundances of unpigmented cells (generally heterotrophic bacteria and archaea) did not vary widely across sites (average of 4.1 × 10⁵ ± 7.8 × 10⁴ cells mL–1), Prochlorococcus were significantly more abundant in surface reef seawater relative to reef depth seawater (t = 2.57, df = 8, p = 0.033) and this result was independent of reef location. Synechococcus were significantly more abundant [ANOVA, F(2,17) = 5.51, p = 0.014] in reef seawater from western compared to central reefs. Average Synechococcus abundances were generally higher in reef seawater (average of 3.5 × 10⁴ ± 1.6 × 10⁴ cells mL–1) compared to off reef seawater (average of 1.9 × 10⁴ ± 3.4 × 10³ cells mL–1), but this difference was not significant (ANOVA, F(2,17) = 1.31, p = 0.30). Picoeukaryotes followed the same pattern as Synechococcus and were higher in forereef seawater (average of 890 ± 550 cells mL–1) compared to off reef seawater (average of 470 ± 80 cells mL–1). Chlorophyll a concentrations were generally similar across reefs (average concentration of 0.17 ± 0.05 μgL–1), excluding JR10 and 12, which had much higher concentrations of chlorophyll a (average: 0.91 ± 0.15 μgL–1). The ratios of chlorophyll a to phaeophytin concentrations ranged from 0.73 to 2.50 and were lowest in reef depth seawater from JR10, 11, and 12.
Overall patterns in environmental data were investigated using PCA (Figure 3). The two off reef sites grouped together, indicating their similarity, and the vector representing Prochlorococcus abundance was oriented in their direction (Figure 3). Surface and reef depth seawater samples were distributed across the PCA and did not group together by depth, although there was more variation across environmental parameters in reef depth seawater. Reef depth seawater samples from JR10, 11, and 12 emerged as outliers (Figure 3). The vector representing the ratio of total chlorophyll a to phaeophytin concentrations across sites was oriented in the direction of the off reef sites and contributed the most variation to principal component one (correlation = −0.86, p = 9.95 × 10⁻⁷; Figure 3). Unpigmented cell abundances contributed the most variation to principal component two (correlation = −0.83, p = 7.10 × 10⁻⁶; Figure 3). An adonis test was conducted, revealing that none of the measured categorical factors (e.g., depth, region) significantly contributed to the differences in environmental data (p > 0.05).
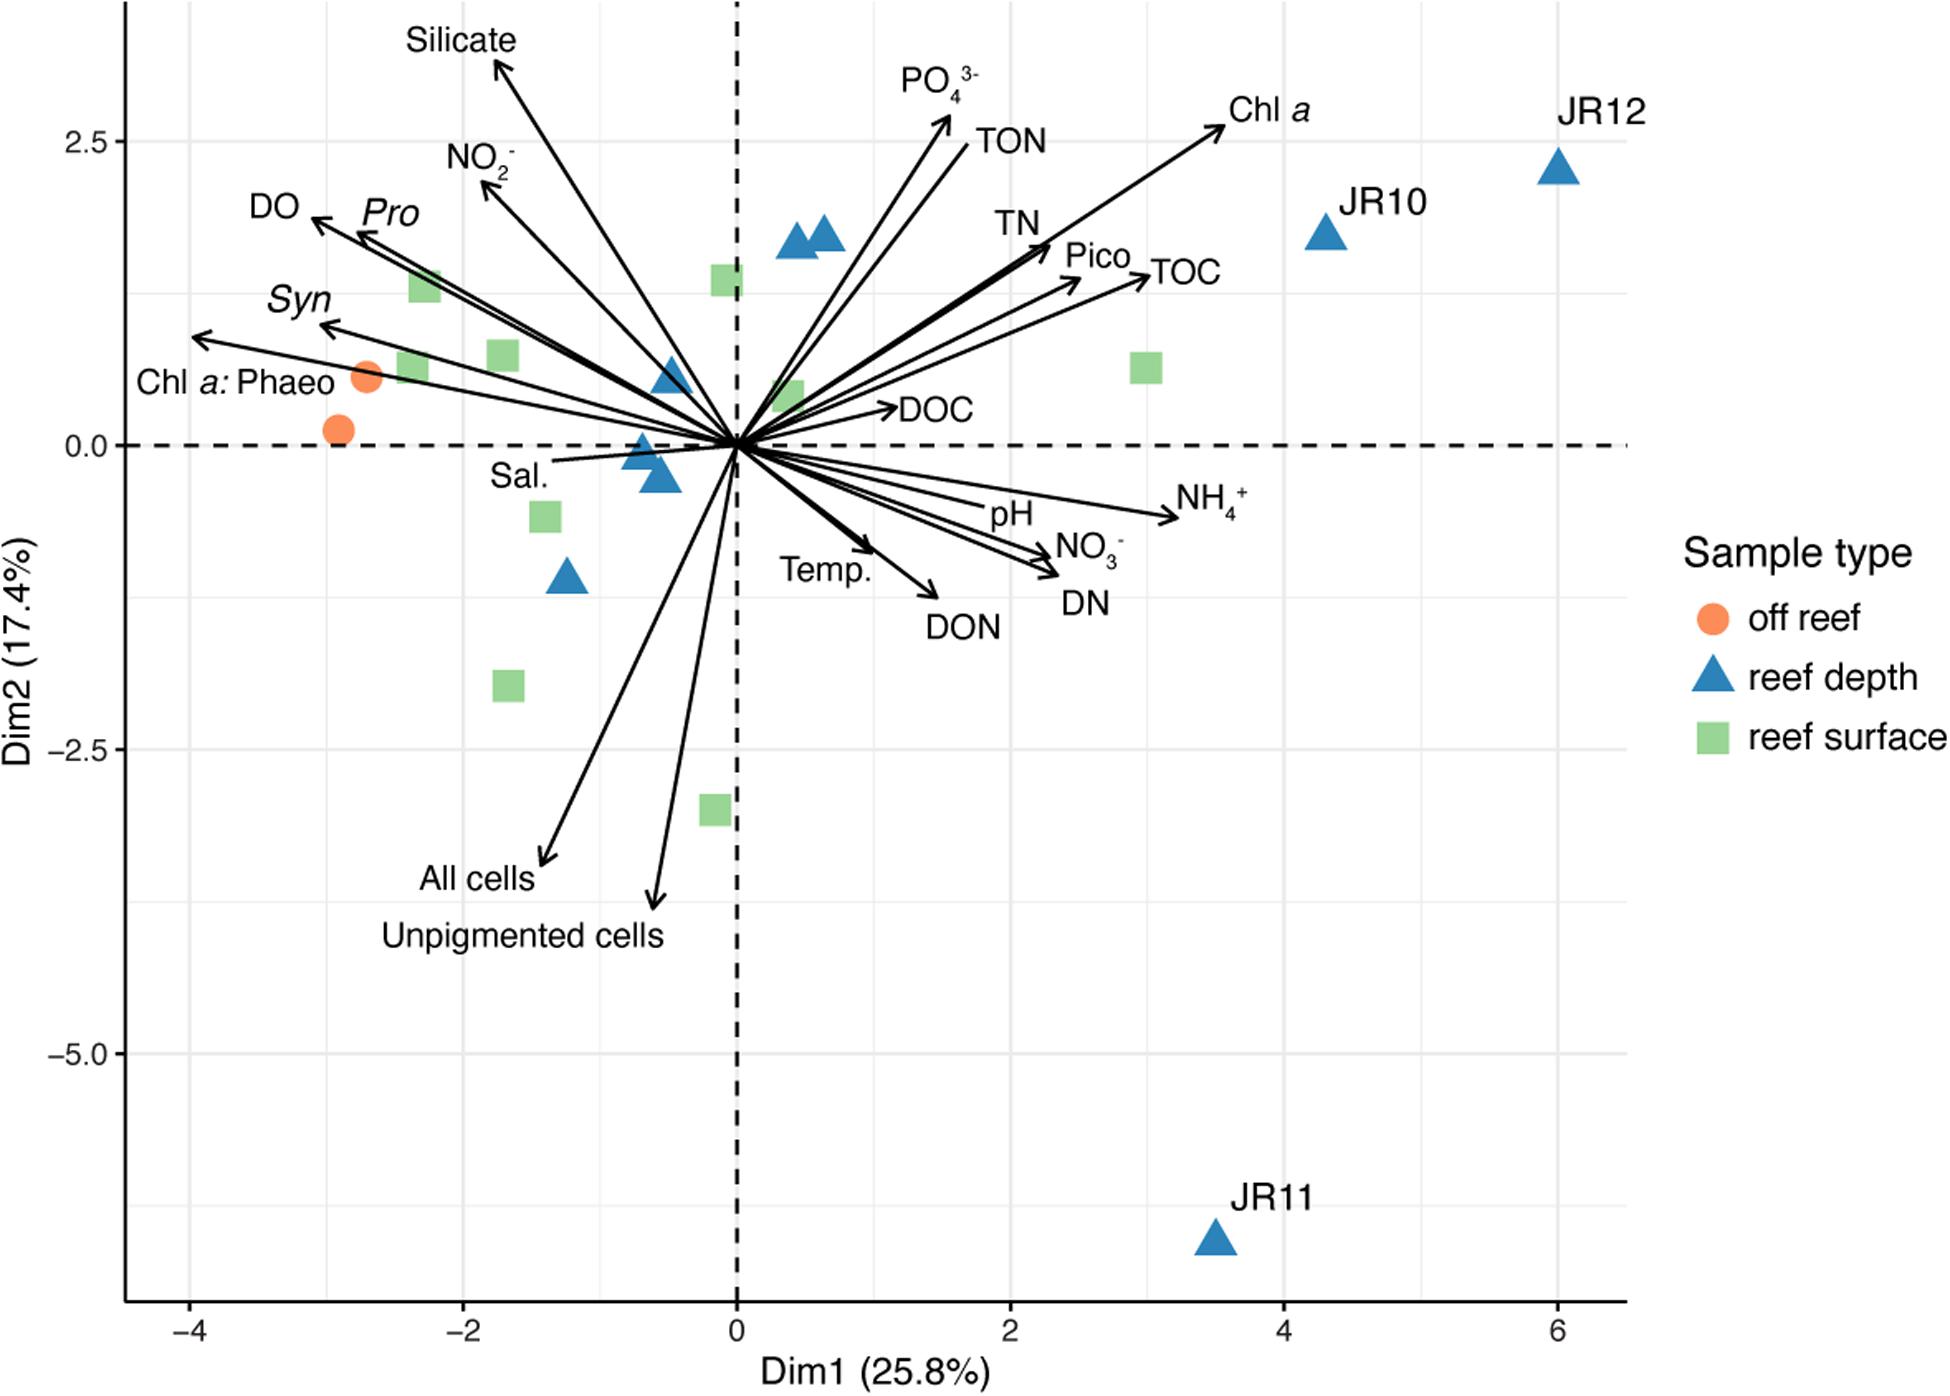
Figure 3. Principal components analysis (PCA) performed using physicochemical seawater properties, inorganic and organic nutrient concentrations, chlorophyll a concentrations, chlorophyll a: phaeophytin, and microbial cell abundances. Symbol colors represent the sample type. Outlier reef sites are labeled. Chl a: Phaeo, chlorophyll a: phaeophytin ratios; Sal., salinity; Chl a, Chlorophyll a; Temp., temperature; Syn., Synechococcus cell abundance; Pro., Prochlorococcus cell abundance; DO, dissolved oxygen; TOC, total organic carbon; DOC, dissolved organic carbon; PO43–, phosphate; TN, total nitrogen; TON, total organic nitrogen; DON, dissolved organic nitrogen; DN, dissolved nitrogen; NO2–, nitrite; NO3–, nitrate; NH4+, ammonium.
Untargeted Metabolites
Overall, 1794 metabolite features were detected using the untargeted method in negative ion mode and the average number of features detected across all samples was 1791 ± 6. Untargeted metabolite feature composition was highly similar across reefs; samples did not separate clearly by reef, region, depth, or sample type (off reef vs. forereef) (Figure 4). That being said, reef depth and surface seawater from JR12 and surface seawater from JR10 were outliers in the NMDS, indicating larger differences in metabolite feature composition in these samples compared to all the other samples (Figure 4).
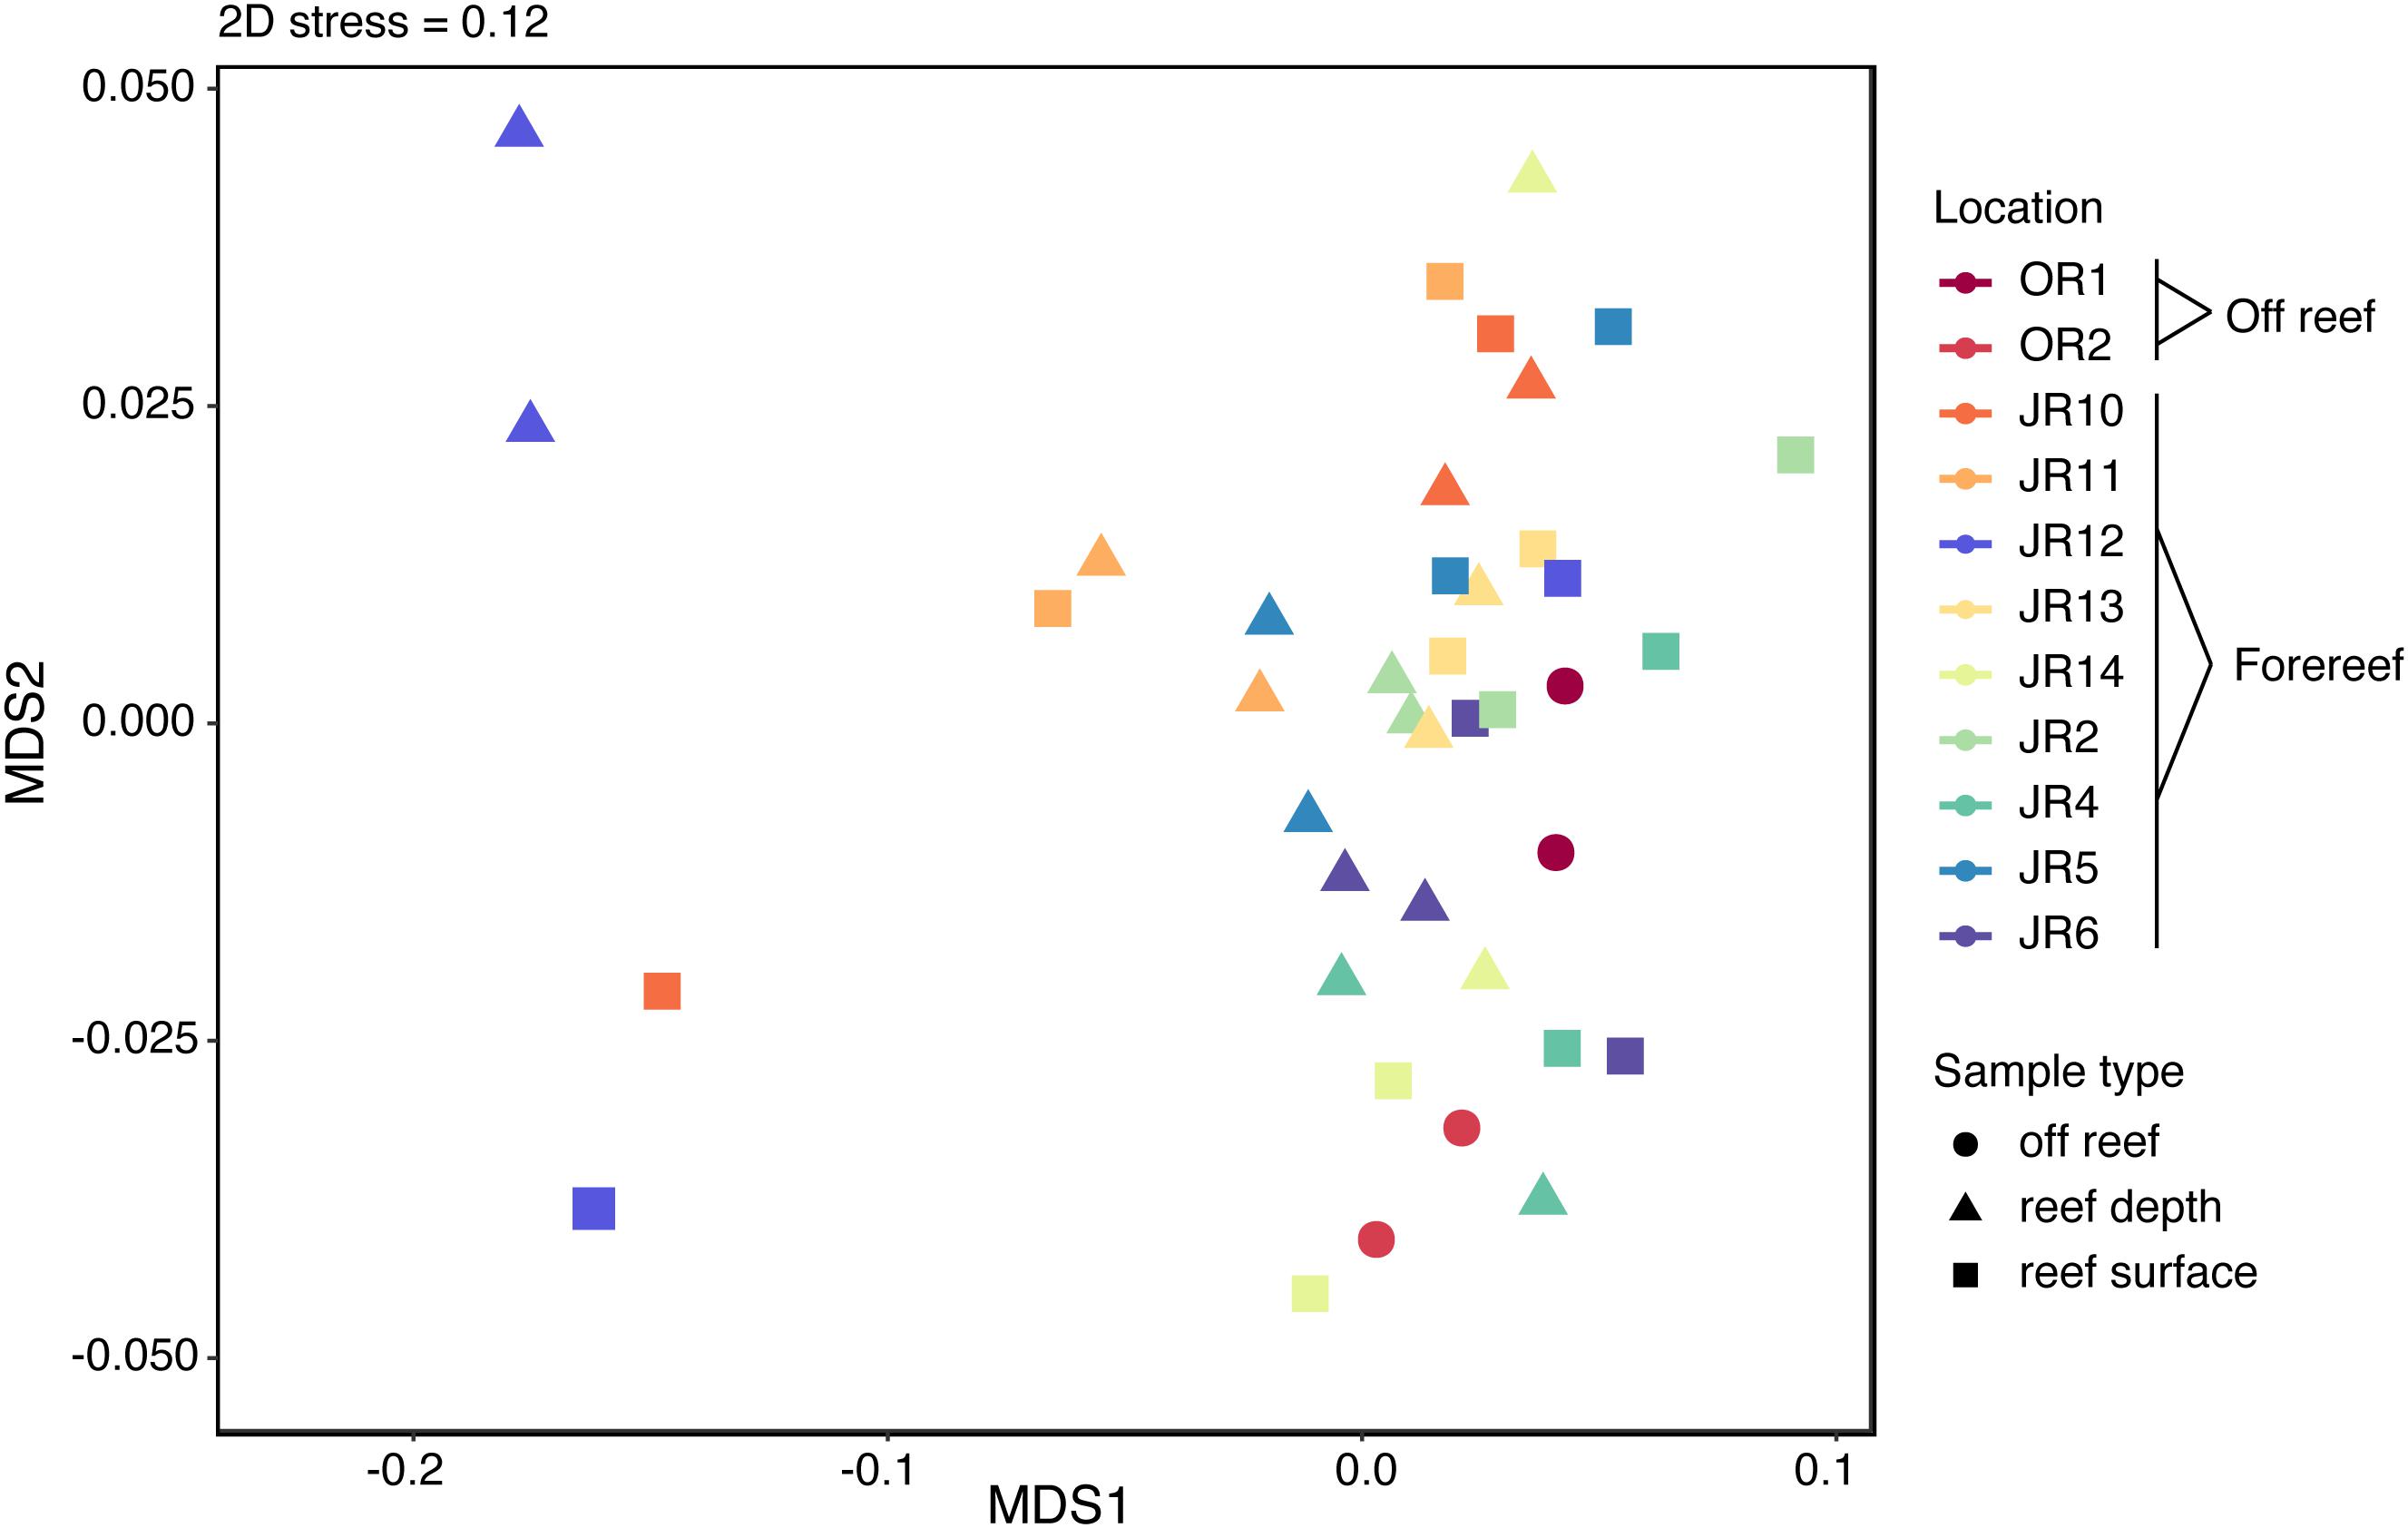
Figure 4. Non-metric multidimensional scaling (NMDS) analysis performed on the Bray-Curtis dissimilarity index of untargeted metabolite features. Symbol colors represent sampling sites and symbol shape indicates sample type.
Significant pairwise Pearson correlations occurred between untargeted features and all of the measured environmental parameters. DOC (357 features), TOC (356 features), ammonium (308 features), Synechococcus abundances (268 features), total dissolved nitrogen (214 features), and phosphate (152 features) had the highest number of significant correlations with untargeted metabolite features (adjusted p-value < 0.05). Prochlorococcus abundances were significantly correlated with 111 features, whereas unpigmented cell and picoeukaryote abundances only correlated with 7 and 3 features, respectively. In these comparisons, 22 untargeted features were highly, positively correlated (r > 0.70) with environmental variables (Supplementary Figure 2). Interestingly, half of these features were significantly and highly correlated with Synechococcus abundances. Of the highest negative correlations (r < −0.70), most occurred between untargeted features and total dissolved nitrogen and ammonium (Supplementary Figure 3). Separate Pearson correlations conducted between untargeted features and benthic cover revealed a few features that were positively and highly correlated. One feature (feature 584) was correlated with coral cover, one feature was correlated with sand (feature 642), and two features (features 265 and 1062) were correlated with rock cover. The percent cover of sand was highly, negatively correlated with most features that had r values <−0.70. Sponge cover was negatively correlated with two untargeted features (features 836 and 849).
An adonis test was used to examine if depth, geographic region, biome, or their interactions significantly influenced the Bray-Curtis dissimilarity in untargeted feature compositions. According to this test, no factors significantly influenced overall feature composition. On the other hand, indicator feature analysis revealed features that were significantly indicative of reef (surface and reef depth) compared to off reef seawater, and surface compared to reef depth seawater. In a comparison between reef and off reef seawater, 76 features were indicative of reef seawater (surface and reef depth) and 171 features were indicative of off reef seawater. Across reef seawater samples, 41 features were indicative of reef depth seawater and 39 features were indicative of surface reef seawater (Figure 5).
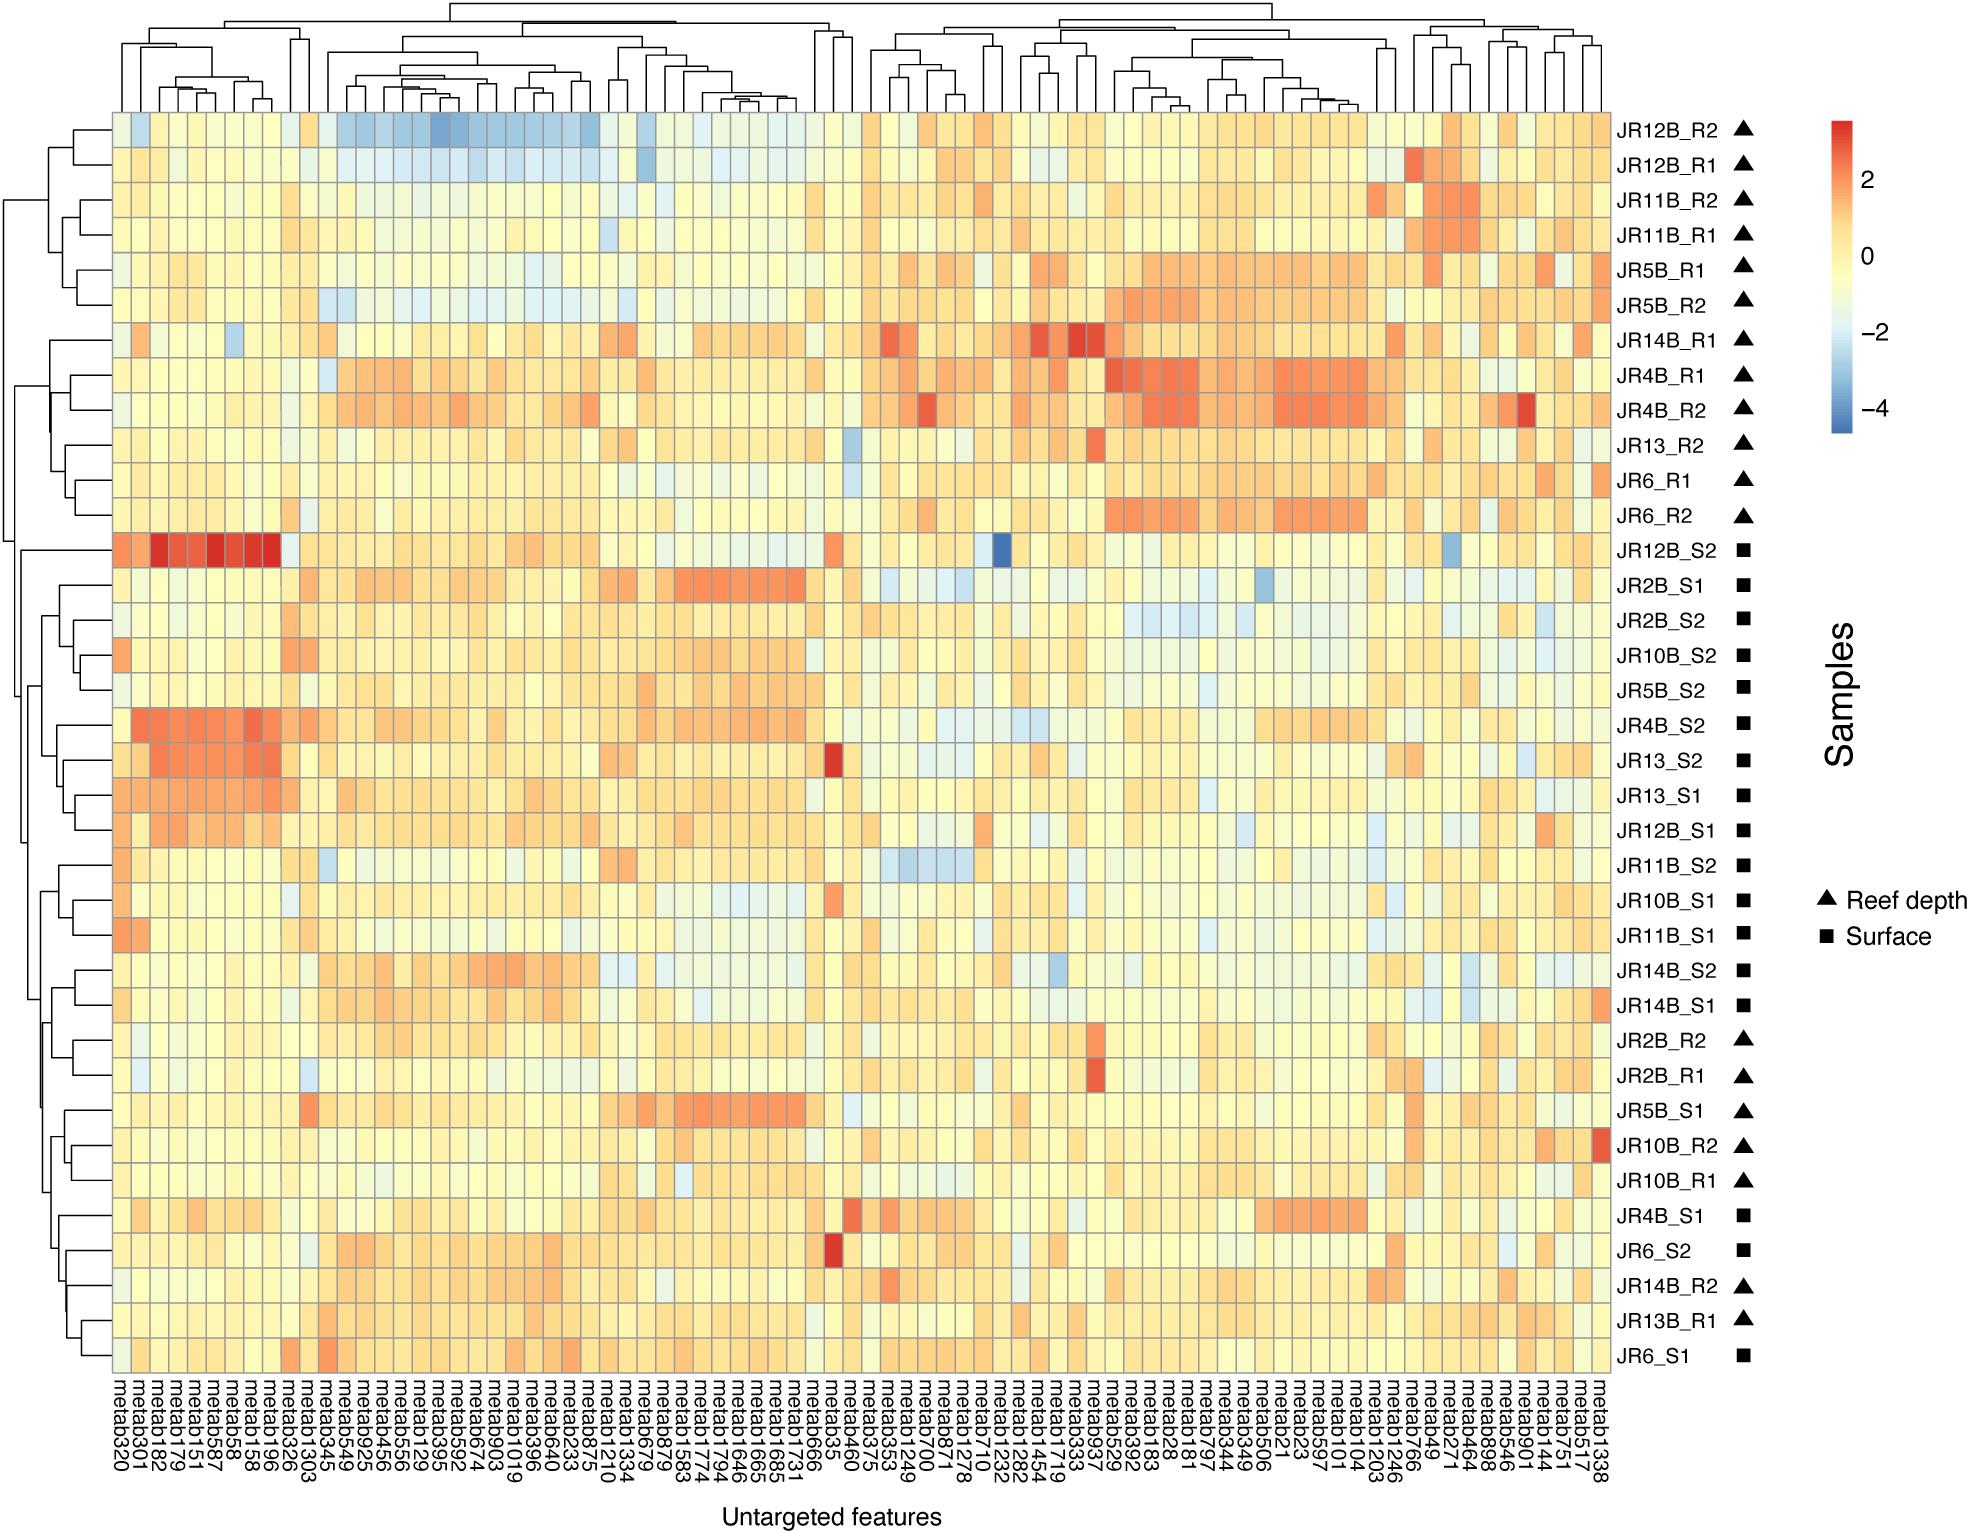
Figure 5. Heatmap of log-transformed untargeted feature peak intensities indicative of either reef surface or reef depth seawater. Warm colors reflect higher peak intensities whereas cooler colors represent lower peak intensities. Surface samples are indicated by S1 or S2 and reef depth samples are indicated by R1 or R2, with 1 and 2 from each depth representing technical replicates. The numbers on the x-axis are the labels for the indicative metabolite features.
Targeted Metabolites
Using targeted metabolomics, we quantified 32 of 53 detected metabolites, after correcting them for extraction efficiency as reported by Johnson et al. (2017) (Supplementary Table 2). A table of the detected, but not quantified metabolites is also provided (Supplementary Table 3). All quantified metabolites had nanomolar or picomolar concentrations in reef and off reef seawater (Supplementary Table 2). Malic acid was present at the highest concentration, ranging from 9.5 to 27.8 nM (Supplementary Table 2).
Pearson correlations between quantified, targeted metabolites and environmental data revealed 21 significant relationships (Figure 6). Nitrite concentrations negatively correlated with guanosine, riboflavin, taurocholic acid, and 5′-methylthioadenosine (Figure 6 and Supplementary Figure 4). Prochlorococcus abundances negatively correlated with adenosine and taurocholic acid (Figure 6 and Supplementary Figure 4). Significant, positive co-correlations between targeted metabolites were also revealed between guanosine and adenosine, malic acid and citric acid, phenylalanine and leucine, phenylalanine and tyrosine, and riboflavin and guanosine among other co-correlations. No significant correlations were detected in separate Pearson correlations between reef depth targeted metabolite concentrations and substrate cover of corals, algae, sponges, rocks, and sand.
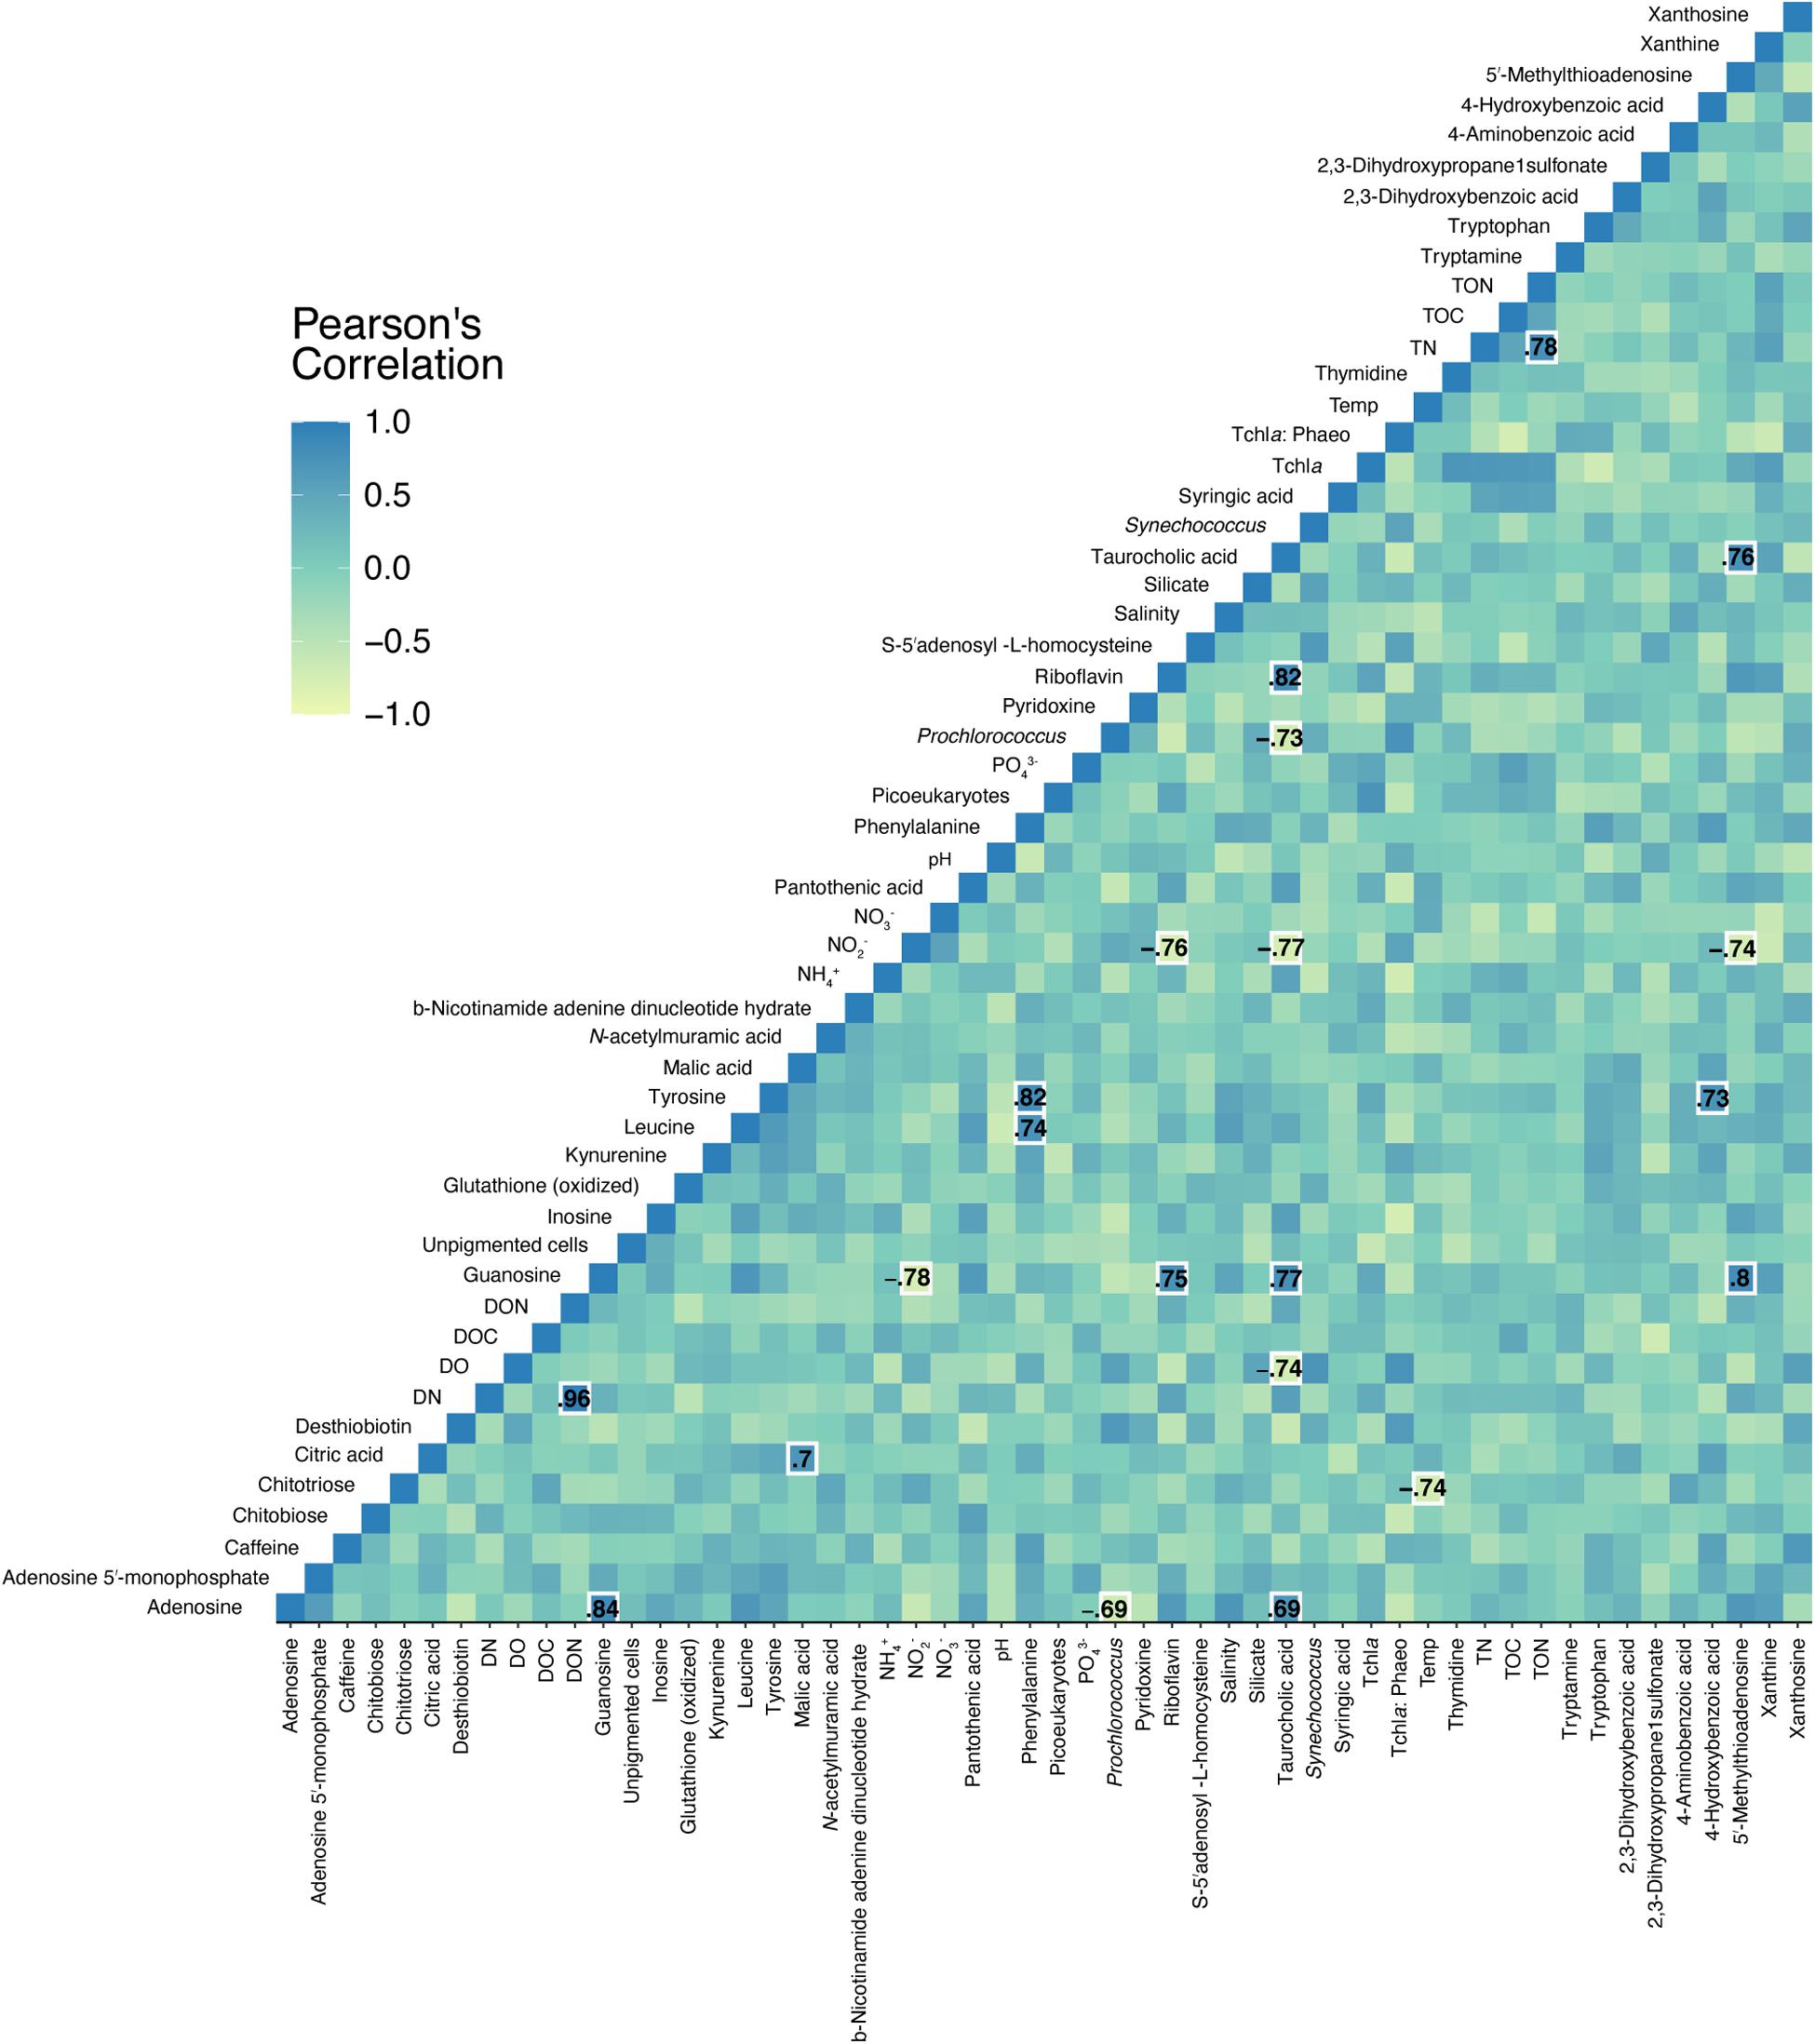
Figure 6. Pearson correlations between targeted metabolite concentrations and environmental measurements. Specific Pearson’s R-values are only shown for significant (p < 0.05, FDR corrected) correlations. Color corresponds to the strength of the correlation.
Most (90%) of the identified metabolites were detected in both off reef and reef seawater (reef depth and reef surface) except for guanosine, pantothenic acid, and xanthine, which were only detected in reef seawater (Figure 7 and Supplementary Table 2). Guanosine and pantothenic acid were significantly lower (guanosine: ANOVA, F(3,36) = 6.33; pantothenic acid: ANOVA, F(3,36) = 6.34, p < 0.05; Tukey’s HSD, adjusted p-value < 0.05) in off reef seawater compared to central and eastern reef seawater (Figures 7A,B). The concentrations of thymidine and xanthine were generally lower in off reef seawater, but not significantly so due to the variability of the concentrations across reefs (Figures 7C,D). MTA concentrations were significantly lower (ANOVA, F(3,36) = 16.47, p < 0.05; Tukey’s HSD, adjusted p-value < 0.05) in off reef forereef seawater compared to central and eastern forereef seawater (Figure 7E). MTA concentrations did not differ significantly between surface and reef depth seawater (ANOVA, F(1,38) = 2.21, p = 0.15).
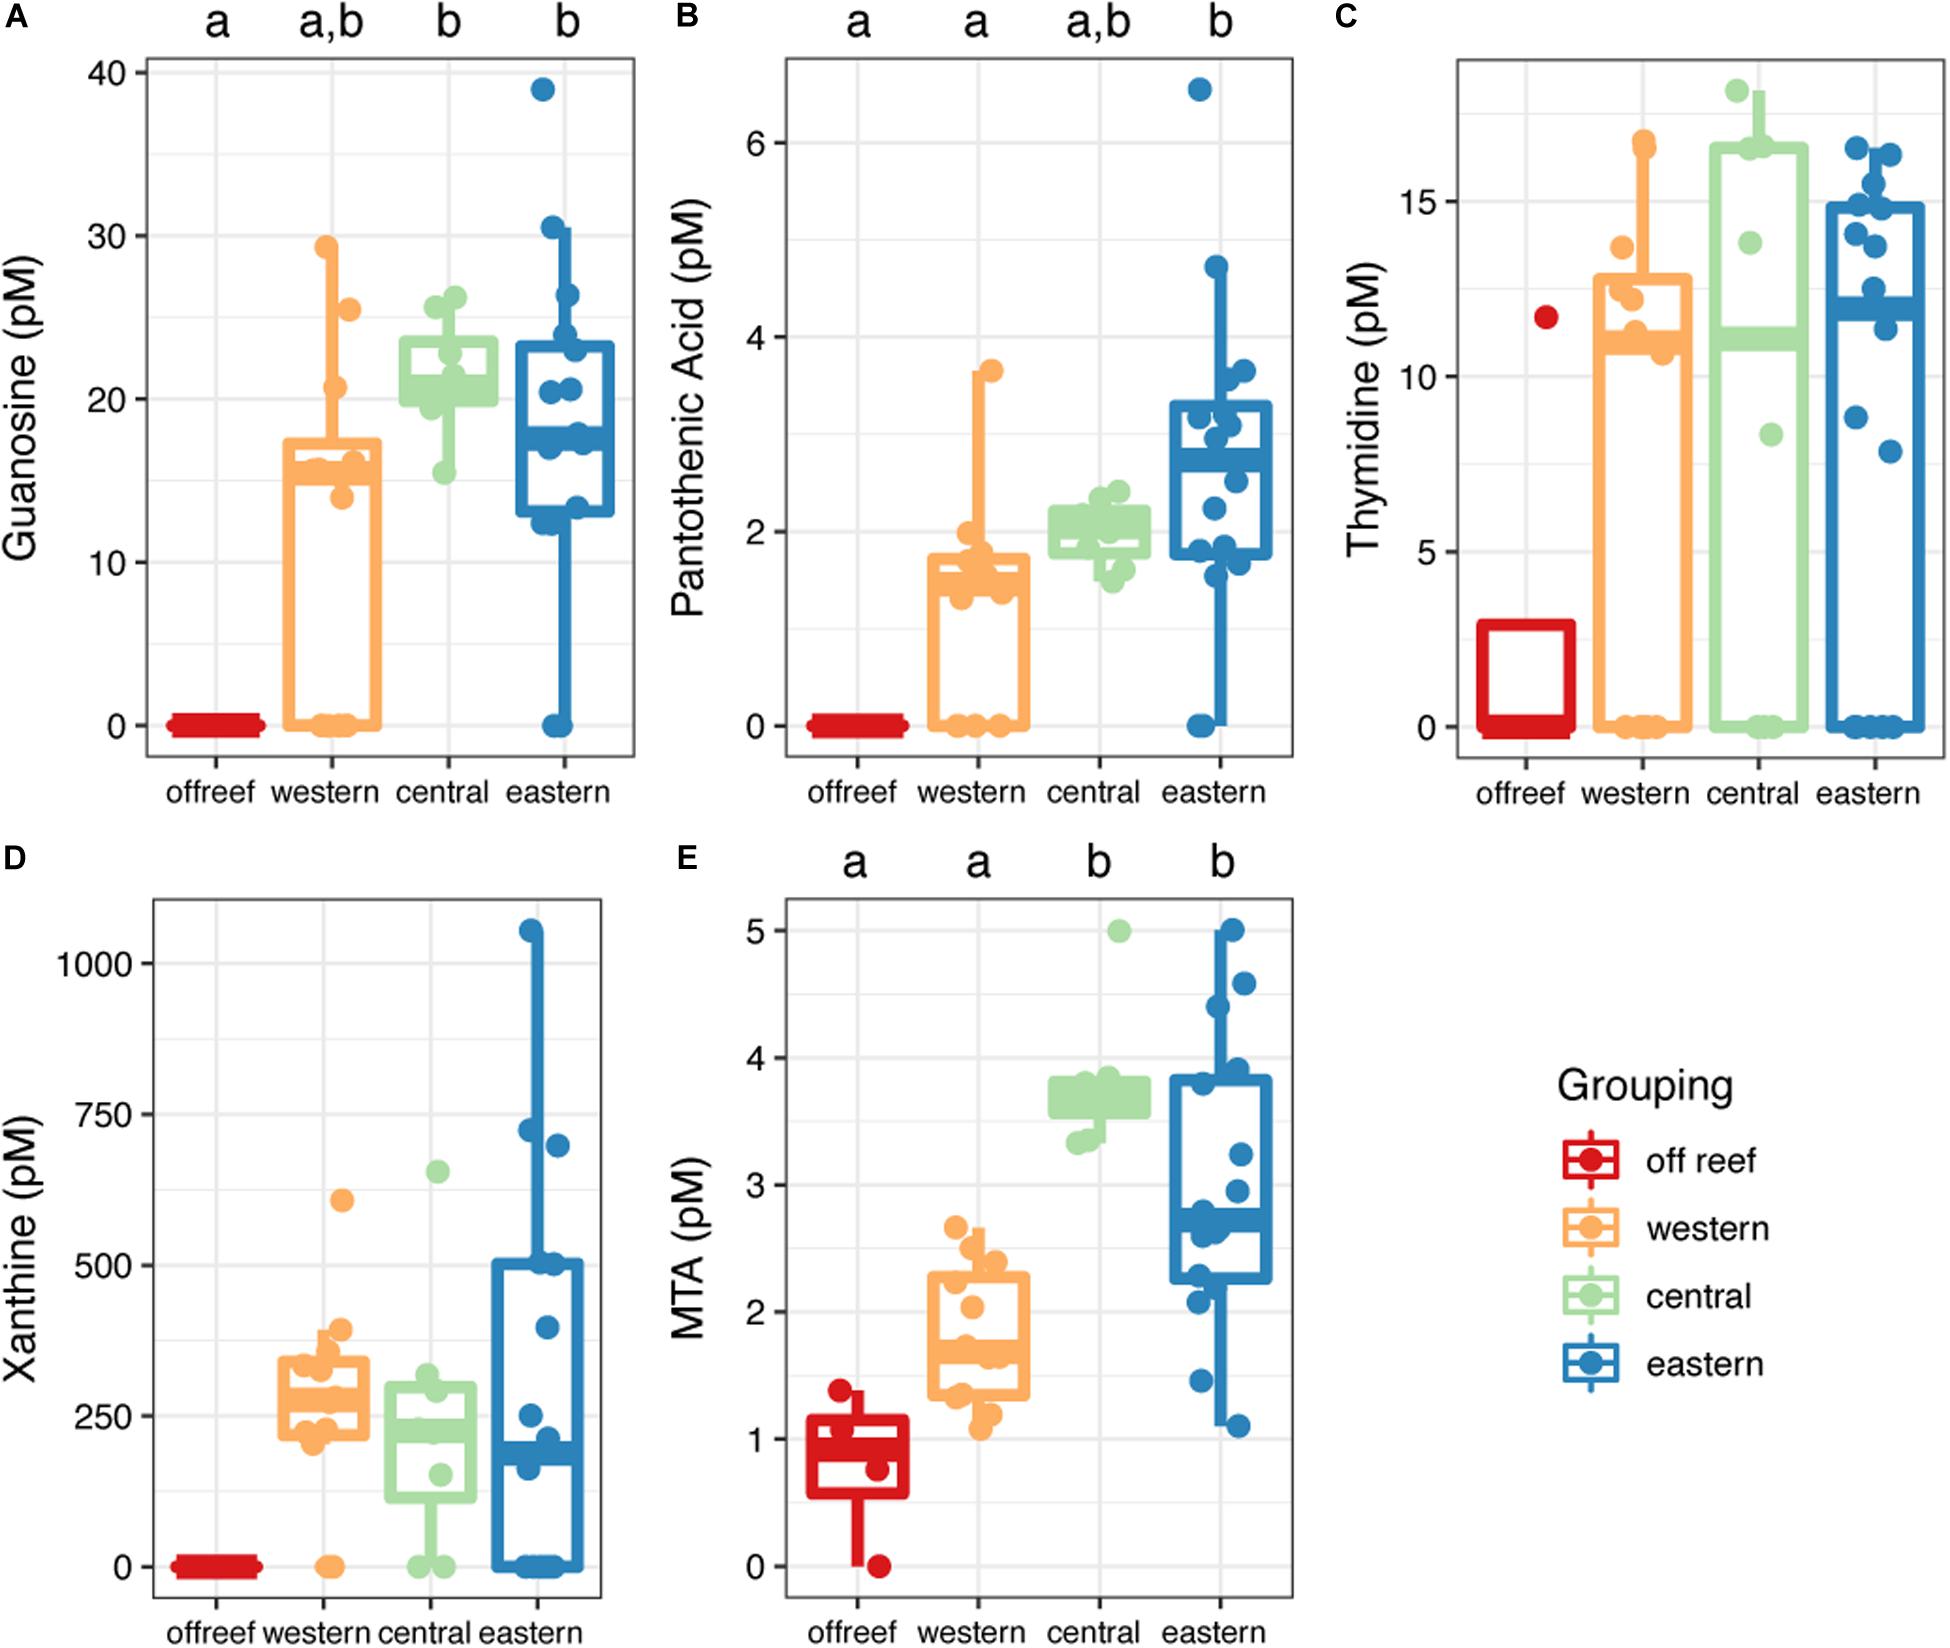
Figure 7. Concentrations of metabolites (A–E) measured using the targeted method across the Jardines de la Reina archipelago. Color corresponds to regional grouping. Boxplots with different letters are significantly different from each other (ANOVA and Tukey’s HSD, adjusted p-value < 0.05).
Riboflavin and xanthosine concentrations exhibited depth-related patterns across JR (Figure 8). Riboflavin concentrations were significantly higher (t = −5.52, df = 23.46, p = 1.21 × 10⁻⁵) in reef depth seawater (median concentration = 4.9 picomolar (pM), interquartile range [IQR] = 2.0) compared to surface reef seawater (median concentration = 1.9 pM, IQR = 0.10) (Figure 8B). Furthermore, the differences between surface and reef depth riboflavin concentrations were significantly different from zero (t = −5.44, df = 8, p = 0.0006) demonstrating the strength of this trend regardless of reef location. Additionally, the concentration of riboflavin in reef seawater from eastern reefs was significantly higher compared to off reef surface seawater (ANOVA, F(3,36), F = 3.42, p < 0.05; Tukey’s HSD, adjusted p-value < 0.05) (Figure 7A). On the other hand, xanthosine concentrations were significantly higher in surface seawater regardless of reef location and despite the patchy concentrations (t = 2.96, df = 8, p = 0.018) (Figure 8D).
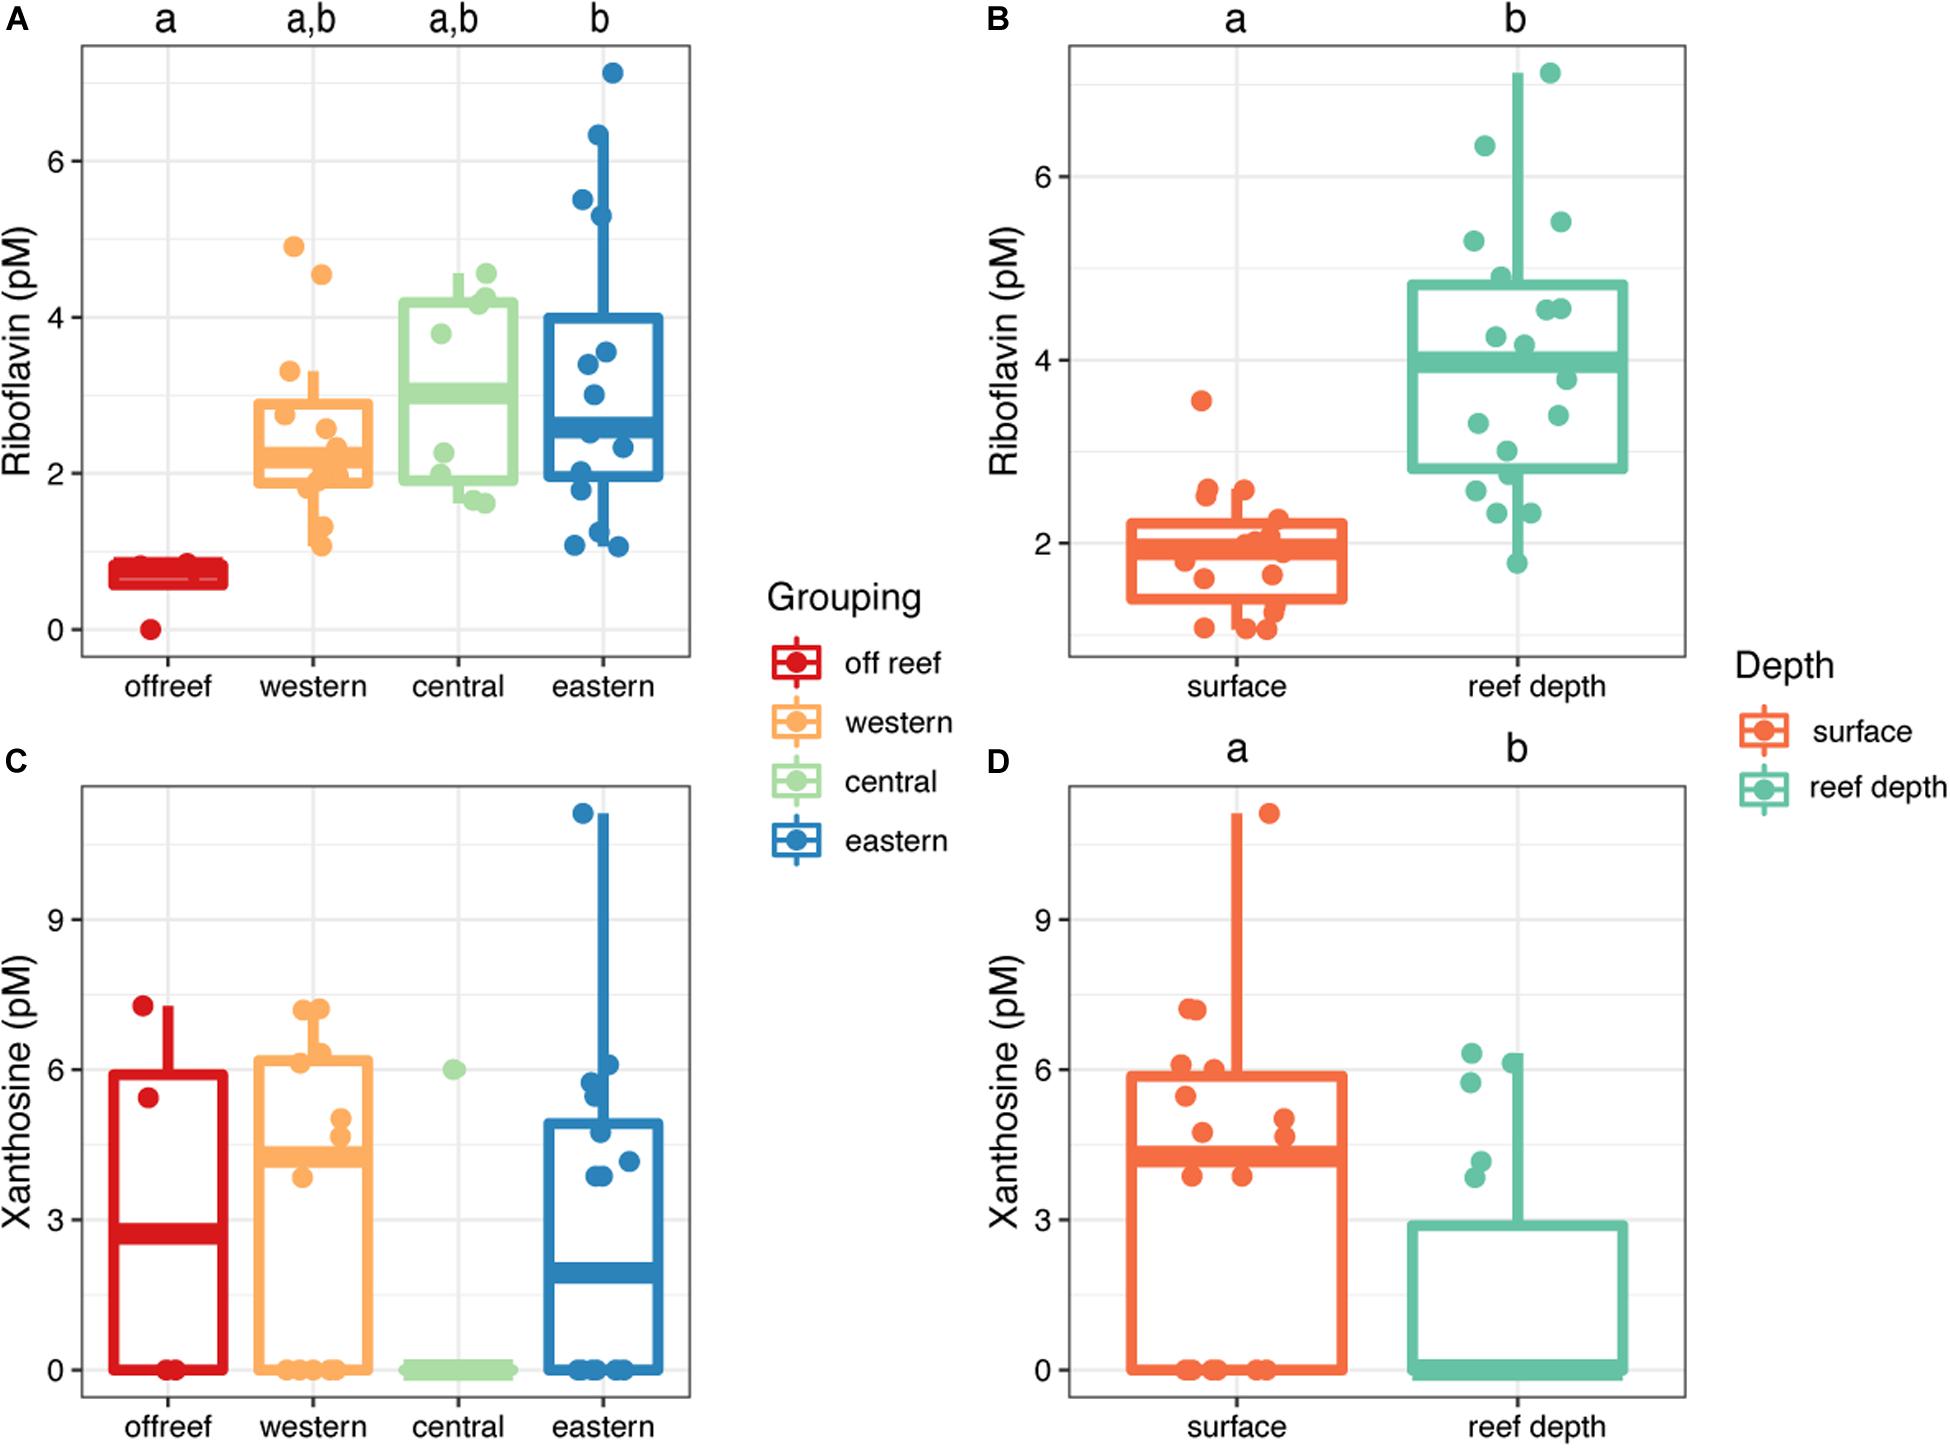
Figure 8. Concentrations of riboflavin (A,B) and xanthosine (C,D) in seawater across Jardines de la Reina, presented by reef geographic location (A,C) and depth (B,D). Boxplots with different letters are significantly different from each other (ANOVA and Tukey’s HSD, adjusted p-value < 0.05, independent two group t-tests, or one-tailed t-tests).
Discussion
This study surveyed dissolved organic metabolites present in forereef seawater from the protected JR coral reef archipelago in an effort to provide baseline information about the extracellular metabolite composition of coral reef seawater. Using both targeted and untargeted metabolomics approaches, we detected and quantified specific metabolites including nucleosides, amino acids, vitamins, and metabolic intermediates and observed that untargeted metabolite feature composition across the archipelago was quite similar between reef depth and surface as well as off reef seawater. We also investigated whether the metabolite feature landscape changed in concert with reef composition and bulk biogeochemical measurements and found similar patterns with a few differences according to metabolite and site.
Similar Metabolite Feature Compositions Across the Jardines de la Reina Archipelago
Untargeted metabolite feature composition and diversity were generally similar across all sampled biomes and depths, likely reflecting the homogenous environmental conditions across the Jardines forereefs. The other measurements generally followed suit, with the exception of higher Prochlorococcus abundances in surface compared to reef depth seawater and higher Synechococcus abundances on western reefs. The metabolite feature composition of seawater from sites JR10, 11, and 12 emerged as outliers and these observations, together with the elevated total chlorophyll a at JR10 and 12 and lower chlorophyll a to phaeophytin ratios in seawater at JR10, 11, and 12, suggest elevated phytoplankton biomass at these reef sites. The biogeochemical and physicochemical similarities across the forereefs are likely due to their location, depth, and hydrography. The forereefs of JR are flushed with oligotrophic water via the Caribbean current that meanders its way through the Caribbean basin (Arriaza et al., 2012), likely driving the high biogeochemical similarity between reefs. Despite the overall homogeneity across measurements, results from indicator feature analysis and targeted metabolite analysis indicate that specific untargeted features and targeted metabolites changed in conjunction with depth (surface vs. reef depth) and biome (off reef vs. reef). The discrepancy between the overall untargeted and targeted metabolite analyses could be due to differences in ionization mode. Most of the targeted compounds that changed across samples were metabolites that ionized in positive mode (e.g., riboflavin and MTA) and these metabolites were not measured in the untargeted analysis (Supplementary Table 2).
Presence of Amino Acids and Nucleosides in Reef and Off Reef Seawater
Targeted metabolite analysis revealed the presence of 53 known extracellular metabolites in reef seawater, over half of which were quantified at nano- or picomolar concentrations. Most (90%, presence/absence) of these metabolites were detected in both off reef and reef seawater, consistent with the observations that the forereefs in Jardines are flushed with oligotrophic seawater from offshore. We determined the dissolved concentrations of five nucleosides (adenosine, guanosine, inosine, thymidine, and xanthosine) and four amino acids (tyrosine, leucine, phenylalanine, and tryptophan). Fiore et al. (2017) reported higher concentrations of nucleosides and the amino acid tryptophan in sponge exhalent compared to inhalant seawater, demonstrating that sponges can be sources of amino acids and nucleosides to the surrounding seawater. Similarly, corals (both stony and soft) can release dissolved free amino acids into the water column, either via their mucus (Ducklow and Mitchell, 1979) or as dissolved exudates (Schlichter and Liebezeit, 1991). Our study was sensitive enough to not only detect the presence of some amino acids, but to quantify their concentrations in seawater approximately 1 m away from potential benthic sources. We also detected several correlations between the concentrations of nucleosides (e.g., adenosine and guanosine) as well as essential (phenylalanine) and non-essential (tyrosine) amino acids, suggesting linkages in their production or use by reef biota.
Geographical Patterns in MTA Distribution
MTA exhibited changes in concentration by region, displaying a hump-like pattern with maximum concentrations in the center of the archipelago and lowest concentrations in off reef seawater. MTA is an intermediate metabolite that is formed when the S-5′-adenosyl-L-methionine (SAM) co-substrate undergoes various reactions within the cell (e.g., to form polyamines, ethylene precursors for plants, quorum sensing compounds, phytosiderophores, and betaine lipids) and accumulation of MTA within the cell can cause cell death (Miller et al., 2018). In freshwater systems or environments with a low supply of bioavailable sulfur, MTA can be scavenged for use of the sulfur atom (Miller et al., 2018). The role of extracellular MTA in marine environments is unknown, but there is evidence that intra- and extracellular MTA accumulation is linked with the synthesis of an acyl homoserine lactone (AHL) in the marine bacterial isolate Ruegeria pomeroyi DSS – 3 when it is grown with dimethylsulfoniopropionate (DMSP) as its sole carbon source (Johnson et al., 2016). While we cannot provide an explanation for the MTA pattern across the forereefs in this study, our finding that MTA exhibits this geographic distribution within extracellular reef seawater demonstrates that MTA could be an important metabolite on these reefs and potentially in other marine environments. As such, the production and loss of MTA should be investigated in reef seawater using a more focused experimental approach in order to understand the processes behind its interesting geographic distribution.
Depth-Related Patterns in Riboflavin and Xanthosine
We found interesting depth-related trends in the riboflavin concentration distributions; riboflavin concentrations were higher in reef depth compared to surface reef and off reef seawater. Incubation- and field-based experiments have demonstrated that corals (Dunlap and Susic, 1985) and sponges (Fiore et al., 2017) can be sources of riboflavin to the surrounding reef seawater. Within the cell, riboflavin (vitamin B2) is a required precursor for cofactors used in oxidative metabolism (Abbas and Sibirny, 2011; Gutiérrez-Preciado et al., 2015). Extracellularly, riboflavin can be used by bacteria as a quorum-sensing (Rajamani et al., 2008), electron-transfer (Marsili et al., 2008), and signal molecule in plant-microbe systems (Dakora et al., 2015). Riboflavin degrades via ultraviolet oxidation to lumichrome or lumiflavin (Dunlap and Susic, 1986), representing a potential abiotic loss of the molecule from shallow environments with high irradiance like the forereefs of JR. Our targeted data confirms that extracellular riboflavin is present on reefs and demonstrates that concentrations of riboflavin are elevated closer to the reef, indicating that the reef is a source of riboflavin. Additionally, riboflavin concentrations were lowest in off reef surface samples, providing further evidence that reefs may be a source of extracellular riboflavin to the surrounding seawater. We hypothesize that the difference in riboflavin concentrations between reef depth and surface seawater is due to both biological exudation by reef organisms at depth and enhanced ultraviolet degradation at the surface, but this hypothesis needs to be investigated further.
Concentrations of the nucleoside xanthosine were generally enriched in surface compared to reef depth seawater, although concentrations were patchy across reefs. Fiore et al. (2017) found that xanthosine was only detected in off reef surface seawater and not in sponge exhalant or inhalant seawater, suggesting that there were either non-sponge sources of xanthosine to off reef surface seawater, no sources of xanthosine to reef depth seawater or that xanthosine was rapidly consumed by sponges and their associated microbial communities (Fiore et al., 2017). In our study, we surveyed five reefs where xanthosine concentrations were detectable in reef depth seawater, providing evidence that the biological sources and/or consumption of xanthosine in reef depth seawater is patchy and could be governed by subtle changes in benthic composition or the distribution of its biological source. Future work should attempt to constrain the sources or sinks of xanthosine in reef seawater in light of these interesting results.
Future Directions
This work provides fundamental and baseline knowledge about the extracellular metabolite feature inventory across the protected JR reef system. However, we did not assess the potential variability of metabolite composition across individual reefs by collecting several discrete samples at different locations adjacent to the reef substrate. Future work should address this question by collecting more than three samples at each reef location and subjecting these samples to both targeted and untargeted metabolomics analyses to investigate whether specific benthic organisms like corals have distinct extracellular metabolite signatures. Additionally, the approaches introduced in this study can also be used to understand if metabolomes reflect the overall quality the reef. Lastly, continuing efforts to increase the retention of molecules from seawater during metabolite extraction will help improve our understanding of the extracellular metabolite composition of reef seawater. The PPL cartridge used for SPE has been reported to extract 43 – 62% of the DOC in seawater (Dittmar et al., 2008) and performs better than other extraction columns. However, this extraction method is biased against the smallest and most polar metabolites (Johnson et al., 2017) that could be important constituents of the metabolite pool on coral reefs as well as in other marine ecosystems.
Conclusion
Here we have provided the first, comprehensive survey of specific extracellular metabolites, their concentrations, and the overall extracellular metabolite feature composition within seawater from the protected Caribbean reef system of Jardines de la Reina, Cuba. This exploratory work investigates trends between reef metabolites and other bulk biogeochemical variables as well as reef composition and quality and lays the groundwork and the methodological framework for future investigations of extracellular reef metabolites. In this study, untargeted metabolite feature composition was fairly similar across the reefs and corresponded with similarity in the other measured environmental parameters. Untargeted features were significantly correlated with DOC, TOC, ammonium, dissolved nitrogen, and phosphate concentrations as well as Synechococcus and Prochlorococcus abundances. Riboflavin concentrations were significantly higher in reef depth seawater relative to surface seawater, whereas xanthosine concentrations generally followed the opposite trend. MTA concentrations were significantly higher in reef seawater from the central reefs, providing context for asking hypothesis-driven questions about the production and loss of MTA in reef seawater. This knowledge provides preliminary insight into the complexity of microbial and microorganismal interactions on coral reefs.
Data Availability Statement
The datasets presented in this study can be found in online repositories. The names of the repository/repositories and accession number(s) can be found below: https://www.ebi.ac.uk/metabolights/MTBLS1820; https://www.bco-dmo.org/project/746196.
Author Contributions
AA, LW, and EK designed the study. AA and MA obtained permits to complete the sample collections. LW, AA, and MA participated in field work and collected the samples. LW processed and prepared the samples for instrument runs. MK analyzed the samples on the instruments. KL and LW analyzed the data. LW wrote the manuscript. LW, AA, and EK discussed and edited the manuscript. All authors read the manuscript, contributed to revisions, and read and approved the final submitted version.
Funding
This work was supported by the Dalio Foundation (now “OceanX”) and the National Science Foundation (OCE-1736288) (award to Amy Apprill). The mass spectrometry samples were analyzed at the WHOI FT-MS Users’ Facility with instrumentation funded by the National Science Foundation (grant OCE-1058448 to EK and MK) and the Simons Foundation (Award ID #509042, EK). Lastly, a portion of the publication fees was supported by the Massachusetts Institute of Technology (MIT) Open Access Article Publication Subvention fund from MIT Libraries.
Conflict of Interest
The authors declare that the research was conducted in the absence of any commercial or financial relationships that could be construed as a potential conflict of interest.
Acknowledgments
We would like to thank the captain and crew of the M/V Alucia for providing an outstanding research platform and for supporting our research team, allowing us to access the protected reefs of JR. Research was conducted in JR, Cuba in accordance with the requirements of the Republic of Cuba, conducted under permit NV2370 and NV2568 issued by the Ministerio de Relaciones Exteriores (MINREX). This research was conducted under a memorandum of understanding between the National Center of Protected Areas (CNAP) of the Ministry of Science, Technology and Environment (CITMA) in Cuba and the Woods Hole Oceanographic Institution in the United States. We would like to thank Amanda Ramos, Fredy Hernandez Delgado, and Victor Manuel Ferrer Rodriguez for their assistance with benthic cover surveys and data integration on the cruise. We would like to thank Craig McLean for statistical guidance, Gretchen Swarr for solid-phase-extraction training, Cynthia Becker for analysis of chlorophyll samples, Joe Jennings for nutrient analysis, and Karen Selph for flow cytometric analysis. We would also like to thank our three reviewers for their suggestions and their time.
Supplementary Material
The Supplementary Material for this article can be found online at: https://www.frontiersin.org/articles/10.3389/fmars.2020.582161/full#supplementary-material
Footnotes
References
Abbas, C. A., and Sibirny, A. A. (2011). Genetic control of ciosynthesis and transport of riboflavin and flavin nucleotides and construction of robust biotechnological producers. Microbiol. Mol. Biol. Rev. 75, 321–360. doi: 10.1128/mmbr.00030-10
Apprill, A., and Rappé, M. S. (2011). Response of the microbial community to coral spawning in lagoon and reef flat environments of Hawaii, USA. Aquat. Microb. Ecol. 62, 251–266. doi: 10.3354/ame01471
Arriaza, L., Hernandez, M., Lorenzo, S., Olivera, J., Rodas, L., and Montesino, D. (2012). Modelación numérica de corrientes marinas alrededor del occidente de Cuba. Serie Oceanol. 10, 11–22.
Atkinson, M. J. (2011). “Biogeochemistry of nutrients,” in Coral Reefs: An Ecosystem in Transition, eds Z. Dubinsky and N. Stambler (Cham: Springer Science and Buisness Media), 199–206.
Azam, F., and Malfatti, F. (2007). Microbial structuring of marine ecosystems. Nat. Rev. Microbiol. 5, 782–791. doi: 10.1038/nrmicro1747
Chambers, M. C., MacLean, B., Burke, R., Amodei, D., Ruderman, D. L., Neumann, S., et al. (2012). A cross-platform toolkit for mass spectrometry and proteomics. Nat. Biotechnol. 30, 918–920. doi: 10.1038/nbt.2377
Dakora, F. D., Matiru, V. N., and Kanu, A. S. (2015). Rhizosphere ecology of lumichrome and riboflavin, two bacterial signal molecules eliciting developmental changes in plants. Front. Plant Sci. 6:700. doi: 10.3389/fpls.2015.00700
De Goeij, J. M., Van Oevelen, D., Vermeij, M. J. A., Osinga, R., Middelburg, J. J., De Goeij, A. F. P. M., et al. (2013). Surviving in a marine desert: the sponge loop retains resources within coral reefs. Science 342, 108–110. doi: 10.1126/science.1241981
Dittmar, T., Koch, B., Hertkorn, N., and Kattner, G. (2008). A simple and efficient method for the solid-phase extraction of dissolved organic matter (SPE-DOM) from seawater. Limnol. Oceanogr. Methods 6, 230–235. doi: 10.4319/lom.2008.6.230
Ducklow, H. W., and Mitchell, R. (1979). Composition of mucus released by coral reef coelenterates. Limnol. Oceanogr. 24, 706–714. doi: 10.4319/lo.1979.24.4.0706
Dunlap, W. C., and Susic, M. (1985). Determination of pteridines and flavins in seawater by reverse-phase, high-performance liquid chromatography with fluorometric detection. Mar. Chem. 17, 185–198. doi: 10.1016/0304-4203(85)90010-6
Dunlap, W. C., and Susic, M. (1986). Photochemical decomposition rates of pteridines and flavins in seawater exposed to surface solar radiation. Mar. Chem. 19, 99–107. doi: 10.1016/0304-4203(86)90042-3
Fiore, C. L., Freeman, C. J., and Kujawinski, E. B. (2017). Sponge exhalent seawater contains a unique chemical profile of dissolved organic matter. PeerJ 5:e2870. doi: 10.7717/peerj.2870
Fiore, C. L., Longnecker, K., Kido Soule, M. C., and Kujawinski, E. B. (2015). Release of ecologically relevant metabolites by the cyanobacterium Synechococcus elongatus CCMP 1631. Environ. Microbiol. 17, 3949–3963. doi: 10.1111/1462-2920.12899
Gutiérrez-Preciado, A., Torres, A. G., Merino, E., Bonomi, H. R., Goldbaum, F. A., and García-Angulo, V. A. (2015). Extensive identification of bacterial riboflavin transporters and their distribution across bacterial species. PLoS One 10:e0126124. doi: 10.1371/journal.pone.0126124
Haas, A. F., Fairoz, M. F. M., Kelly, L. W., Nelson, C. E., Dinsdale, E. A., Edwards, R. A., et al. (2016). Global microbialization of coral reefs. Nat. Microbiol. 1:16042. doi: 10.1038/nmicrobiol.2016.42
Haas, A. F., Nelson, C. E., Kelly, L. W., Carlson, C. A., Rohwer, F., Leichter, J. J., et al. (2011). Effects of coral reef benthic primary producers on dissolved organic carbon and microbial activity. PLoS One 6:e27973. doi: 10.1371/journal.pone.0027973
Haas, A. F., Nelson, C. E., Rohwer, F., Wegley-Kelly, L., Quistad, S. D., Carlson, C. A., et al. (2013). Influence of coral and algal exudates on microbially mediated reef metabolism. PeerJ 1:e108. doi: 10.7717/peerj.108
Hansell, D. A., and Carlson, C. A. (2001). Biogeochemistry of total organic carbon and nitrogen in the Sargasso Sea: control by convective overturn. Deep Sea Res. II Top. Stud. Oceanogr. 48, 1649–1667. doi: 10.1016/S0967-0645(00)00153-3
Hatcher, B. G. (1988). Coral reef primary productivity: a beggar’s banquet. Trends Ecol. Evol. 3, 106–111. doi: 10.1016/0169-5347(88)90117-6
Haug, K., Cochrane, K., Nainala, V. C., Williams, M., Chang, J., Jayaseelan, K. V., et al. (2020). MetaboLights: a resource evolving in response to the needs of its scientific community. Nucleic Acids Res. 48, D440–D444. doi: 10.1093/nar/gkz1019
Johnson, W. M., Kido Soule, M. C., and Kujawinski, E. B. (2017). Extraction efficiency and quantification of dissolved metabolites in targeted marine metabolomics. Limnol. Oceanogr. Methods 15, 417–428. doi: 10.1002/lom3.10181
Johnson, W. M., Soule, M. C. K., and Kujawinski, E. B. (2016). Evidence for quorum sensing and differential metabolite production by the marine heterotroph, Ruegeria pomeroyi, in response to DMSP. ISME J. 10, 2304–2316. doi: 10.1038/ismej.2016.6
Kelly, L. W., Williams, G. J., Barott, K. L., Carlson, C. A., Dinsdale, E. A., Edwards, R. A., et al. (2014). Local genomic adaptation of coral reef-associated microbiomes to gradients of natural variability and anthropogenic stressors. Proc. Natl. Acad. Sci. U.S.A. 111, 10227–10232. doi: 10.1073/pnas.1403319111
Kido Soule, M. C., Longnecker, K., Johnson, W. M., and Kujawinski, E. B. (2015). Environmental metabolomics: analytical strategies. Mar. Chem. 177, 374–387. doi: 10.1016/j.marchem.2015.06.029
Kujawinski, E. B. (2011). The impact of microbial metabolism on marine dissolved organic matter. Annu. Rev. Mar. Sci. 3, 567–599. doi: 10.1146/annurev-marine-120308-081003
Lê, S., Josse, J., and Husson, F. (2008). FactoMineR: an R package for multivariate analysis. J. Stat. Softw. 25, 1–18. doi: 10.18637/jss.v025.i01
Marsili, E., Baron, D. B., Shikhare, I. D., Coursolle, D., Gralnick, J. A., and Bond, D. R. (2008). Shewanella secretes flavins that mediate extracellular electron transfer. Proc. Natl. Acad. Sci. U.S.A. 105, 3968–3973. doi: 10.1073/pnas.0710525105
Melamud, E., Vastag, L., and Rabinowitz, J. D. (2010). Metabolomic analysis and visualization engine for LC - MS data. Anal. Chem. 82, 9818–9826. doi: 10.1021/ac1021166
Miller, A. R., North, J. A., Wildenthal, J. A., and Tabita, F. R. (2018). Two distinct aerobic methionine salvage pathways generate volatile methanethiol in Rhodopseudomonas palustris. mBio 9:e00407-18. doi: 10.1128/mBio.00407-18
Nelson, C. E., Goldberg, S. J., Wegley Kelly, L., Haas, A. F., Smith, J. E., Rohwer, F., et al. (2013). Coral and macroalgal exudates vary in neutral sugar composition and differentially enrich reef bacterioplankton lineages. ISME J. 7, 962–979. doi: 10.1038/ismej.2012.161
Obura, D. (2014). Coral Reef Monitoring Manual South-West Indian Ocean Islands. Mauritius: Indian Ocean Commission.
Ochsenkühn, M. A., Schmitt-Kopplin, P., Harir, M., and Amin, S. A. (2018). Coral metabolite gradients affect microbial community structures and act as a disease cue. Commun. Biol. 1, 1–10. doi: 10.1038/s42003-018-0189-1
Quinn, R. A., Vermeij, M. J. A., Hartmann, A. C., Galtier, I., Benler, S., Haas, A., et al. (2016). Metabolomics of reef benthic interactions reveals a bioactive lipid involved in coral defence. Proc. R. Soc. B Biol. Sci. 283:20160469.
Rajamani, S., Bauer, W. D., Robinson, J. B., Farrow, J. M., Pesci, E. C., Teplitski, M., et al. (2008). The vitamin riboflavin and its derivative lumichrome activate the LasR bacterial quorum-sensing receptor. Mol. Plant Microbe Interact. 21, 1184–1192. doi: 10.1094/MPMI-21-9-1184
Roberts, D. W. (2016). Package ‘labdsv’. Ordination and Multivariate Analysis for Ecology. Version 1.8-0 (2016-01-21). R Package Ver. 1.6–1.
Schlichter, D., and Liebezeit, G. (1991). The natural release of amino acids from the symbiotic coral Heteroxenia fuscescens (Ehrb.) as a function of photosynthesis. J. Exp. Mar. Biol. Ecol. 150, 83–90. doi: 10.1016/0022-0981(91)90107-8
Schlitzer, R. (2018). Ocean Data View. Available online at: http://odv.awi.de
Schrimpe-Rutledge, A. C., Codreanu, S. G., Sherrod, S. D., and McLean, J. A. (2016). Untargeted metabolomics strategies—challenges and emerging directions. J. Am. Soc. Mass Spectrom. 27, 1897–1905. doi: 10.1007/s13361-016-1469-y
Smith, C. A., Want, E. J., O’Maille, G., Abagyan, R., and Siuzdak, G. (2006). XCMS: processing mass spectrometry data for metabolite profiling using nonlinear peak alignment, matching, and identification. Anal. Chem. 78, 779–787. doi: 10.1021/ac051437y
Sogin, E. M., Putnam, H. M., Anderson, P. E., and Gates, R. D. (2016). Metabolomic signatures of increases in temperature and ocean acidification from the reef-building coral, Pocillopora damicornis. Metabolomics 12:71. doi: 10.1007/s11306-016-0987-8
Sogin, E. M., Putnam, H. M., Nelson, C. E., Anderson, P., and Gates, R. D. (2017). Correspondence of coral holobiont metabolome with symbiotic bacteria, archaea and Symbiodinium communities. Environ. Microbiol. Rep. 9, 310–315. doi: 10.1111/1758-2229.12541
Tanaka, Y., Miyajima, T., Umezawa, Y., Hayashibara, T., Ogawa, H., and Koike, I. (2009). Net release of dissolved organic matter by the scleractinian coral Acropora pulchra. J. Exp. Mar. Biol. Ecol. 377, 101–106. doi: 10.1016/j.jembe.2009.06.023
Vohsen, S. A., Fisher, C. R., and Baums, I. B. (2019). Metabolomic richness and fingerprints of deep-sea coral species and populations. Metabolomics 15:34. doi: 10.1007/s11306-019-1500-y
Wegley Kelly, L., Haas, A. F., and Nelson, C. E. (2018). Ecosystem microbiology of coral reefs: linking genomic, metabolomic, and biogeochemical dynamics from animal symbioses to reefscape processes. mSystems 3:e00162-17. doi: 10.1128/msystems.00162-17
Keywords: metabolomics, coral reefs, microorganisms, ecology, DOM cycling
Citation: Weber L, Armenteros M, Kido Soule M, Longnecker K, Kujawinski EB and Apprill A (2020) Extracellular Reef Metabolites Across the Protected Jardines de la Reina, Cuba Reef System. Front. Mar. Sci. 7:582161. doi: 10.3389/fmars.2020.582161
Received: 10 July 2020; Accepted: 13 November 2020;
Published: 14 December 2020.
Edited by:
E. Maggie Sogin, Max Planck Institute for Marine Microbiology (MPG), GermanyReviewed by:
Craig E. Nelson, University of Hawai’i at Mānoa, United StatesBiswapriya Biswavas Misra, Independent Researcher, Visakhapatnam, India
Gerrit Wienhausen, University of Oldenburg, Germany
Copyright © 2020 Weber, Armenteros, Kido Soule, Longnecker, Kujawinski and Apprill. This is an open-access article distributed under the terms of the Creative Commons Attribution License (CC BY). The use, distribution or reproduction in other forums is permitted, provided the original author(s) and the copyright owner(s) are credited and that the original publication in this journal is cited, in accordance with accepted academic practice. No use, distribution or reproduction is permitted which does not comply with these terms.
*Correspondence: Laura Weber, bGd3ZWJlcjkwQGdtYWlsLmNvbQ==; bHdlYmVyQHdob2kuZWR1; Amy Apprill, YWFwcHJpbGxAd2hvaS5lZHU=
†ORCID: Laura Weber, orcid.org/0000-0003-4957-2758; Maickel Armenteros, orcid.org/0000-0002-9736-9247; Elizabeth B. Kujawinski, orcid.org/0000-0001-8261-971X; Amy Apprill, orcid.org/0000-0002-4249-2977