 Pierluigi Carbonara1*
 Andrea Bellodi2,3
 Michele Palmisano1
 Antonello Mulas2,3
 Cristina Porcu2,3
 Walter Zupa1
 Marilena Donnaloia1
 Roberto Carlucci3,4
 Letizia Sion3,4
 Maria Cristina Follesa2,3
- 1COISPA Tecnologia & Ricerca, Stazione Sperimentale per lo Studio delle Risorse del Mare, Bari, Italy
- 2Department of Life and Environmental Science, University of Cagliari, Cagliari, Italy
- 3CoNISMa, Rome, Italy
- 4Department of Biology, University of Bari Aldo Moro, Bari, Italy
Raja clavata is the most widespread and landed skate species in the Mediterranean Basin. Despite its diffusion and economic importance, several aspects of its life history, such as age and growth, are poorly understood. This study evaluated the species’ growth in the South Adriatic Sea (Central Mediterranean Sea) and for the first time attempted an age validation through a tagging experiment. Thin sectioning of vertebral centra proved to be a more accurate preparation method in terms of age estimation precision and reproducibility than whole vertebral centrum staining (cobalt nitrate and ammonium sulfide technique). Marginal analysis showed a clear seasonal pattern, confirming the hypothesis of a single annulus deposition per year. A total of 291 vertebral centra were sampled and used for age estimation purposes. The oldest female was estimated to be 12 years old [total length (TL) = 89 cm], while the oldest male was aged 8 years (TL = 79.9 cm). Females were also found to be characterized by a slightly wider longevity range (ωL = 11.5, ωU = 16.8 years) than males (ωL = 7.8, ωU = 11.2 years). The von Bertalanffy growth curve fit the age and length data more accurately than the Gompertz and logistic models. Eighty-three thornback rays were tagged and released, of which two were recaptured. In both recaptured specimens, oxytetracycline marks were clearly visible. The band deposition after oxytetracycline injection and growth during the freedom period (about 1 year) were consistent with the age estimation method and criteria used and with the obtained growth results. Thus, the analysis of the vertebral centra extracted from the two recaptured specimens confirmed the hypothesis of the deposition of a single annulus per year and in general the age estimation criteria used in this study.
Introduction
Elasmobranchs represent a considerable proportion of bycatch landings in the Mediterranean Basin (Food and Agriculture Organization [FAO], 2016) accounting for 2% of small-scale fishery and 0.8% of bottom trawl total landings in the South Adriatic Sea (Maiorano et al., 2019). The thornback ray (Raja clavata Linnaeus, 1758) is the most important species in terms of landing (Food and Agriculture Organization [FAO], 2018; International Council for the Exploration of the Sea [ICES], 2018), accounting for up to 38% of the total elasmobranch landings in Italian fisheries (Food and Agriculture Organization [FAO], 2016). In the South Adriatic Sea, the thornback ray is caught mostly by bottom longlines targeting the European hake and bottom trawls with mixed target fishes (Merluccius merluccius and Mullus barbatus) and crustacean decapods (Parapaeneus longirostris and Nehrops norvegicus) (Maiorano et al., 2019). Living in a wide bathymetric range (Krstulović-Šifner et al., 2008; Marongiu et al., 2017; Follesa et al., 2019b), the thornback ray is accessible to different fishing métiers (International Council for the Exploration of the Sea [ICES], 2018). Moreover, like most elasmobranchs, R. clavata exhibits a k-selected strategy, which is characterized by slow growth rate, long life spans, late-age sexual maturity, and low fecundity (Gallagher et al., 2005; Whittamore and McCarthy, 2005; Kadri et al., 2014), which makes the species particularly vulnerable to fishing exploitation. Indeed, several studies have shown that k-selected species with low intrinsic population regeneration potential are the most impacted by harvesting (Stevens et al., 2000; Ferretti et al., 2010; Dulvy et al., 2014).
The thornback ray has been listed as near threatened by the International Union for Conservation of Nature (Ellis et al., 2016); therefore, sustainable management of this resource seems to be necessary. However, stock status assessment, which is essential for developing management plans for cartilaginous species, and particularly for R. clavata, requires basic knowledge of their life history traits, such as growth rate, maturity, and fecundity, as fundamental data input. Most stock assessment models, especially the analytical ones, require robust data on the demographic structure of the exploited stocks. One of the first steps for running such models is the conversion of catches by length into catches by age. This routine is performed by means of an age slicing procedure that uses parameters from the von Bertalanffy growth function (VBGF) or age-length keys. For this reason, inappropriate or uncertain growth parameters or age-length keys for converting a size distribution into an age structure can lead to unreliable scientific advice (Scientific, Technical and Economic Committee for Fisheries [STECF], 2017). The evaluation of the stock status is in general a difficult work, in particular this is true for the elasmobranchs fish due to the lack and/or poor quality of the biological information for these species (Musick and Bonfil, 2005; Ellis et al., 2008; Cortés et al., 2015). An age overestimation could lead to an erroneous stock assessment, constructing a misleading scenario of a population composed of older individuals than in reality, which is thus seemingly affected by lower fishing mortality than in the real world. In the opposite scenario, a population would be considered younger, with an overestimation of its fishing mortality (Campana, 2001). Moreover, age errors also impact on the estimation of natural mortality and maturity-at-age data and consequently the recruitment strength and spawning stock biomass (Maunder and Piner, 2015; Olsen et al., 2011). Ultimately, growth and age data affect mostly the short-term predictions of the stock status and the related management measures (Punt et al., 2008; Eero et al., 2015; Hüssy et al., 2016).
Validated age and growth parameters of R. clavata are still not available in many areas, especially in the Mediterranean Basin (Kadri et al., 2014). Some studies have performed age analyses typically using hard structures such as vertebral centra and dermal denticles (Serra-Pereira et al., 2008; Campana, 2014; Kadri et al., 2014; Bellodi et al., 2019). In both cases, age estimations are based on the annual patterns of the growth area in the form of a succession of opaque and transparent zones (Panfili et al., 2002; Campana, 2014; Carbonara and Follesa, 2019). One of the main problems of this kind of analysis is the presence of false rings and/or multiple bands on the hard structure, which are particularly pronounced in older specimens (Campana, 2014; Bellodi et al., 2019), reducing both the precision and the accuracy of the age data (International Council for the Exploration of the Sea [ICES], 2011), thus negatively affecting the stock exploitation analysis (Scientific, Technical and Economic Committee for Fisheries [STECF], 2017). In these contexts, it is highly recommended that age validation analysis be performed (International Council for the Exploration of the Sea [ICES], 2011, 2013). In terms of effectiveness, direct age validation studies, such as mark-recapture experiments with chemically marked otoliths, present a high level of reliability (Campana, 2001; International Council for the Exploration of the Sea [ICES], 2011, 2020). However, mark-recapture surveys are generally expensive and time-consuming, and the success of tagging programs largely depends on tagging-related mortality, tag loss, and tag detection and reporting rates (Björnsson et al., 2011). Moreover, the injected chemical may not always leave a clear mark on the hard structure. This limitation is amplified in elasmobranchs because the chemical marker binds to calcium in bone structures, which is typically low in sharks and rays (Campana, 2014). However, structures such as caudal thorns, spines, neural arches, and vertebral centra contain systematic deposits of calcium phosphate and have often been proven reliable for age estimations in the context of mark-recapture experiments (Cailliet et al., 2006; McFarlane and King, 2006). Thus, when chemically marked individuals are recaptured, the number of opaque/transparent areas formed within the hard structure between release and recapture can be directly related to the time of release (Cailliet and Goldman, 2004; McQueen et al., 2018). Semi-direct validation studies such as marginal analyses represent the most commonly applied methodology for elasmobranch species (Cailliet and Goldman, 2004) and especially R. clavata (Gallagher et al., 2005; Kadri et al., 2014). Although this approach does not validate the absolute age, it is a useful tool for understanding the yearly deposition pattern of bands laid down on the hard structure (Campana, 2001).
This study combined a mark-recapture experiment and marginal analysis as a validation study to provide reliable age and growth data for the thornback ray in the South Adriatic Sea (Central Mediterranean). The research effort was focused on a thorough investigation of the complex life history dynamics of this valuable but vulnerable bycatch species, aiming to present solid data that can contribute to more effective management plans.
Materials and Methods
In the period 2014–2018, thornback ray specimens were collected through commercial landings and discard monitoring (Data Collection Framework; EU Reg. 1004/2017) in fishing ports along the Italian South Adriatic coasts [Geographical Sub-Area (GSA) 18; GSA sensu Food and Agriculture Organization of the UN–General Fisheries Commission for the Mediterranean; Figure 1]. Additional samples were obtained from the Mediterranean International Trawl Survey (MEDITS; 2014–2018) (Spedicato et al., 2019) in the South Adriatic Sea, including Albanian and Montenegrin waters (GSA 18). The following data were collected from the collected specimens: total length (TL; in centimeters) to the nearest 0.1 cm, total weight (TW) to the nearest 0.1 g, sex, and maturity stages (AAVV, 2017; Follesa et al., 2019a).
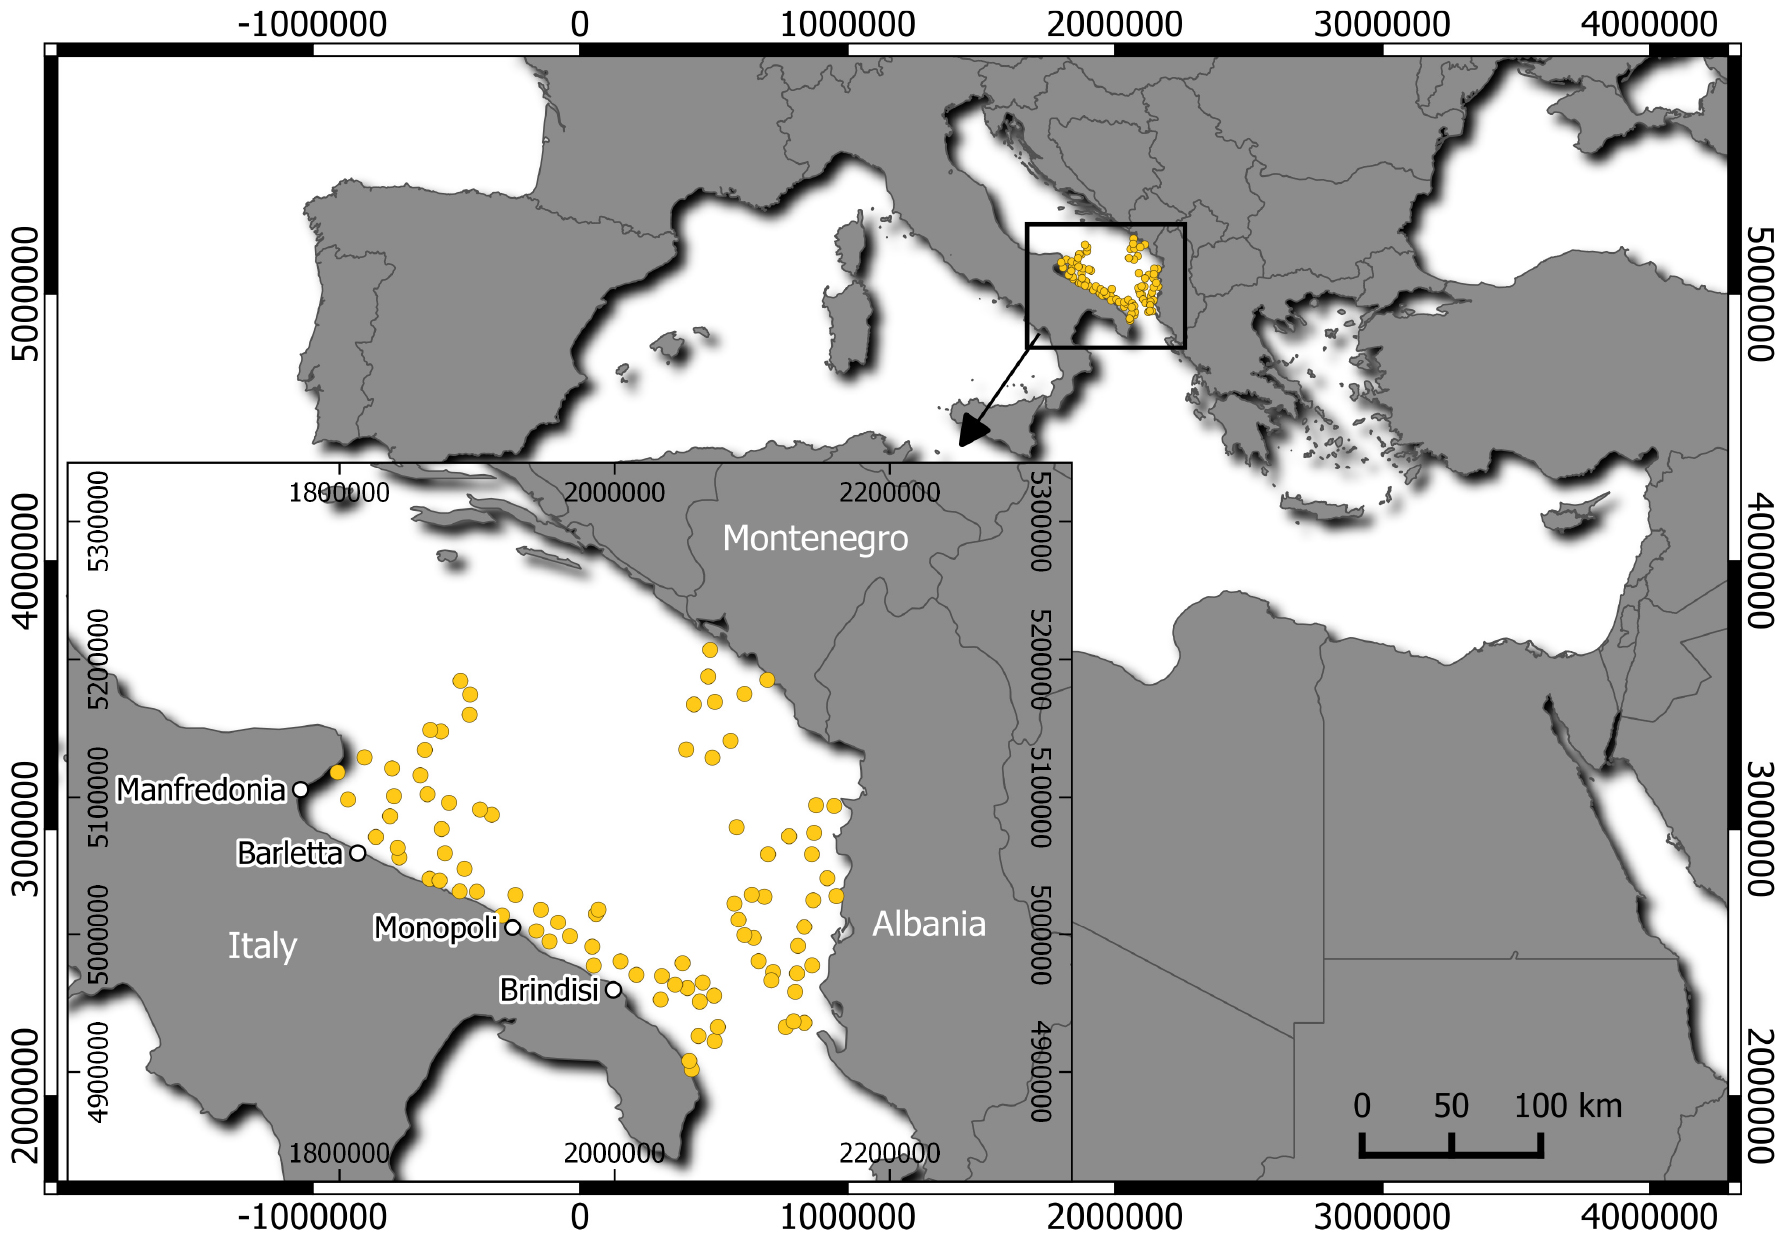
Figure 1. Geographic allocation of the hauls conducted during the MEDITS trawl surveys in GSA 18 (South Adriatic Sea), indicated by yellow points. The main fishing ports along the South Adriatic coasts of Italy (inset) are indicated by white points.
A total of 8 specimens, ranging from 13.6 to 28.3 cm TL and 11.4–110.6 g TW, were sampled from the monitoring of discard, 274 specimens, ranging from 26.7 to 89 cm TL and 90–4180.9 g TW, from the monitoring of landings and 9 specimens, ranging from 32 to 76.6 cm TL and 745.3 and 2940.8 g TW, from the MEDITS survey, respectively.
Age Analysis
From each specimen, about 10 vertebrae were extracted from the thoracic area (immediately posterior to the scapular origin of the vertebral column), where the vertebral centra are bigger and thus easier to analyze (Campana, 2014; Bellodi et al., 2017, 2019). Before age analysis, the vertebrae were stored at −20°C. Subsequently, the vertebral centra were defrosted, soft tissue (muscle, skin, and neural material) was removed by immersion in a 5% sodium hypochlorite solution (Goldman, 2006; Bellodi et al., 2017; Porcu et al., 2020), and the neural and hematic arches were removed with a scalpel. The centra were then measured considering the vertebral length (VL) and vertebral diameter (VD) to the nearest 0.1 mm (Goldman, 2006; Figure 2A) and embedded in epoxy resin (Prochima E-30).
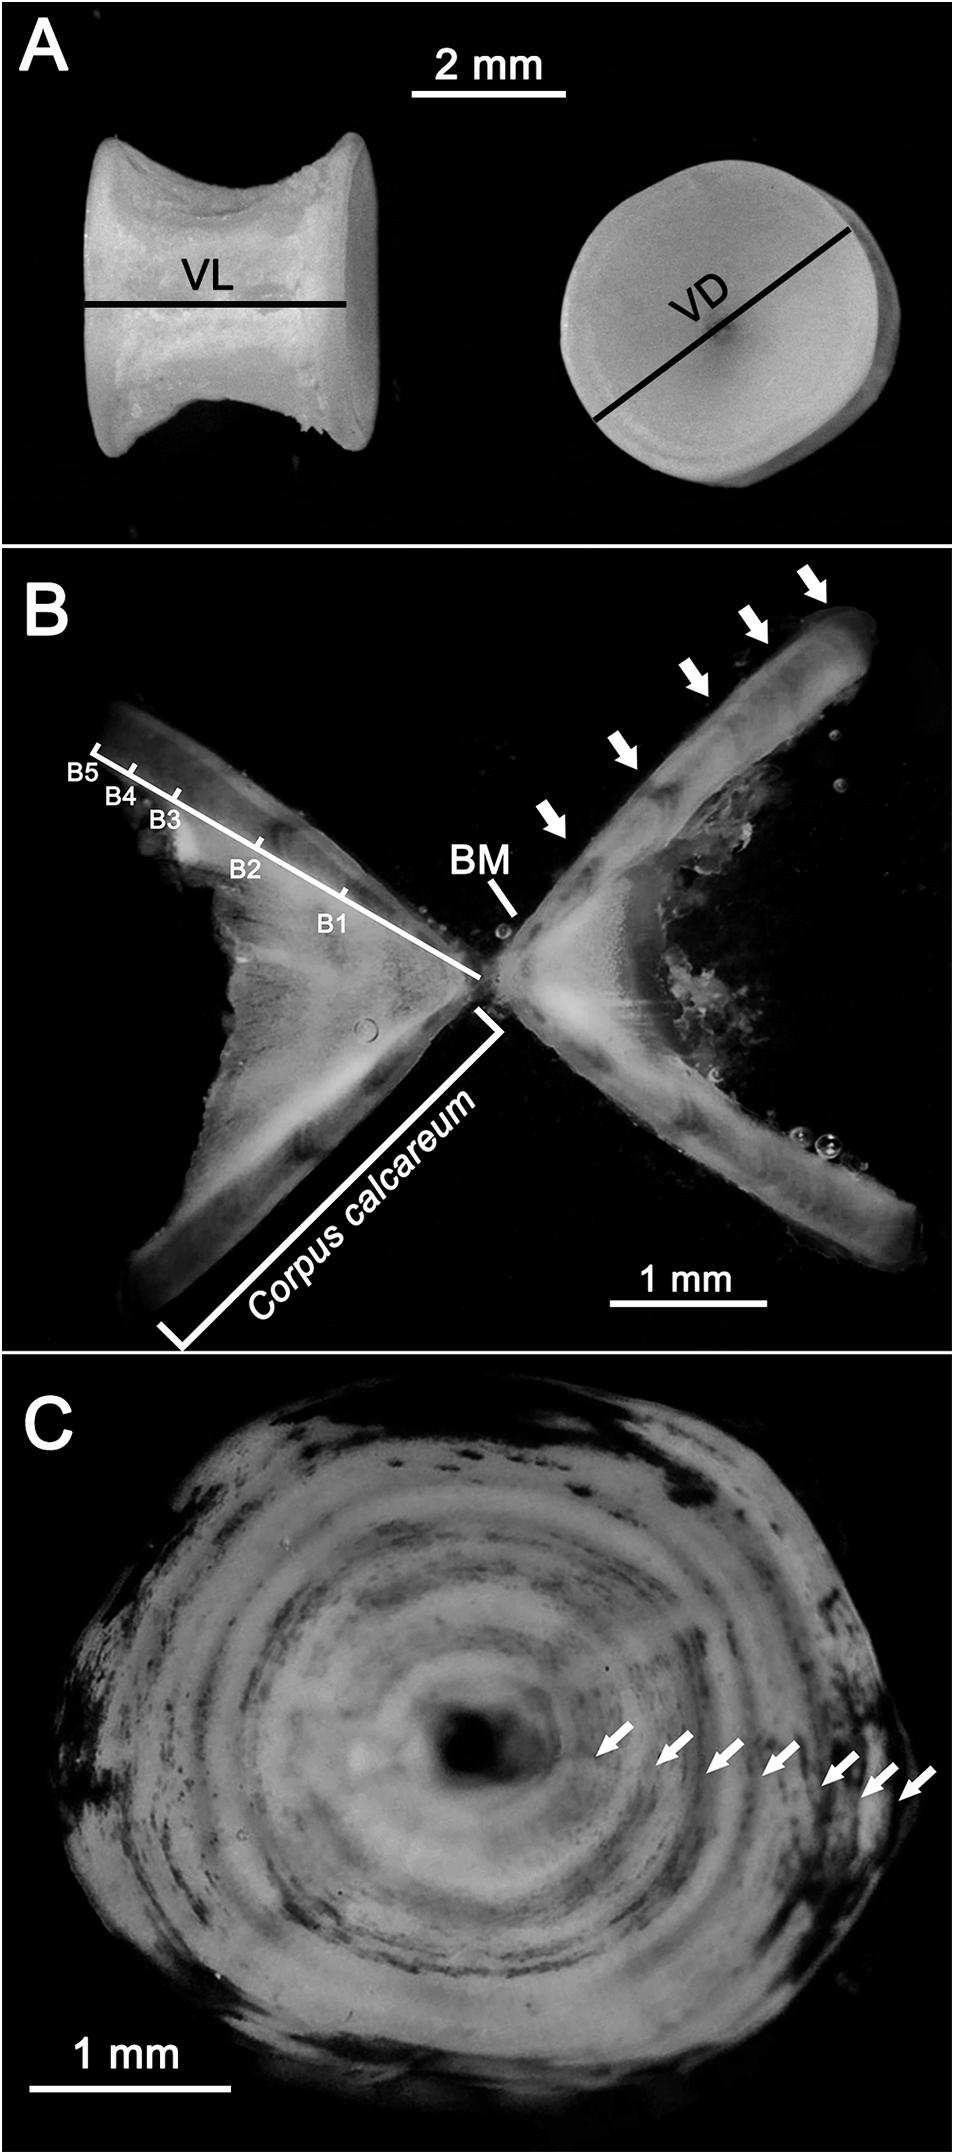
Figure 2. Vertebral centra after cleaning. The vertebral length (VL) and vertebral diameter (VD) are indicated (A). Thin section of a vertebral centrum (B) of a female R. clavata (TL = 66.4 cm) caught in February. The corpus calcareum and band length (B1, B2 … Bn) measurements, the birthmark (BM), and the transparent bands (white arrows) are shown. Whole vertebral centrum (C) of a female specimen (caught in March; TL = 73.7 cm) stained by the cobalt nitrate and ammonium sulfide technique. The transparent bands are indicated by white arrows.
Thin sections were cut with a cutting machine (IsoMet 1000) with a circular diamond blade (Bellodi et al., 2019; Porcu et al., 2020). The sections had an initial width of 0.5 mm. If necessary, they were thinned to increase their readability by grinding with sandpaper (grit 800). The final width ranged between 0.3 and 0.5 mm. The sections were then immersed in a clarification medium (sea water) and examined under a microscope with reflected light against a black background. Under these conditions, the opaque and transparent bands appeared white and dark, respectively (Figure 2B). The length of the corpus calcareum (CCL) and the distance from the vertebra center to each transparent band (B1, B2,…., Bn) were measured (Figure 2B). The birthmark (BM) in each vertebral centrum was identified as the first clear mark corresponding to a change of angle in the CCL shape (Sulikowski et al., 2003; Figure 2B).
Additionally, a subsample of 120 whole vertebral centra were stained using the cobalt nitrate and ammonium sulfide technique (Hoenig and Brown, 1988; Goldman, 2006) and observed with reflected light under a stereomicroscope (Leica S9D). Using this technique, the opaque winter bands appeared as darker circles (Figure 2C).
The age and growth estimations were performed by band count, with one transparent band followed by an opaque one assumed to be an annulus (Sulikowski et al., 2003). An age was assigned to each vertebral section according to the age estimation scheme proposed by Carbonara and Follesa (2019) with a yearly resolution, accepting the birthday as January 1. Each section’s age was independently estimated by two experienced readers blinded to the specimen’s sex and size. Only concordant readings were included in the age analysis. The transparent band counts started from the first band pair that was easily recognizable after the birthmark (BM) (Figure 2B). The transparent bands in the vertebral sections were counted using a microscope (Nikon Eclipse E400). The aging accuracy and the inter-reader agreement of the two preparation methods (thin sectioning and whole vertebral centrum staining) were evaluated by the coefficient of variation (CV) and percentage of agreement (PA) (Eltink, 2000; International Council for the Exploration of the Sea [ICES], 2011) as follows:
where R is the number of times each fish’s age is estimated, Xij is the ith age estimation of the jth fish, Xj is the mean age calculated for the jth fish, and ndiff is the difference in age estimation between the two readers.
Moreover, the index of average percent error (IAPE) (Beamish and Fournier, 1981) was calculated:
where N is the number of samples whose age was estimated, R is the number of readings, Xij is the ith age estimation of the jth fish, and Xj is the average age calculated for the jth fish.
The lower (ωL) and upper (ωU) species longevity ranges were calculated following Barnett et al. (2013). The lower range was obtained as
while the upper range was calculated as
where Tmax is the maximum observed age, E is the IAPE value calculated using the empirical data of the greatest 20% of the age groups observed, and c is an arbitrary constant (c = 1.4) to account for the possibility that the absolute maximum age was not observed.
Marginal Analysis
The pattern of annulus deposition on the vertebrae was analyzed by a semi-direct qualitative marginal analysis approach (Campana, 2001, 2014). The marginal analysis considered the monthly evolution of the edge types (transparent or opaque) of the hard structures. The two edge types were defined when over 75% of the corpus calcareum margin appeared transparent or opaque. Vertebral sections in which about 50% of the edge was opaque or transparent were not included in the analysis (Carbonara et al., 2018).
Back-Calculation
On the basis of the obtained relationships between the TL and morphological measurements of vertebral centra (VL, VD, and CCL), the fish lengths at which different transparent bands were deposited were calculated using the back-calculation method. In particular, the linear-modified Dahl-Lea method (Francis, 1990) was applied, previously used in other Rajidae species (using thin vertebral sections) with reasonable biological accuracy for growth modeling (Sulikowski et al., 2007). The following formula was used:
where a and b are the linear fit parameter estimates, Li is the length at ring i, Lc is the length at capture, CCc is the corpus calcareum at capture, and CCi is the corpus calcareum at ring i.
Tagging Experiment
During seven fishing trips (bottom longlines targeting European hakes) between 2014 and 2015, 132 specimens of R. clavata were captured, of which 83 (42 males and 41 females) were tagged externally with spaghetti tags and marked chemically with an intramuscular injection of 25 mg of oxytetracycline per kilogram of body weight (Tanaka et al., 1990; Gelsleichter et al., 1998; Figure 3). The condition of caught thornback rays was classified using the scale presented in Table 1 (Benoît et al., 2010; Dapp et al., 2016). To maximize the chance of survival and recapture, only thornback rays classified as condition 1 (Righton et al., 2006) were tagged. The tagging procedures were performed immediately after capture and lasted 4 min on average. The specimens were measured (TL and TW), tagged with the spaghetti tag, injected with oxytetracycline, and released back into the sea. In recaptured specimens, thin vertebral centrum sections were observed under ultraviolet light to identify the oxytetracycline ring.
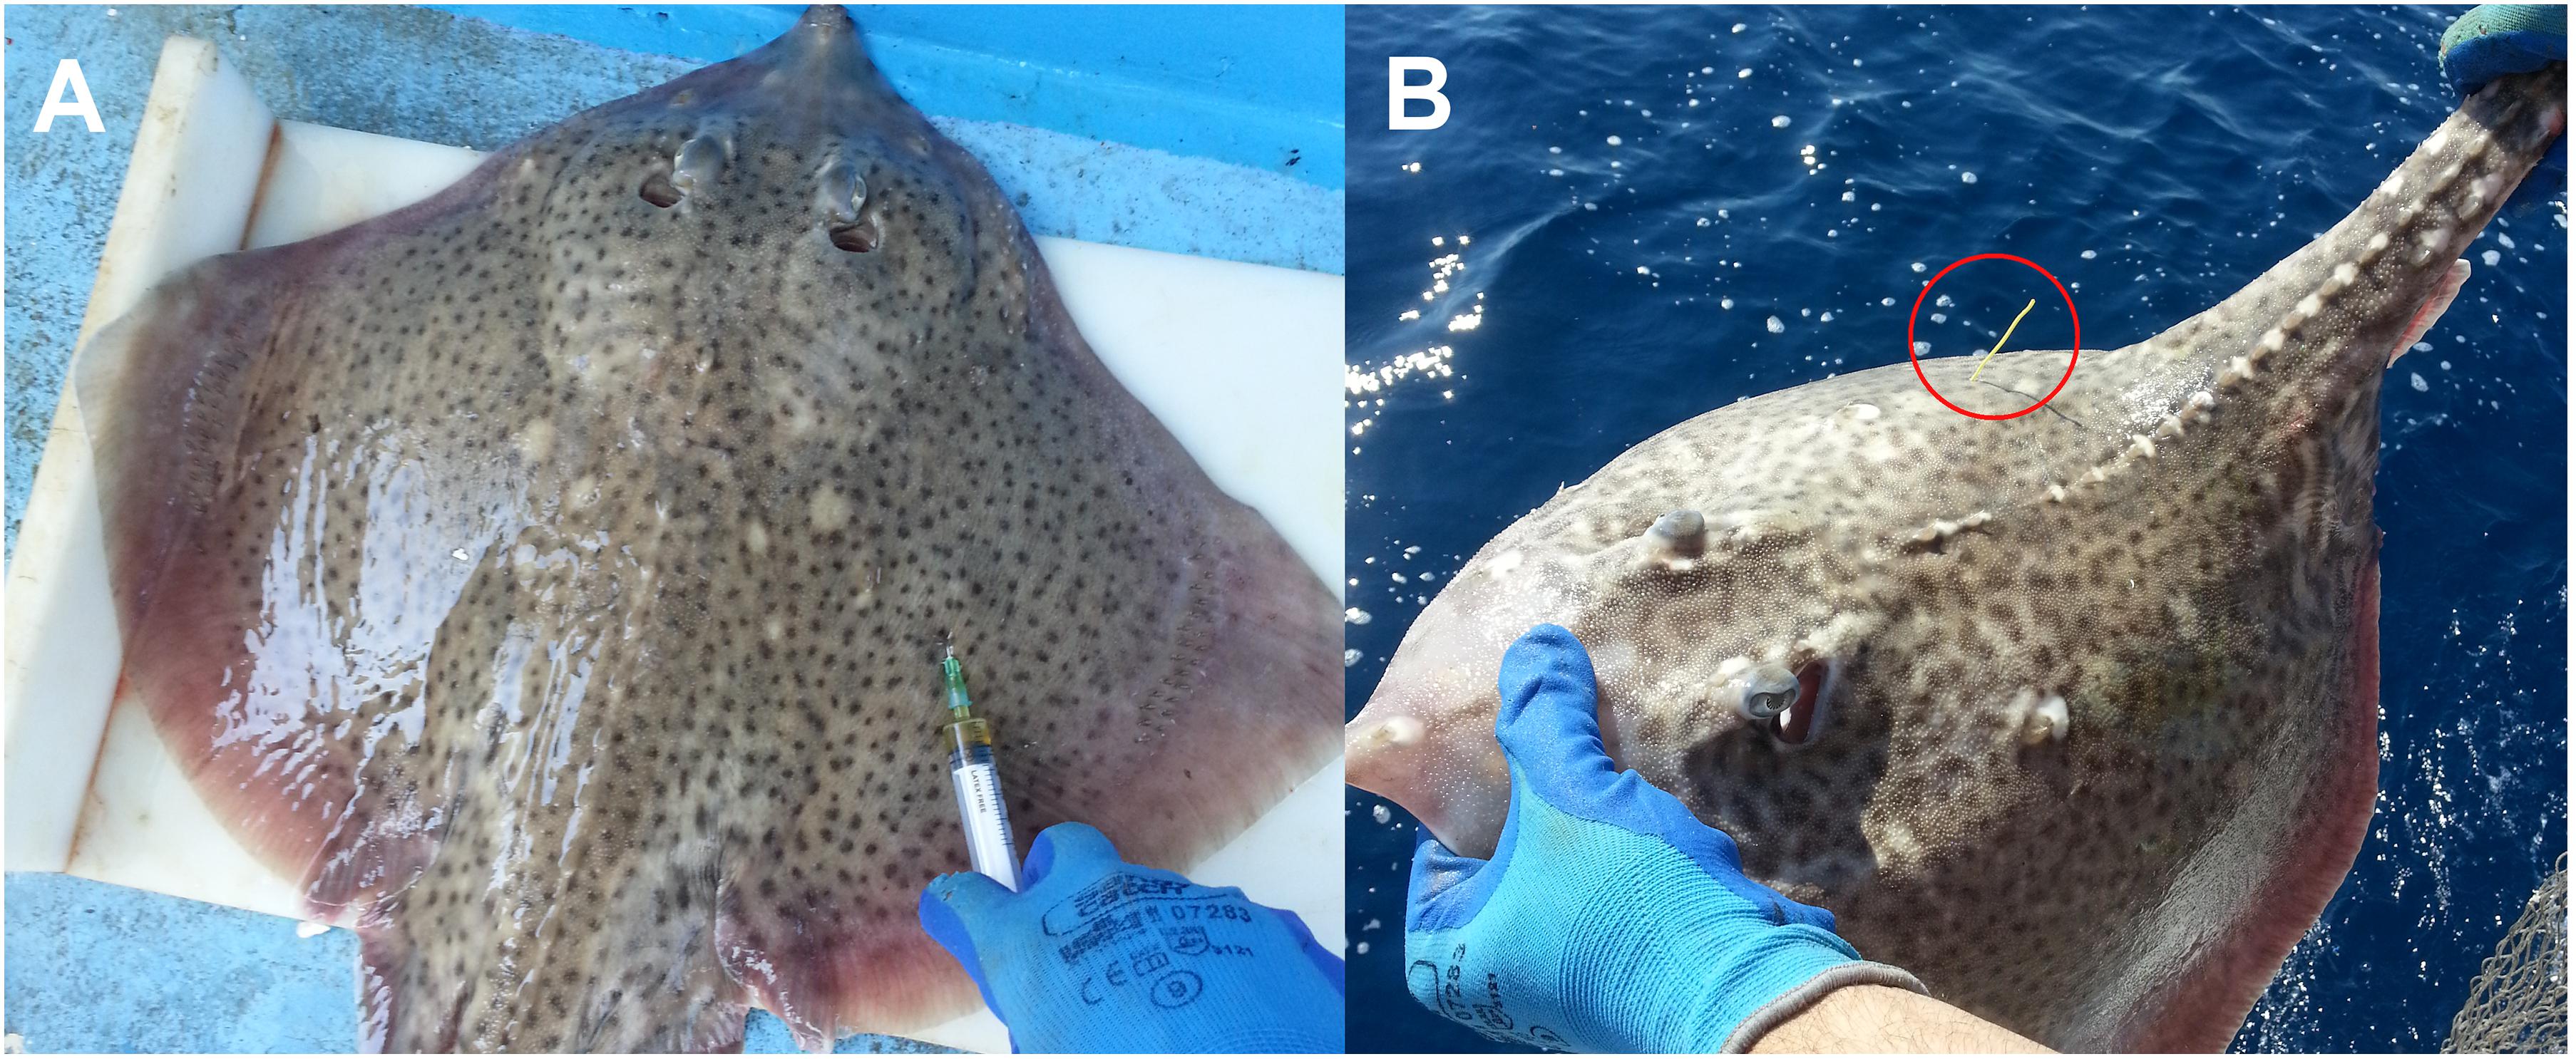
Figure 3. Tagging with a spaghetti tag and oxytetracycline injection. The applied spaghetti tag is marked with a red circle. Tagging with a spaghetti tag and oxytetracycline injection. (A) Tagging with a spaghetti tag and oxytetracycline. (B) The applied spaghetti tag (marked with a red circle).
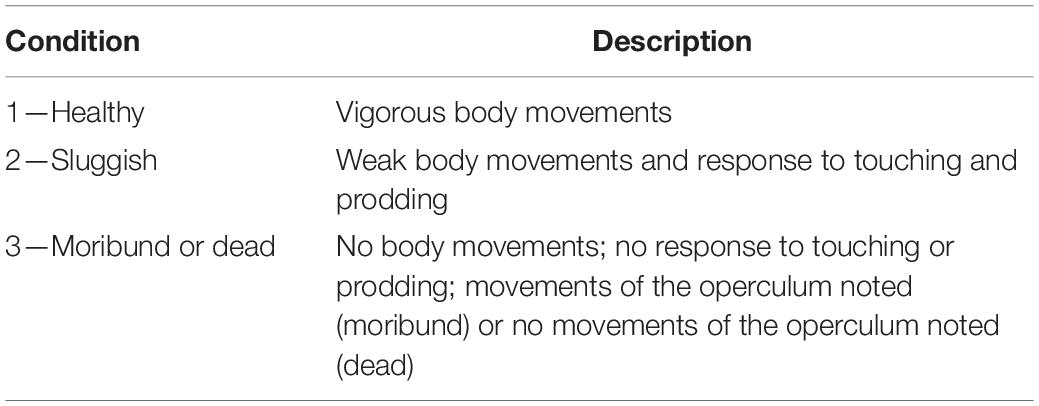
Table 1. Classification of the condition of captured specimens (Benoît et al., 2010; Dapp et al., 2016).
Statistical Analysis
To analyze the growth pattern, four different growth models were tested: the three-parameter von Bertalanffy growth function (3VBGF; von Bertalanffy, 1938) L=L∞(1−e−K(t−t0)), the two-parameter von Bertalanffy growth function (2VBGF; Fabens, 1965) L=L∞−(L∞-β)e[−(Kt)], the Gompertz sigmoid curve (Winsor, 1932) TL=L∞ee−K(t−I), and the logistic curve (Richards, 1959) TL=L∞/1 + e−K(t−I), where L∞is the species’ theoretical maximum length, K is the growth coefficient, t is the observed age, t0 is the hypothetical age of an individual with TL = 0, β is , L0 is the individual’s length at birth, and I is the age at the curve inflection point. Each growth model’s fitness for the collected age data was evaluated by the Akaike information criterion (AIC; Akaike, 1974; Haddor, 2001).
The linear relationships between the TL and the measurements of the vertebral centra were tested using analysis of variance for regression. The obtained growth curves were compared using Chen’s test (Chen et al., 1992).
Results
Age Analysis
A total of 291 R. clavata (168 females and 123 males) were included in the age analysis. The TL ranged between 14.1 and 89.0 cm in females and between 13.6 and 79.9 cm in males (Figure 4). The age ranged between 0 and 12 years in females and between 0 and 8 years in males (Figure 5). The IAPE values calculated from the age data were 3.42% for females and 3.87% for males.
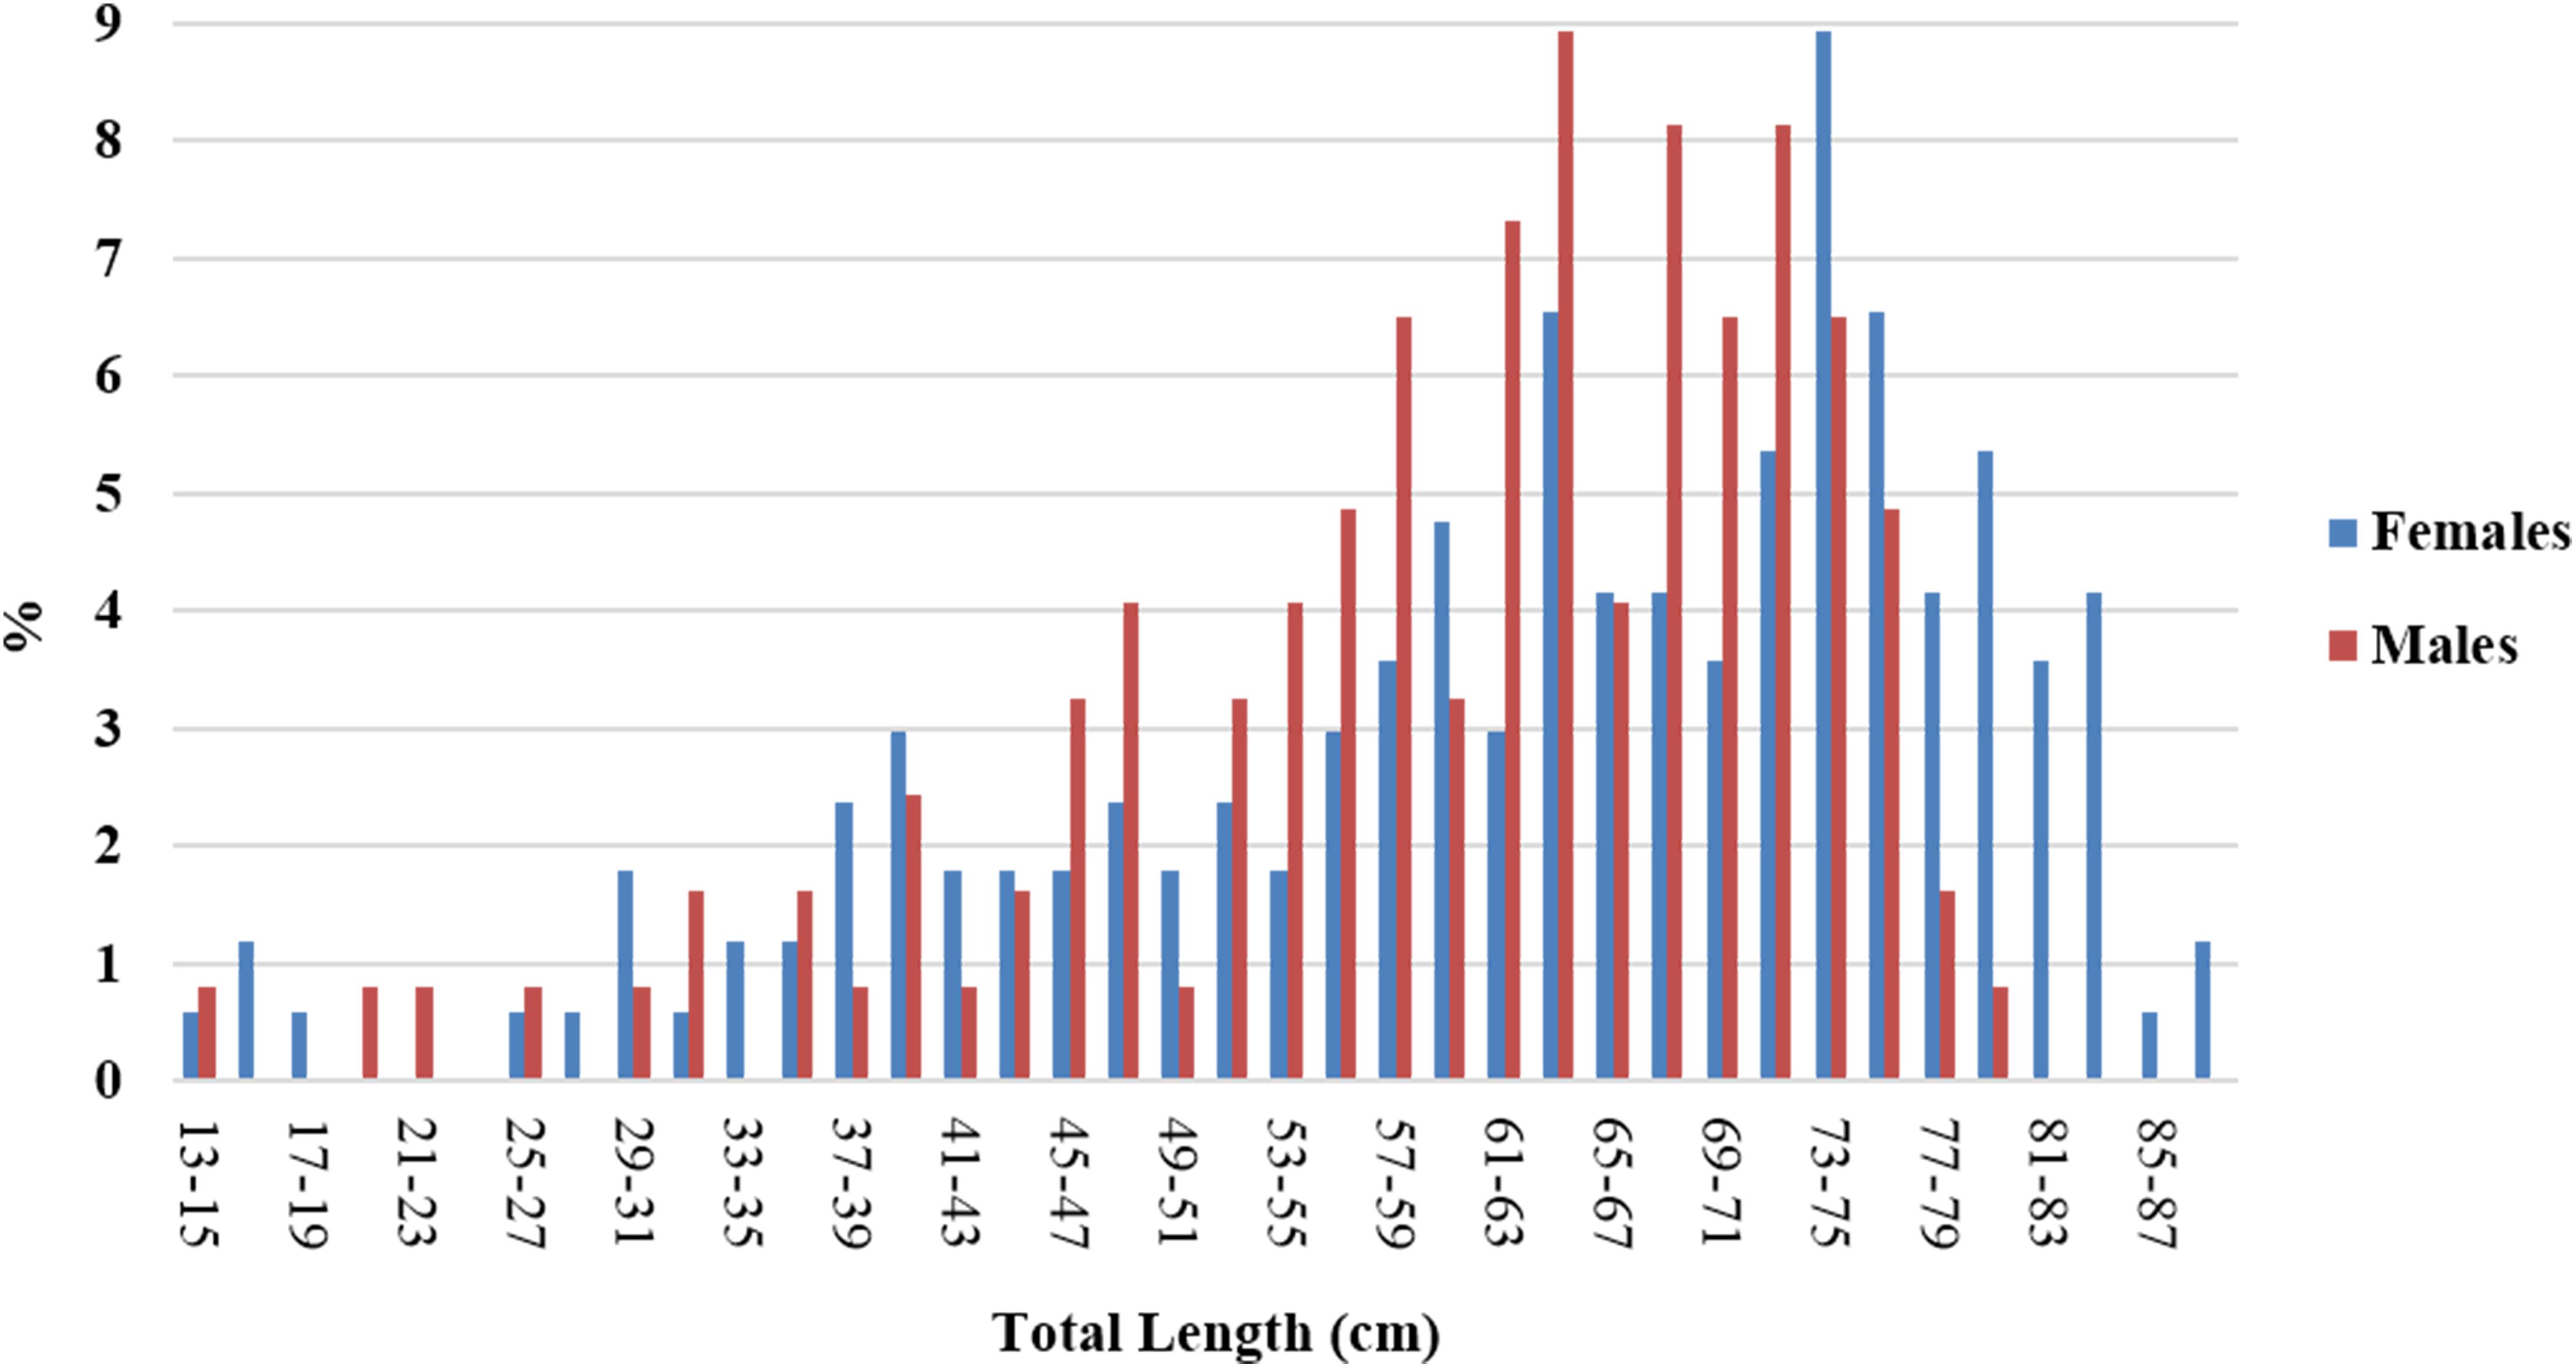
Figure 4. Length frequency distribution of the R. clavata specimens by sex, used for the age analysis.
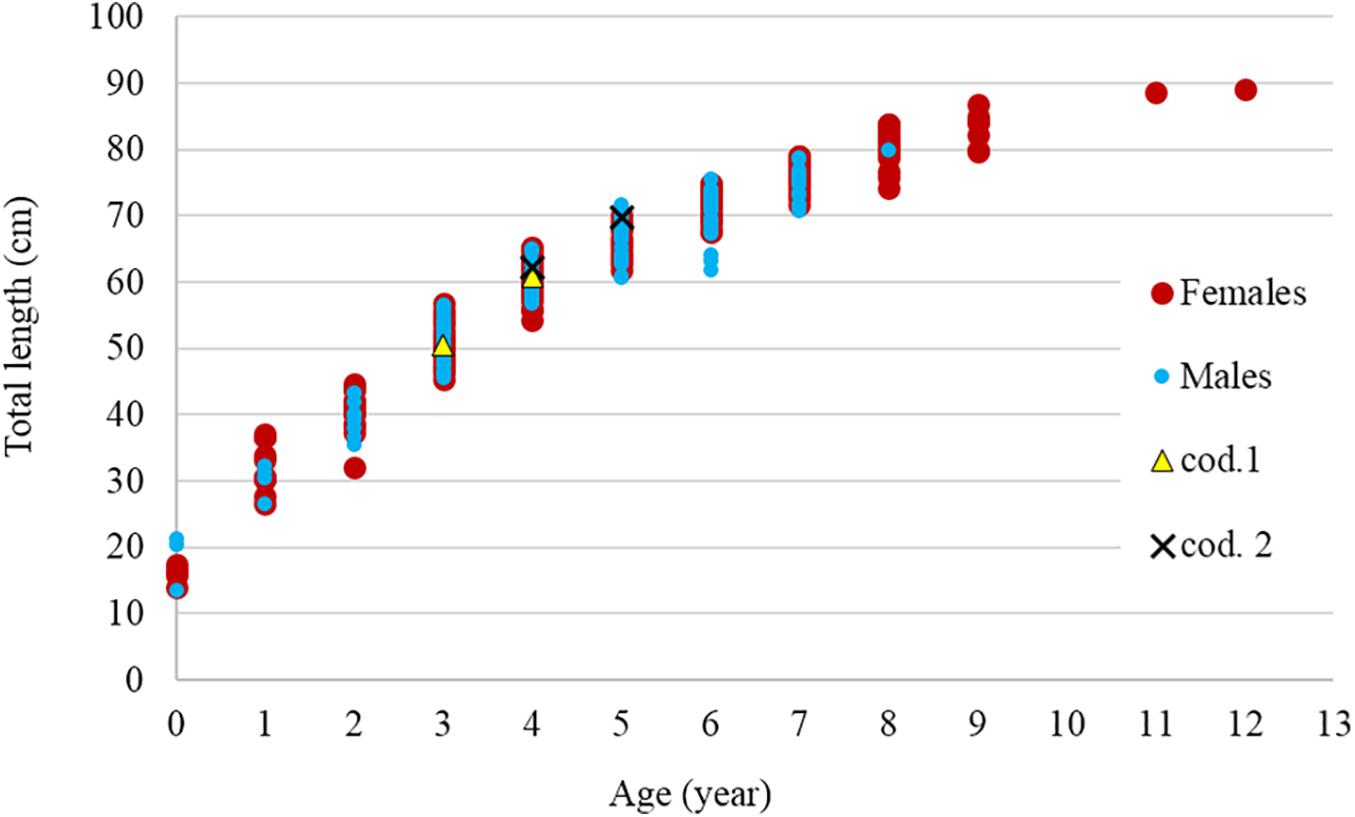
Figure 5. Relationship between age and total length by sex. The two recaptured specimens (cod. 1 and cod. 2) are also indicated.
Figure 6 shows a comparison between the reading results of the two preparation methods (thin sectioning and silver nitrate staining) in terms of PA and CV (accuracy). The overall PA values were 90.7% for thin sectioning and 71.8% for silver nitrate staining. The CV values were 4.5 and 14.1%, respectively.
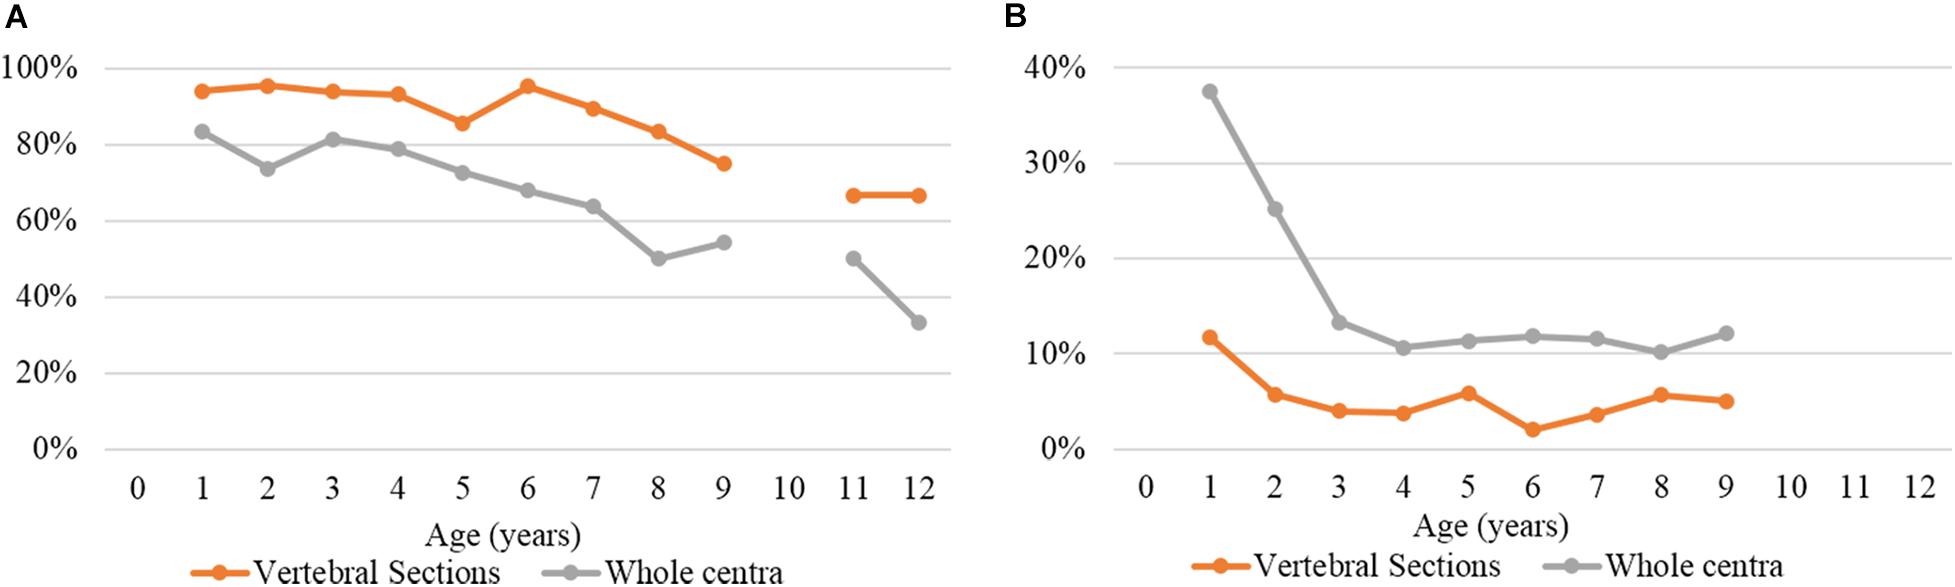
Figure 6. (A) Percentage of agreement and (B) coefficient of variation by age group and preparation method.
Marginal Analysis
The monthly margin evolution showed a prevalence of opaque edges (>50%) between June and October and a prevalence of transparent edges from December to May (Figure 7). This pattern of annulus deposition revealed that one transparent band is followed by one opaque band yearly.
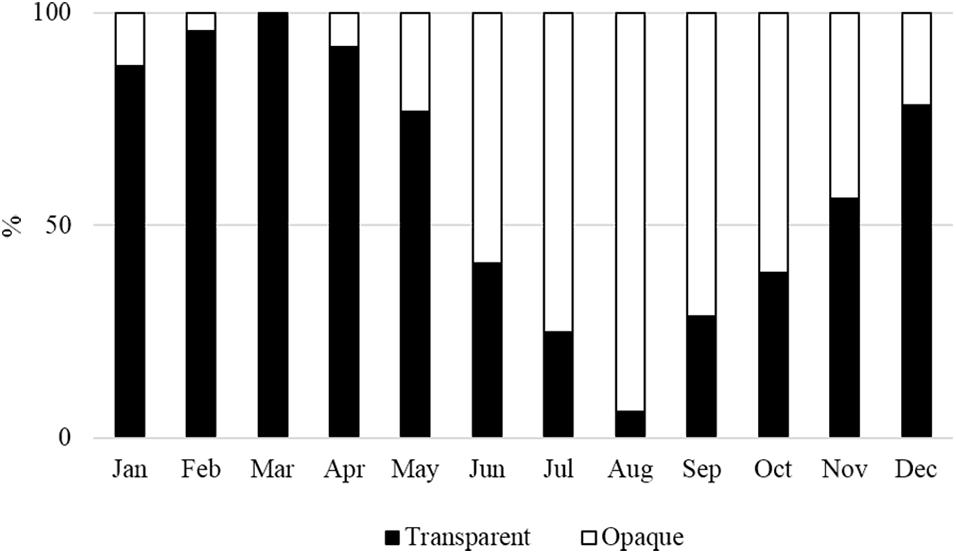
Figure 7. Percentages of monthly opaque and transparent margins of thin vertebral sections.
The growth model parameters for females, males, and the sexes combined with their respective AIC values are displayed in Table 2. The analysis showed that 3VBGF was the model that best described the age-at-length data. The statistical comparison between females and males in the 3VBGF model showed no significant differences (Chen’s test, Fobs > Fcrit).
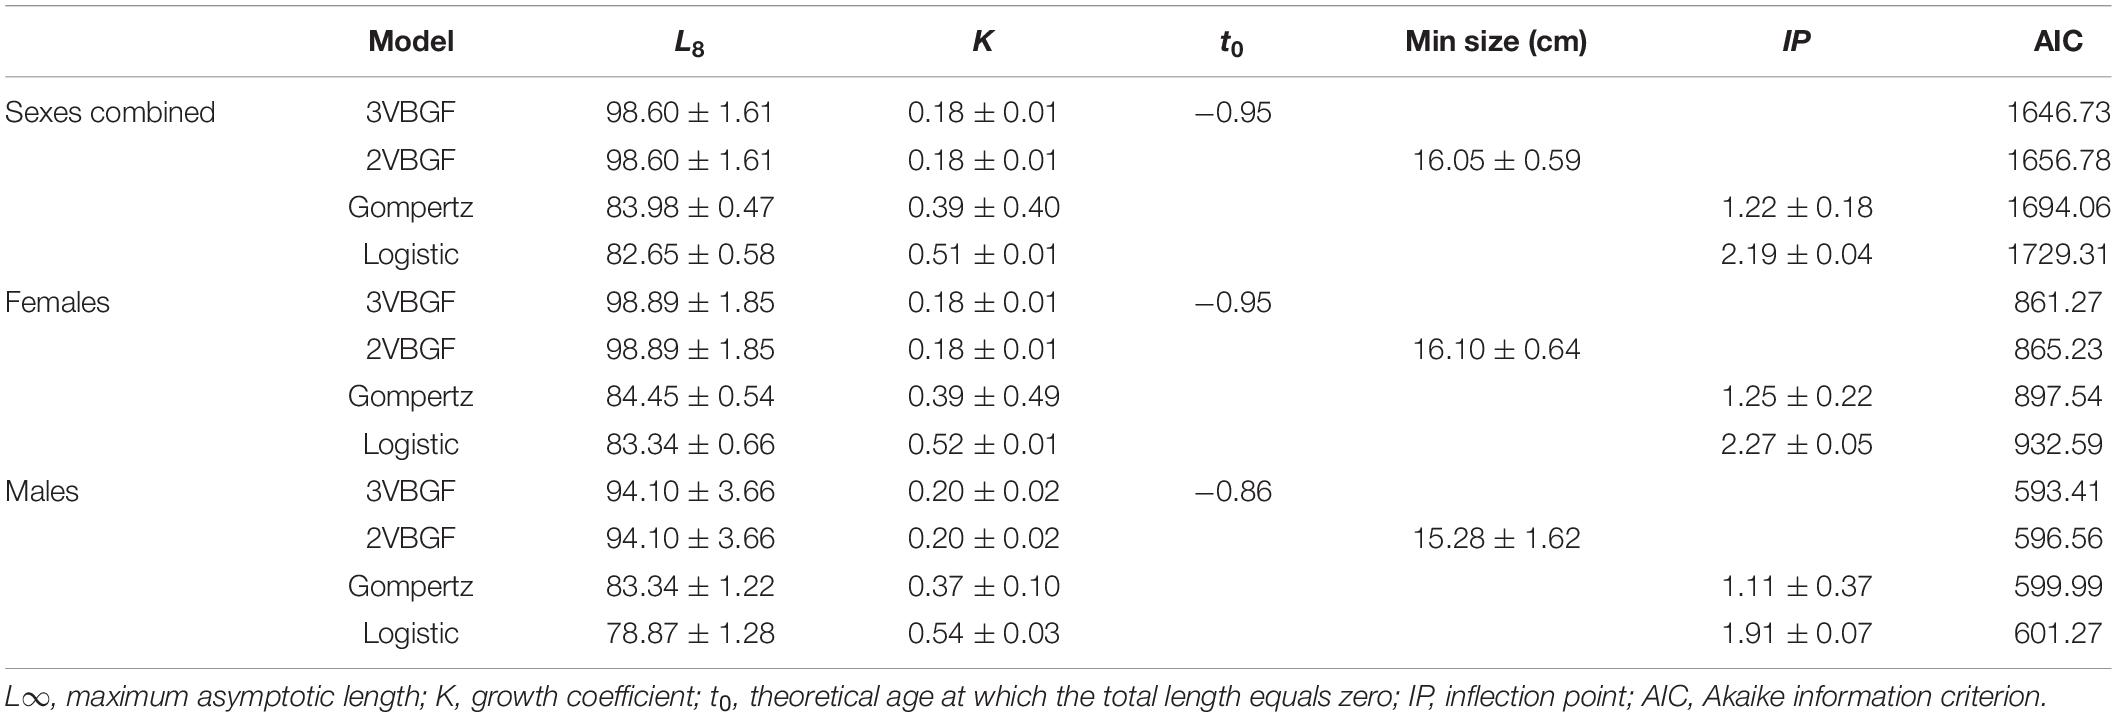
Table 2. Growth parameters (mean ± standard error) calculated for the four tested models for females, males, and the sexes combined.
To estimate the longevity range, the IAPE values of the greatest 20% of the age groups were used for both females and males (3.42 and 3.87%, respectively). The longevity in females ranged between 11.5 (ωL) and 16.8 (ωU) years with a Tmax of 12 years, whereas the longevity in males ranged between 7.8 (ωL) and 11.2 (ωU) years with a Tmax of 8 years.
Back-Calculation
The centrum morphometric descriptors (VL, VD, and CCL) and fish TL were significantly linearly correlated in both sexes (linear regression p < 0.05; Figure 8). A comparison between the sexes showed no significant differences (ANCOVA p > 0.05).
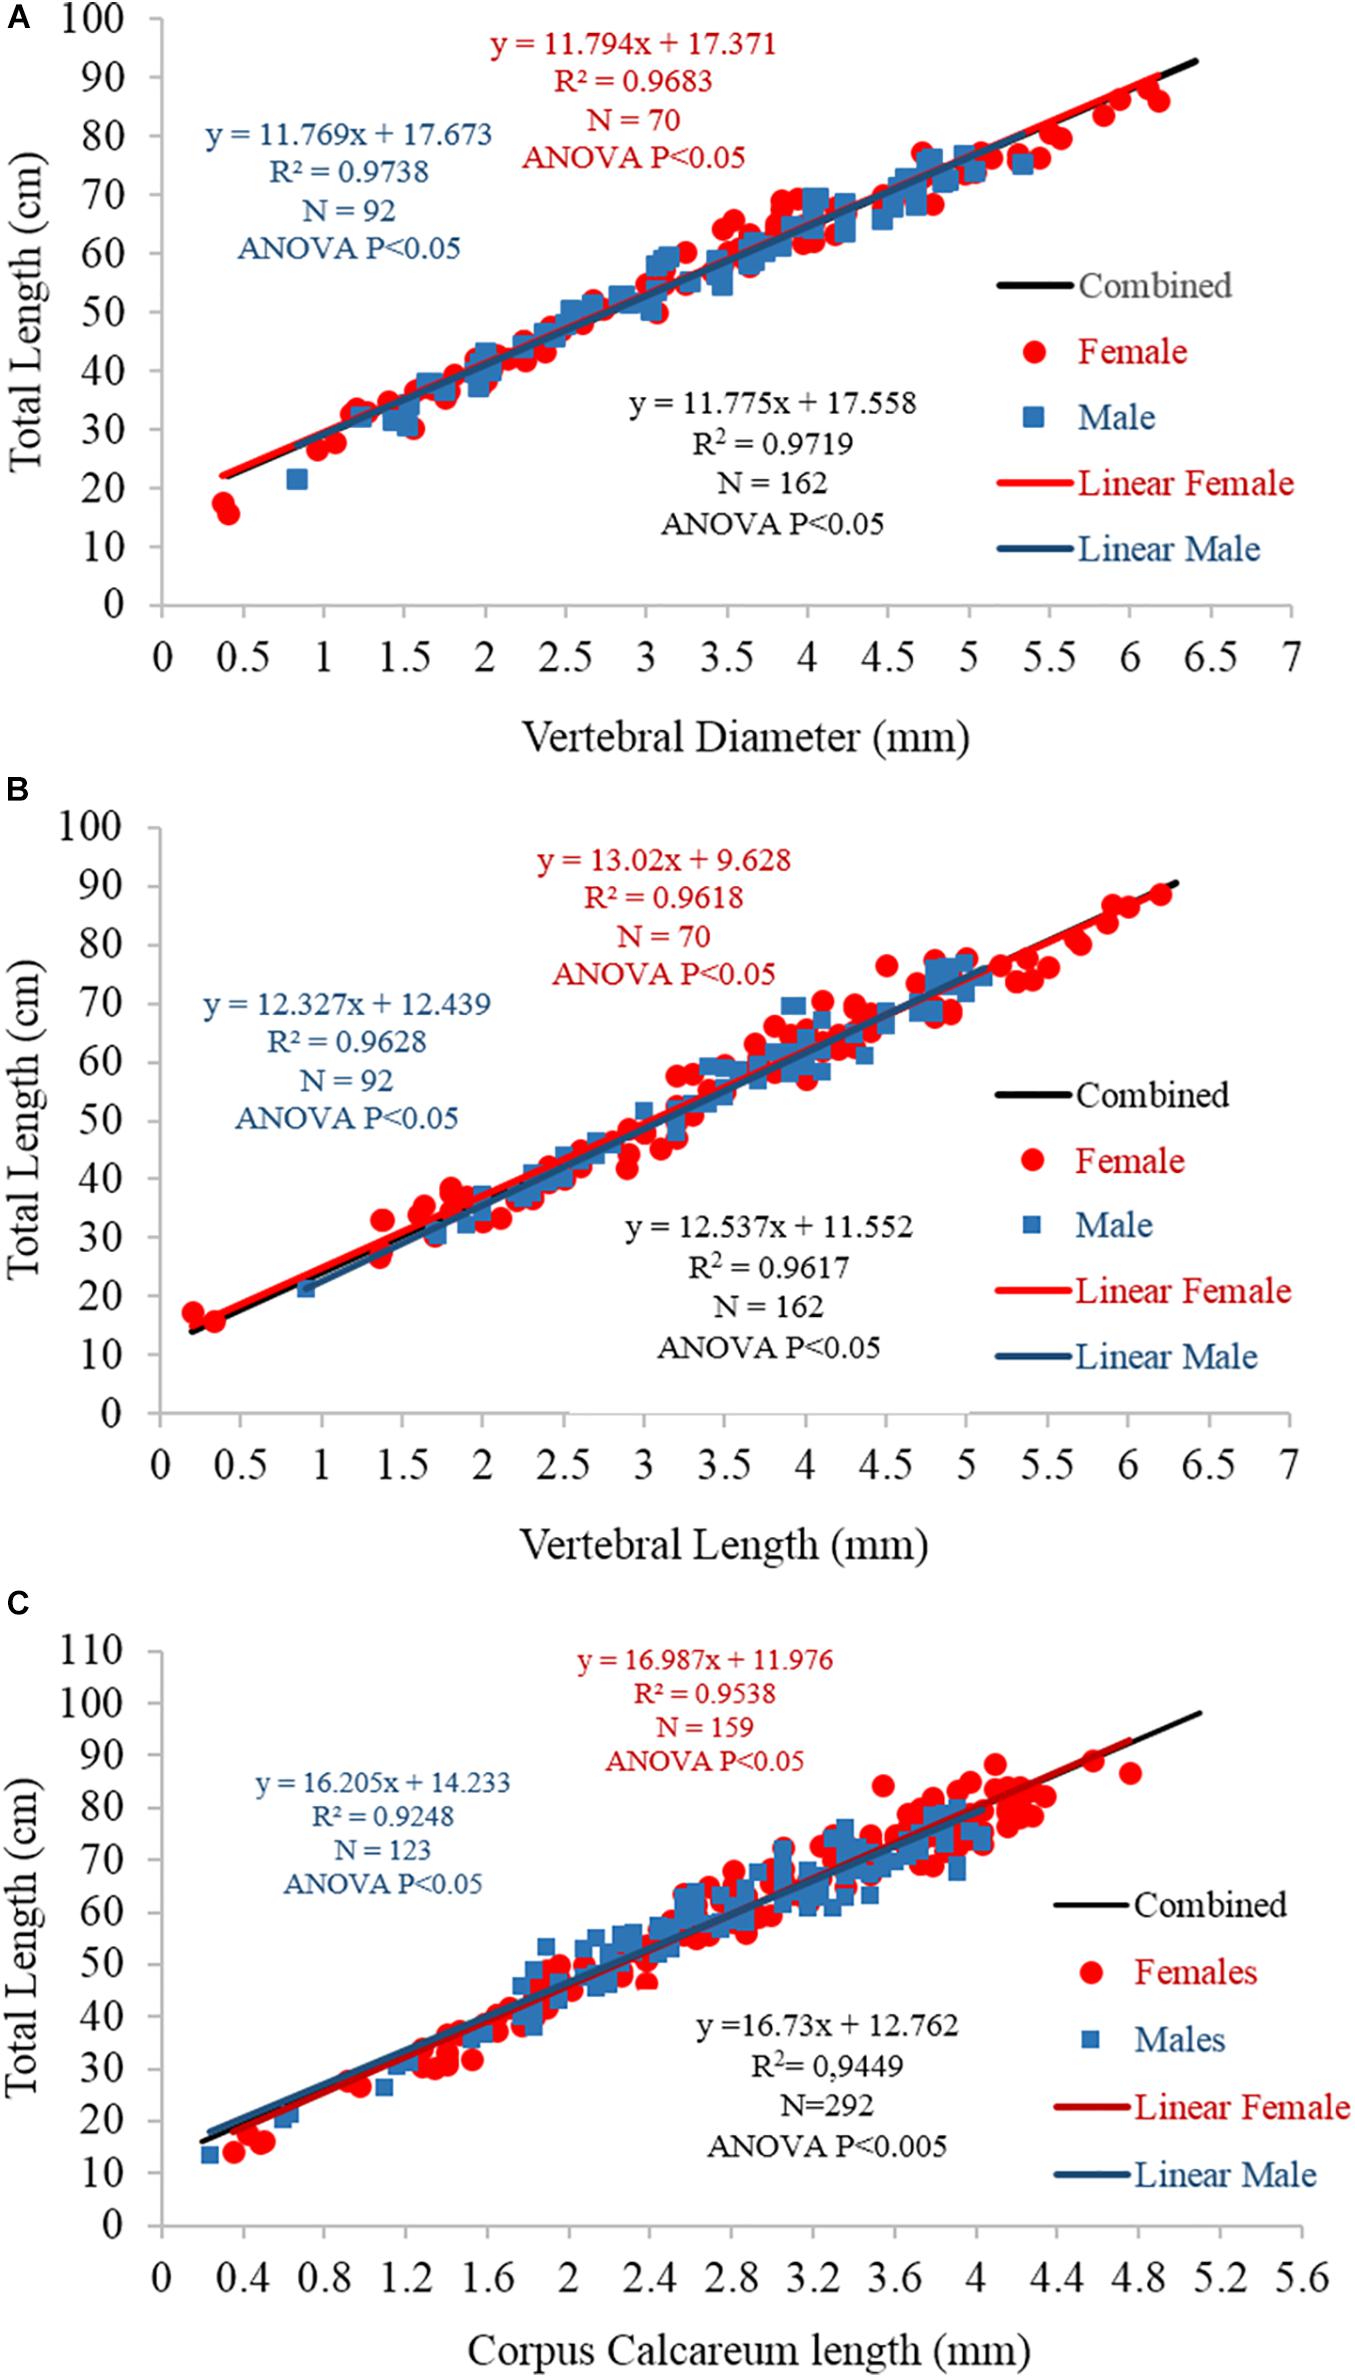
Figure 8. Linear regression between fish total length and (A) vertebral diameter, (B) vertebral length, and (C) corpus calcareum length for females (blue), males (red), and the sexes combined (black). The equations, R2-values, numbers of specimens, and statistical significance results are also reported.
For the back-calculation analysis, the linear relationship between the TL and CCL of the combined sexes was used, as the difference between females and males was statistically insignificant. The results of the back-calculation analysis are reported in Table 3. Given that the transparent bands were laid down during the winter (see section “Marginal Analysis”), the first transparent band was considered age 1, the second age 2, and so on. In this way, the age/length data were achieved, and the growth parameters obtained by back-calculation were as follows: L8 = 105.38 cm; K = 0.14 years–1; t0 = 1.65 years. The comparison between 3VBGF from back-calculation and the readers’ age estimates of the sexes combined showed no statistically significant differences (Chen’s test, Fobs > Fcrit).
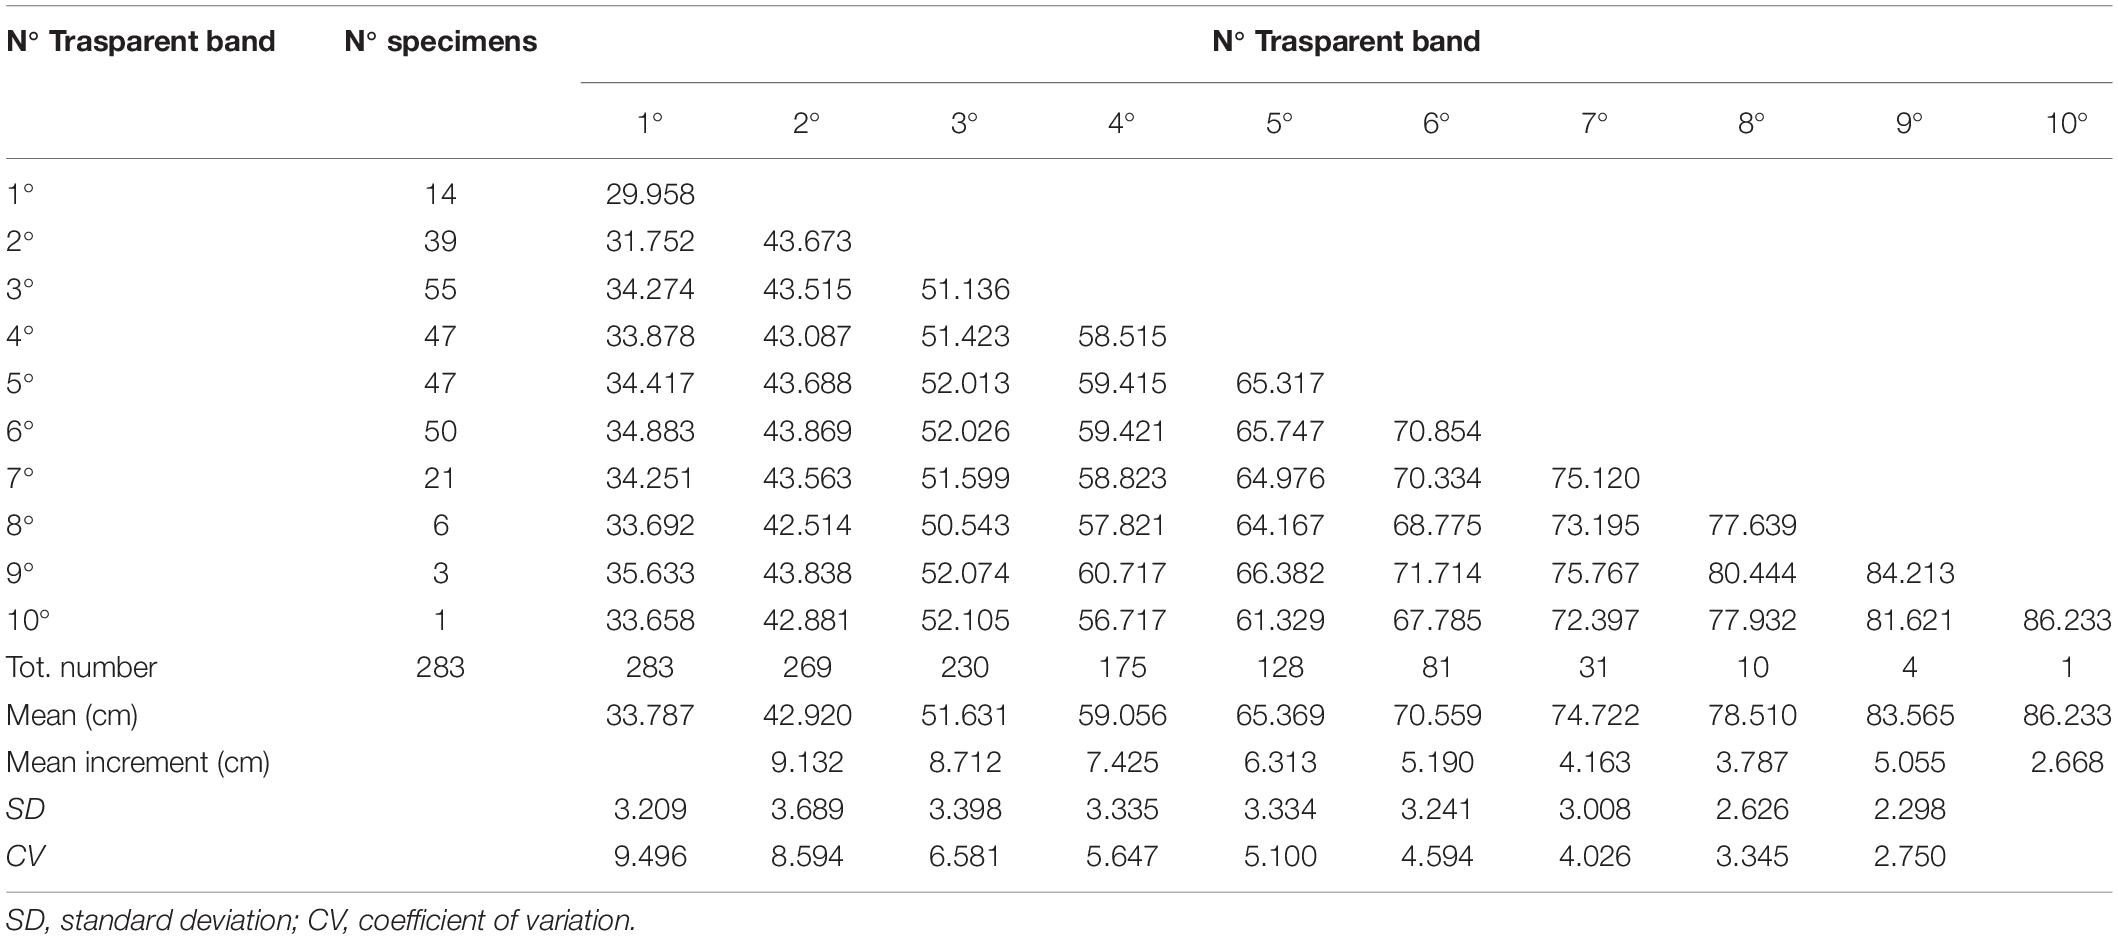
Table 3. Mean back-calculated length for each transparent band.
Tagging Experiment
A total of 132 R. clavata specimens were collected at depths ranging between 106 and 385 m during seven longline fishing trips (Figure 9). Most (63%) specimens were classified as condition 1, while conditions 2 and 3 accounted for 26 and 11%, respectively. In total, 41 females and 42 males were marked with spaghetti tags and oxytetracycline injections (cf. Figure 3). The TL of the tagged specimens ranged between 43.4 and 86.7 cm (Figure 10).
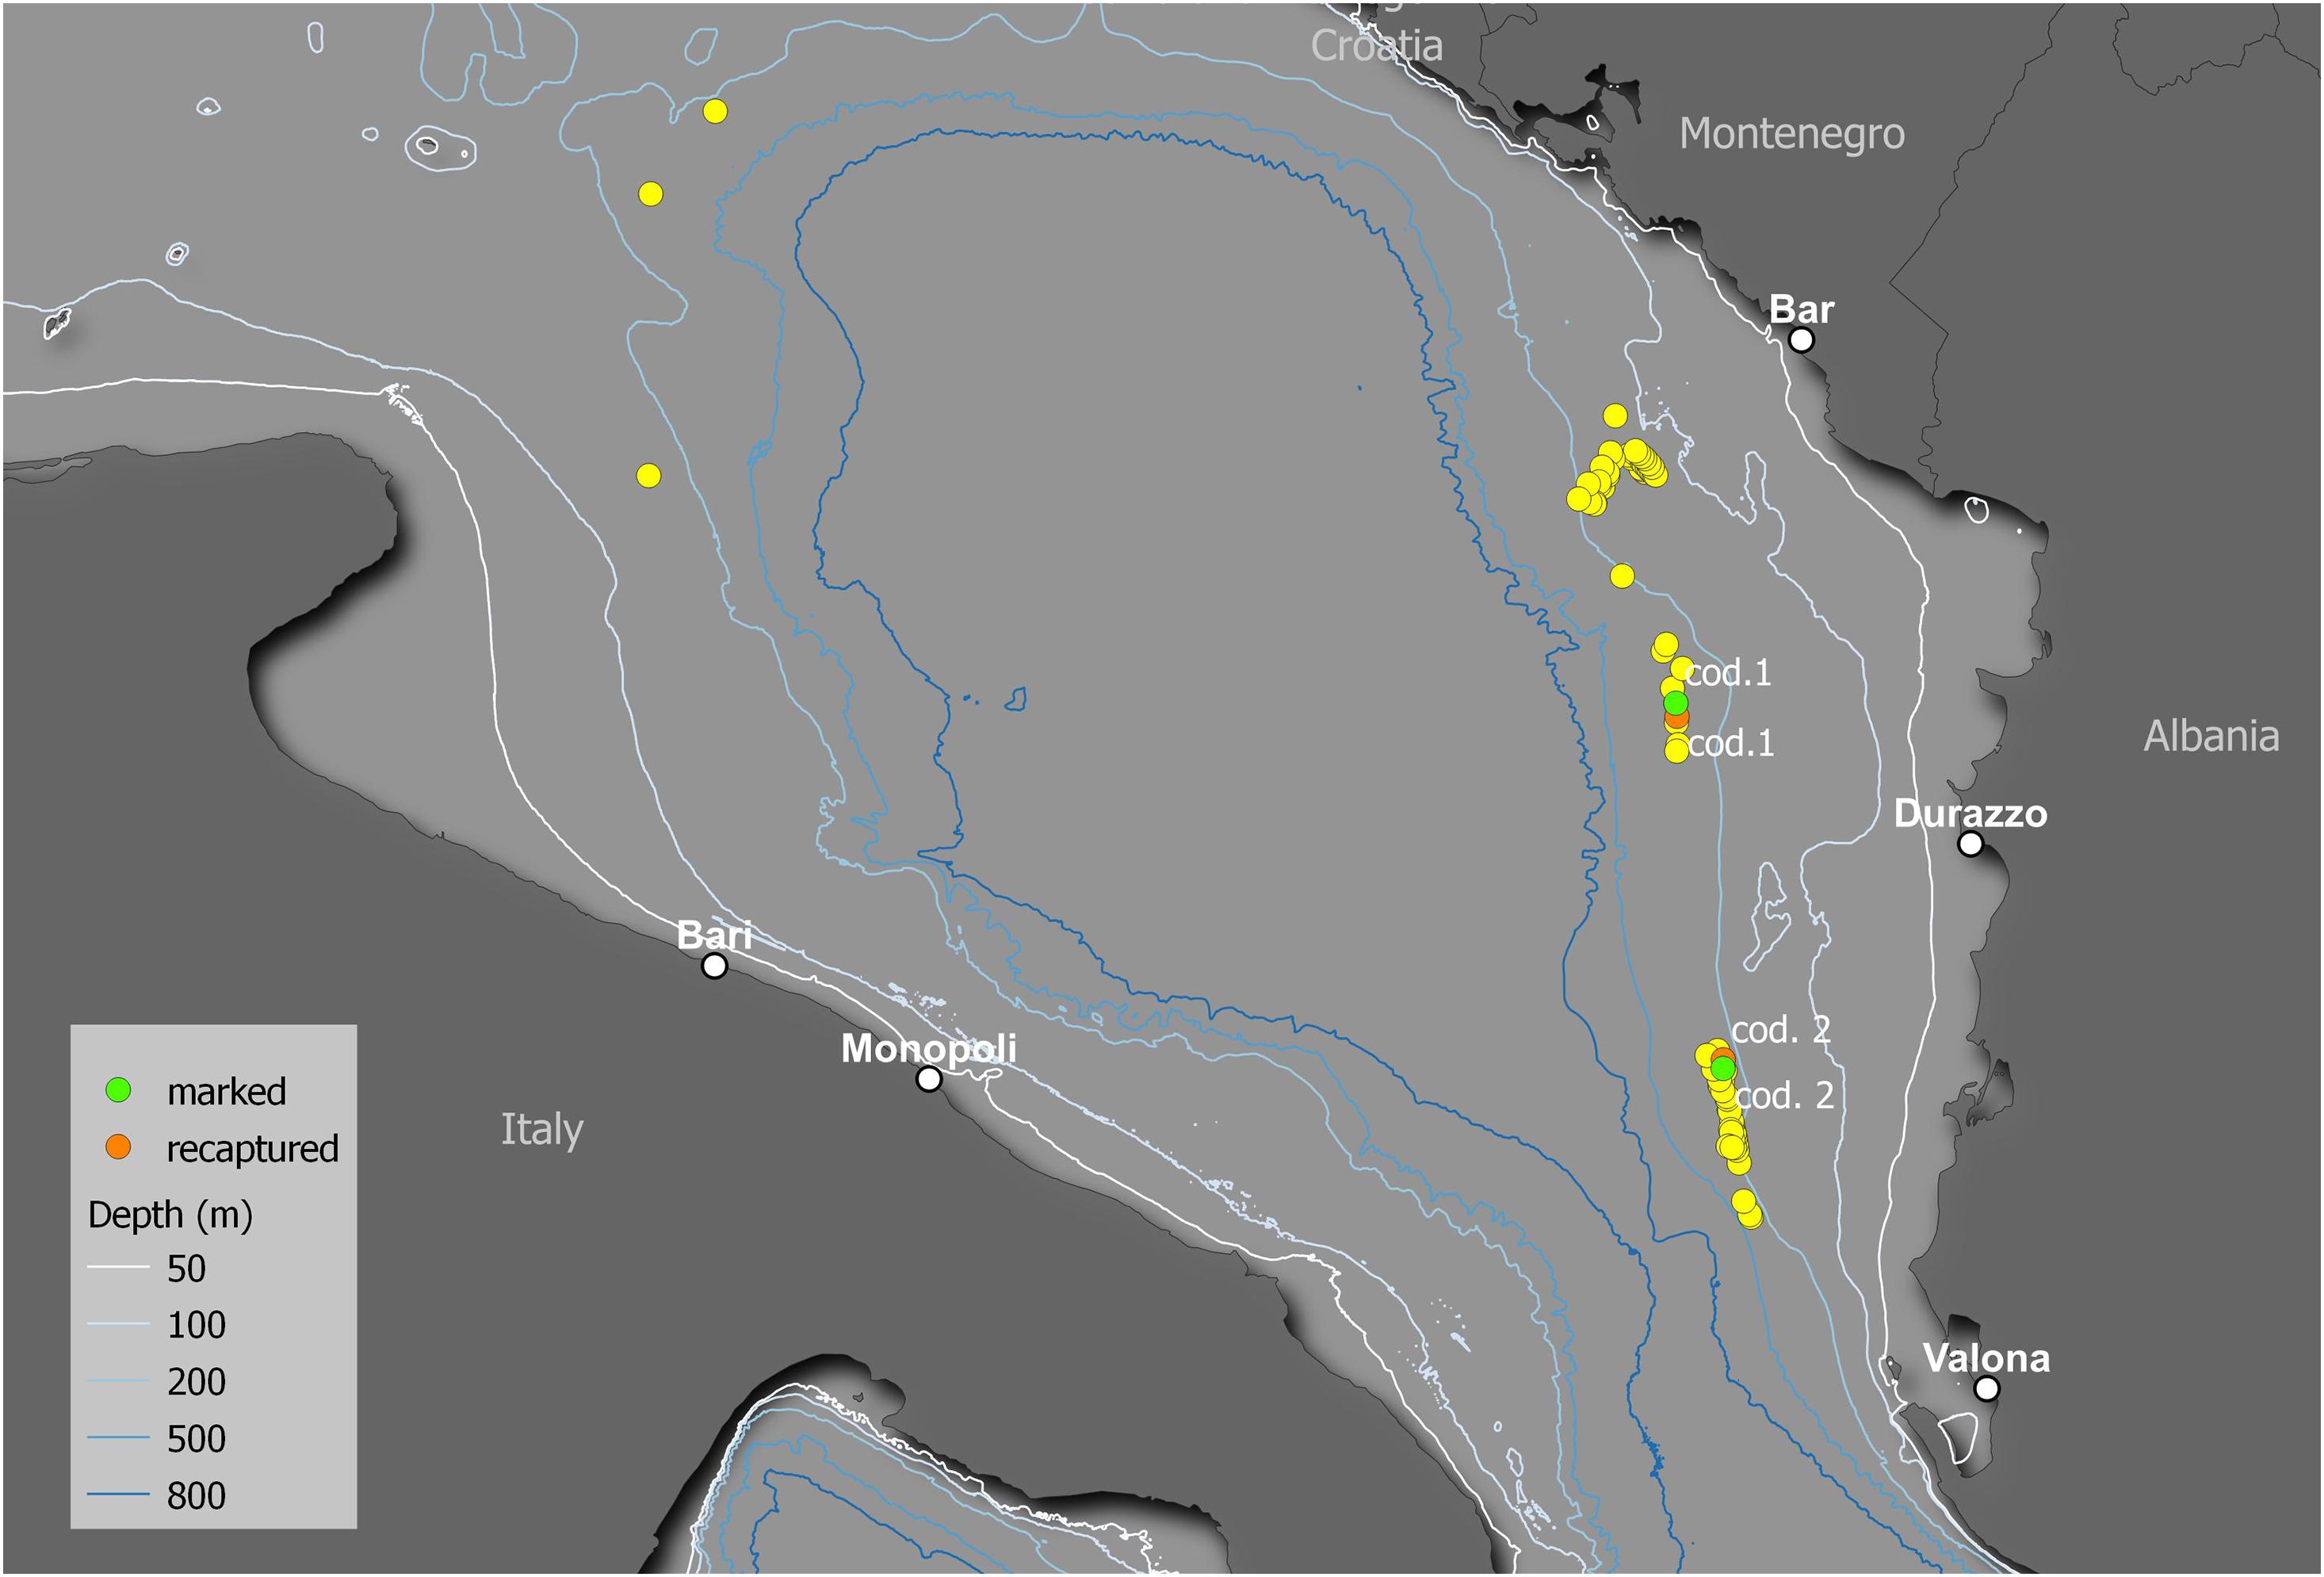
Figure 9. Map of the release locations of the captured specimens. The yellow points indicate the release locations of the specimens that were not recaptured. The green and orange points indicate the release and recapture locations, respectively, of the two recaptured specimens (cod. 1 and cod. 2).
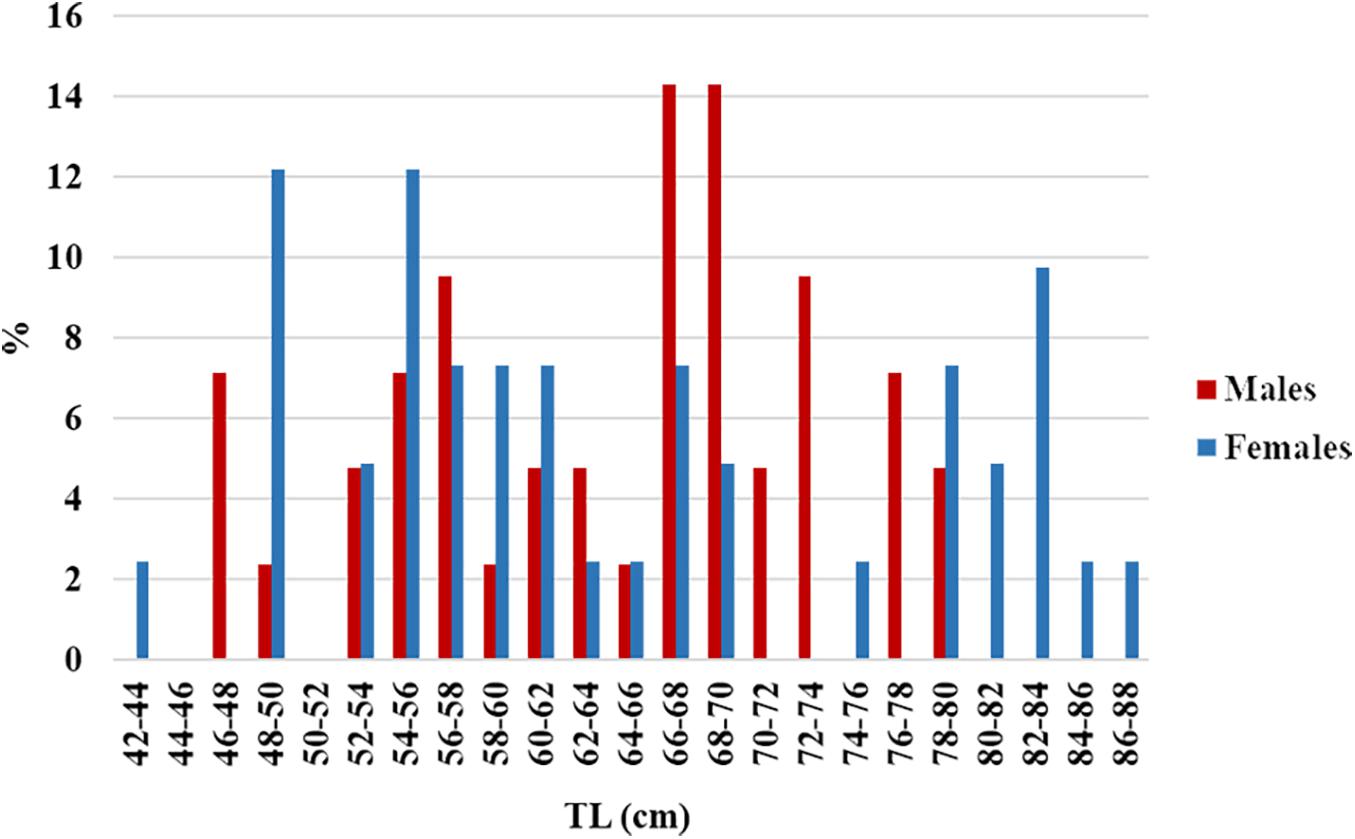
Figure 10. Length frequency distribution of the tagged specimens.
Two specimens were recaptured after 11 (cod. 1 captured November 2014, recaptured October 2015) and 12 (cod. 2 captured November 2015, recaptured December 2016) months (Figure 9), having spent 328 and 417 days of freedom, respectively. The distances between the release and recapture points were 2.26 km for cod. 1 and 1.52 km for cod. 2. Their differences in TL were 10.4 cm (from 50.5 to 60.9 cm) and 7.4 cm (from 62.3 to 69.7 cm), respectively, with average daily increments of 0.32 and 0.18 mm, respectively. In both specimens, the oxytetracycline mark was clearly visible, revealing a completed annulus (one transparent and one opaque ring) (Figure 11).
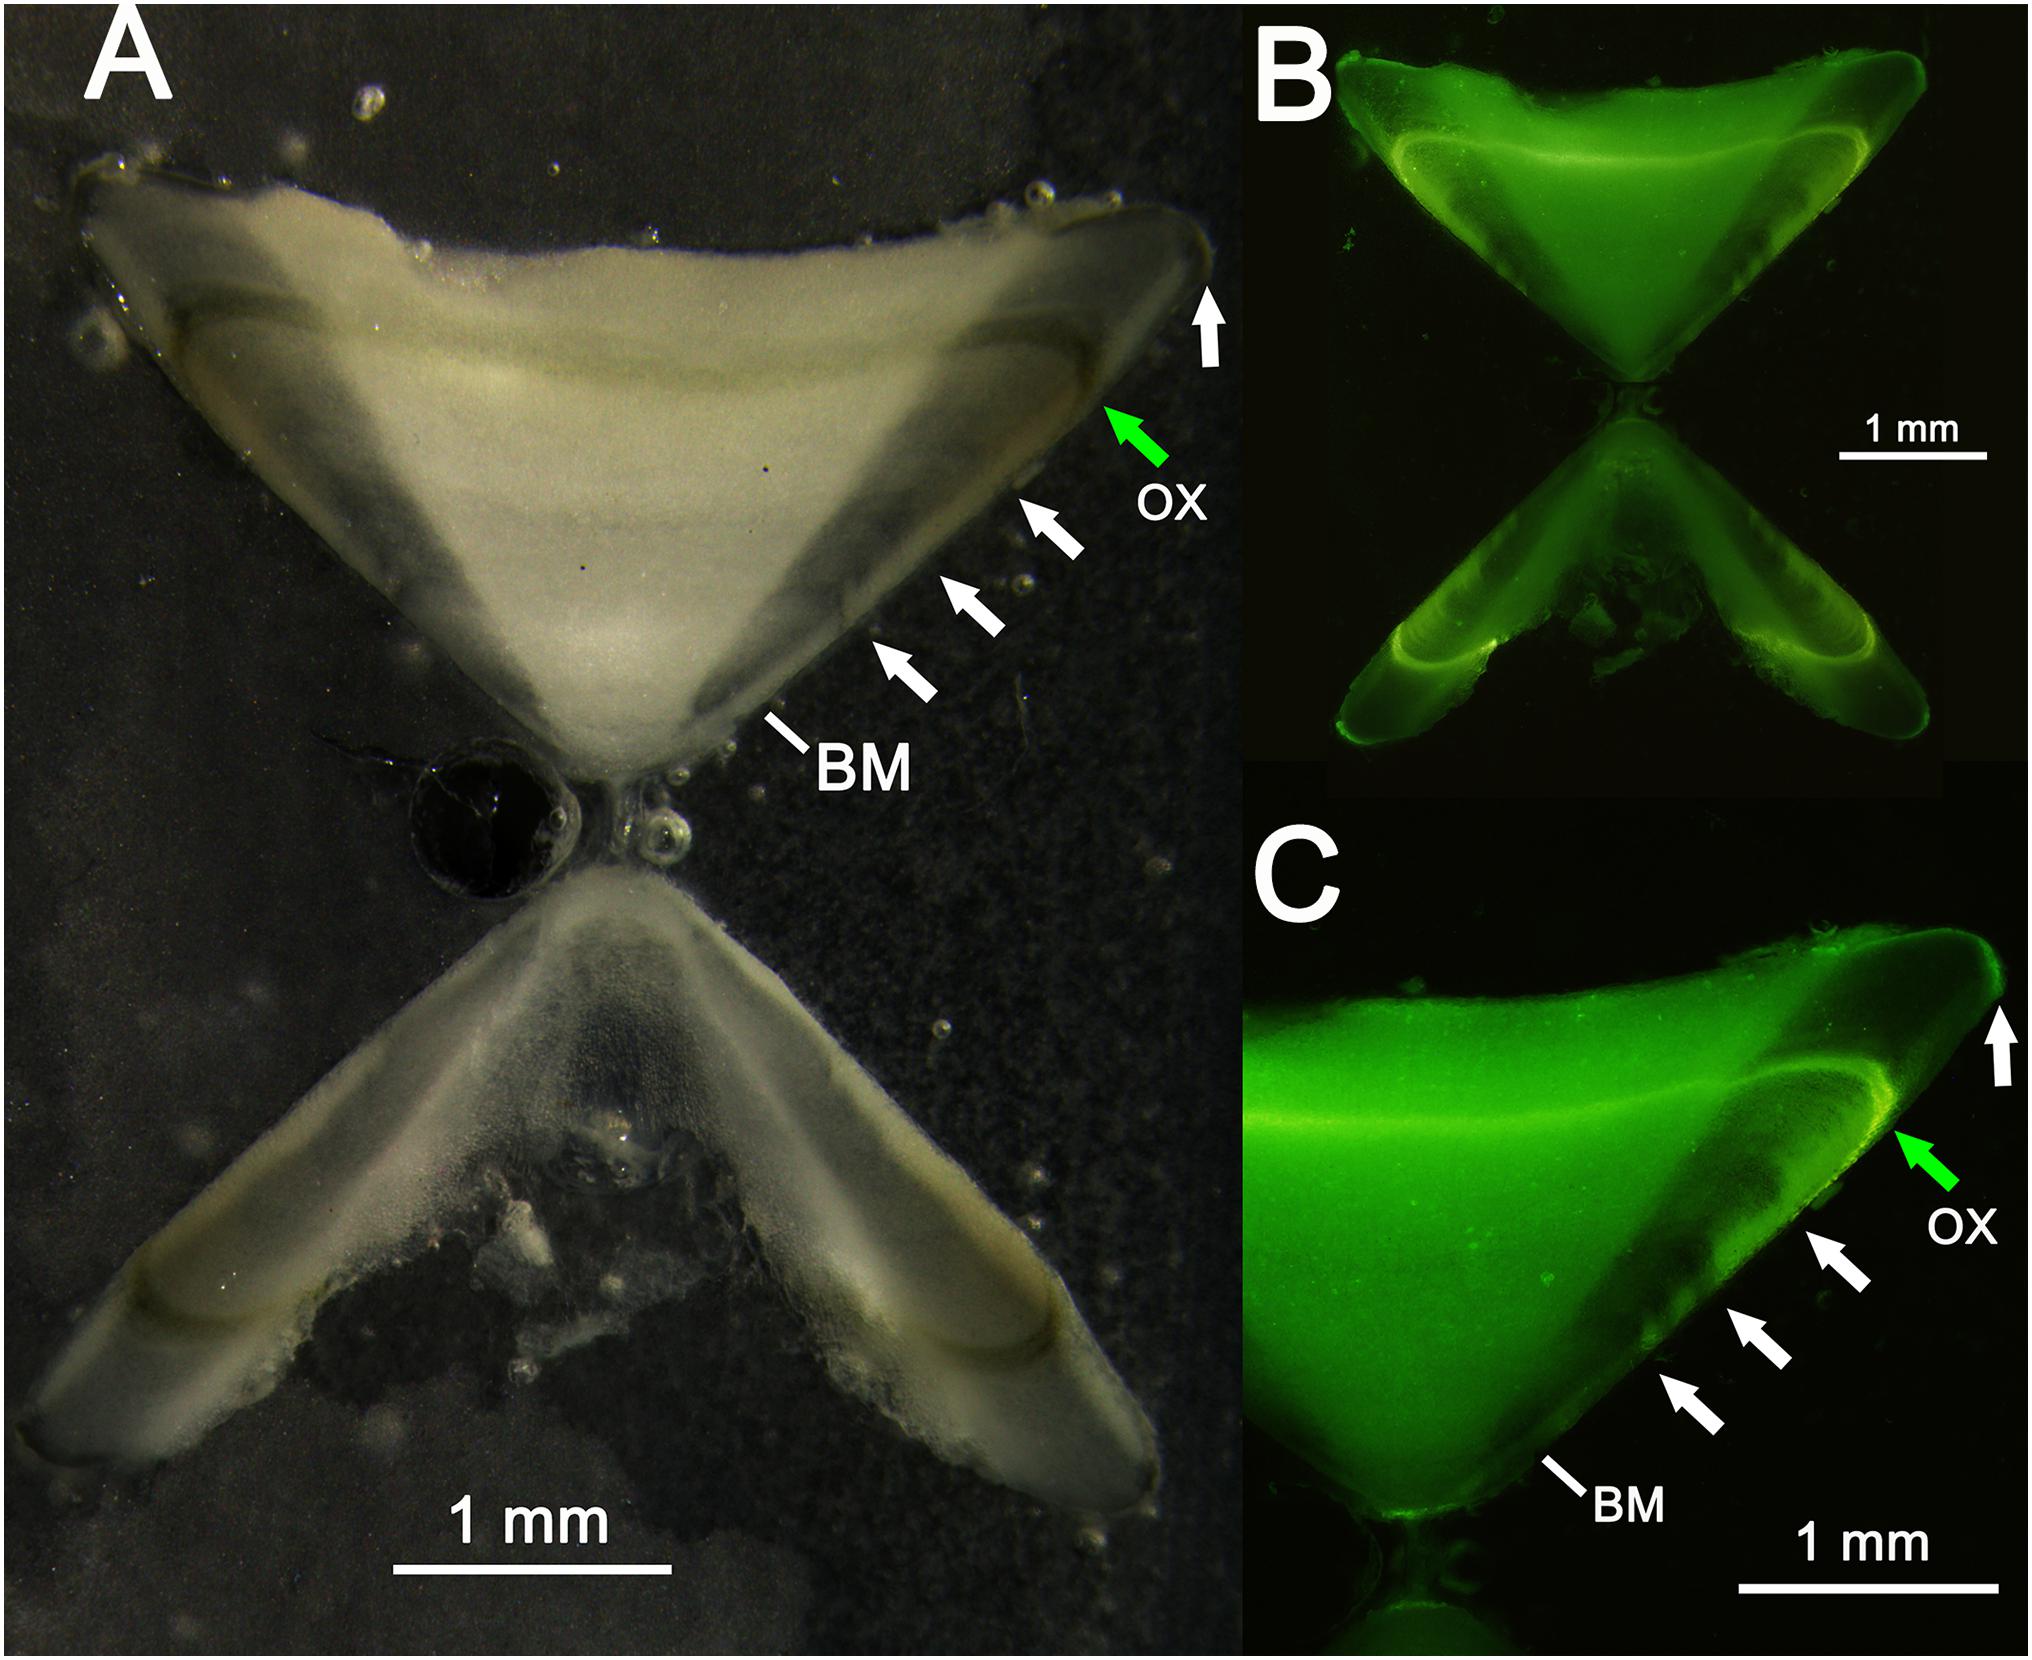
Figure 11. Vertebral thin section of a recaptured thornback ray: (A) thin section observed with reflected light; (B,C) thin section observed with ultraviolet light. The transparent bands (white arrows), birthmark (BM), and oxytetracycline (OX) band (green arrow) are also indicated.
Discussion
Thornback ray age analysis may be performed using several hard structures (e.g., vertebral centra) and preparation methods (Campana, 2014; Bellodi et al., 2019). The accuracy of age reading linked to each hard structure and preparation method represents the first step to establishing a protocol for age estimations (Carbonara and Follesa, 2019; Vitale et al., 2019), deepening in this perspective not only the influence of each processing technique on the data quality but also its cost and time requirements (International Council for the Exploration of the Sea [ICES], 2011). The hard structures mainly used in R. clavata age analyses are the dermal thorns and vertebral centra (Serra-Pereira et al., 2008; Campana, 2014; Kadri et al., 2014; Bellodi et al., 2019). The dermal thorns are usually read after staining. However, staining techniques often have several limitations; for example, the bands remain clear for limited periods, and staining techniques are often time-consuming and expensive (Serra-Pereira et al., 2008). Dermal thorns have additional disadvantages related to the readability of the different types of thorns (Gallagher et al., 2002, 2006; Gravendeel et al., 2002). Caudal thorns present a high shape variability, which affects their readability (Gallagher et al., 2002; Serra-Pereira et al., 2008). Moreover, they may be lost and replaced in the course of the fish’s life history (Meunier and Panfili, 2002), representing an important obstacle to age analysis. Nevertheless, caudal thorns can sometimes be a useful (or even the only available) hard structure. The tail can be sampled without purchasing the entire specimen, and although they may be less readable than small thorns, thorns with large bases can hardly be lost (Serra-Pereira et al., 2008).
In comparison to thorns, vertebral centra have the obvious advantage that they cannot be lost. However, the readability of this structure linked to the preparation method is an important aspect of delineating the standardization steps for age analysis of this species (Carbonara and Follesa, 2019; Vitale et al., 2019). Campana (2014) evaluated the precision of the two most common preparation methods (whole vertebra staining and thin sectioning) for age estimations of batoids. The whole vertebral centrum cobalt nitrate and ammonium sulfide staining technique (Hoenig and Brown, 1988; Goldman, 2006) involves several passages through different chemical solutions to obtain the dark bands corresponding to a more intense deposition of calcium (calcium phosphate). On the other hand, in thin vertebral sectioning, seasonal differences are highlighted as bands with different transparency due to the seasonal fluctuations of calcium deposition. Our results showed that thin sectioning of unstained centra achieved higher accuracy (PA and CV) in all age groups. These results are in line with findings regarding other Rajidae species, such as R. brachyura (Porcu et al., 2015) and Dipturus oxyrinchus (Bellodi et al., 2017). However, the success of each age analysis preparation method for cartilaginous species greatly depends on the overall amount of calcium in their cartilaginous structures, which in turn is linked to the general environmental conditions and diet (Flik et al., 1995; Allen et al., 2011). The best preparation methods depend on the species and specimens and the area (Clement, 1992; Wischniowski, 2008; Başusta et al., 2017; Bellodi et al., 2019). Therefore, it is difficult to define a general rule for age analysis preparation methods (Campana, 2014).
The growth model in fish is typically curvilinear, following a logistic or sigmoidal pattern (Gompertz, 1825; von Bertalanffy, 1938; Ricker, 1975). The strategy in both logistic and sigmoidal models is the same, with a growth rate increase in the juvenile (concave) and late-juvenile (sigmoidal) life stages, and a reduction later, often after sexual maturation (Sebens, 1987; Higgins et al., 2015; Manabe et al., 2018). After sexual maturation, a balance is often achieved between energy allocated for body growth and energy used for reproduction and other vital functions (Kozlowski, 1996). This trade-off may explain the two opposite life strategies of the main fish species: r-selection, whereby organisms exhibit sexual maturity at younger ages, small body sizes, and short life spans, while k-selected organisms present sexual maturation at older ages, large body size, and long life spans (MacArthur and Wilson, 1967).
In fish growth pattern modeling, generally (Katsanevakis, 2006) and in particular for Batoids species the comparison of several model is suggested (Cailliet and Goldman, 2004; Fisher et al., 2013; Mejía-Falla et al., 2014; Porcu et al., 2020). Thus, approaching the growth modeling without a priori “true model” seems more reliable (Burnham and Anderson, 2002; Katsanevakis, 2006) indeed, several species follow different growth trajectories (Katsanevakis and Maravelias, 2008). The estimated growth parameters are obviously model-dependent; therefore, ignoring the model selection uncertainty may introduce substantial bias (Katsanevakis and Maravelias, 2008). This has serious implications for stock status assessments (Carbonara et al., 2019b). The AIC allows the selection of the “best model” (or models) from a set of candidate models (Katsanevakis, 2006), minimizing the risks associated with an a priori selected growth model (Katsanevakis and Maravelias, 2008).
The 3VBGF is the most widely used model for fish, including ray species (Panfili et al., 2002; Campana, 2014). However, it requires a balanced sample, including both small and large specimens. It is not accurate when the sample size is small or lacking small or very large specimens (Cailliet and Goldman, 2004; Higgins et al., 2015). The 2VBGF can improve data fitting mainly when small specimens are absent from the sample (Gutteridge et al., 2013; Porcu et al., 2015). The Gompertz and logistic curves are sigmoid growth functions often used to describe growth in the larval/juvenile stage or in fish that present a low initial growth rate (Campana and Jones, 1992; Quist et al., 2012). These two models differ from each other in the inflection areas: in the logistic curve, the areas above and below the inflection point are symmetric, whereas in the Gompertz curve, they are asymmetric (Quist et al., 2012). The 3VBGF was the best fit for our dataset for both sexes, making the most biologically reasonable estimates for L8, higher of the Lmax (Gallagher et al., 2005; Serra-Pereira et al., 2008; Kadri et al., 2014).
In this study, the difference in growth rates between the sexes was statistically not-significant, even though females appeared to reach larger sizes and older ages. This is in line with findings from the Portuguese coasts (Serra-Pereira et al., 2008) and Welsh coastal waters (Gallagher et al., 2005; Whittamore and McCarthy, 2005). Conversely, significant differences were found between the sexes in Tunisian waters (Kadri et al., 2014). In our study, the similar growth rates of the two sexes were also observable in the relationship between the morphological vertebral centrum measurements and the TL. Although a comparison of growth curves from back-calculation and direct age analysis is not considered a validation method (Campana, 2001), the absence of statistically significant differences suggests that the age criteria and age scheme were consistent and used coherently (Carbonara et al., 2018).
A comparison of our estimated growth rate with those reported in the literature reveals similar patterns of a fast growth rate in the first years and a slowdown from about the fourth year, which coincides with reaching the size at first maturity (Cannizzaro et al., 1995; Gallagher et al., 2005; Kadri et al., 2014). In particular, growth curve comparisons between different studies reveal a difference in TL in the order of 7–9 cm in the central part of the curve for each age group (e.g., from 2 to 6 years of age) (Table 4). This is reasonable, considering the wide geographic area of origin. However, several other factors may be responsible for higher variability of age estimation, apart from the geographic area (Carbonara et al., 2018) and genetic origin (Matić-Skoko et al., 2018): differences in sampling methodologies (Coggins et al., 2013); age schemes/criteria (International Council for the Exploration of the Sea [ICES], 2008; Hüssy et al., 2016; Carbonara et al., 2018); preparation methods (Smith et al., 2016); and reader experience (Kimura and Lyons, 1991; Carbonara et al., 2019b). These combined factors can thus lead to considerably greater differences than those observed in R. clavata. Then, it could be needful, taking in account the results obtained by the present work, considering the use of thin sectioned vertebra as suggested preparation method.
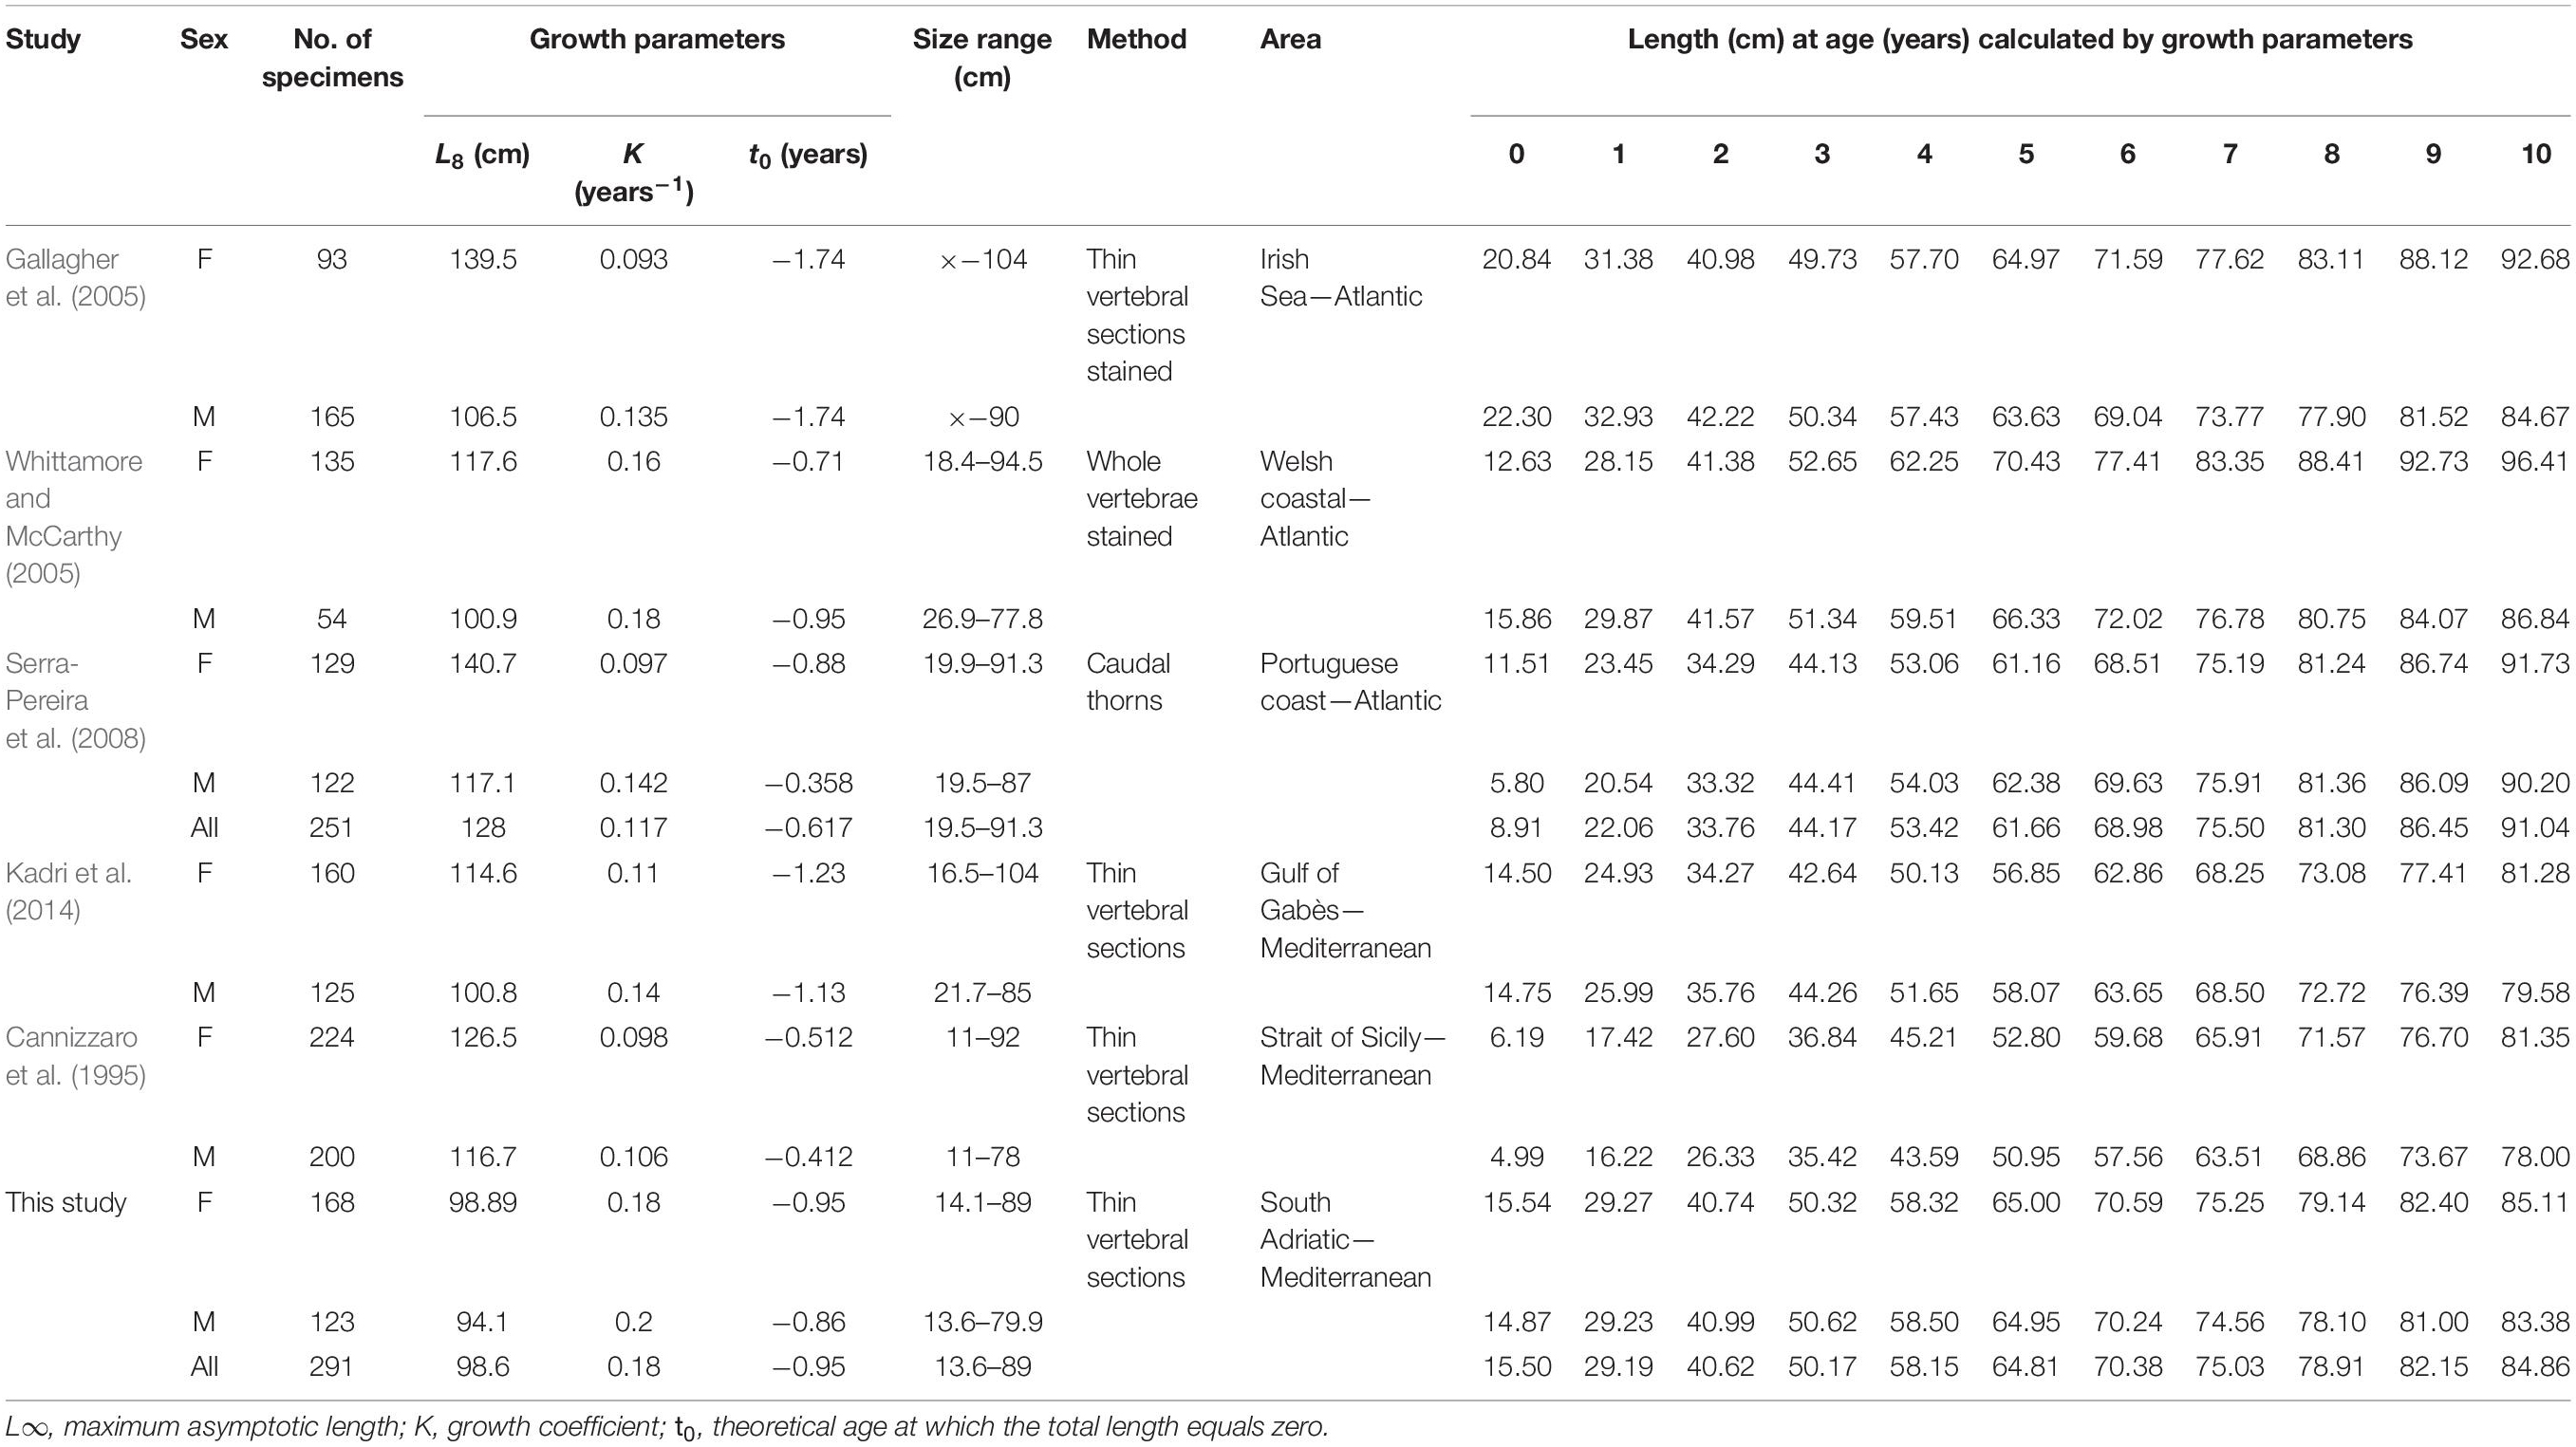
Table 4. Raja clavata growth parameters and estimated length (cm) at age (from 0 to 10 years) by sex, geographical area, and age estimation method.
To our knowledge, there are no longevity data available for the thornback ray. The typical method for longevity estimations based on Taylor’s (1960) formula employs the K value from the VBGF, which can easily lead to an overestimation (e.g., Ebert et al., 2009; Barnett et al., 2013; Mejía-Falla et al., 2014). To avoid this risk, in this study, longevity was estimated according to the method proposed by Barnett et al. (2013), which provides a lower and upper range calculated on the basis of the maximum observed size and the reading precision (IAPE) of the oldest age group. Females showed higher longevity than males, probably due to the difference in maximum observed age and TL between females and males.
Marginal analysis is considered a reliable method for investigating the deposition pattern of opaque and transparent bands (Campana, 2001). In our study, we found a prevalence of opaque bands between June and October, which is comparable to that in the Irish Sea, where the opaque band deposition is prevalent between July and November (Gallagher et al., 2005). This element not only allowed us to assign an annual frequency to the succession of bands but also agreed with the seasonal deposition patterns linked to the specific environmental conditions (Carbonara et al., 2018).
The tagging experiment was performed on the east side of the South Adriatic Sea in a bathymetric range of 100–500 m, according to the species’ distribution in the Mediterranean (Follesa et al., 2019b). The condition of the specimens at the moment of capture was good, which seems an important result in itself, not only for the tagging experiment but also from a management perspective. The thornback ray is considered a bycatch species in the investigated area (Carbonara et al., 2019a; Maiorano et al., 2019). Thus, the release of the caught specimens may be considered a reasonable management measure in terms of survival chances (Bell and Lyle, 2016; Ellis et al., 2017, 2018). The survival rate seems to be closely associated with the condition at capture for all ray species (Braccini et al., 2012), and especially for thornback rays captured by longlines (Ellis et al., 2018).
This study is the first to conduct a thornback ray tag-and-release experiment in the Mediterranean Sea. Analogous experiments have been conducted mostly in NE Atlantic Ocean (North Sea, English Channel, and Irish Sea), allowing assessments of various aspects of the life history of R. clavata in terms of migration, stock unit, and size and sex distribution (Hunter et al., 2006; Ellis et al., 2008, 2011; Bird et al., 2020). The recapture rates in those studies were considerably higher than that in our study (2.4%), ranging between 6.5% (Ellis et al., 2008) and 51% (Hunter et al., 2006). However, the numbers of tagged fish in those studies were significantly larger: 197 in Hunter et al. (2006) and 4,152 in Ellis et al. (2008). Moreover, the tag-release area in our study represents a fishing ground for several fleets from several ports and countries (Lembo and Spedicato, 2011); therefore, it was difficult to intercept any recaptures.
Previous studies demonstrated that the thornback ray is capable of covering distances of several hundred kilometers (Hunter et al., 2006; Bird et al., 2020). The proximity of the recapture site to the release site in this study may not necessarily reflect restricted spatial movements for this species. Skates often exhibit a philopatric behavior (repeated return migrations) (Flowers et al., 2016), which is difficult to observe from mark-recapture data (Hunter et al., 2005). However, in our study, the sampled specimens were released and recaptured in about the same time of the year.
In both recaptured specimens, the mark of oxytetracycline was clearly visible, showing a completed annulus with a transparent and an opaque band. The oxytetracycline mark in the vertebra is in line with the deposition pattern described here, as well as with the bands (opaque and transparent) subsequently laid down up to the margin. Even though we only had two recaptures, the deposition of one annulus per year and the band count can be considered valid (Campana, 2001). Moreover, the age data from the recaptured specimens are consistent with the growth curve obtained by the age analysis.
Although a larger number of OTC-injected recaptured thornback rays with greater time at liberty would be desirable in this type of study (Cailliet et al., 2006), the tag-recapture with chemical mark, that is considered one of the most power validation method (Campana, 2001; Cailliet and Goldman, 2004), allows to obtain reliable results also in studies with a low number of recapture. Indeed, the low number of specimens recaptured is not an atypical condition for age and growth studies on elasmobranchs that apply this age validation technique (Wintner and Dudley, 2000; Natanson et al., 2002; Skomal and Natanson, 2003). Moreover the results obtained from the recapture are in line with the marginal analysis and vertebra thin section readings. Further studies with larger numbers of marked and recaptured thornback rays are needed to obtain complete validated growth data in light of the encouraging results of this study.
The availability of the growth parameters validated for the thornback ray will allow to produce diagnosis of the state of the stocks and the consequent management measures for most of the Mediterranean areas where they have not yet been implemented, especially for the study area: the South Adriatic Sea.
Data Availability Statement
The raw data supporting the conclusions of this article will be made available by the authors, without undue reservation, to any qualified researcher.
Ethics Statement
The animal study was reviewed and approved by the Committee on the Ethics of Animal Experiments of COISPA (Italian Ministry of Health 15/2015-UT).
Author Contributions
PC contributed to experimental design, experiment development, data analysis, results processing, and wrote the manuscript. AB participated in data analysis, results processing, and manuscript revisions. MP took part in data analysis and experiment development. AM, CP, and MD contributed to data analysis and manuscript revisions. WZ participated in results processing and manuscript revisions. RC took part in manuscript revisions. LS contributed to experimental design and revision. MF contributed to data analysis, results processing, and manuscript revisions. All authors contributed to the article and approved the submitted version.
Funding
The tagging experiment was funded by RitMARE project (SP2_WP1_AZ4_UO08_D03). Moreover the samples from commercial fishery (landing and discard) are collected under the Data Collection Framework supported by the Italian Ministry of Agriculture, Food and Forestry Policy (MiPAAF) and by the European Commission (EU Reg. 199/2008).
Conflict of Interest
The authors declare that the research was conducted in the absence of any commercial or financial relationships that could be construed as a potential conflict of interest.
Acknowledgments
We were grateful to Editor and the Reviewers for their constructive comments and suggestions, which greatly helped to improve the manuscript. We were grateful to Vincenzo Menga (captain), Giambattista Napoletano (captain) and all crew of the fishing boat “San Francesco II” that they kindly provided the specimens recaptured.
References
AAVV (2017). MEDITS-Handbook. Version n°9. MEDITS Working Group. Available online at: https://www.sibm.it/MEDITS
Akaike, H. (1974). A new look at the statistical model identification. IEEE Trans. Automat. Control 19, 716–723. doi: 10.1109/TAC.1974.1100705
Allen, P. J., Weihrauch, D., Grandmaison, V., Dasiewicz, P., Peake, S. J., and Anderson, W. G. (2011). The influence of environmental calcium concentrations on calcium flux, compensatory drinking and epithelial calcium channel expression in a freshwater cartilaginous fish. J. Exp. Biol. 214, 996–1006. doi: 10.1242/jeb.041087
Barnett, L. A. K., Winton, M. V., Ainsley, S. M., Cailliet, G. M., and Ebert, D. A. (2013). Comparative demography of skates: life-history correlates of productivity and implications for management. PLoS One 8:e65000. doi: 10.1371/journal.pone.0065000
Başusta, N., Demirhan, S. A., Çiçek, E., and Başusta, A. (2017). Comparison of staining techniques for age determination of some Chondrichthyan species. Turk. J. Fish Aquat. Sci. 17, 41–49. doi: 10.4194/1303-2712-v17_1_06
Beamish, R. J., and Fournier, D. A. (1981). A method for comparing the precision of a set of age determinations. Can. J. Fish. Aquat. Sci. 38, 982–983. doi: 10.1139/f81-132
Bell, J. D., and Lyle, J. M. (2016). Post-capture survival and implications for by-catch in a multispecies coastal gillnet fishery. PLoS One 11:e0166632. doi: 10.1371/journal.pone.0166632
Bellodi, A., Mulas, A., Cau, A., Sion, L., Carbonara, P., and Follesa, M. C. (2019). “Cartilaginous species,” in Handbook on Fish Age Determination: A Mediterranean Experience, Sudies and Review N. 98, eds P. Carbonara and M. C. Follesa (Rome: FAO), 87–109.
Bellodi, A., Porcu, C., Cannas, R., Cau, A. L., Marongiu, M. F., Mulas, A., et al. (2017). Life–history traits of the long–nosed skate Dipturus oxyrinchus. J. Fish Biol. 90, 867–888. doi: 10.1111/jfb.13205
Benoît, H. P., Hurlbut, T., and Chasse, J. (2010). Assessing the factors influencing discard mortality of demersal fishes using a semi-quantitative indicator of survival potential. Fish. Res. 106, 436–447. doi: 10.1016/j.fishres.2010.09.018
Bird, C., Burt, G., Hampton, N., McCully Phillips, S., and Ellis, J. (2020). Fifty years of tagging skates (Rajidae): using mark-recapture data to evaluate stock units. J. Mar. Biol. Assoc. U.K. 100, 121–131. doi: 10.1017/S0025315419000997
Björnsson, B., Karlsson, H., Thorsteinsson, V., and Solmundsson, J. (2011). Should all fish in mark–recapture experiments be double-tagged? Lessons learned from tagging coastal cod (Gadus morhua). ICES J. Mar. Sci. 68, 603–610. doi: 10.1093/icesjms/fsq187
Braccini, M., Van Rijn, J., and Frick, L. (2012). High post-capture survival for sharks, rays and chimaeras discarded in the main shark fishery of Australia? PLoS One 7:e32547. doi: 10.1371/journal.pone.0032547
Burnham, K. P., and Anderson, D. R. (2002). Model Selection and Multimodel Inference: A Practical Information-theoretic Approach, 2nd Edn. (New York, NY: Springer), 488. doi: 10.1007/b97636
Cailliet, G. M., and Goldman, K. J. (2004). “Age determination and validation in chondrichthyan fishes,” in Biology of Sharks and Their Relatives, eds J. Carrier, J. A. Musick, and M. R. Heithaus (Boca Raton, FL: CRC Press), 399–447. doi: 10.1201/9780203491317.pt3
Cailliet, G. M., Smith, W. D., Mollet, H. F., and Goldman, K. J. (2006). Age and growth studies of chondrichthyan fishes: the need for consistency in terminology, verification, validation, and growth function fitting. Environ. Biol. Fish. 77, 211–228. doi: 10.1007/s10641-006-9105-5
Campana, S. E. (2001). Accuracy, precision and quality control in age determination, including a review of the use and abuse of age validation methods. J. Fish Biol. 59, 197–242. doi: 10.1006/jfbi.2001.1668
Campana, S. E. (2014). Age Determination of Elasmobranchs, with Special Reference To Mediterranean Species: A Technical Manual. Studies and Reviews N. 94. (Rome: FAO), 38.
Campana, S. E., and Jones, C. M. (1992). “Analysis of otolith microstructure data,” in Otolith Microstructure Examination and Analysis, eds D. K. Stevenson and S. E. Campana (Ottawa, ON: Department of Fisheries and Oceans), 73–100.
Cannizzaro, L., Garofalo, G., Levi, D., Rizzo, P., and Gancitano, S. (1995). Raja clavata nel canale di sicilia: crescita, distribuzione e abbondanza. Biol. Mar. Medit. 2, 257–262. doi: 10.1080/11250007809440130
Carbonara, P., and Follesa, M. C. (2019). Handbook on Fish Age Determination: A Mediterranean Experience. Studies and Reviews. No. 98. (Rome: FAO), 192.
Carbonara, P., Intini, S., Kolitari, J., Joksimović, A., Milone, N., Lembo, G., et al. (2018). A holistic approach to the age validation of Mullus barbatus L., 1758 in the Southern Adriatic Sea (Central Mediterranean). Sci. Rep. 8:13219. doi: 10.1038/s41598-018-30872-1
Carbonara, P., Porcu, C., Donnaloia, M., Pesci, P., Sion, L., Spedicato, M. T., et al. (2019a). The spawning strategy of European hake (Merluccius merluccius. L. 1758) across the Western and Central Mediterranea Sea. Fish. Res. 219, 1–13. doi: 10.1016/j.fishres.2019.105333
Carbonara, P., Zupa, W., Anastasopoulou, A., Bellodi, A., Bitetto, I., Charilaou, C., et al. (2019b). Explorative analysis on red mullet (Mullus barbatus) ageing data variability in the Mediterranean. Sci. Mar. 83S1, 271–279. doi: 10.3989/scimar.04999.19A
Chen, Y., Jackson, D. A., and Harvey, H. H. A. (1992). Comparison of von Bertalanffy and Polynomial Functions in Modelling Fish Growth Data. Can. J. Fish. Aquat. Sci. 49, 1228–1235. doi: 10.1139/f92-138
Clement, J. G. (1992). Re-examination of the fine structure of endoskeletal mineralization in Chondricthyes: implications for growth, ageing and calcium homeostasis. Aust. J. Mar. Fresh. Res. 43, 157–181. doi: 10.1071/mf9920157
Coggins, L. G., Gwinn, D. C., and Allen, M. S. (2013). Evaluation of Age-Length Key Sample Sizes Required to Estimate Fish Total Mortality and Growth. Trans. Am. Fish. Soc. 142, 832–840. doi: 10.1080/00028487.2013.768550
Cortés, E., Brooks, E. N., and Shertzer, K. W. (2015). Risk assessment of cartilaginous fish populations. ICES J. Mar. Sci. 72, 1057–1068. doi: 10.1093/icesjms/fsu157
Dapp, R. D., Huveneers, C., Walker, T. I., Drew, M., and Reina, R. D. (2016). Moving from measuring to predicting bycatch mortality: predicting the capture condition of a longline-caught pelagic shark. Front. Mar. Sci. 2:126. doi: 10.3389/fmars.2015.00126
Dulvy, N. K., Fowler, S. L., Musick, J. A., Cavanagh, R. D., Kyne, P. M., Harrison, L. R., et al. (2014). Extinction risk and conservation of the world’s sharks and rays. eLife 3:e00590. doi: 10.7554/eLife.00590
Ebert, D. A., Maurer, J. R., Ainsley, S. M., Barnett, L. A. K., and Cailliet, G. M. (2009). Life History and Population Dynamics of Four Endemic Alaskan Skates: Determining Essential Biological Information for Effective Management of Bycatch and Target Species, North Pacific Research Board, Final Report, 715. (Anchorage, AK: North Pacific Research Board), 120.
Eero, M., Hjelm, J., Behrens, J., Buchmann, K., Cardinale, M., Casini, M., et al. (2015). Eastern Baltic cod in distress: biological changes and challenges for stock assessment. ICES J. Mar. Sci. 72, 2180–2186. doi: 10.1093/icesjms/fsv109
Ellis, J. R., Burt, G. J., Cox, L. P. N., Kulka, D. W., and Payne, A. I. L. (2008). The status and management of thornback ray Raja clavata in the south-western North Sea. Theme Session K: small scale and recreational fisheries surveys, assessment, and management. ICES CM 13:45.
Ellis, J. R., Burt, G. J., Grilli, G., McCully Phillips, S. R., Catchpole, T. L., and Maxwell, D. L. (2018). At-vessel mortality of skates (Rajidae) taken in coastal fisheries and evidence of longer-term survival. J. Fish Biol. 92, 1702–1719. doi: 10.1111/jfb.13597
Ellis, J. R., Dulvy, N. K., and Serena, F. (2016). Raja clavata. The IUCN Red List of Threatened Species 2016: e.T39399A103113598. Available online at: https://www.iucnredlist.org/species/39399/103113598 (accessed November, 2020).
Ellis, J. R., McCully Phillips, S. R., and Poisson, F. (2017). A review of capture and post-release mortality of elasmobranchs. J. Fish Biol. 90, 653–722. doi: 10.1111/jfb.13197
Ellis, J. R., Morel, G., Burt, G., and Bossy, S. (2011). Preliminary observations on the life history and movements of skates (Rajidae) around the Island of Jersey, western English Channel. J. Mar. Biol. Assoc. U.K. 91, 1185–1192. doi: 10.1017/S0025315410001906
Eltink, A. T. G. W. (2000). Age Reading Comparisons (MS Excel workbook version 1.0 October 2000). Available online at: http://www.efan.no (accessed October, 2000)
Fabens, A. J. (1965). Properties and fitting of the von Bertalanffy growth curve. Growth 29, 265–289.
Ferretti, F., Worm, B., Britten, G. L., Heithaus, M. R., and Lotze, H. K. (2010). Patterns and ecosystem consequences of shark declines in the ocean. Ecol. Lett. 13, 1055–1071. doi: 10.1111/j.1461-0248.2010.01489.x
Fisher, R. A., Call, G. C., and Grubbs, R. D. (2013). Age, growth, and reproductive biology of cownose rays in chesapeake bay. Mar. Coast. Fish. 5, 224–235. doi: 10.1080/19425120.2013.812587
Flik, G., Verbost, P. M., and Wendalaar Bonga, S. E. (1995). “Calcium transport processes in fishes,” in Cellular and Molecular Approaches to Fish Ionic Regulation, Fish Physiology, Vol. 14, eds C. M. Wood and T. J. Shuttleworth (San Diego, CA: Academic Press), 317–342. doi: 10.1016/s1546-5098(08)60251-4
Flowers, K. I., Ajemian, M. J., Bassos-Hull, K., Feldheim, K. A., Hueter, R. E., Papastamatiou, Y. P., et al. (2016). A review of batoid philopatry, with implications for future research and population management. Mar. Ecol. Prog. Ser. 562, 251–261. doi: 10.3354/meps11963
Follesa, M. C., Agus, B., Bellodi, A., Cannas, R., Capezzuto, F., Casciaro, L., et al. (2019a). The MEDITS maturity scales as a useful tool for investigating the reproductive traits of key species in the Mediterranean Sea. Sci. Mar. 83S1, 235–256. doi: 10.3989/scimar.04965.15A
Follesa, M. C., Marongiu, M. F., Zupa, W., Bellodi, A., Cau, A., Cannas, R., et al. (2019b). Spatial variability of Chondrichthyes in the northern Mediterranean. Sci. Mar. 83S1, 81–100. doi: 10.3989/scimar.04998.23A
Food and Agriculture Organization [FAO] (2016). The State of Mediterranean and Black Sea Fisheries. General Fisheries Commission for the Mediterranean. (Rome: FAO), 134.
Food and Agriculture Organization [FAO] (2018). The State of World Fisheries and Aquaculture 2018 – Meeting the Sustainable Development Goals. (Rome: FAO), 210.
Francis, R. I. C. C. (1990). Back-calculation of fish length: a critical review. J. Fish Biol. 36, 883–902. doi: 10.1111/J.1095-8649.1990.TB05636.X
Gallagher, M., Nolan, C. P., and Jeal, F. (2002). The structure and growth processes of caudal thorns. NAFO SCR Document 02/130. (Dartmouth: NAFO), 7.
Gallagher, M. J., Nolan, C. P., and Jeal, F. (2005). Age, growth and maturity of the commercial rayspecies from the Irish Sea. J. Northwest Atl. Fish. Sci. 35, 47–66. doi: 10.2960/J.v35.m527
Gallagher, M. J., Green, M. J., and Nolan, C. P. (2006). The potential use of caudal thorns as a non-invasive ageing structure in the thorny skate (Amblyraja radiata) Donovan, 1808. Environ. Biol. Fishes 77, 265–272. doi: 10.1007/s10641-006-9114-4
Gelsleichter, J., Cortés, E., Manire, C. A., Hueter, R. E., and Musick, J. A. (1998). Evaluation of toxicity of oxytetracycline on growth of captive nurse sharks, Ginglymostoma cirratum. Fish. Bull. 96, 624–627.
Goldman, K. J. (2006). “Age and growth of elasmobranch fishes,” in Management Techniques for Elasmobranch Fisheries FAO Fisheries Technical Paper. N. 474, eds J. A. Musick and R. Bonfil (Rome: FAO), 76–102.
Gompertz, B. (1825). On the nature of the function expressive of the law of human mortality, and on a new mode of determining the value of life contingencies. Philos. Trans. R. Soc. Lond. 115, 513–585. doi: 10.1098/rstl.1825.0026
Gravendeel, R., Neer, W. V., and Brinkhuizen, D. (2002). An identification key for dermal denticles of Rajidae from North Sea. Int. J. Osteoarchaeol. 12, 420–441. doi: 10.1002/oa.645
Gutteridge, A. N., Huveneers, C., Marshall, L. J., Tibbetts, I. R., and Bennett, M. B. (2013). Life-history traits of a small-bodied coastal shark. Mar. Freshw. Res. 64, 54–65. doi: 10.1071/MF12140
Higgins, R. M., Diogo, H., and Isidro, E. J. (2015). Modelling growth in fish with complex life histories. Rev. Fish Biol. Fish. 25, 449–462. doi: 10.1007/s11160-015-9388-8
Hoenig, J. M., and Brown, C. A. (1988). A simple technique for staining growth bands in elasmobranch vertebrae. Bull. Mar. Sci. 42, 334–337.
Hunter, E., Berry, F., Buckley, A. A., Stewart, C., and Metcalfe, J. D. (2006). Seasonal migration of thornback rays and implications for closure management. J. Appl. Ecol. 43, 710–720. doi: 10.1111/j.1365-2664.2006.01194.x
Hunter, E., Buckley, A. A., Stewart, C., and Metcalfe, J. D. (2005). Migratory behaviour of the thornback ray, Raja clavata, in the southern North Sea. J. Mar. Biol. Assoc. U.K. 85, 1095–1105. doi: 10.1017/S0025315405012142
Hüssy, K., Radtke, K., Plikshs, M., Oeberst, R., Baranova, T., Krumme, U., et al. (2016). Challenging ICES age estimation protocols: lessons learned from the eastern Baltic cod stock. ICES J. Mar. Sci. 73, 2138–2149. doi: 10.1093/icesjms/fsw107
International Council for the Exploration of the Sea [ICES] (2008). Report of the Working Group Elasmobranch Fishes (WGEF), 3–6 March 2008. Copenhagen: ICES.
International Council for the Exploration of the Sea [ICES] (2011). Report of the Workshop of National Age Readings Coordinators (WKNARC), 5-9 September 2011, Boulogne-sur-Mer, France. ICES CM 2011/ACOM:45. (Copenhagen: ICES), 175.
International Council for the Exploration of the Sea [ICES] (2013). Report of the Second Workshop of National Age Readings Coordinators (WKNARC2), 13–17 May 2013, Horta, Azores. (Horta: ICES).
International Council for the Exploration of the Sea [ICES] (2018). Report of the Working Group on Elasmobranch Fishes (WGEF), 19–28 June 2018. (Lisbon: ICES), 1306.
International Council for the Exploration of the Sea [ICES] (2020). ICES Workshop on age validation studies of small pelagic species (WKVALPEL). ICES Sci. Rep. 2:76. doi: 10.17895/ices.pub.5966
Kadri, H., Marouani, S., Saïdi, B., Bradai, M. N., Bouaïn, A., and Morize, E. (2014). Age, growth, sexual maturity and reproduction of the thornback ray, Raja clavata (L.), of the Gulf of Gabès (south-central Mediterranean Sea). Mar. Biol. Res. 10, 416–425. doi: 10.1080/17451000.2013.797584
Katsanevakis, S. (2006). Modelling fish growth: model selection, multi-model inference and model selection uncertainty. Fish. Res. 81, 229–235. doi: 10.1016/j.fishres.2006.07.002
Katsanevakis, S., and Maravelias, C. D. (2008). Modelling fish growth: multi-model inference as a better alternative to a priori using von Bertalanffy equation. Fish ish. 9, 178–187. doi: 10.1111/j.1467-2979.2008.00279.x
Kimura, D. K., and Lyons, J. J. (1991). Between-reader bias and variabil-ity in the age-determination process. Fish. Bull. 89, 53–60.
Kozlowski, J. (1996). Optimal allocation of resources explains interspecific life-history patterns in animals with indeterminate growth. Proc. R. Soc. Lond. B. 263, 559–566. doi: 10.1098/rspb.1996.0084
Krstulović-Šifner, S., Vrgoè, N., Dadić, V., Isajlović, I., Peharda, M., and Piccinetti, C. (2008). Long-term changes in distribution and demographic composition of thornback ray, Raja clavata, in the northern and central Adriatic Sea. J. Appl. Ichthyol. 25, 40–46. doi: 10.1111/j.1439-0426.2008.01204.x
Lembo, G., and Spedicato, M. T. (2011). “Lo stato delle risorse nei mari italiani: GSA 18 – Adriatico Meridionale,” in Lo Stato Della Pesca e Dell’acquacoltura nei Mari Italiani, eds S. Cataudella and M. Spagnolo (Roma: Ministero delle politiche agricole), 159–170.
MacArthur, R. H., and Wilson, E. O. (1967). The Theory of Island Biogeography. (Princeton, NJ: Princeton University Press), 224.
Maiorano, P., Sabatella, R. F., and Marzocchi, B. M. (eds). (2019). Annuario Sullo Stato delle Risorse e sulle Strutture Produttive dei Mari Italiani. (Pune: SIBM), 432. Available online at: http://www.nisea.eu/dir/wp-content/uploads/2019/09/Annuario-20142016_2019_08_05.pdf (accessed November, 2020).
Manabe, A., Yamakawa, T., Ohnishi, S., Akamine, T., Narimatsu, Y., Tanaka, H., et al. (2018). A novel growth function incorporating the effects of reproductive energy allocation. PLoS One 13:e0199346. doi: 10.1371/journal.pone.0199346
Marongiu, M. F., Porcu, C., Bellodi, A., Cannas, R., Cau, A. L., Cuccu, D., et al. (2017). Temporal dynamics of demersal chondrichthyan species in the central western Mediterranean Sea: the case study in Sardinia Island. Fish. Res. 193, 81–94. doi: 10.1016/j.fishres.2017.04.001
Matić-Skoko, S., Šegvić-Bubić, T., Mandić, I., Izquierdo-Gomez, D., Arneri, E., Carbonara, P., et al. (2018). Evidence of subtle genetic structure in the sympatric species Mullus barbatus and Mullus surmuletus (Linnaeus, 1758) in the Mediterranean Sea. Sci. Rep. 8:676. doi: 10.1038/s41598-017-18503-7
Maunder, M. N., and Piner, K. R. (2015). Contemporary fisheries stock assessment: many issues still remain. ICES J. Mar. Sci. 72, 7–18. doi: 10.1093/icesjms/fsu015
McFarlane, G. A., and King, J. (2006). Age and growth of big skate (Raja binoculata) and longnose skate (Raja rhina) in British Columbia waters. Fish. Res. 78, 169–178. doi: 10.1016/j.fishres.2006.01.009
McQueen, K., Eveson, J. P., Dolk, B., Lorenz, T., Mohr, T., Schade, F. M., et al. (2018). Growth of cod (Gadus morhua) in the western Baltic Sea: estimating improved growth parameters from tag–recapture data. Can. J. Fish Aquat. Sci. 76, 1326–1337. doi: 10.1139/cjfas-2018-0081
Mejía-Falla, P. A., Cortés, E., Navia, A. F., and Zapata, F. A. (2014). Age and growth of the round stingray Urotrygon rogersi, a particularly fast-growing and short-lived elasmobranch. PLoS One 9:e96077. doi: 10.1371/journal.pone.0096077
Meunier, F. J., and Panfili, J. (2002). “Historical,” in Manual of Fish Sclerochronology, eds J. Panfili, H. de Pontual, H. Troadec, and P. J. Wright (Brest: IFREMER–IRD), 23–28.
Musick, J. A., and Bonfil, R. (eds) (2005). Management Tecniques for Elasmobranch Fisheries. FAO Fisheries Technical Paper No. 474. (Rome: FAO), 251.
Natanson, L. J., Mello, J. J., and Campana, S. E. (2002). Validated age and growth of the porbeagle shark, Lamna nasus, in the western North Atlantic. Fish. Bull. 100, 266–278.
Olsen, E. M., Ottersen, G., Llope, M., Chan, K.-S., Beaugrand, G., and Chr. Stenseth, N. C. (2011). Spawning stock and recruitment in North Sea cod shaped by food and climate. Proc. R. Soc. B 278, 504–510. doi: 10.1098/rspb.2010.1465
Panfili, J., de Pontual, H., Troadec, J.-P., and Wright, P. J. (eds) (2002). Manual of Fish Sclerochronology. (Brest: IFREMER-IRD), 464.
Porcu, C., Bellodi, A., Cannas, R., Marongiu, M. F., Mulas, A., and Follesa, M. C. (2015). Life–history traits of the commercial blonde ray, Raja brachyura, from the central–western Mediterranean Sea. Mediterr. Mar. Sci. 16, 90–102. doi: 10.12681/mms.898
Porcu, C., Bellodi, A., Cau, A., Cannas, R., Marongiu, M. F., Mulas, A., et al. (2020). Uncommon biological patterns of a little known endemic Mediterranean skate, Raja polystigma (Risso, 1810). Reg. Stud. Mar. Sci. 34, 1–13. doi: 10.1016/j.rsma.2020.101065
Punt, A. E., Smith, D. C., KrusicGolub, K., and Robertson, S. (2008). Quantifying age-reading error for use in fisheries stock assessments, with application to species in Australia’s southern and eastern scalefish and shark fishery. Can. J. Fish. Aquat. Sci. 65, 1991–2005. doi: 10.1139/F08-111
Quist, M. C., Pegg, M. A., and DeVries, D. R. (2012). “Age and Growth,” in Fisheries Techniques, 3rd Edn, eds A. V. Zale, D. L. Parrish, and T. M. Sutton (Bethesda, MD: American Fisheries Society Bethesda), 677–731.
Richards, F. J. (1959). A flexible growth function for empirical use. J. Exp. Bot. 10, 290–301. doi: 10.1093/jxb/10.2.290
Ricker, W. E. (1975). Computation and interpretation of biological statistics of fish populations. Bull. Fish. Res. Board of Can. 191, 1–382.
Righton, D., Kjesbu, O. S., and Metcalfe, J. D. (2006). A field and experimental evaluation of the effect of data storage tags on the growth of cod (Gadus morhua L. 1758). J. Fish Biol. 68, 385–400.
Scientific, Technical and Economic Committee for Fisheries [STECF] (2017). 54th Plenary Meeting Report (PLEN-17-01). (Luxembourg: Publications Office of the European Union), 99. doi: 10.2760/33472
Sebens, K. P. (1987). The ecology of indeterminate growth in animals. Ann. Rev. Ecol. Syst. 18, 371–407. doi: 10.1146/annurev.es.18.110187.002103
Serra-Pereira, B., Figueiredo, I., Farias, I., Moura, T., and Gordo, L. S. (2008). Description of dermal denticles from the caudal region of Raja clavata and their use for the estimation of age and growth. ICES J. Mar. Sci. 65, 1701–1709. doi: 10.1093/icesjms/fsn167
Skomal, G. B., and Natanson, L. J. (2003). Age and growth of the blue shark (Prionace glauca) in the North Atlantic Ocean. Fish. Bull. 101, 627–639.
Smith, B. J., Dembkowski, D. J., James, D. A., and Wuellner, M. R. (2016). A simple method to reduce interpretation error of ages estimated from otoliths. Open Fish Sci. J. 9, 1–7. doi: 10.2174/1874401X01609010001
Spedicato, M. T., Massutí, E., Mérigot, B., Tserpes, G., Jadaud, A., and Relini, G. (2019). The MEDITS trawl survey specifications in an ecosystem approach to fishery management. Sci. Mar. 83S1, 9–20. doi: 10.3989/scimar.04915.11X
Stevens, J. D., Bonfil, R., Dulvy, N., and Walker, P. A. (2000). The effects of fishing on sharks, rays, and chimaeras (chondrichthyans), and the implications for marine ecosystems. ICES J. Mar. Sci. 57, 476–494. doi: 10.1006/jmsc.2000.0724
Sulikowski, J. A., Irvine, S. B., DeValerio, K. C., and Carlson, J. K. (2007). Age, growth and maturity of the roundel skate, Raja texana, from the Gulf of Mexico, USA. Mar. Freshw. Res. 58, 41–53. doi: 10.1071/MF06048
Sulikowski, J. A., Morin, M. D., Suk, S. H., and Howell, W. H. (2003). Age and growth of the winter skate, Leucoraja ocellata, in the Gulf of Maine. Fish. Bull. 101, 405–413.
Tanaka, S., Cailliet, G. M., and Yudin, K. G. (1990). “Differences in growth of the blue shark, Prionace glauca: Technique or population?,” in Elasmobranchs as Living Resources: Advances in the Biology, Ecology, Systematics, and the Status of the Fisheries, Vol. 90, eds H. L. Pratt Jr., S. H. Gruber and T. Taniuchi (Washington, DC: NOAA), 177–187.
Taylor, C. C. (1960). Temperature, growth, and mortality – the pacific cockle. J. Cons. 26, 117–124. doi: 10.1093/icesjms/26.1.117
Vitale, F., Worsøe Clausen, L., and Ní Chonchúir, G. (2019). Handbook of Fish Age Estimation Protocols and Validation Methods. ICES Cooperative Research Report No. 346. (Copenhagen: ICES), 180. doi: 10.17895/ices.pub.5221
von Bertalanffy, L. (1938). A quantitative theory of organic growth (inquires of growth laws II). Hum. Biol. 10, 181–183.
Whittamore, J., and McCarthy, I. (2005). The population biology of the thornback ray, Raja clavata in caernarfon bay, north wales. J. Mar. Biol. Assoc. U.K. 85, 1089–1094. doi: 10.1017/S0025315405012130
Winsor, C. (1932). The Gompertz curve as a growth equation. Proc. Natl. Acad. Sci. U.S.A. 18, 1–8. doi: 10.1073/pnas.18.1.1
Wintner, S. P., and Dudley, S. F. J. (2000). Age and growth estimates for the tiger shark, Galeocerdo cuvier, from the east coast of Africa. Mar. Freshw. Res. 51, 43–53. doi: 10.1071/MF99077
Keywords: Raja clavata growth, age validation, fish tagging, oxytetracycline, back-calculation
Citation: Carbonara P, Bellodi A, Palmisano M, Mulas A, Porcu C, Zupa W, Donnaloia M, Carlucci R, Sion L and Follesa MC (2020) Growth and Age Validation of the Thornback Ray (Raja clavata Linnaeus, 1758) in the South Adriatic Sea (Central Mediterranean). Front. Mar. Sci. 7:586094. doi: 10.3389/fmars.2020.586094
Received: 22 July 2020; Accepted: 23 November 2020;
Published: 16 December 2020.
Edited by:
Nicolas Bailly, University of British Columbia, CanadaReviewed by:
Cui Liang, Institute of Oceanology (CAS), ChinaMa. Carmen Anonuevo Ablan Lagman, De La Salle University, Philippines
Copyright © 2020 Carbonara, Bellodi, Palmisano, Mulas, Porcu, Zupa, Donnaloia, Carlucci, Sion and Follesa. This is an open-access article distributed under the terms of the Creative Commons Attribution License (CC BY). The use, distribution or reproduction in other forums is permitted, provided the original author(s) and the copyright owner(s) are credited and that the original publication in this journal is cited, in accordance with accepted academic practice. No use, distribution or reproduction is permitted which does not comply with these terms.
*Correspondence: Pierluigi Carbonara, Y2FyYm9uYXJhQGNvaXNwYS5pdA==