 Patricia Lastra Luque
 Saburo Sakai
 Hilario Murua
 Haritz Arrizabalaga
- 1AZTI, Marine Research, Basque Research and Technology Alliance (BRTA), Pasaia, Spain
- 2Japan Agency for Marine-Earth Science and Technology (JAMSTEC), Biogeochemistry Program, Yokosuka, Japan
- 3International Seafood Sustainability Foundation (ISSF), Washington, DC, United States
Background: Micromilled fish otoliths (ear bones) have been widely used for stable oxygen (δ18O) and carbon (δ13C) isotope analysis. The first dorsal fin spine is routinely used for ageing in the eastern Atlantic bluefin tuna (ABFT) population; however, stable isotope analysis remains unapplied in this hard structure. The objective of the present protocol is to achieve a sequential sampling of growth layers in the ABFT fin spine at high spatial resolution and along growth trajectory for stable isotope analysis.
Methods: We used a micromilling and micro-powder collecting technique for sequentially sampling annual growth layers of the fin spine bone collected from freshly caught ABFT. We assessed the carbonate content and the optimal drilling amount to ensure enough powder quantity was recovered from each annual growth band to accommodate accurate measurement of the δ18O and δ13C values.
Results: The optimal drilling path included 20 drilling lines in 49 μm, with 400 μm depth and 900 μm-line width, which represents a time resolution of about 2.5 months. The minimum powder quantity required from each annual growth layer for δ18O and δ13C isotope analysis was approximately 180 μg because the carbonate contents in the fin spine powder was 5–6%. The δ18O profile assayed in the last growth intervals coincide with the surface δ18Oseawater for the southern west waters off the Norwegian coast, where the tuna was caught. The fluctuating pattern in the second growth interval may reflect certain fidelity to the Norwegian SE and Swedish SW coast and/or otherwise to the US west coast. The δ13Cspine displayed a larger temporal variability along the growth transect that may be explained by several factors including differences in habitat use, behavior, and even trophic level.
Conclusion: Based on the result obtained, we present an optimal standard protocol for the sampling of sequential, annually formed growth layers in the fin spine bone for stable isotope analysis using the micro-milling as a high precision technique. This protocol is particularly useful in endangered and/or protected species for which fin spines represent a non-lethal alternative to otoliths opening new research avenues to improve their management and conservation.
Introduction
Stable isotope analyses of fish hard tissues (i.e., otolith, scales, vertebrae, fin spines, and rays) has contributed to fishery science addressing fundamental questions in fish ecology such as habitat use, stock structure (Campana, 2005) movements patterns (Elsdon et al., 2008), climate regime shifts, and even dietary patterns (Acosta-Pachõn et al., 2015; McMahon et al., 2015; Tzadik et al., 2015). Fisheries biologists have put considerable attention on the stable oxygen (δ18O) and carbon (δ13C) isotope analyses of carbonates in fish otoliths as they are calcium carbonate structures metabolically inert i.e., is not subsequently resorbed or altered (Campana and Neilson, 1985). Hence, otolith isotopic information from core-to-edge, i.e., along otolith growth trajectory, provides time calibrated insights into marine and freshwater habitats experienced during the life of fish (Campana, 1999). However, otolith removal requires sacrifice of the individual fish, which may be prohibited in the case of endangered and/or protected fish species. Alternative hard tissues such as the first dorsal fin spine bone (fin spine hereafter) may provide valuable and complementary isotopic information particularly valuable for species can neither be sacrificed for their otoliths (i.e., rare and/or endangered species) nor feasible sampled due to management concern like the Atlantic bluefin tuna (Thunnus thynnus) (ABFT), that otolith removal greatly affects the appearance of a fish, diminishing their market value. In this regard, the fin spine has proven useful for direct ageing purposes of ABFT, at least for small and medium sized specimens (Luque et al., 2014), and comparative analysis has shown that fin spine ages are in close agreement with otolith ages (Rodríguez-Marín et al., 2014). To assess whether this alternative structure is suitable for stable isotope analysis is important for the eastern ABFT population since its current growth curve is based on estimates using this structure (International Commission for the Conservation of Atlantic Tunas [ICCAT], 2013). In addition, growth histories recorded in dorsal fin spines have been shown to offer attractive, potentially non-lethal alternatives to otolith collection (Zymonas and McMahon, 2006) for studying biological aspects of some endangered species (Smith and Whitledge, 2010; Jarić et al., 2011; Phelps et al., 2012; Wolff et al., 2013; Rude et al., 2014). Fin spines are mainly composed of hydroxyapatite (HA) [Ca10(PO4)6(OH)2], a type of calcium phosphate which is deposited onto collagen fibrils (Tzadik et al., 2017). Unlike otolith, fin spine resorption through life is well documented (e.g., Luque et al., 2014) and can alter their primary compositions. However, marginal areas of fin spines are least affected by resorption and may still retain chemical compositions incorporated during growth, making the fin spine bone a suitable candidate for reconstructing past aquatic of fish habitats (Clarke et al., 2007; Tzadik et al., 2017). Indeed, Luque et al. (2016) showed the metabolic stability of some biologically essential trace elements in the ABFT fin spine as they were consistently retained in its marginal area. However, the measurement of δ18O and δ13C in the carbonates of the HA matrix remains unexplored. Recently, the carbonate fraction in the ABFT fin spine bone was explored showing that carbonate ions () substitution is regular within the HA matrix and the preferential substitution of – ions within the crystal lattice is by phosphate groups (B-type HA) (Luque et al., 2019) as it was expected for a bone. This knowledge of the nature of the carbonate substitution within the HA crystal lattice is crucial for a correct measurement and ecological interpretation of δ18O and δ13C of its carbonates. Additionally, as the limiting factors when analyzing the mineral component of bone in terms of its isotopic composition are (1) the sample quantity required for an accurate measurement of δ18O and δ13C, and (2) the spatial resolution of sample collection analysis depends on the sampling technique used. This would also imply to estimate firstly the carbonate content in the fin spine powders. In addition, these high-resolution analyses are also affected by the recovery ratio of the milled sample (Sakai and Kodan, 2011), that is desirable to be quick and efficient step, minimizing time during transfer powder to a reaction vial, and ensuring enough powder quantity is collected from each annual band with no mixing annulus.
Micromilling technique is commonly used in the analysis of the isotopic composition of geological materials (Dettman and Lohmann, 1995; Frappier et al., 2002, 2007). Recently, the tendency of this research area has moved towards high-resolution analysis by developing diversified tools to extract microgram-size sub-specimens from appropriate sites in skeletal material including reef corals (Linsley et al., 1994; Sakai, 2007), bivalves (Dettman and Lohmann, 1995) and fish otoliths (Fraile et al., 2015, 2016), improving the spatial resolution of samples within the analyzed tissues. But to date, this high-resolution analysis still remains unapplied in the fin spine bone for most of the top pelagic predators including the Atlantic bluefin tuna. The objective of the present protocol is to achieve a sequential sampling of growth layers formed in the bluefin tuna fin spine bone at high spatial and temporal resolution (yearly) to produce isotopic time series along fish growth trajectory. This analysis could help us to retrospectively produce tuna movement insights among different marine habitats (e.g., feeding and spawning grounds) experienced during the life histories of fish. For that purpose, we present guidelines for the sequential milling of the fin spine bone collected from a freshly caught ABFT for ageing purposes.
We detail the steps necessary that include (i) obtaining the fin spine section, (ii) evaluate the carbonate content of fin spine bone, (iii) designing an optimal sampling plan of drilling individual growth layers, and (iv) extract enough fin spine material (i.e., powder) of good quality (i.e., no mixed annulus) for each growth layer for a reliable measurement of carbon and oxygen stable isotopes. The efficiency of this protocol, previously demonstrated in other carbonate structures, provides accurate carbon and oxygen values for those structures and improves recovery rate and handling time (Sakai and Kodan, 2011). The protocol can be applied to other species which currently use or will be using this hard structure as alternative or complementary to otolith for isotope analysis, and for which annual growth increments in fin spines has been validated. This protocol allows for efficiency comparisons among studies and eliminate potential inconsistencies among methods.
Materials and Methods
Bluefin Tuna Fin Spine Bone Sample Collection
The first spiniform ray of the first dorsal fin of one ABFT was extracted from a fresh specimen caught on August 2017 by a Norwegian commercial purse seiner in the North-east Atlantic Ocean (60° 33′N; 4° 7′E). The specimen’s straight fork length (SFL) was 218 cm.
Fin Spine Bone Preparation
Fin spines were prepared following the procedure described in Luque et al. (2014). An illustration of workflow for ABFT fin spine preparation is displayed in Figure 1. The fin spine extracted was carefully cleaned of the remaining skin tissue with a sharp scalpel, avoiding any damage to the surface of the base of the fin spine. Then, the fin spine was washed with Milli-Q water and air dried at room temperature for 24 h. Prior to sectioning, the maximum width of the condyle (Dmax) was measured (±0.1 mm) with a digital caliper (Figure 2a) and marks were made at the point 1.5 times the condyle base width (1.5Dmax) (Figure 2b) where sections were removed. This sectioning axis has proved to enhance the contrast of annuli and to reduce the effect of nucleus vascularization (Luque et al., 2014), ensuring growth increments contained compact cortical bone without resorption. Two consecutive transversal sections of 0.7 mm and 3 mm thickness, respectively, were obtained with an Isomet low-speed saw provided with a diamond blade 0.2 × 0.5 × 12.7 mm (Series 15HC; Ref. 11-4244) and working at 250–300 rpm (Buehler, Lake Bluff, IL, United States). The first section was digitalized using an image analyzer for ageing purposes. While the second cross section was used for milling of sequential growth layer and analyzing stable isotope ratios of carbon (δ13Cspine) and oxygen (δ18Ospine) along the growth trajectory. Additionally, fin spine sections underwent an extra cleaning cycle using an ultrasonic water bath for 10 min with ultrapure deionized water (Milli-Q, 18.2 M ohm cm–3) to remove excess organic tissue (Luque et al., 2019). The sections were rinsed again with ultrapure water, placed in new 1.5 ml vials, and allowed to dry in class 100 laminar-flow hood for 48 h.
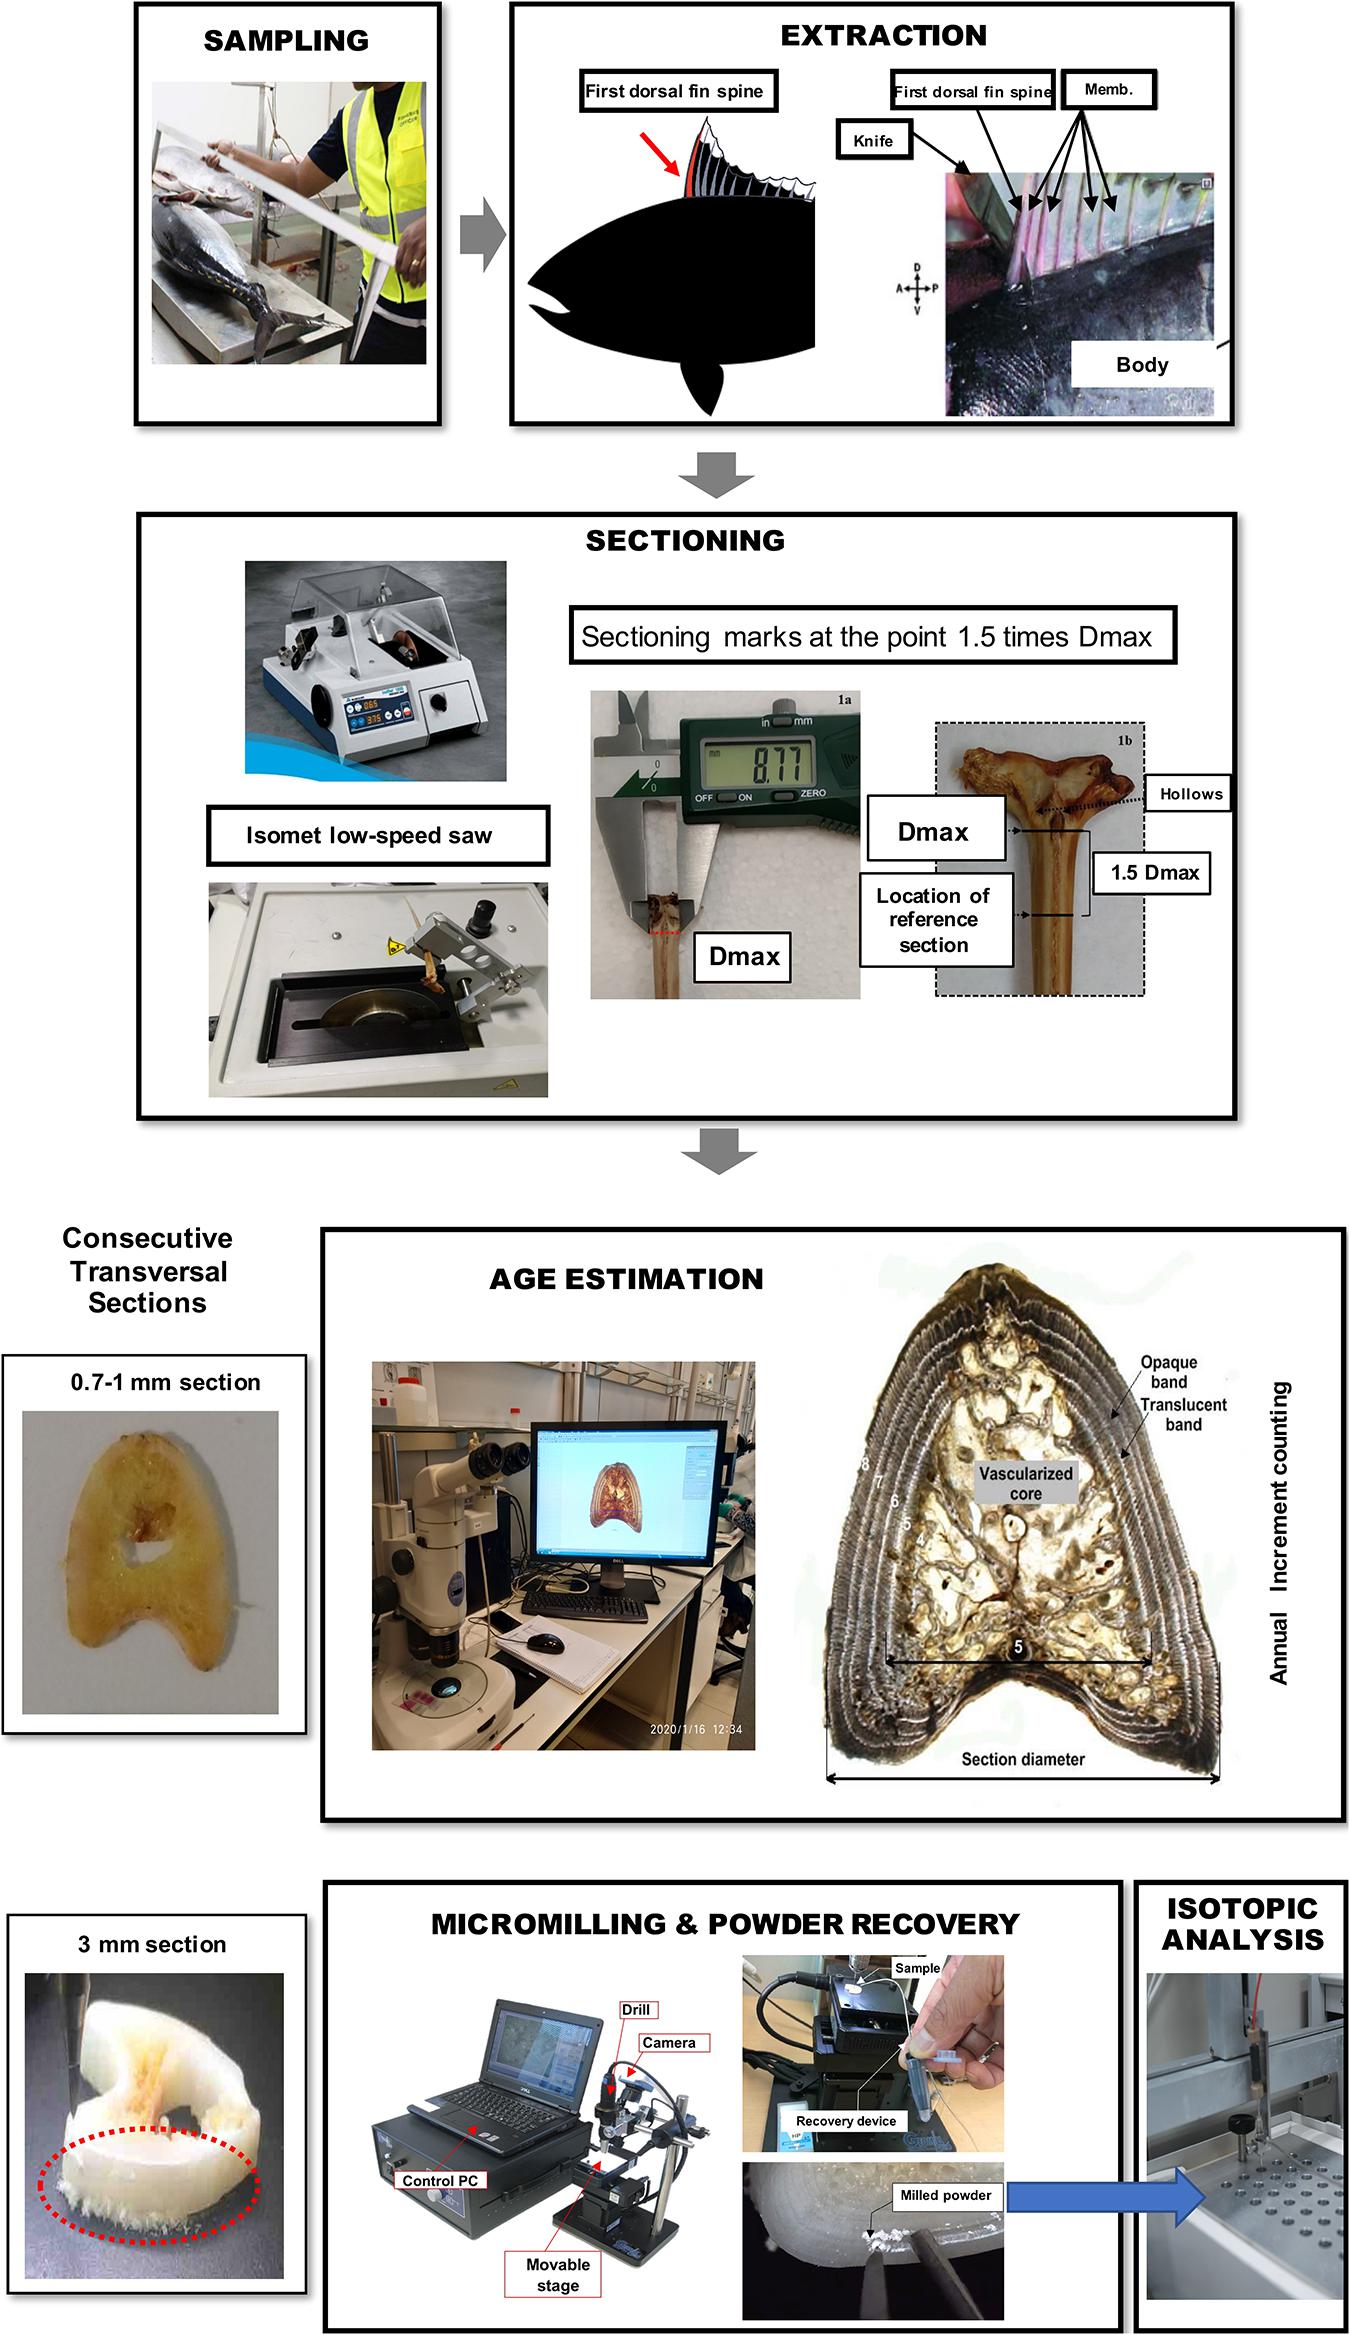
Figure 1. Illustration of workflow for bluefin tuna fin spine sampling, preparation, age interpretation, micromilling, and isotopic analysis processing.
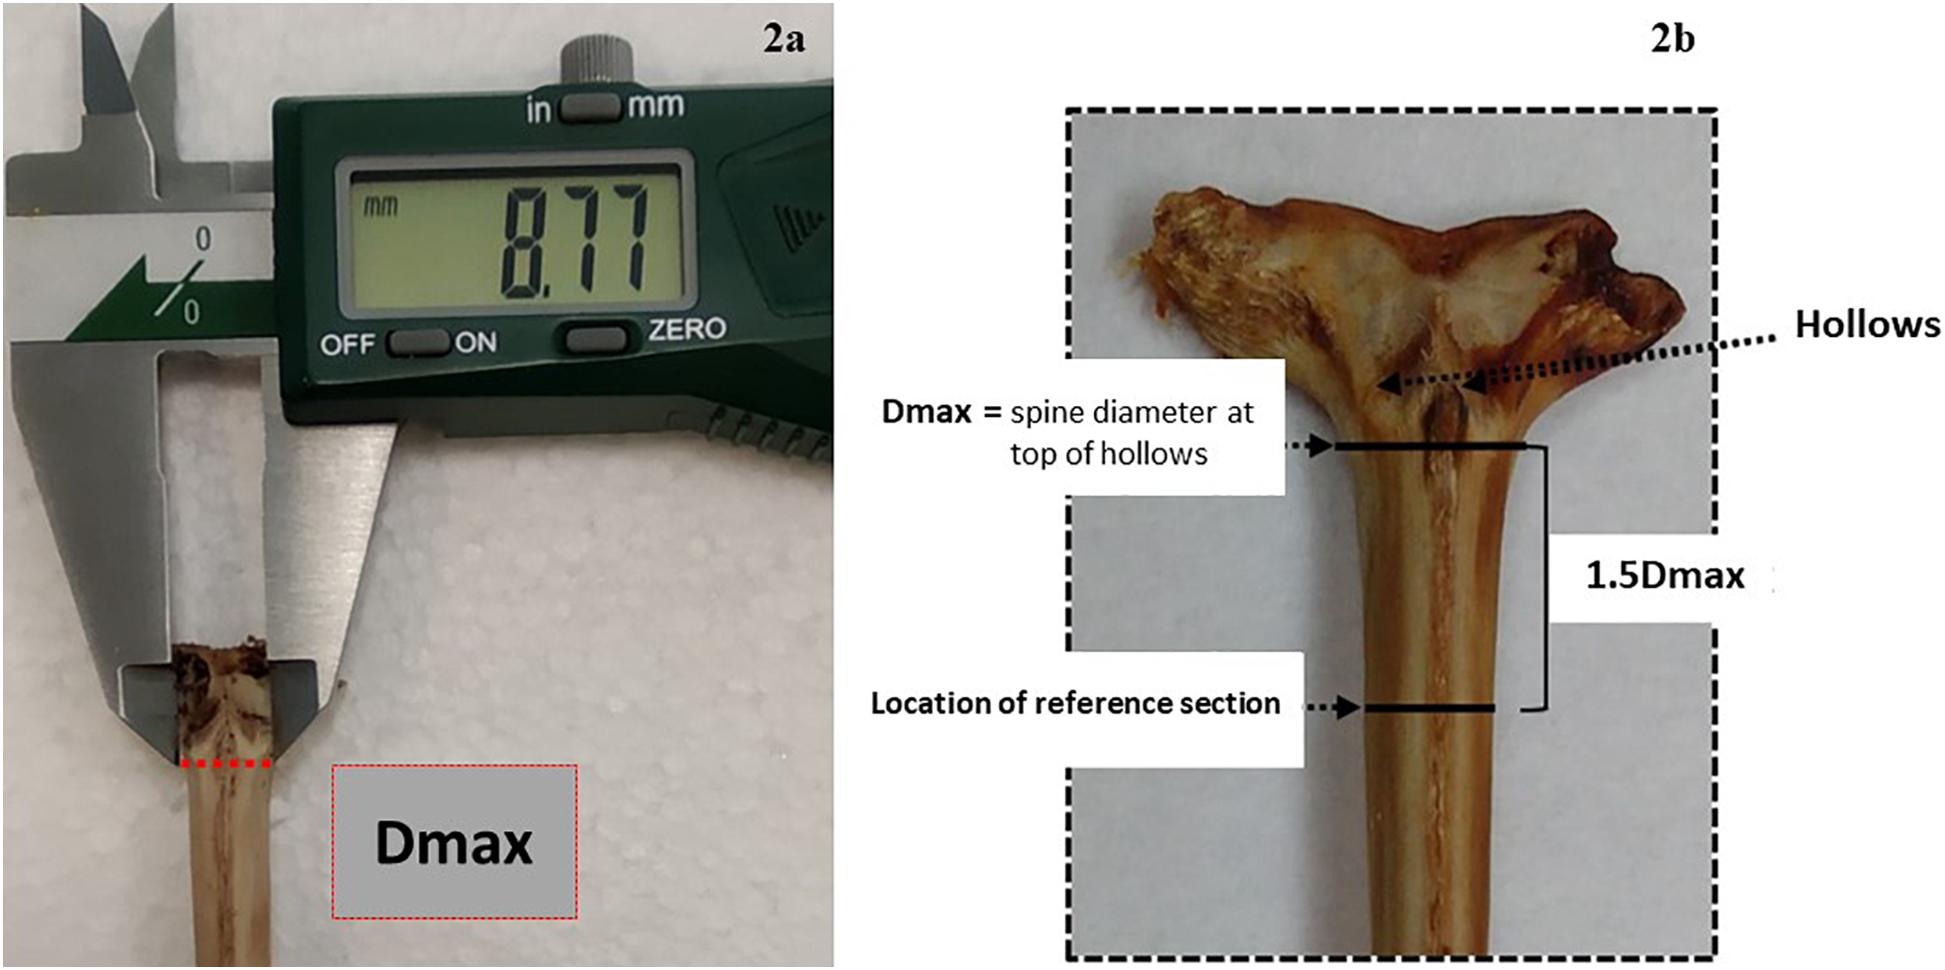
Figure 2. Description of the sectioning axis location: (a) an anterior view of the condyle base and the location of Dmax, which is manually measured with the calliper along the imaginary line below the hollows, (b) an anterior view of the condyle base and the location of the 1.5 cutting axis at 1.5 Dmax from the same imaginary line.
Age Interpretation and Annuli Age Assignment
Age interpretation and annulus measurements of fin spine section was performed following Luque et al. (2014) methodology for direct ageing of ABFT from the eastern Atlantic Ocean and Mediterranean Sea. An annulus was defined as a bipartite structure consisting generally of a wide opaque band followed by a narrow translucent band, presumably formed on a yearly basis. Age was estimated by counting the translucent bands (Luque et al., 2014). Age interpretation was performed using digital images that were captured with a binocular lens magnifier connected to a digital camera. An image analyzer (Nis-elements D 3.0, Nikon software; www.nikon.com) was used to measure the total diameter of the fin spine section and the visible translucent bands at its external border (Figure 1). In fish older than three years old, the central area of the spine begins to reabsorb, and the bands consequently disappear, although it represents a real handicap in specimens older than five years old. To overcome the problem of reabsorption of annuli with age, a replacement method modified from Hill et al. (1989) was followed. Once the age of the first inner visible translucent band was estimated, final ages were calculated by adding the number of translucent bands estimated to lie within the vascularized area and the number counted between the vascularized area and the spine edge (Luque et al., 2014). In this regard, an estimated age was assigned to each of the observed growth increment to ensure the milling along the growth trajectory.
Powder Amount Requirements for Fin Spine Bone Stable Isotope Analyses
Prior to any stable isotope assays in carbonate, it is necessary to determine the carbonate content of the bone structure. In this regard, the 3 mm-thick fine spine section was firstly used to obtain high-volume of powder from the whole area of the fin spine, to evaluate the carbonate content in the fin spine bone. We drilled through the whole area with approximately 500 μm depth by a high-resolution GEOMILL326 Micromill System (GEOMILL 326, Izumo Web Ltd., Japan) using a tungsten carbide bit (Shofu Ltd., Japan) (Figure 2). We weighed the fin spine powders between 46 μg and 440 μg and pure calcium carbonate powders to the glass vials for δ18O and δ13C analyses using a micro-balance (Sartorius AG, Germany). Carbonate content of fin spine powders was calculated by comparing evolved CO2 gas volume by the reaction with the Hydroxyapatite (HA) and pure carbonate powders and phosphoric acid which are introduced to the isotope ratio mass spectrometer (Table 1). Evolved CO2 gas volume was calculated from the detection intensity of 12C16O16O (mass 44) which occupy most of CO2 isotopologues (98.4%).
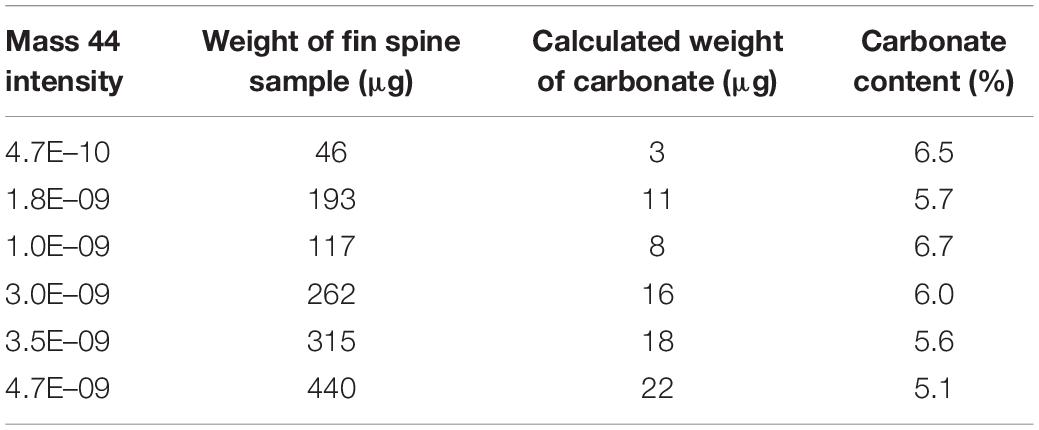
Table 1. Evaluation of carbonate contents in fin spine bone powder.
Sequential Sampling of Fin Spine Annual Growth Layers by Micro-Milling System
We used a computer guided function of GEOMILL326 micromill system for sampling sequentially, the annually formed growth layer in the fin spine (Figure 1). The fin spine section under investigation was mounted on the micro-mill sample plate using 10 μm-thick two-sided tape (3 M) to prevent the vibration of sample by drilling. This plate is placed on a motorized stage under a LED downward light. Prior to drilling, we identified individual annual growth layers in the fin spine section with real-time images that are viewed on a computer screen via a CMOS camera connected to a zoom lens. Then, we outlined a sampling plan based on annual growth layer width, and the proximity to the fin spine nucleus vascularization. Since the annuli on the fin spines show a concentric distribution, drilling sample paths were pre-programmed following the contours of the externally visible annual translucent and opaque bands, ensuring that single annulus are extracted We sampled from the exterior to inner annulus minimizing the drilled-powder collection loss using the micro-powder collecting device (Kyushu-Danji, Izumo Web Ltd., Japan) and ensuring single-growth layer sampling. Further, we only sampled those annuli contained in the compact bone, avoiding the central vascularized nucleus because (i) the annulus have been, or are in the process of being resorbed and (ii) the cellular turnover and molecular exchange differs in comparison with the cortical bone and would not yield isotope values that are comparable to cortical bone (Tomaszewicz et al., 2016). In this regard, fin spine section was milled following a pre-programmed drill path from the outer edge of the fin spine inwards and that includes 20 drilling lines using roughly 300–400 μg of fine spine, which means that the time resolution is about 2.5 months (49 μm interval on average with 400 μm depth and 900 μm-line width). Upon completion of drilling each drill path, the milled bone powder is vacuumed using the vacuum powder recovery system (Sakai and Kodan, 2011) into the glass vials for δ18O and δ13C analyses.
Oxygen and Carbon Isotope Measurements (δ18O and δ13C)
δ18O and δ13C of powder samples for each milled layer were analyzed on an automated carbonate preparation device (MultiPrep) coupled to an isotope-ratio mass spectrometer (GV Instruments) at Japan Agency for Marine-Earth Science and Technology. Powdered samples were reacted with dehydrated phosphoric acid under vacuum at 90°C. The isotope ratio measurement is calibrated based on repeated measurements of NBS-19 and precision is ±0.1‰ for oxygen and carbon isotopes (±1 SD). For the sample powder preparation, we did not use any pre-treatment techniques normally used for bioapatite to remove secondary contaminants and organic matters because the fin spine was freshly taken from a living fish and not from an archeological samples (Snoeck and Pellegrini, 2015), and also because recently organic removal treatment is not used for most of the current δ18O and δ13C analyses such as foraminifers (Serrano et al., 2008).
Fitting Curves to Data
The sequence of analysis was done from the outer edge of the fin spine inwards, and data was plotted in function of distance to “the edge of the spine.” The Locally Weighted Least Squares Regression smoothing technique (LOESS) was used to fit data to a curve (Cleveland et al., 1988; R Core Team, 2017). This technique estimates the deviations of data (confidence intervals) to the fitted curve. The model was fitted locally using a bandwidth including data in a neighborhood of x in the curve. Data were weighted considering the distance from x. We applied α = 0.38 as the size of the bandwidth. This smoothing technique is a powerful and adjustable method potentially mining information from the isotopic data that is difficult to unravel using a parametric model to fit data. The regression model was constructed using R (R Core Team, 2017) on RStudio (RStudio Team, 2016).
Results and Discussion
Oxygen and Carbon Isotope Measurements
Carbonate contents in the fin spine powder were calculated around 5–7% based on the comparison with the evolved CO2 gas volume from the pure calcium carbonates (Table 1). Currently, general gas-source mass spectrometer requires at least 10 μg of carbonate powder for δ18O and δ13C analysis. Considering the estimated carbonate content in the fin spine, the minimum powder quantity required from each annual band was estimated to be at least 180 μg.
To ensure that enough powder was collected from each annual growth layer for accommodating an accurate measurement of δ18O and δ13C, we designed to drill 20 lines starting from the edge (i.e., line 1) and moving inward along growth intervals to the annuli assigned as the 6th (i.e., line 20); i.e., the whole drilling area laid down within the last three annuli (Figure 3). This sampling design was considered the optimal one that allows the milling of sectioned fin spines by 49 μm increments (2.5 months) at the highest level of precision improving the spatial resolution of sample collection for isotope analysis (Figure 3). In addition, one of the main problems regarding high resolution analysis concerns the recovery ratio of the milled sample. Sample recovery has been mostly performed with a pointed scalpel blade (Dettman and Lohmann, 1995), that implies a substantial proportion of the milled material is lost during transfer to a reaction vial. The vacuum pump system, recently developed and included in the high precision GEOMILL326 system, enables to achieve a rapid recovery of around 5 to 100 μg of carbonate with a high recovery ratio (>90%) (Sakai and Kodan, 2011). This is especially useful for bone tissue samples as there is frequently not enough material removed via micromilling of sequential growth layers to accommodate isotopic analysis without mixing powder from sequential milled annuli.
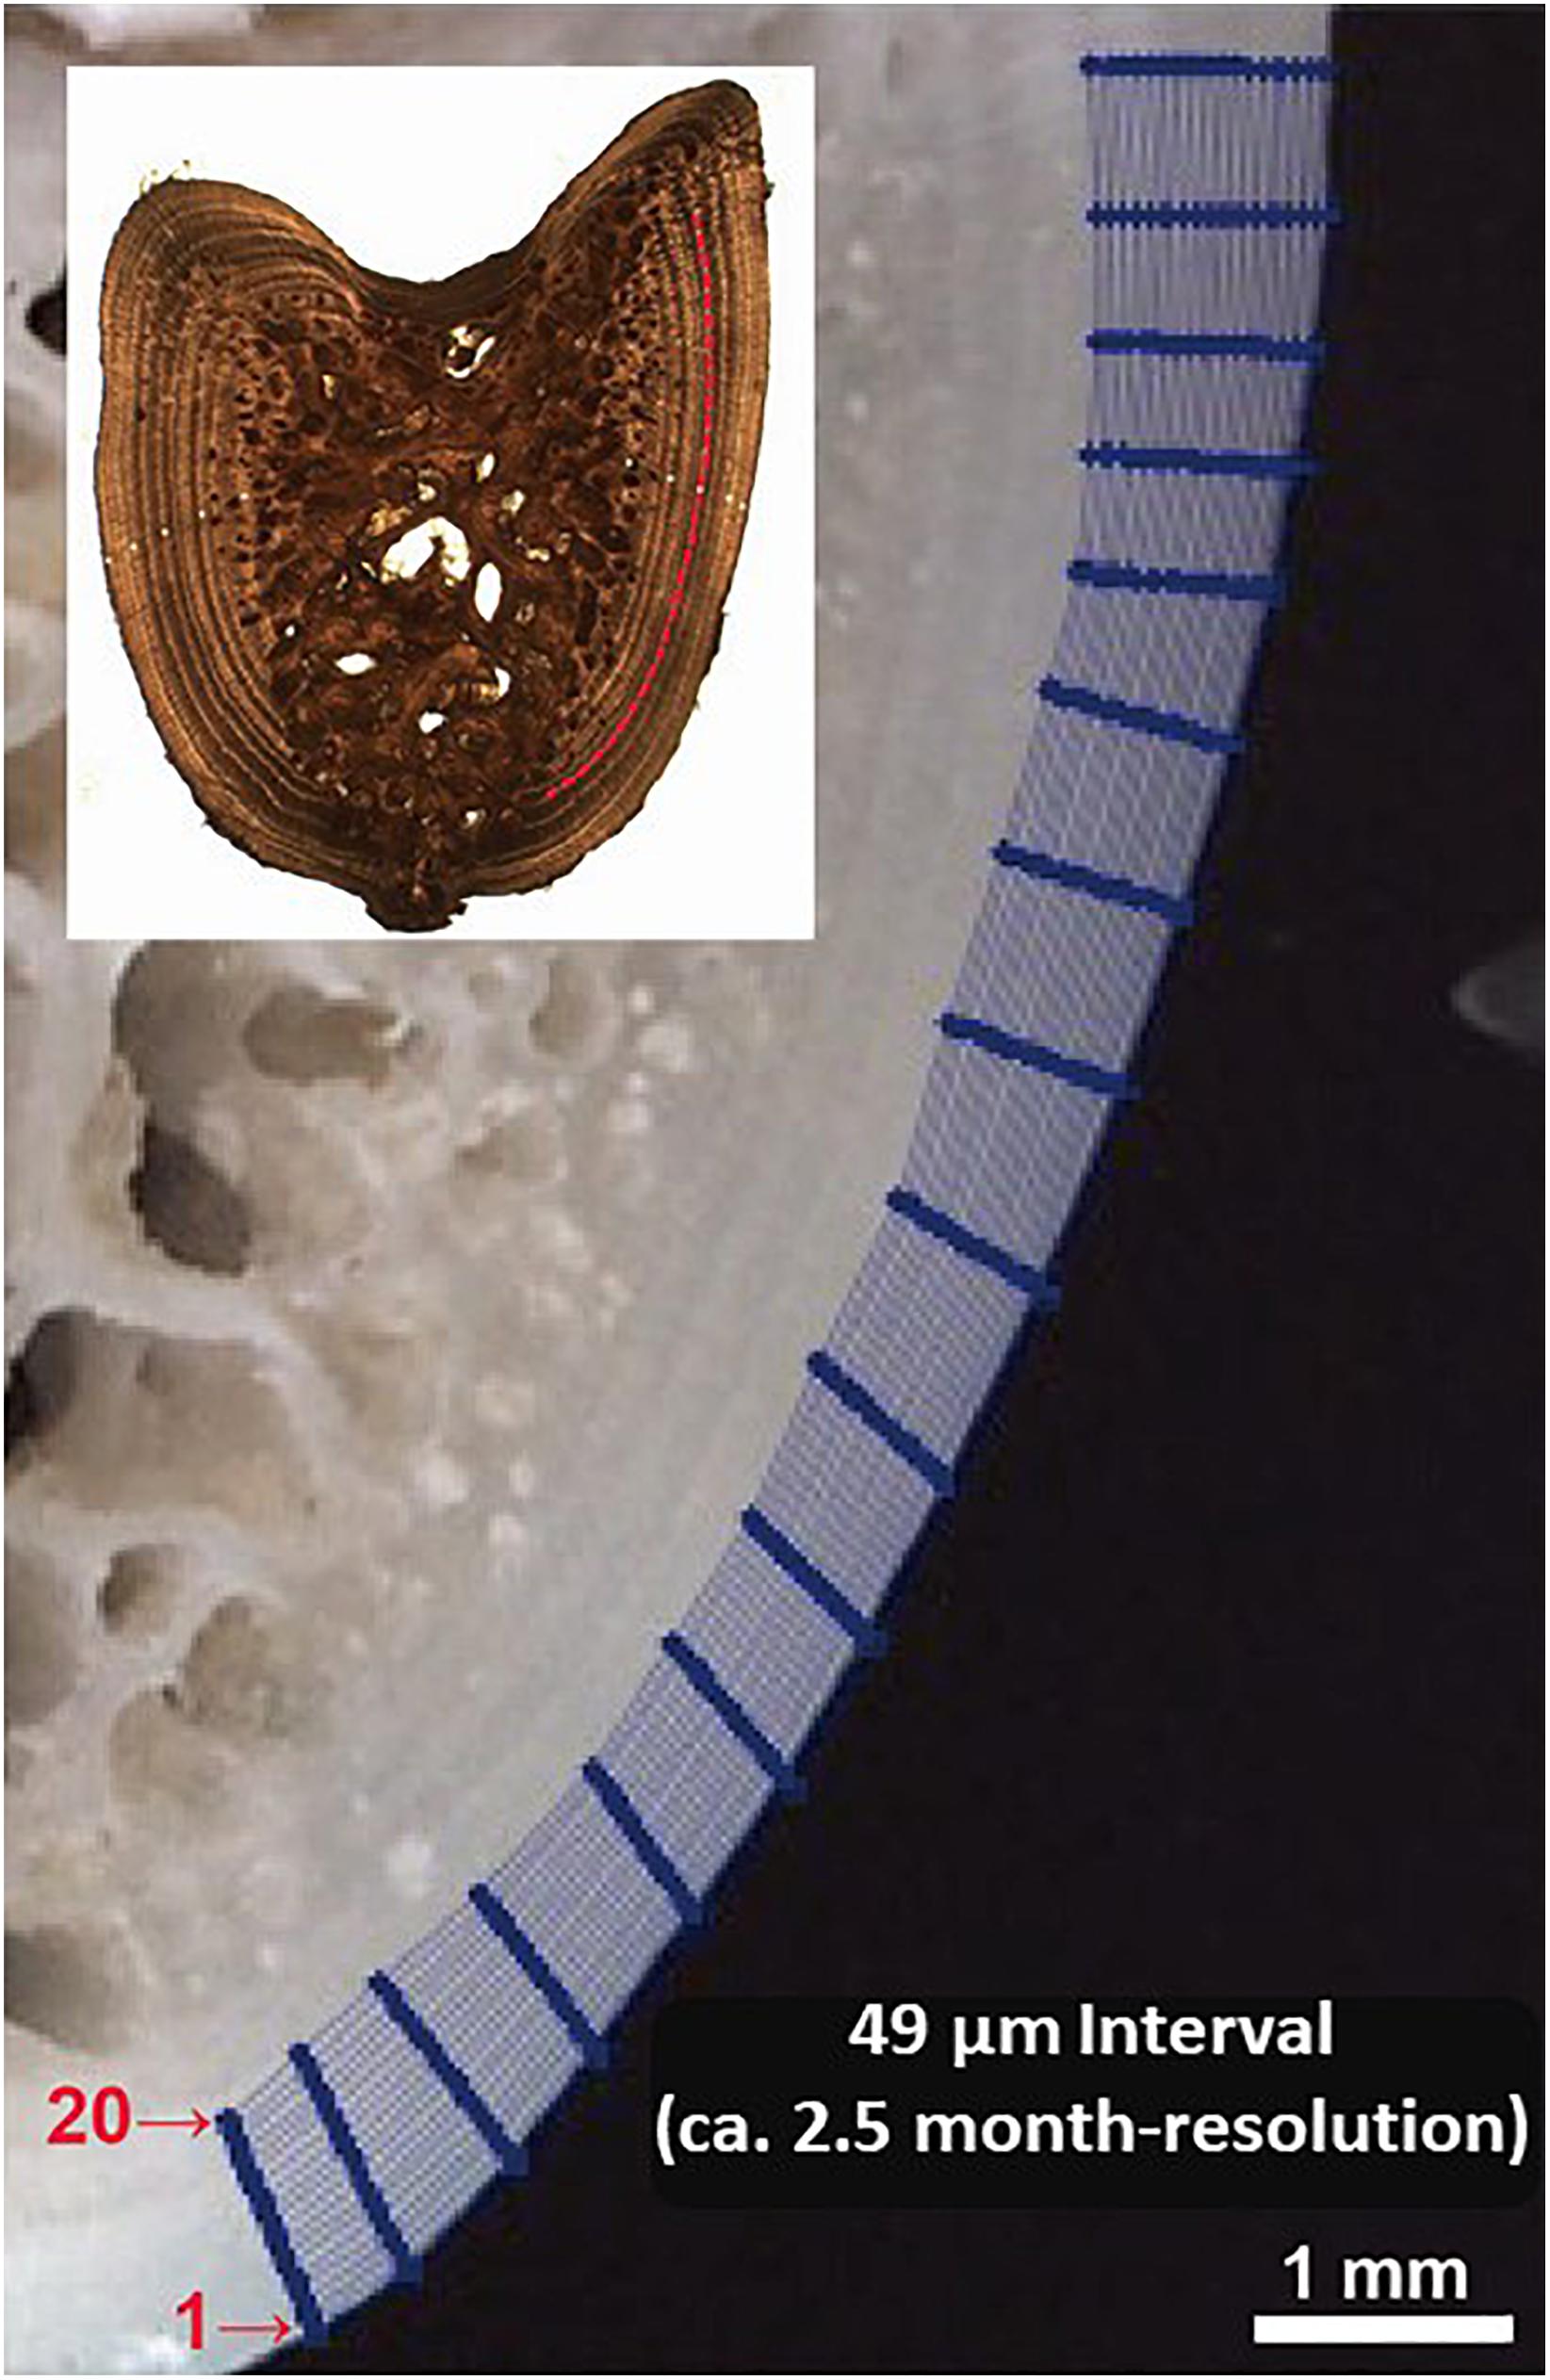
Figure 3. Illustration of micromilling sampling plan designed for fin spine cross section. The sequence of analysis was done from the outer edge of the spine inwards (i.e., lines 20 to 1) which follow the growth annual intervals.
Reconstructing Life Fish History With High-Resolution Fin Spine Isotopic Data
ABFT is a large highly migratory species that inhabits the North Atlantic Ocean (NAO) and its adjacent seas such as the Mediterranean Sea (Fromentin and Powers, 2005; Rooker et al., 2007) and Norwegian waters (Nøttestad et al., 2017). Individuals commonly cross the Atlantic Ocean but also return to natal areas to spawn (Graves et al., 2015; Rooker et al., 2014, 2019). It is widely recognized that an improved understanding of the movement and exchange of ABFT from the two primary spawning zones— Gulf of Mexico (western) and Mediterranean Sea (eastern)—is critically needed for management purposes (Kerr et al., 2016; Rodríguez-Ezpeleta et al., 2019).
In the present study, the ABFT specimen was aged 8 years old by counting the translucent bands annually formed in the fin spine section (Luque et al., 2014). The fin spine stable isotope ratios of oxygen (δ18Ospine) and carbon (δ13Cspine) from the spine edge to inside and along the milled growth intervals, ranged from −0.9 ‰ to −1.7 ‰, and from −5.0 ‰ to −3.2 ‰, respectively (Figure 4A). The highest δ18Ospine value (-0.9 ‰) was recorded at the outer edge of the spine. This value coincides with surface δ18Oseawater data for the southern waters off the Norwegian coast (LeGrande and Schmidt, 2006), where the ABFT specimen was caught. From there, the isotopic profile depicts a fluctuating pattern with δ18O values between −1.7 ‰ and −1.2 ‰ and showing relative minimums at spine inward (i.e., milled lines 11, 12, and 16) that correspond with the annuli 7th and the annuli 6th, respectively, and relative maximums at lines 14 and 19 that correspond to annuli 6th (Figure 4A).
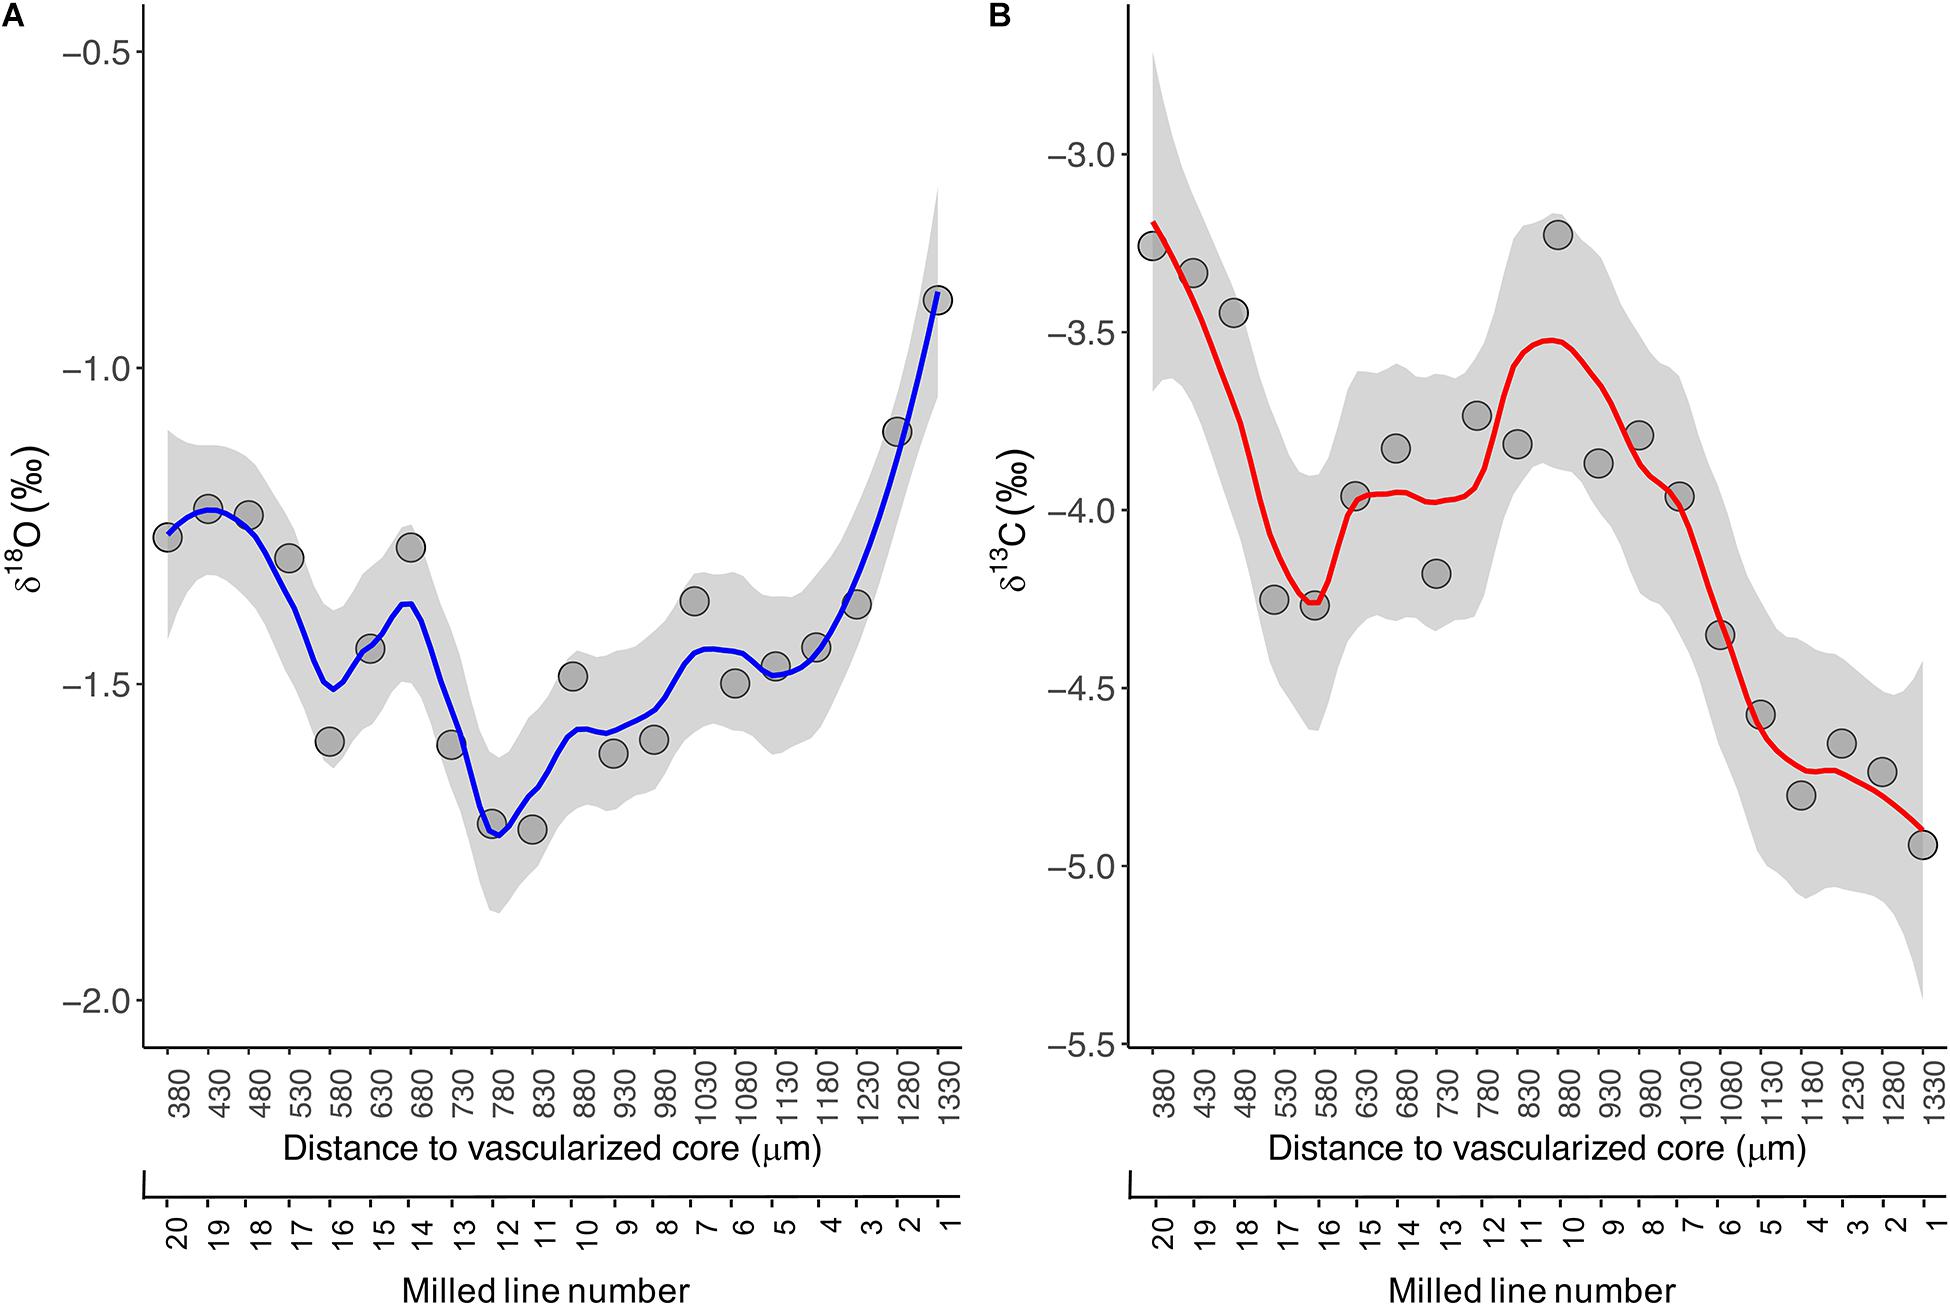
Figure 4. LOESS regression curves (solid lines) with smoothing based on 95% confidence intervals (grey area) for the δ18Ospine (A) and δ13Cspine (B) values assayed across growth intervals in the fin spine section. Data was plotted in function of distance to the fin spine edge (μm).
The fluctuating pattern and values described above can be explained by two possible hypotheses in line with the global surface δ18Oseawater data (LeGrande and Schmidt, 2006; Jefanova et al., 2020) and the ABFT movement patterns in the North Atlantic Ocean (Arregui et al., 2018; Rooker et al., 2019). A first hypothesis could indicate that the ABFT show certain fidelity to the Swedish south west (SW) and Norwegian south east (SE) coasts with successive excursions in and out the Skagerrak and Kattegat straits because δ18Ospine values assayed coincides with surface δ18Oseawater data in these waters (Jefanova et al., 2020). A second hypothesis may indicate a link of ABFT with the Grand Banks and the Mid-Atlantic Bight (North western Atlantic coast) which is related to the negative δ18Ospine data obtained. This second hypothesis could suggest that (1) the ABFT remained off the east coast of the United States for the entire year (age 6–7) and then move to the Norwegian waters, or (2) the fish made a transoceanic migration between the United States coast and Skagerrak and Kattegat straits waters. However, in this case, it seems that the fin spine did not record a signature during these transoceanic excursions in the North Atlantic Ocean where surface δ18Oseawater values are around 0.4 ‰ (LeGrande and Schmidt, 2006).
Albeit the result of habitat use obtained from a single bluefin tuna fin spine should be considered with caution; however, it demonstrates the ability of the fin spine bone in retaining an oxygen isotopic signature from the seawater where the tuna inhabits along growth trajectory. As such, it suggests the fin spine bone a suitable candidate for detecting a signature for the (eastward ←→ westward) transoceanic movement and even local excursions to (i) foraging areas like the Bay of Biscay, and (ii) spawning zones such as the Mediterranean Sea for the eastern ABFT population. In this regard, further fin spine isotope analysis using samples collected from adults but also from juveniles will be necessary to examine whether isotopic signatures in the fin spines could provide evidence of such transoceanic and/or local migration, which is particularly interesting for the juvenile stage as less knowledge on migrations using e-tags is available for juveniles than adults (Arregui et al., 2018).
Besides, the isotopic composition of carbon in tissues of pelagic animals is strongly dependent on fractionation of carbon isotopes during photosynthesis by the phytoplankton community at the base of the marine food web. Such fractionation varies with sea surface temperature (Goericke and Fry, 1994). Consequently, carbon isotope ratios can be used to identify the location of feeding grounds for any pelagic animals for which tissue archives and matching records of sea surface temperature are available over the possible spatial range of the species (MacKenzie et al., 2011). But the relationship between SST and δ 13C values is complex (Cassar et al., 2006), and varies spatially with climatic and oceanographic conditions. In the present study, the δ13Cspine values showed large temporal variability across growth intervals. It increased from −5.0 ‰ to −3.2 ‰ in portions from the outer edge of the spine inward up to line 10, while a more fluctuating pattern is displayed beyond line 11 to spine inward with δ13C values between −4.2 ‰ and −3.2 ‰ and showing relative minimums at milled lines 10 and 20, and relative maximums at milled lines 16 and 17 (Figure 4B). Interpretation of results regarding δ13Cspine is out of the present work and requires further research as the δ13Cspine may reflect not only δ13C of dissolved inorganic carbon in the ambient water (δ13CDIC) but also the diet (δ13Cdiet). Hence, such variability may be explained by differences in the diet, behavior, and habitat types with differing temperature and productivity regimes, being BFT exposed to conditions that influences δ13C incorporation into their hard structures across fish growth life.
Advantages and Disadvantages of a High-Resolution Sampling Protocol for Stable Isotopes Analyses on Fin Spines
The quality and quantity of information extracted from fish hard structures has been progressing with advances on the analytical techniques used. The main advantage of the protocol showcased in this paper is the increased information that can be extracted from fin spines. In this regard, the protocolis based on a computer-guided micromill system with the high-resolution automated carbonate preparation device coupled to a gas-ratio mass spectrometer. These coupled systems provide an accurate and precise sequential sampling method along thin growth intervals, annually formed in the ABFT fin spine bone for stable isotope analysis. In addition, the vacuum pump included in the computer-controlled micromill system is a great advantage to collect powder from individual growth increments without mixing milled layers. It is particularly useful when the powder material for isotopic analysis is limited which allows obtaining a greater temporal resolution with the lower amount of sample needed to extract for stable isotopes analyses.
As any technique used to study the chemical composition of fish hard structures, the main disadvantages of this protocol rely only on the price of the equipment used to extract the powdered samples and the time needed to define the sampling lines in the sample.
Conclusion
The methodology presented in this protocol shortens the sample preparation time compared to other traditional micromilling techniques, improves the recovery ratio, and homogenizes the sample quantity, which, in turn, improves the analytical reproducibility. Preliminary results indicate that (1) fin spines retain oxygen isotopic ratios of sea water surface (2) and this technique can be a powerful tool for high-resolution analyses of the growth banding of carbonates in fin spine bone to inform fish environmental history reconstruction. While tested using a fin spine of one Atlantic blue fin tuna specimen, these techniques are adequate for a wide variety of both commercial and protected fish species, and the application of the standardized protocol will enable direct comparison among future studies.
Data Availability Statement
The original contributions presented in the study are included in the article/Supplementary Material, further inquiries can be directed to the corresponding author.
Ethics Statement
Ethics approval or specific consent procedures were not required for this study, because no alive animals were used. The only sample we used comes for an individual caught by commercial fisheries regulated under the International Commission for the Conservation of Atlantic Tunas (ICCAT).
Author Contributions
PL design of the work, supervised lab work, participated in the interpretation of data, and drafting the manuscript. SS was in charge of the lab work regarding micromilling and stable isotope analysis, interpretation of data, and drafting the manuscript. HA coordinated the spine sampling program, discussion of the approach, and drafting/editing of the manuscript. HM participated in the discussion of the approach and revising/editing the manuscript. All authors contributed to the article and approved the submitted version.
Funding
This project has received funding from the European Union’s Horizon 2020 Research and Innovation Program under the Marie Skłodowska-Curie grant agreement no. 753304.
Conflict of Interest
The authors declare that the research was conducted in the absence of any commercial or financial relationships that could be construed as a potential conflict of interest.
Acknowledgments
The fin spine sample used in this work was collected by the Institute of Marine Research (Norway) under the provision of the ICCAT Atlantic Wide Research Programme for Bluefin Tuna (GBYP), funded by the European Union, by several ICCAT CPCs, the ICCAT Secretariat and by other entities (see: http://www.iccat.int/GBYP/en/). The contents of this manuscript do not necessarily reflect the point of view of ICCAT or of the other funders, which have not responsibility for them, neither do they necessarily reflect the views of the funders and in no ways anticipate the Commission’s future policy in this area. The manuscript benefited from helpful discussions and statistics graphs from Dr. Gorka Bidegain.
Supplementary Material
The Supplementary Material for this article can be found online at: https://www.frontiersin.org/articles/10.3389/fmars.2020.588651/full#supplementary-material
References
Acosta-Pachõn, T. A., Ortega-García, S., and Graham, B. (2015). Stable carbon and nitrogen isotope values of dorsal spine age rings indicate temporal variation in the diet of striped marlin (Kajikia audax) in waters around Cabo San Lucas, Mexico. Rapid Commun. Mass Spectrom. 29, 1676–1686. doi: 10.1002/rcm.7271
Arregui, I., Galuardi, B., Goñi, N., Lam, C. H., Fraile, I., Santiago, J., et al. (2018). Movements and geographic distribution of juvenile bluefin tuna in the Northeast Atlantic, described through internal and satellite archival tags. ICES J. Mar. Sci. 75, 1560–1572. doi: 10.1093/icesjms/fsy056
Campana, S. E. (1999). Chemistry and composition of fish otoliths: pathways, mechanisms and applications. Mar. Ecol. Prog. Ser. 188, 263–297. doi: 10.3354/meps188263
Campana, S. E. (2005). “Otolith elemental composition as a natural marker of fish stocks,” in Stock Identification Methods, eds S. X. Cadrin, K. D. Friedland, and J. R. Waldman (Amsterdam: Elsevier), 227–245. doi: 10.1016/b978-012154351-8/50013-7
Campana, S. E., and Neilson, J. D. (1985). Microstructure of fish otoliths. Can. J. Fish. Aquat. Sci. 42, 1014–1032. doi: 10.1139/f85-127
Cassar, N., Laws, E. A., and Popp, B. N. (2006). Carbon isotopic fractionation by the marine diatom Phaeodactylum tricornutum under nutrient- and light-limited growth conditions. Geochim. Cosmochim. Acta 70, 5323–5335. doi: 10.1016/j.gca.2006.08.024
Clarke, A. D., Telmer, K. H., and Mark Shrimpton, J. (2007). Elemental analysis of otoliths, fin rays and scales: a comparison of bony structures to provide population and life-history information for the Arctic grayling (Thymallus arcticus). Ecol. Freshw. Fish 16, 354–361. doi: 10.1111/j.1600-0633.2007.00232.x
Cleveland, W. S., Devlin, S. J., and Grosse, E. (1988). Regression by local fitting. J. Econom. 37, 87–114. doi: 10.1198/004017004000000149
Dettman, D. L., and Lohmann, K. C. (1995). Microsampling carbonates for stable isotope and minor element analysis: physical separation of samples on a 20-micrometer scale. J. Sediment. Res. A Sediment. Petrol. Process. 65, 566–569. doi: 10.1306/d426813f-2b26-11d7-8648000102c1865d
Elsdon, T. S., Wells, B. K., Campana, S. E., Gillanders, B. M., Jones, C. M., Limburg, K. E., et al. (2008). Otolith chemistry to describe movements and life-history parameters of fishes: hypotheses, assumptions, limitations and inferences. Oceanogr. Mar. Biol. 46, 297–330. doi: 10.1201/9781420065756.ch7
Fraile, I., Arrizabalaga, H., and Rooker, J. R. (2015). Origin of Atlantic bluefin tuna (Thunnus thynnus) in the Bay of Biscay. ICES J. Mar. Sci. 72, 625–634. doi: 10.1093/icesjms/fsu156
Fraile, I., Arrizabalaga, H., Santiago, J., Goñi, N., Arregi, I., Madinabeitia, S., et al. (2016). Otolith chemistry as an indicator of movements of albacore (Thunnus alalunga) in the North Atlantic Ocean. Mar. Freshw. Res. 67, 1002–1013. doi: 10.1071/MF15097
Frappier, A. B., Sahagian, D., Carpenter, S. J., González, L. A., and Frappier, B. R. (2007). Stalagmite stable isotope record of recent tropic cyclone events. Geology 35, 111–114. doi: 10.1130/G23145A.1
Frappier, A. B., Sahagian, D., González, L. A., and Carpenter, S. J. (2002). El Niño events recorded by stalagmite carbon isotopes. Science 298, 565. doi: 10.1126/science.1076446
Fromentin, J. M., and Powers, J. E. (2005). Atlantic bluefin tuna: population dynamics, ecology, fisheries and management. Fish Fish. 6, 281–306. doi: 10.1111/j.1467-2979.2005.00197.x
Goericke, R., and Fry, B. (1994). Variations of marine plankton δ13C with latitude, temperature, and dissolved CO2 in the world ocean. Global Biogeochem. Cycles 8, 85–90. doi: 10.1029/93GB03272
Graves, J. E., Wozniak, A. S., Dickhut, R. M., Cochran, M. A., Macdonald, E. H., Bush, E., et al. (2015). Transatlantic movements of juvenile Atlantic bluefin tuna inferred from analyses of organochlorine tracers. Can. J. Fish. Aquat. Sci. 72, 625–633. doi: 10.1139/cjfas-2014-0305
Hill, K. T., Cailliet, G. M., and Radtke, R. L. (1989). A comparative analysis of growth zones in four calcified structures of Pacific blue marlin, Makaira nigricans. Fish. Bull. 87, 829–843.
International Commission for the Conservation of Atlantic Tunas [ICCAT] (2013). Report of the 2012 Atlantic bluefin tuna stock assessment session. Collect. Vol. Sci. Pap. ICCAT. 69, 1–198.
Jarić, I., Lenhardt, M., Pallon, J., Elfman, M., Kalauzi, A., Suciu, R., et al. (2011). Insight into Danube sturgeon life history: trace element assessment in pectoral fin rays. Environ. Biol. Fishes 90, 171–181. doi: 10.1007/s10641-010-9728-4
Jefanova, O., Mažeika, J., Petrošius, R., Skuratoviè, Ž, Paškauskas, R., Martma, T., et al. (2020). Baltic Sea water tritium and stable isotopes in 2016–2017. Isotopes Environ. Health Stud. 56, 193–204. doi: 10.1080/10256016.2020.1715969
Kerr, L. A., Cadrin, S. X., Secor, D. H., and Taylor, N. G. (2016). Modeling the implications of stock mixing and life history uncertainty of Atlantic bluefin tuna. Can. J. Fish. Aquat. Sci. 74, 1990–2004. doi: 10.1139/cjfas-2016-0067
LeGrande, A. N., and Schmidt, G. A. (2006). Global gridded data set of the oxygen isotopic composition in seawater. Geophys. Res. Lett. 33:L12604. doi: 10.1029/2006GL026011
Linsley, B. K., Dunbar, R. B., Wellington, G. M., and Mucciarone, D. A. (1994). A coral-based reconstruction of Intertropical Convergence Zone variability over Central America since 1707. J. Geophys. Res. 99, 9977–9994. doi: 10.1029/94JC00360
Luque, P. L., Rodriguez-Marin, E., Landa, J., Ruiz, M., Quelle, P., Macias, D., et al. (2014). Direct ageing of Thunnus thynnus from the eastern Atlantic Ocean and western Mediterranean Sea using dorsal fin spines. J. Fish Biol. 84, 1876–1903. doi: 10.1111/jfb.12406
Luque, P. L., Sanchez-Ilárduya, M. B., Sarmiento, A., Murua, H., and Arrizabalaga, H. (2019). Characterization of carbonate fraction of the Atlantic bluefin tuna fin spine bone matrix for stable isotope analysis. PeerJ 2019:e7176. doi: 10.7717/peerj.7176
Luque, P. L., Zhang, S., Rooker, J. R., Bidegain, G., and Rodríguez-Marín, E. (2016). Dorsal fin spines as a non-invasive alternative calcified structure for microelemental studies in Atlantic bluefin tuna. J. Exp. Mar. Bio. Ecol. 486, 127–133. doi: 10.1016/j.jembe.2016.09.016
MacKenzie, K. M., Palmer, M. R., Moore, A., Ibbotson, A. T., Beaumont, W. R. C., Poulter, D. J. S., et al. (2011). Locations of marine animals revealed by carbon isotopes. Sci. Rep. 1:21. doi: 10.1038/srep00021
McMahon, K. W., Thorrold, S. R., Elsdon, T. S., and Mccarthy, M. D. (2015). Trophic discrimination of nitrogen stable isotopes in amino acids varies with diet quality in a marine fish. Limnol. Oceanogr. 60, 1076–1087. doi: 10.1002/lno.10081
Nøttestad, L., Tangen, Ø, Rong, U. K., and Hamre, J. (2017). Utbredelse, Fangst og Forskning av Makrellstørje (Thynnus thunnus) i Norsk Økonomisk Sone (NØS) (in Norwegian). Bergen: Institute of Marine Research.
Phelps, Q. E., Whitledge, G. W., Tripp, S. J., Smith, K. T., Garvey, J. E., Herzog, D. P., et al. (2012). Identifying river of origin for age-0 Scaphirhynchus sturgeons in the Missouri and Mississippi rivers using fin ray microchemistry. Can. J. Fish. Aquat. Sci. 69, 930–941. doi: 10.1139/F2012-038
R Core Team (2017). R: A Language and Environment for Statistical Computing. Vienna: R Foundation for Statistical Computing.
Rodríguez-Ezpeleta, N., Díaz-Arce, N., Walter, J. F., Richardson, D. E., Rooker, J. R., Nøttestad, L., et al. (2019). Determining natal origin for improved management of Atlantic bluefin tuna. Front. Ecol. Environ. 17:439–444. doi: 10.1002/fee.2090
Rodríguez-Marín, E., Luque, P. L., Quelle, P., Ruiz, M., Perez, B., Macias, D., et al. (2014). Age determination analyses of atlantic bluefin tuna (Thunnus Thynnus) Within the biological and genetic sampling and analysis contract (Gbyp). Collect. Vol. Sci. Pap. ICCAT 70, 321–331.
Rooker, J. R., Arrizabalaga, H., Fraile, I., Secor, D. H., Dettman, D. L., Abid, N., et al. (2014). Crossing the line: migratory and homing behaviors of Atlantic bluefin tuna. Mar. Ecol. Prog. Ser. 504, 265–276. doi: 10.3354/meps10781
Rooker, J. R., Bremer, J. R. A., Block, B. A., Dewar, H., De Metrio, G., Corriero, A., et al. (2007). Life history and stock structure of atlantic bluefin tuna (Thunnus thynnus). Rev. Fish. Sci. 15, 265–310. doi: 10.1080/10641260701484135
Rooker, J. R., Fraile, I., Liu, H., Abid, N., Dance, M. A., Itoh, T., et al. (2019). Wide-ranging temporal variation in transoceanic movement and population mixing of bluefin tuna in the North Atlantic Ocean. Front. Mar. Sci. 6:398. doi: 10.3389/fmars.2019.00398
Rude, N. P., Smith, K. T., and Whitledge, G. W. (2014). Identification of stocked muskellunge and potential for distinguishing hatchery-origin and wild fish using pelvic fin ray microchemistry. Fish. Manag. Ecol. 21, 312–321. doi: 10.1111/fme.12081
Sakai, S., and Kodan, T. (2011). Micropowder collecting technique for stable isotope analysis of carbonates. Rapid Commun. Mass Spectrom. 25, 1205–1208. doi: 10.1002/rcm.4980
Serrano, O., Serrano, L., and Mateo, M. A. (2008). Effects of sample pre-treatment on the δ13C and δ18O values of living benthic foraminifera. Chem. Geol. 257, 218–220. doi: 10.1016/j.chemgeo.2008.09.013
Smith, K. T., and Whitledge, G. W. (2010). Fin ray chemistry as a potential natural tag for smallmouth bass in northern Illinois Rivers. J. Freshw. Ecol. 25, 627–635. doi: 10.1080/02705060.2010.9664412
Snoeck, C., and Pellegrini, M. (2015). Comparing bioapatite carbonate pre-treatments for isotopic measurements: Part 1-Impact on structure and chemical composition. Chem. Geol. 417, 394–403. doi: 10.1016/j.chemgeo.2015.10.004
Tomaszewicz, C. N. T., Seminoff, J. A., Avens, L., and Kurle, C. M. (2016). Methods for sampling sequential annual bone growth layers for stable isotope analysis. Methods Ecol. Evolut. 16, 1–9. doi: 10.1111/2041-210X.12522
Tzadik, O. E., Curtis, J. S., Granneman, J. E., Kurth, B. N., Pusack, T. J., Wallace, A. A., et al. (2017). Chemical archives in fishes beyond otoliths: a review on the use of other body parts as chronological recorders of microchemical constituents for expanding interpretations of environmental, ecological, and life−history changes. Limnol. Oceanogr. Methods 15, 238–263. doi: 10.1002/lom3.10153
Tzadik, O. E., Goddard, E. A., Hollander, D. J., Koenig, C. C., and Stallings, C. D. (2015). Non-lethal approach identifies variability of δ15N values in the fin rays of Atlantic Goliath Grouper, Epinephelus itajara. PeerJ 2015:e1010. doi: 10.7717/peerj.1010
Wolff, B. A., Johnson, B. M., and Landress, C. M. (2013). Classification of hatchery and wild fish using natural geochemical signatures in otoliths, fin rays, and scales of an endangered catostomid. Can. J. Fish. Aquat. Sci. 70, 1775–1784. doi: 10.1139/cjfas-2013-0116
Keywords: dorsal fin spine, micromilling, growth layers, δ18O and δ13C, Atlantic bluefin tuna
Citation: Luque PL, Sakai S, Murua H and Arrizabalaga H (2020) Protocol for Sampling Sequential Fin Spine Growth Intervals for Isotope Analysis in the Atlantic Bluefin Tuna. Front. Mar. Sci. 7:588651. doi: 10.3389/fmars.2020.588651
Received: 29 July 2020; Accepted: 24 November 2020;
Published: 17 December 2020.
Edited by:
António V. Sykes, University of Algarve, PortugalReviewed by:
Pedro Morais, University of Algarve, PortugalBrett W. Molony, Oceans and Atmosphere (CSIRO), Australia
Copyright © 2020 Luque, Sakai, Murua and Arrizabalaga. This is an open-access article distributed under the terms of the Creative Commons Attribution License (CC BY). The use, distribution or reproduction in other forums is permitted, provided the original author(s) and the copyright owner(s) are credited and that the original publication in this journal is cited, in accordance with accepted academic practice. No use, distribution or reproduction is permitted which does not comply with these terms.
*Correspondence: Patricia Lastra Luque, cGxhc3RyYUBhenRpLmVz