 Nils B. Kerpen1*
 Torsten Schlurmann1
 Alexander Schendel1
 Jannek Gundlach1
 Daniel Marquard2
 Markus Hüpgen3
- 1Ludwig-Franzius-Institute for Hydraulic, Estuarine and Coastal Engineering, Leibniz University Hannover, Hanover, Germany
- 2Institute of Technical Chemistry, Leibniz University Hannover, Hanover, Germany
- 3Institute of Building Materials Science, Leibniz University Hannover, Hanover, Germany
In this study, the wave-induced distribution of 13 microplastic (MP) samples of different size, shape, and density was investigated in a wave flume with a sandy mobile beach bed profile. The particle parameter were chosen based on an occurrence probability investigated from the field. MP abundances were analyzed in cross-shore and vertical direction of the test area after over 40,000 regular waves. It was found, that MP particles accumulated in more shallow waters with increasing size and density. Particles with high density () have been partly confined into deeper layers of the sloping beach during the formation of the bed profile. Particles with a density lower than that of water used in the experiments floated constantly in the surf zone or deposited on the beach caused by wave run-up. A correlation was found between the settling velocity of the MP particles and the flow velocity at the accumulation point and a power function equation developed. The obtained results were critically discussed with findings from the field and further laboratory studies.
Introduction
The pollution of marine habitats by microplastic (MP) particles is a worldwide matter of growing concern. An increasing quantity of literature confirms the occurrence of MP in all parts of the marine environment, including ocean surface waters (Sebille et al., 2012, Sebille et al., 2020), deep sea regions (Thompson et al., 2004; Woodall et al., 2014; Enders et al., 2015; Willis et al., 2017; Shim et al., 2018; Kane and Clare, 2019), coastal zones (Chubarenko and Stepanova, 2017; Chubarenko et al., 2018a; Sagawa et al., 2018), and typical occurrence and deposition patterns along beaches (Turra et al., 2014; Wessel et al., 2016; Hinata et al., 2017; Lavers and Bond, 2017).
The term “MP” shows variations between different studies in relation to the underlying size range (Chubarenko et al., 2018a). A common definition at the European level it the distinction between small (nominal diameter Dn < 1 mm) and large MP particles (1 ≤ Dn(mm) ≤ 5) (Galgani et al., 2013). A major source of MP particles found in marine environments is the degradation over time from larger fractions by physical forces, incorporating the abrasive effects induced by breaking waves and currents and interaction with marine aggregate (sand), photodegradation (ultra-violet light), or biochemical degradation (oxidation or bacteria), all of which are taking place in the surf zone area (Klemchuk, 1990; Efimova et al., 2018).
The transport of MP within and out of the surf zone is largely determined by the particles' properties, which can differ significantly in terms of chemical and physical characteristics, size, shape, degradation stage, and color (Hidalgo-Ruz et al., 2012). The physical and dynamical properties of marine MP particles are documented relative to their behavior in coastal zones (Chubarenko et al., 2018a). I addition to that, the abundance in water, global distribution and composition of MP particles is documented by a summary of international studies (Shim et al., 2018) focusing on spatiotemporal MP particle distribution and corresponding size distribution as well as polymer composition. The entrainment and transport patterns of MP particles are strongly linked to oceanographic events such as sea storms and prevalent ocean currents (Turra et al., 2014). It was proven that stormy winds, surface waves and sea level variations govern the occurrence and deposition of MP within the sandy body of beaches instead of anthropogenic loads (Chubarenko et al., 2018b). For the initiation of movement and entrainment of MP particles, the particle size and density in correlation with the sediment properties were more important than the particle shape (Ballent et al., 2013; Waldschläger and Schüttrumpf, 2019b). It was recently found that the infiltration depth increases with decreasing MP particle diameter and that spherical particles infiltrate deeper than fragments and fibers (Waldschläger and Schüttrumpf, 2020).
While there is a substantial number of literature available on the distribution of MPs on surfaces or within deeper sediment layers along beaches, the understanding of the transport processes that lead to an accumulation of MPs across the beach shoreline in the so-called surf-zone is only limited (Zhang, 2017). The transport and deposition of MPs is governed by the same drivers and processes that determine the transport of natural sediments, a topic that has been extensively studied in the past (Van Rijn, 1993; Soulsby, 1997; Nielsen, 2009). The surf zone is characterized by complex hydro- and morphodynamic processes that interact in a cause-and-effect relationship (Dean and Dalrymple, 1984; Holthuijsen, 2007). In dependence of the prevalent wave climate and triggered by wave breaking and wave-induced near-shore currents, sediment is entrained, transported, and re-distributed across and along the shoreline, often resulting in storm induced erosion or seasonal bathymetric changes including the formation of breaker bars, which in turn promote wave breaking and further increase the dissipation of wave energy (Fredsøe and Deigaard, 1992; Van Rijn, 1993). In essence, the surf-zones are morphologically active regions and are characterized by a dynamic reshaping of beach profiles (bathymetries) and sediment layers.
The asymmetric nature of waves approaching shallow water environments on the coast and finally entering the near-shore region subsequently leads to wave transformation processes (shoaling and refraction), a net velocity drift in the direction of wave propagation known as the Stokes drift (Dean and Dalrymple, 1984). The onshore flow induced by the Stokes drift is most pronounced in the upper water layers, near the surface, with a linearly descending effect in larger depth and even imposing currents in the opposite direction near the bottom (i.e., offshore drift). This resembles a typical recirculation pattern that affects the sediment deposition on beaches and in shallow water environments and is enforced by pressure gradients to the wave set-up. In addition, as wave energy is dissipated by wave breaking, the radiation stress decreases, and the mean water level increases onshore (Horikawa, 1988); this is often referred to as wave set-up. As a result of the pressure gradient produced by the mean water level increase and to compensate for the onshore-directed flow, an offshore-directed flow develops in the lower part of the water column, called the undertow (Nadaoka and Kondoh, 1982) (Figure 1A). In combination with this system of nearshore currents, turbulences and vortices induced by wave breaking cause intense entrainment and movement of sediment within the surf zone. The sediment in the surf zone might be transported in three modes: as bed load, as suspended sediment, and sheet flow movement (Horikawa, 1988). The local particle movement is also strongly influenced by small scale vortices and turbulence stemming from the interaction of the wave-induced flow with ripples (Baas, 1978) (Figure 1B). As the characteristics of MPs differ from natural sediments, MPs react to these hydrodynamic processes and wave-induced flow forces similarily but not completely identical to natural sediments.
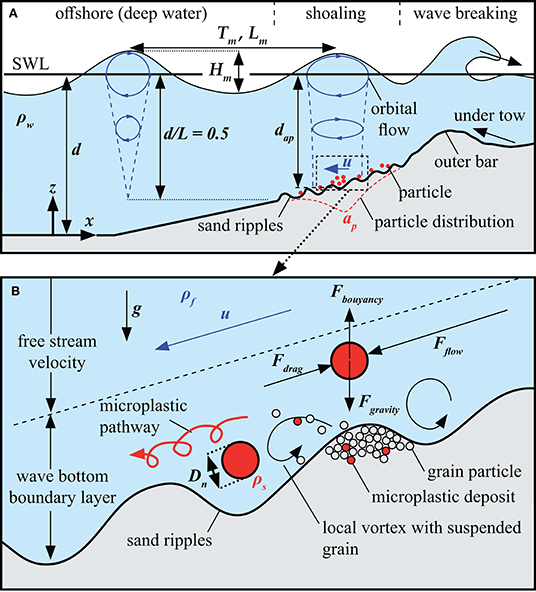
Figure 1. (A) Parameter definition and two-dimensional flow conditions in the wave shoaling zone [inspired by Greenwood (2003)]. (B) Force balance of MP particles, near-bottom boundary layer, and flow-induced vortex systems at ripples below a wave trough.
Taking the linear theory into account as a first step to understand the governing drivers and processes in the surf zone, wave-induced flow forces (orbital velocities) act up to a water depth d of half the wave length L (Stokes, 1847) (Figure 1A). The simplified balance of power of MP particles in limited water depth is made up of forces acting on the particles as a result from local flow conditions (orbital velocities u ~ Fflow, buoyancy Fbuoyancy), and resisting forces of the particles (gravity forces Fgravity, drag forces Fdrag) (Figure 1B).
Regarding the dynamics of MP particles in the surf zone, only little understanding is provided, some are even contradicting to each other. For example it is argued, that, compared to nearshore waters, a higher number of particles can be found on the sea floor in the area of breaking waves, while larger particles with high settling velocities remain in the swash region (Ho and Not, 2019), whereas particles with low settling velocities are transported seawards (Hinata et al., 2017). On the contrary, the plastic polymer composition varies in different aquatic environments and it is likely that MP polymer, size and shape are required for modeling environmental transport in a correct manner (Schwarz et al., 2019).
Nevertheless, to date, there is a limited number of studies (Baldock et al., 2008; Forsberg et al., 2020) that have empirically explored the transport principle and fate of MP particles in the surf zone under dynamic boundary conditions experimentally gained in laboratory facilities. So far, only partial processes such as the sinking behavior of MP (McNown and Malaika, 1950; Kowalski et al., 2016; Bagaev et al., 2017; Khatmullina and Isachenko, 2017; Kaiser et al., 2019; Waldschläger and Schüttrumpf, 2019a) or artificial biotic, abiotic or mechanical degradation processes (Tosin et al., 2012; Song et al., 2017; Efimova et al., 2018; Gerritse et al., 2020) in simplified laboratory environments have been intensively investigated under isolated boundary conditions. This lack of investigation under complex interacting nature-like boundary conditions indicates the demands for experiments with higher order of complexity to explore the role and quantify the influence of different parameter (i.e., beach configuration, sediment size, particle size, and density on the MP transport processes). Demands to close this research gap have only recently been addressed in available literature (Zhang, 2017; Sebille et al., 2020). Thus, the present study aims to contribute to this field of research by achieving a better understanding of the driving forces and triggered processes that are governing the transport of MP particles and their accumulation in the surf zone. To this end, physical model tests with MP particles of different size, shape and density were systematically carried out. This was done to profoundly advance knowledge on transport, distribution and deposition of MP in the surf zone, induced by original wave attack on a mobile beach profile. The fate and abundance of the tested MP particles is documented during the wave-driven beach profile evolution until equilibrium state.
The materials and methods section defines the model set-up, the test program and the test procedure. Also, the wave analysis, the sampling methods and the particle analysis routines are described. The first part of the results section documents the evolution of the beach profile under waves. The second part highlights the MP distribution, separated for (i) floating particles, (ii) particles transported vertically in the sediment, and (iii) cross-shore transported particles. Then, the observations and findings are discussed and compared with recent literature. Limitations and shortcomings of the present study are addressed. Finally, the main findings are concluded.
Materials and Methods
The distribution and accumulation of MPs in the surf zone due to wave-induced flow was studied in a laboratory wave flume. In the following, the experimental set-up, test program and procedure are described and the applied MP particles, their sampling and analysis are explained.
Model Set-Up
Hydraulic model tests were conducted in a wave flume made of glass with a length of 6.7 m, a width of 0.3 m and an overall depth of 0.45 m. The water depth can be varied from 0.0 m to 0.4 m. The flume is equipped with a flap-type wave maker (wet-back) for monochromatic wave generation. Waves can be generated with a total stroke of 0.1 m. Hence, dependent on the water depth d, deep water wave heights up to H0 = 0.14 m and deep water wave periods larger than T0 ≥ 0.5 s can be generated.
Figure 2 shows the experimental set-up, including the still water line (SWL) and reference bed profile at the beginning of an experiment (t = 0 h) for the present study. Cross-shore coordinate x is defined positively toward the beach and the vertical coordinate z is defined positively upwards, with the origin of both axes at the toe of the wave paddle. At the end of the flume, a fine-sand (Dn = 0.19 mm) beach profile is implemented. Wave characteristics are recorded in front of the beach slope (x = 2.4 m), on top of a horizontal bar (shoaled waves, x = 3.9 m, from test 003 on x = 3.2 m) and in the surf zone (x = 4.95 m) by ultra-sonic wave gauges (sampling frequency: fs = 100 Hz, vertical resolution: δz = 0.2 mm). The wave conditions at gauge 1 correspond to a surf similarity parameter of with a mean wave steepness and represent plunging wave breaking (Battjes, 1974). α is the slope of the beach, Hm and Tm respectively the mean height and period of the measured waves. Tests were conducted in intermediate water depth (d/L = 0.21, k · d = 1.34). L is the wave length (in m) and k = 2π/L is the wave number (in m−1). Additionally, the wave propagation and the temporal change of the beach profile are recorded by a camera (image resolution: 6000 x 3376 pixel, sampling frequency: 11 frames/second) through the glass wall of the wave fume. A sample picture of the camera observation section is given in Figure 3 for the reference bed configuration (t = 0 h) with a designation of the instrumentation.
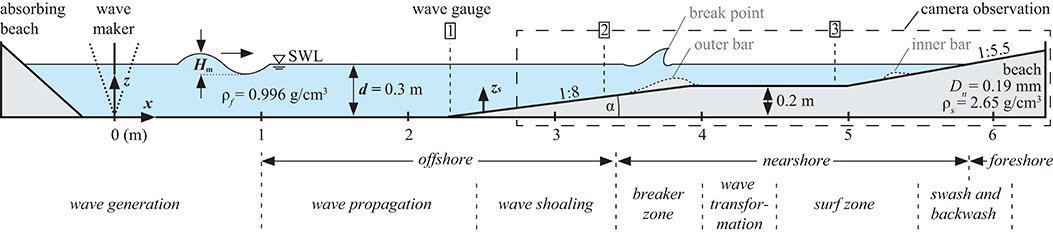
Figure 2. Side view of the experimental set-up with wave maker, ultra-sonic wave gauge location, reference bed profile (t = 0 h), and camera observation section.
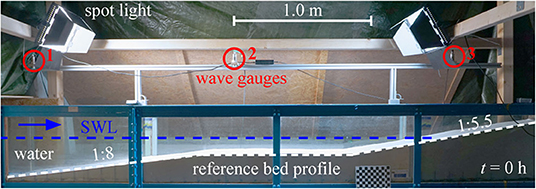
Figure 3. Camera observation section of the reference bed profile (dashed white line) and the still water line (SWL, dashed blue line) in the wave flume (t = 0 h). Position of the three ultra-sonic wave gauges (red circles) and spot lights for even camera exposure during experiments.
Wave Analysis
The determination of individual waves generated by the wave maker and freely propagating toward the sloping beach is carried out in a time domain analysis using the zero crossing method. The obtained wave parameters for the whole time series represent mean values of the individual waves (index i), namely the mean wave height , the mean wave period and the number of waves NW in the time series (index n). The wave parameters are calculated with the WaveLab 3 software (Frigaard and Andersen, 2014).
The hydraulic boundary conditions of each conducted experiment including the water level d, mean wave height, mean wave period, number of waves, duration of a single test and the duration of the total experiment are given in Table 1. The total test duration is rounded to full hours for clarity. The deviation from this time span is below 5 min. The hydraulic boundary conditions were chosen to reproduce the principle model set-up presented in previous research (Van der Zanden et al., 2017) in a scale of 1:10 (Froude similitude) to enable a comparison with large scale tests.
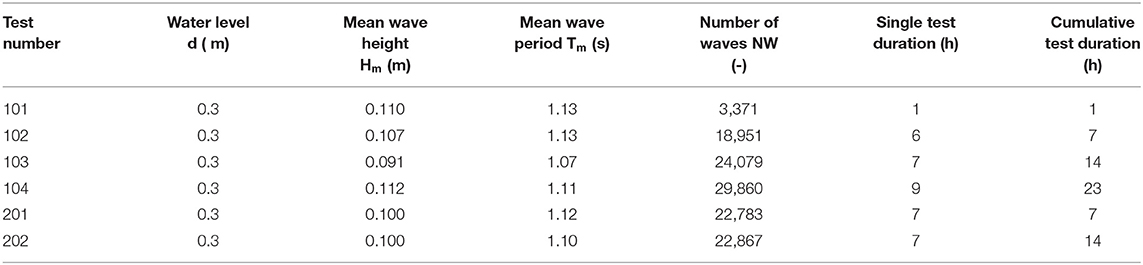
Table 1. Hydraulic boundary conditions.
Materials
The median grain diameter (D50) of the sediment from which the sloping beach was build is 0.19 mm (fine sand). The sediment density is (bulk weight 1.45 g/cm3). The sediment supplier specifies the grain shape as rounded edges.
The complexity of MP particles occurring in nature can only be represented in this study in a parameterized way. In the present study MPs with different nominal diameter (0.5 < Dn < 4.1), shape (spherical and disc-shaped) and density (buoyant and non-buoyant, ) are used to evaluate the individual influences of those properties on the transport and distribution along the beach profile. The material characteristics are summarized in Table 2. The particle diameters, consisting of the longest axis a, the intermediate axis b, and the shortest axis c, are given as mean values , and based on a quantity of 10 particles each (60 particles for tracer C, D, and E). In addition to the mean particle diameters, the percentage standard deviation from the respective diameter is given (e.g., ). The nominal diameter of a particle is the diameter of a sphere having the same volume as the particle; it is computed from (Bunte and Abt, 2001). The nominal diameter Dn is used as not only the shape, but also the mass and volume of a particle are important for its entrainment, transport and sinking.
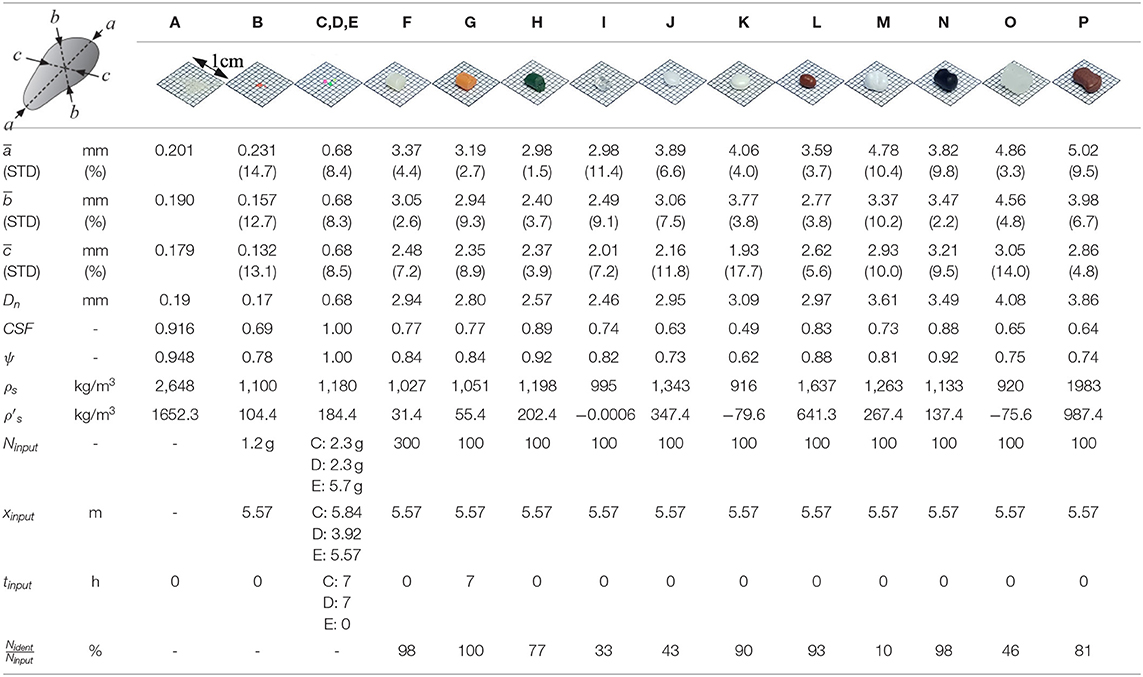
Table 2. Sediment and tracer specification.
A pycnometer (Heico, volume: 100 ml) was used to determine the volume V of the particles. The weight of the pycnometer flask and the specimen was measured by a milligram balance (readability: 0,001 g); at least 15 g of each particle were used to reduce measurement inaccuracy due to smaller or bigger samples. As a solvent, deionized water was used. To clean the samples and to simulate the comparable energy input as in the flow channel, the pycnometer flask with the polymer samples was exposed before measurement to 30 min of vacuum (5–10 mbar), 5 min of ultrasonic treatment, 30 min of vacuum and 5 min of ultrasonic treatment. The vacuum was produced and maintained by a water jet pump and measured by a manometer (accuracy: 1 mbar). To validate the effectiveness of the treatment, it was calibrated with the help of a polymer sample with a known density. After treatment and the adjustment of the solvent density, the volume was measured and the specimen density calculated (ρs = m/V).
The submerged specific density is defined as the difference between the particle density and the fluid density ρf. The fluid density for the present study was (fresh water at a temperature of 30.4°C). The number of particles added is defined by Ninput and respectively the input position xinput (position of the wave board: x = 0.0 m) and the time of addition tinput relative to the beginning of the experiment. The adding process of particles is explained in section test program and procedure.
As the particle's shape is of importance for the transport behavior of MPs in water (Chubarenko et al., 2018a) and to simplify the classification and comparability with other studies, the uneven particle shape can be described by shape parameters (Figure 4) (Bunte and Abt, 2001). These shape parameters are based on the ratio between the three particle diameters a, b, and c. In the following, the microplastic particles are classified according to (Krumbein, 1941) and (Sneed and Folk, 1958). A sphere-like particle has almost equal a, b, and c values (b/a ≥ 0.75 and c/b ≥ 0.75). A particle becomes more disk-shaped for decreasing platyness ratios (c/b < 0.75) and more rod-like for reduced elongation ratios (b/a < 0.75). The particle is bladed if the platyness and elongation ratio is below 0.75. The shape factor CSF = c/(ab)0.5 (Corey, 1949) (Wadell, 1933) can be used to determine the particle settling velocity which for particles of equal weight is affected by the particle shape. Figure 4A indicates that the tested MP particles are mostly spherical shaped. Only particle “K” is disk-shaped.
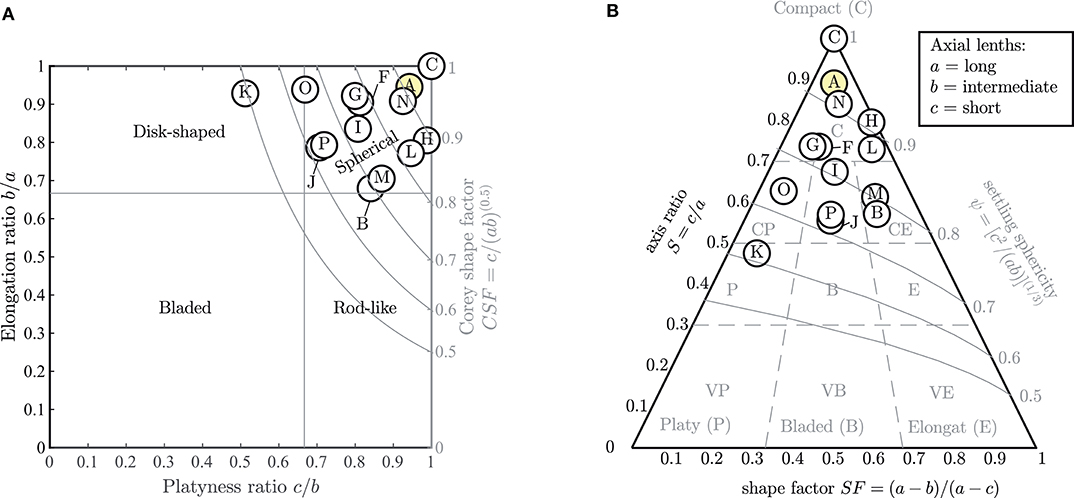
Figure 4. Shape parameter of the tested MPs including the surrounding grain (sample “A,” yellow shaded). (A) Relation between axes ratio and particle shape (Zingg's classification) (Krumbein, 1941) and sphericity classification (Corey, 1949). (B) Sphericity-form diagram with relation between axis ratio, shape factor, and settling sphericity (Sneed and Folk, 1958).
Particles of the same effective settling sphericity can be identified with the sphericity-form diagram (Figure 4B), which is defined by the axis ratio S = c/a, the shape factor SF = (a − b)/(a − c), and the settling sphericity . The settling sphericity reflects the tendency of platy particles to settle relatively slowly, and thus, easily remain suspended in flow to be transported over long distances. The diagram is segmented into areas of equal particle shape, with the shapes Compact (C), Platy (P), Bladed (B), or Elongated (E) as outer extreme values and further finer increments (e.g., VP for very platy or CP as compact platy). Most tested particles have a compact form, only particle “K” has a platy shape. The settling sphericity of the microplastic ranges from 0.6 < ψ ≤ 1.
Test Program and Procedure
The initial beach profile is exposed to wave attack for 14 h in order to enable first the dynamic shaping and natural evolution of a stable bathymetry of the sloping beach (Table 1, test number 101–103). The first experiment is continued for another 9 h (test number 104) to confirm the equilibrium conditions reached after 14 h. The repeatability of the test conditions and the results is demonstrated by repeating the experiment with equivalent boundary conditions (test number 201 and 202).
The test procedure followed a strict protocol. First, the initial beach profile made from marine aggregate was installed in the dry wave flume. Then water was slowly poured into the flume so that air could escape from the sediment pores. The glass walls of the flume enabled a visual verification of the success of this procedure. The water level was adjusted to d = 0.3 m. A set of MP particles was then placed on the bathymetry (xinput, tinput and Ninput according to Table 1). These initial conditions have then been exposed to wave impact according to a certain time span.
In the first experiment, the water was drained from the flume in three intervals, after 1 h (test 101), 7 h (test 102), and 14 h (test 103), to sample MP particles from within and from the surface of the beach profile and to document the bathymetry surface with a camera. In the second experiment, the water was drained after 7 h (test 201) and 14 h (test 202) for sampling.
Sampling and Analysis Methods
The quantification of MPs in the test environment was conducted with three different techniques to ensure that all particles are detected despite their differences in size and shape. (1) Samples are taken from sediment cores along the test area (target: fluorescent MP with a diameter < 1 mm), (2) MP on the bathymetry surface were detected by cameras and (3) a test excavation was conducted at the end of a test (target: MP with diameter > 1 mm). The sampling procedure, the laboratory analysis of the samples and the beach slope evolution over time are described in detail in the Supplementary Material.
Results
Next, experimentally derived evidence of the wave-induced transport, distribution and deposition of MP in the surf zone is presented and analyzed, given for morphodynamic changes over time in combination with the MP abundance detected on the sloping beach. First, the evolution of the beach profile under regular waves is documented as the original profile proves to have an influence on the MP transport due to the strong linkage between cause and effects imposed by hydro- and morphodynamic processes in the surf zone. Then, the shore-orthogonal distribution of MP on the bed profile and the stratifying abundance (i.e., vertical distribution underneath the surface in deeper sediment layers, of MP is quantified and rationalized).
Beach Profile Evolution
The combination of an offshore directed undertow in the surf zone and an onshore directed transport outside the surf zone before the occurrence of wave breaking results in a formation of a longshore oriented breaker bar on the beach slope under waves (Fredsøe and Deigaard, 1992). The initial beach configuration was designed to reproduce the principle model set-up presented in previous research (Van der Zanden et al., 2017) in a scale of 1:10 (Froude similitude) in order to benefit from the detailed observations and measurements of velocities and turbulence under regular plunging wave breaking while discussing the distribution of MPs in the present paper.
The initial beach configuration (before the waves developed the beach, time step t = 0 s) comprised a 1:8 offshore slope (2.5 m < x < 3.85 m), followed by a 1.0 m long and 0.2 m high horizontal section (3.85 m < x < 4.85 m). The shoreward profile followed a 1:5.9 slope until the end of the flume (4.85 m < x < 6.70 m). A documentation of the beach profile evolution due to regular wave loading (Table 1) for a number of different time steps ti (with i(h){0;7;14;23}) is given in Figure 5A. The location (xinput) and time (tinput) of the addition of MP particles are marked by a triangle.
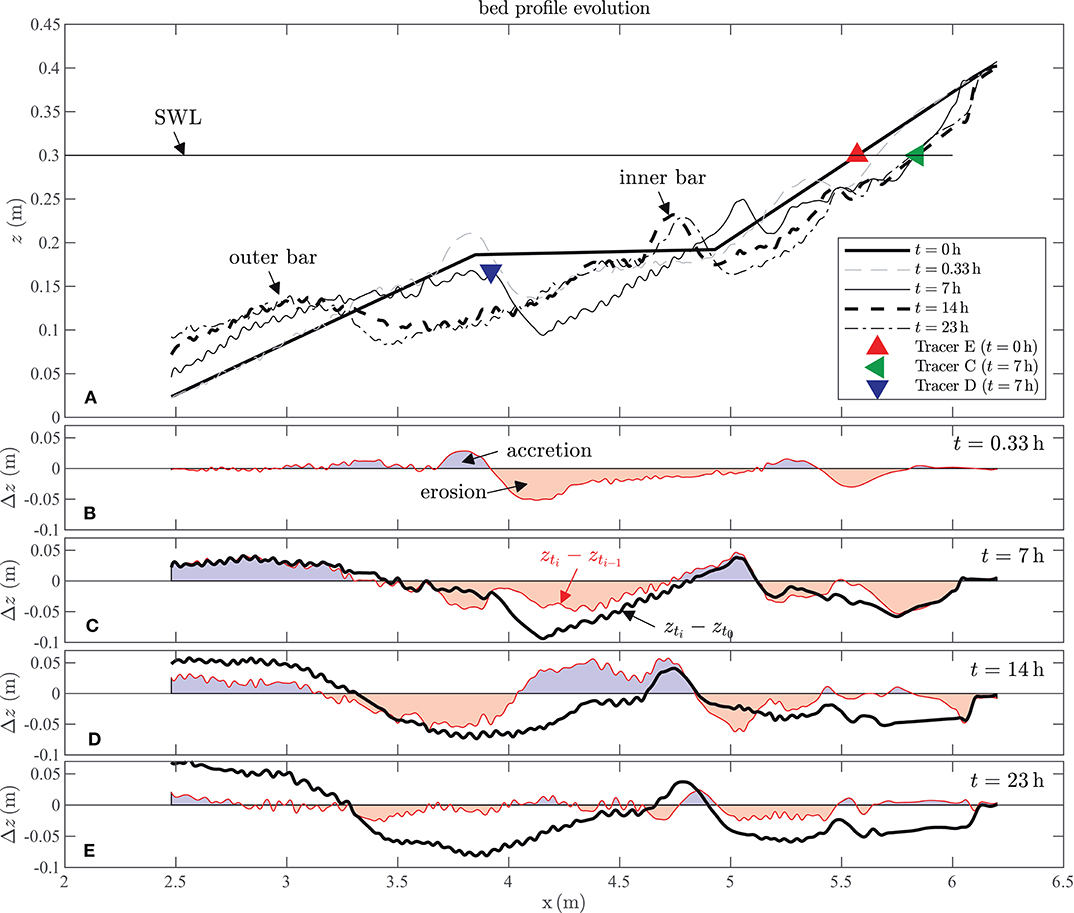
Figure 5. Bed profile evolution. (A) Initial horizontal test section (bold black solid line), interim bed profiles after certain time (gray dashed line, black solid line), final bed profile (bold black dashed line), and bed profile after equilibrium survey (black dash-dotted line). Location and time of added MP. (B) Erosive sections (red areas) and accretive sections (blue areas) after 20 min, (C) after 7 h, accumulative bed profile evolution (bold black solid line), (D) 14 h, and (E) 23 h to validate the equilibrium stage.
The local bathymetry alteration Δz along the beach profile (Δx-coordinate) is given for four time steps ti with respect to the initial observation time step t0 by a black bold solid line (Δzx = zx,ti − zx,t0) (Figures 5B–E). Predominantly erosive sections are represented by negative Δzx values. Predominantly accumulative sections show positive Δzx values. To enable the estimate of the bathymetry alteration for the three time steps ti with respect to the previous time step ti−1 the red solid line (Δzx = zx,ti − zx,ti−1) is given. Erosive sections are shaded in red, accretive sections in blue.
The formation of a breaker bar at x = 3.8 m at the beginning of the test is clearly visible. With ongoing test duration, this breaker bar shifted due to wave-induced processes into the offshore direction as its crest width increased. In addition, a second inner bar formed near the shore line due to the waves breaking over the outer bar. As expected, the system is morphodynamically very active, especially during the first 14 h of the test. But even after a further 9 h (t = 23 h), morphodynamic processes still progressed and distinct areas of erosion and sedimentation can still be quantified (Figure 5E), although to a much lesser extent then in the initiation of the experiments. As the differences regarding form and position of the breaker bars are rather small after 23 h, it is assumed that equilibrium conditions for the beach profile have been reached at this point.
Since the spatial and temporal distribution of microplastic particles is of particular interest in this dynamic environment, both aspects will be considered separately in the following.
Microplastic Transport and Distribution
The flow conditions in the nearshore zone are highly dynamic and complex (A et al., 2017; Van der Zanden et al., 2017), especially near the outer breaker bar where additional turbulence is induced by breaking waves. In the present simplified set-up, the near-bed flow exists as an interaction of wave-induced oscillatory flows, undertow currents, and local wake-vortex systems at sediment ripples and bars. Together, these processes affect and drive the sediment (and MP) transport, which was described early (Inman, 1949) as being dependent on bed roughness, settling velocity and threshold velocity for incipient motion. Flow-induced sorting processes of graded particles are documented for the vertical (Harada et al., 2015) and the cross-shore (McLaren and Bowles, 1985; Van der Zanden et al., 2017) orientation.
Since the transport principles and the sorting mechanism for (i) floating particles, (ii) particles being transported above the bed in cross-shore direction, and (iii) particles being infiltrated into the sediment differ, the results are described separately for each case.
Floating Particles
Particles with a relative density () are buoyant and float on the water surface. This is the case for MP “I” (), “K” (), and “O” (). The distribution of floating MP particles on the water surface at the end of the tests (t = 14 h, before flume drainage) is documented in Table 3. Between 32 and 90% of the implemented MPs could be retrieved during the experiments. It was difficult to retrieve tracer “I” from the experiment due to its high degree of transparency. The abundance of tracer “K” and “O” separates into equal parts in (i) floating behind the outer breaker bar (4 m < x < 5.5 m) and (ii) deposition on the beach slope above SWL (x > 5.8 m). No floating particles were detected offshore to the outer breaker bar or in the sediments examined below the beach profile. This finding principally indicates that all buoyant tracers retrieved after the experiments have been continuously forced to rest merely in the inner surf zone very close to beach in shallow water environments depicted by wave run-up and run-down. Buoyant tracers were not subject to the undertow and remained within the inner surf zone in the modeling domain.
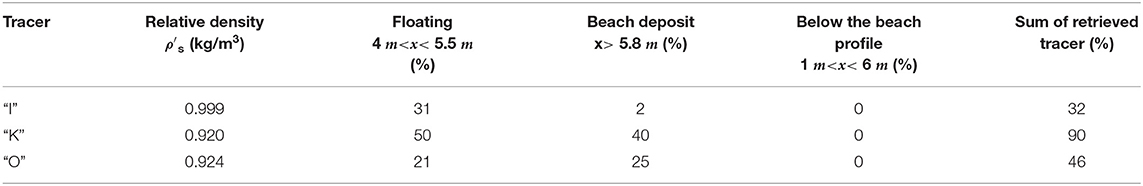
Table 3. Distribution of floating MPs after 14 h.
In contrast to non-buoyant particles, the basic transport mechanisms of floating MP particles in coastal waters are dealt with in detail in laboratory studies (Baldock et al., 2008), numerical studies (Hardesty et al., 2017; DiBenedetto, 2020), and in field studies (Hinata et al., 2017). Reviews with discussion of relevant processes are also available (Zhang, 2017; Sebille et al., 2020). For this reason, the further evaluation of floating particles in the inner surf zone from this small scale experiments is discontinued at this point. Based on observations of MPs “K” and “O”, buoyant particles were deposited in almost equal parts on the beach or floated on the water surface. MP “I” is neglected in this analysis as, due to the transparent appearance of the particles, only a limited number could be found again.
Vertical Positioning
In this study, vertical sorting describes the position of MP particles within the sediment column. The core sample analysis of collected probes provides insights on the MP distribution underneath the mobile bed surface in direct interaction with the marine aggregate (zs < 0, with zs = 0 as the z-coordinate of the beach bed profile). In brief, dominant regions for an accumulation of MP vary with respect to (i) the particle size and density and (ii) for the point in time of application into the dynamical system. These dependencies on the abundance of MP inside the sediment are analyzed and depicted in the Figures 6–8.
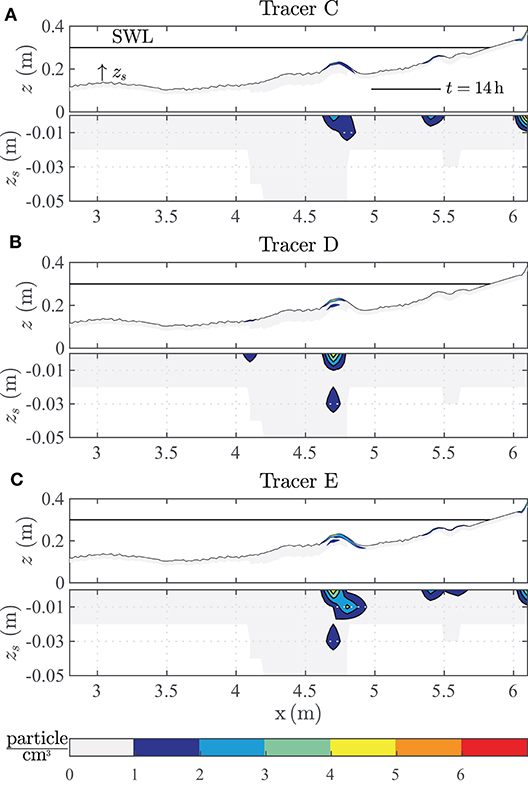
Figure 6. Microplastic distribution (particle/cm3) below the beach profile surface of (A) the tracer “C,” (B) tracer “D,” and (C) tracer “E” (each diameter = 0.68 mm).
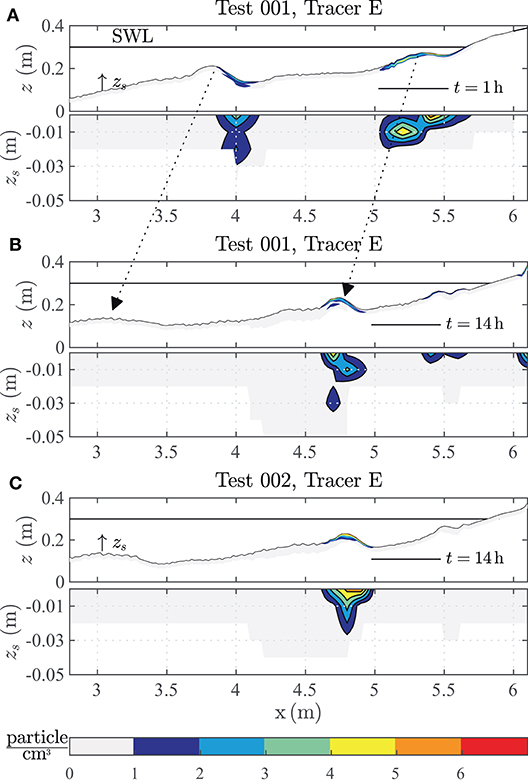
Figure 7. Microplastic distribution of Tracer “E” below the beach profile surface in (A) Test 001 after 1 h testing, (B) Test 001 after 14 h testing and (C) the repetition Test 002 after 14 h testing.
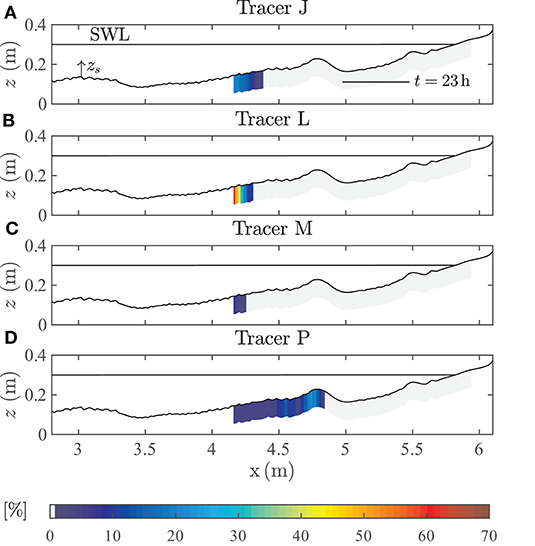
Figure 8. Microplastic distribution [% of the (A) tracer “J”, (B) tracer “L”, (C) tracer “M,” and (D) tracer “P” (Dn > 1 mm)] below the beach profile surface.
Location and time dependency
The significance of the input location (xinput) and the point-in-time of MP application (tinput) into the system on the final MP distribution pattern in the sediment is discussed at first. This preliminary configuration aims to elucidate the principle transport mechanisms and overall fate of MP in the surf zone in dependence of its entrance and introduction into the dynamic system. This is done with the goal to understand whether the initial conditions (xinput, tinput) play a dominant role in the investigation and may bias the formation of deposition patterns. In order to investigate the main transport trajectories leading to a gradually migration of MP particles during high morphological activity, particles (“E”) were introduced at the SWL at the beginning of the test (t = 0 h). After termination of the major wave-induced morphologic changes of the beach profile aiming for almost stable conditions of the beach profile (t = 7 h), MPs with the same material attributes as MP “E” were introduced into the wave flume either on the crest of the meanwhile evolved outer breaker bar (MP “D,” at x = 3.8 m) or at the SWL (MP “C” at x = 5.8 m). Details on the placement of particles “C,” “D,” and “E” are given in Figure 5. The distribution of these MPs with a diameter of Dn = 0.68 mm within the beach profile surface at the end of the test (t = 14 h) is given in Figure 6.
The number of MP particles per cubic centimeter is related with an adjacent color-coded map along the x- and z-axis for all three MPs (i.e., “C,” “D,” and “E”). The individual MP distribution inside the surf zone is stated in cross-shore direction (x-coordinate) and a depth-profile (z-coordinate) in the first 5 cm below the beach surface (0.0 m < zs < −0.05 m).
For tracer “E,” applied at the beginning of the tests (t = 0 h) at the SWL, three regions of major concentration are identified. Beginning at the beach, the first accumulation point represents the cliff which has been formed at x = 6.1 m. The particles occur only close to the beach profile surface (i.e., in the first sample, not deeper than 1 cm). This deposition is trusted to be subject to modeling effects, as the water was drained after 7 h of testing in order to monitor the distribution of MP on top of the beach profile and to introduce additional tracers (“C” and “D”). During the re-filling of the wave flume, MP particles floated on the water surface and drifted toward the beach. Hence, particles above the cliff are most likely deposited here due to this modeling effect. The second region of particle concentration of tracer “E” is at x = 5.4 m and is located at the inner breaker bar formed by already broken waves. The particles are deposited in the upper first centimeter (zs < −0.01 m) of the beach profile only; being subject to constantly acting redistributing forces imposed by broken waves. The largest abundance region of tracer “E” is at the first breaker bar (x = 4.7 m). Along the peak elevation of the outer breaker bar particles are traced in deeper sediment layers up to a depth of zs = −0.02 m. Underneath the crest of the breaker bar particles are detected in an even larger depth of zs = −0.04 m. This outer breaker bar is constantly migrating offshore after initial formation (compare Figure 5). Hence, the accumulation of MP in deeper regions (zs < −0.03 m) is possible by sediment covering and could not be excluded. Further offshore, no fractions of MP “E” have been detected in the sediment samples.
MP “C” was applied at the SWL in accordance to MP “E,” but after completion of the initial morphodynamic changes of the bed profile (t = 7 h). While the distribution along the x-axis is comparable for both tracers, MP “C” was infiltrated less deeply (only up to zs = −0.02 m) into the sediment than MP “E” at the inner breaker bar. Only below the outer breaker bar (x = 4.7 m) tracer “C” is distributed up to a depth of zs = −0.02 m only. The results indicate that MPs will become infiltrated deeper into the sediment column over time and with increasing morphodynamic changes. In addition, the vertical infiltration of particles into the subsurface occurs mainly where large morphodynamic changes occur (i.e., at the location of the inner breaker bar). Further offshore, no additional fractions of MP “C” have been detected in the sediment.
MP “D” was applied after the completion of the initial morphodynamic changes of the bed profile (t = 7 h) and on top of the outer breaker bar at this time step (x = 3.9 m). These MP accumulated mainly close to the surface (zs > −0.02 m) at the outside slope of the inner breaker bar (x = 4.7 m). Low quantities are detected at the outer breaker bar in a depth of zs = −0.03 m and close to the surface at x = 4.1 mm. Further offshore, no more instances of MP “D” have been detected in the sediment. In summary, MPs “C,” “D,” and “E” were transported toward the inner breaker bar and accumulated there, regardless of whether the MPs were initially applied offshore or onshore from the inner breaker bar.
The transport mechanisms of MP inside the surf zone strongly depend on the temporal scale of the progression of wave-induced material deposition. This resembles a cumulative effect originating from prevalent driving forces on non-buoyant MP particles and is quantified for MP “E”, which was sampled at two time steps (t = 1 h and t = 14 h). The result is given in Figures 7A,B. The MP distribution is given equivalently to the graphical representation of Figure 6. After 1 h of test time, MPs “E” migrated from the SWL toward more offshore environments. The particles accumulated at the trough onshore of the outer breaker bar (x = 4.0 m) and all over the inner breaker bar, (5.0 m < x < 5.6 m). At the outer breaker bar, tracers occurred up to a depth of zs = −0.03 m. At the inner breaker bar, most particles are close to the bed profile surface and at a maximum depth of zs = −0.02 m. It was shown that the breaker bars migrated further offshore over time. It can be deduced that MP particles are buried by sediment during this gradual migration process (i.e., depicted by lower abundances in shallower zs-regions).
Obviously, the dominant abundance of tracer “E” at the inner breaker bar reduces significantly after t = 14 h. The tracer in the trough of the outer breaker bar were re-mobilized and accumulated at the former inner breaker bar. This discovered process resembles a temporal deposition effect of MP particles after sufficient time spans to relocate its initial into a terminal position.
A comparison between Figures 7B,C highlight the repeatability of the processes. The absence of MP particles in the area of the inner breaker bar is due to the fact that the water in test 002 has not been drained during the experiment and the particles have spread unaffected by it.
Size and density dependency
Samples taken earlier with the syringe and subsequently analyzed contained no MPs with diameters > 1 mm. Since, for MP “L”, only a minimum quantity of the initial population was detected on the beach profile surface, a test excavation probe of in-situ material was taken (t = 23 h). Excavating a sediment probe and following analysis proved that tracers from the populations “J,” “L,” “M,” and “P” could be observed in the sediment sample (no other MP with a diameter > 1 mm; MPs with a diameter < 1 mm were not counted during the excavation). The composition of the material and its constituents are given in Figure 8. Tracers “J,” “L,” and “M” were detected in different quantities in a rather narrow stretch in the surf zone between 4.1 m < x < 4.3 m but not deeper than 10 cm below the beach surface. Beyond this region, these tracers were not detected in the sediment.
Tracer “P” is distributed over a larger area in the sediment (4.5 m < x < 4.8 m), also not deeper than 10 cm below the beach profile. The MP accumulation peaked at the offshore-oriented slope of the inner breaker bar.
In contrast to the much smaller MPs “C,” “D,” and “E,” the larger MP particles “J,” “L,” “M,” and “P” tend to accumulated in the sand offshore from the breaker bar, whereas the former were found onshore from the breaker bar. Furthermore, the MP “P,” which was by far the heaviest particle in this study, was distributed within the sediment over the largest distance. On the other hand, the lightest MP “M” concentrated to a rather small area offshore from the breaker bar. Therefore, there seems to be a correlation between the density of a MP particle and its potential for infiltration and accumulation in the sand: the heavier the particle, the easier it is infiltrated.
Cross-Shore Positioning
The cross-shore transport of MP particles in the test environment was obtained from image processing data. Visual observations of the test area showed that the particles, as soon as they were picked up by the waves, were moved by all modes of transport depending on their density and thus position in the water column. The deposition of these particles after a certain time varied for different sizes, shapes and densities. Deposition must be specified in this case: The plastic generally particles followed the orbital tracks in the water column and above the ground imprinted by the wave action. Due to shallow and intermediate water depths conditions, the particles above the ground moved floor-parallel (Δx ~ 8 cm) on- and offshore directed (Greenwood, 2003). In order to determine the position of the particles at certain times, the wave generation was stopped and the particles deposited on the spot.
It is observed that each particle fraction concentrates around a specific location x in cross-shore direction, which is referred to as the peak accumulation point ap. The number of MP particles at a given location NP(x) is normalized by the maximum number of particles at the accumulation peak NP(x =xap). Then, the normalized quantity at the accumulation peak is always equal to 1. In the following, this relation is described as normalized quantity (NP(x) /NP(xap)).
It is assumed that the resistance of a particle of a certain size, shape and density to a flow force acting on it can be expressed by the settling velocity w. Then, Figure 9 highlights the shoreline-orthogonal MP distribution. The normalized quantity of the detected MP particles is given by the cross-shore coordinate x. These distributions are sorted according to the associated settling velocity w.
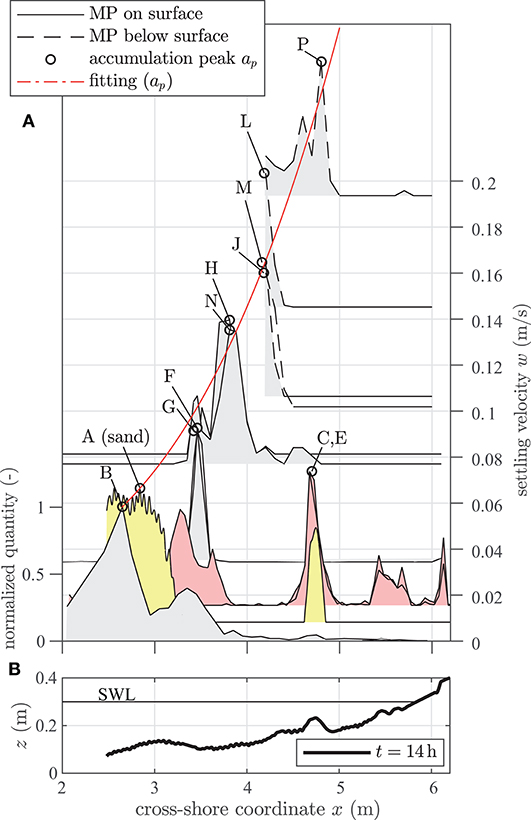
Figure 9. (A) Shoreline-orthogonal distribution of normalized MP quantities on (black solid contour) and below (black dashed contour) the bed profile sorted by corresponding settling velocity. (B) Bed profile elevation for t = 14 h (black bold line) and still water line (black line).
First, MPs can be found anywhere between the two breaker bars. Secondly, it can be seen that the location of the peak accumulation moves in onshore direction as the MP's settling velocity increases. Interestingly, the peak accumulation point of the sediment particles (tracer “A,” yellow shaded) also matches this empirically deduced dependency. If one takes into account the increase in water depth for a decreasing x-coordinate and consequently a decrease in orbital flow energy (Figure 10), a dependency of the MP cross-shore placement on the orbital flow velocity and settling velocity appears coherent. Particles with a comparatively high settling velocity are rather dense and follow a more streamlined shape, whereas particles with a low settling velocity have a lower density and are less streamlined. Therefore, particles with an associated high sinking velocity are more likely to deposit in lower water depths (Figure 10) with exposure to higher wave induced flow velocities, as they are more resistant against these than particles with a small settling velocity.
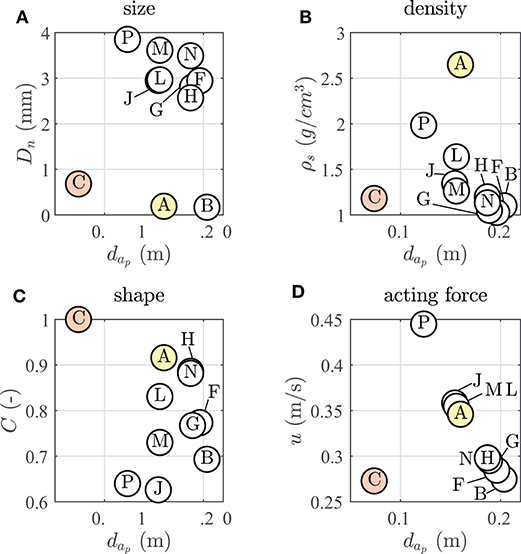
Figure 10. Particle properties [(A) size, (B) density, (C) shape, and (D) acting force] over water depth d at corresponding accumulation peak ap.
The accumulation peaks of tracer “C” and “E” (red shaded) do not initially follow this recognized trend. However, Figure 5 shows the relatively rapid (t = 0.33 h) formation of an inner breaker bar near the shore line (x = 5.3 m). One potential explanation for the accumulation location of particles “C” and “E” might be that this inner breaker bar led to reduced flow loads or functioned as a sheltering option for these particles.
Furthermore, Figure 10 shows a decrease of the microplastic density with increasing water depth and thus distance to the shoreline. This phenomenon deduced in the present experimental configuration can be robustly confirmed from observations in field data (Turra et al., 2014).
Results further indicate that transport and deposition patterns of MP particles in the surf-zone are dependent on the particle's size, shape and density. The revealed data from the wave flume experiments suggest a prominent correlation and, presume, a control mechanism between the settling velocity of particles and their prime deposition position inside the surf-zone in dependence of the prevailing wave conditions. The reproducibility of these results is robustly confirmed by repeated tests in order to exclude arbitrariness of the experiments.
To provide additional insights in the processes leading to the different accumulation peaks for each of the tested MPs, the relationship between the forces acting on the MP particle at the point of accumulation (mean return flow) and the forces acting against it [i.e., the particle settling velocity w (Ahrens, 2000)] are examined. The sediment settling velocity is found to be an appropriate feature to mimic a distinct measure of the grain resistance to withstand entrainment and transport (Heng, 1989). As it has already been proven that Ahrens' approach maps the settling velocity of MP with a small error (E = 6.6%, R2 = 0.962) (Khatmullina and Isachenko, 2017), the approach of Ahrens is applied. Particle shape corrections (Kowalski et al., 2016) are not applied in the present study.
A linear correlation has been empirically identified between the particle settling velocity w and the respected local water depth dx,p at the peak accumulation point of the particle. To improve the universal character of this correlation and to constitute a transferability of our findings, a dimensionless relation is practically derived. An additional linear correlation has been identified between the dimensionless settling velocity and the relative water depth dx,ap/Hm. The physical differences in the system at different relative water depth are identified as differences in the maximum horizontal orbital velocities over ground.
The correlation between the dimensionless settling velocity and the relative maximum horizontal orbital velocity can be expressed by
with a corresponding quality of fit of R2 = 0.94 and a root mean square error of RMSE = 97.3 (Figure 11). The settling velocity w represents the resisting forces of the MP particles that incorporates the relative particle density , the particle diameter Dn and the kinematic fluid viscosity υkin. The maximum orbital velocity umax is induced by the prevalent wave climate and represents the acting forces of the fluid motion on the particle on the bed profile and includes the mean wave height Hm, mean wave period Tm and the local water depth dz,ap.
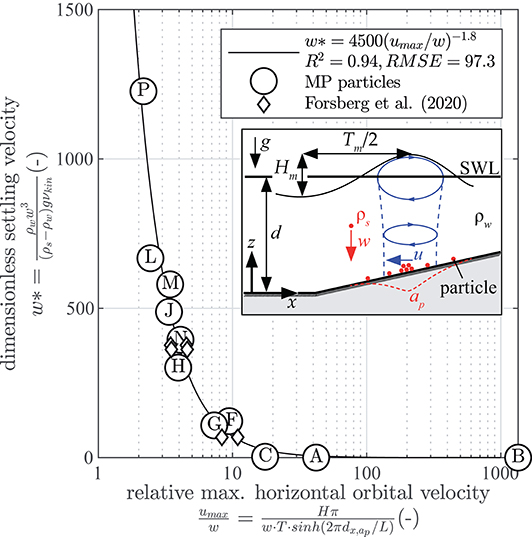
Figure 11. Correlation between the dimensionless settling velocity w (red) and the relative max horizontal orbital velocity u (blue).
The next chapter, therefore, moves on to discuss (i) the correlation between the settling velocity of a particle, its deposition location and the local prevailing flow conditions, (ii) the consistency of results compared to observations by other authors, and (iii) the influence of model simplification on the observed processes.
Discussion
One of the key findings of the present study on the wave-induced distribution of MP particles in the surf zone over a dynamic bed profile is the formation of accumulation peaks based on particle properties.
For the cross-shore direction, it was observed that the accumulation peaks tend to move toward shallow waters with increasing particle size or density. This trend is in agreement with similar observations made in the field (Turra et al., 2014; Hinata et al., 2017; Shim et al., 2018) and laboratories (Forsberg et al., 2020). Furthermore, the results revealed a correlation between the dimensionless settling velocity of MP particles and the acting velocity (orbital flow velocity in the present case). This observation is supported by the fact that the settling velocity of the sediments was previously found to be suitable as a measure of resistance of the grain to transportation (Heng, 1989). It could be shown that the simplified maximum horizontal orbital flow velocity enables a prediction of the accumulation peak of MP particles of different size and density. A transferability of this correlation to more complex and three-dimensional flow processes must be proven in future studies and also in larger scale.
Since the particles examined in this study all have similar round shape, the influence of the particle shape on the formation of accumulation peaks could only be discussed qualitatively. However, recent laboratory studies have identified influences of the particle shape on the particle's fate (Forsberg et al., 2020; Waldschläger and Schüttrumpf, 2020) and settling velocity approaches are already available that take the particle shape into account (Kowalski et al., 2016). Further studies should thus be carried out to determine whether the description of accumulation peaks by settling velocity also applies to MP particles with significant different shapes. However, a first comparison to data of plates and fibers (Forsberg et al., 2020) is positive (Figure 11).
The observation of the vertical position of MP particles in the subsurface reveals that for large MP particles (Dn > 1 mm, 15 < Dn,plastic/Dn,grain < 20) a corresponding high density () was required to be stratified during the formation of the bed profile. Small MP particles (Dn < 1 mm, Dn,plastic/Dn,grain = 3.6) stratified during the dynamic formation of the bed profile in the morphdynamically active regions mainly at positions where the inner and outer breaker bar was formed. This supports observations from oscillating sheet flows where significant vertical sorting occurred during the acceleration phase of particles (Harada et al., 2015). In contrast to this, tests on the infiltration behavior of MP particles in sediments by constant flows revealed hardly any infiltration for particles with a diameter three times larger than the grain diameter (Waldschläger and Schüttrumpf, 2020).
In terms of limitations, the conducted model tests show the known scale effects of bedload transport models caused by the impossible similitude of the Reynolds number, the Froude number, the sediment density and the settling velocity in different scales (Kamphuis and Nairn, 1985; Hughes, 1993). Inertial forces and gravity are considered predominantly, whereas viscosity, elasticity, and surface tension are incorrectly represented. For the present study, all friction effects—especially on the boundary layer—are overestimated. The present model scale is small compared to the prototype conditions (e.g., wave height Hm = 0.11 m). The grain size and MP particle size and density, on the other hand, show prototype dimensions, which a requirement for correctly modeling environmental transport (Schwarz et al., 2019). This leads to an imbalance between forces (scaled) acting on the particles and resistance forces (prototype) of the particles. It is assumed that the influence of slight density differences on the MP abundance is not as dominant as in this test set-up. It was deliberately refrained from working with scaled sediments and MP particles to avoid a dissimilarity of the settling velocity of the sediments and the MP particles in the water, as an incorrect scaling of relative density results in inaccurate particle accelerations and sediment transport rates (Hughes, 1993). The development of the bathymetry on a prototype scale after 90 min test time (Van der Zanden et al., 2017) is very similar to that of the present tests after about 30 min (Froude similitude: 90 min·(1/10)0.5 = 28.5 min). During this time, the crest of the outer breaker bar mainly rose. Thus, the generally described observations tend to apply. In addition, this comparison and the continuation of the present small scale experiments for additional hours shows that the large scale tests study did not achieve an equilibrium.
Model experiments are carried out with regular wave trains considered of 1st order wave theory resembling progressive periodic waves of permanent shape. The bed profile evolution for regular waves is known to be similar compared to irregular wave spectra, but the process for regular waves is faster (Dean, 1985). The influence of the faster morphological change of the bed profile in the present tests on the distribution of the MP remains unknown for the time being and should be investigated in future studies.
A study in a wave flume enables the approximation of two-dimensional flow conditions in cross-shore orthogonal orientation. Three-dimensional flow conditions, such as long-shore currents, rip-currents, inclined wave attack and wave refraction, are neglected in such studies. However, it is known that these phenomena have an impact on the transport processes of MPs in the surf-zone (Sebille et al., 2020).
The wave parameters were kept constant throughout the study. A parameter study on the influence of different wave heights and wave steepness was not carried out because the focus of the study was on the general transport dynamics of MP particles and the sea state is only the driving force in the system. A comparison to additional limited data (Forsberg et al., 2020) showed that the identified correlation between dimensionless settling velocity and relative horizontal orbital velocity is applicable for varying wave steepness (Figure 11). Against this background, future studies in larger scales should investigate whether the mechanisms of action shown can also be transferred to other wave parameters and also to wave spectra.
The physical model tests were repeated only once. A higher number of repetitions would be desirable for statistically robust analysis and subsequent statements. However, the single repetition showed that the bathymetry after 14 h test time could be accurately reproduced (187 comparative positions along the slope, R2 = 0.987, MSE = 8.2 × 10⁻⁵, Δmax = 26.3 mm at the trough behind the outer breaker bar).
The findings of the current study relate primarily to the transport behavior of spherical MP particles, with diameters larger than that of the surrounding sediment (except MP “B”). It is known that the ratio of the size between plastic particles and the surrounding sediment has an influence on the transport behavior (Waldschläger and Schüttrumpf, 2019b; Sebille et al., 2020) because if, for example, the particle size is smaller than the sediment grain size, the initiation of movement depends on the particle orientation to the flow.
The influence of the shape factor is less varied in the present study (0.64 < CSF < 1). Based on 45 studies, the probability distribution of Corey shape factors (CSF) and densities of MP particles in natural sediment were analyzed (Kooi and Koelmans, 2019). The shape factor distribution is dominated by fibers and fragments (CSF = 0.25−0.75). The authors identified fibers as the most abundant shape particles (48.5%) and only 6.5% with a spherical shape. They identified PE (density range: 0.89 0.98 g/cm3, 25% proportion), PET (0.96−1.45 g/cm3, 16.5%), and PA (1.02−1.16 g/cm3, 12%) as the most common MP polymer types. The present study covers this density range fairly well.
The sampling method has an influence on the MP detection in the field as well as in the laboratory, and the detection of MP particles varies between different research groups. There is an urgent need to establish standardized protocols for sampling, sample preparation, MP analysis and data expression (Phuong et al., 2016; Prata et al., 2019). Removal of organic matter through digestion improves identification. Visual inspection can be improved, chemical identification is essential. Mitigation of cross-contaminations is required to validate the results. The present study attempted to minimize these influences by examining a known number of particles with known material properties. This enables exact quantification between existing and detected particles in the system. Most of the particles with Dn > 1 mm could be detected at the end of each test (Table 2). No transparent particles should be used in further studies as they appear invisible in water. For particles with Dn < 1 mm only 5–10% are detected at the end of the tests (97% of these on the bed profile and 3% in the sediment samples). Hence, the fate of over 90% of particles with Dn < 1 mm remains unknown in the present study.
Laboratory experiments are often performed with MP concentrations of a higher order of magnitude than those found in the field (Phuong et al., 2016). MP particle exposure conditions usually involve only one type of polymer of a precise size and homogenous shape. Particle exposure conditions are not consistent with the particles present in the field (many types, sizes, shapes). A wider range of sizes and types of MPs was investigated in the present study. The form factors, on the other hand, are predominantly spherical. With regard to the plastic particle density in the morphodynamically active model area (the upper 5 cm of the bathymetry) we had 1,300 particles with a diameter > 1 mm in a dry sediment mass of 87 kg, which led to a particle density of about 15 particles/kg. About 25,000 particles with a diameter of 0.68 mm (Tracer “C,” “D,” and “E”) have been used in the associated tests, which lead to a mean particle density of 287 particles/kg. For reference, in a study of 300 m deep urban fjord in Norway (Haave et al., 2019), 48–107 particles/kg dry sample weight with a diameter > 0.5 mm were detected in the natural samples. A study about the sandy coasts of the Baltic Sea detected very similar ranges of 56–108 particles/kg dry sample weight with a diameter between 0.5 and 5 mm (maximum concentration 600 particles/kg) (Chubarenko et al., 2018b). Therefore, the number of plastic particles used in the present experiment is comparable to natural deposits.
Conclusion
Experiments in a two-dimensional wave flume have been conducted in order to explore the general behavior of MP particles on a sloping beach composed of real sediments and to quantify the wave-induced distribution of particles in the surf zone. The related mix of MP particle demonstrated a comparable spherical shape and showed a large variation in size (0.17 < Dn(mm) < 4.07) and density (). The material properties were selected based on typical abundances surveyed in the natural environment.
It was found that the accumulation peaks on the sloping beach of different MP abundances in the system correlate with a certain water depth for constant wave conditions. The accumulation peak of typical MP fractions tends to shift into shallower water depths with increasing particle size and density. This revealed mechanism corroborates with observations from field surveys. These findings lead to the derivation of a correlation between the dimensionless settling velocity w* representing resisting forces of the particle and the normalized horizontal orbital velocity u/w induced by the wave impact representing acting forces on the particle.
The findings of the present study are useful for numerical studies of the dynamic behavior of MP particles in the surf zone. In addition, they can contribute with the identification of accumulation locations of MP particles with different characteristics in the natural environment.
It was discussed, that the detection of MP particles in hydraulic model tests is important and must be improved and standardized. Furthermore, it can be deduced that the observed MP particle distribution on the sloping beach was affected by the small and only modular scale of the wave flume facility and, moreover, influenced by rudimentary model implementation schemes in the present study. For an identification and quantification of these influences, additional experiments in larger scale and with irregular waves have to be carried out. Also, the analysis of the influence of storm sequences incorporating wave and water level variations could help to understand the dynamic rearrangement and re-suspension of MP particles in the surf zone. The observations in these tests suggest that the surface abrasion of MP particles in the surf zone is strong. Long test series in larger scales could contribute to further understand and quantify the degradation of particles from MP to nanoplastic.
Data Availability Statement
The raw data supporting the conclusions of this article will be made available by the authors, without undue reservation.
Author Contributions
NK: research concept, literature review, test design, conducting hydraulic tests, data processing, analysis, and manuscript writing. TS: research idea, research concept, manuscript review, and guidance. AS: literature on sediment transport, data verification, and discussion. JG: data verification and discussion. DM: image processing and MP counting. MH: MP sample analysis. All authors discussed the results and contributed to the final manuscript.
Funding
The publication of this article was funded by the Open Access Fund of the Leibniz University Hannover.
Conflict of Interest
The authors declare that the research was conducted in the absence of any commercial or financial relationships that could be construed as a potential conflict of interest.
Acknowledgments
The authors gratefully acknowledge the contribution of Jonas Matthia and Anja Balkenhol who supported the physical model tests and the sample analysis.
Supplementary Material
The Supplementary Material for this article can be found online at: https://www.frontiersin.org/articles/10.3389/fmars.2020.590565/full#supplementary-material
References
A, D. A. van der., Zanden, J. van der, O'Donoghue, T., Hurther, D., Cáceres, I., McLelland, S. J., et al. (2017). Large-scale laboratory study of breaking wave hydrodynamics over a fixed bar. J. Geophys. Res. Oceans 122, 3287–3310. doi: 10.1002/2016JC012072
Ahrens, J. P. (2000). A fall-velocity equation. J. Waterw. Port Coast. Ocean Eng. 126, 99–102. doi: 10.1061/(ASCE)0733-950X(2000)126:2(99)
Baas, J. H. (1978). “Ripple, ripple mark, ripple structure,” in Sedimentology (Berlin, Heidelberg: Springer), 921–925. doi: 10.1007/3-540-31079-7_172
Bagaev, A., Mizyuk, A., Khatmullina, L., Isachenko, I., and Chubarenko, I. (2017). Anthropogenic fibres in the Baltic Sea water column: Field data, laboratory and numerical testing of their motion. Sci. Total Environ. 599–600, 560–571. doi: 10.1016/j.scitotenv.2017.04.185
Baldock, T. E., Kudo, A., Guard, P. A., Alsina, J. M., and Barnes, M. P. (2008). Lagrangian measurements and modelling of fluid advection in the inner surf and swash zones. Coast. Eng. 55, 791–799. doi: 10.1016/j.coastaleng.2008.02.013
Ballent, A., Pando, S., Purser, A., Juliano, M. F., and Thomsen, L. (2013). Modelled transport of benthic marine microplastic pollution in the Nazaré Canyon. Biogeosciences 10, 7957–7970. doi: 10.5194/bg-10-7957-2013
Battjes, J. A. (1974). Computation of set-up, longshore currents, run-up and overtopping due to wind-generated waves: Techn. Hogeschool, Proefschr.–Delft, 1974. Delft: Delft University of Technology.
Bunte, K., and Abt, S. R. (2001). Sampling Surface and Subsurface Particle-Size Distributions in Wadable Gravel-and Cobble-Bed Streams for Analyses in Sediment Transport, Hydraulics, and Streambed Monitoring. Ft. Collins, CO: U.S. Department of Agriculture, Forest Service, Rocky Mountain Research Station. doi: 10.2737/RMRS-GTR-74
Chubarenko, I., Esiukova, E., Bagaev, A., Isachenko, I., Demchenko, N., Zobkov, M., et al. (2018a). “Chapter 6—behavior of microplastics in coastal zones,” in Microplastic Contamination in Aquatic Environments, ed E. Y. Zeng (Elsevier), 175–223. doi: 10.1016/B978-0-12-813747-5.00006-0
Chubarenko, I., Esiukova, E. E., Bagaev, A. V., Bagaeva, M. A., and Grave, A. N. (2018b). Three-dimensional distribution of anthropogenic microparticles in the body of sandy beaches. Sci. Total Environ. 628–629, 1340–1351. doi: 10.1016/j.scitotenv.2018.02.167
Chubarenko, I., and Stepanova, N. (2017). Microplastics in sea coastal zone: Lessons learned from the Baltic amber. Environ. Pollut. 224, 243–254. doi: 10.1016/j.envpol.2017.01.085
Corey, A. T. (1949). Influence of shape on the fall velocity of sand grains. (Master's Thesis). Colorado Agricultural and Mechanical College, Fort Collins. Available online at: https://mountainscholar.org/bitstream/handle/10217/195976/ETDF_1949_Corey_A.pdf (accessed January 27, 2020).
Dean, R. G. (1985). “Physical modelling of littoral processes,” in Physical Modelling in Coastal Engineering: Proceedings of an International Conference, ed R. A. Dalrymple (Newark, DE: Balkema), 119–139.
Dean, R. G., and Dalrymple, R. A. (1984). Water Wave Mechanics for Engineers and Scientists. Prentice-Hall. Available online at: https://www.scholars.northwestern.edu/en/publications/water-wave-mechanics-for-engineers-and-scientists
DiBenedetto, M. H. (2020). Non-breaking wave effects on buoyant particle distributions. Front. Mar. Sci. 7:148. doi: 10.3389/fmars.2020.00148
Efimova, I., Bagaeva, M., Bagaev, A., Kileso, A., and Chubarenko, I. P. (2018). Secondary microplastics generation in the sea swash zone with coarse bottom sediments: laboratory experiments. Front. Mar. Sci. 5:313. doi: 10.3389/fmars.2018.00313
Enders, K., Lenz, R., Stedmon, C. A., and Nielsen, T. G. (2015). Abundance, size and polymer composition of marine microplastics ≥10 μm in the Atlantic Ocean and their modelled vertical distribution. Mar. Pollut. Bull. 100, 70–81. doi: 10.1016/j.marpolbul.2015.09.027
Forsberg, P. L., Sous, D., Stocchino, A., and Chemin, R. (2020). Behaviour of plastic litter in nearshore waters: first insights from wind and wave laboratory experiments. Mar. Pollut. Bull. 153:111023. doi: 10.1016/j.marpolbul.2020.111023
Fredsøe, J., and Deigaard, R. (1992). Mechanics of Coastal Sediment Transport. Singapore; New Jersey: World Scientific. doi: 10.1142/1546
Frigaard, P., and Andersen, T. L. (2014). Analysis of Waves: Technical documentation for WaveLab 3. Denmark: Department of Civil Engineering, Aalborg University.
Galgani, F., Hanke, G., Werner, S., Oosterbaan, L., Nilsson, P., Fleet, D., et al. (2013). Guidance on monitoring of marine litter in European seas. Lucembourg: Publications Office of the European Union.
Gerritse, J., Leslie, H. A., de Tender, C. A., Devriese, L. I., and Vethaak, A. D. (2020). Fragmentation of plastic objects in a laboratory seawater microcosm. Sci. Rep. 10:10945. doi: 10.1038/s41598-020-67927-1
Greenwood, B. (2003). “Sediment transport by waves,” in Encyclopedia of Sediments and Sedimentary Rocks, eds G. V. Middleton, M. J. Church, M. Coniglio, L. A. Hardie, and F. J. Longstaffe (Dordrecht: Springer Netherlands), 619–626.
Haave, M., Lorenz, C., Primpke, S., and Gerdts, G. (2019). Different stories told by small and large microplastics in sediment—first report of microplastic concentrations in an urban recipient in Norway. Mar. Pollut. Bull. 141, 501–513. doi: 10.1016/j.marpolbul.2019.02.015
Harada, E., Gotoh, H., and Tsuruta, N. (2015). Vertical sorting process under oscillatory sheet flow condition by resolved discrete particle model. J. Hydraul. Res. 53, 332–350. doi: 10.1080/00221686.2014.994139
Hardesty, B. D., Harari, J., Isobe, A., Lebreton, L., Maximenko, N., Potemra, J., et al. (2017). Using numerical model simulations to improve the understanding of micro-plastic distribution and pathways in the marine environment. Front. Mar. Sci. 4:30. doi: 10.3389/fmars.2017.00030
Heng, S. L. (1989). Effect of sediment density on bed-load transport. J. Hydraul. Eng. 115, 124–138. doi: 10.1061/(ASCE)0733-9429(1989)115:1(124)
Hidalgo-Ruz, V., Gutow, L., Thompson, R. C., and Thiel, M. (2012). Microplastics in the marine environment: a review of the methods used for identification and quantification. Environ. Sci. Technol. 46, 3060–3075. doi: 10.1021/es2031505
Hinata, H., Mori, K., Ohno, K., Miyao, Y., and Kataoka, T. (2017). An estimation of the average residence times and onshore-offshore diffusivities of beached microplastics based on the population decay of tagged meso- and macrolitter. Mar. Pollut. Bull. 122, 17–26. doi: 10.1016/j.marpolbul.2017.05.012
Ho, N. H. E., and Not, C. (2019). Selective accumulation of plastic debris at the breaking wave area of coastal waters. Environ. Pollut. 245, 702–710. doi: 10.1016/j.envpol.2018.11.041
Holthuijsen, L. H. (2007). Waves in Oceanic and Coastal Waters. Cambridge: Cambridge University Press. doi: 10.1017/CBO9780511618536
Horikawa, K. (1988). Nearshore Dynamics and Coastal Processes: Theory, Measurement, and Predictive Models. Japan: University of Tokyo Press.
Hughes, S. A. (1993). Physical Models And Laboratory Techniques In Coastal Engineering. Singapore: World Scientific. doi: 10.1142/2154
Inman, D. L. (1949). Sorting of sediments in the light of fluid mechanics. J. Sediment. Res. 19, 51–70. doi: 10.1306/D426934B-2B26-11D7-8648000102C1865D
Kaiser, D., Estelmann, A., Kowalski, N., Glockzin, M., and Waniek, J. J. (2019). Sinking velocity of sub-millimeter microplastic. Mar. Pollut. Bull. 139, 214–220. doi: 10.1016/j.marpolbul.2018.12.035
Kamphuis, J. W., and Nairn, R. B. (1985). Scale effects in large coastal mobile bed models. Coast. Eng. 1984, 2322–2338. doi: 10.1061/9780872624382.157
Kane, I. A., and Clare, M. A. (2019). Dispersion, accumulation, and the ultimate fate of microplastics in deep-marine environments: a review and future directions. Front. Earth Sci. 7:80. doi: 10.3389/feart.2019.00080
Khatmullina, L., and Isachenko, I. (2017). Settling velocity of microplastic particles of regular shapes. Mar. Pollut. Bull. 114, 871–880. doi: 10.1016/j.marpolbul.2016.11.024
Klemchuk, P. P. (1990). Degradable plastics: a critical review. Polym. Degrad. Stab. 27, 183–202. doi: 10.1016/0141-3910(90)90108-J
Kooi, M., and Koelmans, A. A. (2019). Simplifying microplastic via continuous probability distributions for size, shape, and density. Environ. Sci. Technol. Lett. 6, 551–557. doi: 10.1021/acs.estlett.9b00379
Kowalski, N., Reichardt, A. M., and Waniek, J. J. (2016). Sinking rates of microplastics and potential implications of their alteration by physical, biological, and chemical factors. Mar. Pollut. Bull. 109, 310–319. doi: 10.1016/j.marpolbul.2016.05.064
Krumbein, W. C. (1941). Measurement and geological significance of shape and roundness of sedimentary particles. J. Sediment. Res. 11, 64–72. doi: 10.1306/D42690F3-2B26-11D7-8648000102C1865D
Lavers, J. L., and Bond, A. L. (2017). Exceptional and rapid accumulation of anthropogenic debris on one of the world's most remote and pristine islands. Proc. Natl. Acad. Sci. 114, 6052–6055. doi: 10.1073/pnas.1619818114
McLaren, P., and Bowles, D. (1985). The effects of sediment transport on grain-size distributions. J. Sediment. Res. 55, 457–470. doi: 10.1306/212F86FC-2B24-11D7-8648000102C1865D
McNown, J. S., and Malaika, J. (1950). Effects of particle shape on settling velocity at low Reynolds numbers. Eos Trans. Am. Geophys. Union 31, 74–82. doi: 10.1029/TR031i001p00074
Nadaoka, K., and Kondoh, T. (1982). Laboratory measurements of velocity field structure in the surf zone by LDV. Coast. Eng. Jpn. 25, 125–145. doi: 10.1080/05785634.1982.11924341
Nielsen, P. (2009). Coastal and Estuarine Processes. Singapore: World Scientific Publishing Company. doi: 10.1142/7114
Phuong, N. N., Zalouk-Vergnoux, A., Poirier, L., Kamari, A., Châtel, A., Mouneyrac, C., et al. (2016). Is there any consistency between the microplastics found in the field and those used in laboratory experiments? Environ. Pollut. 211, 111–123. doi: 10.1016/j.envpol.2015.12.035
Prata, J. C., da Costa, J. P., Duarte, A. C., and Rocha-Santos, T. (2019). Methods for sampling and detection of microplastics in water and sediment: a critical review. TrAC Trends Anal. Chem. 110, 150–159. doi: 10.1016/j.trac.2018.10.029
Sagawa, N., Kawaai, K., and Hinata, H. (2018). Abundance and size of microplastics in a coastal sea: comparison among bottom sediment, beach sediment, and surface water. Mar. Pollut. Bull. 133, 532–542. doi: 10.1016/j.marpolbul.2018.05.036
Schwarz, A. E., Ligthart, T. N., Boukris, E., and van Harmelen, T. (2019). Sources, transport, and accumulation of different types of plastic litter in aquatic environments: a review study. Mar. Pollut. Bull. 143, 92–100. doi: 10.1016/j.marpolbul.2019.04.029
Sebille, E., van Aliani, S., Law, K. L., Maximenko, N., Alsina, J. M., Bagaev, A., et al. (2020). The physical oceanography of the transport of floating marine debris. Environ. Res. Lett. 15:023003. doi: 10.1088/1748-9326/ab6d7d
Sebille, E., van England, M. H., and Froyland, G. (2012). Origin, dynamics and evolution of ocean garbage patches from observed surface drifters. Environ. Res. Lett. 7:044040. doi: 10.1088/1748-9326/7/4/044040
Shim, W. J., Hong, S. H., and Eo, S. (2018). “Chapter 1—marine microplastics: abundance, distribution, and composition,” in Microplastic Contamination in Aquatic Environments, ed. E. Y. Zeng (Elsevier), 1–26. doi: 10.1016/B978-0-12-813747-5.00001-1
Sneed, E. D., and Folk, R. L. (1958). Pebbles in the lower colorado river, Texas a study in particle morphogenesis. J. Geol. 66, 114–150. doi: 10.1086/626490
Song, Y. K., Hong, S. H., Jang, M., Han, G. M., Jung, S. W., and Shim, W. J. (2017). Combined effects of UV exposure duration and mechanical abrasion on microplastic fragmentation by polymer type. Environ. Sci. Technol. 51, 4368–4376. doi: 10.1021/acs.est.6b06155
Soulsby, R. (1997). Dynamics of Marine Sands: A Manual for Practical Applications. London: Thomas Telford.
Thompson, R. C., Olson, Y., Mitchell, R. P., Davis, A., Rowland, S. J., John, A. W. G., et al. (2004). Lost at sea: where is all the plastic? Science 304:838. doi: 10.1126/science.1094559
Tosin, M., Weber, M., Siotto, M., Lott, C., and Degli-Innocenti, F. (2012). Laboratory test methods to determine the degradation of plastics in marine environmental conditions. Front. Microbiol. 3:225. doi: 10.3389/fmicb.2012.00225
Turra, A., Manzano, A. B., Dias, R. J. S., Mahiques, M. M., Barbosa, L., Balthazar-Silva, D., et al. (2014). Three-dimensional distribution of plastic pellets in sandy beaches: shifting paradigms. Sci. Rep. 4:4435. doi: 10.1038/srep04435
Van der Zanden, J., Van der, A. D. A., Hurther, D., Cáceres, I., O'Donoghue, T., et al. (2017). Bedload and suspended load contributions to breaker bar morphodynamics. Coast. Eng. 129, 74–92. doi: 10.1016/j.coastaleng.2017.09.005
Van Rijn, L. C. (1993). Principles of sediment transport in rivers, estuaries and coastal seas. Amsterdam: Aqua publications Amsterdam.
Wadell, H. (1933). Sphericity and roundness of rock particles. J. Geol. 41, 310–331. doi: 10.1086/624040
Waldschläger, K., and Schüttrumpf, H. (2019a). Effects of particle properties on the settling and rise velocities of microplastics in freshwater under laboratory conditions. Environ. Sci. Technol. 53, 1958–1966. doi: 10.1021/acs.est.8b06794
Waldschläger, K., and Schüttrumpf, H. (2019b). Erosion behavior of different microplastic particles in comparison to natural sediments. Environ. Sci. Technol. 53, 13219–13227. doi: 10.1021/acs.est.9b05394
Waldschläger, K., and Schüttrumpf, H. (2020). Infiltration behaviour of microplastic particles with different densities, sizes and shapes—from glass spheres to natural sediments. Environ. Sci. Technol. 54, 9366–9373. doi: 10.1021/acs.est.0c01722
Wessel, C. C., Lockridge, G. R., Battiste, D., and Cebrian, J. (2016). Abundance and characteristics of microplastics in beach sediments: insights into microplastic accumulation in northern Gulf of Mexico estuaries. Mar. Pollut. Bull. 109, 178–183. doi: 10.1016/j.marpolbul.2016.06.002
Willis, K. A., Eriksen, R., Wilcox, C., and Hardesty, B. D. (2017). Microplastic distribution at different sediment depths in an Urban Estuary. Front. Mar. Sci. 4:419. doi: 10.3389/fmars.2017.00419
Woodall, L. C., Sanchez-Vidal, A., Canals, M., Paterson G. L. J., Coppock, R., Sleight, V., et al. (2014). The deep sea is a major sink for microplastic debris. R. Soc. Open Sci. 1, 140317. doi: 10.1098/rsos.140317
Keywords: plastic, pollution, nearshore zone, transport mechanisms, settling velocity, morphodynamics, grain sorting, shoreline
Citation: Kerpen NB, Schlurmann T, Schendel A, Gundlach J, Marquard D and Hüpgen M (2020) Wave-Induced Distribution of Microplastic in the Surf Zone. Front. Mar. Sci. 7:590565. doi: 10.3389/fmars.2020.590565
Received: 01 August 2020; Accepted: 23 October 2020;
Published: 30 November 2020.
Edited by:
Juan Jose Munoz-Perez, University of Cádiz, SpainReviewed by:
Bin Deng, Changsha University of Science and Technology, ChinaAlejandro Orfila, Consejo Superior de Investigaciones Científicas (CSIC), Spain
Copyright © 2020 Kerpen, Schlurmann, Schendel, Gundlach, Marquard and Hüpgen. This is an open-access article distributed under the terms of the Creative Commons Attribution License (CC BY). The use, distribution or reproduction in other forums is permitted, provided the original author(s) and the copyright owner(s) are credited and that the original publication in this journal is cited, in accordance with accepted academic practice. No use, distribution or reproduction is permitted which does not comply with these terms.
*Correspondence: Nils B. Kerpen, a2VycGVuQGx1ZmkudW5pLWhhbm5vdmVyLmRl