 Mikael K. Sejr1,2*
 Kim N. Mouritsen3
 Dorte Krause-Jensen1,2
 Birgit Olesen3
 Martin Emil Blicher4
 Jakob Thyrring1,2,5
- 1Department of Bioscience, Aarhus University, Silkeborg, Denmark
- 2Arctic Research Centre, Aarhus University, Aarhus, Denmark
- 3Department of Biology, Aarhus University, Aarhus, Denmark
- 4Greenland Climate Research Centre, Greenland Institute of Natural Resources, Nuuk, Greenland
- 5Department of Zoology, The University of British Columbia, Vancouver, BC, Canada
Understanding the influence of physical drivers and their scale-dependent interactions on ecosystem structure and function is becoming increasingly relevant as ecologists are challenged to quantify and predict the biological implications of anthropogenic activities and climate changes. Here, we aim to quantify the impact of multiple physical drivers (ice scour, wave exposure, and air temperature) and their interactions with small scale modifying factors (tidal level, substrate rugosity, and canopy forming macroalgae) on rocky intertidal community structure. We did this by quantifying intertidal biomass, cover and species richness at three tidal levels (high, mid, and low) at four sites in a sub-arctic Greenland fjord. We found a well-developed intertidal community, with a total of 16 macroalgae and 20 invertebrate species. At one locality, the total biomass was dominated by canopy forming algae exceeding 16 kg wet weight per m–2. Physical stress from ice scour, waves, and air exposure had negative effects on all three community metrics but important interactions and modifying processes were identified. The effect of tidal level differed between sites ranging from an absence of organisms at both high- and mid-intertidal level at the most ice- and wave exposed site to extensive cover across all three tidal levels at the wave and ice sheltered site. Canopy forming macroalgae and substrate rugosity both modified the impacts of physical stress. In the absence of ice scour, canopy forming algae formed extensive cover that modified extreme air temperatures, and the abundance of dominant invertebrate species were all positively related to the biomass of macroalgae. Rugosity provided refuge from ice scour, facilitating increased species richness and cover at exposed sites. Moreover, we detected no negative effects of fast ice, and ice scour impacts were primarily found where presence of glacial ice was combined with wave exposure. Our results provide an example of how large-scale physical factors pass through a filter of several modifying smaller scale processes before their impact on plot scale community structure is manifested.
Introduction
Organisms living in the rocky intertidal zone in the Arctic are subject to high levels of physical stress. Low winter air temperatures, large seasonal and diurnal temperature fluctuations, and ice scouring are factors characteristic for the region which, combined with wave action and desiccation, influence vertical and horizontal patterns of species richness, diversity, and composition (Heaven and Scrosati, 2008). In settings of extreme air temperature and sea ice scouring, microhabitats can provide an important refuge as exemplified for ice-scoured coasts in Canada, where organisms can be confined to crevices or depressions of the substrate deep enough to modify extreme temperatures, protect from ice abrasion, and shelter from wave exposure (Bergeron and Bourget, 1986; Guichard and Bourget, 1998; Helmuth et al., 2010). Ice scouring can also drive temporal variation in species composition (Carroll and Highsmith, 1996). Alleviation from physical stress can also be provided by organisms. For example, canopy forming algae can prevent dessication and mitigate extreme temperatures for organisms living below the canopy (Bertness et al., 1999). The importance of facilitative interactions increases in areas characterized by high physical stress (Bertness and Callaway, 1994). On north Atlantic shores, canopy forming algae increase the species diversity by buffering physical stress, especially temperature (Watt and Scrosati, 2013). Hence, when physical stress exceeds a critical level, the biological interactions may shift from competition to facilitation (Bertness and Leonard, 1997).
Quantitative studies of the rocky intertidal community structure in Greenland are limited to a few studies in sub-arctic West Greenland (Høgslund et al., 2014; Ørberg et al., 2018). In Greenland, community composition, species richness and diversity can be expected to be influenced by large scale factors working on a 100–1000 km scale, such as general climate conditions, ocean currents and the presence of sea ice and glaciers, resulting in latitudinal differences along the coast of Greenland and between Greenland and other Atlantic coasts (Węsławski et al., 2011; Renaud et al., 2015). However, such large scale drivers are modified by local scale factors in individual fjords.
In this study we aimed to quantify how factors varying at small scale (meters) may modify the impact of drivers typically showing variability on a larger scale (kilometers) to determine variation in rocky intertidal community structure. We selected four sites in a Greenland fjord, that were expected to vary in wave exposure and ice scouring intensity (large scale factors). At each site, we quantified the effect of intertidal level, substrate rugosity and macroalgal canopy cover (small scale factors) on three metrics of community structure; biomass, cover, and species richness. With a focus on interactions among the multiple drivers in defining community structure, we (1) quantify the importance of canopy-forming algae in modifying extreme temperatures, (2) test if canopy-forming macroalgae can increase species richness through stress alleviation, and finally, (3) test if surface rugosity can be a significant factor determining biomass of canopy-forming algae in particular and community structure and richness in general.
Materials and Methods
Study Site
The Nuup Kangerlua fjord system (64° N, 51° W) is a sub-arctic fjord characteristic for the southwest coast of Greenland (Figure 1). The distance between mouth and head of the fjord is 187 km and the entire coastline, which is dominated by rocky coast or talus, is estimated to 1272 km (Mortensen et al., 2011). The fjord is connected to the Greenland ice sheet through six glaciers terminating in the inner part of the fjord. Large parts of the fjord are ice free during winter except for a small branch (Kobbefjord), where fast ice is usually present from December to April. Depending on the moon phase, the tidal amplitude ranges from 1 to 5 m in Nuup Kangerlua. Water surface temperature is <0°C in winter and may exceed 10°C in shallow protected areas in summer (Olesen et al., 2015; Ørberg et al., 2018). Minimum air temperatures in winter range typically between −15 and −25°C and summer maximum is ca. 20°C (Thyrring et al., 2017). We selected four rocky intertidal sites in the outer part of the fjord system (Figure 1), together covering a wide range of wave and ice exposure.
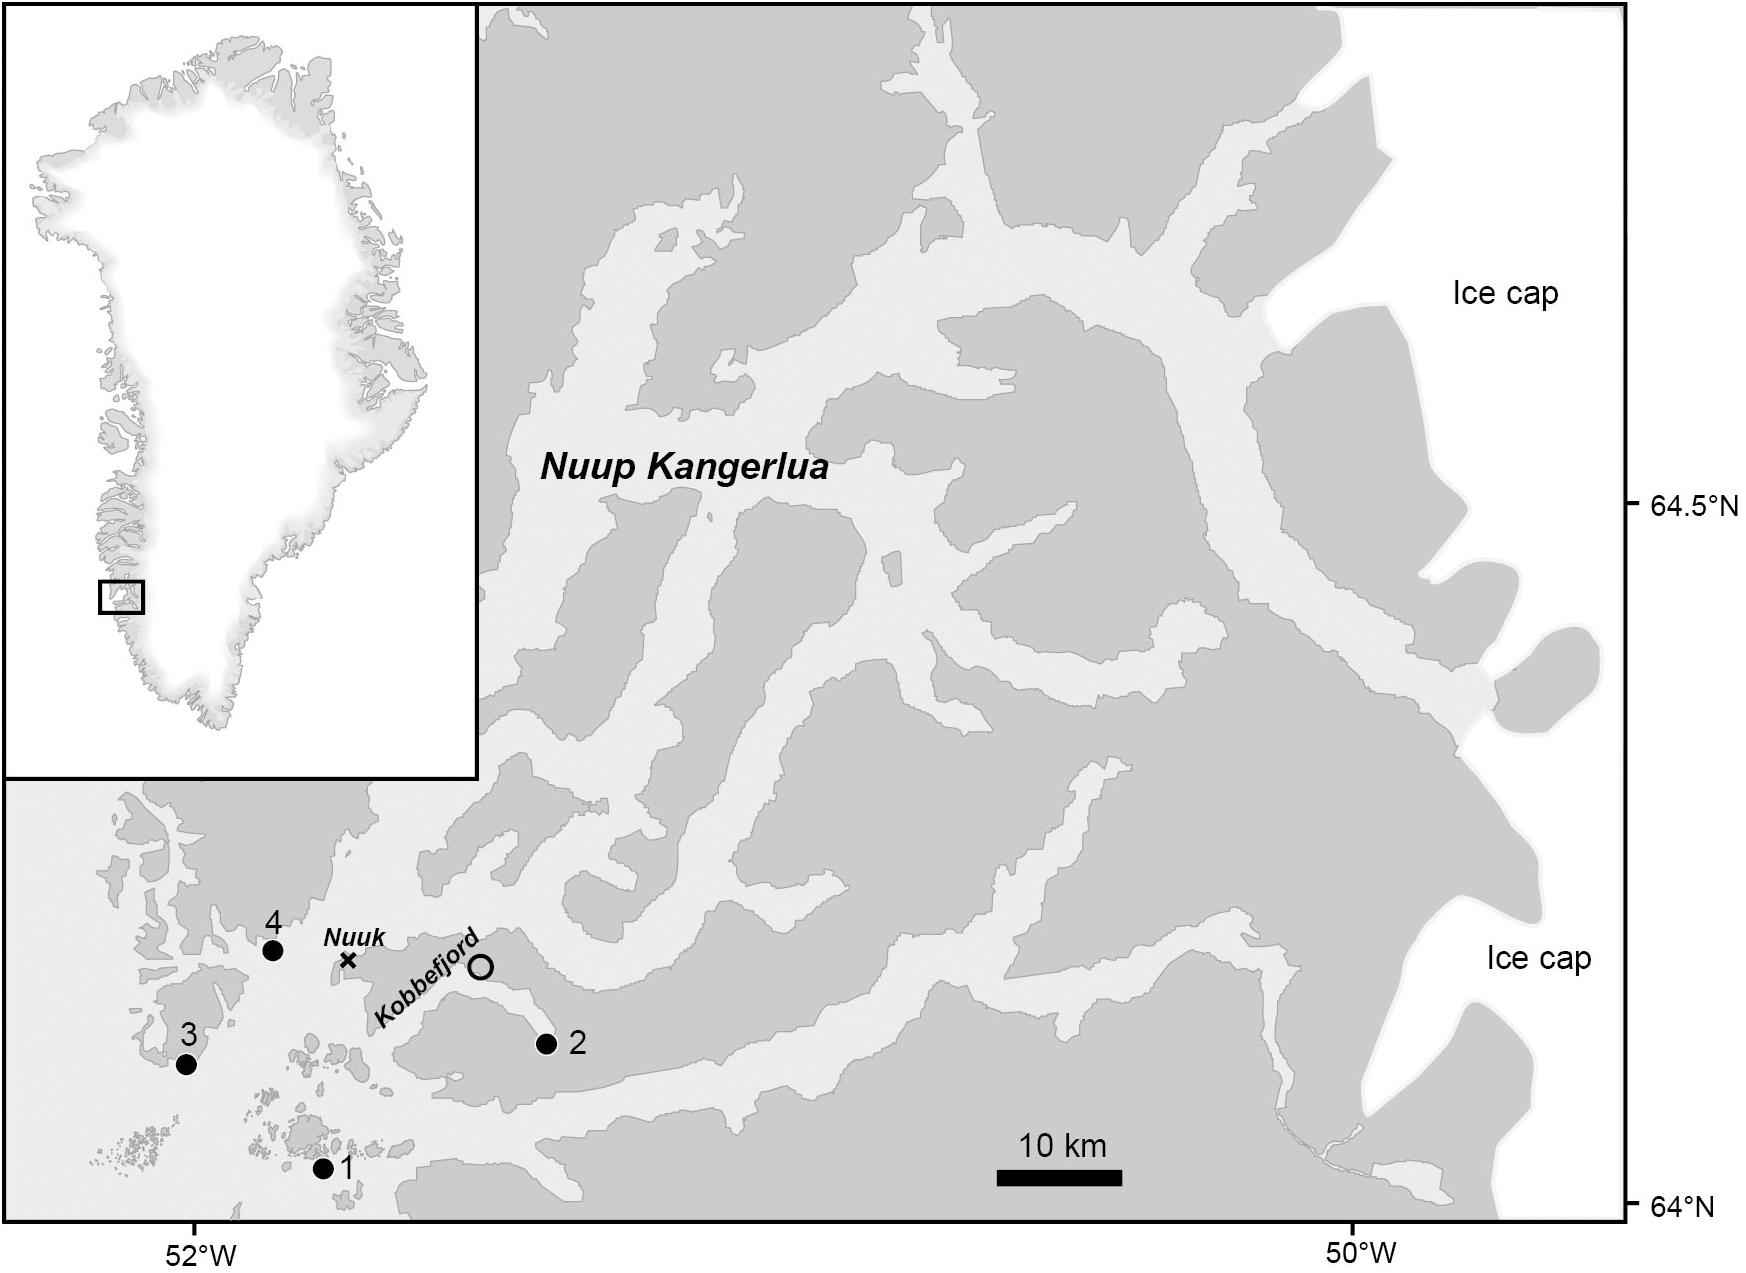
Figure 1. Map of the Nuup Kangerlua fjord system and the Kobbefjord branch with positions of study sites 1–4 (•), temperature loggers (∘) and meteorological station (×) for wind data, positioned in the city Nuuk.
Environmental Factors
The seasonal temperature profile was resolved for the three different tidal levels at a representative site selected according to its easy accessibility in winter (Site o, Figure 1). At site o, we placed Hobo temperature loggers at three tidal zones from August 18, 2011 to July 7, 2012. At each tidal zone one logger was placed on exposed bare rock (no algal cover) and one was placed beneath dense stands of canopy forming macroalgae (100% Ascophyllum nodosum cover). The distance between the two paired loggers at each zone was 0.5–1 m. A wave exposure index was calculated for each of the four study sites based on (1) the distance (fetch) to neighboring coastlines in 8 directions (at 45° intervals), (2) average wind speed, and (3) average wind direction (Blicher et al., 2013). Water temperature and salinity at other study sites were only measured once during August 2011 (Table 1). Wind speed and direction were obtained from a local meteorological station in Nuuk (see Figure 1) and provided by Asiaq1. Actual water velocity at each of the four sites was measured as wave force during a 14-day period in September 2011 using calibrated dynamometers (Bell and Denny, 1994) bolted into the rock. At each site, ice scour intensity was quantified by measuring the deformation of 10 stainless steel screws (diameter 3 mm) fixed in the mid-intertidal zone with their heads protruding c. 2 cm above the rockface. The angle of deformation (0–90°) was used as a proxy of ice scouring intensity and expressed in percentage, ranging from 0% (no deformation) to 100% when a screw was bent 90° (or broken off). The average across the ten screws for each site is given in Table 1. Screws were fixed in September 2011 and retrieved after 1 year. Rugosity was measured using a profile gauge to obtain a surface profile across the rock surface in each sample quadrat (diagonal corner to corner, see below) after harvesting the biomass. The profile of the rock surface mirrored on the profile gauge was photographed and the digital image was used to obtain straight horizontal and actual topographic distance across the measured rock surface. The actual distance divided by the horizontal distance defined an index of surface rugosity (range 1–1.4). At each intertidal level, the average and maximum exposure time to air was calculated based on the local tide model.
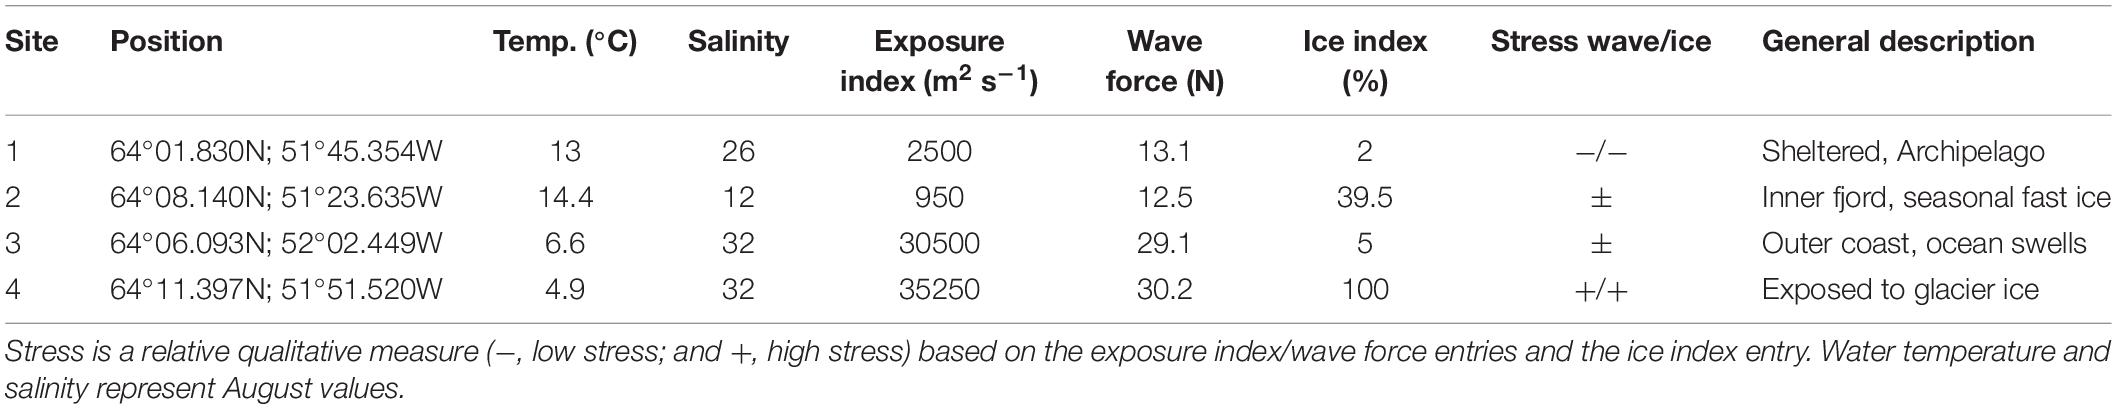
Table 1. Geographical position and physical properties of the four study sites in the Nuuk Kangerlua fjord system (see Figure 1).
Biological Sampling
At each of the four study sites, algae, and invertebrates were sampled at low, middle, and high tidal level corresponding to the mid-intertidal zone (middle), as identified from the local tide model, and 75 vertical cm above (high) and 75 vertical cm below (low), as identified using a vertical rod and a hand niveller. The mid-intertidal zone (2.55 m above chart 0) was defined as the elevation corresponding to half of the maximum tidal amplitude, which is 5.10 m according to the local tide model. The average and extreme air exposure for each sampled tidal level is given in Table 2. At each tidal zone, a 5 m rope was positioned parallel to the shore, and along the rope 7 replicate sample quadrats were laid out using 25 × 25 cm metal frames. Within each quadrate (0.0625 m2), algae and invertebrate cover was estimated by eye for individual species (for barnacles usually for a sub-area of the quadrate) and summed across all species to provide an estimate of total cover, which could exceed 100% when species were overlaid. Once cover was estimated, all organisms where harvested within each quadrat for identification to lowest possible taxonomic level and measurement of biomass (wet weight) in the lab.
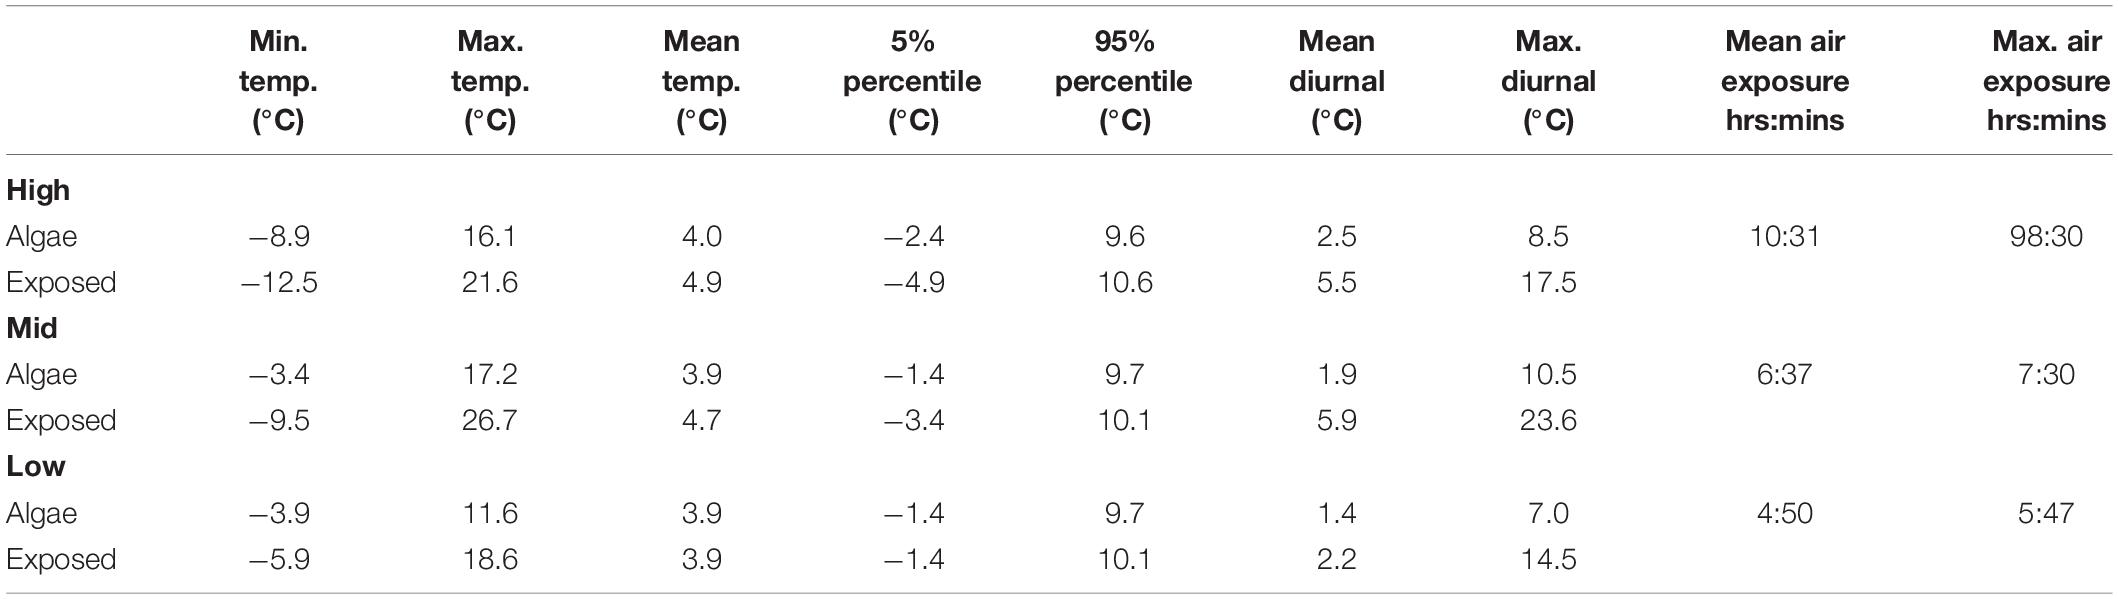
Table 2. Annual temperature statistics from different tidal levels (high, mid, and low) in Kobbefjord (see Figure 1) measured by temperature loggers positioned on bare rock (exposed) or under macroalgae cover (algae) at each level: minimum, maximum, annual mean, 5 and 95% percentiles, and mean and maximum diurnal variation. Mean and maximum air exposure are also given for each tidal level.
Statistical Analyses
All statistical tests were carried out in Statistical Package for the Social Sciences (IBM SPSS). 1-way ANOVAs were preceded by test of prerequisites (normality and homogeneity of variance), and if violated, the non-parametric Kruskal–Wallis test was applied. Both types of main tests were proceeded by Bonferroni-corrected post hoc tests for pairwise comparisons. Two-way ANOVAs/ANCOVAs were likewise preceded by tests of standard prerequisites (via residual plots, Levene’s test for equality of error variance, Box’s test for equality of covariance) and Tukey’s-tests were applied for post hoc contrasts. Species richness residuals (corrected for the effect of site, tidal level, and canopy biomass), planned for rugosity correlations, were extracted directly from ANCOVAs run without rugosity as predictor. Prior to multiple regressions (MRs), zero-order regressions and curve-fitting were carried out to evaluate the linearity of the relationship between independent variables and predictors. Preceding MRs were executed to test for other relevant preconditions beside zero-order linearity: multicollinearity (tolerance, eigenvalue, and condition index), residual-plots, normality, and influential cases (Mahalanobis distance). In addition to the above statistics, standard Pearson’s correlations were conducted.
Results
Physical Conditions
The wave exposure index (Table 1) showed large differences between study sites, with site 3 and 4 being most influenced by waves corresponding to the dominance of strong winds from south. The relative difference in exposure index between sites was confirmed by our short-term measurements of actual in situ wave force (Table 1). However, there was no linear relationship between the two estimates of wave exposure. At site 3 there was a strong influence of ocean swells, which is not included in the wave exposure index but influenced the actual measurements of wave force. The ice scour index ranged from most screws being unaffected after 1 year (site 1 and 3) to all screws being bent 90° or broken off entirely (site 4) (Table 1).
Rugosity was similar across tidal levels within sites (2-way ANOVA, F2,72 = 1.284, p = 0.283) but differed significantly between sites (F3,72 = 9.506, p < 0.0001). Rugosity showed no significant site-tidal level interaction (F3,72 = 1.534, p = 0.179). The rock surface of site 4, exposed to both ice and wave stress, had significantly less rugosity than the other three sites (post hoc tests, p = 0.043), whereas the ice-exposed site 2 had more rugosity than site 1 (p = 0.017). Other pair-wise contrasts showed no significant differences (p ≥ 0.364).
Seasonal temperature variation in the intertidal zone showed a distinct pattern across tidal levels and in presence/absence of macroalgae. Short-term variation in temperature, which mainly reflects the difference between air and water temperature during the tidal cycle, was most pronounced in the mid and high intertidal where the presence of macroalgae reduced extreme temperatures (Figure 2). Consequently, the maximum recorded temperature was up to 11°C higher and the minimum recorded temperature up to 6°C lower at exposed sites devoid of macroalgae compared to sites covered by macroalgae (Table 2).
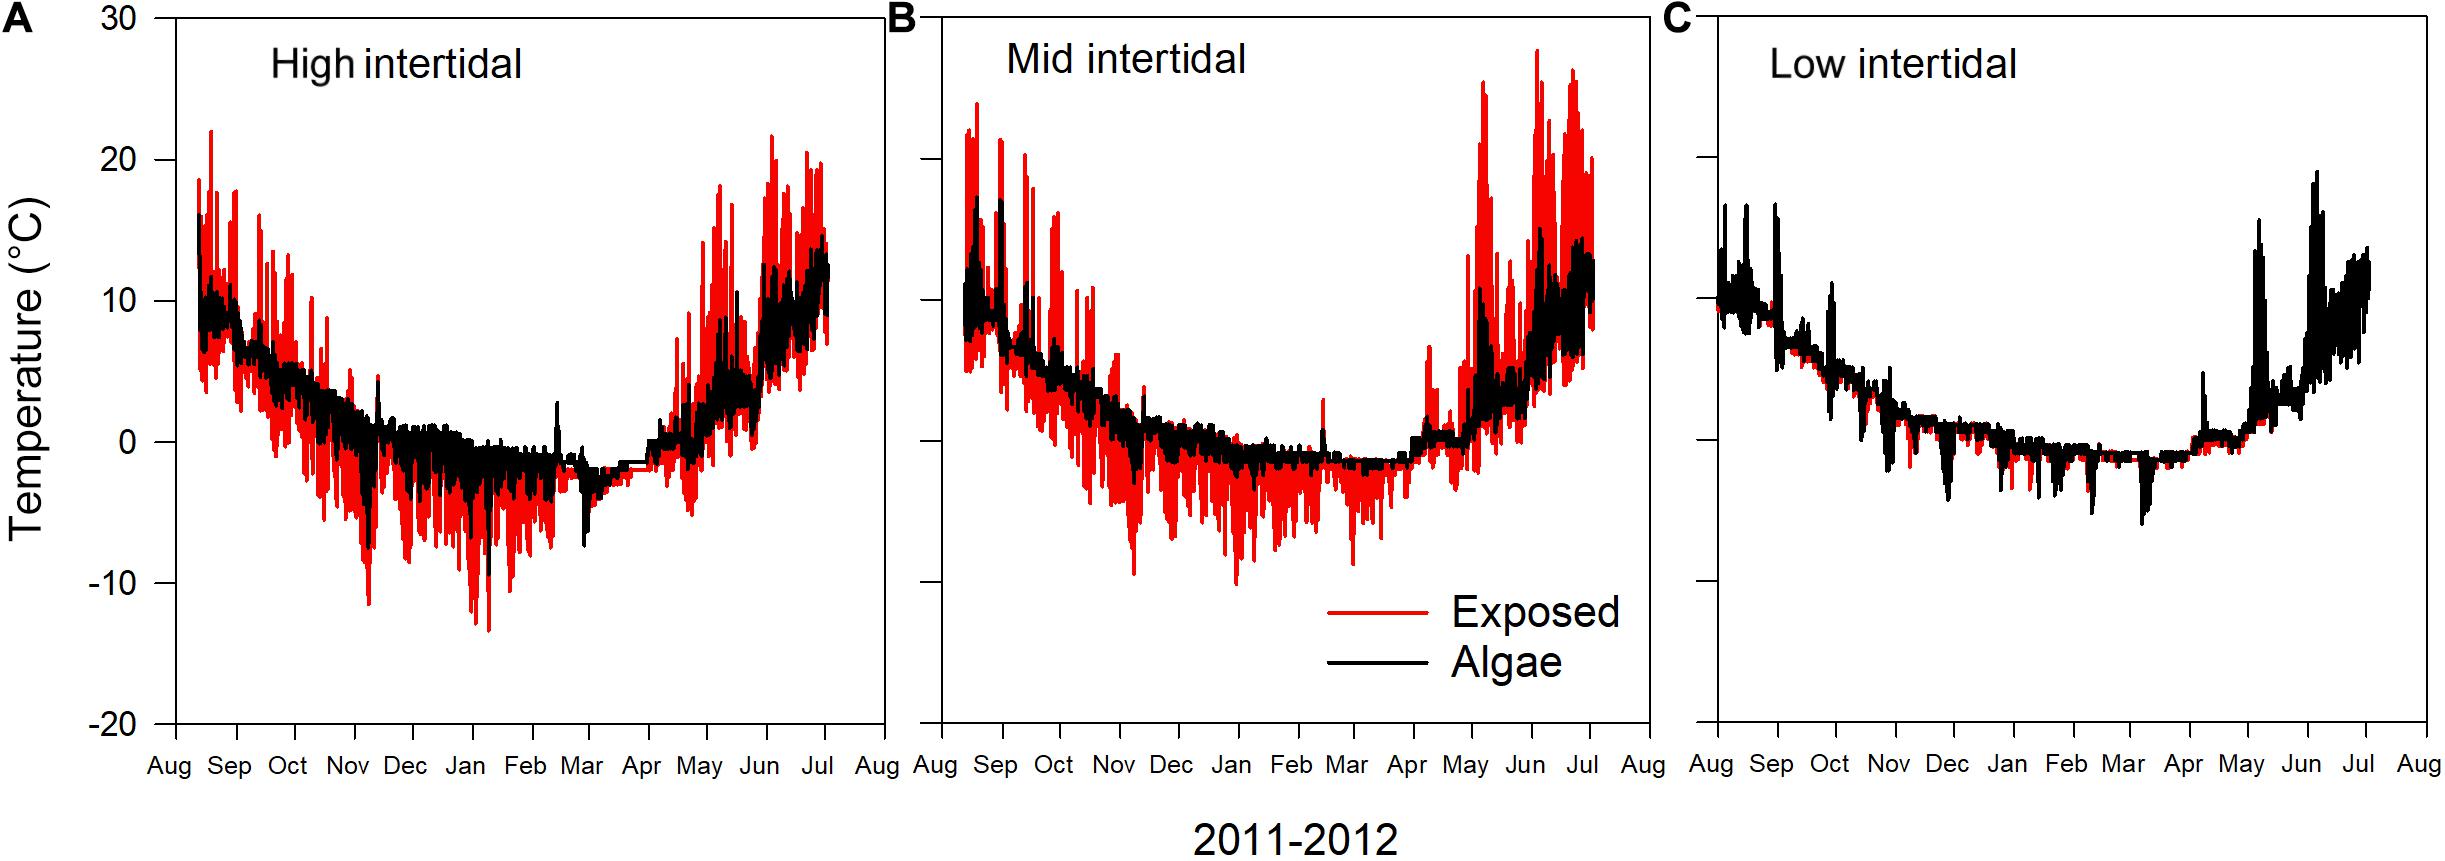
Figure 2. Annual variation in temperature at three intertidal levels (A: High, B: Mid, and C: Low intertidal) in Kobbefjord recorded by paired temperature loggers on bare rock (exposed) and beneath 100% cover of the algae Ascophyllum nodosum at each tidal level.
Total Cover, Biomass, and Species Richness
We found 36 species across sites and tidal levels (Table 3). The intertidal community (macroalgae and invertebrates combined) varied significantly across tidal levels as well as between sites, both regarding total cover, total biomass, and total species richness (Figure 3 and Table 4). Values of all community variables generally decreased with increasing physical stress in terms of air exposure and mechanical disturbance (ice and wave action), reaching minima at the highest tidal level on ice- and/or wave-exposed sites (3 and 4) and maxima at the lower tidal levels of the less disturbed, sheltered sites (1 and 2) (Figure 3). Quantitatively, tidal level and site, and, to a lesser extent, also surface rugosity and canopy biomass, together explained the majority of the variance in measured community parameters (84.4–92.3%, Table 4). Tidal level and site accounted for approx. similar proportions of variance regarding total cover and biomass, whereas tidal level appears considerably more important than site for total species richness (see F-values in Table 4).
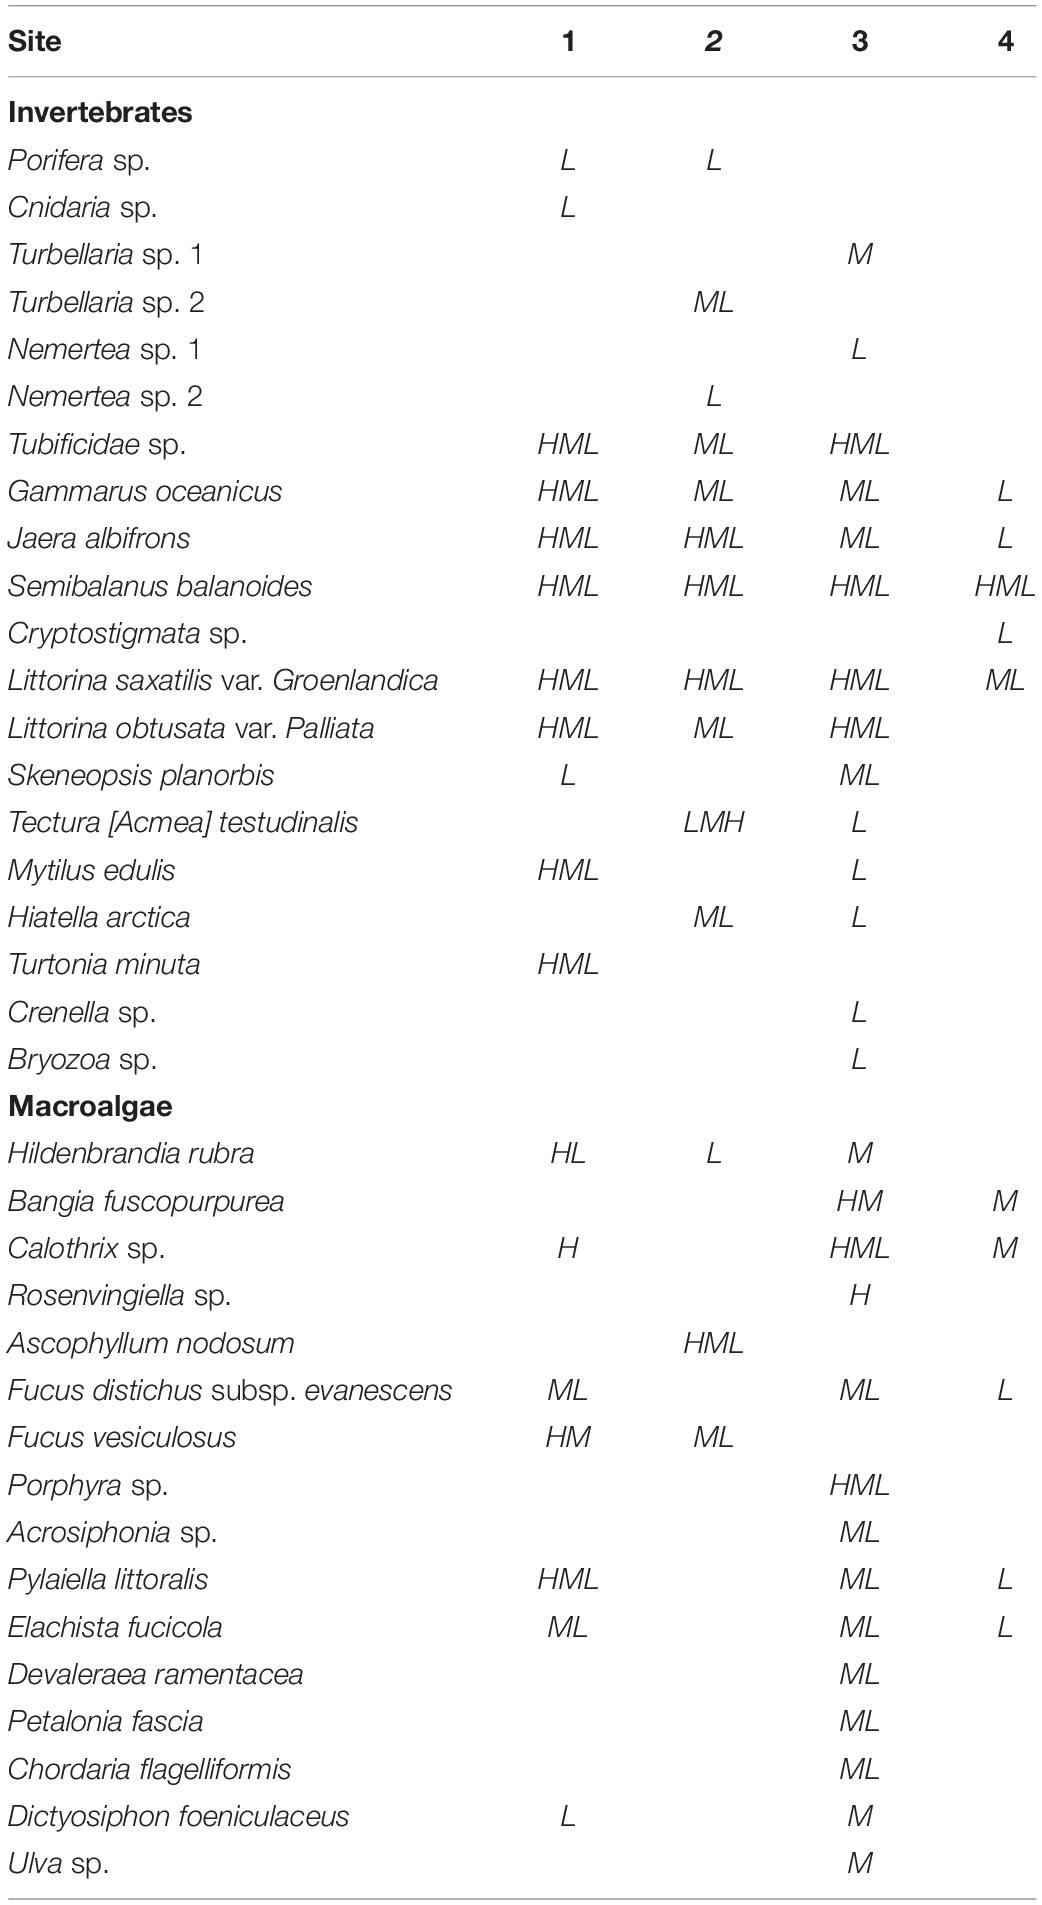
Table 3. Species list and occurrence at low (L), mid (M), or high (H) tidal level at the four sites.
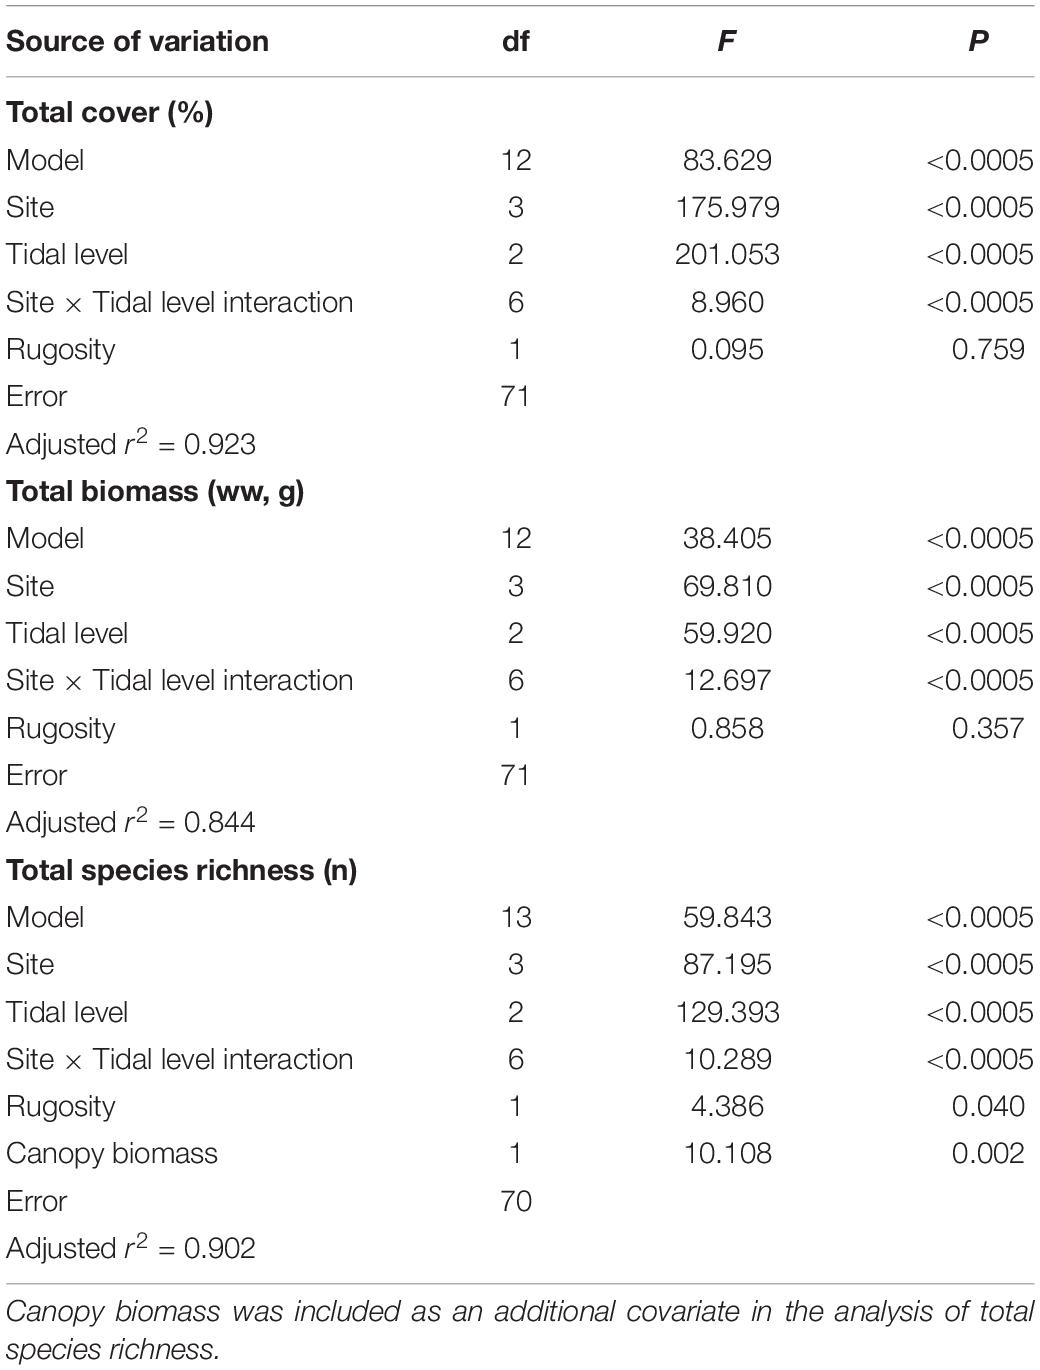
Table 4. Summary statistics from full model 2-way ANCOVAs on total cover, total biomass, and total species richness as dependent variables, including site and tidal level as fixed factors and rugosity index as a covariate.
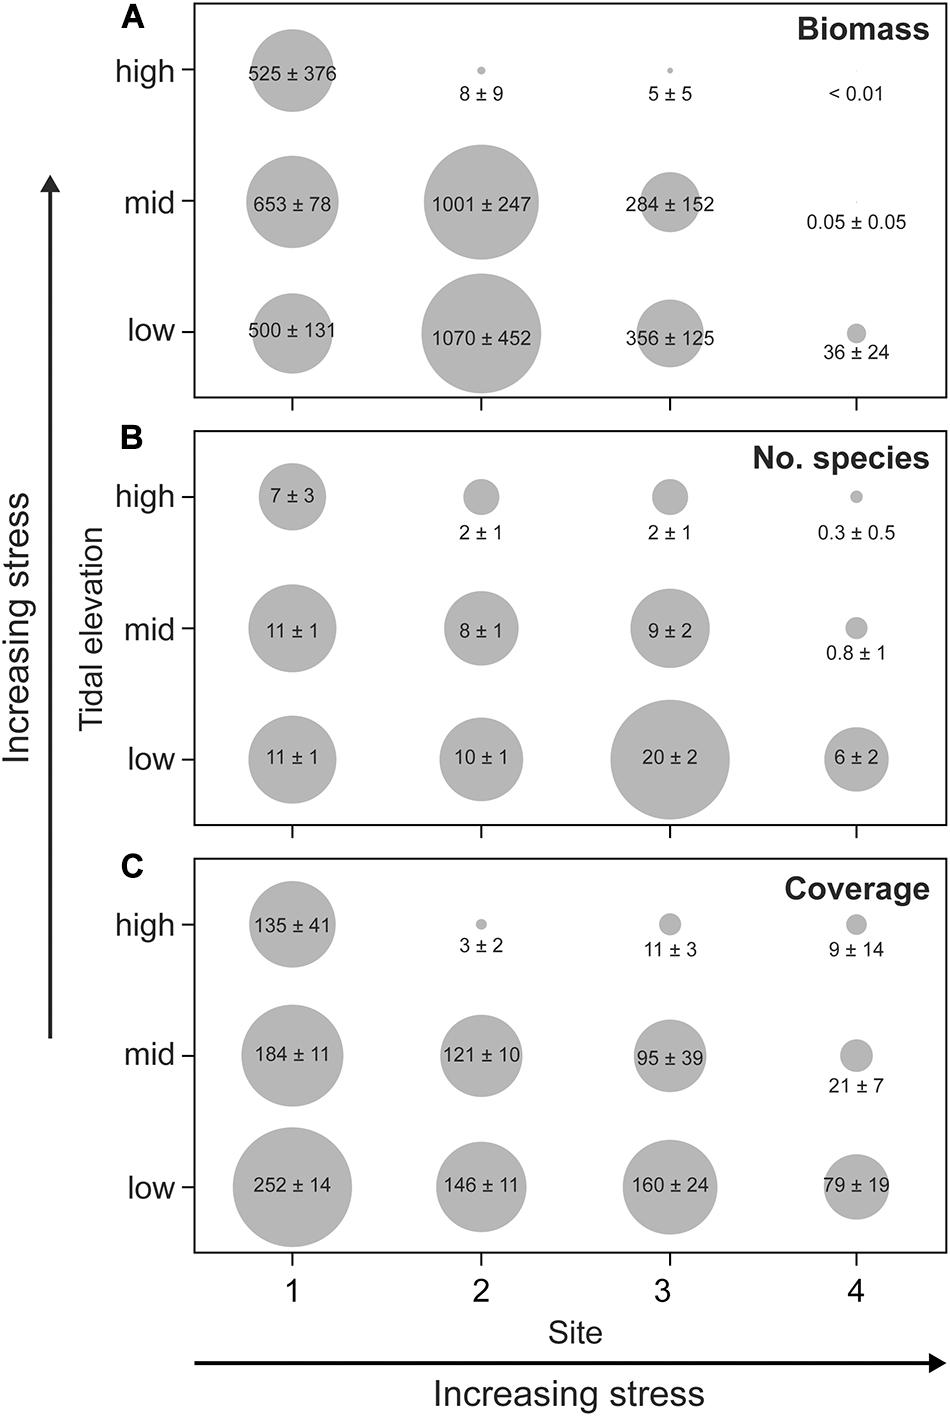
Figure 3. Distribution of (A) total biomass (g wet weight), (B) species richness (number), and (C) total accumulated cover (%) along two stress gradients: tidal level (air exposure time) and mechanical stress (ice scour and wave action between sites). Numbers are mean ± SD (n = 7) and the size of gray dots correlate with mean values.
Total Cover
There was significant site-tidal level interaction of total cover (Table 4). Although cover decreased significantly with increasing tidal level at all sites (1-way ANOVA or Kruskal–Wallis tests, p ≤ 0.001), there were notable differences in patterns across sites. At the least disturbed site 1, total cover decreased only weakly with tidal level, and mean cover at the two highest tidal levels did not differ statistically (Figure 3C; post hoc test, p = 0.282). At the most disturbed site 4, by contrast, cover decreased to a very low value already at the mid tidal level, while at the least disturbed site 1 there was no difference in mean cover between mid- and high tidal level (post hoc test, p = 0.157). The two intermediately disturbed sites (site 2 and 3) attained a tidal pattern in cover intermediate between site 1 and 4, and whereas all tidal levels differed significantly from each other (post hoc tests, p ≤ 0.001) a marked decline in total cover was evident solely at the highest tidal level (Figure 3C). Considering the three tidal levels together, total cover was lowest at the most disturbed site 4 (post hoc tests; all contrasts, p < 0.0001) and greatest at site 1 (all contrasts, p < 0.0001), whereas site 2 and 3 attained similar intermediate values (p = 0.916). As opposed to site and level the rugosity of the rocky surface showed no isolated correlation with total cover (Table 4, but see below).
Total Biomass
The tidal pattern in total biomass resembled that of cover by showing a significant site-tidal level interaction (Table 4). This was evident through a notable decrease in biomass with tidal level at the wave/ice-disturbed sites (sites 2–4, 1-way ANOVA, p < 0.0005), whereas tidal level had no impact on biomass at the least disturbed site 1 (Kruskal–Wallis test, p = 0.280, Figure 3A). There was almost no biomass present at the most disturbed site 4, particularly at the mid and high tidal level that did not differ statistically (post hoc test, p = 0.154; other contrasts: p < 0.0001). Also, the high tidal level at both site 2 and 3 supported very limited biomass compared to lower tidal levels (post hoc tests, p < 0.0001) that for both sites attained similar mean values (post hoc tests, p ≥ 0.623; Figure 3A). The comparatively high biomass at mid and low tidal level at site 2, with several sample quadrates supporting more than 1 kg ww (>16 kg m–2) is mainly due to the presence of particularly dense stands of the brown macroalga A. nodosum that occurred solely at this site (see below). Considering the three tidal levels together, there was a similarly high biomass at site 1 and 2 (post hoc test, p = 0.147) that exceeded the biomass of the remaining two sites (post hoc tests, p ≤ 0.011). Total biomass was smallest at site 4 (post hoc tests, p < 0.0005).
As for total cover, substrate rugosity played no isolated role for total biomass across sites and tidal levels (Table 4). However, when separating total biomass into algal- and invertebrate components, rather strong positive relationships with rugosity emerged at the smallest spatial scale (across sampled quadrates within tidal levels and individual sites) (Figures 4A,C). For both algal and invertebrate biomass, rugosity explained a major proportion of the variance at those tidal levels where sufficient data were available (mid and low), and interestingly, solely at the two ice-disturbed sites (2 and 4). Similar analyses using total cover rather than biomass resulted in the same overall conclusions (data not shown). However, cover produced somewhat fewer and generally less significant relationships.
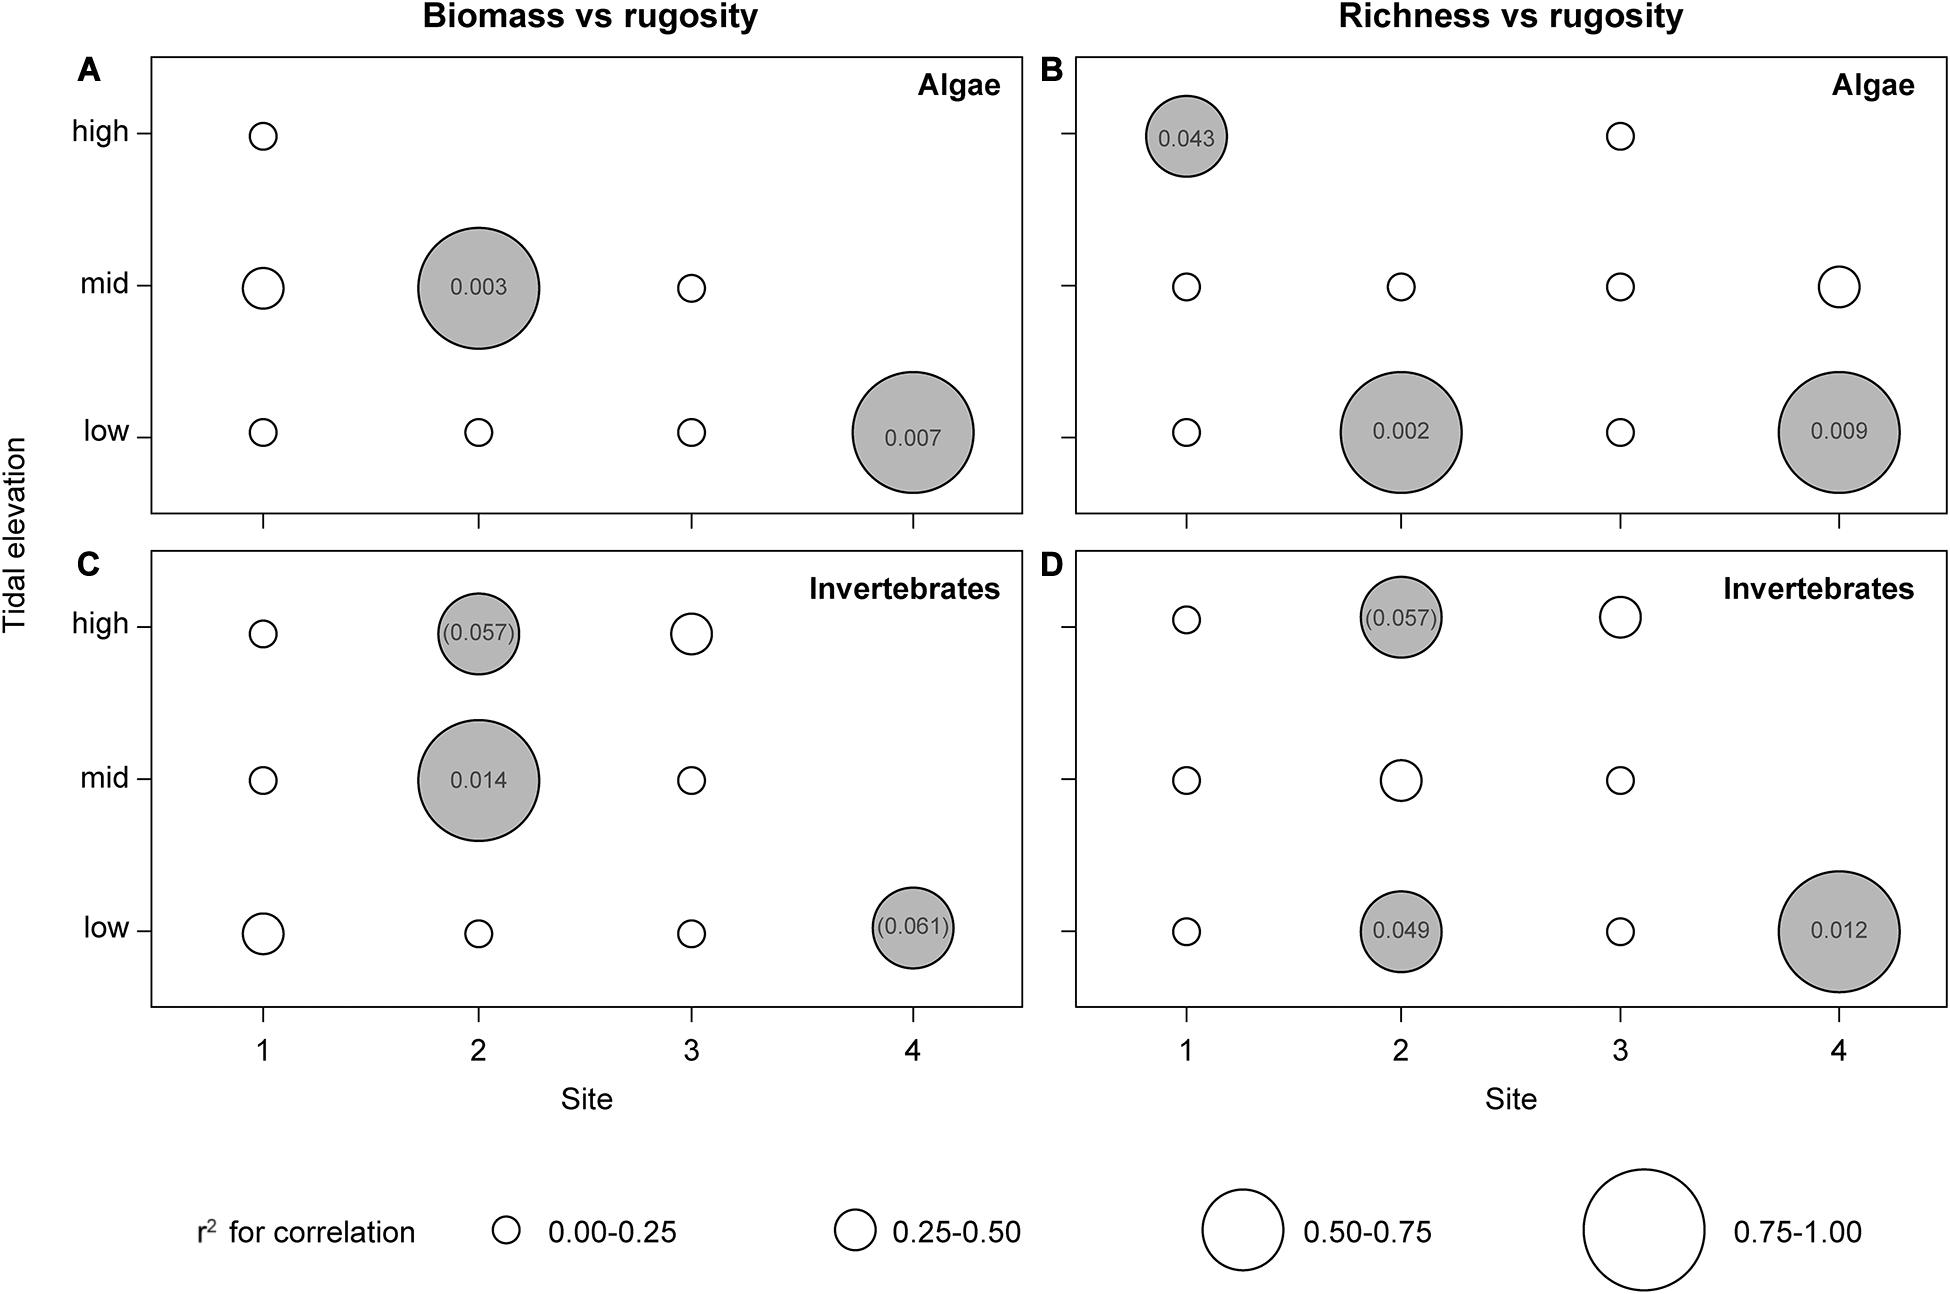
Figure 4. Pearson’s correlations between biomass (A,C) and total species richness (B,D) of macro algae and invertebrates as dependent variables and substrate rugosity index as predictor at different site-tidal level combinations. Dot size indicates r2-value intervals (see inserted key). White dots: insignificant correlations (p ≥ 0.05); gray dots: significant and marginal significant positive correlations with indication of associated p-value (marginal significant relationships in brackets) (n = 6–7).
Total Species Richness
As for total cover and biomass, total species richness showed significant site-tidal level interaction (Table 4), but richness nevertheless decreased toward the high tidal level at all sites (Figure 3B; 1-way ANOVA, p < 0.0001). The site-specific tidal patterns in total species richness mirror that of total cover (Figure 3) with numerically rather similar species richness across tidal levels at site 1 as opposed to particularly low richness at mid and high tidal levels at site 4, whereas the two sites with intermediate disturbance (site 2 and 3) showed greatly reduced richness solely at the highest tidal level (Figure 3B). Statistically, however, all tidal levels differed from each other at all four sites (post hoc tests, p ≤ 0.0011). When all tidal levels were combined, the lowest species richness was found at the most disturbed site 4, followed by the also ice-affected site 2, whereas the highest richness was supported by the sites least affected by ice (1 and 3) (post hoc tests; site 1 vs. 3: p = 0.090, all other contrasts: p < 0.0005).
As opposed to total cover and biomass, total species richness correlated positively with substrate rugosity across the entire data set (i.e., regardless of spatial scale) (Table 4). The relationship between residual richness (i.e., richness corrected for the effect of other predictors, see Table 4) and rugosity was significant but relatively weak as rugosity explained only 8–9% of the variance in species richness (r2 = 0.084, p = 0.008).
Total species richness was, across all sites and tidal levels, also affected positively by canopy biomass (Ascophyllum and Fucus combined), which explained more variance than rugosity (Table 4). Because canopy biomass was, in turn, positively related to rugosity (r2 = 0.072, p = 0.013), particularly so at the two ice-disturbed sites 2 and 4 (r240 = 0.169, p = 0.007), where richness appears facilitated indirectly by the positive effect of rugosity on canopy-forming macroalgae (see next section). Interestingly, however, when site, tidal level and canopy biomass are statistically corrected for, the isolated effect of rugosity (based on residuals from the full ANCOVA model) on total species richness was evident only at ice-disturbed sites (r240 = 0.124, p = 0.022) while rugosity appears uninfluential in the absence of ice scouring (r240 = 0.008, p = 0.571).
As evident also for biomass of both macroalgae and invertebrates, the significant link between species richness and rugosity, especially on ice-disturbed sites, emerged even stronger when focusing on the smallest spatial scale (within tidal level). Here, positive relationships exist between species richness and rugosity for both macroalgae and invertebrates, especially at the low tidal level (Figures 4B,D). Such relationship was also found for algal richness at the highest tidal level of the most sheltered site 1 (Figure 4B). This deviation from the general pattern could result from the possibility that high rugosity not only protects against ice-disturbance but also against desiccation at the uppermost fringes of sheltered intertidal zones.
Distribution of Key-Species
Ascophyllum nodosum
Ascophyllum was only present at site 2 (Figure 5), where this canopy-forming macroalga accounts for more than 80% of all biomass present, and hence, determines total biomass (see Figure 3A): evenly high biomass at mid and low tidal level (post hoc test, p = 0.762) that disappears almost entirely at the highest tidal level (p ≤ 0.002 for both contrasts). At the mid tidal level, Ascophyllum biomass was strongly influenced by rugosity, which explained more than 90% of the variation (r25 = 0.914, p = 0.001). At the low tidal level, this relationship was absent (r25 = 0.057, p = 0.605). Insufficient data were available for analysis at the highest tidal level where macroalgae were very sparsely represented.
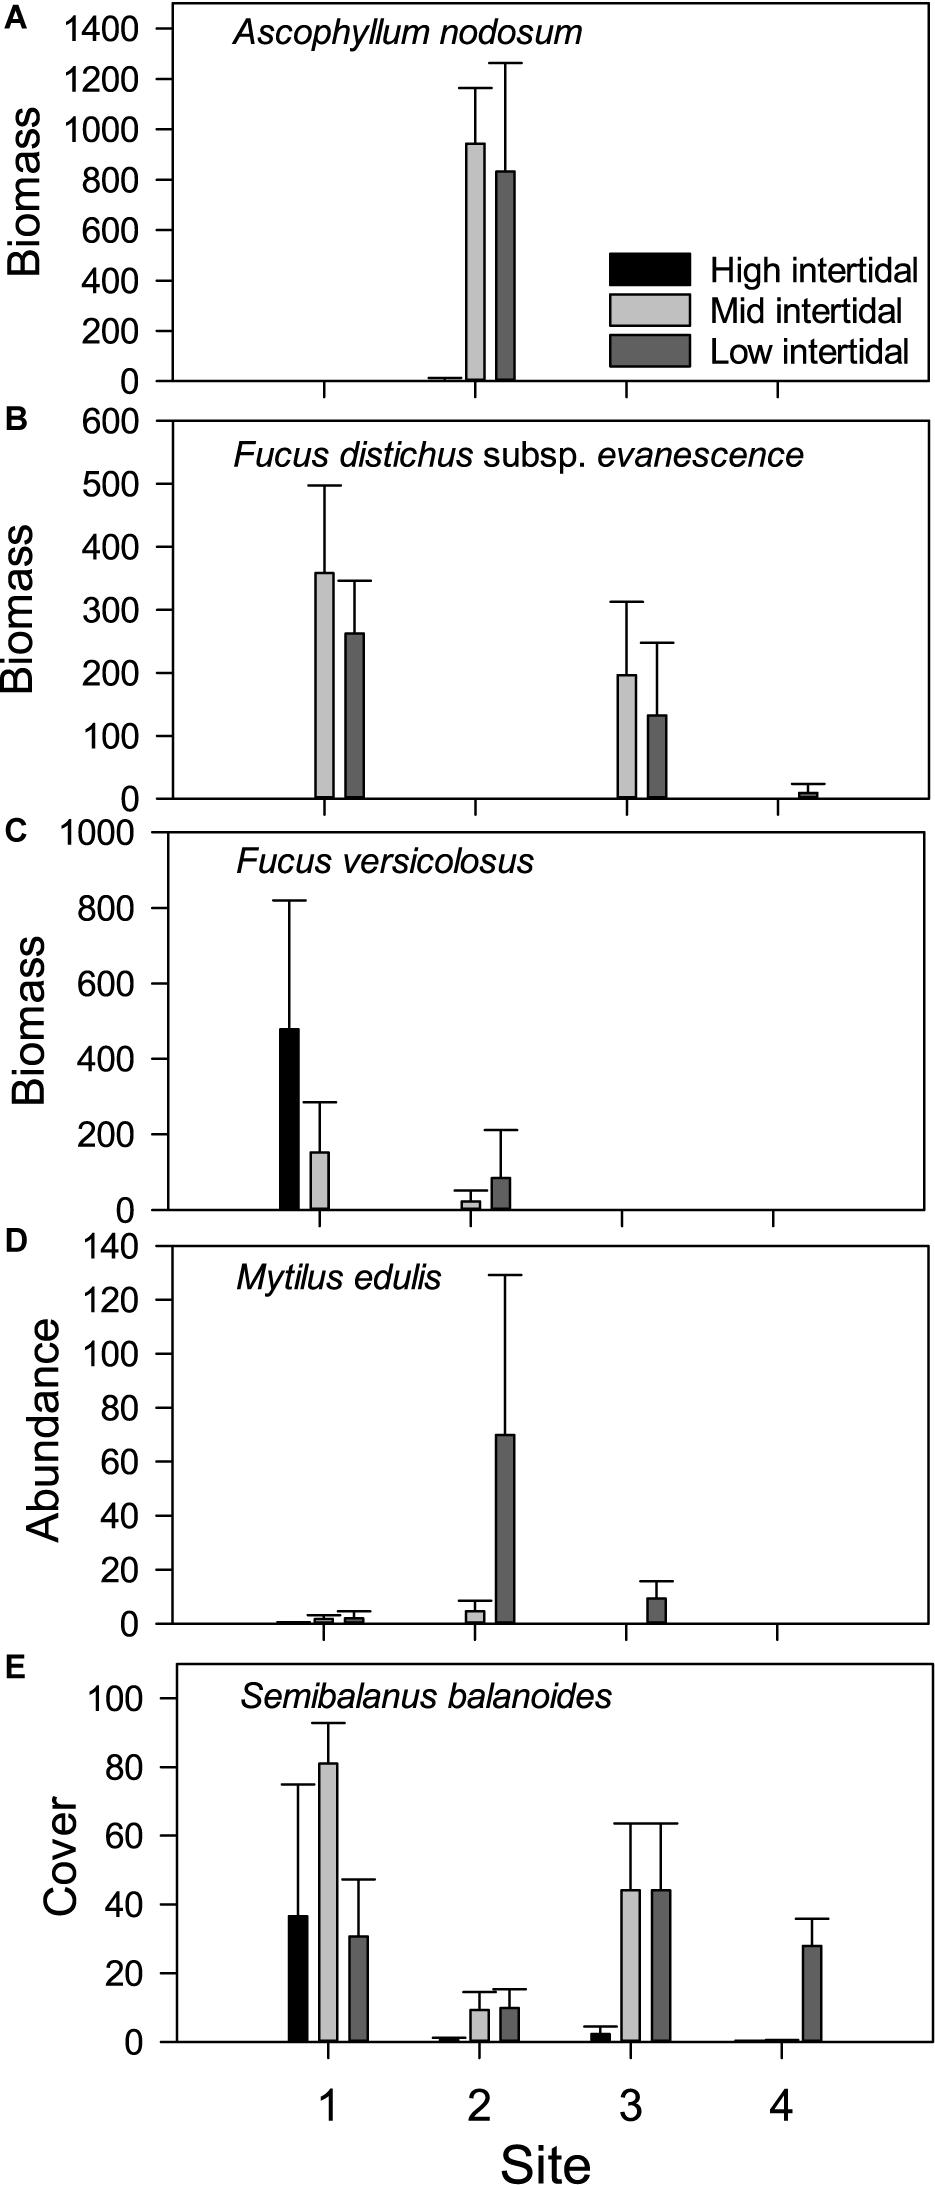
Figure 5. Occurrence of intertidal key species across sites and tidal level (high, mid, and low). Biomass (g wet weight) of the macroalgal species (A) Ascophyllum nodosum, (B) Fucus distichus subsp. Evanescens, and (C) Fucus vesiculosus, abundance (no. ind.) of (D) the mussel Mytilus edulis and (E) cover (%) of the barnacle Semibalanus balanoides. Values are mean ± SD per sampling quadrate (0.0625 m2). N = 7 for all values.
Fucus distichus subsp. evanescens
This brown macroalga was particularly abundant at the two ice sheltered sites 1 and 3, where it accounted for the majority of the total biomass at mid and low tidal level (see Figures 3, 5). The species was restricted to the two lowest tidal levels at all sites, resulting in a significant difference between tidal levels. A full model ANCOVA, with tidal level and site (1 and 3 only) as fixed factors and the rugosity index as a covariate, showed no site-tidal level interaction (F2,35 = 1.994, p = 0.151). A subsequent reduced model demonstrated a significant site-effect (F1,37 = 8.181, p = 0.007), with most biomass at the wave and ice sheltered site 1, and a significant tidal level-effect (F2,37 = 25.167, p < 0.0005), with peak biomass at the mid tidal level (post hoc tests: p ≤ 0.047 for all contrasts). Substrate rugosity, in contrast, had no significant impact on the occurrence of Fucus distichus subsp. evanescens on site 1 and 3 (F1,37 = 0.837, p = 0.366). A limited biomass was also found at the lowest tidal level of the most disturbed site 4 (see Figure 5B), and here, biomass was significantly related to rugosity (r25 = 0.729, p = 0.014, Figure 6B).
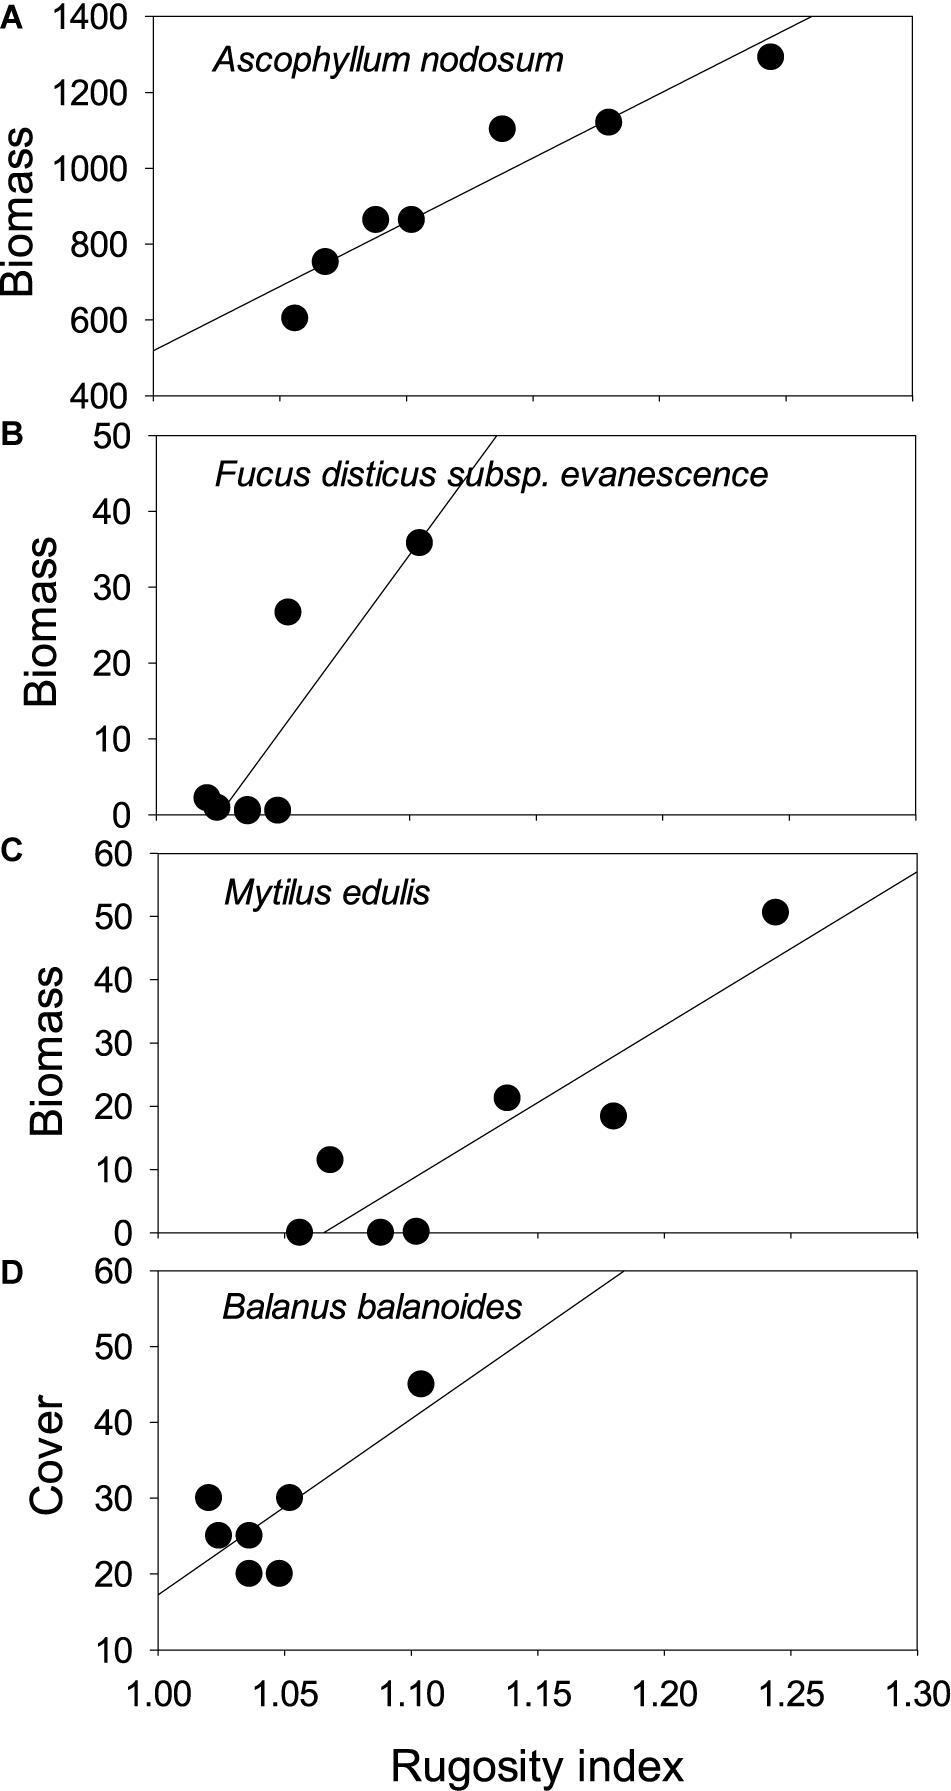
Figure 6. Biomass or cover versus rugosity relationships for individual species: (A) Ascophyllum nodosum (site 3, mid tidal level: biomass), (B) Fucus distichus subsp. evanescens (site 2, low tidal level: biomass), (C) Mytilus edulis (site 3, mid tidal level: abundance), (D) Semibalanus balanoides (site 4, low tidal level: cover).
Fucus vesiculosus
Fucus vesiculosus was also found mainly on the sheltered site 1 and tended to replace Fucus distichus subsp. evanescens at the high tidal level (Figure 5C). However, stands of F. vesiculosus also occurred at the ice-disturbed site 2, where it was entirely absent at the high tidal level. In contrast, F. vesiculosus was absent at the lowest tidal level at site 1. Hence, a significant and opposite distributional pattern emerged according to tidal level at the two sites: biomass decreased toward the lower tidal level at site 1, whereas it increased toward the lower tidal level at site 2 (Kruskal–Wallis tests, W ≥ 11.622, p ≤ 0.003). There was no significant relationship between F. vesiculosus biomass and rugosity at any of the four site-tidal level combinations supporting the species (r25 ≤ 0.248, p ≥ 0.255).
Mytilus edulis
Blue mussels were absent at the most disturbed site 4 and reached greatest biomass at site 2 in the inner Kobbefjord among the abundant Ascophyllum stands (Figure 5). Aside from the most sheltered site 1 where Mytilus occurred at the highest tidal level, blue mussels were restricted to the two lower levels, resulting in a pronounced intertidal pattern of increasing biomass with decreasing shore height (Kruskal–Wallis tests, W ≥ 12.648, p ≤ 0.002). Where sufficient data were available, and in accordance with the overall pattern for total biomass (see above), Mytilus biomass was unrelated to substrate rugosity at the sheltered sites 1 and 3, whereas a strong positive relationship existed at mid tidal zone of the ice-influenced site 2 (r25 = 0.808, p = 0.006, Figure 6C). Mytilus here is positively related to the Ascophyllum dominated canopy biomass (r25 = 0.674, p = 0.024; see next section), which, in turn is positively related to rugosity (Figure 6A).
Semibalanus balanoides
Barnacles occurred at all sites and at all tidal levels (Figure 5E). However, cover differed significantly among sites (all tidal levels combined, Kruskal–Wallis test, W = 29.922, p < 0.0005): cover was similar at sites 1 and 3 as well as at sites 2 and 4 (post hoc tests, p ≥ 0.141) but cover was considerably greater at the ice sheltered sites 1 and 3 (post hoc tests, p ≤ 0.010). At all four sites, cover showed significant tidal patterns (Kruskal–Wallis tests, W ≥ 7.538, p ≤ 0.023) that differed according to the degree of disturbance: barnacles tended to be distributed at lower tidal level with increasing disturbance (Figure 5E).
As seen also for the biomass of M. edulis, barnacle cover was unrelated to substrate rugosity at the sheltered sites 1 and 3, whereas positive relationships were evident at the ice-disturbed sites 2 and 4. At the latter most disturbed site 4, insufficient barnacles were present at the high two tidal levels for rigorous analyses. At the lowest tidal level, however, there was a positive relationship between cover and rugosity (r25 = 0.580, p = 0.047, Figure 6D). Similar relationships were found at the ice-disturbed site 2, where cover correlated positively with rugosity, particularly at the high tidal level (r25 = 0.615, p = 0.037) but also marginally so at mid-tidal level (r25 = 0.542, p = 0.059). Whereas rugosity facilitated barnacle distribution solely at the ice-disturbed sites, canopy biomass appeared to play a comparable role at the less sheltered sites 1 and 3: both on higher and lower tidal level at site 1, significant positive associations existed between barnacle cover and canopy biomass (r25 ≥ 0.602, p ≤ 0.040, Figure 7), and a similar tendency was present on mid tidal level at site 2 (r25 = 0.509, p = 0.072).
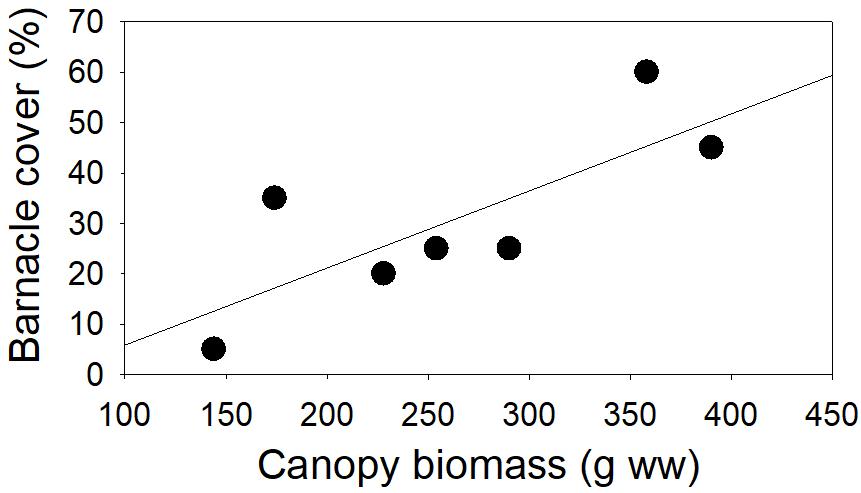
Figure 7. Relationship between cover of Semibalanus balanoides and canopy biomass (Ascophyllum nodosum and Fucus spp. combined) at low tidal level, site 1 (r25 = 0.602, p = 0.040).
Interspecific Relationships of Key-Species
Existence of facilitating or inhibitory interactions among the quantitatively most important intertidal species was initially investigated across sites for each tidal level separately (n = 28) by simple Pearson’s correlation. Separating the analyses according to tidal level removed variance associated with inherent species-specific zonation patterns in response to, e.g., air exposure period. In most cases, however, sufficient reliable data were available solely for the two lower tidal level.
Mytilus edulis, the two littorinoids Littorina saxatilis and Littorina obtusata, the abundant isopod Jaera albifrons and the amphipod Gammarus oceanicus were all strongly positively related to the biomass of the canopy-forming macrophytes A. nodosum and Fucus spp. (Figure 8 and Table 5). Most of these invertebrates were also positively related to each other. These relationships were judged to exist mainly, if not solely, as a consequence of their common and usually stronger link to canopy biomass, and are hence, not further addressed.
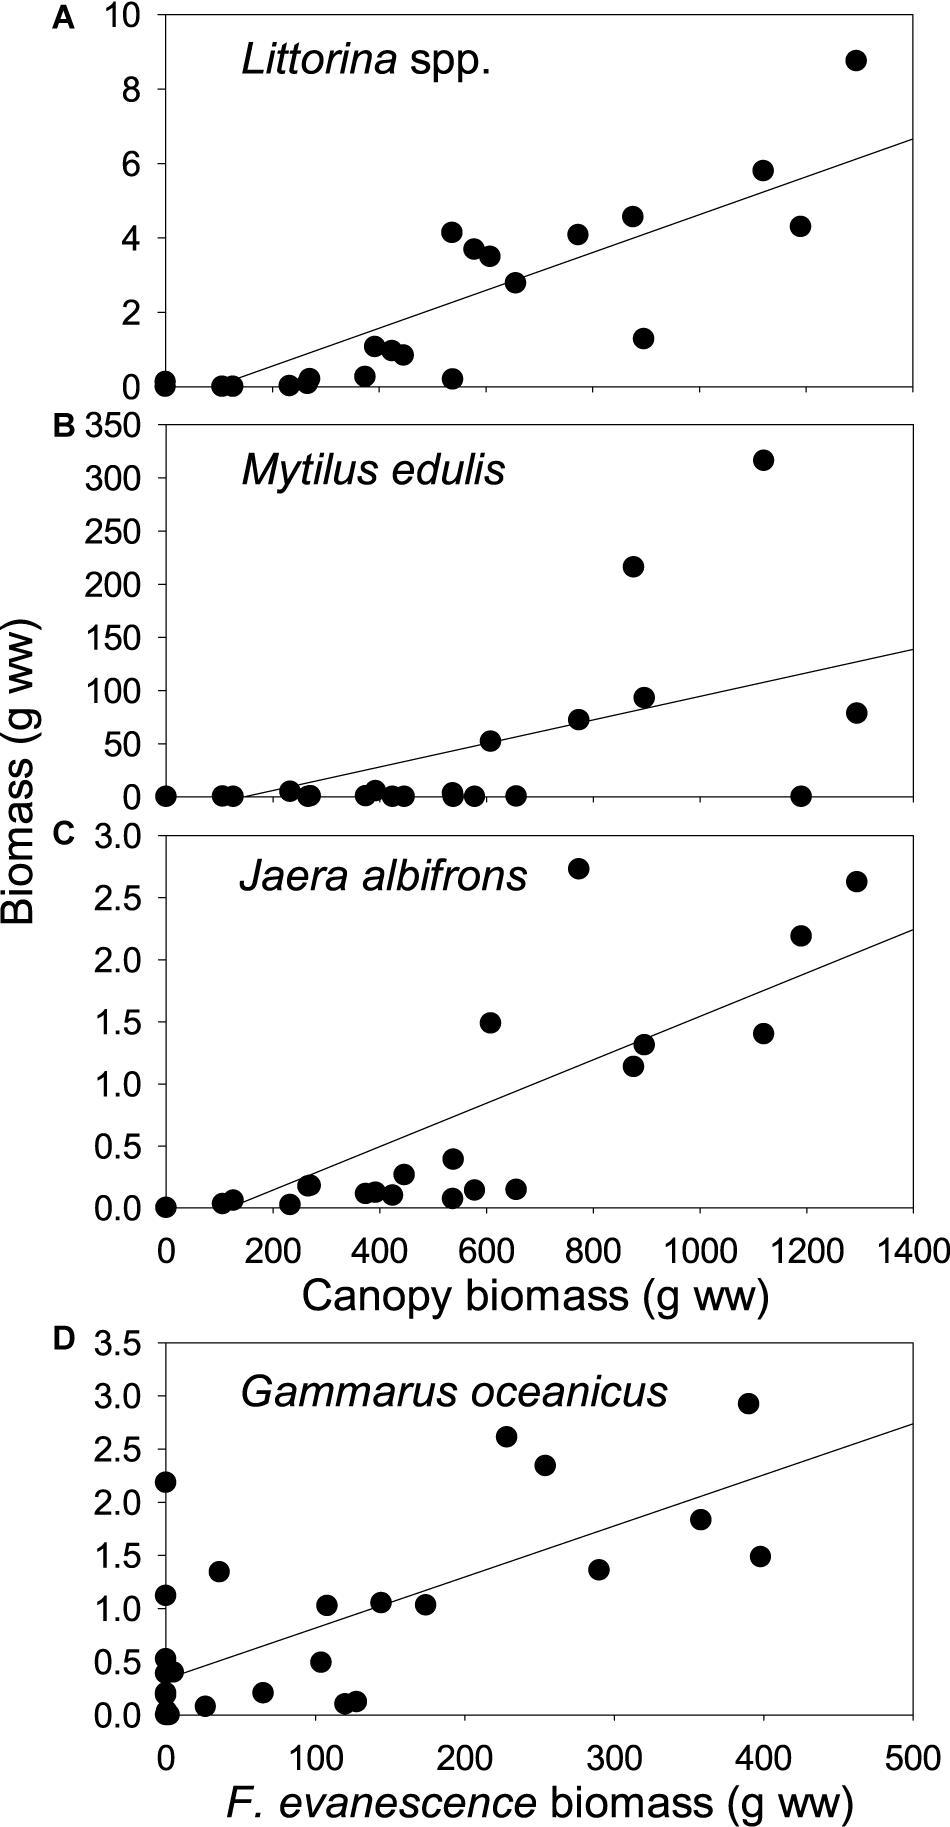
Figure 8. Relationships across sites between invertebrates (biomass, g ww) and canopy-forming macrophytes (biomass, g ww) at selected tidal levels. (A) Littorina saxatilis and L. obtusata combined (mid tidal level; r2 = 0.516, p < 0.0005); (B) Mytilus edulis (low tidal level; r2 = 0.676, p < 0.0005); (C) Jaera albifrons (mid tidal level; r2 = 0.682, p < 0.0005); (D) Gammarus oceanicus (low tidal level; r2 = 0.502, p < 0.0005). N = 28 for all relationships. Canopy species includes Ascophyllum nodosum and Fucus spp. Note that the Gammarus relationship only includes Fucus distichus subsp. evanescens.
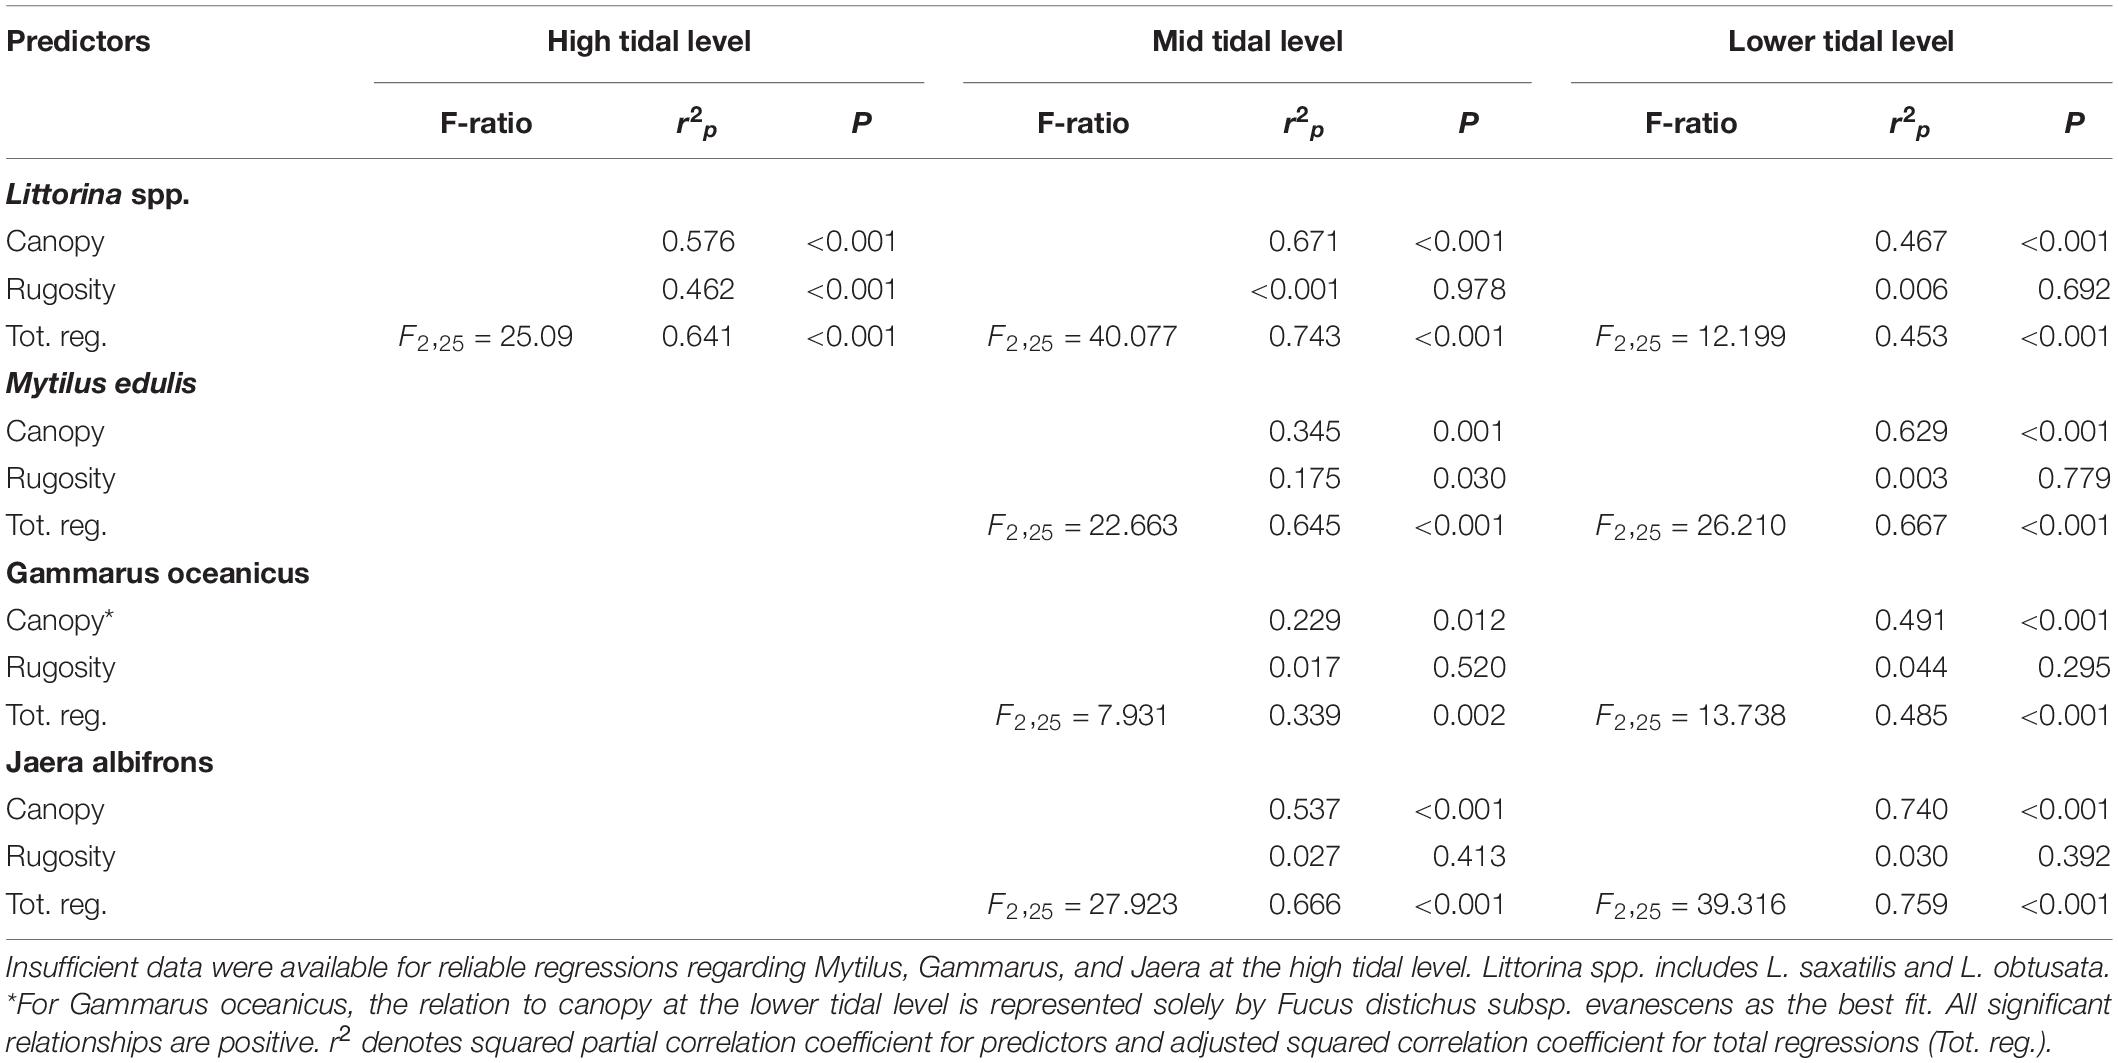
Table 5. Summary statistics of across-site multiple regression analyses of total biomass (g ww) of invertebrate species as dependent variables that related significantly to canopy biomass (g ww; mainly Ascophyllum nodosum and Fucus spp.) and to the rugosity index (see section “Materials and Methods”) as predictors.
The canopy-forming algae appear to a certain extent facilitated by substrate rugosity (see above). Hence, the pattern of a seemingly causative relationship between several key-invertebrates and the macrophyte-canopy facilitating their existence (food and shelter) may, in principle, be driven in part by the animals’ possible dependence of substrate rugosity as rock cervices can be used as shelter against desiccation during low tide and during events of mechanical disturbance. In order to unravel this, multiple regressions were carried out using invertebrate biomass as dependent variable and canopy biomass and rugosity index as predictors. For all species and tidal levels supporting adequate data for analysis, canopy biomass emerged as a significant predictor of invertebrate occurrence also when rugosity was corrected for Table 5. Interestingly, rugosity turned out as an isolated predictor of Littorina biomass at the highest tidal level, but only there, and similarly, mussel biomass was significantly affected by rugosity isolated at the tidal level with sufficient data (mid tidal level). Hence, both Littorina and Mytilus appear to make use of rock crevices to mitigate environmental stress particularly at the uppermost part of their intertidal distribution where algal biomass is limited.
Similar statistical conclusions were reached using canopy cover rather than biomass as predictor (data not shown). However, across all analyzed species and tidal levels, canopy biomass explained considerably more variance than canopy cover; on average 25.3% more (range: 4.7–52.2%).
Discussion
Quantifying how different physical drivers interact and shape community structure is essential for being able to document and understand ecological patterns and potential future changes. To achieve this, a central challenge is to understand how large-scale drivers are modified locally by physical and biological factors to produce the mosaic of environmental conditions that impact individual species and drive community structure at a local scale. For the Greenland intertidal, this includes quantifying the combined impact of general atmospheric warming, reduction of sea ice cover, and increased discharge of melt water and icebergs from the Greenland Ice Sheet. Here we show that in the intertidal zone of a SW Greenland fjord, wave exposure, ice scour, and tidal level are essential parameters influencing intertidal community structure. However, the combined influence of the three factors and their interaction was highly variable throughout the fjord, and results in an intertidal community ranging from being nearly absent to fully covering the substrate. Biomass, cover and species richness all displayed the same overall response to environmental stress; as the accumulated effect of intertidal height, wave exposure and ice exposure increase, the community becomes increasingly depleted. At the most wave and ice sheltered site 1, we found a well developed community at all vertical levels, demonstrating that the intertidal zone in the sub-arctic can support an abundant intertidal community with biomasses exceeding 16 kg wet weight m–2. A likely explanation for the high biomass, cover and species richness at high tidal level at site 1, is that ocean swells are present even in calm weather at this otherwise sheltered site. Swells decrease dessication and temperature stress without inducing severe drag on organisms, underlining the difficulty in accurately estimating physical drivers at the appropriate scale. Fetch calculations and tidal models are efficient methods for estimates of fjord-scale distribution of stress but cannot resolve the impact of swells. At the two intermediately stressed sites (2 and 3), the biomass was significantly reduced at the high tidal level, whereas the combination of wave exposure and ice scour is able to remove all organisms except barnacles at all tidal levels on the most exposed site 4 (Figure 3). The effect of scouring ice has been well documented from other sub-arctic and Arctic areas (Bergeron and Bourget, 1986), but presence of sea ice is not always of negative influence. At our site 2 (Kobbefjord), the presence of stable winter sea ice (fast ice) did not prevent the existence of relatively high biomass and species richness at mid and lower tidal levels. Clearly, the fast ice did not lead to much ice scour, and in fact, fast ice and the resulting intertidal ice foot may protect intertidal organisms from detrimental sub-zero air temperatures at low tide (Scrosati and Eckersley, 2007; Ørberg et al., 2018). Floating ice, on the other hand, is pushed onto the shore by wave and wind forces, which results in vastly amplified ice scour on wave exposed coastlines, as evidenced in Atlantic Canada (Scrosati and Heaven, 2007). As seen also in rocky intertidal habitats at lower latitudes (Raffaelli and Hawkins, 1996), we find air exposure time and tidal level combined with wave exposure to be key stressors at higher latitudes, but in glacial fjords, ice scour adds an additional stressor that increases the variation in intertidal community structure on a local scale.
Compared to lower latitudes, where biological interactions such as grazing and predation are key factors shaping intertidal communities (Coleman et al., 2006; Underwood et al., 2008), the intertidal zone in high-latitude fjord systems seems to be primarily controlled by physical stress (Barnes, 2002; Blicher et al., 2013). Another level of complexity is added, through substrate rugosity that provides small scale refuge from the stress induced by ice scour, wave exposure, and air temperature. When tested across all sites and tidal level, rugosity showed a small but significant positive effect on species richness, but not on biomass or cover. However, when the analysis was carried out for individual sites, a significant positive effect was found on also biomass and cover, especially at sites impacted by ice and/or waves (see Figure 4). The effect of rugosity was also species-specific. Particularly the macroalgae F. distichus subsp. evanescens and A. nodosum as well as M. edulis were affected by rugosity, explaining a surprisingly large fraction of the variation (≥73%) at certain sites and tidal levels. At the site with highest stress from waves and ice (site 4), the positive effect of rugosity on the biomass of F. distichus subsp. evanescens even extended to the lowest tidal level.
Macroalgae also alleviated physical stress from waves, desiccation and extreme sub-zero air temperatures. We provide an example of the seasonal temperature range experienced by intertidal organisms in a sub-arctic fjord and quantify how macroalgae modify understory air temperatures. Compared to seasonal temperature data from southern Greenland (Høgslund et al., 2014), we observe temperatures that are quite similar, although summer extremes are slightly higher (above 30°C) in southern Greenland. In winter, the fronds of Fucus and Ascophyllum shelter understory organisms from exposure to lethal low temperatures, hereby increasing species richness. The buffering effect on summer extreme has been documented in a large scale study in Canada, where a positive relationship between macroalgal biomass and species richness and diversity was found at high and mid tidal levels, whereas no effect was found low in the intertidal zone (Watt and Scrosati, 2013). We identified a positive relationship between macroalgal biomass and species richness across the full data set (Table 4), but as mentioned above, we further documented how the complex interactions between waves, ice, tidal level and rugosity combined to influence distribution of canopy forming macroalgae.
The dominant intertidal species show high similarity with observations from Atlantic Canada (Watt and Scrosati, 2013) and Iceland (Ingólfsson, 1996). Total species richness is also similar with about 10–12 species in the lower intertidal and 4–6 in the upper. The absence of patelid limpets in Greenland (this study, Høgslund et al., 2014) but abundance of Littorina spp. suggest that, in terms of grazer identity, the community is more similar to the West Atlantic than East Atlantic shores (Jenkins et al., 2008), and there is also evidence of connectivity to North-American populations for Mytilus in NW Greenland (Mathiesen et al., 2017). Previous studies of intertidal diversity along a latitudinal gradient, with data from Svalbard representing an Arctic locality, found a significant decrease in species richness in the arctic intertidal compared to lower latitudes (Kotta et al., 2017). From the extensive sampling effort in Svalbard (Weslawski et al., 2010) it appears that the abundant species in our data, such as M. edulis, Littorina spp., the small isopod Jaera albifrons and A. nodosum, are all absent in the intertidal zone of Svalbard, which on the other hand appear to have a higher abundance of polychaetes and larger oligochaetes (Weslawski et al., 1993). And while Fucus distichus subsp. evanescens occurs in Svalbard (Weslawski et al., 2010), canopy forming macroalgae in general do not reach the same high biomasses as observed at favorable sites in Greenland.
In conclusion, multiple physical factors (ice scour, waves, and tidal height) interact and are combined with the stress alleviating effect from macroalgae and rugosity to produce large spatial variation in intertidal community structure. In contrast to the intertidal community at lower latitudes, grazing and predation appear insignificant for community structure. We found an overall positive relationship between species richness and total biomass, which shows the importance of canopy forming macroalgae in providing habitat and stress relief for other species. At sites with ice scour and/or wave action, surface rugosity provided small scale refuge for several species including canopy forming algae. Combined, our findings show that local scale manifestation of large scale climatic drivers such as air temperature or presence of sea ice cover depends on complex interactions with biological or physical processes working at small scales.
Data Availability Statement
The original contributions presented in the study are included in the article, further inquiries can be directed to the corresponding author.
Author Contributions
MS conceived the project, secured the funding, prepared the figures, and wrote the manuscript draft, which was improved with input from all other authors. KM, DK-J, BO, and MB organized and conducted the data collection. KM and MS did the data analysis. All authors contributed to the article and approved the submitted version.
Funding
This project was funded by Danish Environmental Protection Agency’s Program for Arctic Research, DANCEA (“De-icing of Arctic Coasts”, J.nr.MST-113-00157 and “Grønlands marine skove – udbredelse og biodiversitet”, J.nr. 2019–8703). MS was funded by the EU Horizon 2020 project INTAROS. DK-J received funding from the Independent Research Fund Denmark (8021-00222B, “CARMA”). This work was also a contribution to the Greenland Ecosystem Monitoring Program, which supported logistics via MarinBasis Nuuk. JT received funding from the Independent Research Fund Denmark (DFF-International Postdoc; case no. 7027-00060B, “The future of Arctic biodiversity in a climate change era”) and by a Marie Skłodowska-Curie Individual Fellowship (IF; contract number 797387) during the writing of this manuscript.
Conflict of Interest
The authors declare that the research was conducted in the absence of any commercial or financial relationships that could be construed as a potential conflict of interest.
Footnotes
References
Barnes, D. K. A. (2002). Polarization of competition increases with latitude. Proc. R. Soc. Lond. Ser. B Biol. Sci. 269, 2061–2069. doi: 10.1098/rspb.2002.2105
Bell, E. C., and Denny, M. W. (1994). Quantifying “wave exposure”: a simple device for recording maximum velocity and results of its use at several field sites. J. Exp. Mar. Bio. Ecol. 181, 9–29.
Bergeron, P., and Bourget, E. (1986). Shore topography and spatial partitioning of crevice refuges by sessile epibenthos in an ice disturbed environment. Mar. Ecol. Prog. Ser. 28, 129–145.
Bertness, M. D., and Callaway, R. (1994). Positive interactions in communities. Trends Ecol. Evol. 9, 191–193. doi: 10.1016/0169-5347(94)90088-90084
Bertness, M. D., and Leonard, G. H. (1997). The role of positive interactions in communities: lessons from intertidal habitats. Ecology 78, 1976–1989.
Bertness, M. D., Leonard, G. H., Levine, J. M., Schmidt, P. R., and Ingraham, A. O. (1999). Testing the relative contribution of positive and negative interactions in rocky intertidal communities. Ecology 80, 2711–2726.
Blicher, M. E., Sejr, M. K., and Hogslund, S. (2013). Population structure of Mytilus edulis in the intertidal zone in a sub-Arctic fjord. SW Greenland. Mar. Ecol. Prog. Ser. 487, 89–100.
Carroll, M. L., and Highsmith, R. C. (1996). Role of catastrophic disturbance in mediating Nucella-Mytilus interactions in the Alaskan rocky intertidal. Mar. Ecol. Prog. Ser. 138, 125–133. doi: 10.3354/meps138125
Coleman, R., Underwood, A., Benedetti-Cecchi, L., Åberg, P., Arenas, F., Arrontes, J., et al. (2006). A continental scale evaluation of the role of limpet grazing on rocky shores. Oecologia 147, 556–564.
Guichard, F., and Bourget, E. (1998). Topographic heterogeneity, hydrodynamics, and benthic community structure:a scale-dependent cascade. Mar. Ecol. Prog. Ser. 171, 59–70. doi: 10.3354/meps171059
Heaven, C. S., and Scrosati, R. A. (2008). Benthic community composition across gradients of intertidal elevation, wave exposure, and ice scour in Atlantic Canada. Mar. Ecol. Prog. Ser. 369, 13–23. doi: 10.3354/meps07655
Helmuth, B., Broitman, B. R., Yamane, L., Gilman, S. E., Mach, K., Mislan, K. A. S., et al. (2010). Organismal climatology: analyzing environmental variability at scales relevant to physiological stress. J. Exp. Biol. 213, 995–1003. doi: 10.1242/jeb.038463
Høgslund, S., Sejr, M. K., Wiktor, J., Blicher, M. E., and Wegeberg, S. (2014). Intertidal community composition along rocky shores in South-west Greenland: a quantitative approach. Polar Biol. 37, 1549–1561.
Ingólfsson, A. (1996). The distribution of intertidal macrofauna on the coasts of iceland in relation to temperature. Sarsia 81, 29–44. doi: 10.1080/00364827.1996.10413609
Jenkins, S. R., Moore, P., Burrows, M. T., Garbary, D. J., Hawkins, S. J., Ingolfsson, A., et al. (2008). Comparative ecology of north Atlantic shores: do difference in players matter for process? Ecology 89, S3–S23.
Kotta, J., Orav-Kotta, H., Jänes, H., Hummel, H., Arvanitidis, C., Van Avesaath, P., et al. (2017). Essence of the patterns of cover and richness of intertidal hard bottom communities: a pan-European study. J. Mar. Biol. Assoc. UK 97, 525–538.
Mathiesen, S. S., Thyrring, J., Hemmer-Hansen, J., Berge, J., Sukhotin, A., Leopold, P., et al. (2017). Genetic diversity and connectivity within Mytilus spp. in the subarctic and Arctic. Evol. Appl. 10, 39–55.
Mortensen, J., Lennert, K., Bendtsen, J., and Rysgaard, S. (2011). Heat sources for glacial melt in a sub-Arctic fjord (Godthabsfjord) in contact with the Greenland ice sheet. J. Geophys. Res. 116:13.
Olesen, B., Krause-Jensen, D., Marbà, N., and Christensen, P. (2015). Eelgrass Zostera marina in subarctic Greenland: dense meadows with slow biomass turnover in cold waters. Mar. Ecol. Prog. Ser. 518, 107–121. doi: 10.3354/meps11087
Ørberg, S. B., Krause-Jensen, D., Mouritsen, K. N., Olesen, B., Marbà, N., Larsen, M. H., et al. (2018). Canopy-forming macroalgae facilitate recolonization of sub-Arctic intertidal fauna and reduce temperature extremes. Front. Mar. Sci. 5:334. doi: 10.3389/fmars.2018.00332
Renaud, P. E., Sejr, M. K., Bluhm, B. A., Sirenko, B., and Ellingsen, I. H. (2015). The future of Arctic benthos: expansion, invasion, and biodiversity. Prog. Oceanogr. 139, 244–257. doi: 10.1016/j.pocean.2015.07.007
Scrosati, R., and Eckersley, L. K. (2007). Thermal insulation of the intertidal zone by the ice foot. J. Sea Res. 58, 331–334. doi: 10.1016/j.seares.2007.08.003
Scrosati, R., and Heaven, C. (2007). Spatial trends in community richness, diversity, and evenness across rocky intertidal environmental stress gradients in eastern Canada. Mar. Ecol. Prog. Ser. 342, 1–14. doi: 10.3354/meps342001
Thyrring, J., Blicher, M. E., Sørensen, J. G., Wegeberg, S., and Sejr, M. K. (2017). Rising air temperatures will increase intertidal mussel abundance in the Arctic. Mar. Ecol. Prog. Ser. 584, 91–104. doi: 10.3354/meps12369
Underwood, A. J., Chapman, M. G., Cole, V. J., and Palomo, M. G. (2008). Numbers and density of species as measures of biodiversity on rocky shores along the coast of New South Wales. J. Exp. Mar. Bio. Ecol. 366, 175–183. doi: 10.1016/j.jembe.2008.07.022
Watt, C., and Scrosati, R. (2013). Regional consistency of intertidal elevation as a mediator of seaweed canopy effects on benthic species richness, diversity, and composition. Mar. Ecol. Prog. Ser. 491, 91–99. doi: 10.3354/meps10521
Węsławski, J. M., Kendall, M. A., Włodarska-Kowalczuk, M., Iken, K., Kędra, M., Legezynska, J., et al. (2011). Climate change effects on Arctic fjord and coastal macrobenthic diversity—observations and predictions. Mar. Biodivers. 41, 71–85. doi: 10.1007/s12526-010-0073-79
Weslawski, J. M., Wiktor, J., and Kotwicki, L. (2010). Increase in biodiversity in the arctic rocky littoral, Sorkappland, Svalbard, after 20 years of climate warming. Mar. Biodivers. 40, 123–130. doi: 10.1007/s12526-010-0038-z
Keywords: intertidal, Arctic, Greenland, algae, sea ice, community structure
Citation: Sejr MK, Mouritsen KN, Krause-Jensen D, Olesen B, Blicher ME and Thyrring J (2021) Small Scale Factors Modify Impacts of Temperature, Ice Scour and Waves and Drive Rocky Intertidal Community Structure in a Greenland Fjord. Front. Mar. Sci. 7:607135. doi: 10.3389/fmars.2020.607135
Received: 17 September 2020; Accepted: 09 December 2020;
Published: 18 January 2021.
Edited by:
Heliana Teixeira, University of Aveiro, PortugalReviewed by:
Fernando P. Lima, University of Porto, PortugalJan Marcin Weslawski, Institute of Oceanology (PAN), Poland
Copyright © 2021 Sejr, Mouritsen, Krause-Jensen, Olesen, Blicher and Thyrring. This is an open-access article distributed under the terms of the Creative Commons Attribution License (CC BY). The use, distribution or reproduction in other forums is permitted, provided the original author(s) and the copyright owner(s) are credited and that the original publication in this journal is cited, in accordance with accepted academic practice. No use, distribution or reproduction is permitted which does not comply with these terms.
*Correspondence: Mikael K. Sejr, bXNlQGJpb3MuYXUuZGs=